54 OESTERREICHISCHE NATIONALBANK A modern economy relies on a stable and efficient financial sector. The finan- cial sector plays an essential role in mobilizing savings and determining the quantity and quality of investment. Companies, investors, savers and con- sumers rely on the availability of a broad range of financial services. How- ever, the financial sector and the way it influences the economy at large has come under critical review of late. This paper surveys the available evi- dence on the significance of the Aus- trian financial sector for the Austrian economy, highlighting how it evolved before the onset of the financial and economic crisis and how it has been evolving since. On the one hand, the contribution of the financial sector can be seen as the output generated by the individual firms of which the sector is made up. On the other hand, the finan- cial sector can be analyzed by looking at the sector’s function in mobilizing savings from savers or surplus units and allocating credit across space and time to real investment as well as liquidity provision. In this article, the term Austrian financial sector refers to all institutions and actors that are involved in provid- ing financial services in Austria, such as banks, insurance companies, invest- ment funds, pension funds as well as the stock exchange. The paper takes a comprehensive view of the financial sector and does not discuss specific seg- ments and markets. Furthermore, the paper concentrates on the domestic economy, considering the financial sec- tor’s international activities only to the extent that they have immediate effects on the wider domestic economy. This “residential” perspective implies that we take all financial institutions oper- ating in Austria into account, not only those in Austrian ownership. The data we look at are based on the national accounts framework (supplemented by current account data). In most cases (a notable exception being input-output data, which we use for cross-sectional analysis) they allow for a long-term perspective, reaching back to the mid- 1990s, so that we can cover develop- ments since Austria’s accession to the EU in 1995 or the start of monetary union in 1999. This paper is structured as follows: Section 1 sets the scene by providing a Refereed by: Heinz Handler, WIFO What is the financial sector’s contribution to the Austrian economy? Even though its contribution to the economy has decreased since the onset of the crisis, the Austrian financial sector still accounts for about 4% of value added and about 3% of the labor force. In rendering its services, the financial sector relies on inputs from the real economy, above all legal, accounting, head office and consulting services. In Austria, the domestic financial sector is still the main funding source for the real sector, even if its share has diminished over the past decade, with the decline having been somewhat more distinct on the asset side than on the liability side. For the financial sector, financing the real sector was becoming less relevant until the crisis hit. Christian Beer, Walter Waschiczek 1 JEL classification: G21, G22 Keywords: financial sector, intermediation, gross value added, Austria 1 Oesterreichische Nationalbank, Economic Analysis Division, christian.beer@oenb.at, walter.waschiczek@oenb.at. The views expressed in this paper are exclusively those of the authors and do not necessarily reflect those of the OeNB or the Eurosystem. The authors would like to thank the referee, as well as Michael Andreasch, Ernest Gnan, Walpurga Köhler-Töglhofer and Patricia Walter (all OeNB) for helpful comments and valuable suggestions and Matthias Wicho (OeNB) for help with financial accounts data.
Transcript
54 OESTERREICHISCHE NATIONALBANK
A modern economy relies on a stable and efficient financial sector. The finan-cial sector plays an essential role in mobilizing savings and determining the quantity and quality of investment. Companies, investors, savers and con-sumers rely on the availability of a broad range of financial services. How-ever, the financial sector and the way it influences the economy at large has come under critical review of late.
This paper surveys the available evi-dence on the significance of the Aus-trian financial sector for the Austrian economy, highlighting how it evolved before the onset of the financial and economic crisis and how it has been evolving since. On the one hand, the contribution of the financial sector can be seen as the output generated by the individual firms of which the sector is made up. On the other hand, the finan-cial sector can be analyzed by looking at the sector’s function in mobilizing savings from savers or surplus units and allocating credit across space and time to real investment as well as liquidity provision.
In this article, the term Austrian financial sector refers to all institutions
and actors that are involved in provid-ing financial services in Austria, such as banks, insurance companies, invest-ment funds, pension funds as well as the stock exchange. The paper takes a comprehensive view of the financial sector and does not discuss specific seg-ments and markets. Furthermore, the paper concentrates on the domestic economy, considering the financial sec-tor’s international activities only to the extent that they have immediate effects on the wider domestic economy. This “residential” perspective implies that we take all financial institutions oper-ating in Austria into account, not only those in Austrian ownership. The data we look at are based on the national accounts framework (supplemented by current account data). In most cases (a notable exception being input-output data, which we use for cross-sectional analysis) they allow for a long-term perspective, reaching back to the mid-1990s, so that we can cover develop-ments since Austria’s accession to the EU in 1995 or the start of monetary union in 1999.
This paper is structured as follows: Section 1 sets the scene by providing a
Refereed by: Heinz Handler,
WIFO
What is the financial sector’s contribution to the Austrian economy?
Even though its contribution to the economy has decreased since the onset of the crisis, the Austrian financial sector still accounts for about 4% of value added and about 3% of the labor force. In rendering its services, the financial sector relies on inputs from the real economy, above all legal, accounting, head office and consulting services. In Austria, the domestic financial sector is still the main funding source for the real sector, even if its share has diminished over the past decade, with the decline having been somewhat more distinct on the asset side than on the liability side. For the financial sector, financing the real sector was becoming less relevant until the crisis hit.
Christian Beer, Walter Waschiczek1
JEL classification: G21, G22Keywords: financial sector, intermediation, gross value added, Austria
1 Oesterreichische Nationalbank, Economic Analysis Division, [email protected], [email protected]. The views expressed in this paper are exclusively those of the authors and do not necessarily reflect those of the OeNB or the Eurosystem. The authors would like to thank the referee, as well as Michael Andreasch, Ernest Gnan, Walpurga Köhler-Töglhofer and Patricia Walter (all OeNB) for helpful comments and valuable suggestions and Matthias Wicho (OeNB) for help with financial accounts data.
What is the financial sector’s contribution to the Austrian economy?
MONETARY POLICY & THE ECONOMY Q2/17 55
brief overview of the relevant literature on the relationship between the finan-cial sector and economic development. In the two following sections, the con-tribution of the financial sector to the economy at large is analyzed from the two perspectives outlined above. Spe-cifically, section 2 looks at the contri-bution to value added, and section 3 takes stock of the intermediation role of the financial sector. Section 4 dis-cusses the benefits of having a domestic financial sector. Section 5 concludes.
1 Literature findings on the benefits and drawbacks of financial institutions and markets
In a world of perfect information and zero transaction costs, there would be no need for financial institutions. In the real world, the central contribution of the financial sector consists in reducing the agency problems caused by con-flicting interests and information asym-metries that characterize the relations between investors and savers. These agency problems cause information costs (because of a lack of adequate ac-cess to information about the credit-worthiness of prospective borrowers and the performance of current bor-rowers), transaction costs, as well as costs of risk, maturity, and volume transformation. By reducing such fric-tions, a well-functioning financial sec-tor fosters economic activity. The finan-cial sector positively affects the avail-ability of funds for corporate investments by enabling households to deposit their savings in bank accounts, mutual funds or stocks (floated on the stock exchange by banks). Monitoring and screening prospective borrowers by the financial sector contributes to higher produc-
tivity of an economy by allocating capi-tal to the most profitable investment opportunities.
However, the relationship between financial sector activity and economic activity remains an object of discus-sion.2 While early empirical research on the nexus between financial sector size and economic growth found a pos-itive, more or less linear relationship (King and Levine, 1993; Beck et al., 2000; De Gregorio and Guidotti, 1995 and Rajan and Zingales, 1998), these findings have been questioned in the wake of recent crises such as the burst of the dot-com bubble and in particular the crisis that started in 2008.
One strand of the literature focuses on the effects of a growing finan- cial sector on macroeconomic perfor-mance. Several authors find that the higher the growth rate of financial sec-tor value added relative to the non-financial sectors, the greater the proba-bility of subsequent financial busts. Easterly et al. (2000) portend that ad-ditional financial development, which is reflected in higher debt ratios of the real sector and higher leverage of the financial sector, might aggravate cycli-cality, as in a downturn banks are under pressure to cut the volume of loans granted to firms. Beck et al. (2012) relate this to the fact that the financial sector has extended its scope beyond traditional intermediation services to activities such as derivatives and trading.
Recent studies found not only di-minishing marginal effects of the ser-vices provided by the financial sector but also evidence that in advanced economies the relationship may even (have) become negative at some point. Arcand et al. (2015) and Cecchetti and Kharroubi (2015) suggest that the rela-
2 We refer here to the literature on the effects of the size of the financial sector but not of the structure of the financial system (e.g. the question of the relative merits of bank-based and market-based financial systems).
What is the financial sector’s contribution to the Austrian economy?
56 OESTERREICHISCHE NATIONALBANK
tionship between finance and growth resembles an inverted U-shape. Inter-estingly, despite using different meth-ods and looking at different country groups and periods, all studies conclude that the turning point is private sector credit of about 90% to 100% of GDP.3 Defining credit to the private sector (nonfinancial corporations and house-holds) as loans granted and debt securi-ties held by Austrian financial institu-tions, Austria has been above this threshold for more than 10 years. Philippon (2008) argues that the finan-cial sector competes with other sectors for scarce resources, especially for skilled labor (“brain drain”).4 A further aspect is that an expansion of financial intermediation might reflect a misallo-cation to less productive economic ac-tivities. In particular, additional mort-gage lending often contributes less to
overall economic growth than credit to young innovative companies (Beck, 2015 and Coeuré, 2014). Credit to firms removes financing constraints, thus leading to higher investment and growth, whereas better credit to house-holds is likely to result in a lower sav-ings rate and may therefore be associ-ated with lower economic growth.5 These effects are particularly binding in a situation of restrictive loan supply, in which case credit to households would restrain credit to enterprises for investment, but less so in times of ample liquidity. Much of the increase in financial intermediation has been asso-ciated with mortgage loans, which – especially if used to purchase existing housing – contribute less to produc-tion. Expressed as a percentage of loans to nonfinancial corporations, housing loans by Austrian banks to domestic
3 However, these studies are based on banking sector development indicators only and did not take into account the increasing role of other financial intermediaries and the capital markets in corporate finance.
4 Yet, Ritzberger-Grünwald et al. (2016) show that at least for the banking sector this has not been the case in Austria.
5 See Cournède and Denk (2014), Pagano et al. (2014) and the literature cited therein. Apart from the effect on the savings ratio that arises when households can spend more than without taking out a loan, residential construction typically features low productivity, so that an increase in the structure of investment towards residential construc-tion reduces economic growth.
In % of loans to nonfinancial corporations
140
120
100
80
60
40
20
0
Lending for house purchase to households1
Chart 1
Source: OeNB.1 Including nonprofit institutions serving households.
Austria Euro area Germany
1999 2001 2003 2005 2007 2009 2011 2013 2015
What is the financial sector’s contribution to the Austrian economy?
MONETARY POLICY & THE ECONOMY Q2/17 57
households rose from 21% in 1999 to 71% in 2016. However, in part this surge also reflects weak demand for corporate loans (see for example OeNB, 2016). While this increase was much more pronounced than in Ger-many and the euro area, the ratio is still markedly below that registered in Ger-many and the euro area as a whole (chart 1).
Another risk factor is the high in-terconnectedness among financial in-stitutions (both within and across na-tional borders). For example, many in-vestment funds, pension funds and other financial institutions are subsid-iaries of credit institutions. Banks pro-vide financing to each other as well as to other financial intermediaries such as insurance corporations, pension funds and investment funds. The multi-ple layers of interconnection between the different institutions can be charac-terized as a complex, adaptive “system of systems” where the whole may be-have differently than the sum of its parts, given dynamic properties such as amplifying feedback effects (Haldane, 2015). The interconnection of financial institutions can act as a transmitter of local shocks and disturbances to the financial system at large and thus pose a risk of contagion across sectors and beyond borders.
2 Role of the financial sector as producer and exporter of services
In this section we take up the first of the two perspectives on the macroeco-nomic relevance of the Austrian finan-cial sector: we look at how the financial sector affects the economy by produc-ing goods and (primarily) services used as final or as intermediate goods by
other sectors, by buying intermediate goods from other (domestic) enter-prises and by exporting its services. Within the standard EU framework for the statistical classification of economic activities (NACE), the financial sector is categorized in section K (financial and insurance activities). It includes the subsectors financial service activities other than insurance and pension fund-ing (in the following “banking”), insur-ance, reinsurance and pension funding other than compulsory social security “insurance” and activities auxiliary to financial services and insurance activi-ties (“auxiliary”). Sector K covers a broad and comprehensive range of financial intermediaries as it includes also the stock exchange, brokers, and other activities related to financial ser-vices.
2.1 The financial sector’s direct contribution to value added
Within the national accounts frame-work, the standard way of measuring a sector’s contribution to the economy is gross value added, defined as the value of gross output that it produces less the value of its intermediate consumption. Besides income on intermediation (such as loan provision to consumers and businesses), value added also includes fees for advisory services, insurance premia etc. In 2015, gross value added by the financial sector amounted to EUR 12.8 billion or 4.2% of total value added.6 Over the past two decades, this share has been on a downward trend; in 1995, the financial sector had contrib-uted 5.6% to value added. This reduc-tion, which took place in particular after the crisis hit, was in stark contrast to the development in the euro area where the financial sector’s share in
6 Value added by Austrian banks only includes results of banks domiciled in Austria. The business activities of subsidiaries based abroad are included as capital income from the rest of the world.
What is the financial sector’s contribution to the Austrian economy?
58 OESTERREICHISCHE NATIONALBANK
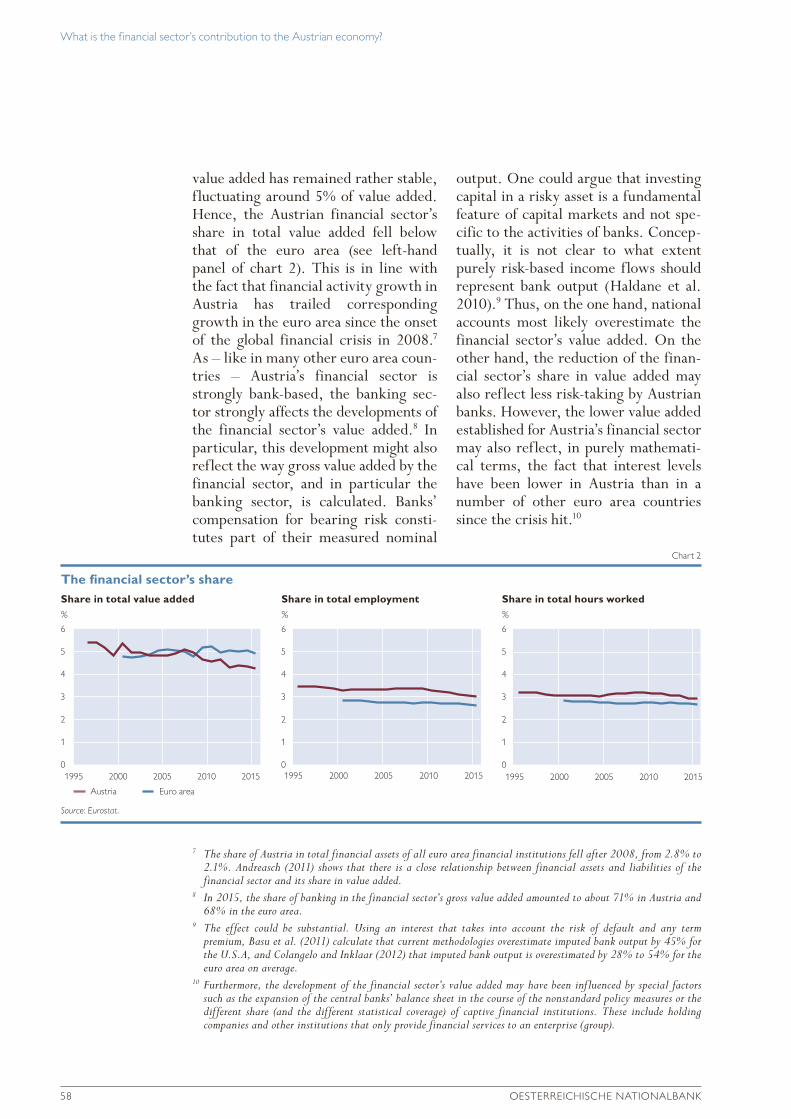
value added has remained rather stable, fluctuating around 5% of value added. Hence, the Austrian financial sector’s share in total value added fell below that of the euro area (see left-hand panel of chart 2). This is in line with the fact that financial activity growth in Austria has trailed corresponding growth in the euro area since the onset of the global financial crisis in 2008.7 As – like in many other euro area coun-tries – Austria’s financial sector is strongly bank-based, the banking sec-tor strongly affects the developments of the financial sector’s value added.8 In particular, this development might also reflect the way gross value added by the financial sector, and in particular the banking sector, is calculated. Banks’ compensation for bearing risk consti-tutes part of their measured nominal
output. One could argue that investing capital in a risky asset is a fundamental feature of capital markets and not spe-cific to the activities of banks. Concep-tually, it is not clear to what extent purely risk-based income flows should represent bank output (Haldane et al. 2010).9 Thus, on the one hand, national accounts most likely overestimate the financial sector’s value added. On the other hand, the reduction of the finan-cial sector’s share in value added may also reflect less risk-taking by Austrian banks. However, the lower value added established for Austria’s financial sector may also reflect, in purely mathemati-cal terms, the fact that interest levels have been lower in Austria than in a number of other euro area countries since the crisis hit.10
7 The share of Austria in total financial assets of all euro area financial institutions fell after 2008, from 2.8% to 2.1%. Andreasch (2011) shows that there is a close relationship between financial assets and liabilities of the financial sector and its share in value added.
8 In 2015, the share of banking in the financial sector’s gross value added amounted to about 71% in Austria and 68% in the euro area.
9 The effect could be substantial. Using an interest that takes into account the risk of default and any term premium, Basu et al. (2011) calculate that current methodologies overestimate imputed bank output by 45% for the U.S.A, and Colangelo and Inklaar (2012) that imputed bank output is overestimated by 28% to 54% for the euro area on average.
10 Furthermore, the development of the financial sector’s value added may have been influenced by special factors such as the expansion of the central banks’ balance sheet in the course of the nonstandard policy measures or the different share (and the different statistical coverage) of captive financial institutions. These include holding companies and other institutions that only provide financial services to an enterprise (group).
% % %
Share in total value added Share in total employment Share in total hours worked
What is the financial sector’s contribution to the Austrian economy?
MONETARY POLICY & THE ECONOMY Q2/17 59
The financial sector is an important employer, even though its share in total employment has come down over the past two decades.11 In 2015, close to 130,000 persons or 3.0% of the total labor force were employed in the finan-cial sector, according to national ac-counts data. The share of banking in financial sector employment was 59% in 2015 and thus somewhat lower than its share in value added, compared with about 21% employed by insurance firms and 8% by auxiliary activities. Since the financial sector’s share in em-ployment is considerably lower than in
output (chart 2), this implies that labor productivity in the financial sector is higher than in the total economy.12 The financial sector’s share in hours worked was about the same as in total employ-ment, suggesting that on average work-ing hours in the financial sector do not differ from those in the total economy.
2.2 Interdependencies between the financial sector and the wider economy
In this section, we analyze the interde-pendencies between financial sector services and the production of non-
11 For an overview of bank employment in Austria, see Ritzberger-Grünwald et al. (2016). As to the banking sector OeNB data show that the reduction in employment continued in 2016.
12 However, to some extent this might also be the result of the potential overestimation of the sector’s value added, given the uncertainties concerning its calculation (see above).
Table 1
Intermediate inputs used and supplied by the financial sector
Used by the financial sector Supplied by the financial sector to each sector
in % of total use of intermediate inputs by the financial sector
in % of total output produced by each sector
in % oftotal supply of intermediate inputs supplied by the financial sector
Domestic real sectorsLegal, accounting, head office, consulting 13.5 8.0 4.4Advertising and market research 5.4 8.7 0.8Computer programming 4.6 3.3 1.8Security, building services, business support 3.8 5.7 0.9Real estate 3.3 0.9 12.7Publishing, broadcasting, telecommunication 3.3 2.6 1.0Scientific, engineering and other services 2.6 1.3 2.2Transport 2.5 0.7 2.5Accommodation and food 1.4 0.6 2.3Construction 1.2 0.3 3.3Utilities 1.1 0.4 2.4Manufacturing 0.9 0.0 12.7Education, health, social work, arts, sports 0.9 0.1 7.0Wholesale and retail trade 0.9 0.2 10.7Personal services 0.5 0.7 1.0Other 0.4 0.3 1.4Agriculture and forestry 0.0 0.0 1.1Domestic financial sector 40.2 17.9 31.8
Imports 13.6 x x
Total 100 x 100
Source: Authors’ calculations based on data from Statistics Austria.
Note: Data ordered by second column.
What is the financial sector’s contribution to the Austrian economy?
60 OESTERREICHISCHE NATIONALBANK
financial goods and services in the finan-cial and nonfinancial corporate sectors. We use the most recent release of input-output tables, relating to 2013 (Statistics Austria, 2017). The in-put-output tables re-assign all activities that are characteristic of a sector to this sector and subtract the noncharacteris-tic activities (e.g. construction activi-ties of the financial sector are assigned to the construction sector). Further-more, the tables are derived under the assumption that a product has the same input structure regardless in which sec-tor it is produced (commodity techno-logy assumption; see Statistics Austria, 2017). Consequently, the activities assigned to a given sector may not be aligned with the framework underlying the previous sections. These aspects have to be taken into account when comparing the results in this section with those in other sections.
The left column of table 1 highlights that the financial sector uses intermedi-ate goods from the domestic real sec-tor, from the financial sector and from abroad (imports). The table shows a very high interconnectedness within the financial sector, as 40.2% of all in-termediate goods used by the domestic financial sector stem from this very sector.13 Inputs from the domestic real sector14 amount to 46.2%, with the major intermediate inputs being attrib-utable to legal, accounting, head office and consulting services (13.5%).15 Other significant providers of interme-diate inputs for the financial sector are advertising and market research ser-vices (5.4%); security, building ser-vices and business support; and com-
puter programming and transport (4.6%). Furthermore, the left column of table 1 suggests that the bulk of intermediate inputs used to produce financial sector services is supplied do-mestically, as only 13.6% are imports.
The middle column of table 1 indi-cates how important financial sector demand is for producers in the real sec-tor and for the financial sector itself. It shows the share of goods in real and financial sector output that is used by the financial sector as intermediate goods and services. Thus, 17.9% of goods produced by the financial sector serves as intermediate input for the financial sector. Additionally, the finan-cial sector is an important purchaser of intermediate goods from advertising and market research (8.7% of their to-tal output is intermediate input for the financial sector); legal, accounting, head office and consulting services (8.0%); and security, building services and business support (5.7%).
The financial sector also supplies its services to other sectors in order to facilitate the production of goods and services. The right column of table 1 shows that 12.7% of all intermediate inputs supplied by the financial sector are used as intermediate input in manu-facturing, further 12.7% by real estate services, 10.7% by wholesale and retail trade, 7.0% by education, health, social work, etc., and 4.4% by legal, account-ing, head office and consulting services. This reflects both the size of these ac-tivities and the dependence on financial services.
Table 1 shows the interconnected-ness in the production of goods and ser-
13 Given the scope of this article, we focus on domestic effects and do not discuss the role of imports and exports.14 We merged the nonfinancial activities as shown in table A1 in the annex.15 However, one has to take into account that some of these inputs might be head offices within a banking or
insurance group. The data do not allow scrutinizing the importance of the various activities merged under this heading.
What is the financial sector’s contribution to the Austrian economy?
MONETARY POLICY & THE ECONOMY Q2/17 61
vices between the real and financial sector. If final demand for financial sec-tor services changes, not only does the output for final use of these services change (direct effect of the increase in demand) but also indirect effects arise as the financial sectors needs interme-diate inputs from the real and financial sectors. The production of these inter-mediate inputs, in turn, relies on inter-mediate input from the financial sector and so on. Input-output analysis covers all of these effects, thus allowing us to calculate the impact on total output stemming from a change in demand for financial sector goods and services.16
The domestic output multiplier (i.e. the multiplier that shows the effects on the Austrian economy) amounts to 1.7. Hence, if demand for financial sector services increases by EUR 1, total do-mestic production increases by EUR 1.7. Compared with nonfinancial activ-ities, this multiplier is about average. We can further determine how this effect on the total economy is distrib-uted over financial and nonfinancial goods and services. Table 2 shows the indirect effects that arise if final de-mand for financial sector services in-creases by EUR 1. It corroborates the findings from the analysis in the first part of this section. There are strong effects on the financial sector itself and on nonfinancial goods and services pro-ducers, in particular on the production of legal, accounting, head office and consulting services. The output of these services would increase by EUR 0.11. The increase in output takes place be-
cause these services are required by the financial sector both as intermediate inputs (as discussed at the beginning of this section) and because they are needed to produce other goods and ser-vices that are intermediate inputs in the production of financial sector services. Relatively strong impacts of a change in demand for financial sector services are also apparent for advertising and mar-ket research, telecommunication and computer programming.17
Furthermore, we can also analyze for which goods and services financial sector services are important interme-diate inputs – either in the production of final demand or in the production of other intermediate inputs. For this pur-
16 Such an analysis relies on several assumptions, e.g. constancy of input coefficients (e.g. Statistics Austria, 2017). However, for our analysis, which aims to provide some information on the interdependencies between the financial sector and real economic activity, these limitations are not too restrictive.
17 In the interpretation of these results one has to keep in mind that the table only shows domestic indirect effects. Since in the case of e.g. manufacturing most indirect effects are effective abroad, the large role of manufacturing as a supplier of intermediate inputs for the financial sector cannot be inferred from the table.
Table 2
Indirect effects of an increase in final demand for financial sector services by 1 EUR
EUR
Domestic real sectorsLegal, accounting, head office, consulting 0.11Advertising and market research 0.04Publishing, broadcasting, telecommunication 0.04Computer programming 0.04Real estate 0.03Security, building services, business support 0.03Transport 0.02Manufacturing 0.02Scientific, engineering and other services 0.02Utilities 0.02Construction 0.02Other 0.01Wholesale and retail trade 0.01Accommodation and food 0.01Education, health, social work, arts, sports 0.01Personal services 0.00Agriculture and forestry 0.00Domestic financial sector 0.25
Total 0.70
Source: Authors’ calculations based on data from Statistics Austria.
What is the financial sector’s contribution to the Austrian economy?
62 OESTERREICHISCHE NATIONALBANK
pose, table 3 shows the proportion of additional output that occurs in the financial sector subject to rising de-mand for specific goods or services in the real and financial sector. In line with our discussion above, the table shows the strong interdependencies within the financial sector. Further-more, 11.5% of all indirect effects from an increase in the demand for real estate services occur in the financial sector; likely because of the relevance of loans in real estate. Legal, account-ing, head office and consulting services are not only large suppliers of inputs for financial sector services – financial sec-tor services are also important inter-mediate inputs for these services. Fur-thermore, the table suggests that a sig-nificant part of indirect effects that arise in the production of wholesale and retail trade as well as personal services occurs in the financial sector. Yet, in sum the indirect effects in these sectors are rather small.
Overall, the input-output analysis suggests that there are quite strong in-terlinkages and interdependencies both within the financial sector and between the financial and nonfinancial sectors. The interconnections are most pro-nounced between the financial sector and legal, accounting, head office and consulting services.
2.3 Exports of financial services
In the third part of the discussion of the financial sector’s direct contribution to the wider economy, we turn to its rele-vance for Austria’s exports of goods and services. To assess the financial sector’s contribution, we added the bal-ance-of-payment items financial services, which refer to cross-border services by banks and other financial institutions (e.g. brokers, clearinghouses) and insur-ance and pension services.Activities in-clude bank fees and costs related to the issuance of bonds and underwriting, or the insurance service charge imposed on cross-border premium payments. Additionally, financial services include estimates of FISIM (financial interme-diation services, indirectly measured), that is the margin between interest pay-able and a reference rate on loans and deposits. FISIM’s share expanded over the past years significantly.
The financial sector’s share in all Austrian gross exports of goods and services declined steadily after the on-set of the crisis, from 1.9% in 2008 to 1.3% in 2016 (see left-hand panel of chart 3). In 2016, the restructuring of one large banking group accelerated this downward trend. This reduction was broad based, all major regions (with the exception of the U.K.) con-tributed to this development. However, the reduction was markedly lower in Central, Eastern and Southeastern Europe (CESEE) than in other regions. The regional distribution of exports
Table 3
Proportion of indirect effects occuring in the financial sector
% of total indirect effects
Domestic real sectorsReal estate 11.5Legal, accounting, head office, consulting 10.2Wholesale and retail trade 8.8Personal services 7.9Education, health, social work, arts, sports 7.5Other 7.1Security, building services, business support 7.0Computer programming 6.8Scientific, engineering and other services 6.8Accommodation and food 5.9Manufacturing 4.5Advertising and market research 4.5Transport 4.3Agriculture and forestry 4.2Publishing, broadcasting, telecommunication 4.2Construction 3.4Utilities 3.0Domestic financial sector 36.3
Source: Authors’ calculations based on data from Statistics Austria.
What is the financial sector’s contribution to the Austrian economy?
MONETARY POLICY & THE ECONOMY Q2/17 63
highlights the significant role of CESEE.18 As a group, CESEE took more than 29% of all exports of the fi-nancial sector in 2016. This share was consistently increasing over the last two decades. Among individual coun-tries, Germany is the largest trading partner for financial goods and ser-vices, as is the case with other goods and services, accounting for almost 24% of all exports.
3 Role of the financial sector in the financing process
The second way to examine the macro-economic relevance of the financial sec-tor is to look at its intermediation func-tion, i.e. its role in providing financial services to the real economy (enter-prises, government and households).
We base our analysis on the financial accounts, which provide harmonized data at a sectoral level. Within the financial accounts framework, the finan-cial sector is represented by the institu-tional sector S12 (financial corpora-tions) that covers all resident corpora-tions whose main function is to provide financial services.
Looking at financial accounts data confirms the principal findings of the analysis of the financial sector’s value added. To start with, the total financial volume (as measured by total assets) of the financial sector is not high in inter-national comparison. By the third quar-ter of 2016, total assets of all Austrian financial corporations amounted to EUR 1.485 billion, which was equiva-lent to 430% of GDP. This was slightly
18 Using the classification of the Austrian balance of payments statistics, CESEE includes the following countries: Albania, Bosnia and Hercegovina, Bulgaria, Estonia, Kosovo, Croatia, Latvia, Lithuania, FYR Macedonia, Moldova, Montenegro, Poland, Romania, Russia, Serbia, Slovak Republic, Slovenia, Czech Republic, Ukraine, Hungary, Belarus.
% % %
In % of total Austrian exports By balance sheet item By country/region
What is the financial sector’s contribution to the Austrian economy?
64 OESTERREICHISCHE NATIONALBANK
below the German value (464%) and well below the euro area average of 684% of GDP (chart 4). Moreover, in contrast to the euro area as a whole, the ratio of financial corporations’ total assets to GDP declined over the past years (in the first quarter of 2010, it had been 570%). Finally, financial accounts data reinforce the notion that the Austrian financial sector is strongly bank-based, although the share of banks in the total assets of all financial inter-mediaries has decreased since the onset of the crisis (fourth quarter of 2008) from 71.8% to 64.4%. In the euro area as a whole, banks contributed less than half (46.5%) to financial sector assets.19
The difference between the euro area and Austria has widened substantially since the onset of the crisis.
From a macroeconomic perspec-tive, a more relevant measure for the importance of the financial sector is the extent to which it finances the domes-
tic real sector rather than devoting it-self to other activities.20 Until the onset of the crisis, financing nonfinancial corporations, government and house-holds was becoming less relevant for the Austrian financial sector. Between 1995 and 2008 the share of funds pro-vided to the domestic real sector (in the form of loans, debt securities and listed as well as unlisted shares) in total finan-cial sector assets almost halved (from 50% to 25%) while foreign financings as well as financing within the financial sector increased. Since then, the share of the domestic real sector has recov-ered somewhat, reaching 30% in the third quarter of 2016. The largest con-tribution to this overall decrease came from the reduction in financing the public sector, whose share plummeted in the period from 1995 to 2008, but recovered to 6.3% in 2016 as the bank-ing sector started to invest in govern-ment bonds (chart 5).21 Financing non-
% of GDP
800
700
600
500
400
300
200
100
0
Assets of financial institutions
Chart 4
Source: ECB, OeNB.
Austria Euro area Germany
Q1 06 Q1 08 Q1 10 Q1 12 Q1 14 Q1 16
19 Again, the different role of captive financial institutions has to be taken into account (see footnote 10).20 By mid-2016, roughly 40% of the total financing volume of the Austrian financial sector were foreign financings.
Unfortunately, the financial accounts do not allow for a breakdown of these by foreign economic sector. Further-more, available data go back only to 2012. In this period, the share of foreign financings did not change much.
21 Another factor that has played a role has been the reclassification of banks into the government sector in the form of bad banks.
What is the financial sector’s contribution to the Austrian economy?
MONETARY POLICY & THE ECONOMY Q2/17 65
financial corporations also lost in im-portance until the onset of the crisis, whereas the share of households re-mained quite stable.
For the Austrian real sector, the do-mestic financial sector is still the main funding source, even if its share has diminished over the past decade (chart 6). The data for those financial liabilities for which a breakdown by creditor sector is available in the finan-cial accounts show that Austrian finan-cial institutions held 43% of the shares, securities and loans issued/incurred by the real sector in Austria. As data are available only from 2006, the pre-crisis
development cannot be analyzed. Since then, however, the share of corporate bond holdings has fallen from one-third to one-fifth of the outstanding volume. The financial sector’s holdings of non-quoted shares almost halved. The share of loans by financial institutions (mostly banks) in all loans to nonfinancial cor-porations shrank from 64% to 57%, reflecting an increase in intercompany loans. In government finance, financial institutions reduced their loans to gov-ernment starkly, while they acquired additional government bonds so that their share in financing the Austrian government sector did not change
%
25
20
15
10
5
0
Share of real sectors in total assets of Austrian financial corporations
Chart 5
Source: OeNB.1 Including nonprofit institutions serving households.
What is the financial sector’s contribution to the Austrian economy?
66 OESTERREICHISCHE NATIONALBANK
much overall, amounting to 23% in 2015. The share of the financial sector in the financing of households increased slightly, by 2 percentage points, to 86%.
On the asset side, the reduction in the importance of the Austrian finan-cial sector for the real sector was some-what more pronounced than on the lia-bility side. The share of financial assets held by the real sector that is interme-diated by the financial sector shrank steadily, from 50% to 42% between 2006 and 2015. The reduction in rele-vance was most marked for households. In particular, households withdrew capital from mutual funds issued by Austrian investment companies, but the Austrian financial sector’ share in the direct holdings of securities and even in households’ deposits also fell, the latter however only slightly
(chart 7). Yet it has to be taken into account that domestic mutual funds invest to a considerable degree into for-eign securities and shares.22 Regarding nonfinancial corporations, the picture was similar for mutual funds and de-posits while the share of securities is-sued by Austrian financial institutions even increased.23 As to the government sector, the share of the domestic finan-cial sector in deposits varied widely, reflecting strong fluctuations in depos-its held with nonresident banks, espe-cially immediately after the onset of the crisis in 2008.
Overall, the real sector now uses the intermediation services of the fi-nancial sector slightly less than in the past.24 One might argue that increasing financial market integration and tech-nological advances have rendered the
22 By the end of 2016, more than two-thirds (69%) of the net asset value of all Austrian mutual funds were foreign investments.
23 Stocks and bonds offer households the possibilities to invest their savings directly into companies, i.e. without intermediation by the financial sector (although the financial sector might supply other services regarding this investment). Data from the Household Finance and Consumption Survey (Fessler et al., 2016) show that about 10% of Austrian households invest in mutual funds, 4% in bonds and 5% in shares. Participation rates are the higher the higher the income or net wealth of households. For example, in the first net income quartile less than 1% of all households own shares compared to 13% in the fourth quartile. Furthermore, about 1% of all house-holds in the first income quartile own bonds compared to about 8% in the fourth quartile. Analyzing participa-tion rates according to net wealth gives a similar picture. Hence, this form of investment is more important for affluent households.
24 This view only captures direct funding but neglects the provision of disintermediated financing, such as providing underwriting, consulting and advisory services, by financial institutions.
% % %
Nonfinancial corporations Government Households1
100
80
60
40
20
0
100
80
60
40
20
0
100
80
60
40
20
0
Share of the domestic financial sector in selected assets of the Austrian real sector
Chart 7
Source: OeNB.
Securities Deposits Mutual fund shares
1 Including nonprofit institutions serving households.
What is the financial sector’s contribution to the Austrian economy?
MONETARY POLICY & THE ECONOMY Q2/17 67
geographical location of the providers of financial services increasingly irrele-vant. Especially within the EU, the free flow of capital is one of the four free-doms of the single market, and this idea has fed into many EU initiatives and projects, ranging from the 1988 dereg-ulation of capital movements in the EU to the Capital Markets Union project (Elsinger et al., 2016).
The (slight) reduction of the share of the Austrian financial sector in the financial assets and liabilities of the real sector would also corroborate this view. More than two-thirds of the lia-bilities of the Austrian government sec-tor and almost one-third of the total external financing of the corporate sec-tor came from abroad in 2015. How-ever, there were marked differences across financial instruments. The cross-border share was lowest for bank loans, while more than two-thirds of Austrian corporate bonds were placed abroad, which may be ascribable to the relatively small domestic bond market. The same holds for the stock market. Moreover, the sizable foreign share in equity instruments and in other loans reflects the relatively high share of inward direct investment in the Aus-trian corporate sector (Elsinger et al., 2016).25 Austrian households, in con-trast, depend almost completely on domestic sources for their external financing.
4 Benefits of having a domestic financial sector
There are a number of reasons why geographic proximity between finan-cial institutions and potential borrow-ers matters in the provision of financial
services.26 In essence, these reasons stem from information asymmetries that increase with distance. The role of proximity in the provision of financial services is most often attributed to transactions costs, which include trans-portation costs and information costs (Brevoort and Wolken, 2008). Trans-portation costs arise because screening loan applicants and monitoring existing borrowers may require regular site vis-its by a loan officer. Information costs are particularly relevant for evaluating credit applications from small, infor-mationally “opaque” enterprises when lenders have to substitute “soft” infor-mation for “hard” information. Col-lecting this information strongly bene-fits from proximity to borrowers be-cause it depends on personal contacts as well as the knowledge of the local community and economic conditions. These considerations are especially relevant for SMEs, which are more likely to be opaque and therefore re-quire information to be updated more frequently. Since there are economies of scale associated with obtaining this kind of information, distance matters in financial relationships especially for SMEs. Both technological and financial innovations may have facilitated forms of transactions-based lending that focus on the quality of specific assets rather than on the overall quality of a firm. These assets can be valued using hard information and can therefore be used as collateral. As information on these assets may be obtained also for opaque small borrowers, there is less need for personal interactions between creditor and debtors (Udell, 2009). Neverthe-less, in those cases in which hard infor-
25 Although the foreign share in equities may well include portfolio investments.26 Geographic proximity is not necessarily equal to being resident in the same country. Especially in a small open
economy this may well mean being just across the border. However, if legal, linguistic and perhaps cultural differ-ences are taken into account, then geographic proximity might in many cases at least be aligned with “domestic.”
What is the financial sector’s contribution to the Austrian economy?
68 OESTERREICHISCHE NATIONALBANK
mation cannot be replaced with soft information, relationship lending still requires the proximity of the borrower to the lender.
Furthermore, linguistic and cul-tural differences, different underlying economic structures, as well as differ-ences in national supervision practices and corporate governance still pose barriers in the European credit markets (Affinito and Piazza, 2008). Again, these are likely to be felt more by smaller firms that tend to borrow smaller sums than larger companies do.
Informational and regulatory differ-ences may also be behind the so-called “home bias” that (individual and insti-tutional) investors exhibit in their investment decisions. Despite the full liberalization of capital movements and technological change, in virtually all portfolios the share of domestic assets is significantly greater than expected according to portfolio theory. At least partially, this tilt can be rationalized by various factors such as lower transac-tion costs, diverging tax rules, fewer
information asymmetries or the ab-sence of exchange-rate risk (Levy and Levy, 2014). As a result, the costs of di-versification could be higher than the resulting return. Given the small size and the ensuing low liquidity of Aus-trian stocks, they would not be in-cluded in large international portfolios in the absence of sufficient liquidity. So Austrian corporations depend on do-mestic investors, including financial in-stitutions, for their financing.
Furthermore, even within the euro area, financial integration is not a one-way street, as shown by the substantial financial fragmentation associated with the financial and sovereign debt crises between 2007 and 2011 (ECB, 2016). The crisis brought the era of rapid growth of cross-border capital flows to a halt and gave rise to an increasing re-nationalization of loan financing. Across types of flows, banking flows were hit the hardest, and the ensuing retrenchment of banking activity abroad was matched by an increase in domestic activity of banks. The share of
Annual change in % %
60
40
20
0
–20
8
7
6
5
4
3
2
1
0
Loans to the Austrian non-MFI sector
Chart 8
Source: ECB.1 Those euro area countries for which data are available since 1998.
By Austrian MFIs By other euro area MFIs1 Share of other euro area MFIs (right-hand scale)
1998 2000 2002 2004 2006 2008 2010 2012 2014 2016
What is the financial sector’s contribution to the Austrian economy?
MONETARY POLICY & THE ECONOMY Q2/17 69
banks from other euro area countries in lending to Austrian nonbanks27 showed a clear upward trend since the begin-ning of the European Monetary Union, even if it has been considerably more volatile than lending from Austrian banks, as chart 8 shows. One factor may have been that banks that were bailed out with public funds were ex-pected to increase home-market lend-ing (Milesi-Ferretti and Tille, 2011 and Lund et al., 2013). Thus, in times of financial stress, when information asymmetries become particularly rele-vant, financing from the domestic financial sector may be especially im-portant.
5 Summary
In spite of the setbacks during the crisis years, the financial sector still accounts for about 4% of value added and about 3% of the labor force. However, esti-mating the contribution of the financial sector is hindered by uncertainties such as the treatment of risk in the financial sector’s value added. For many years, the financial sector had also contrib-uted to the Austrian current account surplus, although in recent years, its net exports diminished. The financial sector is closely intertwined with other economic sectors. A change in financial sector activities has a relatively strong impact on the Austrian economy. This holds particularly for legal, accounting, head office and consulting services. The true macroeconomic relevance of the financial sector goes beyond its direct contribution to output and de-mand. Its economic function lies in the financing of the real economy. How-ever, also with respect to financial in-termediation, the importance of the Austrian financial sector has been grad-ually decreasing. The reduction was
most pronounced for capital market in-vestments (mutual funds but also direct holdings of stocks and securities) of the household sector. For the financial sec-tor, financing the domestic economy was becoming less relevant before the crisis hit, but has become somewhat more relevant again since then.
Even though the Austrian financial sector has shrunk over recent decades, the share of private credit in GDP is consistently higher than the threshold above which the literature suggests negative impacts on GDP growth. Fur-thermore, the relative increase of hous-ing loans to households compared to loans to nonfinancial corporations that had been registered in many other countries took place in Austria, too, although on a far lesser scale. Thus, if the value-added share of the financial sector were to continue its decrease, this need not necessarily be a detriment to the Austrian economy. However, any specific conclusion would require a thorough analysis of the specific situa-tion in Austria.
Recent technical advances as well as the increasing integration of financial and capital markets notwithstanding, there are still good reasons why the presence of a domestic financial sector matters in the provision of financial services. The considerations rest among others on the cost of screening loan applicants and monitoring borrowers. Furthermore, the financial and eco-nomic crisis triggered a re-nationaliza-tion of loan financing, which suggests that borrowing possibilities abroad are more fragile than domestic ones. These factors imply that despite the decrease of its relative importance there will still be a role for the domestic financial sec-tor in the future.
27 Lending from all euro area banks (including those from Austria).
What is the financial sector’s contribution to the Austrian economy?
70 OESTERREICHISCHE NATIONALBANK
ReferencesAndreasch, M. 2011. Finanzvermögen und Finanzverflechtungen innerhalb des österreichischen
Finanzsektors 2010. In: Statistiken Q3/11. OeNB. 29–38.Arcand, J. L., E. Berkes and U. Panizza. 2015. Too much finance? In: Journal of Economic
Growth. 20(2). 105–148.Affinito, M. and M. Piazza. 2008. What are borders made of? An analysis of barriers to Euro-
pean banking integration. Banca d’Italia Temi di discussione 666. Basu, S., R. Inklaar and J. C. Wang. 2011. The Value of Risk: Measuring the Service Income of
U.S. Commercial Banks. In: Economic Inquiry 49(1). 226–245.Beck, T., H. Degryse and C. Kneer. 2014. Is more finance better? Disentangling intermedia-
tion and size effects of financial systems. In: Journal of Financial Stability 10 (February). 50–64.Brevoort, K. P. and J. D. Wolken. 2008. Does Distance Matter in Banking? Finance and
Economics Discussion Series. Federal Reserve Board. 2008-34.Cecchetti, St. G. and E. Kharroubi. 2015. Why does financial sector growth crowd out real
economic growth? BIS Working Papers 490.Coeuré, B. 2014. On the optimal size of the financial sector. Speech at the ECB Conference
entitled “The optimal size of the financial sector.” Frankfurt. September 2.Colangelo, A. and R. Inklaar, 2010. Banking sector output measurement in the euro area – a
modified approach. In: Review of Income and Wealth 58(1). 142–165.De Gregorio, J. and P. E. Guidotti. 1995. Financial development and economic growth. In:
World Development 23(3). 433–448.Easterly, W., R. Islam and J. Stiglitz. 2000. Shaken and stirred. Explaining growth volatility.
Annual Bank Conference on Development Economics. World Bank. 191–211.ECB. 2016. Financial integration in Europe. April. Fessler, P., P. Lindner und M. Schürz. 2016. Eurosystem Household Finance and Consump-
tion Survey 2014. First results for Austria (second wave). In: Monetary Policy & the Economy Q2/16. OeNB 34–95.
Elsinger, H., R. Köck, M. Kropp and W. Waschiczek. 2016. Corporate financing in Austria in the run-up to capital markets union. In: Financial Stability Report 31. OeNB. June. 96–119.
Haldane, A. G. 2015. On microscopes and telescopes. Speech given at the Lorentz centre work-shop on socio-economic complexity. Leiden. March 27.
Haldane, A., S. Brennan and V. Madouros. 2010. The contribution of the financial sector – miracle or mirage? In: The London School of Economics. 2010. The Future of Finance: The LSE Report.
King, R. G. and R. Levine. 1993. Finance and growth: Schumpeter might be right. In: The Quarterly Journal of Economics 108(3). 717–737.
Levy H. I. and M. Levy. 2014. The home bias is here to stay. In: Journal of Banking & Finance 47. 29–40.
Lund, S., T. Daruvala, R. Dobbs, P. Härle, J.-H. Kwek and R. Falcón. 2013. Financial globalization: Retreat or reset? McKinsey Global Institute. March.
Milesi-Ferretti, G. M. and C. Tille. 2011. The great retrenchment: International capital flows during the global financial crisis. In: Economic Policy 26(66). 287–342.
OeNB. 2016. Financial Stability Report 32. December.Pagano, M., S. Langfield, V. Acharya, A. Boot, M. Brunnermeier, C. Buch, M. Hellwig,
A. Sapir and I. van den Burg. 2014. Is Europe overbanked? ESRB Advisory Scientific Committee Report 4.
Philippon, T. 2008. The evolution of the US financial industry from 1860 to 2007: Theory and evidence. NYU Stern Working Papers.
What is the financial sector’s contribution to the Austrian economy?
MONETARY POLICY & THE ECONOMY Q2/17 71
Philippon, T. 2015. Has the U.S. finance industry become less efficient? On the theory and measurement of financial Intermediation. In: American Economic Review 105(4). 1408–1438.
Raiffeisen Zentralbank Österreich. 2013. Wertschöpfungsbericht: Volkswirtschaftliche Leistung und fiskalischer Beitrag der Raiffeisen Bankengruppe in Österreich im Jahr 2013.
Rajan, R. G. and L. Zingales. 1998. Financial dependence and growth. In: American Economic Review 88(3). 559–586.
Ritzberger-Grünwald, D., A. Stiglbauer and W. Waschiczek. 2016. Banking employ-ment in Austria. In: Financial Stability Report 32. OeNB. 80–100.
Schneider, H., Halper, P. and P. Luptacik. 2016. Ökonomischer Footprint der Erste Bank und Sparkassen. Volks- und regionalwirtschaftliche Effekte in Österreich. Industriewissenschaft-liches Institut.
Statistics Austria. 2017. Input-Output-Tabelle inklusive Aufkommens- und Verwendungstabelle.Udell, G. 2009. Financial innovation, organizations and small business lending. In: Alessandrini, P.,
M. Fratianni and A. Zazzaro (eds.). The changing geography of banking and finance. Springer York.
What is the financial sector’s contribution to the Austrian economy?
72 OESTERREICHISCHE NATIONALBANK
AnnexTable A1
Transfer table
NACE Original Combined
A01 Products of agriculture, hunting and related services Agriculture and forestryA02 Products of forestry, logging and related servicesA03 Fish and other fishing products; aquaculture products; support services to fishingB Mining and quarryingC10—12 Food products, beverages and tobacco products ManufacturingC13—15 Textiles, wearing apparel and leather productsC16 Wood and of products of wood and cork, except furniture; articles of straw and plaiting materialsC17 Paper and paper productsC18 Printing and recording servicesC19 Coke and refined petroleum products C20 Chemicals and chemical productsC21 Basic pharmaceutical products and pharmaceutical preparationsC22 Rubber and plastics productsC23 Other non-metallic mineral productsC24 Basic metalsC25 Fabricated metal products, except machinery and equipmentC26 Computer, electronic and optical productsC27 Electrical equipmentC28 Machinery and equipment (not elsewhere classified)C29 Motor vehicles, trailers and semi-trailersC30 Other transport equipmentC31—32 Furniture; other manufactured goodsC33 Repair and installation services of machinery and equipmentD35 Electricity, gas, steam and air-conditioning UtilitiesE36 Natural water; water treatment and supply servicesE37—39 Sewerage; waste collection, treatment and disposal activities; materials recovery; remediation activities
and other waste management services F Constructions and construction works ConstructionG45 Wholesale and retail trade and repair services of motor vehicles and motorcycles Wholesale and retail tradeG46 Wholesale trade services, except of motor vehicles and motorcyclesG47 Retail trade services, except of motor vehicles and motorcyclesH49 Land transport services and transport services via pipelines TransportH50 Water transport servicesH51 Air transport servicesH52 Warehousing and support services for transportationH53 Postal and courier servicesI Accommodation and food services Accomodation and foodJ58 Publishing services Publishing, broadcasting,
telecommunicationJ59—60 Motion picture, video and television programme production services, sound recording and music publi-shing; programming and broadcasting services
J61 Telecommunications servicesJ62—63 Computer programming, consultancy and related services; information services Computer programmingL68B Real estate services excluding imputed rents Real estateL68A Imputed rents of owner-occupied dwellingsM69—70 Legal and accounting services; services of head offices; management consulting services Legal, accounting, headoffice,
consultingM71 Architectural and engineering services; technical testing and analysis services Scientific, enigineering and other
servicesM72 Scientific research and development servicesM74—75 Other professional, scientific and technical services; veterinary servicesM73 Advertising and market research services Advertising and market researchN77 Rental and leasing services OtherN78 Employment servicesN79 Travel agency, tour operator and other reservation services and related servicesN80—82 Security and investigation services; services to buildings and landscape; office administrative, office
support and other business support servicesSecurity, building services, business support
O84 Public administration and defence services; compulsory social security services Education, health, social work, arts, sportsP85 Education services
Q86 Human health servicesQ87— 88 Social work servicesR90—92 Creative, arts and entertainment services; library, archive, museum and other cultural services;
gambling and betting servicesR93 Sporting services and amusement and recreation servicesS94 Services furnished by membership organisations Personal servicesS95 Repair services of computers and personal and household goodsS96 Other personal services