140
Monetary Policy Guidelines for 2021 – 2023 Moscow

Monetary PolicyGuidelines for 2021 – 2023
Moscow

Approved by the Bank of Russia Board of Directors on 5 November 2020.
The document has been prepared based on statistics as of 22 October 2020.Cut-off date for forecast calculations – 15 October 2020.
The softcopy is posted in the Publications / Guidelines for the Single State Monetary Policy section of the Bank of Russia website (http://www.сbr.ru/publ/ondkp/).
12 Neglinnaya Street, 107016 MoscowBank of Russia website: www.сbr.ru
© Central Bank of the Russian Federation 2020

CONTENTS
INTRODUCTION .............................................................................................................................................3
1. MONETARY POLICY GOALS, PRINCIPLES AND INSTRUMENTS .......................................................5
2. MACROECONOMIC SCENARIOS AND MONETARY POLICY IN 2020–2023 .........................................................................................................................................25
2.1. Main economic trends in 2020 ................................................................................................282.2. Scenarios for the development of Russia’s economy in 2021–2023 .....................................................................................................................................35
3. MONETARY POLICY ENVIRONMENT AND CORE MEASURES IN 2019 H2 AND 2020 ........................................................................................................................... 49
4. MONETARY POLICY OPERATIONAL PROCEDURE IN 2020 AND IN 2021-2023 ..................................................................................................................57
APPENDICES ................................................................................................................................................67
Appendix 1 Monetary policy transmission mechanism in Russia ....................................................................67Appendix 2 Households’ and businesses’ perception of inflation: survey results .................................................................................................................................... 89Appendix 3 Inflation indicators used by the Bank of Russia ............................................................................93Appendix 4 Non-monetary factors of inflation in 2020: the impact of pandemic-related restrictions .....................................................................................................97Appendix 5 World experience of monetary policy and macroeconomic policy in general: crisis resolution approaches ............................................................................100Appendix 6 Inflation and monetary policy: cross-country comparisons .................................................... 109Appendix 7 Monetary programme ....................................................................................................................... 114Appendix 8 Calendar of key rate decisions for 2021 ........................................................................................ 117Appendix 9 Macroeconomic and banking statistics ......................................................................................... 118Appendix 10 Statistics on the use of monetary policy Instruments ................................................................127Appendix 11 Bank of Russia one-week auction-based operations in 2021 ................................................... 130Appendix 12 Required reserve averaging periods in 2021 ................................................................................ 132
GLOSSARY .................................................................................................................................................. 133
ABBREVIATIONS .........................................................................................................................................137
List of boxes
Box 1 Why the Bank of Russia seeks to maintain inflation close to 4% ..........................................................21
Box 2 Neutral interest rate ....................................................................................................................................22
Box 3 Impact of the coronavirus pandemic on potential output .....................................................................32
Box 4 Bank of Russia’s operations in the foreign exchange market .............................................................. 45
Box 5 Fiscal policy in 2020–2023 ........................................................................................................................47
Box 6 Measures taken by the Bank of Russia and the Russian Government to address the economic consequences of the coronavirus pandemic .............................................. 54
Box 7 Changes in the rules and procedures for conducting operations ........................................................ 64
Box 8 New approach to required reserves ..........................................................................................................65
Box 9 Banking sector liquidity and lending to the economy ............................................................................82
Box 10 Transfer curve and the shaping of interest rates on bank operations ................................................ 84
Box 11 Concept of an economic equilibrium and deviations of key macroeconomic variables from such equilibrium (gaps) ..................................................................................................... 86
Box 12 Estimating the exchange rate pass-through to inflation .......................................................................87

Monetary Policy Guidelines for 2021 – 2023 3
INTRODUCTION
The Monetary Policy Guidelines for 2021–2023 are a strategic document of the Bank of Russia stipulating the regulator’s key approaches to maintaining price stability. It elaborates on inflation targeting policy, including its goals, principles, and instruments employed. Russia has been following the inflation targeting regime since 2015. Its consistent usage has helped significantly reduce inflation and maintain it close to 4%. Specifically, price growth in Russia averaged 3.4% over the three last years.
In its Monetary Policy Guidelines, the Bank of Russia presents its baseline scenario and alternative scenarios of the medium-term economic forecast for Russia’s development, detailing the specifics of the monetary policy stance under different circumstances.
This year saw a drastic shift in economic trends both in Russia and abroad instigated by the coronavirus pandemic, as well as dramatic changes in the oil market. Russia’s economy was facing a combination of demand and supply shocks affecting the real and financial sectors and all areas of people’s lives. These events became one of the most serious challenges over recent decades, which required the Government of the Russian Federation and the Bank of Russia to take decisive measures and enhance the coordination in their efforts to support households, businesses, and the economy in general.
By the moment when these challenges arose this year, Russia had accumulated a substantial safety cushion created earlier owing to its consistent and well-balanced macroeconomic policy. The launch of the fiscal rule and a better sustainability of public finance, the maintenance of inflation at its record lows, a higher stability of the financial sector, and a decreased dependence of Russia’s economy on external developments have enabled Russia to more easily weather this year’s challenges and implement adequate measures needed to address negative trends.
The Bank of Russia responded to the dramatic changes in the economic situation with a shift to accommodative monetary policy, cutting the key rate from 6.00% to its record low of 4.25% per annum. Such response of monetary policy was necessary so as to avoid a long-lasting deviation of inflation downwards from the target (close to 4%) and promote conditions that would drive the economy back to its development potential. Thus, in contrast to the previous years when proinflationary risks were mostly predominant, this year the Bank of Russia implemented measures in order to mitigate disinflationary risks induced by a significant decline in aggregate demand.
The considerable reduction in the key rate in response to adverse shocks became possible largely as a result of the consistent usage of the inflation targeting regime over recent years, along with prudent macroeconomic policy. Among other things, this has helped decrease inflation expectations and improve their anchoring at the inflation target, thus limiting proinflationary risks. Therefore, the inflation targeting regime has proved to be efficient in both relatively stable conditions and the period of the drastic changes observed this year. The fundamental of this regime is households’ and businesses’ confidence in the monetary policy pursued, which is in itself an instrument securing price stability and

4 Monetary Policy Guidelines for 2021 – 2023 Introduction
stabilising inflation expectations. Confidence is promoted owing to the consistency of the monetary policy goals and principles, as well as regular communication with society, which favours the development of a predictable economic environment.
Communication transparency is a key to successful inflation targeting policy, and it became particularly important during the period of the pandemic. After making its decisions, the Bank of Russia always promptly provided its comments to explain the measures implemented amid the current events. The Bank of Russia will take further actions in order to enhance communication transparency. In autumn 2020, the Bank of Russia started to publish its information and analytical commentaries on inflation trends in each of the Russian regions. Thus, the Bank of Russia currently provides the analysis of consumer price dynamics at all the three levels: in Russia in general, the federal districts, and individual regions. In the future, the Bank of Russia is going to expand the range of its communications with regular publications to be released by regional branches on the economic situation in Russian regions.
In order to improve the transparency and clarity of its communications regarding future monetary policy, the Bank of Russia is also going to publish information on the key rate path within its macroeconomic forecast.
Further developments will largely depend on how the pandemic situation will be unfolding and the progress of recovery processes in the Russian and global economies, as well as the extent of shifts in households’ sentiment and behaviour patterns and in businesses’ investment and output plans, which in turn may materially impact the economic growth potential both in Russia and abroad. All the above factors form a broad range of probable scenarios of future developments. In such a situation, the Bank of Russia is considering an expanded set of macroeconomic forecast scenarios, including a baseline one and three alternatives.
The key point in these scenarios is not oil prices (in contrast to previous years), but assumptions regarding the growth rates of actual and potential GDP in the Russian and global economies over the forecast horizon. The risk scenario, which is one of the alternatives, also assumes a considerable impact of geopolitical factors on forecast parameters.
As the economic situation returns to normal and inflation stabilises close to 4%, the Bank of Russia will estimate a possible time and pace for shifting from accommodative to neutral monetary policy where the key rate will stay within a neutral range of 5.0–6.0% per annum. Furthermore, under any scenario of future developments, the Bank of Russia will pursue its monetary policy so as to bring inflation back to the target and maintain it close to 4% over the medium-term horizon.
Steadily low inflation, that is, price stability, is absolutely crucial for people’s confidence in the national currency. This in turn is essential for social stability, people’s comfortable living, doing business, and promoting domestic savings and investment, which are the fundamentals for sustainable economic growth. Hence, performing its core function stipulated by the Constitution of the Russian Federation and Federal Law No. 86-FZ, dated 10 July 2002, ‘On the Central Bank of the Russian Federation (Bank of Russia)’, which is protecting the ruble and ensuring its strength through maintaining price stability, the Bank of Russia is contributing to the development of favourable conditions for Russia’s economic growth.

Monetary Policy Guidelines for 2021 – 2023 5
1. MONETARY POLICY GOALS, PRINCIPLES AND INSTRUMENTS
CONTRIBUTION OF MONETARY POLICY TO ECONOMIC DEVELOPMENT
One of the key functions of the Bank of Russia in accordance with the Constitution of the Russian Federation1 and Federal Law ‘On the Central Bank of the Russian Federation (Bank of Russia)’ is to protect the ruble and ensure its strength. The Bank of Russia ensures the strength of the ruble by maintaining price stability, including for creating conditions for balanced and sustainable economic growth. Price stability is the main monetary policy goal, which implies steadily low inflation. It is an important element of an environment that is favourable for living and doing business.
Low inflation ensures a stable purchasing power of the national currency. Low and predictable inflation protects incomes and savings in the national currency. Price stability is a critical condition to protect wages, pensions and other earnings, as well as ruble-denominated savings of households and companies against unpredictable devaluation. This enables households, among other things, to maintain their living standards and plan their spending, including long-term expenses, with greater confidence.
Price stability is essential to support social stability. Low and stable inflation is particularly important to protect low-income households. Such households choose inexpensive staple goods and
1 Part 2, Article 75 of the Constitution of the Russian Federation. This constitutional principle is elaborated on in Federal Law No. 86-FZ, dated 10 July 2002, ‘On the Central Bank of the Russian Federation (Bank of Russia)’, including in Articles 3 and 34.1.
cannot switch to their cheaper substitutes if prices rise considerably. High inflation forces them to reduce consumption, which decreases their quality of life. All else being equal, high inflation aggravates social inequality since it largely affects incomes in socially vulnerable groups of the population. Low inflation is, therefore, an important prerequisite for ensuring social stability.2
Low and sustainable inflation is also favourable for businesses. It contributes to higher affordability of borrowing for companies. High inflation, or significant price volatility is a source of risks for economic agents, including banks. Banks include an increased inflation premium in interest rates for both households and businesses. Low and stable inflation, on the contrary, reduces banks’ risks and creates a more favourable environment for the real sector of the economy to borrow funds. Not only Russian banks, but also domestic investors (both individuals and companies), as well as foreign investors are more inclined to provide financing in a country with a predictable economic environment of which sustainably low inflation is an integral part.
Price stability also simplifies financial and investment planning for businesses and households. Steadily low inflation lays the groundwork for a long-term increase in savings and investment and, consequently, for sustainable and well-balanced economic growth. Thereby, monetary policy helps achieve the common goal of economic policy, that is, an acceleration of economic growth, while maintaining macroeconomic
2 For details regarding the effect of inflation on social inequality, refer to Appendix 3 of the Monetary Policy Guidelines for 2018–2020.
6 Monetary Policy Guidelines for 2021 – 2023
1. Monetary Policy Goals, Principles and Instruments
stability. In turn, this will contribute to a more sustainable increase in social welfare.
Promoting overall confidence in the national currency, low and stable inflation creates favourable conditions for reducing the portion of foreign currency-denominated assets and liabilities in the economy. This, in turn, improves the robustness of the economy to changes in the external environment.
Household and business surveys also suggest that low and stable inflation is an essential element of an environment which is favourable for living and doing business. According to household and business surveys, high inflation is one of the problems affecting living conditions and business climate and impairing the competitiveness of Russian goods (refer to Appendix 2 ‘Households’ and businesses’ perception of inflation: survey results’).
Monetary policy lays the groundwork for sustainable economic development; however, it cannot be a source of a sustainable rise in the economic potential. In the long run, the main factors influencing the potential of economic growth are changes in the labour force size, capital formation, a rise in labour and capital productivity, and innovative technology implementation. The central bank cannot drive the efficiency of production factors and technology deployment through its monetary policy instruments. In its efforts to maintain price stability, the central bank influences domestic demand trends and, consequently, the utilisation of production factors. Thereby, monetary policy helps support economic output close to its potential, rather than determines the economic potential of the country. This defines the countercyclical nature of monetary policy.
The countercyclical role of monetary policy implies that a situation where growth rates and aggregate demand start to exceed
the economy’s production capacity causes the economy to deviate from its potential upwards. In order to prevent its overheating and the resulting deviation of inflation and inflation expectations upwards from the target, the central bank needs to temporarily increase the key rate above its neutral level. Monetary policy tightening will drive the economy back to a balanced growth path and inflation to its target level. To the contrary, when aggregate demand decreases below the economy’s production capacity, this entails the materialisation of the risks of the economy deviating downwards from its potential and of inflation – downwards from its target. This situation requires a temporary reduction in the key rate below its neutral level. Monetary policy easing will provide appropriate support to aggregate demand and bring inflation back to the target. Specifically, such a situation was observed in 2020 when the slump in the global and Russian economies induced by the coronavirus pandemic entailed the risks of inflation deviation downwards from the target in 2021. To support domestic demand and stabilise inflation close to the target over the forecast horizon, the Bank of Russia cut the key rate, shifting to accommodative monetary policy (for details on the key rate decisions, refer to Section 3 ‘Monetary policy environment and core measures in 2019 H2 and 2020’).
That being said, when the economy is close to or above its potential, any efforts to boost economic growth through monetary policy measures by means of a key rate reduction may result in long-term adverse consequences for price stability and financial stability. In the short run, the effects of such an unreasonable decrease in the key rate may spur accelerated lending growth and a rise in domestic demand. However, domestic capacities to satisfy increased demand will be lacking since the economy is already close to or above

1. Monetary Policy Goals, Principles and Instruments
Monetary Policy Guidelines for 2021 – 2023 7
its potential. This will ultimately speed up inflation, which will inevitably cause a rise in interest rates and push economic growth rates downwards.
To enable a sustainable expansion of production capacities, it is necessary to implement other measures. In the first place, these are fiscal and structural policy measures to be taken by the Russian Government, as well as institutional changes. Only such measures, provided they are implemented successfully, may directly boost potential economic growth rates.
KEY MONETARY POLICY PRINCIPLES
• Setting a permanent public quantitative inflation target
Within its inflation targeting strategy, the Bank of Russia sets a quantitative inflation target and publicly announces it for households, businesses and financial market participants to take it into account in their planning and decision-making. The Bank of Russia pursues its monetary policy to deliver on the inflation target.
The monetary policy goal is to maintain annual inflation close to 4% on a continuous basis (for more details, refer to Box 1 ‘Why the Bank of Russia seeks to maintain inflation close to 4%’). The wording ‘close to 4%’ implies that inflation may slightly hover around 4%. Such fluctuations are natural, given that the economy involves a complex chain of interdependencies and that prices are being influenced by multiple factors. However, monetary policy impacts price trends indirectly, specifically through demand, and has a significant time-lag effect, which is why monetary policy measures are capable to ensure the achievement of the inflation target only over time (for details, refer to Appendix 1 ‘Monetary policy transmission mechanism in Russia’).
The inflation target is set for the annual growth rate of consumer prices, that is, the change in prices for goods and services purchased by households over the last 12 months. The consumer price growth rate is determined based on the consumer price index (CPI) calculated for Russia by Rosstat. Concurrently, specific local factors may cause variations in price growth rates across individual goods and service groups and various regions.
The Bank of Russia seeks to maintain inflation close to 4% on a continuous basis. If there are any factors over the forecast horizon that may cause inflation to deviate from the target, the Bank of Russia assesses the reasons behind them and the duration of their potential impact on inflation, in order to make appropriate decisions on monetary policy that would help prevent a deviation of inflation from the target. In a situation where inflation deviates from the target, the Bank of Russia chooses the pace of inflation returning to the target taking into account the scale of the deviation and the influence of key rate decisions on economic activity. Moreover, making these decisions, the Bank of Russia factors in risks to financial stability.
A floating exchange rate is an essential condition for monetary policy to efficiently influence the economy under the inflation targeting regime. When the exchange rate flexibility is low, the central bank’s foreign exchange interventions impacting the banking sector liquidity entail a high dependence of the situation in the money market and other financial market segments on external economic developments. This makes it harder for the central bank to independently manage interest rates and decreases the efficiency of monetary policy.
A floating exchange rate acts as a ‘built-in stabiliser’ enabling the economy to adjust to shifts in external conditions and

8 Monetary Policy Guidelines for 2021 – 2023
1. Monetary Policy Goals, Principles and Instruments
smoothing their impact.3 Under the floating exchange rate regime, the Bank of Russia carries out no interventions in the domestic foreign exchange market to maintain any specific exchange rate or the pace of its movements. That said, the Bank of Russia may conduct foreign exchange transactions in the domestic market in order to replenish (use) international reserves based on the fiscal rule being implemented by Russia’s Ministry of Finance, as well as to fight financial instability factors.
• Key rate and communication as monetary policy instruments
Under the inflation targeting regime, the key rate is the main instrument of the Bank of Russia’s monetary policy. The key rate is the interest rate on main operations4 carried out by the Bank of Russia to regulate the banking sector liquidity. A change in the key rate is an indicator to assess the stance and characteristics of monetary policy. The Bank of Russia’s Board of Directors makes its key rate decisions on a regular basis, specifically eight times a year, in accordance with the pre-approved and publicly available schedule (refer to Appendix 8 ‘Calendar of key rate decisions for 2021’). Revising the key rate, the Bank of Russia, through interbank lending rates, influences interest rates in the economy, and their movements in turn impact domestic demand and inflation. For the key rate to efficiently translate into financial market interest rates, overnight money market rates should form close to the key rate. This is the operational
3 For details regarding the role of a floating exchange rate as a ‘built-in stabiliser’ of the economy, refer to Appendix 9 of the Monetary Policy Guidelines for 2018–2020.
4 The rate corresponds to the minimum interest rate at the Bank of Russia’s one-week repo auctions and to the maximum interest rate at the Bank of Russia’s one-week deposit auctions (within the operational procedure of the Bank of Russia’s monetary policy that also comprises a range of other operations).
objective of the Bank of Russia’s monetary policy.
In order to achieve its operational objective, the Bank of Russia employs standard liquidity management instruments, supplying funds to banks and raising funds from banks, as well as the interest rate corridor. Carrying out its auctions to provide or absorb liquidity, the Bank of Russia seeks to bring actual balances in correspondent accounts across the banking sector in general in line with demand for them, since banks need to maintain their required reserves and process client payments. The Bank of Russia thus creates the conditions promoting an equilibrium in the overnight segment of the money market and the efficient functioning of the interest rate corridor. Interest rate corridor bounds determined by interest rates for overnight symmetric standing facilities limit the range of interest rate fluctuations in the overnight segment of the money market and drive them closer to the key rate (for details about the operational procedure, refer to Section 4 ‘Monetary policy operational procedure in 2020 and in 2021-2023’).
When the economy is in a long-term equilibrium, that is, when inflation and inflation expectations are close to the target and output is near its potential, monetary policy should be neither contractionary, nor expansionary for the economy, i.e. the central bank should pursue neutral monetary policy. When the economy is in an equilibrium, the key rate is assumed to be at a neutral level. The latter is determined by multiple factors and may be estimated using various methods (see Box 2 ‘Neutral interest rate’).
The notion of a neutral interest rate is also associated with the notion of a neutral yield curve. In an equilibrium, the yield curve should have a normal shape, i.e. it should be upward-sloping. This implies that long-term interest rates in the economy

1. Monetary Policy Goals, Principles and Instruments
Monetary Policy Guidelines for 2021 – 2023 9
are higher than short-term ones, since market participants include additional term and risk premiums in long-term interest rates. When the economy is close to its potential, inflation stays near its target, and the key rate is neutral, such slope of the yield curve suggests that real interest rates for various terms form at such levels that promote neutral monetary conditions in the economy.
Any key rate decision is accompanied by an explanation of its logic and reasons, and, generally, by a signal regarding possible further monetary policy moves, which may be implemented should economic developments and inflation trends be in line with the Bank of Russia’s baseline forecast. Thereby, the monetary policy signal is conventional in nature and demonstrates the intents which may be effectuated if the central bank’s baseline scenario materialises. A monetary policy signal is no less important than a key rate decision itself, since it impacts market participants’ expectations regarding further moves of the central bank and influences yield curve trends and monetary conditions that are coherent with the Bank of Russia’s forecast.
The Bank of Russia’s explanation of its decisions and intentions with regard to further moves is an important instrument for managing inflation expectations, that is, for the so-called anchoring of inflation expectations to the target. Inflation expectations impact both inflation trends and interest rates in the economy. The level and stability of inflation expectations determine, among other things, the risk premium included in interest rates. The anchoring of inflation expectations of both households and businesses to the inflation target is crucial to ensure the efficiency of measures being implemented by the central bank. Therefore, it is essential that economic agents are confident in monetary
policy aimed at keeping inflation close to the target level. In order to promote such confidence, it is critical that inflation successfully achieves the target and economic agents comprehend the policy pursued by the central bank, including its goals, approaches and measures being implemented to deliver on the target. Such explanations are particularly important where certain factors cause a temporary deviation of inflation away from the target and the central bank takes measures to bring it back to the target level. In this regard, the Bank of Russia especially focuses on the development of its communication policy, and communication transparency is a core principle in the implementation of monetary policy (see the subsection ‘Communication transparency’ herein).
• Monetary policy decision-making based on the macroeconomic forecast
The Bank of Russia makes its monetary policy decisions relying on the macroeconomic forecast. The effect of monetary policy decisions on price dynamics is not immediate: it takes time and involves a long chain of interconnections known as the monetary policy transmission mechanism (MPTM). Interest rates are the main channel for this effect. A change in the Bank of Russia key rate and a signal regarding its future path impact market interest rates which in turn influence economic agents’ consumer, saving, lending and investment activity. The propensity to save or spend (consume, invest) impacts domestic demand in the economy that influences price movements. It takes from two months to three quarters for a key rate revision to largely translate into interest rates on loans and deposits with various maturities. In addition, it takes extra time for changes in monetary conditions to have a full-scale effect on demand and
10 Monetary Policy Guidelines for 2021 – 2023
1. Monetary Policy Goals, Principles and Instruments
inflation. In view of the above, the key rate pass-through to demand and price dynamics takes from three to six quarters (for details, refer to Appendix 1 ‘Monetary policy transmission mechanism in Russia’). Therefore, a macroeconomic forecast is critical to prepare a key rate decision based on the current situation in the economy and its expected developments in the future.
The Bank of Russia’s forecasts are based on advanced macroeconomic models. The core of the medium-term forecasting system is formed by comprehensive forecasting models covering key interdependencies in the economy at the macro level. They are the basis for identifying the key parameters for a medium-term macroeconomic forecast. These parameters encompass changes in inflation, economic growth, monetary indicators, and the balance of payments. Furthermore, model-based techniques enable the calculation of the scenario path of key rate movements.
Preparing a macroeconomic forecast, the Bank of Russia estimates the duration of factors impacting the economy and price movements, and the stability of existing economic trends. Given the time-lag effect of monetary policy measures on the economy, the Bank of Russia relies on sustainable economic trends and long-term factors when making its decisions on the key rate. The Bank of Russia revises the key rate if current trends evidence a long-lasting deviation of inflation from the target over the forecast horizon or there are long-acting factors that are highly probable to cause such a persistent deviation. Where the existing deviation of inflation from its target results from temporary factors and there are grounds to believe that inflation will return to the target in the short run, it is unreasonable to employ monetary policy measures. This is explained as follows: if the Bank of Russia takes measures in response to such a short-term deviation, they will
continue to influence price movements after inflation returns to the target, which may thus pull inflation away from the target in the opposite direction, and this does not conform to the task of maintaining annual inflation close to 4%.
Nonetheless, factors which are short-term in nature may have a longer-lasting effect when they are so significant that they are capable to influence inflation expectations. Inflation trends are largely driven by inflation expectations, as they guide economic agents in their decision-making regarding purchases, wage levels, and pricing. For instance, in response to a rise in inflation triggered by short-term factors, households may increase demand for goods, expecting that their prices may soon go up. This process may affect both the goods that have already become more expensive and other products, particularly staples. In this environment, manufacturers may decide to significantly raise prices for a wider range of goods and services. Inflationary pressure will amplify, and the deviation of inflation from the target will become more persistent. Such a situation may require monetary policy measures. In contrast, when inflation expectations are steady and anchored to the inflation target, consumers limit their purchases of goods in response to a price growth acceleration since they are confident that inflation is to slow down and return to the target. Therefore, when inflation expectations are anchored, an increase in prices is a factor limiting demand and thus containing a rise in inflation induced by temporary proinflationary factors.
The Bank of Russia conducts an in-depth analysis of a wide range of data when preparing its macroeconomic forecast. The Bank of Russia analyses, among other things, current statistics on the situation in the Russian economy and in global commodity and financial markets,

1. Monetary Policy Goals, Principles and Instruments
Monetary Policy Guidelines for 2021 – 2023 11
information on economic policies in major foreign countries, and possible changes in fiscal, tax, social and other areas of Russia’s economic policy. The Bank of Russia uses these data to formulate assumptions for its forecast scenarios – a complex of external and internal economic factors that may have a material effect on the Russian economy and inflation trends, as well as estimates inflation risks.
When developing its macroeconomic forecast, the Bank of Russia also takes into account the fact that decisions on monetary policy are always made when there is no complete certainty. There can be various factors of uncertainty, including not only possible future economic developments and related forecast assumptions, but also new information on the past and present situation in the economy. Uncertainty in the course of monetary policy decision-making may also be associated with the specifics of model-based techniques used to build a macroeconomic forecast. In this regard, the Bank of Russia places a high emphasis on the rationale of monetary policy decisions it makes in a changing economic environment. Specifically, this involves the use of a broad range of model-based techniques and forecasting of various scenarios of developments in the global and Russian economies, which enables the Bank of Russia to estimate the robustness of its macroeconomic forecast and monetary policy decisions being made based on this forecast with account of its goal to maintain inflation close to the target.
Currently, the Bank of Russia continues to follow the conservative approach when estimating the balance of inflation risks over the forecast horizon, while giving a slightly higher priority to proinflationary factors and risks. This is associated with the specifics of inflation expectations in Russia. Over recent years, households’ inflation expectations and businesses’ price
expectations have decreased significantly as a result of the Bank of Russia’s monetary policy. However, they are still sensitive to short-term proinflationary pressure. Moreover, inflation expectations respond to price movements asymmetrically: households and businesses are more responsive to an acceleration of price growth, rather than to its slowdown. In such a situation, underestimation of proinflationary factors and risks may entail persistent and long-lasting deviations of inflation upwards from the target. Therefore, when formulating assumptions for its forecast, the Bank of Russia especially focuses on those drivers of price movements that may potentially push inflation and inflation expectations upwards. This is in line with the intent of the Bank of Russia to make prudent (robust) monetary policy decisions, taking into account the goal of maintaining inflation close to 4% over the forecast horizon.
The management of households’ and businesses’ inflation expectations is a key task of monetary policy under the inflation targeting regime. In order to change the nature of inflation expectations, it is crucial to maintain inflation close to the target, that is around 4%. Regular communication regarding monetary policy is also critical. Within its communication strategy, the Bank of Russia provides detailed and transparent information about the means, instruments and measures it is going to employ in order to bring inflation back to the target. In turn, a decrease in inflation expectations and their anchoring at a low level help support stable low prices and improve the efficiency of monetary policy.
Measures pursued in other areas of domestic economic policy, as well as measures of economic policy in major foreign countries are important factors the Bank of Russia considers when building its macroeconomic forecast. They may have quite a significant effect on the Russian

12 Monetary Policy Guidelines for 2021 – 2023
1. Monetary Policy Goals, Principles and Instruments
economy and price trends. Hence, the Bank of Russia needs to take them into account when implementing its monetary policy.
In accordance with the legislation, the Bank of Russia is responsible for several areas of economic policy. Along with monetary policy, these areas comprise, among other things, financial stability, sustainability and development of the banking sector, the financial market and the national payment system. The correlation and consistency of these measures are achieved owing to decisions made by the Bank of Russia’s Board of Directors and through the participation of representatives of various areas of the Bank of Russia’s activities in the work of dedicated committees and work groups within the Bank of Russia.
Monetary policy and fiscal policy. Fiscal policy has a significant effect on the conditions of the implementation of monetary policy, including the growth rate and the structure of the economy, product and service price trends, and the level of the country risk premium. Therefore, the Bank of Russia takes into account fiscal policy measures when preparing its macroeconomic forecast and making its key rate decisions.
The fiscal rule is a key element of Russia’s fiscal policy. It works to smooth out the impact of changes in external economic conditions on the domestic environment, including the exchange rate of the ruble and demand in the economy. This reduces volatility of the exchange rate and prices, thus creating favourable conditions for the implementation of monetary policy. The fiscal rule also ensures the predictability of the Russian Government’s approaches to expenditure budgeting and public debt management. In turn, this promotes long-term sustainability in the area of public finance, which is essential to support steady long-term interest rates in the economy and the efficiency of the monetary policy
transmission mechanism, as well as to decrease the equilibrium country risk premium.5
The use of the fiscal rule, which includes operations carried out in the foreign exchange market, reduces fluctuations in the real exchange rate of the ruble caused by changes in the global oil market. This increases the competitiveness of Russian goods and helps create the conditions in the country favouring the development of manufacture in non-commodity sectors and, accordingly, gradual changes in the structure of the economy.
Under the fiscal rule, Russia’s Ministry of Finance calculates the amount of additional oil and gas revenues of the federal budget to be used for purchasing foreign currency to subsequently replenish the National Wealth Fund (NWF), or the amount of foreign currency from the NWF to be sold for further transfer to the budget. Pursuant to instructions from the Ministry of Finance, the Bank of Russia carries out fiscal rule-based operations in the foreign exchange market uniformly and within the amounts announced by the Ministry of Finance so as to avoid any notable influence on exchange rate dynamics. At the same time, the Bank of Russia reserves the right to suspend these operations if volatility in the domestic foreign exchange market increases, among other things, due to the materialisation of external risks or threats to financial stability.
Fiscal policy parameters have a considerable effect on aggregate demand in the economy and, consequently, on inflation. Significant easing of fiscal policy may induce proinflationary pressure in the
5 In 2020–2021, in order to mitigate the adverse consequences of the coronavirus pandemic for the economy, federal budget expenditures will exceed the level provided for by the fiscal rule. However, it is critical that already now the Government of the Russian Federation is planning to completely return to the fiscal rule parameters beginning from 2022 (for details, refer to Section 2 ‘Macroeconomic scenarios and monetary policy in 2020–2023’).

1. Monetary Policy Goals, Principles and Instruments
Monetary Policy Guidelines for 2021 – 2023 13
economy, while budget consolidation has a disinflationary effect. In this environment, a timely and proportionate response of monetary policy will help limit the risks of inflation and inflation expectations deviating from the target and mitigate the economy’s deviation from the balanced-growth path. The nature and specifics of the impact of budget expenditures on economic activity and inflation depend not only on their structure and performance, but also on how they are distributed over time.
Price trends may be influenced by tax policy measures. However, a change in indirect taxes generally entails a one-off adjustment of prices and does not require any monetary policy response provided that economic agents’ inflation expectations are anchored to the target. Contrastingly, where inflation expectations fluctuate due to alterations in tax policy, a situation may require a monetary policy response in order to limit the risks of inflation deviating from the target.
Government expenditures, specifically investment in the development of a number of important industries, may also drive structural changes in the economy. If they help overcome structural constraints, this contributes to the expansion of the economy’s production capacity. As a result, an acceleration of economic growth boosted by increasing government expenditures will not exert upward pressure on inflation. Contrastingly, when an increase in government expenditures creates an environment where a rise in domestic demand exceeds the expansion of the production capacity, this may amplify proinflationary pressure in the economy.
Thus, long-term priorities, the strategy and specific measures of fiscal and structural policy have a material impact on the Bank of Russia’s macroeconomic forecast and its estimate of the balance of risks to inflation. In turn, this has a significant effect on
the selection of a monetary policy stance needed to achieve the inflation target.
Russia’s Ministry of Finance and Ministry of Economic Development, in preparing a draft federal budget and a social and economic development forecast, also take into account the inflation target and the effect of monetary policy on the economy and price movements. The correlation and consistency of monetary policy and fiscal policy measures are achieved owing to the continuous communication between the Bank of Russia and Russia’s Ministry of Finance and Ministry of Economic Development. Namely, they hold regular joint meetings to cross-check estimates and factors impacting key macroeconomic indicators and to discuss macroeconomic forecast assumptions and scenarios. Furthermore, consistent communications on related topics are also essential to enhance confidence in monetary policy and fiscal policy.
Monetary policy and other types of state policy. A range of measures being implemented by other government authorities also helps support price stability. Preparing its macroeconomic forecast, the Bank of Russia also takes into account the effect of such measures. Efforts to reduce the impact of non-monetary factors on price movements are critical to limit price growth and volatility. The Bank of Russia is unable to directly influence these factors that are primarily supply-side. However, they may cause significant inflation fluctuations which in turn may adversely affect inflation expectations (for details about the influence of non-monetary factors, refer to Appendix 4 ‘Non-monetary factors of inflation in 2020: the impact of pandemic-related restrictions’).
Measures being implemented by the Russian Government and regional public authorities help reduce the impact of non-monetary factors on inflation. The Bank of

14 Monetary Policy Guidelines for 2021 – 2023
1. Monetary Policy Goals, Principles and Instruments
Russia is involved in these efforts, providing its expertise to analyse goods and service markets and proposing ways to address problems. At the regional level, the Bank of Russia’s regional branches also regularly communicate on these issues with public authorities.
The key measures of state policy aimed at decreasing the influence of non-monetary factors on price movements that are being currently taken comprise efforts to improve the infrastructure of the agricultural product and food market, promote competition, including in the motor fuel market, and establish administered prices and tariffs, including for utility services.
The implementation of agricultural policy measures will help reduce the negative effect on inflation caused by supply-side factors in agriculture and by shifts in the exchange rate and global commodity markets. This will help lower food price volatility which remains the highest among the key inflation components and hinders a decrease in inflation expectations.
Efforts to reduce the monopolisation of goods and service markets will also decrease the adverse effect of non-monetary factors on prices. When competition is weak, businesses have fewer incentives to improve performance and cut costs, which entails higher prices. Thus, when unfavourable factors push costs upwards, monopolies may increasingly pass them on to customers. In a more competitive environment, companies will strive to maintain their market share and, accordingly, pass increased costs on to ultimate prices only partially, although reducing their profit. Concurrently, they will also do their best to enhance their performance and cut costs – otherwise, they will have to exit the market. Eventually, a more competitive environment in the market helps decrease the impact of adverse factors on price movements.
A critical framework to reduce the effect of imperfect competition on pricing is ‘The
Standard for Promotion of Competition in the Constituent Territories of the Russian Federation’ (hereinafter, the Standard). Bank of Russia representatives participate in the work of collective bodies established in compliance with the requirements of the Standard. In order to identify commodity markets in the constituent territories of the Russian Federation where high market concentration hinders the reduction in inflationary pressure and to address this situation, the Bank of Russia expands its cooperation with the Federal Antimonopoly Service of the Russian Federation and is extensively engaged in the improvement of the Standard.
Prices may also be impacted by internal institutional factors associated with the regulation in individual markets, including changes in required ratios, fees, and tariff setting approaches. Although they generally have only minor and non-recurrent effect on inflation within the overall CPI, it may turn out to be significant for individual markets and regions, as well as for households’ and businesses’ inflation expectations. Therefore, the Bank of Russia continues to carefully monitor the actual and planned changes in this area and discuss their effects with businesses, the financial community, and government authorities.
The majority of the above measures aimed at smoothing out the impact of non-monetary factors on inflation takes time to deliver. The Bank of Russia will factor in consumer price changes caused by these measures when preparing its macroeconomic forecast and making its monetary policy decisions.
Monetary policy and financial sector stability policy. The Bank of Russia adheres to the principle of independent target setting for monetary policy and financial sector stability policy. Within this strategy, the Bank of Russia uses monetary policy and the key rate as its core mechanism to maintain inflation close to the target, while

1. Monetary Policy Goals, Principles and Instruments
Monetary Policy Guidelines for 2021 – 2023 15
the financial sector stability is secured through other policy measures. Firstly, this is regulation of bank and non-bank financial institutions (microprudential regulation), supervision, financial resolution measures aiming at the sustainability of financial institutions and preservation of depositors’ and creditors’ funds. Secondly, this is macroprudential policy supporting the stability of the financial system in general and helping prevent the accumulation of excessive risks in its individual segments and mitigate the probability of crisis events and their adverse economic consequences. Thus, this enables monetary policy to focus on maintaining price stability.
In today’s international practice, central banks more often pursue the strategy of independent target setting for these two tasks. Global experience shows that price stability does not guarantee financial stability. Thus, systemic risks typically emerging in individual segments may accumulate in the financial sector as a whole amid generally stable macroeconomic conditions. Moreover, an environment characterised by macroeconomic stability may provoke an underestimation of long-term financial risks by market participants. If such risks materialise in the future, this may entail major economic losses. In other words, there can be a mismatch between financial cycle and business cycle phases. And they can also substantially differ in terms of their intensity and duration. These effects were most pronounced in the 2008–2009 when overheating in global financial markets caused severe losses in the real economy. In order to maintain financial stability, it is therefore essential to enhance microprudential regulation by implementing special macroprudential policy measures that would successfully prevent the accumulation of systemic risks.
Simultaneously, the sustainability of the financial sector is a prerequisite for the efficient functioning of the monetary policy
transmission mechanism. Only a stable financial sector is capable to ensure the smooth processing of payments and the transformation of savings into investment. By limiting the accumulation of systemic risks, it is possible to reduce the probability of financial crises and increase the degree of certainty for financial market participants. In the case of adverse developments in financial markets, including due to external factors, macroprudential policy easing enables the financial sector to stably perform its core functions and helps mitigate negative effects for the real economy. All this promotes confidence in the national financial sector, its attractiveness for all groups of participants, and, consequently, positively influences the level of risk premia, the depth and liquidity of financial markets, and the financial sector expansion and development. Thus, financial sector stability policy ensures a sustainable and efficient transmission of the effects of monetary policy decisions into the dynamics of key macroeconomic indicators.
In most cases, changes in microprudential regulation influence long-term and structural aspects of financial institutions’ operations; therefore, relevant decisions are made irrespective of medium-term monetary policy decisions. Furthermore, changes in microprudential regulation (in contrast to macroprudential regulation) are generally introduced on a continuous basis and do not depend on a particular stage of the financial and economic cycle. In view of the above, normally they do not have any significant effect on the monetary policy environment. However, in the course of extensive structural alterations in the approaches to regulation (e.g. introduction of the Basel III requirements), analysis can identify that they do considerably impact the parameters of individual operations performed by financial institutions. If this happens, the Bank of Russia takes into account such influence, e.g. when making

16 Monetary Policy Guidelines for 2021 – 2023
1. Monetary Policy Goals, Principles and Instruments
decisions on appropriate adjustments to the operational procedure of its monetary policy.
Macroprudential policy decisions are largely associated with cyclical fluctuations in the economy and financial markets; therefore, macroprudential measures take into account the effect of monetary policy decisions on macroeconomic indicators. In turn, macroprudential policy measures can impact the monetary policy environment, including lending trends and interest rates in individual segments. Therefore, making decisions on how to limit systemic risks through macroprudential policy, the Bank of Russia assesses the intensity of their influence on the movements of financial sector indicators and, where necessary, factors in such influence when working out monetary policy decisions.
The monetary policy environment may also be impacted by other measures aimed at ensuring the stable operation of the financial sector. Thus, liquidity provision to credit institutions within financial resolution measures shifts the structural liquidity balance in the banking sector. The Bank of Russia takes these changes into account when setting limits on operations to absorb or provide liquidity, thereby mitigating their potential effect on the operational procedure of monetary policy and on monetary conditions.
Pursuing the policy of independent target setting, the Bank of Russia normally changes the key rate only in response to macroeconomic developments affecting inflation. A situation where systemic risks ultimately materialise generally requires a closer coordination in the implementation of monetary policy and financial stability policy. In such cases, making its monetary policy decisions, the Bank of Russia may factor in the need to both stabilise financial markets and maintain the sustainability of the financial sector as a whole. Furthermore,
in a situation where macroeconomic risks materialise simultaneously with financial stability risks, a sequence of prudential policy measures may amplify the efficiency of monetary policy measures.6
In addition, if there is any threat to financial stability, the Bank of Russia may carry out foreign exchange transactions in the domestic foreign exchange market. The Bank of Russia sees as a threat to financial stability such a situation in the foreign exchange market which may cause a considerable shrinkage of liquidity in the domestic foreign exchange market, the emergence of persistent devaluation expectations coupled with elevated demand for foreign exchange, growth of the share of foreign currency in the economy in general, and a short-term increase in risks to credit institutions’ and businesses’ sustainability.
Monetary policy and financial market development. Monetary policy decisions influence the economy through the financial market. A mature financial market enables a more efficient redistribution of financial resources, which in turn creates conditions for investment activity growth and national economic development. Financial instruments (bank deposits and loans, securities) are used to accumulate and subsequently redistribute financial resources. That said, a change in the patterns of the use of financial instruments generally does not alter monetary conditions in the economy.
The Bank of Russia’s financial market development strategy and its priority to maintain price stability through monetary policy measures promote the availability of financing for a wide range of economic agents. Furthermore, the financial market is
6 For details regarding monetary policy and macroprudential policy measures implemented by the Bank of Russia in 2020 amid the coronavirus pandemic, refer to Section 3 ‘Monetary policy environment and core measures in 2019 H2 and 2020’.

1. Monetary Policy Goals, Principles and Instruments
Monetary Policy Guidelines for 2021 – 2023 17
a key element to transmit the key rate signal into the economy. The larger the size and liquidity of the financial market, the stronger and quicker the transmission of the key rate into the dynamics of economic indicators. In turn, this improves the efficiency of the monetary policy pursued.
To expand the circle of financial market participants and involve them in an extensive exchange of financial resources, the Bank of Russia implements measures to enhance the digitisation of the financial market, increase the range and accessibility of financial services, and promote competition. In order to achieve these goals, the Bank of Russia develops its Faster Payments System (FPS) enabling clients to instantly transfer funds to one another, even if their accounts are with different banks participating in the FPS; develops the Digital Profile infrastructure enabling citizens to remotely provide information about themselves contained in public sources to financial institutions through a single point of contact; develops the Unified Biometric System in order to ensure that citizens and businesses can remotely and safely access financial services at any time and location in the country; and contributes to the implementation of the law on financial platforms (the Marketplace project) allowing individuals access to various financial institutions’ services through a single point of contact.
The Bank of Russia deploys innovative technology and platform solutions in the financial market, which improves financial inclusion, reduces market participants’ costs, speeds up operations in the financial sector, and lowers barriers for financial service suppliers and consumers, thus favouring a competitive environment enabling small and regional financial institutions to offer their services to a broad range of consumers. The promotion of competition in the financial market helps enhance the
quality of services and decrease funding costs for economic agents.
In order to boost the growth of investment activity, the Bank of Russia implements measures aimed at increasing the portion of individuals’ money income invested in the economy, which is primarily supported owing to the development of individual investment accounts. To ensure better protection for retail investors, the Bank of Russia took efforts to promote the approval of the law on investor classification. An increase in the number of private investors helps spur demand for debt instruments offered and reduce offering costs for companies.
Mutual trust among market participants, information transparency and consumer protection are also essential for encouraging investors’ and borrowers’ interest in financial market transactions. In view of the above, the Bank of Russia implements measures to counteract unfair practices, prevent and suppress violations, improve conduct supervision and the quality of corporate governance, enhance the institute of business reputation, and raise the qualification requirements for financial institutions’ key officials.
The Bank of Russia takes action to improve financial literacy of the general public focusing on various social groups in order to help households better navigate the services offered in financial markets and use them more efficiently. These efforts are aimed at developing individuals’ skills for efficient personal financial management, adequate risk assessment, and expansion of their knowledge about various financial products. Moreover, the Bank of Russia seeks to enhance financial literacy not only among individuals, but also among companies.
The implementation of risk-based and proportionate banking regulation also motivates banks to lend to real sector
18 Monetary Policy Guidelines for 2021 – 2023
1. Monetary Policy Goals, Principles and Instruments
companies. Such regulation will provide banks with more opportunities to efficiently redistribute credit resources in the economy, including owing to a decrease in interest rates.
Generally, the measures taken to develop the financial market will contribute to a higher engagement of domestic private investors in the financial market operation, which will become a driver for the evolution of the long-term money institute and economic growth and will also help increase the efficiency of monetary policy.7 However, the financial market development package will take time to deliver. Therefore, decisions in this area have no major implications for the conduct of monetary policy in the short run. As the financial market evolves, the changes unfolding in it will gradually modify the monetary policy transmission mechanism.
Monetary policy and economic policies in foreign countries. Given its openness, the Russian economy is strongly influenced by developments in global financial and commodity markets which depend on economic policies in both key advanced economies and emerging market economies. Decisions made by major central banks and governments first and foremost impact the economic situation in respective countries. In turn, developments in major economies influence global demand and, accordingly, prices in global goods and service markets, including commodity markets. Given Russia’s extensive involvement in global trade, prices in global goods and service markets are a key driver of price trends in the country.
Monetary policies pursued by major central banks influence financial asset prices in global markets, investors’ risk appetite,
7 For details about financial market development measures and their effects, refer to The Guidelines for the Development of the Russian Financial Market in 2019–2021, http://www.cbr.ru/about_br/publ/onfinmarket/.
country risk premiums, and exchange rate movements. Since cross-border capital flows are unrestricted, Russian economic agents’ borrowings in external markets, Russian entities’ overseas investment, and foreign investment in the Russian economy depend on the situation in global financial markets, including in emerging market economies, and on the attractiveness of Russian financial assets as compared to other countries. The Bank of Russia builds its macroeconomic forecast taking into account the multifaceted effect of economic policy measures in advanced and developing countries on the situation in the Russian economy.
• Communication transparency
Promoting the society’s understanding of and confidence in the Bank of Russia’s monetary policy to form a predictable economic environment. The transparency of monetary policy is aimed at enhancing the society’s understanding of and confidence in the monetary policy stance and promoting a predictable economic environment for all economic agents. In turn, the understanding of and confidence in the monetary policy pursued increase its efficiency and helps maintain price stability. When households and businesses are confident that inflation will remain steadily low and that the central bank seeks and is capable to ensure price stability on an ongoing basis, there will be no considerable adjustments in their inflation expectations in response to short-term price fluctuations or the emergence of proinflationary or disinflationary factors. Furthermore, a better understanding of the central bank’s decisions and its communication signals helps economic agents take them into account quicker and more correctly when forming their expectations regarding interest rates and making their decisions on borrowings, savings, wage indexation and

1. Monetary Policy Goals, Principles and Instruments
Monetary Policy Guidelines for 2021 – 2023 19
pricing. As a result, the impact of monetary policy on the economy and inflation enhances, and the scale and duration of inflation deviation from the target decline.
Communication transparency is critical in today’s practices of central banks. Therefore, communication policy has become an independent instrument of monetary policy. In order to efficiently manage expectations of a wide range of economic agents, it is essential not only to set a quantitative inflation target and to deliver on it steadily through monetary policy decisions, but also to take active focused efforts to communicate the information on inflation, the balance of price stability risks, and monetary policy to various audiences.
Information delivered by the central bank is especially important for forming expectations of households and the non-financial sector due to their generally lower motivation and opportunities for accessing and processing specialised economic information (in contrast to professional financial market participants). Thus, today the central bank’s communication policy should take into account the specifics and needs of various target audiences.
Moreover, the information communicated by the central bank becomes increasingly important when the economy experiences significant changes. In such an environment, prompt communication of detailed information to the society about monetary policy decisions and comprehensible explanations of current economic developments and their potential consequences help reduce uncertainty and stabilise the situation, influencing the behaviour and expectations of households, businesses, and financial market participants. For instance, in spring 2020, after the drastic deterioration of the situation in the global and Russian economies induced by the coronavirus pandemic, the Bank of Russia launched
additional, more frequent communication channels. Specifically, in April–May 2020, the Bank of Russia Governor held weekly press conferences on current economic developments. In addition, the Bank of Russia issued its analytical review Financial Pulse focusing on monetary policy issues, among other things.
Frequency and completeness of information on monetary policy. Within its transparency policy, the Bank of Russia first and foremost seeks to promptly and amply communicate the information on the goals, principles, measures and results of its monetary policy, as well as on the assessment of the economic situation and its prospects. Key monetary policy goals and principles are communicated annually in the Monetary Policy Guidelines. On the day the Bank of Russia’s Board of Directors makes its key rate decision, the Bank of Russia issues a press release on the specifics of and rationale for this decision. In addition, the Bank of Russia Governor regularly holds live press conferences after the approval of key rate decisions. The Bank of Russia started to carry out the Bank of Russia Governor’s press conferences after each meeting of the Board of Directors during the period of economic uncertainty in spring 2020, and then decided to continue this practice further on. Therefore, the Bank of Russia will hold eight, instead of four, press conferences a year. As a result, the Bank of Russia will be able to provide additional comments on the Board of Directors’ key rate decisions more regularly.
Furthermore, the Bank of Russia publishes its medium-term macroeconomic forecast four times a year (in February, April, July, and October), along with its press release on the key rate. The Bank of Russia’s Monetary Policy Report is also issued four times a year: it provides a detailed view of the Bank of Russia regarding current economic developments and its medium-term

20 Monetary Policy Guidelines for 2021 – 2023
1. Monetary Policy Goals, Principles and Instruments
forecast that are the basis for the key rate decisions made. The Bank of Russia made the decision to expand communications on its macroeconomic forecast, including to publish information on the key rate path. The Bank of Russia is going to elaborate the formats of such communications in the near future.
The Bank of Russia issues its regular commentaries analysing the economic situation, main macroeconomic trends, inflation movements and inflation expectations, the situation in financial markets, and the state of the balance of payments. In addition to economic materials based on recent data, the Bank of Russia also publishes findings of a range of economic research on its website and analytical articles in specialised economic journals.
Outreach of monetary policy and targeting of communications. The Bank of Russia takes efforts to improve the outreach of its monetary policy and to make the communication more targeted, including at the regional level.
The Bank of Russia seeks to provide more extensive coverage of regional economic trends. To this end, in addition to its information and analytical commentaries on inflation in the Russian federal districts, in autumn the Bank of Russia started to publish its commentaries on inflation in every Russian region. Thus, the Bank of Russia now provides the analysis of consumer price trends at all the three levels: in Russia in general, the federal districts, and individual regions. The Bank of Russia is working out approaches to and the format of the
publication of comprehensive information on economic conditions in Russian regions.
The Bank of Russia enhances the frequency and information content of its communications and interviews and increases the number of its publications, as well as employs both new remote communication technologies and conventional channels, such as round table conferences and communication sessions with businesses and government authorities in all Russian regions, personal interviews in mass media, and public lectures at universities. Remote forms of communication with various audiences became increasingly important amid the coronavirus pandemic.
At the same time, the Bank of Russia takes into account how knowledgeable a particular audience is about monetary policy issues and the economy in general, and thus selects the most appropriate communication channels and tools, the complexity of information, the extent and format of its disclosure. In view of the above, the Bank of Russia publishes a broad range of materials, from research papers to educational videos for various audiences, including schoolchildren. In order to expand the coverage and improve the targeting of its communications, the Bank of Russia actively increases its presence in social media.
The Bank of Russia will continue to enhance the efficiency of its communications on monetary policy issues, employing the whole range of instruments available and improving their usage with due regard for the specifics of the audience.

1. Monetary Policy Goals, Principles and Instruments
Monetary Policy Guidelines for 2021 – 2023 21
BOX 1 WHY THE BANK OF RUSSIA SEEKS TO MAINTAIN INFLATION CLOSE TO 4%
The Bank of Russia has set the 4% inflation target with account of the pricing specifics and the structure of Russia’s economy. This level is slightly higher than in economies with mature market mechanisms, long-term experience of maintaining price stability, well-established confidence in monetary authorities, and low inflation expectations. Inflation targets in such economies generally range from 1% to 3%. However, it would be very hard to continuously maintain inflation close to this level in Russia due to the insufficient maturity of its market mechanisms and sectoral diversification of the economy.
In addition to the above factors, the 4% target has been selected so as to mitigate the risks of deflationary trends in the markets of individual products. Given the existing structure of the Russian economy, prices in various product groups may be changing unevenly. Moreover, the consumer basket includes a rather high share of goods and services that may fluctuate in prices a lot. Therefore, when inflation is considerably below 4%, this may create the risk of a long-lasting price decrease, i.e. deflation, in the markets of various product groups. If deflation occurs in a broad range of goods, its implications might be no less adverse than those resulting from high inflation. Specifically, expecting prices to go down, consumers will tend to postpone their purchases. Declining domestic demand will in turn exert additional downward pressure on prices, thereby exacerbating the deflationary spiral. Therefore, to avoid deflationary developments in the course of the adjustment of relative prices, the target growth rate of the overall consumer price index in Russia should provide for a certain margin.

22 Monetary Policy Guidelines for 2021 – 2023
1. Monetary Policy Goals, Principles and Instruments
BOX 2 NEUTRAL INTEREST RATE
The neutral rate (natural rate of interest, neutral interest rate, equilibrium interest rate) has been a key term in the macroeconomic theory since it was invented by Knut Wicksell in 1898.
The neutral rate is the interest rate (in particular, the central bank’s key rate and overnight interbank interest rates set close to the key rate) that sustainably supports (1) the economy at full employment (the output is at its potential) and (2) inflation at the target level. The neutral rate is deemed to be a benchmark for assessing a monetary policy stance. It is also considered to be a benchmark for longer-run average interest rates in the economy.1
The real neutral rate is determined by the economy’s structure, the level of risks associated with investments in financial and non-financial assets, and economic agents’ risk appetite. In particular, the following key factors may be highlighted: • Multifactor productivity growth rate. The higher it is, the higher is the neutral rate, as, all other things being equal, businesses make larger investments and, accordingly, are willing to pay more for raising additional capital.
• Demography. The structure of the population and changes in its size, both in general and of individual age groups, influence both economic growth rates (and, consequently, investment activity) and the saving ratio. Thus, as the proportion of middle age groups in the population structure with a high saving ratio increases, the neutral rate will go down.
• Financial sector maturity and regulation. A higher maturity of the banking sector and capital markets contributes to the growth of the saving ratio in the economy and, accordingly, help decrease the neutral rate. This effect is also facilitated when economic agents extend their planning horizon, thus making the future more important than the present, which encourages savings.
• Neutral rate levels in other economies. The neutral rate in an open economy with free capital flows will be comparable with the neutral rate in the global financial market (the external interest rate), adjusted for a country risk premium and an inflation volatility premium. A country premium characterises the differences in economic agents’ perception of sovereign credit risks and the predictability of economic conditions in a particular country as compared to the environment in the key economies determining the level of the global neutral rate.In turn, the nominal neutral rate is the total of the real neutral rate and expected inflation.
Where inflation expectations are anchored to the target, expected inflation coincides with the central bank’s target (for the Bank of Russia, the annual target is 4%).
However, the central bank would be unable to keep inflation at the target level by simply preserving the key rate equal to the neutral interest rate. The economy is a complicated system continuously impacted by diverse and often poorly predictable factors (both internal and external ones), due to which both output and inflation may deviate from the potential and target, respectively. If being affected by certain factors, output in the economy is above (beneath) its potential at a given moment, this commonly causes an acceleration (deceleration)
1 Economists distinguish between the longer-run neutral rate (or trend interest rate) and the shorter-run neutral rate. In this case, we only refer to the longer-run neutral rate that depends on structural factors. The shorter-run neutral rate fluctuates around the longer-run neutral rate, being affected by cyclical factors (e.g. external environment, current business activity, and fiscal policy measures). The shorter-run neutral rate is also impacted by the extent of the anchoring of inflation expectations to the inflation target and other factors. This is the shorter-run neutral rate that should be referred to when discussing the current monetary policy stance. Quantification of the shorter-run neutral rate is quite complicated, even in economies with a much longer inflation targeting history than in Russia. Moreover, central banks do not announce the results of such quantifications (Bank of England, 2018; Brainard, 2018). However, making monetary policy decisions, central banks do factor in the direction and extent of the current deviation of the shorter-run neutral rate from the longer-run rate and the future dynamics of the former.

1. Monetary Policy Goals, Principles and Instruments
Monetary Policy Guidelines for 2021 – 2023 23
of inflation. Inflation may also deviate from the target for other reasons that are not associated with fluctuations in output (e.g. due to changes in the external environment and exchange rate). If there are grounds to believe that such changes may entail a significant upward (downward) deviation of inflation from the target, the central bank would have to set the key rate above (below) the neutral rate so as to bring inflation back to the target level.
Unfortunately, the neutral rate is a value that cannot be measured directly, but can only be roughly approximated on the basis of other economic indicators and their dynamics. Moreover, the range of such estimates would be very broad.
The first group of methods is based on macroeconomic models that rely on structural interconnections between key economic variables (output, inflation, the key rate, and exchange rates) and, depending on their past dynamics, generate a range of estimates for non-observable values, including for the neutral rate. In order to obtain robust estimates using these methods, it is necessary to have extended (20–30 years) data series for the economy in question. That said, if during the period which is used as the basis for generating a neutral rate estimate the economy was facing material structural shifts, including significant changes in a monetary policy regime, the variation of obtained model-based estimates for the neutral rate will be quite wide.
The other group of methods is based on the above interconnection between the neutral rate in an open economy and the neutral rate in the key economies. These methods, however, are rougher and assess financial investors’ perception whether interest rates in a certain country are adequate (considering all risks) compared with interest rates in the key economies. Essentially, they measure the relative attractiveness of financial assets denominated in the national currency. These estimates cannot directly take into account the specifics of the economy in question. Therefore, they only allow an approximate estimate of the interconnection between interest rates, inflation and economic growth. Accordingly, when these methods are used, the final estimate largely depends on the assumptions regarding the nature and size of the country premium in relation to the global neutral rate. This is exacerbated by the uncertainty of neutral rate estimates for the key economies that are used as the basis for calculations. The advantage of estimates obtained through these methods is that they are within a relatively narrow range.
Hence, it is essential to emphasise that, although the level of the neutral rate is quite an important notion in macroeconomic analysis in general and monetary policy in particular, in practice it can only be calculated very approximately. Moreover, this level is not constant, fluctuating as the economy’s structure (including the above factors) changes and economic agents adjust to the inflation targeting regime.
A large variation and instability of neutral rate estimates are among the reasons why critics dispute the use of the neutral interest rate to determine the extent of monetary policy tightness (softness). Indeed, the neutral rate is a convenient instrument to explain monetary policy decisions, including to the general public. However, the uncertainty over its estimates, even in advanced economies, entails a high cost of errors in such communication.
According to the most part of the research published over recent years, the quantitative estimates of the level of the longer-run real neutral rate for Russia range from 1% to 3% (the range of estimates). For example, Kreptsev et al. (2016): 1.0–3.2% (various models); IMF (2019): 1–3% (various models); Isakov (2019): 1.5–2.5% (various parameters). At the same time, the above estimates are characterised by wide confidence intervals. In 2017–2019, the Bank of Russia’s estimate of the longer-run real neutral rate was in the upper half of the range of external estimates, i.e. in the range of 2–3% (see the Box ‘Neutral interest rate’ in the Monetary Policy Guidelines for 2020–2022). In 2020, the Bank of Russia shifted its estimate of the longer-run neutral rate to the lower half of the range of external estimates, for several reasons. Firstly, amid expectations regarding the long-term consequences of the coronavirus pandemic for the

24 Monetary Policy Guidelines for 2021 – 2023
1. Monetary Policy Goals, Principles and Instruments
global economy, the estimate of the longer-run external neutral rate decreased: e.g. according to the surveys by the FOMC,2 the prevailing trend in the estimate of the longer-run real rate in September 2020 approximated 0.25–0.5%3 against 0.75–1.0% in June 2018, while real yields on five-year U.S. Treasury bonds declined from an average of 0.7% in 2018 to an average of -0.7% beginning from early 2020. Secondly, Russia’s equilibrium country risk premium also lowered to 100–150 bp, evidencing a decrease in the dependence of the Russian economy on the oil price on the back of the operating fiscal rule and the inflation targeting regime. Therefore, the longer-run neutral interest rate is currently estimated within the range of 1.0–2.0% (which corresponds to the 5.0–6.0% neutral interest rate with the inflation target of 4%).
References:
1. Kreptsev D. , Porshakov A. , Seleznev, S. , Synyakov A. The Equilibrium Interest Rate: Estimates for Russia / the Bank of Russia. Working Paper Series. 2016. No. 13.2. Bank of England. Inflation Report / August 2018.3. Brainard L. What Do We Mean by Neutral and What Role Does It Play in Monetary Policy? / Remarks delivered at the Detroit Economic Club. Detroit, Michigan. 2018.4. International Monetary Fund. Russian Federation – Staff Report for the 2019 Article IV Consultation.5. Isakov A. , Latypov R. The Ibsen Manoeuvre: Yet Another R* Estimate / VTB Capital Research Alert, (Very) Technical Brief series. 15 July 2019.6. Holston K. , Laubach T. , Williams J. Measuring the Natural Rate of Interest: International Trends and Determinants / NBER Working Paper. 2016. No. 11.
2 The Federal Open Market Committee of the US Federal Reserve System.3 With expected inflation (PCE) of 2% over a long-term horizon.
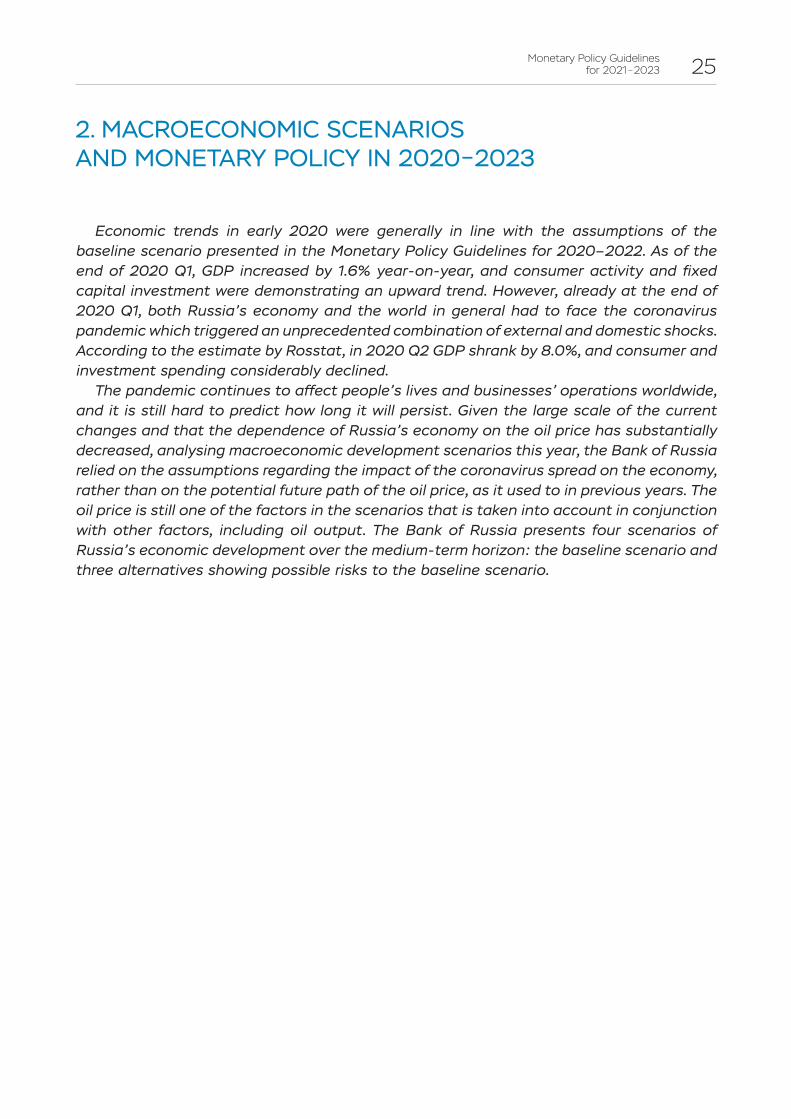
Monetary Policy Guidelines for 2021 – 2023 25
2. MACROECONOMIC SCENARIOS AND MONETARY POLICY IN 2020–2023
Economic trends in early 2020 were generally in line with the assumptions of the baseline scenario presented in the Monetary Policy Guidelines for 2020–2022. As of the end of 2020 Q1, GDP increased by 1.6% year-on-year, and consumer activity and fixed capital investment were demonstrating an upward trend. However, already at the end of 2020 Q1, both Russia’s economy and the world in general had to face the coronavirus pandemic which triggered an unprecedented combination of external and domestic shocks. According to the estimate by Rosstat, in 2020 Q2 GDP shrank by 8.0%, and consumer and investment spending considerably declined.
The pandemic continues to affect people’s lives and businesses’ operations worldwide, and it is still hard to predict how long it will persist. Given the large scale of the current changes and that the dependence of Russia’s economy on the oil price has substantially decreased, analysing macroeconomic development scenarios this year, the Bank of Russia relied on the assumptions regarding the impact of the coronavirus spread on the economy, rather than on the potential future path of the oil price, as it used to in previous years. The oil price is still one of the factors in the scenarios that is taken into account in conjunction with other factors, including oil output. The Bank of Russia presents four scenarios of Russia’s economic development over the medium-term horizon: the baseline scenario and three alternatives showing possible risks to the baseline scenario.

26 Monetary Policy Guidelines for 2021 – 2023
2. Macroeconomic scenarios and monetary policy in 2020–2023
2019 (actual)
Baseline
2020 2021 2022 2023
Inflation, as % in December year-on-year 3.0 3.9 – 4.2 3.5 – 4.0 4.0 4.0
Inflation, average for the year, as % year-on-year 4.5 3.2 – 3.3 3.3 – 4.0 4.0 4.0
Gross domestic product 1.3 -(4.0 – 5.0) 3.0 – 4.0 2.5 – 3.5 2.0 – 3.0
Final consumption expenditure 2.4 -(6.2 – 7.2) 4.2 – 5.2 3.0 – 4.0 2.1 – 3.1
– households 2.5 -(9.5 – 10.5) 5.3 – 6.3 3.7 – 4.7 2.5 – 3.5
Gross capital formation 3.8 -(7.8 – 10.8) 3.1 – 5.1 4.2 – 6.2 3.0 – 5.0
– gross fixed capital formation 1.5 -(7.8 – 9.8) 3.3 – 5.3 4.5 – 6.5 3.2 – 5.2
Exports -2.3 -(5.1 – 7.1) -0.8 – 1.2 3.6 – 5.6 2.0 – 4.0
Imports 3.4 -(18.0 – 21.0) 3.9 – 5.9 8.4 – 10.4 4.9 – 6.9
Money supply in national definition 9.7 14 – 17 8 – 12 7 – 11 7 – 11
Banking system’s claims on the economy in rubles and foreign currency* 10.1 9 – 12 7 – 11 7 – 11 7 – 11
– on businesses 7.1 8 – 11 6 – 10 6 – 10 6 – 10
– on households 19 13 – 16 12 – 16 10 – 14 10 – 14
* Banking system claims on organisations and households mean all of the banking system’s claims on non-financial and financial institutions and households in rubles, foreign curren-cy and precious metals, including loans issued (including overdue loans), overdue interest on loans, credit institutions’ investment in debt and equity securities and promissory notes, as well as other forms of equity interest in non-financial and financial institutions, and other accounts receivable from settlement operations involving non-financial and financial insti-tutions and households. Claims’ growth rates are given with the exclusion of foreign currency revaluation. In order to exclude the effect of foreign currency revaluation the growth of claims in foreign currency and precious metals is converted into rubles using the period average USD/RUB exchange rate.
Source: Bank of Russia.
KEY PARAMETERS OF THE BANK OF RUSSIA’S FORECAST UNDER THE BASELINE SCENARIO(growth as % of previous year, unless indicated otherwise)
Table 1
2019 (actual)
Baseline
2020 2021 2022 2023
Current account 65 33 32 18 30
Balance of trade 165 88 99 100 126
Exports 420 316 331 353 400
Imports 255 228 232 253 274
Balance of services -36 -14 -24 -38 -51
Exports 63 44 48 52 57
Imports 99 59 71 90 109
Primary and secondary income account -64 -41 -43 -44 -45
Current and capital account balance 65 33 32 18 30
Financial account (net of reserve assets) -4 49 30 17 11
Government and the central bank -23 -4 -5 -4 -4
Private sector 19 53 35 20 15
Net errors and omissions -2 0 0 0 0
Change in FX reserves (‘+’ is increase, ‘-’ is decrease) 66 -16 2 1 19
Urals price, average for the year, US dollars per barrel 64 41 45 45 50
* Using the methodology of the 6th edition of ‘Balance of Payments and International Investment Position Manual’ (BPM6). In the Financial account ‘+’ stands for net lending, ‘-’ – for net borrowing. Due to rounding total results may differ from the sum of respective values.
Source: Bank of Russia.
RUSSIA’S BALANCE OF PAYMENTS INDICATORS UNDER THE BASELINE SCENARIO*(billions of US dollars)
Table 2
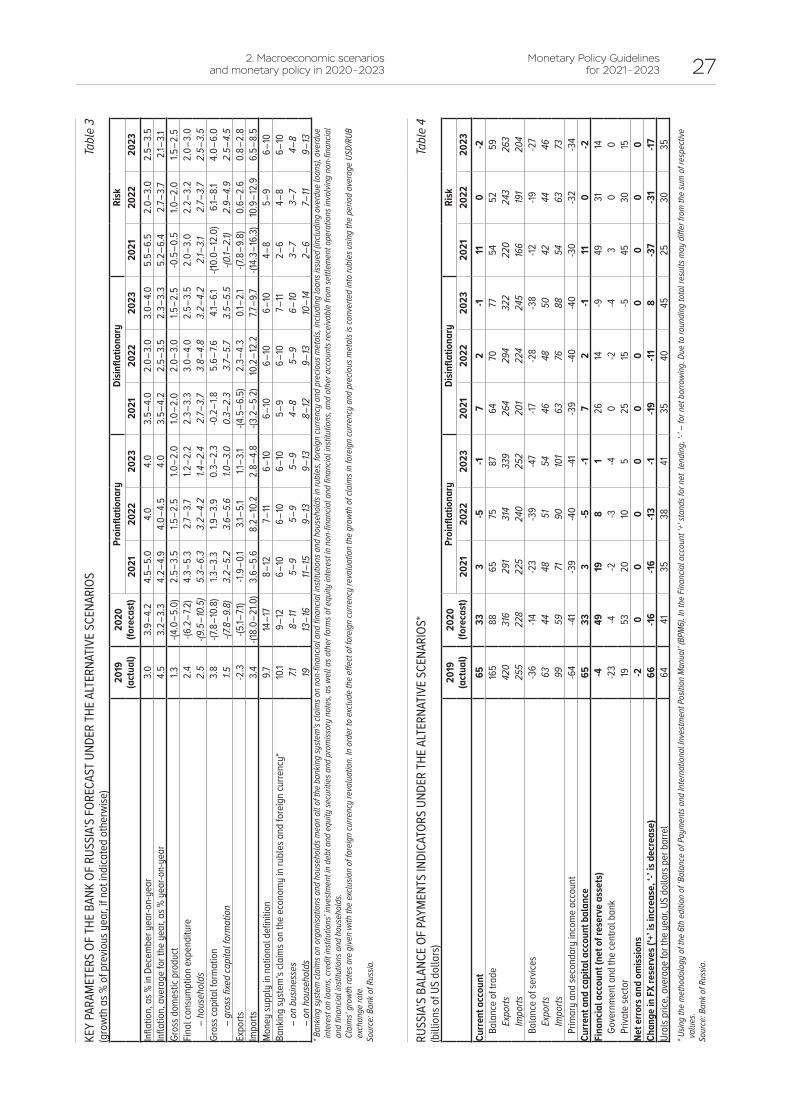
2. Macroeconomic scenarios and monetary policy in 2020–2023
Monetary Policy Guidelines for 2021 – 2023 27
2019
(a
ctua
l)20
20
(fore
cast
)Pr
oinfl
atio
nary
Disin
flatio
nary
Risk
2021
2022
2023
2021
2022
2023
2021
2022
2023
Infla
tion,
as %
in D
ecem
ber y
ear-o
n-ye
ar3.
03.
9 – 4.
24.
5 – 5.
04.
04.
03.
5 – 4.
02.
0 – 3.
03.
0 – 4.
05.
5 – 6.
52.
0 – 3.
02.
5 – 3.
5In
flatio
n, a
vera
ge fo
r the
yea
r, as %
yea
r-on-
year
4.5
3.2 –
3.3
4.2 –
4.9
4.0 –
4.5
4.0
3.5 –
4.2
2.5 –
3.5
2.3 –
3.3
5.2 –
6.4
2.7 –
3.7
2.1 – 3
.1Gr
oss d
omes
tic p
rodu
ct1.3
-(4.0
– 5.0
) 2.
5 – 3.
51.5
– 2.5
1.0 – 2
.01.0
– 2.0
2.0 –
3.0
1.5 – 2
.5-0
.5 – 0
.51.0
– 2.0
1.5 – 2
.5Fin
al co
nsum
ptio
n ex
pend
iture
2.4
-(6.2
– 7.2
) 4.
3 – 5.
32.
7 – 3.
71.2
– 2.2
2.3 –
3.3
3.0 –
4.0
2.5 –
3.5
2.0 –
3.0
2.2 –
3.2
2.0 –
3.0
– ho
useh
olds
2.5
-(9.5
– 10.
5)
5.3 –
6.3
3.2 –
4.2
1.4 – 2
.42.
7 – 3.
73.
8 – 4.
83.
2 – 4.
22.1
– 3.1
2.7 –
3.7
2.5 –
3.5
Gros
s cap
ital f
orm
atio
n3.
8-(7
.8 – 1
0.8)
1.3
– 3.3
1.9 – 3
.90.
3 – 2.
3-0
.2 – 1
.85.
6 – 7.6
4.1 – 6
.1-(1
0.0 –
12.0
) 6.1
– 8.1
4.0 –
6.0
– gr
oss fi
xed
capi
tal f
orm
atio
n1.5
-(7.8
– 9.8
) 3.
2 – 5.
23.
6 – 5.
61.0
– 3.0
0.3 –
2.3
3.7 – 5
.73.
5 – 5.
5-(0
.1 – 2.
1) 2.
9 – 4.
92.
5 – 4.
5Ex
ports
-2.3
-(5.1 –
7.1)
-1.9 –
0.1
3.1 – 5
.11.1
– 3.1
-(4.5
– 6.5
) 2.
3 – 4.
30.1
– 2.1
-(7.8
– 9.8
) 0.
6 – 2.
60.
8 – 2.
8Im
ports
3.4
-(18.
0 – 21
.0)
3.6 –
5.6
8.2 –
10.2
2.8 –
4.8
-(3.2
– 5.2
) 10
.2 – 1
2.2
7.7 – 9
.7-(1
4.3 –
16.3
) 10
.9 – 1
2.9
6.5 –
8.5
Mon
ey su
pply
in n
atio
nal d
efini
tion
9.714
– 17
8 – 12
7 – 11
6 – 10
6 – 10
6 – 10
6 – 10
4 – 8
5 – 9
6 – 10
Bank
ing
syste
m’s
claim
s on
the
econ
omy
in ru
bles
and
fore
ign
curre
ncy*
10.1
9 – 12
6 – 10
6 – 10
6 – 10
5 – 9
6 – 10
7 – 11
2 – 6
4 – 8
6 – 10
– on
bus
ines
ses
7.18 –
115 –
95 –
95 –
94 –
85 –
96 –
103 –
73 –
74 –
8–
on h
ouse
hold
s19
13 – 1
611
– 15
9 – 13
9 – 13
8 – 12
9 – 13
10 – 1
42 –
67 –
119 –
13* B
ankin
g sy
stem
clai
ms o
n or
gani
satio
ns a
nd h
ouse
hold
s mea
n al
l of t
he b
ankin
g sy
stem
’s cla
ims o
n no
n-fin
ancia
l and
fina
ncia
l insti
tutio
ns a
nd h
ouse
hold
s in
rubl
es, f
orei
gn cu
rrenc
y an
d pr
ecio
us m
etal
s, in
cludi
ng lo
ans i
ssue
d (in
cludi
ng o
verd
ue lo
ans),
ove
rdue
in
tere
st on
loan
s, cr
edit
insti
tutio
ns’ in
vestm
ent i
n de
bt a
nd e
quity
secu
ritie
s and
pro
miss
ory
note
s, as
wel
l as o
ther
form
s of e
quity
inte
rest
in n
on-fi
nanc
ial a
nd fi
nanc
ial in
stitu
tions
, and
oth
er a
ccou
nts r
ecei
vabl
e fro
m se
ttlem
ent o
pera
tions
invo
lving
non
-fina
ncia
l an
d fin
ancia
l insti
tutio
ns a
nd h
ouse
hold
s. Cl
aim
s’ gr
owth
rate
s are
give
n wi
th th
e ex
clusio
n of
fore
ign
curre
ncy
reva
luat
ion.
In o
rder
to ex
clude
the
effec
t of f
orei
gn cu
rrenc
y re
valu
atio
n th
e gr
owth
of c
laim
s in
fore
ign
curre
ncy
and
prec
ious
met
als i
s con
verte
d in
to ru
bles
usin
g th
e pe
riod
aver
age
USD/
RUB
exch
ange
rate
.So
urce
: Ban
k of R
ussia
.
KEY
PARA
MET
ERS
OF TH
E BA
NK O
F RUS
SIA’
S FO
RECA
ST U
NDER
THE
ALTE
RNAT
IVE
SCEN
ARIO
S(g
rowt
h as
% o
f pre
vious
yea
r, if n
ot in
dica
ted
othe
rwise
)Ta
ble
3
2019
(a
ctua
l)20
20
(fore
cast
)Pr
oinfl
atio
nary
Disin
flatio
nary
Risk
2021
2022
2023
2021
2022
2023
2021
2022
2023
Curre
nt a
ccou
nt65
333
-5-1
72
-111
0-2
Bala
nce
of tr
ade
165
8865
7587
6470
7754
5259
Expo
rts42
031
629
131
433
926
429
432
222
024
326
3Im
ports
255
228
225
240
252
201
224
245
166
191
204
Bala
nce
of se
rvice
s-3
6-14
-23
-39
-47
-17-2
8-3
8-12
-19-2
7Ex
ports
6344
4851
5446
4850
4244
46Im
ports
9959
7190
101
6376
8854
6373
Prim
ary
and
seco
ndar
y in
com
e ac
coun
t-6
4-4
1-3
9-4
0-4
1-3
9-4
0-4
0-3
0-3
2-3
4Cu
rrent
and
capi
tal a
ccou
nt b
alan
ce65
333
-5-1
72
-111
0-2
Fina
ncia
l acc
ount
(net
of r
eser
ve a
sset
s)-4
4919
81
2614
-949
3114
Gove
rnm
ent a
nd th
e ce
ntra
l ban
k-2
3-4
-2-3
-40
-2-4
30
0Pr
ivate
sect
or19
5320
105
2515
-545
3015
Net e
rrors
and
om
issio
ns-2
00
00
00
00
00
Chan
ge in
FX
rese
rves
(‘+’
is in
crea
se, ‘
-’ is
decr
ease
)66
-16-16
-13-1
-19-11
8-3
7-3
1-17
Ural
s pric
e, a
vera
ge fo
r the
yea
r, US
dolla
rs p
er b
arre
l64
4135
3841
3540
4525
3035
* Usin
g th
e m
etho
dolo
gy o
f the
6th
edi
tion
of ‘B
alan
ce o
f Pay
men
ts an
d In
tern
atio
nal I
nves
tmen
t Pos
ition
Man
ual’
(BPM
6). In
the
Finan
cial a
ccou
nt ‘+
’ sta
nds f
or n
et l
endi
ng, ‘
-’ –
for n
et b
orro
wing
. Due
to ro
undi
ng to
tal r
esul
ts m
ay d
iffer
from
the
sum
of r
espe
ctive
va
lues
.So
urce
: Ban
k of R
ussia
.
RUSS
IA’S
BALA
NCE
OF PA
YMEN
TS IN
DICA
TORS
UND
ER TH
E AL
TERN
ATIV
E SC
ENAR
IOS*
(bill
ions
of U
S do
llars
)Ta
ble
4
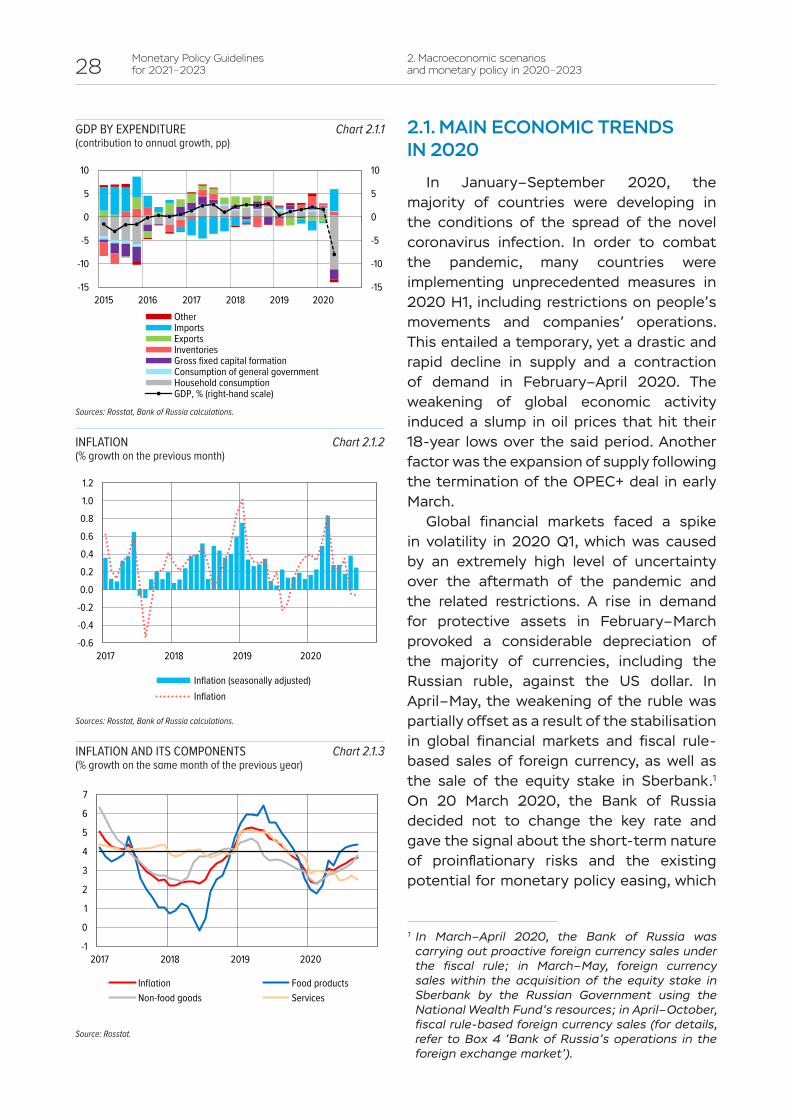
28 Monetary Policy Guidelines for 2021 – 2023
2. Macroeconomic scenarios and monetary policy in 2020–2023
-15
-10
-5
0
5
10
-15
-10
-5
0
5
10
2015 2016 2017 2018 2019 2020OtherImportsExportsInventoriesGross fixed capital formationConsumption of general governmentHousehold consumptionGDP, % (right-hand scale)
Sources: Rosstat, Bank of Russia calculations.
GDP BY EXPENDITURE(contribution to annual growth, pp)
Chart 2.1.1 2.1. MAIN ECONOMIC TRENDS IN 2020
In January–September 2020, the majority of countries were developing in the conditions of the spread of the novel coronavirus infection. In order to combat the pandemic, many countries were implementing unprecedented measures in 2020 H1, including restrictions on people’s movements and companies’ operations. This entailed a temporary, yet a drastic and rapid decline in supply and a contraction of demand in February–April 2020. The weakening of global economic activity induced a slump in oil prices that hit their 18-year lows over the said period. Another factor was the expansion of supply following the termination of the OPEC+ deal in early March.
Global financial markets faced a spike in volatility in 2020 Q1, which was caused by an extremely high level of uncertainty over the aftermath of the pandemic and the related restrictions. A rise in demand for protective assets in February–March provoked a considerable depreciation of the majority of currencies, including the Russian ruble, against the US dollar. In April–May, the weakening of the ruble was partially offset as a result of the stabilisation in global financial markets and fiscal rule-based sales of foreign currency, as well as the sale of the equity stake in Sberbank.1 On 20 March 2020, the Bank of Russia decided not to change the key rate and gave the signal about the short-term nature of proinflationary risks and the existing potential for monetary policy easing, which
1 In March–April 2020, the Bank of Russia was carrying out proactive foreign currency sales under the fiscal rule; in March–May, foreign currency sales within the acquisition of the equity stake in Sberbank by the Russian Government using the National Wealth Fund’s resources; in April–October, fiscal rule-based foreign currency sales (for details, refer to Box 4 ‘Bank of Russia’s operations in the foreign exchange market’).
-0.6-0.4-0.20.00.20.40.60.81.01.2
2017 2018 2019 2020
Inflation (seasonally adjusted)Inflation
Sources: Rosstat, Bank of Russia calculations.
INFLATION (% growth on the previous month)
Chart 2.1.2
-1
0
1
2
3
4
5
6
7
2017 2018 2019 2020
Inflation Food productsNon-food goods Services
Source: Rosstat.
INFLATION AND ITS COMPONENTS(% growth on the same month of the previous year)
Chart 2.1.3

2. Macroeconomic scenarios and monetary policy in 2020–2023
Monetary Policy Guidelines for 2021 – 2023 29
created the conditions for yield curves to promptly reverse.
In May–August 2020, economic activity in the global economy showed diverse trends. Advanced economies were predominantly reviving; as a result, their 2020 GDP estimates were revised upwards. The economic recovery was promoted by measures taken by governments and the exceptionally fast and large-scale easing of monetary policy through both decreases in policy rates and the expansion of the scale of quantitative easing operations and the range of financial instruments applied. In September, the epidemiological situation worsened in a significant number of countries, which exacerbated concerns about the reintroduction of quarantine restrictions and a deterioration of trends in global financial and commodity markets.
The renewal of the OPEC+ deal on oil production cuts in May contributed to the recovery of global oil prices. In summer, energy commodity prices were supported by rising global demand and a decrease in oil production in the USA. Despite the easing of the OPEC+ cuts in August, oil output expanded less than expected, which supported oil prices, also driving their moderate growth. In September–October, this trend reversed: concerns about a decline in global demand and restoring production in Libya put downward pressure on oil prices. The average Urals crude price in September–October equalled USD 40.9 per barrel.2
The ruble continued to strengthen in May–June, driven by the overall upward trend of EMEs’ exchange rates and a significant shrinkage of service imports. However, this trend reversed in mid-June. The ruble was dragged down by the decline in exports amid the oil production cuts under the OPEC+ deal, as well as the conversion of dividends and OFZ sales by foreign investors. Intensifying geopolitical tensions,
2 Assessment as of 22 October 2020.
rising sanction risks for Russia, an increase in the capital outflow resulting from the repayment of external debt, and declining risk appetite worldwide aggravated the volatility of the Russian stock indices and caused more downward pressure on the ruble’s exchange rate in August–October.
Monetary conditions in the Russian economy were easing in June–September. The significant reduction in the Bank of Russia key rate in April–July (by 1.75 pp overall), coupled with the signals about a possible further easing of monetary policy created the conditions for a decrease in interest rates and yields on government and corporate bonds. Banks were not only cutting interest rates on their products, but also easing their non-price lending conditions. The preferential lending programmes, especially the 6.5% p.a. mortgage programme, had a material effect on the trends in the credit market.
As regards economic activity in Russia, the consequences of the coronavirus spread started to affect it only at the end of 2020 Q1. In January–February 2020, production and consumer activity was growing. As of the end of 2020 Q1, GDP gained 1.6% in annualised terms. Fixed capital investment also increased over this period, including owing to more extensive federal budget spending.
These trends totally altered in April. The restrictions adversely impacted both production and consumer activity. Transportation and consumer-facing industries were hit the most. The only exception was a number of individual segments, specifically trade in food products, basic goods and medicines, delivery services, and online trade.
The measures implemented by the Government of the Russian Federation and the Bank of Russia helped offset a considerable portion of losses for households, businesses and the economy in general. According to the Bank of Russia’s

30 Monetary Policy Guidelines for 2021 – 2023
2. Macroeconomic scenarios and monetary policy in 2020–2023
assessment, the anti-crisis measures supporting consumer demand amounted to approximately 0.8 trillion rubles in 2020 Q2 (see Box 6 ‘Measures taken by the Bank of Russia and the Russian Government to address the economic consequences of the coronavirus pandemic’).
Pursuant to the estimate by Rosstat, GDP shrank by 8.0% in 2020 Q2 (Chart 2.1.1). The major drag on GDP was the decline in household consumption, resulting from an 8.4% reduction in real disposable household incomes and a considerable shrinkage of the retail and service industries. 2020 Q2 recorded a 7.6% decline in fixed capital investment, which was associated with the uncertainty over economic developments in Russia and abroad and the shortage of imported components. Moreover, despite temporary disruptions in production and logistics chains, demand dropped more than production. Consequently, inventories increased, which positively contributed to GDP dynamics. Exports in 2020 Q2 were close to the readings recorded in the same quarter last year. The contraction of external demand and the decrease in oil production under the OPEC+ deal were offset owing to the effect of the 2019 low base explained by the contamination of the Druzhba pipeline and the shift of oil output from domestic consumption to exports. Due to the slump in production activity in 2020 H1, employers’ demand for labour and the employment rate trended down.
At the beginning of Q3, amid the easing of the restrictions both in Russia and abroad, economic activity in Russia was recovering, predominantly owing to industries focused on domestic consumption. However, this revival discontinued in September. The output of investment goods, including both construction materials and engineering products, shrank, due to which investment activity may be expected to contract in the coming months. The revival in consumer activity slowed down, with retail sales
decreasing mostly due to food products. The value of paid services rose, although staying close to its record lows. As the epidemiological situation deteriorates and the fiscal stimulus programmes contract, consumer activity may decline by the end of the year. According to the Bank of Russia’s forecast, GDP will shrink by 4.0–5.0% as of the end of 2020.
Beginning from March 2020, price movements were mostly affected by one-off non-monetary factors related to the spread of the pandemic in Russia and abroad (for details, refer to Appendix 4 ‘Non-monetary factors of inflation in 2020: the impact of pandemic-related restrictions’). The weakening of the ruble amid the deterioration of external economic conditions caused proinflationary pressure in March. The launch and subsequent easing of the anti-pandemic restrictions in Russian regions increased price fluctuations (Chart 2.1.2).
The impact of subdued demand amplified beginning from May, and the monthly price growth rate (SA) started to trend down. Nonetheless, annual inflation continued to rise due to the base effect, predominantly in food price dynamics (Chart 2.1.3). In September, it reached 3.67%.
An increase in price volatility negatively influenced households’ and businesses’ price expectations. Their level was still elevated in September. Analysts’ inflation forecasts for 2020–2021 remained anchored at the Bank of Russia’s target (close to 4%).
Until the end of 2020, the disinflationary pressure of declining incomes and demand will be the key factor affecting price movements. The monthly growth of consumer prices is forecast to remain low. However, annual inflation will be rising as the low readings recorded in 2019 H2 are excluded from the inflation calculation. By the end of 2020, annual inflation will reach 3.9–4.2%.

2. Macroeconomic scenarios and monetary policy in 2020–2023
Monetary Policy Guidelines for 2021 – 2023 31
MAT
RIX
OF T
HE B
ANK
OF R
USSI
A’S
MAC
ROEC
ONOM
IC F
OREC
AST
SCEN
ARIO
S
DEM
AND
Stea
dy re
cove
ryLo
ng a
nd u
nste
ady
reco
very
BASE
LINE
SCE
NARI
OModerate decline in potential
SUPPLY
Exte
rnal
ass
umpt
ions
W
eake
ning
epi
dem
iolo
gica
l risk
s
Smoo
th o
il pr
ice re
boun
d to
USD
50
per b
arre
l (ca
ncel
latio
n of
OP
EC+
cuts
in li
ne w
ith th
e in
itial
dea
l)
Slig
ht ri
se in
cred
it sp
read
s in
2020
H2
and
thei
r sub
sequ
ent s
low
de
crea
seIn
tern
al a
ssum
ptio
ns
Grad
ual b
udge
t con
solid
atio
n in
line
with
curr
ent e
stim
ates
(ret
urn
to th
e fis
cal r
ule
para
met
ers i
n 20
22)
St
eady
revi
val o
f con
sum
er a
ctiv
ity (c
ompa
rabl
e w
ith o
ther
pos
t-cr
isis t
rend
s)
Smoo
th re
cove
ry o
f inv
estm
ent a
ctiv
ity
Exte
rnal
ass
umpt
ions
Pe
rsist
ent p
ande
mic
(new
case
s, re
stric
tions
par
tially
rem
aini
ng in
pla
ce)
De
cline
in o
il pr
ices t
o US
D 35
per
bar
rel i
n 20
21 a
nd th
eir g
radu
al re
boun
d to
USD
50
per
barr
el a
fter 2
023
(ext
ensio
n of
OPE
C+ cu
ts)
M
ore
signi
fican
t (th
an in
the
base
line
scen
ario
) gro
wth
of c
redi
t spr
eads
and
thei
r su
bseq
uent
slow
dec
reas
e be
ginn
ing
from
202
1 H2
Inte
rnal
ass
umpt
ions
Bu
dget
cons
olid
atio
n pr
oces
s as i
n th
e ba
selin
e sc
enar
io
No ch
ange
s in
cons
umer
pre
fere
nces
, wea
k co
nsum
er a
ctiv
ity, h
ighe
r pro
pens
ity to
save
Sl
ower
(tha
n in
the
base
line
scen
ario
) rev
ival
of i
nves
tmen
t act
ivity
, pos
tpon
emen
t of
inve
stm
ent p
lans
Deep decline in potential
Exte
rnal
ass
umpt
ions
W
eake
ning
epi
dem
iolo
gica
l risk
s
Decli
ne in
oil
price
s to
USD
35 p
er b
arre
l in
2021
and
thei
r gra
dual
re
boun
d to
thei
r new
equ
ilibr
ium
leve
l of U
SD 4
1 pe
r bar
rel
(can
cella
tion
of O
PEC+
cuts
in li
ne w
ith th
e in
itial
dea
l)
Slig
ht g
row
th o
f cre
dit s
prea
ds in
202
0–20
21 a
nd th
eir s
low
er (t
han
in th
e ba
selin
e sc
enar
io) d
ecre
ase
Inte
rnal
ass
umpt
ions
Sm
ooth
er (t
han
in th
e ba
selin
e sc
enar
io) p
roce
ss o
f bud
get
cons
olid
atio
n
Solid
reco
very
of c
onsu
mer
act
ivity
in 2
021,
with
a fu
rthe
r slo
wdo
wn
of g
row
th
Slow
er (t
han
in th
e ba
selin
e sc
enar
io) r
eviv
al o
f inv
estm
ent a
ctiv
ity,
revi
sions
and
par
tial c
ance
llatio
ns o
f ear
lier p
lann
ed in
vest
men
t pr
ojec
ts
Exte
rnal
ass
umpt
ions
Pe
rsist
ent p
ande
mic
(new
case
s, re
stric
tions
par
tially
rem
aini
ng in
pla
ce)
Do
wnf
all i
n oi
l pric
es a
nd th
eir s
low
rebo
und
to U
SD 3
5 pe
r bar
rel (
exte
nsio
n of
OPE
C+ cu
ts)
Co
nsid
erab
le in
crea
se in
cred
it sp
read
s am
id ri
sing
debt
pro
blem
s in
emer
ging
mar
ket
econ
omie
s and
inte
nsify
ing
geop
oliti
cal r
isks,
inclu
ding
glo
bal p
rote
ctio
nism
risk
sIn
tern
al a
ssum
ptio
ns
Smoo
ther
(tha
n in
the
base
line
scen
ario
) pro
cess
of b
udge
t con
solid
atio
n
Subd
ued
cons
umer
sent
imen
t, w
eak
cons
umer
act
ivity
Extr
emel
y slo
w re
cove
ry o
f inv
estm
ent a
ctiv
ity, s
igni
fican
t rev
ision
s (po
stpo
nem
ent)
and
part
ial c
ance
llatio
ns o
f ear
lier p
lann
ed in
vest
men
t pro
ject
s
DISI
NFLA
TION
ARY
SCEN
ARIO
PROI
NFLA
TION
ARY
SCEN
ARIO
RISK
SCE
NARI
O

32 Monetary Policy Guidelines for 2021 – 2023
2. Macroeconomic scenarios and monetary policy in 2020–2023
BOX 3 IMPACT OF THE CORONAVIRUS PANDEMIC ON POTENTIAL OUTPUT
Long-lasting economic crises do not only deteriorate economic indicators during the period of a crisis, but may also drag on the economy’s long-term development path, or the path of its potential output, if stated differently. Potential output is the overall level of output the economy is capable to generate with the full utilisation of production factors under the existing resource, technological and institutional constraints. In central banks’ practice, the relevant concept of potential output is a level of output creating neither proinflationary, nor disinflationary pressure, i.e. a level ensuring that inflation stays at the target, provided there are no new shocks. Potential output is not constant, but is changing depending on the dynamics of production factors (e.g. labour force growth, the embrace of innovative technologies, or the commissioning of new equipment). Therefore, another characteristic of the economy is the growth rate of potential output, or the pace of changes in potential output over time.
The coronavirus pandemic and the related restrictions instigated a large-scale economic crisis worldwide. After the lapse of several months, it can be said that this economic crisis has turned out to be longer-lasting and entail more serious consequences than it was expected at the beginning of the year. In many countries, including Russia, the pandemic has induced not only a decline in demand, but also strong supply shocks that have caused a decrease in both potential output and, possibly, its growth rates. Higher uncertainty over the period of time that will be needed to efficiently eliminate coronavirus-related risks is another factor that differs this crisis from the previous ones. Consequently, after the restrictions are completely cancelled, the depth of the decline in potential output and its growth rate will be affected by the steadiness of remaining changes observed in investment and consumer behaviour, as well as in individual strategies of working age population groups in the labour market.
The pandemic has impacted potential output in the Russian and global economies through several channels.
Global trade and production chains. Having experienced hardships already before the outbreak of the coronavirus due to international trade tensions and rising protectionism, global trade contracted even more significantly because of the pandemic. Global value-added chains were disrupted, with vulnerabilities unexpectedly identified in the arrangement of cross-border supplies. Companies that have faced difficulties during the pandemic will seek to be secured against similar risks in the future. As a result, they may search counterparties located geographically closer to them and diversify the portfolio of their contracts. In the long run, these processes may entail a fragmentation and disintegration in research and development that are now often carried out by consortia of enterprises from various countries. Consequently, international technology exchange boosting production and labour efficiency may decelerate. Since the upgrade of technologies is a key driver of potential output in today’s economy, disruptions in the well-established communication and cooperation practices may considerably affect the post-crisis recovery.
Production factors. The restrictions introduced and the uncertainty about their cancellation have impacted the main production factors contributing to potential output, i.e. labour and capital.
On the one hand, a lot of enterprises are resuming their normal operation, which suggests that the past supply-side shock could be short-term and, therefore, did not have any material effect on potential output, that is, the capacities available were not utilised in production only temporarily and have not lost their production characteristics over the downtime period. On the other hand, restrictions still remain in a number of industries (in particular, in such areas as tourism, entertainment and recreation, and a range of personal services). Accordingly, a number

2. Macroeconomic scenarios and monetary policy in 2020–2023
Monetary Policy Guidelines for 2021 – 2023 33
of businesses may possibly never reopen, some of them will need restructuring, and a whole range of industries will have to adjust in order to comply with the physical distancing requirements. In addition, the restrictions have forced a lot of employers to reduce headcount and fire a part of employees. Consequently, such companies’ productive power, as well as human and intellectual capital will weaken, entailing a decline in potential output.
Fired employees will have to decide whether to continue looking for a job in the same industry (including in other regions), or try to change their specialisation or cease searching for a job at all. If an employee decides to move or change the area of work, he/she may possibly stay unemployed for a long period of time, which may adversely affect knowledge and skills. When accumulated knowledge and skills are lost, this deteriorates human capital, negatively impacting potential output. If an employee opts to stop looking for a job (e.g. intentionally deciding to cease searching because of the contraction in the market or fears of being infected in cases where an employee has any other diseases), labour force may shrink, which will also weigh on potential output.
The remaining restrictions to travel abroad will limit the inflow of migrants, due to which the part of capital based on these labour resources will not be utilised, which may cause its gradual depreciation.
At the same time, an accelerated advancement of digital technologies promoting the efficiency of both the existing business models and labour productivity may significantly offset the negative impact of the pandemic. However, labour force will need time to build up required competencies (this is particularly relevant for fired employees wishing to change their specialisation), due to which the labour market may face a mismatch exacerbating the adverse impact of individual factors on potential output, since companies will experience a shortage of specialists with required qualifications despite a large number of people looking for jobs.
There may be resurgences of disease cases, followed by extra restrictions, which may also hinder even more the redistribution of production factors among industries.
Expectations and behaviour. The economic crisis instigated by the coronavirus pandemic differs from conventional cyclical fluctuations because of probable residual effects which imply situations where economic agents’ behaviour remains affected by uncertainty and lack of confidence in the future even after restrictions are lifted. The persistence of the pandemic and the absence of efficient medicines and any approved vaccine against the virus may cause shifts in consumer and investment behaviour that will affect the utilisation and quality of production capacities in the economy.
People may continue social distancing to be on the safe side and limit their spending, not returning to their normal pre-pandemic consumption models, wary of a potential reduction in their incomes.
Companies will suspend or cancel their earlier planned investment projects, including because of a decline in their relevance caused by shifts in consumer preferences. Investment in new production capacities may also stay decreased due to the overall uncertainty and changing requirements for the protection of customers and employees.
Concerns about a resurgence of coronavirus cases or another infection, as well as volatility in global financial markets may aggravate the above trends.
Analysing the potential scenarios of the development of the Russian economy, the Bank of Russia relied on the assumption that the intensity of the impact of the above-described channels may vary. Specifically, the baseline and disinflationary scenarios involve weaker negative effects compared to the proinflationary and risk scenarios.
Another channel predominantly influencing potential output in Russia’s economy is the balance of demand and supply in the oil market. The spread of the coronavirus entailed a slump

34 Monetary Policy Guidelines for 2021 – 2023
2. Macroeconomic scenarios and monetary policy in 2020–2023
in economic activity worldwide, entailing a decline in oil prices. The OPEC+ deal contributed to the recovery in oil prices, yet the economy is actually underutilising the capacities available in oil production, with potential output decreasing for the effective period of the OPEC+ agreement. A longer-lasting and more extensive spread of the coronavirus assumed in the disinflationary and risk scenarios may force governments to (partially) reintroduce tight restrictions or maintain the existing restrictions in place for a long period of time (specifically, in a range of industries materially affecting oil prices, e.g. air transportation). In this case, the oil price may decline even beneath its current path, which may be a reason for revising the OPEC+ agreement with larger oil production cuts and, consequently, entail a greater negative impact on potential output.
Basically, although potential output is not a statistical value, it can be said that the above factors have been influencing various industries in a diverse manner. Specifically, their negative impact may be expected to be most serious in air transportation and oil production, and least significant – in food retail. Moreover, it is highly probable that potential output has expanded in industries focused on the development of digital technology-based services (e.g. online trade, communication, data storage and exchange).
The pandemic continues to affect the economic environment. Therefore, although it is possible to generally determine how the above-described channels may impact potential output in the Russian economy, any quantitative estimates are characterised by high uncertainty.
In each of the above scenarios, the Bank of Russia relied on different assumptions regarding the overall impact of the above-described channels on the depth of the decline in potential output, with the baseline scenario involving the smallest decrease and the risk scenario – the largest.

2. Macroeconomic scenarios and monetary policy in 2020–2023
Monetary Policy Guidelines for 2021 – 2023 35
2.2. SCENARIOS FOR THE DEVELOPMENT OF RUSSIA’S ECONOMY IN 2021–2023
In 2020, due to the outbreak of the coronavirus pandemic in a large number of countries and the implementation of the related restrictions, Russia’s economy faced an unprecedented combination of external and domestic shocks, the impact of which is currently hard to estimate adequately. The pandemic persists, and the spread of the coronavirus still remains unpredictable. Macroeconomic forecasts largely depend on various assumptions regarding the scale of the pandemic and the time of its termination, as well as the related measures taken to control and prevent the spread of the coronavirus.
Considering possible scenarios for the development of the Russian economy, the Bank of Russia relied on the assumption regarding the impact of the pandemic on the pace and sustainability of demand revival and the depth of the decline in potential output, including with account of possible time-lag effects associated with the restrictions affecting economic activity (for details about the influence on potential output, see Box 3 ‘Impact of the coronavirus pandemic on potential output’). Given the possible combinations of these assumptions, the Bank of Russia presents four scenarios of Russia’s economic development over the medium-term horizon: the baseline scenario and three alternatives showing possible risks to the baseline scenario (see the Matrix of the Bank of Russia’s macroeconomic forecast scenarios). It should be emphasised that, in contrast to previous years, the oil price is no longer the main assumption for differences in the scenarios, but is rather considered in combination with other factors, including oil output which is no less significant.
1020304050607080
I II III IV I II III IV I II III IV I II III IV I II III IV I II III IV I II III IV I II III IV
2016 2017 2018 2019 2020 2021 2022 2023
Actual Baseline scenarioProinflationary scenario Disinflationary scenarioRisk scenario
* Nominal prices for Urals crude oil.Source: Bank of Russia calculations.
OIL PRICE PATH* IN THE BASELINE SCENARIO(US dollars per barrel)
Chart 2.2.1

36 Monetary Policy Guidelines for 2021 – 2023
2. Macroeconomic scenarios and monetary policy in 2020–2023
These scenarios are detailed below herein. The Bank of Russia’s goal to maintain price and financial stability with inflation close to 4% remains unchanged under any scenario.
2.2.1. Baseline scenario
The global economy will bounce back slowly, and the external output gap will remain negative until the end of the forecast horizon.
The decline in the global economy turned out to be moderate in 2020 Q2. Moreover, Q3 leading indicators evidenced an active recovery in a large number of countries.
However, due to the resurgence of infection cases and the reintroduction of restrictions in a range of countries (namely, in Europe) at the end of Q3–the beginning of Q4, the progressive recovery can hardly be expected to remain throughout the period until the end of 2020. The revival in 2021 will also be moderate amid persistent epidemiological risks and overall uncertainty in the global economy.
It may take multiple years to return to normal life, while differences in the possibilities to adjust to the new situation across countries and industries will make it hard to accelerate recovery growth. Another factor that will hinder a fast revival will be the search for new business models meeting changes in the environment and consumer preferences (social distancing, new consumer patterns, and an increased level of savings).
In this regard, the Bank of Russia assumes that the external output gap will remain negative even by the end of the forecast horizon.
Elevated uncertainty in the global economy inducing a higher volatility of capital flows in emerging market economies may persist until the end of 2020, gradually decreasing by the end of 2021.
The accelerated spread of the coronavirus worldwide at the end of Q3–the beginning
-10
-5
0
5
10
15
I II III IV I II III IV I II III IV I II III IV I II III IV I II III IV I II III IV I II III IV
2016 2017 2018 2019 2020 2021 2022 2023
Actual Baseline scenario
Note: shaded areas over the forecast horizon show the probability of different GDP growth values. Colour gradation reflects probability intervals. Confidence intervals are symmetrical and based on historical estimates of GDP growth uncertainty.Source: Bank of Russia calculations.
GDP GROWTH PATH IN THE BASELINE SCENARIO (% change on the same period of the previous year)
Chart 2.2.2
012345678
I II III IV I II III IV I II III IV I II III IV I II III IV I II III IV I II III IV I II III IV
2016 2017 2018 2019 2020 2021 2022 2023
Actual Medium-term target Baseline scenario
Note: shaded areas over the forecast horizon show the probability of different inflation values. Colour gradation reflects probability intervals. Confidence intervals are symmetrical and based on historical estimates of inflation uncertainty. Source: Bank of Russia calculations.
INFLATION PATH IN THE BASELINE SCENARIO (% change on the same period of the previous year)
Chart 2.2.3

2. Macroeconomic scenarios and monetary policy in 2020–2023
Monetary Policy Guidelines for 2021 – 2023 37
of Q4 spurred the growth of volatility in financial markets. Amid the persistent uncertainty over the recovery pace of the global economy and the further spread of the coronavirus, EMEs’ risk premia will remain increased at the end of 2020, starting to trend down in early 2021. Russia’s risk premium will remain elevated in 2021 due to the additional effects of idiosyncratic geopolitical factors. Increased uncertainty and higher risk premia may cause more significant capital flow fluctuations in EMEs and Russia both until the end of 2020 and throughout 2021.
Beginning from the end of 2021, the balance of risks for EMEs, including for Russia, will return to the levels common to these markets. As risk premia go down gradually, capital inflows to EMEs will stabilise.
Oil prices will stabilise close to USD 45–50 per barrel in 2022–2023.
The fulfilment of the OPEC+ deal and the recovery of global demand for oil will drive the gradual growth of the average annualised oil price to USD 45 per barrel in 2021–2022 and USD 50 per barrel in 2023. Nonetheless, the recovery of oil prices will be moderate due to the expected gradual expansion of non-OPEC+ oil supply and the easing of the OPEC+ oil production limits.
Russia’s economy will shift to a sustainable recovery in early 2021 and will reach its potential output in 2022 H1, maintaining this level until the end of the forecast horizon.
In late 2019–early 2020, the growth rate of the Russian economy was close to its potential, with the output gap approximating zero. The pandemic provoked a slump in Russia’s actual output to the level beneath the potential.
Based on the up-to-date figures released, the baseline scenario may assume a considerable acceleration of the sequential quarterly growth of GDP in Q3 and its near-
-200-150-100-50
050
100150200
2005
2006
2007
2008
2009
2010
2011
2012
2013
2014
2015
2016
2017
2018
2019
2020
*20
21*
2022
*20
23*
Balance of non-tradable componentsBalance of servicesCapital account balanceBalance of tradeBalance of current and capital account
* Forecast.Source: Bank of Russia calculations.
MAIN CURRENT ACCOUNT COMPONENTS IN THE BASELINE SCENARIO (billions of US dollars)
Chart 2.2.4
-250-200-150-100-50
050
100150200250
2005
2006
2007
2008
2009
2010
2011
2012
2013
2014
2015
2016
2017
2018
2019
2020
*20
21*
2022
*20
23*
Assets, banks Liabilities, banksAssets, other Liabilities, other
* Forecast.Note. For assets “+” - decrease, “-” - increase; for liabilities “-” decrease, “+” - increase.Source: Bank of Russia calculations.
MAIN COMPONENTS OF THE PRIVATE SECTOR’S FINANCIAL ACCOUNT IN THE BASELINE SCENARIO (billions of US dollars)
Chart 2.2.5

38 Monetary Policy Guidelines for 2021 – 2023
2. Macroeconomic scenarios and monetary policy in 2020–2023
zero dynamics in 2020 Q4. In 2021, the Russian economy will continue its steady revival.
The recovery growth of consumer and investment demand will be promoted by accommodative monetary policy and the measures taken in 2020 by the Russian Government to support households and businesses. At the same time, the support from fiscal policy will gradually diminish, with progressive budget consolidation starting already in 2021 Q2 and the level of spending brought in line with the fiscal rule parameters in 2022–2023.
Loose monetary conditions and the recovery of confidence among households and businesses about their future incomes will ensure stable demand for credit. After 9–12% in 2020, the growth of the banking system’s claims on the economy, supported by the implementation of the government programmes within the measures addressing the aftermath of the pandemic, will go down to 7–11% in 2021 and remain at this level further on. In addition, the banking system’s claims on households, just as before the pandemic, will continue to expand slightly faster (to 10–14% by 2023) than claims on companies (to 6–10%).
The contribution of budget operations to money supply will decrease, and by 2023 the growth of money supply will be driven by the expansion of banks’ claims on the economy, equalling 7–11%.
As a result, the increase in households’ final consumption expenditure will total 5.3–6.3% in 2021 and 3.7–4.7% in 2022, getting closer to its long-term rates of 2.5–3.5% in 2023. Gross fixed capital formation will be recovering more smoothly, with its growth rate reaching 3.3–5.3% in 2021 and 4.5–6.5% in 2022 and subsequently slowing down to 3.2–5.2% in 2023.
Output will return to its 2020 Q1 level in early 2022. The negative output gap due to expenditure consolidation in the budget system, the effect of the OPEC+
restrictions, and only a partial recovery of external demand will remain throughout 2021. In early 2022, this gap will be close to zero, staying at this level until the end of the forecast horizon. Accordingly, the recovery pace of Russia’s economy will exceed its potential growth rate in 2021 and is expected to be close to it beginning from mid-2022. Potential growth may accelerate in 2023, provided the Government of the Russian Federation successfully implements the measures aimed at overcoming structural constraints, including within the approved national projects.
Inflation will stabilise close to 4% under accommodative monetary policy.
In 2020, price trends were influenced by both disinflationary (weak domestic and external demand) and proinflationary factors (a weaker ruble and extra costs incurred by businesses to comply with the anti-pandemic requirements). According to the baseline scenario, inflation will be in the range of 3.9-4.2% as of the end of 2020.
The disinflationary impact of subdued demand will prevail throughout 2021 until early 2022, with quarterly price growth slowing down noticeably. As aggregate demand gradually bounces back owing to decreasing epidemiological risks, the negative output gap will gradually close. Coupled with accommodative monetary policy, this will progressively push price growth rates back to the 4% target.
As the Russian economy revives and inflation stabilises close to 4% over the forecast horizon, the Bank of Russia will estimate a possible time and pace for shifting from accommodative to neutral monetary policy, including with account of the downward revision in the real neutral key rate from 2–3% to 1–2% per annum (for details regarding the estimate of the neutral rate, refer to Box 2 ‘Neutral interest rate’).
The current account surplus will shrink against 2019; net lending by the Russian
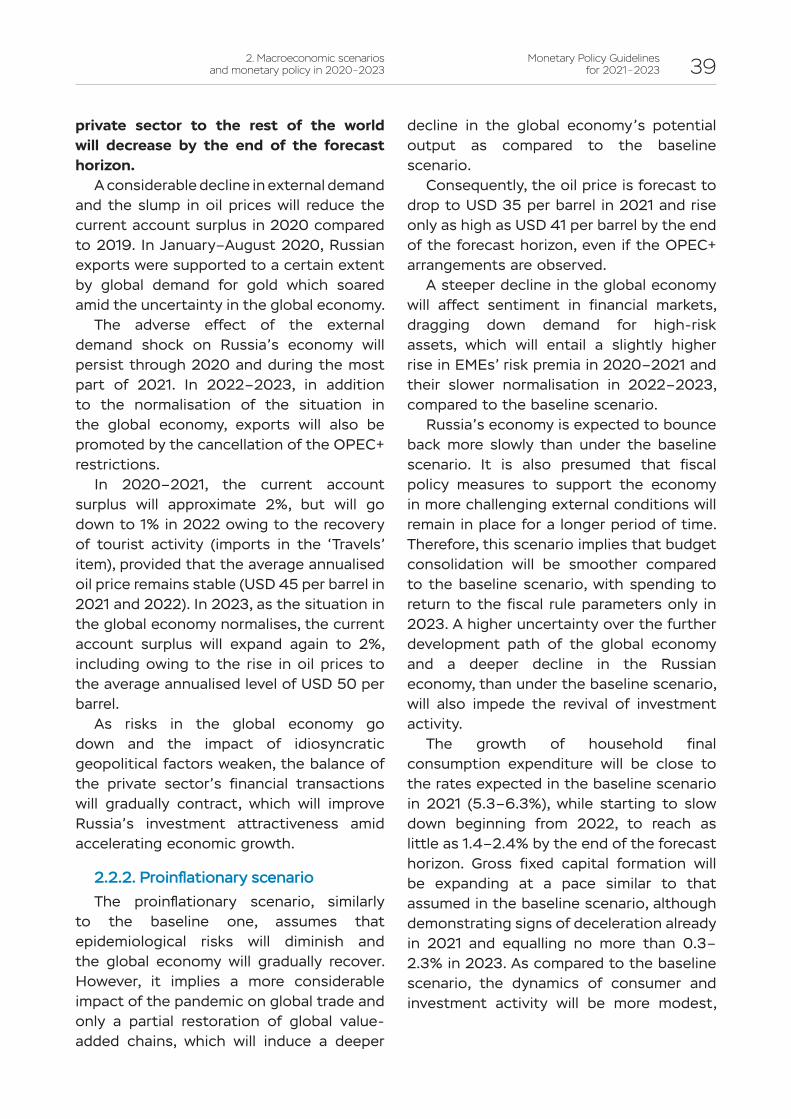
2. Macroeconomic scenarios and monetary policy in 2020–2023
Monetary Policy Guidelines for 2021 – 2023 39
private sector to the rest of the world will decrease by the end of the forecast horizon.
A considerable decline in external demand and the slump in oil prices will reduce the current account surplus in 2020 compared to 2019. In January–August 2020, Russian exports were supported to a certain extent by global demand for gold which soared amid the uncertainty in the global economy.
The adverse effect of the external demand shock on Russia’s economy will persist through 2020 and during the most part of 2021. In 2022–2023, in addition to the normalisation of the situation in the global economy, exports will also be promoted by the cancellation of the OPEC+ restrictions.
In 2020–2021, the current account surplus will approximate 2%, but will go down to 1% in 2022 owing to the recovery of tourist activity (imports in the ‘Travels’ item), provided that the average annualised oil price remains stable (USD 45 per barrel in 2021 and 2022). In 2023, as the situation in the global economy normalises, the current account surplus will expand again to 2%, including owing to the rise in oil prices to the average annualised level of USD 50 per barrel.
As risks in the global economy go down and the impact of idiosyncratic geopolitical factors weaken, the balance of the private sector’s financial transactions will gradually contract, which will improve Russia’s investment attractiveness amid accelerating economic growth.
2.2.2. Proinflationary scenarioThe proinflationary scenario, similarly
to the baseline one, assumes that epidemiological risks will diminish and the global economy will gradually recover. However, it implies a more considerable impact of the pandemic on global trade and only a partial restoration of global value-added chains, which will induce a deeper
decline in the global economy’s potential output as compared to the baseline scenario.
Consequently, the oil price is forecast to drop to USD 35 per barrel in 2021 and rise only as high as USD 41 per barrel by the end of the forecast horizon, even if the OPEC+ arrangements are observed.
A steeper decline in the global economy will affect sentiment in financial markets, dragging down demand for high-risk assets, which will entail a slightly higher rise in EMEs’ risk premia in 2020–2021 and their slower normalisation in 2022–2023, compared to the baseline scenario.
Russia’s economy is expected to bounce back more slowly than under the baseline scenario. It is also presumed that fiscal policy measures to support the economy in more challenging external conditions will remain in place for a longer period of time. Therefore, this scenario implies that budget consolidation will be smoother compared to the baseline scenario, with spending to return to the fiscal rule parameters only in 2023. A higher uncertainty over the further development path of the global economy and a deeper decline in the Russian economy, than under the baseline scenario, will also impede the revival of investment activity.
The growth of household final consumption expenditure will be close to the rates expected in the baseline scenario in 2021 (5.3–6.3%), while starting to slow down beginning from 2022, to reach as little as 1.4–2.4% by the end of the forecast horizon. Gross fixed capital formation will be expanding at a pace similar to that assumed in the baseline scenario, although demonstrating signs of deceleration already in 2021 and equalling no more than 0.3–2.3% in 2023. As compared to the baseline scenario, the dynamics of consumer and investment activity will be more modest,

40 Monetary Policy Guidelines for 2021 – 2023
2. Macroeconomic scenarios and monetary policy in 2020–2023
which will be associated with a moderate tightening of monetary policy.
According to the proinflationary scenario, activity in the corporate and retail segments of the credit market is forecast to be slightly lower than under the baseline scenario due to a tightening of price and non-price lending conditions amid increased economic uncertainty. Similarly to the baseline scenario, retail lending will be growing faster over the entire forecast period (9–13% against 5–9% expected in corporate lending), which will somewhat support consumer demand.
Potential output in Russia’s economy is expected to shrink more significantly compared to the baseline scenario; coupled with loose fiscal policy, this will contribute to a faster closing of the negative output gap, which will amplify inflationary pressure already beginning from 2021 Q1 when quarterly inflation exceeds the target. Another factor of increased inflationary pressure may be a rise in import prices induced by higher transportation and anti-pandemic costs incurred by foreign manufacturers. A return to moderately tight monetary policy will help drive inflation back to the target by 2022 Q3–Q4, maintaining it close to the target level further on.
Lower prices for oil and other commodities, combined with a slower rise in external demand will entail a contraction of exports in 2021 and decelerate growth in subsequent years, as a result of which the value of exports will stay beneath the level expected in the baseline scenario over the entire forecast period. As compared to the baseline scenario, imports will also contract due to the weaker ruble and sluggish domestic demand, yet to a lesser extent than exports, which will cause a current account deficit in 2022–2023. A financial account deficit in the private sector is forecast to be lower than under the baseline scenario amid a contraction in export revenues and banks’ net foreign assets.
-10
-5
0
5
10
15
I II III IV I II III IV I II III IV I II III IV I II III IV I II III IV I II III IV I II III IV
2016 2017 2018 2019 2020 2021 2022 2023
Actual Baseline scenario Proinflationary scenario
Note: shaded areas over the forecast horizon show the probability of different GDP growth values. Colour gradation reflects probability intervals. Confidence intervals are symmetrical and based on historical estimates of GDP growth uncertainty. Source: Bank of Russia calculations.
GDP GROWTH PATH IN THE PROINFLATIONARY SCENARIO (% change on the same period of the previous year)
Chart 2.2.6
012345678
I II III IV I II III IV I II III IV I II III IV I II III IV I II III IV I II III IV I II III IV
2016 2017 2018 2019 2020 2021 2022 2023
Actual Baseline scenarioMedium-term target Proinflationary scenario
Note: shaded areas over the forecast horizon show the probability of different inflation values. Colour gradation reflects probability intervals. Confidence intervals are symmetrical and based on historical estimates of inflation uncertainty. Source: Bank of Russia calculations.
INFLATION PATH IN THE PROINFLATIONARY SCENARIO (% change on the same period of the previous year)
Chart 2.2.7

2. Macroeconomic scenarios and monetary policy in 2020–2023
Monetary Policy Guidelines for 2021 – 2023 41
2.2.3. Disinflationary scenarioIn contrast to the baseline scenario,
the disinflationary scenario presumes that vaccines in development will not fully curb the spread of the virus worldwide, which will force governments to maintain the restrictions for a long time.
Since control over the spread of the virus is hard to ensure, and consumer and investment activity is expected to be subdued, this will induce a more significant rise in EMEs’ risk premia than under the baseline scenario. However, beginning from 2021 H2, as households and businesses adjust to a decreased level of consumption and output, risk premia will gradually go down, while still staying elevated as compared to the baseline scenario.
The disinflationary scenario assumes that the oil price will decline to USD 35 per barrel in 2021, bouncing back to USD 50 per barrel only after 2023, despite a highly probable extension of the OPEC+ agreement expected in this scenario.
According to this scenario, the recovery of Russia’s economy will be sluggish. Consumer activity will not restore to its pre-crisis levels both due to the shifts in people’s preferences occurred over the pandemic period (rejection of a range of products and services) and as a result of an increase in their propensity to save because of fears to stay without funds if new restrictions are introduced and labour incomes decline. Persistent uncertainty will make businesses suspend the implementation of their investment projects, which will suggest no need to expand output even amid an underutilisation of production capacities. Under this scenario, fiscal policy involves consolidation in line with the path of the baseline scenario, as a result of which the level of budget spending will be brought in line with the fiscal rule parameters in 2022–2023.
-10
-5
0
5
10
15
I II III IV I II III IV I II III IV I II III IV I II III IV I II III IV I II III IV I II III IV
2016 2017 2018 2019 2020 2021 2022 2023
Actual Baseline scenario Disinflationary scenario
Note: shaded areas over the forecast horizon show the probability of different GDP growth values. Colour gradation reflects probability intervals. Confidence intervals are symmetrical and based on historical estimates of GDP growth uncertainty. Source: Bank of Russia calculations.
GDP GROWTH PATH IN THE DISINFLATIONARY SCENARIO (% change on the same period of the previous year)
Chart 2.2.8
012345678
I II III IV I II III IV I II III IV I II III IV I II III IV I II III IV I II III IV I II III IV
2016 2017 2018 2019 2020 2021 2022 2023
Actual Baseline scenarioMedium-term target Disinflationary scenario
Note: shaded areas over the forecast horizon show the probability of different inflation values. Colour gradation reflects probability intervals. Confidence intervals are symmetrical and based on historical estimates of inflation uncertainty. Source: Bank of Russia calculations.
INFLATION PATH IN THE DISINFLATIONARY SCENARIO (% change on the same period of the previous year)
Chart 2.2.9

42 Monetary Policy Guidelines for 2021 – 2023
2. Macroeconomic scenarios and monetary policy in 2020–2023
An increase in households’ final consumption expenditure is expected to be considerably slower in 2021 than under the baseline scenario, reaching 2.7–3.7%; however, accommodative monetary policy will support the upward trend in subsequent years. In 2023, households’ final consumption expenditure will rise by 3.2–4.2%, exceeding the growth rate assumed under the baseline scenario. There will be almost no recovery growth in gross fixed capital formation in 2021, but its increase will accelerate to 3.5–5.5% by 2023, which is comparable with the dynamics of this indicator expected in the baseline scenario.
Weak consumer and investment demand in 2021 will limit the willingness of the real sector of the economy to increase leverage. Concurrently, elevated economic uncertainty will force banks to pursue more conservative credit policy, selecting borrowers more cautiously, which will slow down lending to both businesses and households. By the end of the forecast horizon, the growth of lending will bounce back to the levels close to those expected in the baseline scenario. Specifically, growth in retail lending will speed up from 8–12% in 2021 to 10–14% in 2023 and in corporate lending – from 4–8% in 2021 to 6–10% in 2023. Credit activity will be predominantly driven upwards by the lowest-risk credit segments, including mortgage lending in the retail segment of the market and long-term ruble-denominated loans in the corporate segment.
Slack domestic and external demand will impede the closing of the negative output gap over the entire forecast horizon, and the economy is forecast to bounce back to its 2020 Q1 level only in 2023 Q1.
Weaker proinflationary pressure will push price growth rates downwards beneath the target already in 2021 Q2, and despite the implementation of very accommodative monetary policy, inflation will rise closer to
its target no earlier than after the end of the forecast period.
Lower prices for oil and other commodities, combined with a probable extension of the OPEC+ deal and a slower rise in external demand will entail a contraction in exports in 2021 and a slower increase in exports in subsequent years. As a result, the value of exports will be considerably below the level expected in the baseline scenario over the entire forecast horizon. As compared to the baseline scenario, imports will also shrink significantly due to remaining quarantine restrictions, a weaker exchange rate and sluggish domestic demand. Amid less significant export revenues and a slower increase in banks’ net foreign assets, net lending by the Russian private sector to the rest of the world in 2021–2022 will be lower than under the baseline scenario. In 2023, it will shift to net borrowing as Russian companies attract foreign investment in the conditions of economic growth in Russia. Concurrently, the accumulation of foreign assets by the private sector will be less considerable amid the resumption of fiscal rule-based foreign currency purchases.
2.2.4. Risk scenarioThe risk scenario assumes that, in
addition to a resurgence of coronavirus cases, the global economy may also face other shocks, e.g. rising trade frictions and geopolitical tension, and debt problems in certain countries and industries.
Under this scenario, the earlier implemented measures to stimulate economies may turn out to be insufficient, with businesses and households still needing support, although of a smaller amount. However, the expansion of public debt and already high budget deficits in a number of countries will not allow any additional fiscal stimulus measures.
Increased uncertainty is expected to trigger a surge in EMEs’ risk premia that
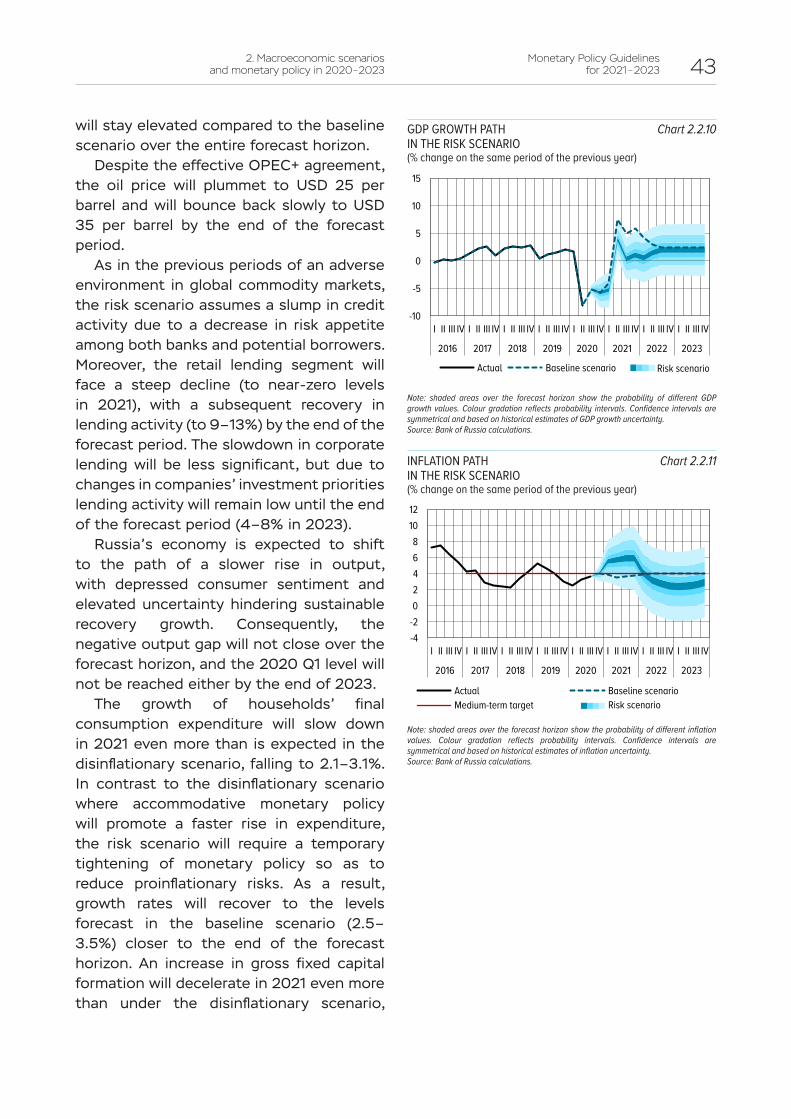
2. Macroeconomic scenarios and monetary policy in 2020–2023
Monetary Policy Guidelines for 2021 – 2023 43
will stay elevated compared to the baseline scenario over the entire forecast horizon.
Despite the effective OPEC+ agreement, the oil price will plummet to USD 25 per barrel and will bounce back slowly to USD 35 per barrel by the end of the forecast period.
As in the previous periods of an adverse environment in global commodity markets, the risk scenario assumes a slump in credit activity due to a decrease in risk appetite among both banks and potential borrowers. Moreover, the retail lending segment will face a steep decline (to near-zero levels in 2021), with a subsequent recovery in lending activity (to 9–13%) by the end of the forecast period. The slowdown in corporate lending will be less significant, but due to changes in companies’ investment priorities lending activity will remain low until the end of the forecast period (4–8% in 2023).
Russia’s economy is expected to shift to the path of a slower rise in output, with depressed consumer sentiment and elevated uncertainty hindering sustainable recovery growth. Consequently, the negative output gap will not close over the forecast horizon, and the 2020 Q1 level will not be reached either by the end of 2023.
The growth of households’ final consumption expenditure will slow down in 2021 even more than is expected in the disinflationary scenario, falling to 2.1–3.1%. In contrast to the disinflationary scenario where accommodative monetary policy will promote a faster rise in expenditure, the risk scenario will require a temporary tightening of monetary policy so as to reduce proinflationary risks. As a result, growth rates will recover to the levels forecast in the baseline scenario (2.5–3.5%) closer to the end of the forecast horizon. An increase in gross fixed capital formation will decelerate in 2021 even more than under the disinflationary scenario,
-10
-5
0
5
10
15
I II III IV I II III IV I II III IV I II III IV I II III IV I II III IV I II III IV I II III IV
2016 2017 2018 2019 2020 2021 2022 2023
Actual Baseline scenario Risk scenario
Note: shaded areas over the forecast horizon show the probability of different GDP growth values. Colour gradation reflects probability intervals. Confidence intervals are symmetrical and based on historical estimates of GDP growth uncertainty.Source: Bank of Russia calculations.
GDP GROWTH PATH IN THE RISK SCENARIO (% change on the same period of the previous year)
Chart 2.2.10
-4-202468
1012
I II III IV I II III IV I II III IV I II III IV I II III IV I II III IV I II III IV I II III IV
2016 2017 2018 2019 2020 2021 2022 2023
Actual Baseline scenarioMedium-term target Risk scenario
Note: shaded areas over the forecast horizon show the probability of different inflation values. Colour gradation reflects probability intervals. Confidence intervals are symmetrical and based on historical estimates of inflation uncertainty. Source: Bank of Russia calculations.
INFLATION PATH IN THE RISK SCENARIO (% change on the same period of the previous year)
Chart 2.2.11

44 Monetary Policy Guidelines for 2021 – 2023
2. Macroeconomic scenarios and monetary policy in 2020–2023
bouncing back even more slowly to reach no more than 2.5–4.5% by the end of the forecast horizon.
Beginning from 2021 Q1, proinflationary pressure will amplify significantly, yet temporarily both due to the weaker ruble amid a rise in overall uncertainty and as a result of less strict budget consolidation as the Government will continue to implement budget-funded measures to support the economy. A tightening of monetary policy will bring inflation back to the target already in 2022 Q1. Proinflationary factors will have a weaker influence, while the impact of disinflationary factors (such as subdued consumer activity, a revision or cancellation of investment plans) will increase, which will require a shift towards accommodative monetary policy beginning from 2022 Q2. However, despite accommodative monetary policy, inflation will stay beneath the target over the entire forecast horizon.
Considerably lower prices for oil and other commodities, combined with a probable extension of the OPEC+ deal and a slower recovery of external demand, will entail a slump in exports in 2021 and a slower increase in exports in subsequent years, as a result of which the value of exports is forecast to be substantially lower than under all other scenarios over the entire forecast horizon. As compared to all other scenarios, imports will also plummet amid remaining quarantine restrictions, a weaker exchange rate, and sluggish domestic demand, yet to a lesser extent than exports. Consequently, the current account balance will be close to zero in 2022, shifting to a moderate deficit in 2023. As tension in global financial markets and demand for risk-free assets remain, net lending by the Russian private sector to the rest of the world will decrease in 2021 only to a certain extent, gradually contracting further on, while still remaining higher than under all other scenarios.

2. Macroeconomic scenarios and monetary policy in 2020–2023
Monetary Policy Guidelines for 2021 – 2023 45
BOX 4 BANK OF RUSSIA’S OPERATIONS IN THE FOREIGN EXCHANGE MARKET
The Bank of Russia conducts foreign exchange transactions in accordance with the fiscal rule mechanism developed by the Ministry of Finance of the Russian Federation. Carrying out these operations, the Bank of Russia does not aim to influence in any way the nominal exchange rate of the ruble, pursuing the floating exchange rate regime needed to implement the inflation targeting policy.
Over the period from 9 January through 6 March 2020, the Bank of Russia conducted fiscal rule-based operations to buy foreign currency and purchased foreign currency to offset the purchases postponed in August–December 2018. Over the said period, the Bank of Russia purchased foreign currency amounting to 685 billion rubles (including 570 billion rubles as regular purchases, and 115 billion rubles as purchases to offset the earlier suspended operations) (Chart 1).
Following the downfall in oil prices, on 9 March 2020 the Bank of Russia announced the suspension of foreign currency purchases.1 On 10 March 2020, the Bank of Russia shifted to proactive foreign currency sales, taking into account the actual oil price in the market.2
Furthermore, in addition to standard fiscal rule-based operations to sell foreign currency from the National Wealth Fund in the domestic foreign exchange market, beginning on 19 March 2020 the Bank of Russia started to sell foreign currency to pay for the equity stake in Sberbank acquired by the NWF.3 Due to increased volatility in financial markets, the Bank of Russia developed a sale mechanism intended to enhance the stabilising effect of the fiscal rule amid low oil prices and thus contribute to economic and financial stability. In accordance with this
1 Bank of Russia’s commentary on operations under fiscal rule, dated 9 March 2020, http://www.cbr.ru/eng/press/event/?id=6491.
2 Bank of Russia’s commentary on operations under fiscal rule, dated 10 March 2020, http://www.cbr.ru/eng/press/event/?id=6492.
3 Bank of Russia’s commentary on FX operations related to the acquisition of Sberbank shares by the National Wealth Fund, dated 19 March 2020, http://www.cbr.ru/eng/press/event/?id=6533.
-400
-300
-200
-100
0
100
200
03.2020 04.2020 05.2020
0
20
40
60
80
100
-450
-250
-50
150
350
550
01.2
017
05.2
017
09.2
017
01.2
018
05.2
018
09.2
018
01.2
019
05.2
019
09.2
019
01.2
020
05.2
020
09.2
020
Foreign currency purchases to offset the earlier suspended operationsOther foreign currency sale operationsRegular foreign currency purchases/salesSuspended foreign currency purchasesMonthly average Urals crude price (right-hand scale)
RUB bn per monthUS dollars per barrelRUB bn per month
Sources: Russia’s Ministry of Finance, Bank of Russia calculations.
BANK OF RUSSIA’S FISCAL RULE-BASED OPERATIONS IN THE FOREIGN EXCHANGE MARKET Chart 1

46 Monetary Policy Guidelines for 2021 – 2023
2. Macroeconomic scenarios and monetary policy in 2020–2023
mechanism, additional foreign currency sales were calculated so as to fully offset the shortage of foreign currency supply in the domestic foreign exchange market caused by a decline in export revenues from the sale of oil, petroleum products and natural gas amid the slump in the Urals crude price beneath USD 25 per barrel. Taking into account price levels in the oil market, the Bank of Russia was conducting these operations for about two months – from 19 March through 12 May 2020.
The mechanism of proactive foreign currency sales was used through 6 April. Beginning on 7 April, the Bank of Russia resumed regular fiscal rule-based foreign currency sales. Price levels observed in the oil market in May–August were the reason why after 12 May the Bank of Russia terminated foreign currency sales within the Sberbank deal.
From 13 May, the Bank of Russia carried out only regular fiscal rule-based operations in the foreign exchange market.
The proactive sales and purchases within the Sberbank deal totalled 504 billion rubles. The purchases that were not performed in March–April 2020 amounted to 126 billion rubles (Table 1). The foreign currency sales over the period from 10 March through 12 May totalled 581 billion rubles.
The fiscal rule-based operations to sell foreign currency in the domestic foreign exchange market conducted by the Bank of Russia from 13 May through 22 October amounted to 711 billion rubles.
From the beginning of the year through 22 October, the Bank of Russia’s net operations in the foreign exchange market totalled -653 billion rubles, where ‘-’ implies net sales of foreign currency.
On 30 September 2020, the Bank of Russia started to offset the remaining amount of foreign currency to be sold within the Sberbank deal, the amount of the proactive sales carried out in March–April and the purchases postponed for this period, and the amount of the purchases
FOREIGN CURRENCY SALES IN OCTOBER–DECEMBER 2020 IN ADDITION TO FISCAL RULE-BASED OPERATIONS(billions of rubles)
Table 2
Foreign currency earned from the sale of the equity stake in Sberbank 2,139
Proactive foreign currency sales in March–May 2020, and sales related to the Sberbank deal -504
Balance of fiscal rule-based foreign currency purchases suspended in 2018 -1,324
Fiscal rule-based foreign currency purchases suspended in March–April 2020 -126
Balance from the Sberbank deal to be sold in October–December 2020 185
Foreign currency sales within the acquisition of Aeroflot’s shares using the NWF’s resources 50
Balance to be sold (for other purposes) in October–December 2020 235
BANK OF RUSSIA’S OPERATIONS IN THE FOREIGN EXCHANGE MARKET IN 2020(billions of rubles)
Table 1
09.01–06.03 10.03–12.05 13.05–22.10 Cumulative, year-to-22.10
TOTAL SALES (-)/purchase (+) 685 -581 -757 -653
Regular sales (-)/purchases (+) by the Ministry of Finance 570 -77 -711 -218Proactive foreign currency sales (from 10.03 to 06.04) + sales within the deal with Sberbank’s equity stake (from 19.03 to 12.05) -504 -504
Net foreign currency sales to offset sales not carried out within the Sberbank deal and foreign currency purchases suspended in 2018 -46 -46
Purchases not performed in 2020 (from 10.03 to 06.04) -126* Data on the amounts of operations conducted by Russia’s Ministry of Finance to buy (sell) foreign currency in the domestic FX market are published on the Bank of Russia web-site (http://www.cbr.ru/statistics/flikvid). Daily amounts may differ from aggregate values for individual periods due to rounding.
Source: Bank of Russia calculations.

2. Macroeconomic scenarios and monetary policy in 2020–2023
Monetary Policy Guidelines for 2021 – 2023 47
suspended in 2018 and not performed until now. In October, the Bank of Russia started foreign currency sales related to the acquisition of Aeroflot’s shares by the Russian Government using the NWF’s resources (50 billion rubles by the end of 2020). Beginning from 26 October 2020, foreign exchange transactions carried out not under the fiscal rule may not exceed 4 billion
rubles a day.This limit will make it possible to completely offset in 2020 Q4 foreign currency sales from
the Sberbank deal and sales within the Aeroflot deal (Table 2). Given the amount of these extra operations and that they will be conducted uniformly, this will not have any significant impact on the situation in the domestic foreign exchange market.
In 2020, the Bank of Russia conducted its operations in the foreign exchange market in line with the fiscal rule. The Bank of Russia’s efforts in March–April helped prevent excess volatility of the exchange rate amid the unprecedented slump in the oil price and the decline in export revenues, which contributed to price stability in the market of consumer goods and services.
BOX 5 FISCAL POLICY IN 2020–2023
Since 2017, fiscal policy is based on the fiscal rule, which enabled a reduction in the non-oil and gas deficit of the federal budget from 8.0% of GDP in 2017 to 5.4% in 2019.
In 2020 Q1, the budget execution was in line with the projections of Russia’s Ministry of Finance, with non-oil and gas revenues exceeding last year’s level and extensive spending, including within national projects.
In 2020 Q2, fiscal policy was revised due to the drastic changes in the situation.Budget expenditures were significantly increased: in addition to the social and demographic
measures announced by the Russian President in his Address to the Federal Assembly of the Russian Federation on 15 January 2020, the Government of the Russian Federation developed and approved extra anti-epidemic and anti-crisis measures to address the aftermath of the pandemic. As a result, expenditures planned for 2020 were additionally increased, thus significantly exceeding the threshold conforming to the fiscal rule parameters.
In 2020 Q2, the revenue base of the budget contracted considerably due to the downfall in global oil prices and the subsequent oil production cuts within the OPEC+ deal, as well as the launch of the anti-coronavirus restrictions. Oil and gas revenues of the budget shrank by more than a half against the previous year. The decline in non-oil and gas revenues was partially offset owing to the earnings from the sale of the equity stake in Sberbank (the Bank of Russia’s profit from this transaction in the amount of 1.1 trillion rubles was transferred to the budget in April 2020). However, as regards main non-oil and gas taxes, revenues decreased due to the suspension of business activity required by the quarantine measures and the anti-crisis regulatory relaxations introduced by the Russian Government in relation to tax policy and non-tax revenues. According to the Bank of Russia’s estimate, in 2020 H2 oil and gas revenues will stabilise at the level corresponding to or significantly beneath the base oil price. Non-oil and gas revenues, such as the payment of domestic VAT and profit tax, will continue to decline due to the specifics of their payment (they are transferred to the budget with a one-quarter lag). Problems of the budgets of the constituent territories of the Russian Federation and extra-budgetary funds will be aggravated, since their revenues directly depend on companies’ payroll funds and financial performance, which will require extra transfers from the federal budget. Budget spending will remain extensive. As a result, the deficit of the budget system and federal

48 Monetary Policy Guidelines for 2021 – 2023
2. Macroeconomic scenarios and monetary policy in 2020–2023
budget will continue to expand. The Bank of Russia expects that by the end of 2020 the deficit of the budget system may reach 5% of GDP. In order to finance additional expenditures amid the reduction in the revenue base, Russia’s Ministry of Finance announced an increase in the borrowing programme to more than 5 trillion rubles in 2020. In addition, beginning from April 2020, fiscal rule-based foreign currency sales were started in order to compensate for a decline in oil and gas revenues.
The fiscal policy stimulus to support the economy will pass its peak in 2020, after which the budget consolidation process will begin in 2021. However, expenditures and anti-crisis measures will be scaled down more smoothly in 2021 than it is presumed by the fiscal rule.
The tax policy provides for a balanced reduction in direct taxes on small and medium-sized enterprises. Non-oil and gas revenues will decrease due to a reduction in social insurance premia for SMEs from 30% to 15% of the excess of employees’ wages over the minimum subsistence income (about 0.4% of GDP annually). However, the decrease will be offset by additional federal budget revenues obtained, in particular, through: modifying the parameters of the excess income tax regime; updating the parameters for granting tax exemptions to the oil and gas sector; increasing the mineral tax with regard to certain solid minerals; increasing the excise rate on tobacco products; switching to the progressive personal income tax system and implementing the personal income tax on deposits and interest; amending the corporate profit tax collection process through changes introduced into double taxation agreements between the Russian Federation and other states.
To enhance the attractiveness of the Russian jurisdiction for IT companies, the rate of insurance premia has been reduced to 7.6% from 14% and the profit tax has been reduced to 3%, which is offset by the cancellation of VAT exemption on the sale of foreign-made software.
The Bank of Russia expects a reduction in the deficit of the budget system in 2021, including the budgets of the constituent territories of the Russian Federation and extra-budgetary funds, as compared to 2020. The main source to finance the budget deficit will be additional offerings of debt securities, including federal government bonds (OFZ), regional and municipal bonds (in 2021, additional borrowings through OFZ placements are expected to total about 1.1 trillion rubles). In addition, the Bank of Russia considers it possible that Russia’s Ministry of Finance may use the balances of funds in the budget system’s ruble accounts.
In 2022–2023, the planned expenditures of the federal budget are expected to return to the thresholds provided for by the fiscal rule, which will be facilitated by measures aimed at prioritising budget expenditure. In 2023, fiscal policy will shift to a neutral stance.
Under the baseline scenario, average oil prices in 2021 are expected to be beneath the base level provided for by the fiscal rule. For this reason, the NWF will finance a part of the budget deficit in the amount of the shortfall in oil and gas revenues, which will decrease the NWF’s resources. Global Urals crude prices are expected to bounce back to the level exceeding the base price, as a result of which in 2022–2023 foreign currency will be purchased in the domestic market in the amount of additional oil and gas revenues in accordance with the fiscal rule. Consequently, in 2023 the NWF will start to be replenished owing to extra oil and gas revenues earned in 2022.
Public debt is expected to expand in 2021–2023 and may exceed 20% of GDP by the end of the forecast period. Domestic debt will account for the largest portion in the total amount of Russia’s public debt due to the increase in OFZ issue. In addition, public debt will grow because of the programme for granting state guarantees within the measures aimed to support businesses and corporate lending.

Monetary Policy Guidelines for 2021 – 2023 49
3. MONETARY POLICY ENVIRONMENT AND CORE MEASURES IN 2019 H2 AND 2020
Over the period under review, the monetary policy environment drastically altered several times, being affected by a range of external and internal factors. Taking this into account, the Bank of Russia adjusted its medium-term forecast, and along with it, its monetary policy stance and signals regarding its possible future moves. After the significant, yet temporary rise in 2018 H2–early 2019, inflation was slowing down over the period from September 2019 through February 2020, and even faster than it had been forecast. This enabled the Bank of Russia to resume the reduction in the key rate and shift to neutral monetary policy. In March 2020, the situation changed dramatically. The outbreak of the coronavirus pandemic required the Government to respond with unprecedented restrictions that caused massive alterations in the economic environment and financial markets. The Bank of Russia made a decision to pause the reduction in the key rate and preserve it unchanged so as to comprehensively assess the impact of short-term proinflationary and medium-term disinflationary factors, as well as to support financial stability. In addition, the Bank of Russia took into account that the considerable decline in the economy triggered a significant risk of a downward deviation of inflation away from the 4% target in 2021. In these conditions, beginning from April the Bank of Russia was decisively decreasing the key rate and shifted to accommodative monetary policy so as to stabilise inflation and address the economic aftermath of the pandemic. In September–October, the Bank of Russia decided not to change the key rate due to
rising short-term proinflationary risks amid higher volatility in financial markets and intensifying geopolitical risks.
• Key rate reduction and shifting to neutral monetary policy (September 2019–February 2020)
In September 2019–February 2020, the Bank of Russia continued the cycle of the key rate decrease started in June 2019.1 Overall, the key rate was cut by 125 bp over the said period, from 7.25% to 6.00% per annum. Alongside with that, the Bank of Russia’s predominant signal was that it would explore the need for further key rate reduction. Financial market participants were taking this into account when forming their expectations.
Over the said period, inflation slowed down considerably, which contributed to the key rate decrease. The growth rates of consumer prices continued to trend down from their local peak of 5.3% in March 2019 to 2.3% in February 2020. The following factors influenced inflation movements over the period under review.
The strengthening of the ruble throughout 2019 accelerated the decrease in inflation. This happened concurrently with the appreciation of the currencies of other emerging market economies, resulting from the inflow of capital into these countries and the reduction in their country risk premia, which was associated with, among other factors, the easing of monetary policies by the US Fed and the ECB. The slowdown of inflation in Russia’s
1 For details regarding the start of the reduction cycle, refer to the Monetary Policy Guidelines for 2020–2022, http://cbr.ru/Content/Document/File/79959/on_2020_eng.pdf .

50 Monetary Policy Guidelines for 2021 – 2023
3. Monetary policy environment and core measures in 2019 H2 and 2020
trading partners was also limiting the growth of prices for imports.
Moderate economic activity associated with domestic and external demand trends was also an important factor of a more significant decrease in inflation. On the one hand, global economic growth prospects were deteriorating from early 2019, including due to rising tensions in global trade, which entailed a decline in external demand for core Russian exports. On the other hand, domestic demand also remained modest. Specifically, the growth of consumer demand in 2019 H1 was hindered because of a moderate rise in households’ incomes and the increase in the VAT base rate at the beginning of 2019. In addition, fiscal policy in general had a restraining effect on economic growth, including because the national projects planned by the Russian Government were implemented more slowly than it had been expected.
Moreover, supply-side factors in individual food markets also dragged inflation down. The growth of prices for certain crop products slowed down because of a good harvest and its earlier supply in 2019. The supply of meat products was steadily expanding. The supply in the markets of individual meat products was increasing faster than demand. By February 2020, the annual food price growth slowed down to 1.8%.
Lower consumer price growth rates contributed to the decrease in inflation expectations. The response of households’ inflation expectations to the VAT rise was moderate, and further on their expectations were moving downwards throughout 2019. As regards companies’ price expectations, they decreased to their record lows by mid-2019 and further on remained steady. The risks of the secondary effects of the VAT rate increase did not materialise. Nonetheless, although inflation expectations lowered
significantly, they stayed elevated compared to the inflation target.
When making its decisions on cutting the key rate over the period from September 2019 to early February 2020, the Bank of Russia assumed that disinflationary risks rather exceeded proinflationary risks over the short-term horizon. Medium-term risks remained balanced.
The easing of monetary policy contributed to the easing of monetary conditions. Both loan and deposit rates were going down. Banks were easing their non-price conditions in corporate and mortgage lending. The Bank of Russia continued the cycle of the key rate decrease, and coupled with its communications regarding a possible future path of the key rate, this contributed to the further easing of monetary conditions.
• The pause in the key rate reduction needed due to uncertainty caused by the pandemic (March 2020)
At its meeting on 20 March 2020, the Bank of Russia’s Board of Directors made the decision to keep the key rate unchanged. The spread of the coronavirus pandemic in February–March induced drastic deviations of the situation from the Bank of Russia’s baseline scenario. Moderate growth in the Russian economy at the beginning of the year reversed to a rapid and deep decline in economic activity, instigating long-lasting disinflationary pressure on prices dragged down by shrinking aggregate demand. Furthermore, volatility in global commodity and financial markets materially exacerbated short-term proinflationary factors and financial stability risks. The decision not to change the key rate helped balance the impact of these factors and risks.
Anti-pandemic measures entailed a slump in commodity and financial markets.

3. Monetary policy environment and core measures in 2019 H2 and 2020
Monetary Policy Guidelines for 2021 – 2023 51
Restrictions affecting economic activity worldwide and related expectations of an unprecedented downfall in the global economy amplified volatility of capital flows and caused a stress in global financial markets. At the same time, oil prices plummeted due to both a considerable contraction of global demand and the unexpected termination of the OPEC+ deal and oil production expansion. Volatility in global financial markets and the slump in oil prices entailed a material weakening of the ruble. In response, the Bank of Russia had to implement extra measures in order to secure financial stability and support the economy and the financial sector amid the coronavirus pandemic.
Due to the materialisation of proinflationary risks, the Bank of Russia expected inflation to temporarily rise in the next few months. Proinflationary factors were caused by the pass-through of the ruble depreciation to prices and elevated demand for individual products when households were preparing for the lockdown period. Moreover, seasonally adjusted monthly inflation sped up in March, exceeding 4% in annualised terms. Increased current inflation pushed upwards the inflation expectations of households, businesses and financial market participants.
The Bank of Russia was also taking into account that the decline in aggregate demand in 2020 will create persistent disinflationary pressure on prices over the medium-term horizon. This is associated with the fact that the anti-coronavirus restrictions implemented in Russia and abroad will induce a dramatic decrease in economic activity and make the economy deviate downwards from its potential.
Given the expected long-lasting disinflationary pressure caused by falling demand, the Bank of Russia needed to ease its monetary policy. However, money market
indicators suggested that financial market participants were actually expecting the key rate to increase. Monetary conditions were also tightened significantly amid volatility in global financial markets and rising credit risk. The Bank of Russia’s decision to keep the key rate unchanged, followed by weekly press conferences on current developments and the progress of stabilisation measures, helped limit the scale of the tightening of monetary conditions, influencing market participants’ sentiment and expectations regarding the possible future path of the key rate. This was also facilitated by other measures taken by the Bank of Russia, including the regulatory easing for credit and other financial institutions.
• Pursuing accommodative monetary policy to stabilise inflation close to the target by supporting domestic demand (April–October 2020)
In April, the Bank of Russia resumed the cycle of key rate reductions and shifted to accommodative monetary policy. The situation in financial markets started to improve by May (largely owing to foreign central banks’ efforts) and stayed stable in June–July. The key rate was decreased amid the considerable contraction of domestic and external demand, which created the risks of a downward deviation of inflation from the target over the medium-term horizon. Over the four months, the key rate was cut by a total of 175 bp, to 4.25% per annum.
August–October recorded a rise in short-term proinflationary risks, which was associated with, among other things, higher volatility in global markets due to geopolitical factors. Taking this into account and given the need to maintain financial stability, the Bank of Russia decided not to change the key rate in September and October, continuing accommodative monetary policy. Moreover,
52 Monetary Policy Guidelines for 2021 – 2023
3. Monetary policy environment and core measures in 2019 H2 and 2020
the Bank of Russia emphasised that at its next meetings the Board of Directors may consider a further decrease in the key rate amid prevailing medium-term disinflationary factors.
Making its decisions on the key rate, the Bank of Russia also took into account the following factors.
The Bank of Russia made its decisions, anticipating medium-term inflation to be affected by the deep decline in domestic and external demand, even despite the fiscal stimulus measures being taken. In April–October, overall inflationary pressure generally remained low. The growth rates of consumer prices reflecting the steadiest price movements were close to or below 4% in annualised terms.
Over this period, there was a range of short-term proinflationary factors. They were caused by both the periods of higher exchange rate volatility and the realisation of pent-up demand for consumer goods after the lifting of restrictions. However, although economic activity was reviving, consumer prices were moving unevenly.
Short-term proinflationary factors in April–August triggered a rise in households’ and businesses’ inflation expectations. This may suggest that their response to the drastic change in the economic environment in spring turned out to be somewhat weaker than during the previous crisis periods, possibly as a result of their stronger anchoring at the target since inflation has been staying at its record lows in recent years. However, in September–October inflation expectations increased significantly, which was largely associated with the weakening of the ruble.
Price dynamics were predominantly affected by medium-term disinflationary factors. By cutting the key rate and shifting to accommodative monetary policy, the Bank of Russia limits the risks of inflation deviation away from the target in 2021. With
this in view, the Bank of Russia forecasts that inflation will range from 3.5% to 4.0% in 2021 and stay close to 4% further on.2
Another important factor the Bank of Russia considered is a material deviation of the Russian economy from its potential due to the pandemic and the effects of the anti-coronavirus restrictions in Russia and abroad. In Q2, GDP shrank by 8.0% year-on-year. The realisation of pent-up after the restrictions were lifted spurred a revival in economic activity, which turned out to be faster than expected. This was most notable in the industries focused on domestic consumer demand. Moreover, throughout this period, the Russian economy was supported by the measures implemented by the Government of the Russian Federation and the Bank of Russia to limit the scale of the economic decline in 2020 and promote the recovery of domestic demand.
However, according to economic indicators for September–October, recovery processes started to slow down, primarily due to domestic demand trends. This was associated with two factors: the effect of pent-up demand was exhausted and the rise in expenses was limited amid the deteriorating epidemiological situation. Further on, domestic demand is generally forecast to grow more slowly than it was expected in summer.
As estimated by the Bank of Russia, the economy will regain its potential in 2022 H1. The path of economic growth will largely depend on the process of budget consolidation to take place further on, coronavirus pandemic trends in Russia and abroad, and the specifics of the rebound in private demand amid potential changes in households’ and businesses’ behaviour.
The shift to accommodative monetary policy was needed to support domestic demand and stabilise inflation close
2 For details, refer to Section 2 ‘Macroeconomic scenarios and monetary policy in 2020–2023’.

3. Monetary policy environment and core measures in 2019 H2 and 2020
Monetary Policy Guidelines for 2021 – 2023 53
to the Bank of Russia’s target over the forecast horizon. The key rate reduction was combined with the easing of macroprudential policy and regulatory requirements by the Bank of Russia, which created the conditions promoting banks’ lending activity. This was critical in the situation where elevated credit risks could push interest rates upwards and entail a tightening of non-price lending conditions in a range of market segments. The easing of monetary conditions driven by the significant key rate decrease will influence inflation and economic trends over the next 1.5 years.
After the key rate decrease to its record low of 4.25% per annum, in September and October the Bank of Russia decided not to change the key rate, maintaining accommodative monetary policy. This decision was made given the rise in short-term proinflationary risks associated with higher volatility in global markets, as well as the need to consider financial stability issues. The Bank of Russia took into account that a reduction in the key rate amid elevated volatility in financial markets could provoke an increase in inflation expectations and a tightening of monetary conditions due to rising interest rates on long-term financial instruments and a more significant response of the exchange rate than in stable conditions. Therefore, the existing room for a further key rate decrease should be used with account of potential risks to financial stability.
When making its key rate decisions, the Bank of Russia factored in that disinflationary risks exceed proinflationary ones over the medium-term horizon.
Disinflationary risks for the baseline scenario are mostly associated with further coronavirus spread trends in Russia and abroad, the scale of possible anti-pandemic measures and their impact on economic
activity, as well as the recovery pace of the Russian and global economies as a result of the easing of restrictions. Inflation may also be limited because of steady shifts in households’ preferences and behaviour, including a potential increase in their propensity to save.
The risks of intensified volatility in global markets still remain over the short-term horizon; they are caused by, among other factors, a range of geopolitical events, which may affect exchange rate and inflation expectations. Furthermore, proinflationary pressure may be caused by currently remaining disruptions in logistics and production chains, as well as extra costs incurred by businesses to be protected against the coronavirus.
There is still uncertainty about long-term structural consequences of the coronavirus pandemic for the Russian and global economies, namely the scale of the decline in the Russian economy’s potential. The global growth potential may also be affected considerably by geopolitical factors, including rising trade tensions. In turn, the scale of the deviation of the Russian economy from its potential is the crucial factor influencing medium-term inflation trends.
Medium-term inflation trends are also largely impacted by fiscal policy. Making its monetary policy decisions, the Bank of Russia relies on the fiscal policy course presented in the draft Guidelines for Fiscal, Tax and Customs and Tariff Policy for 2021 and the 2022–2023 Planning Period.
Given the prevailing medium-term proinflationary factors, the Bank of Russia noted in September and October that if the situation develops in line with its baseline forecast, it will explore the need for further key rate reduction at the upcoming meetings of the Board of Directors.

54 Monetary Policy Guidelines for 2021 – 2023
3. Monetary policy environment and core measures in 2019 H2 and 2020
BOX 6 MEASURES TAKEN BY THE BANK OF RUSSIA AND THE RUSSIAN GOVERNMENT TO ADDRESS THE ECONOMIC CONSEQUENCES OF THE CORONAVIRUS PANDEMIC
Measures implemented by the Bank of RussiaThe outbreak of the coronavirus and the anti-pandemic measures induced a steep and
drastic decline in economic activity in Russia in 2020 Q2. This situation required a prompt, comprehensive and well-coordinated response from the Bank of Russia and the Government of the Russian Federation in order to mitigate the adverse consequences of the crisis. In addition to shifting to accommodative monetary policy, the Bank of Russia also implemented a complex of measures aiming to protect households’ interests, support corporate borrowers, maintain the financial sector’s potential to provide lending to the economy, and reduce the regulatory and supervisory burden.1
Household protection. Households facing hardships needed loan restructuring and the postponement of repayments. The Bank of Russia facilitated this process, recommending that credit institutions do not take into account the restructuring as a factor that might deteriorate individuals’ credit history. Furthermore, it was crucial to minimise possible contacts between people in order to curb the spread of the pandemic. Therefore, the Bank of Russia recommended that organisations provide services to customers remotely, as well as implemented a range of measures to improve the possibilities for making bank card and online payments.
Support to corporate borrowers. The Bank of Russia facilitated the corporate loan restructuring (including the postponement of repayments and loan extension). To simplify this process, the Bank of Russia eased the regulation for credit institutions. Specifically, in the course of the classification of such loans, credit institutions were allowed not to deteriorate temporarily their assessment of the financial standing of companies in vulnerable industries, the quality of debt servicing, or the quality category of loans. Moreover, in order to support this process, the Bank of Russia also launched its long-term repo auctions as a source of financing for banks offering loan restructuring options to their clients.
Support of SME lending and contribution to the implementation of government programmes. The Bank of Russia expanded the refinancing programme for banks in order to shore up and stimulate lending to small and medium-sized enterprises (SMEs). The Bank of Russia reduced the interest rate and cancelled sectoral restrictions within the effective specialised refinancing facilities. It also established an additional preferential refinancing facility with a limit of 500 billion rubles. The new facility is largely aimed specifically at supporting lending to SMEs, while it also provides for the promotion of lending to maintain employment (including for large companies), in combination with the government programme to subsidise interest on such loans to banks. The Bank of Russia also eased the regulation for banks granting loans to these types of companies.2
Support of mortgage lending. The Bank of Russia made a number of decisions on the regulation so as to promote mortgage lending and compensate banks for a decrease in their capital adequacy ratios resulting from the recognition of mortgage loan losses. The development of mortgage lending will also be facilitated owing to the Bank of Russia’s decision allowing a faster implementation of the new methodology for measuring credit risk on mortgage loans and the reduction in macroprudential capital requirements for new mortgage loans.
1 These measures are described in detail on the Bank of Russia website, http://cbr.ru / info_2020 / .2 More details are available on the Bank of Russia website, http://www.cbr.ru / press / pr / ?file=27032020_145
619dkp2020-03-27T14_55_46.htm.

3. Monetary policy environment and core measures in 2019 H2 and 2020
Monetary Policy Guidelines for 2021 – 2023 55
Support of the financial sector’s potential to provide funding to the economy. The Bank of Russia implemented a range of decisions on the regulation predominantly associated with banks’ capital adequacy ratios that were aimed at expanding their capabilities to provide lending to the economy. In particular, banks were allowed to utilise supervisory capital buffers. The Bank of Russia also eased certain macroprudential requirements for capital adequacy. Specifically, the Bank of Russia released macroprudential capital buffers for unsecured consumer loans extended through 31 August 2019 and decreased macroprudential risk-based buffers to credit institutions’ capital adequacy ratios for unsecured consumer loans issued beginning on 1 September 2020. The Bank of Russia also recommended that credit institutions postpone their decisions on dividend payouts for 2019 until August–September 2020.
In order to support banks’ credit activity, the Bank of Russia approved temporary decisions as regards the valuation of assets especially hard hit by the pandemic, including restructured loans and securities. In addition, the Bank of Russia suspended a range of new regulatory requirements that are to be launched in the near future.3
Regulatory and administrative easing. Amid the pandemic, the Bank of Russia suspended inspections at all financial institutions and extended the deadlines for fulfilling a range of requirements for credit institutions, financial market participants, collective investment entities and microfinance institutions. In addition, a number of legislative amendments approved made it possible to extend the deadlines for and simplify a range of procedures regulating joint-stock companies’ operation.
Measures implemented by the Russian GovernmentIn March–July 2020, the Government of the Russian Federation approved three packages
of anti-crisis measures aimed at combating the spread of the coronavirus and supporting households and businesses.4
A considerable portion of the measures adopted by the Government of the Russian Federation was intended to maintain households’ incomes and employment. In April–October 2020, the allocations for these purposes approximated 950 billion rubles.
The overall complex of the measures to aid businesses exceeded 2 trillion rubles. Companies were granted support both directly (e.g. as subsidies and preferential loans) and indirectly, namely through a temporal reduction in or suspension of mandatory payments to the budget. The largest part (465 out of 750 billion rubles) of the direct aid to businesses was used to maintain employment in the industries hardest hit by the pandemic.5 Alongside with that, the Government introduced additional measures to aid companies in individual sectors, including construction, air transportation, tourism, and others. In order to support housing construction, the Government expanded the preferential mortgage lending programmes to preserve households’ demand for housing amid declining incomes. Moreover, to help businesses focus on addressing the aftermath of the pandemic, the Government of the Russian Federation implemented a complex of temporary measures to reduce administrative and supervisory burden.
3 The exhaustive list of the measures is available on the Bank of Russia website, http://www.cbr.ru / vfs / finstab / plan_limit_covid.pdf.
4 The comprehensive description of the measures is available on the website of the Russian Government, http://government.ru / support_measures / .
5 Motor transportation; air, water and rail transport; tourism; exhibition activities; hotels; entertainment and leisure; public catering; personal services; culture and sports; non-food retail; dental care services; extended education; mass media.
56 Monetary Policy Guidelines for 2021 – 2023
3. Monetary policy environment and core measures in 2019 H2 and 2020
* * *Thus, the above measures implemented by the Bank of Russia and the Government of the
Russian Federation provided prompt and multifaceted support to households and businesses during the most challenging period of the crisis. However, as the situation stabilises, these measures will be gradually terminated. The anti-crisis measures launched by the Russian Government will ensure the maximum support to the economy in 2020, after which budget consolidation will begin, and the effect of these measures will be gradually exhausted.6 The majority of the pandemic-related measures were approved by the Bank of Russia for the period from 1 March through 30 September 2020. In August 2020, the Bank of Russia confirmed the scheduled cancellation of a range of measures, while partially extending the regulatory easing. Making its key rate decisions, the Bank of Russia’s Board of Directors will take into account how the progressive termination of the anti-crisis measures impacts the economy and monetary conditions. Concurrently, the earlier key rate reduction will promote the easing of monetary conditions in 2020 and 2021, thus supporting the economy in the medium term.
6 For details, refer to Box 5 ‘Fiscal policy in 2020–2023’.

Monetary Policy Guidelines for 2021 – 2023 57
thus creates the conditions promoting an equilibrium in the overnight segment of the money market and the efficient functioning of the interest rate corridor. The upper and lower bounds of the latter are determined by interest rates on overnight standing facilities, while the centre corresponds to the key rate. The width of the interest rate corridor is 200 bp; it forms the maximum and minimum alternative cost of borrowing and depositing in the interbank market, thus limiting fluctuations in market rates and bringing them closer to the key rate.
The Bank of Russia monitors the banking sector liquidity daily, while regulating its overall amount primarily on a weekly basis. Amid the currently existing structural liquidity surplus, the Bank of Russia regularly absorbs excess liquidity for a one-week period at its deposit auctions that are normally held on Tuesdays. If the situation alters causing a structural liquidity deficit, the Bank of Russia will launch its repo auctions to provide liquidity for a one-week period as well. Along with these main operations, the instrument system of monetary policy also comprises auctions both to absorb and provide funds for longer periods. Currently, the Bank of Russia additionally absorbs excess liquidity by issuing three-month coupon bonds. In order to promptly respond to factors that may entail a material deviation of overnight interest rates from the key rate, the Bank of Russia conducts deposit auctions and fine-tuning repo auctions for periods from one to six days.
The system of monetary policy instruments has existed in its current form since the end of 2013. In the following
OPERATIONAL OBJECTIVE AND INSTRUMENT SYSTEM OF MONETARY POLICY
Within the inflation targeting strategy, the Bank of Russia’s monetary policy influences the economy and inflation predominantly through the interest rate channel. Accordingly, the operational objective of the Bank of Russia’s monetary policy is to keep overnight money market rates close to the key rate. This market segment is the target one both because interest rates forming therein act as the benchmark for the majority of interest rates in the economy and because the Bank of Russia is capable to almost directly impact their levels using its instruments.
In order to achieve its operational objective, the Bank of Russia employs standard liquidity management instruments and the interest rate corridor. According to the Bank of Russia’s regulations, banks must maintain required reserves, i.e. certain balances of funds in their accounts, primarily correspondent accounts. Thereby, the Bank of Russia establishes a required end-of-day level of liquidity both for every particular bank and for the banking sector as a whole. If the balance in banks’ correspondent accounts is forecast to get above or beneath this level as a result of changes in the amount of cash in circulation, budget operations or other factors, the Bank of Russia will, respectively, absorb or provide funds through its auctions.1 The Bank of Russia
1 Banks have the right to average required reserves in their correspondent accounts, that is, to maintain the required amount of funds not every evening, but rather on average over the period of four to five weeks, which makes it possible to flexibly respond to significant changes in the liquidity level, helping stabilise market rates.
4. MONETARY POLICY OPERATIONAL PROCEDURE IN 2020 AND IN 2021-2023

58 Monetary Policy Guidelines for 2021 – 2023
4. Monetary policy operational procedure in 2020 and in 2021-2023
communication helped market participants form their expectations regarding future interest rate trends. This influenced liquidity management strategies pursued by banks. Over the course of those required reserve averaging periods when the Bank of Russia made the decisions to reduce the key rate, credit institutions sought to first deposit funds with the Bank of Russia or in the money market at higher interest rates, delaying their required reserve averaging for the second half of the averaging period when the cost of funds declined. This caused an excess supply of liquidity in the market and a local expansion of the spread several days prior to the approval of the relevant key rate decision by the Bank of Russia.
Secondly, volatility in market rates notably rose in late March–April 2020 due to the increase in banks’ demand for liquidity induced by higher uncertainty in financial markets and lower predictability of bank clients’ transactions amid the restrictions in place. As a result, market rates could rise above the key rate on certain days. In order to enhance credit institutions’ capabilities to manage their liquidity, the Bank of Russia
years, it has become more technologically advanced and convenient for usage by credit institutions.
ACHIEVING THE OPERATIONAL OBJECTIVE OF MONETARY POLICY
In 2020, overnight interbank rates mostly formed in the lower half of the interest rate corridor, but close to the Bank of Russia key rate (Chart 4.1). In January–September 2020, the average absolute deviation of RUONIA from the key rate (spread) expanded against the previous year, to reach 19 bp (vs the average of 18 bp in 2019). The spread volatility increased to 18 bp over the period January–September 2020 (vs 15 bp in 2019).
The rise in interest rate volatility over individual periods was caused by a range of factors. Firstly, in 2020 the Bank of Russia was progressively reducing the key rate. In accordance with the decisions made by the Bank of Russia’s Board of Director, the key rate was cut by 2 pp from January to August, specifically from 6.25% to 4.25% per annum. The Bank of Russia’s transparent
0
2
4
6
8
10
12
2017 2018 2019 2020 2021RUONIA Repo rateImplied ruble interest rate on FX swaps Interest rate corridor boundsBank of Russia key rate Implied ruble interest rate on BoR FX swaps*
* Implied rate on BoR reverse FX swap = ruble lending rate – foreign currency borrowing rate + LIBOR (since 19 December 2016: key rate – 1 pp – (LIBOR + 1.5 pp) + LIBOR = key rate – 2.5 pp).
Source: Bank of Russia calculations.
MONEY MARKET RATES(% p.a.)
Chart 4.1

4. Monetary policy operational procedure in 2020 and in 2021-2023
Monetary Policy Guidelines for 2021 – 2023 59
forecast was that banks somewhat delayed their required reserve averaging, expecting the key rate to be cut in December 2019. As a result, the balance of funds in banks’ correspondent accounts as of the year-end totalled 2.6 trillion rubles, which is above the Bank of Russia’s forecast of 2.3 trillion rubles. Moreover, the structural liquidity surplus averaged 3 trillion rubles in the December required reserve averaging period. In this case, the average value enables a more objective assessment of how long-term factors, namely budget operations, influence the banking sector liquidity and reduces the effect of temporary strategies pursued by individual credit institutions to manage balances of funds in their correspondent accounts.
In 2020, the dynamics of liquidity factors were significantly affected by the restrictions introduced to combat the pandemic. After the seasonal inflow of funds into banks in January–February caused by the return of cash after the New Year holidays and the increase in budgetary funds placed with banks by the Federal Treasury, the liquidity surplus expanded. However, in mid-March the inflow of funds into the banking sector reversed to an outflow. Shortly before the non-work days were announced, both households and businesses increased demand for cash, which entailed an outflow of liquidity from the banking sector. Moreover, there was a decrease in cash inflows into banks as a result of the collection of retailers’ earnings. Since this reduction was more significant than the decline in retail turnover in April–June, this may suggest that the portion of cash payments for goods and services expanded compared with cashless payments. In July–the first half of October, the growth of the amount of cash in circulation notably slowed down, while still exceeding the issue over the same periods of previous years.
carried out fine-tuning repo auctions2 during this period. As the situation stabilised in financial markets and the Bank of Russia and the Russian Government launched the package of anti-crisis measures, banks’ demand for refinancing decreased and volatility of overnight interest rates returned to its pre-crisis level.
The Bank of Russia’s estimates suggest that if the liquidity surplus remains, the negative spread between market rates and the key rate will not exceed 25 bp, as before.
LIQUIDITY FACTORS AND LIQUIDITY FORECAST
In 2019–2020, the banking sector had a structural liquidity surplus. This implies that funds in banks’ correspondent accounts exceeded the amount they needed to comply with the reserve requirements and process client payments. For this reason, the Bank of Russia continued to hold deposit auctions and offer coupon bonds.
In 2019, the liquidity surplus was varying from 2.3 to 4.2 trillion rubles, totalling 2.8 trillion rubles as of the end of the year. This is beneath the Bank of Russia’s forecast of 3.6–3.9 trillion rubles presented in the Monetary Policy Guidelines for 2020–2022. A smaller-than-expected liquidity inflow via the budget channel in December 2019 was the main reason behind this deviation. In its forecast, the Bank of Russia assumed that if the budget expenditures planned for 2019 were partially carried over to 2020 and onwards, the Federal Treasury would be able to increase the amount of funds offered for depositing with banks. However, in December credit institutions’ debt under these transactions contracted nearly twice, while budget expenditures increased moderately against the previous year.
Another factor causing the downward deviation of the actual surplus from the
2 For details, refer to the subsection ‘The use of monetary policy instruments’ herein.

60 Monetary Policy Guidelines for 2021 – 2023
4. Monetary policy operational procedure in 2020 and in 2021-2023
The outflow of liquidity due to an increased amount of cash was partially offset by the considerable rise in budget expenditures in April–June. This was primarily associated with operations in extra-budgetary funds’ accounts, that is, payments to households, including to families with children, and healthcare costs. Concurrently, the collapse of the Urals crude price induced a reduction in oil and gas revenues of the budget, yet the resulting decrease in the liquidity outflow was offset owing to the foreign currency sales by Russia’s Ministry of Finance in the domestic foreign exchange market. In addition, revenues from the payment of main non-oil and gas taxes contracted in Q2, following the decline in economic activity and the implementation of a range of tax easing measures. In July–September, tax revenues of the budget started to gradually restore, while budget spending decreased.
Expenditures of general government exceeded its revenues, and this gap was covered primarily through a decrease in balances in the general government accounts with the Bank of Russia and a rise in the internal borrowings of Russia’s Ministry of Finance. Having received the
Bank of Russia’s profit from the sale of the equity stake in Sberbank, the Federal Treasury, on the contrary, managed to increase the amount of deposits placed with banks, while reducing the maturities of its operations so as to preserve the capacity to promptly finance future expenditures.
The banking sector’s increased demand for liquidity was also driven by the growth of required reserves to be maintained by credit institutions with the Bank of Russia, which resulted from the foreign currency revaluation of banks’ liabilities in April–May and in August–September. They were then gradually revalued back, with demand for liquidity falling, as the exchange rate of the ruble adjusted.
Due to the above factors, the liquidity surplus shrank from 2.8 to 1.4 trillion rubles over January–September. Demand for cash is expected to return to its pre-pandemic levels as economic activity revives. Accordingly, the amount of cash in circulation will be gradually decreasing. However, this process will shift to 2021. The disinflationary and risk scenarios do not assume that cash will return to banks, if the epidemiological situation worsens over the forecast horizon. In 2022–2023, the
-10
-5
0
5
10
15
20
2015 2016 2017 2018 2019 2020
OFZ operations of Russia’s Ministry of Finance*
Bank of Russia’s interventions in the domestic foreign exchange market and gold purchases**
Change in the amount of cash in circulation
Federal Treasury operations
Change in the balances of funds in general governmentaccounts with the Bank of Russia, and other operations***
* Including coupon payments.** The Bank of Russia has suspended domestic FX market interventions since 28.07.2015.
*** Excluding Federal Treasury deposit, repo and swap operations and OFZ operations of Russia’s Ministry of Finance, including operations of Russia’s Ministry of Finance to buy (sell) foreign currency in the domestic foreign exchange market, settlements on Bank of Russia USD/RUB sell/buy FX swaps, and other operations.
Source: Bank of Russia.
FACTORS OF BANKING SECTOR LIQUIDITY(cumulative total, trillions of rubles)
Chart 4.2

4. Monetary policy operational procedure in 2020 and in 2021-2023
Monetary Policy Guidelines for 2021 – 2023 61
amount of cash in circulation will gradually get closer to its conventional path and will grow in line with nominal GDP trends. However, as before, the dynamics of this indicator will be substantially restrained by a wider use of cashless payments.
The effect of the fiscal rule and the foreign currency sales scheduled by the Bank of Russia for 2020 Q4 in addition to standard fiscal rule-based operations3 will partially offset the expected inflow of liquidity through the budget channel.
According to the Bank of Russia’s estimate, the liquidity surplus will reach 1.0–1.4 trillion rubles as of the end of 2020. Further on, the liquidity surplus is expected to shrink over the three-year horizon. By the end of 2023, the banking sector liquidity surplus is forecast to total 0.3 trillion under the baseline scenario and may reverse to a deficit in the amount of 0.3 trillion rubles under the risk scenario. These estimates are based on the key parameters of the Bank of Russia’s macroeconomic forecast and the budget projections of Russia’s Ministry of Finance (for details, refer to Section 2.2 ‘Scenarios for the development of Russia’s economy in 2021–2023’). The Bank of Russia will continue to absorb excess liquidity through deposit auctions and the offering of Bank of Russia coupon bonds. This will enable it to maintain interbank interest rates near the key rate and create the monetary conditions required to keep annual inflation close to 4%.
3 The net amount of the above additional foreign currency sales will total 185 billion rubles, which corresponds to the amount needed to offset the foreign currency sales related to the Sberbank deal, the fiscal rule-based foreign currency purchases suspended in 2018 and in March–April 2020, and the proactive foreign currency sales carried out under the fiscal rule in March–April. Additionally, beginning from 26 October 2020, the Bank of Russia will carry out foreign currency sales in the domestic market in the amount of 50 billion rubles within the transaction with Aeroflot’s shares.
THE USE OF MONETARY POLICY INSTRUMENTS
In 2020, in order to achieve the operational objective of monetary policy, the Bank of Russia continued to absorb excess liquidity through one-week deposit auctions as the main instrument (Chart 4.3). The Bank of Russia also continued to hold fine-tuning deposit auctions in order to bring overnight interest rates closer to the key rate at the end of required reserve averaging periods when the money market commonly experiences an excess supply of liquidity.
The efficient monetary policy operational procedure and the promptly implemented anti-crisis measures (Box 6 ‘Measures taken by the Bank of Russia and the Russian Government to address the economic consequences of the coronavirus pandemic’) supported confidence in financial markets and helped maintain activity in the interbank lending market amid the spread of the pandemic. However, in March–April, due to higher uncertainty in financial markets, the rise in the turnover of customer transactions and the rapid contraction in the structural liquidity surplus, the uneven distribution of funds among individual credit institutions could become a source of growing volatility in the money market. In order to avoid this, it was critical to improve the availability of liquidity for credit institutions at interest rates close to the key rate. To smooth out arising mismatches, the Bank of Russia carried out ten fine-tuning repo auctions for different periods from 10 March through 6 May, in addition to its regular liquidity-absorbing operations. The maximum amount of the Bank of Russia’s claims on credit institutions under these operations totalled 0.9 trillion rubles. Beginning from mid-May when the new required reserve averaging period started, these operations were no longer needed as the dynamics

62 Monetary Policy Guidelines for 2021 – 2023
4. Monetary policy operational procedure in 2020 and in 2021-2023
of liquidity factors gradually returned to normal and customer activity stabilised.
As the banking sector’s structural liquidity surplus contracted in March–April, the Bank of Russia reduced its coupon bond offerings. The Bank of Russia issues bonds to absorb a steady excess of liquidity for longer periods. In order to ensure greater flexibility in managing liquidity through its one-week deposit auctions, the Bank of Russia reduced the amount of coupon bonds in circulation in the first half of the year more than twofold, to 0.7 trillion rubles.
Furthermore, as the external environment remains unfavourable and in order to reduce maturity mismatches in assets and liabilities on credit institutions’ balance sheets, the Bank of Russia launched one-month repo auctions at a fixed interest rate and one-year repo auctions at a floating interest rate. Nonetheless, credit institutions managed to adjust quite fast to the decrease in the structural surplus and started to make advantage of the regulatory easing granted. As a result, there was almost no demand for repo auctions in May–September. However, although the banking sector had sufficient liquidity, banks increased again their demand for refinancing in October, raising over 0.6
trillion rubles. This is associated with the fact that the dynamics of budget operations at the end of the year are characterised by divergent trends. In terms of seasons, budget expenditures are largely carried out over the last weeks of the year. To finance these expenditures, Russia’s Ministry of Finance started to raise funds in advance, significantly expanding its OFZ offerings in the primary market. This could form short-term imbalances in the distribution of funds among banks. To offset these imbalances, the Bank of Russia increased the maximum amount of funding for one month from 0.4 to 1 trillion rubles. Further on, as budget expenditures are carried out, this will result in an inflow of funds into bank accounts and will enable banks to repay their debts on repos.
In 2020, in order to support lending to the economy amid the pandemic, the Bank of Russia temporarily expanded the range of specialised refinancing facilities by launching a number of instruments with a total limit of 500 billion rubles to provide liquidity to banks on preferential terms. These instruments were intended to incentivise banks to extend loans to non-financial organisations for them to
-5
-4
-3
-2
-1
0
1
2
2017 2018 2019 2020
BoR coupon bonds
Auction-based refinancing operations (repos, FX swaps**, secured loans)
Refinancing standing facilities (repos, FX swaps**, securedloans)
Reverse facilities, other than standard instruments of the Bank of Russia’s monetary policy***
Standing deposit facilities
Deposit auctions
Structural liquidity deficit (+) / surplus (-)
Источник: Банк России* The Bank of Russia’s claims on credit institutions under refinancing instruments / the Bank of Russia’s liabilities to credit institutions under surplus liquidity absorption instruments as of the start of the operating day.
** The Bank of Russia’s USD/RUB and EUR/RUB buy/sell FX swaps.*** The Bank of Russia’s specialised refinancing facilities, Bank of Russia loans issued under irrevocable credit lines, and USD/RUB and EUR/RUB sell/buy FX swaps.Source: Bank of Russia.
STRUCTURE OF BANK OF RUSSIA OPERATIONS*(trillions of rubles)
Chart 4.3

4. Monetary policy operational procedure in 2020 and in 2021-2023
Monetary Policy Guidelines for 2021 – 2023 63
pay salaries and cover other urgent needs (in combination with the government programme subsidising interest rates on bank loans for urgent needs and to maintain employment), as well as other loans to small and medium-sized enterprises. As of 1 October, the Bank of Russia’s claims on credit institutions under these instruments amounted to 443 billion rubles. The Bank of Russia also amended the terms for the specialised refinancing facility aimed at maintaining affordable interest rates on SME loans secured by JSC Russian Small and Medium Business Corporation. Specifically, the Bank of Russia removed sectoral restrictions and decreased the interest rate to 4.0% per annum, with interest rates for ultimate borrowers limited to 8.5% per annum.
In the future, taking into account current macroeconomic forecasts, the Bank of Russia is not planning to introduce any
significant changes to the operational procedure or revise the existing system of instruments. As a result of the above modifications, required reserves will address their objectives more efficiently. In the conditions of a structural surplus, as before, liquidity will be managed predominantly through one-week deposit auctions. A steady excess of liquidity will be absorbed through the issue of coupon bonds, with the amount of each issue to be established based on the liquidity forecast, just as before. A reverse to a structural deficit is still highly unlikely, yet the Bank of Russia always has readily available instruments to address such a situation, and the existing operational procedure stipulates how they should be employed. The Bank of Russia will continue to enhance the technical level and usability of its operations for credit institutions.

64 Monetary Policy Guidelines for 2021 – 2023
4. Monetary policy operational procedure in 2020 and in 2021-2023
BOX 7 CHANGES IN THE RULES AND PROCEDURES FOR CONDUCTING OPERATIONS
In 2020, the Bank of Russia continued to improve the technical level of operations, fine-tune their parameters, and advance the system of monetary policy instruments. The Bank of Russia also implemented a range of changes to its approaches to managing risks inherent in operations.
Development of electronic document workflowThe development of electronic document workflow between the Bank of Russia and its
counterparties on credit operations remains a key priority.On 9 January 2020, the Bank of Russia launched the electronic exchange of documents
related to the formation of collateral pools comprising non-marketable assets within the standard refinancing facilities, to be carried out with credit institutions (or their branches) through accounts.
Beginning from 28 September 2020, the Bank of Russia switched credit institutions’ document workflow to the electronic format through accounts within credit operations related to specialised refinancing facilities.
Technology of operationsThe Bank of Russia continued to advance the technology used to conduct operations in
order to enhance the flexibility of the usage of its monetary policy instruments and for credit institutions to more efficiently manage their own liquidity.
From the beginning of 2020, according to the schedule, the Bank of Russia enabled the use of intraday loans and overnight loans at night, on weekends and holidays in order to process settlements in the Bank of Russia’s Faster Payments System.
In view of the decision approved in May 2020 to launch regular long-term repo auctions, the Bank of Russia elaborated a range of procedures. As a result, it became possible to introduce floating rate repos.
Managing financial risks on operationsAnother priority of the Bank of Russia is to enhance the work with collateral and claims on
counterparties under refinancing operations. When making its decisions on managing its own financial risks related to operations conducted, the Bank of Russia is first of all guided by the need to maintain the conditions enabling the achievement of the monetary policy goals and securing financial stability.
In early 2020, the Bank of Russia changed the algorithm for selecting securities and non-marketable assets as collateral to back Bank of Russia loans. Currently, the selection of assets is primarily based on the assessment of their quality, that is, preference is given to assets with the highest adjustment ratios. The second priority in the course of the selection is the value and maturity of assets.
Launching long-term repo auctions, the Bank of Russia decided to limit the list of securities that may be used in transactions to federal government bonds and securities of the constituent territories of the Russian Federation and municipalities, the issues of which have the highest credit rating according to the national rating scale.
Beginning from mid-2021, the Bank of Russia is planning to cease applying the criteria associated with the reserve requirements when granting access to its operations for credit institutions. From 2022, the Bank of Russia is going to identify its counterparties in liquidity-providing operations in the domestic market based on information on credit ratings instead of information on their classification groups and compliance with the reserve requirements.

4. Monetary policy operational procedure in 2020 and in 2021-2023
Monetary Policy Guidelines for 2021 – 2023 65
The Bank of Russia is planning to carry out repos and lending transactions with Russian credit institutions, provided their credit rating is at least ‘B-(RU)’ according to the rating agency ACRA JSC or ‘ruB-’ according to the rating agency JSC Expert RA.
BOX 8 NEW APPROACH TO REQUIRED RESERVES
As part of the efforts to enhance the required reserve mechanism and reduce the regulatory burden on credit institutions, in 2021 the Bank of Russia will simplify the procedure for calculating required reserves and fulfilling the reserve requirements by credit institutions.
Within the new procedure, the Bank of Russia will cancel special reporting on required reserves that shall be compiled and submitted by credit institutions. The Bank of Russia will make its own calculations of required reserves based on data from the existing reporting forms.1
The Bank of Russia will no longer require excessive details regarding the distribution of reservable liabilities between the categories with different required reserve ratios established. Reservable liabilities will be included in particular categories based on the balance in a balance sheet account in general. The Bank of Russia will no longer require credit institutions to include or exclude particular liabilities in the amount of a part of the balance sheet account.
As a result of the development of trilateral exchange transactions with the engagement of a central counterparty, the regulatory burden related to the formation of required reserves shifted from credit institutions – transaction parties to the exchange financial intermediary, that is, the credit institution acting as the central counterparty. In order to eliminate this disproportion, the Bank of Russia is going to include funds raised by credit institutions being transaction parties within their exchange transactions in the reservable liabilities of credit institutions – transactions parties and, accordingly, to exclude them from the reservable liabilities of the credit institution acting as the central counterparty.
Earlier, the Bank of Russia cancelled the option to exclude long-term liabilities from reservable liabilities, which was caused by the fact that credit institutions committed a large number of errors and the terms of long-term borrowing contracts were unstable. In view of the above, the new scheme also implies that long-term reservable liabilities will not be included in a separate category.
An essential element in the course of the switch to the new procedure will be the expanded usage of the required reserve averaging mechanism. Required reserve averaging provides more opportunities to credit institutions to promptly regulate their liquidity, i.e. to quickly alter the amount of funds in their correspondent accounts with the Bank of Russia.
According to the current scheme, when banks form their required reserves, a part of these funds is manually blocked in their required reserve accounts with the Bank of Russia. While the portion of these funds is relatively small (20% of a bank’s total required reserves), a bank’s technical errors in the course of the transfer of these funds into its account with the Bank of Russia may entail fines and the prohibition to participate in the Bank of Russia’s refinancing operations.
In addition, a range of credit institutions currently do not use the maximum required reserve averaging ratio established, while others have lost the right to averaging due to their financial
1 Provided for by Bank of Russia Ordinance No. 4927-U, dated 8 October 2018, ‘On the List, Forms and Procedure for Compiling and Submitting Credit Institutions’ Reporting Forms to the Central Bank of the Russian Federation’.

66 Monetary Policy Guidelines for 2021 – 2023
4. Monetary policy operational procedure in 2020 and in 2021-2023
standing. This complicates both the formation of required reserves for credit institutions and control over their formation for the Bank of Russia.
Pursuant to the new scheme, in the course of the monthly calculation of required reserve amounts, only their averaged value will be changed, while the balances of funds in required reserve accounts will only be changed once a year.2 Moreover, credit institutions that have failed to make a sufficient contribution to their required reserve accounts will have the right to use refinancing operations, with fines for such violations remaining.
In order to increase the usage of the averaging mechanism by credit institutions, the new scheme provides for single averaging ratios established by the Bank of Russia separately for banks and non-bank financial institutions.
The Bank of Russia is also going to significantly change the procedure for calculating and imposing fines in cases where credit institutions fail to comply with reserve requirements. Specifically, a fine will be imposed for violations committed by a credit institution over a period of no more than 12 last reporting (averaging) periods. If a credit institution’s contribution to its required reserve account turns out to be insufficient when the credit institution submits updated reporting after the end of the regulation period, a fine will be calculated with account of the duration of the committed violation.
The implementation of the proposed approaches will simplify the procedure for calculating credit institutions’ required reserves, enhance the transparency of calculations, reduce the number of errors and, accordingly, fines imposed for credit institutions’ failures to comply with reserve requirements, and decrease costs incurred by credit institutions and the Bank of Russia in connection with the required reserve regulation and inspections to be conducted.
In October 2020, the Bank of Russia launched the piloting of the dedicated process for regulating the amount of required reserves in accordance with the new Bank of Russia’s Regulation ‘On Credit Institutions’ Required Reserves’. Taking part in the piloting, credit institutions will have the opportunity to assess the amount of changes in required reserves resulting from the recalculation pursuant to the new procedure, including in order to improve the quality of the forecast of their own liquidity.
2 The time of the relevant regulation period will be published on the Bank of Russia website.

Monetary Policy Guidelines for 2021 – 2023 67
APPENDIX 1 MONETARY POLICY TRANSMISSION MECHANISM IN RUSSIA
Revising the key rate, the Bank of Russia influences interest rates in the economy, the value of financial assets and the exchange rate. Price changes in the financial market impact, through a chain of economic interdependencies, demand for goods and services and, ultimately, inflation. Inflation expectations of businesses, households and financial market participants are an important driver of price movements in the economy. If economic agents have confidence in the central bank, their inflation expectations get anchored around the inflation target, fluctuating with account of the central bank’s forecasts and expectations regarding future inflation and monetary policy.
In the modern economic theory and practice, the mechanism through which monetary policy influences the economy and inflation is called ‘the transmission mechanism’; it comprises a number of channels (see the Monetary Policy Transmission Mechanism Chart). The interest rate channel is the core one in the Russian economy. Inflation expectations, lending, and foreign exchange are also essential channels of impact. Other channels of the transmission mechanism described in economic literature (balance sheet channel, welfare channel, risk-taking channel, cash flow channel) also play a certain role in the functioning of the transmission mechanism, but they are less significant.
In addition, inflation and the functioning of the monetary policy transmission mechanism are also influenced by a range of non-monetary factors, i.e. factors which the central bank cannot impact directly. They include structural and institutional specifics of the economy, technological and natural processes, including epidemics and climate changes, which influence supply and demand in individual segments of the commodity market.
When making its monetary policy decision, the Bank of Russia analyses how its impact will spread through each of the main transmission mechanism channels, relying on the available estimates of the transmission strength and speed at each stage and considering the effect of non-monetary factors.
This Appendix provides an overview of the main channels of the Bank of Russia’s monetary policy transmission mechanism. When reading this Appendix, it is essential to take into account a number of facts.
Firstly, the monetary policy transmission mechanism is based on fundamental macroeconomic and macrofinancial linkages. The set of channels through which macroeconomic policy influences market participants’ behaviour and, ultimately, inflation remains almost unchanged. The parameters of these channels are modifying slowly, as structural changes accumulate in the real and financial sectors of the national economy. Therefore, the parameters of the transmission mechanism are assessed based on the analysis of economic development over a long-term period. However, currently, shocks associated with the pandemic, instability in global markets or other factors may significantly distort the functioning of the transmission mechanism. Such distortions generally do not last long, and the impact of monetary policy on the economy prevailing before the shock restores after a while. This publication focuses on the long-term principles of the functioning of the
APPENDICES
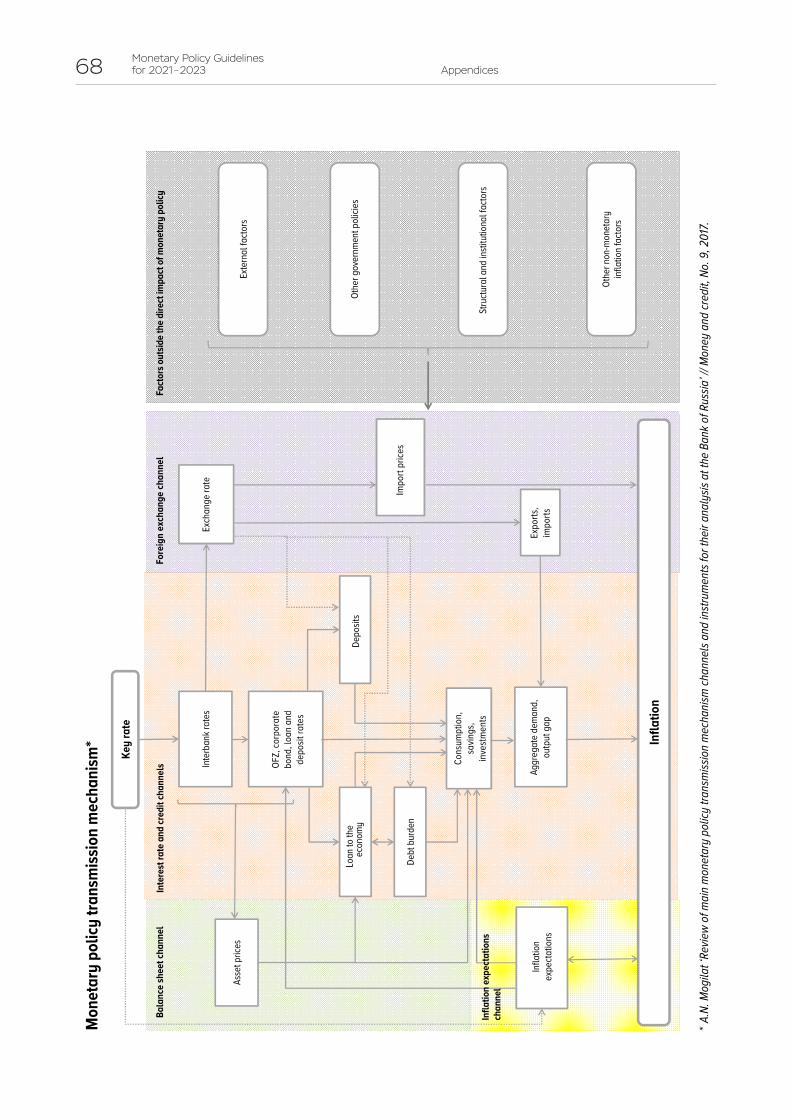
68 Monetary Policy Guidelines for 2021 – 2023 Appendices
Mon
etar
y po
licy
trans
miss
ion
mec
hani
sm*
*A.N
. Mog
ilat ‘
Revie
w of
mai
n m
onet
ary
polic
y tra
nsm
issio
n m
echa
nism
chan
nels
and
instr
umen
ts fo
r the
ir an
alys
is at
the
Bank
of R
ussia
’ // M
oney
and
cred
it, N
o. 9
, 201
7.
Loan
to th
e ec
onom
y
Key
rate
Inte
rban
k rat
es
OFZ,
corp
orat
e bo
nd, l
oan
and
depo
sit ra
tes
Asse
t pric
es
Exch
ange
rate
Debt
bur
den
Cons
umpt
ion,
sa
vings
, in
vestm
ents
Expo
rts,
impo
rtsAg
greg
ate
dem
and,
outp
ut g
ap
Infla
tion
Fore
ign
exch
ange
chan
nel
Inte
rest
rate
and
cred
it ch
anne
ls
Deposits
Bala
nce
shee
t cha
nnel
Infla
tion
expe
ctatio
ns
Othe
r gov
ernm
ent p
olici
es
Othe
r non
-mon
etar
y inf
latio
n fa
ctors
Impo
rt pr
ices
Fact
ors o
utsid
e th
e di
rect
impa
ct o
f mon
etar
y po
licy
Exte
rnal
facto
rs
Stru
ctura
l and
insti
tutio
nal f
acto
rsIn
flatio
n ex
pect
atio
ns
chan
nel

AppendicesMonetary Policy Guidelines
for 2021 – 2023 69
transmission mechanism, although, where relevant, it also specifies how these principles have changed amid instability induced by the coronavirus pandemic in 2020.
Secondly, the effect of key rate revisions on financial assets, the exchange rate and aggregate demand is largely symmetrical. Therefore, key rate increases and reductions are further discussed solely for illustrative purposes. Thus, if the text reads that a 1 pp decrease in the key rate results in a 1.5% rise in lending, this implies that a 1 pp increase in the key rate entails a 1.5% decline in lending.
Thirdly, this Appendix only provides a quantification of the direct effect of a key rate revision on the financial sector and the economy and factors out the structural effects of monetary policy. For instance, a key rate hike, with inflation expectations unchanged, causes a decrease in aggregate demand in the economy, economic activity, and inflation. However, the stabilisation of inflation at a low level owing to a key rate increase helps anchor inflation expectations. As a result, inflation risks included in loan and deposit rates go down, and these interest rates decrease over time. Investors are not wary of long-term investment, financing becomes available for projects with longer payback periods, and the implementation of such projects drives economic activity upwards.
Contrastingly, a reduction in the key rate beneath the level needed for the economy, coupled with a short-term acceleration of economic activity, may cause a steady rise in inflation and inflation expectations, which in turn would make savings and investments less attractive and impede investment demand in the long run. However, the quantitative analysis of structural effects is beyond the scope of this Appendix, and it further analyses only the direct effect of key rate revisions (a temporary decline in demand when the key rate is raised and a temporary increase in demand when the key rate is reduced). This Appendix describes qualitative characteristics of the effects of individual structural changes (mainly related to the movements of inflation expectations).
• Interest rate channel and related channels of the transmission mechanism
The interest rate channel of the transmission mechanism plays a pivotal role in the transmission of monetary policy impulses. Through this channel, key rate movements influence interest rates in all segments of the national financial system. Changes in interest rates on loans and deposits impact businesses’ and households’ propensity to borrow or save, and, accordingly, their demand for financial instruments (interest rate channel). Concurrently, changes in financial market rates influence banks’ and financial companies’ capabilities to increase lending to the economy and, thus, the supply of financial instruments (credit, balance sheet and risk-taking channels). The interaction of these processes causes changes in the amounts of financial transactions and, accordingly, aggregate demand in the economy. The first stage of these channels involves the transmission of key rate changes to interest rates on financial market instruments.
The impact of the key rate on interest rates in the economy. As noted above, monetary policy decisions influence the economy through the financial sector. At the first stage, a revision of the Bank of Russia key rate is translated into interest rate changes across all segments of the financial market. It takes from one day to several quarters, depending on a particular market segment. All else being equal, the scale of this influence is close to the actual and expected change in the key rate. In addition, longer-term interest rates are influenced not only by actual, but also by expected future decisions on monetary policy.

70 Monetary Policy Guidelines for 2021 – 2023 Appendices
First of all, a change in the key rate almost immediately leads to a similar adjustment of overnight interbank lending rates. These rates always remain close to the Bank of Russia key rate, which is supported by the operations conducted by the Bank of Russia to manage the banking sector liquidity. As a result, interbank lending rates form at the target level, regardless of the actual situation with the banking sector liquidity (see Box 9 ‘Banking sector liquidity and lending to the economy’).
Since overnight interbank lending rates play a key role in the functioning of the transmission mechanism, the Bank of Russia especially focuses on the transparency and reliability of their indicators. In 2020, the Bank of Russia modified the procedure for calculating the benchmark RUONIA rate. Striving to increase confidence in this benchmark and bring it in compliance with the international quality standards for money market benchmarks, the Bank of Russia decided to become the administrator of this benchmark rate.
A change in the overnight interbank lending rate is translated into a change in longer-term interest rates in the interbank lending market. This takes a little more time and depends not only on the actual decrease or increase in the overnight rate, but also on shifts in market participants’ expectations regarding its future movements. Banks may either place and raise overnight interbank loans on a daily basis, or carry out one longer-term transaction. Banks choose a more advantageous option; hence, if overnight rates are expected to rise, lending banks will seek a higher interest rate on long-term transactions, and vice versa. Given that the overnight interbank lending rate is closely linked to the key rate, these expectations largely depend on the Bank of Russia’s statements and forecasts, primarily, its signal regarding its future monetary policy.
Market participants’ expectations about the future key rate path have quite a strong impact on interest rate movements. For instance, if market participants expect in advance the key rate to change, longer-term interest rates may adjust even prior to the actual revision of the key rate and, accordingly, adjustments in short-term interbank lending rates. Hence, long-term interest rates may rise or decrease faster than short-terms rates. The reverse situation is also possible. If the central bank raises the key rate in response to the growing risks of inflation acceleration, market participants may consider it to be a signal that a rise in inflation owing to the prompt response of monetary policy will ultimately be less significant than it could have been otherwise, and that in the future the central bank will be able to shift to the key rate reduction faster. As a result, in response to an increase in the key rate, short-term interbank rates will change more considerably than long-term ones. Since expectations are an important factor influencing long-term interest rates, the central bank’s communication is crucial to ensure the efficient functioning of the interest rate channel of the transmission mechanism.
Along with expectations, interbank rates for various maturities are also impacted by a number of other factors (the level of uncertainty in the economy affecting the premium on longer-term loans, and the market structure, including the concentration of borrowers and lenders in its individual segments). According to the Bank of Russia’s estimates, over the period after the switch to the inflation targeting regime, it took two weeks for a 1 pp change in the overnight interbank lending rate (RUONIA) to translate into a 0.75–1 pp change in interbank lending rates for less than one year, a 0.45–0.75 pp change in interbank lending rates for one to five years, and a 0.35–0.4 pp change in interbank lending rates for over five years.

AppendicesMonetary Policy Guidelines
for 2021 – 2023 71
Banks may use interbank loans along with other financial instruments, namely bonds, loans, and deposits. Therefore, changes in interbank lending rates entail alterations in interest rates in other segments of the financial market. Movements of interbank lending rates are translated into bond yields most quickly. As the number of market participants is high and secondary trading is considerable, any new information (including changes in the current level of interbank lending rates and expectations regarding their future movements) results in almost instant changes in market demand and supply, influencing bond yields. The Bank of Russia estimates that changes in interbank lending rates lead to a similar shift in the yield curve of federal government bonds (OFZ) within one month’s time. The scale and pace of changes in corporate bond yields are comparable with the similar indicators of OFZ. Bond yields move in this manner while other factors remain unchanged (along with interbank lending rates, bond yields are also influenced by fluctuations of demand in certain investor groups, one-off large issues, shifts in the structure of the market portfolio of corporate bonds, fiscal policy and expectations regarding its changes in the future, as well as a number of other factors).
In turn, interest rates on interbank loans and bond yields impact interest rates on bank loans and deposits. This impact results from two interconnections. Firstly, choosing between different financial instruments, banks opt for those with more attractive interest rates. For instance, if bond yields go down and banks may gain higher profit by placing funds in the credit market than by purchasing bonds, they will increase their credit transactions and reduce loan rates in order to expand their market share. As a result, interest rates on loans and deposits change in the same manner as bond yields and interbank rates. Secondly, interbank interest rates and OFZ yields are widely used in the pricing of main banking products, including through the transfer curve mechanism (see Box 10 ‘Transfer curve and the shaping of interest rates on bank operations’).
Interest rates on banking products adjust somewhat longer than interest rates in the interbank lending or bond markets, which is largely explained by the specifics of decision-making on changes in conditions on standard credit and deposit products, since different banks need different time to make such decisions. In addition, short-term interest rates respond to changes in interbank lending rates faster than long-term rates, and it takes more time for banks to adjust their deposit rates, than loan rates. Among other things, this is associated with the fact that a deposit is a standard product, and its interest rate changes only after the bank takes a centralised decision to renew conditions. As a result, a 1 pp change in short-term (up to one year) interbank lending rates leads to a 0.8 pp change in interest rates on short-term loans within two to four months and a similar change in short-term deposits within six to eight months. Interest rates on long-term bank loans adjust by 0.8 pp within four to six months and on long-term deposits – within seven to nine months, if interbank lending rates for similar maturities change by 1 pp.1 The remaining 0.2 pp are translated into both credit and deposit rates during a long period of time.
Loan and deposit rates are impacted not only by the situation in the stock and money markets, but also the environment in related segments of the credit or deposit markets. For instance, setting long-term loan rates, banks factor in not only interest rates on long-term OFZ or interbank loans, but also shorter-term loan rates. Hence, when long-term expectations regarding key rate movements change, causing a shift in the ratio of interest
1 In the case of a drastic shock of money market rates, their transmission to loan and deposit rates may be faster (as it happened in late 2014–early 2015).

72 Monetary Policy Guidelines for 2021 – 2023 Appendices
rates in the short- and long-term segments of the stock and money markets, loan and deposit rates adjust to new conditions with an additional time lag. Specifically, the decisive key rate reduction in 2020 related to the pandemic changed the bond yield curve over a short period of time. Concurrently, the credit and deposit markets were adapting to the new situation slowly, with the ratio of long- and short-term interest rates in these markets adjusting weakly and unsteadily.
Along with interbank lending rates and OFZ yields, interest rates on bank loans and deposits are also influenced by other factors, including banks’ assessments of credit risks and, accordingly, risk premia on loans, inflation expectations of both banks and their clients, banks’ costs for deposit-taking and loan placement, and borrowers’ estimates of a future rise in demand in the economy.
The influence of interest rates on lending, saving, investment and consumption. Changes in interest rates in various financial market segments influence economic agents’ propensity to borrow, invest, save or consume and, accordingly, translate into the dynamics of monetary indicators, consumer and investment demand. All other circumstances being equal, lower interest rates lead to higher lending, consumption and investment, and vice versa.
The monetary policy transmission mechanism comprises several channels through which interest rates impact borrowing and saving. First, the current level of interest rates directly influences the attractiveness of loans and deposits for bank clients and, consequently, their choice between current and future consumption (the last stage of the interest rate channel of the transmission mechanism). When interest rates go down, it becomes easier to finance current expenses using borrowing, while saving and delaying expenses for the future become less attractive. Contrastingly, when interest rates rise, deposits gain attractiveness, whereas loans lose it. This channel, associated with bank clients’ demand for financial products is called the interest rate channel of the transmission mechanism.
Second, interest rate movements influence the market value of shares, bonds, real estate and other assets: when interest rates drop, asset prices go up, declining when the former rise. Moreover, the strongest and quickest response is typical of prices in the financial assets market where transactions are performed faster than in the real estate market, for instance. Since businesses and households may use their assets as collateral to secure loans, their appreciation increases businesses’ and households’ capabilities to borrow funds. This also contributes to an increase in lending when the key rate is cut, or a decline in credit activity when the key rate is raised (the balance sheet channel of the transmission mechanism, or the asset price channel). The analysis of balance sheets across a broad range of Russian real sector companies confirms the efficiency of the balance sheet channel in the Russian economy; however, in general, its effect is less significant compared to all other channels. This is associated with the fact that at the moment companies and especially households almost never use assets, prices for which depend on interest rates, as collateral in the Russian economy.
Third, changes in the market value of assets caused by interest rate movements impact not only bank clients, but also banks themselves. An increase in the value of bank assets amplifies bank capital, and banks may thus build up their lending transactions. Contrastingly, a decline in the value of bank assets induced by a rise in interest rates decreases bank capital and limits banks’ capabilities to expand lending. In the Russian banking system, this channel of the influence of interest rates on lending amounts (the narrow credit channel of

AppendicesMonetary Policy Guidelines
for 2021 – 2023 73
the transmission mechanism) is of moderate importance, as the majority of Russian banks have sufficient capital cushions (in mid-2020, the capital adequacy ratio in the Russian banking sector exceeded 12%, which is 1.5 times more compared with the minimum capital adequacy requirements). However, in individual large banks, capital adequacy may influence both the value and structure of their lending transactions. The effect of the above two channels is limited not only due to the described structural specifics of the Russian financial sectors, but also by a wide range of external factors affecting stock market participants’ sentiment. In 2020, a temporary disorganisation of the world economy instigated by the pandemic was one of such external factors.
Fourth, the current level of interest rates in the economy influences banks’ choice between higher- and lower-risk transactions (the risk-taking channel). A reduction in market rates limits banks’ interest income, which encourages banks to extend more loans, including by expanding lending to higher-risk borrowers (who are granted loans at higher interest rates).
Fifth, the functioning of the credit and risk-taking channels is associated with the effect of interest rates on the debt burden of banks’ borrowers (debt burden shows which portion of borrowers’ income is used to repay interest and debt). On the one hand, a rise in debt burden reduces borrowers’ capabilities to service their current liabilities and, accordingly, raise new loans, thus decreasing demand in the credit market. On the other hand, an increase in debt burden per borrower (and, consequently, higher risk that loan repayment will only be partial or delayed) forces banks to create additional loan loss provisions, which reduces bank capital and limits banks’ capabilities to expand lending (the credit channel). In addition, interest rates are also used in the standard models of risk analysis. If interest rates (and debt burden per borrower) go down, banks assess a borrower as more reliable and are more willing to extend loans to such a borrower (the risk-taking channel).
Along with the impact through credit activity, rising debt burden also directly affects aggregate demand in the economy, because the more borrowers spend to service their liabilities, the less amount of money they have to finance their expenses. Debt burden can be measured using the debt service ratio, or the payment-to-income ratio, where payments comprise debt to be redeemed and interest charged.
The extent and pace of the impact of changes in interest rates on debt burden depend on the structure of the credit market. In particular, the larger is the share of loans issued at a floating interest rate (for instance, linked to the key rate or interbank lending rates), the faster interest rate changes in the economy translate into a rise or reduction in borrowers’ interest expenses. In Russia, floating interest rates are gradually becoming more widespread, while still staying less popular than fixed interest rates. In the middle of 2020, loans at fixed interest rates accounted for nearly three-fourths of the corporate loan portfolio. The pace of the transmission of interest rate changes to debt burden also depends on loan maturities. The shorter is the average loan maturity and the faster earlier issued loans are replaced with new ones extended at updated interest rates, the quicker is the response of debt burden to interest rate movements. In mid-2020, loans for more than one year accounted for approximately 80% of the corporate portfolio of term loans and 90% of the retail loan portfolio. Hence, a change in market rates was relatively slowly translating into Russian borrowers’ debt burden.
74 Monetary Policy Guidelines for 2021 – 2023 Appendices
According to the Bank of Russia’s estimates, a 1 pp change in the weighted average2 interest rate on ruble and foreign currency loans leads to a co-directional change in the debt service ratio by approximately 0.1 pp for households and 0.3 pp for corporates. Considering the existing transmission lags and the term structure of lending, it takes about two years after the interest rate change for it to be fully translated into the debt burden level. There are also other factors influencing debt burden dynamics, including exchange rate fluctuations resulting in a revaluation of foreign currency liabilities. In a number of cases, these drivers’ contribution to debt burden and, consequently, credit activity may significantly exceed that of changes in interest rates. In the first place, this can considerably affect the monetary policy transmission, as well as become a source of risks to financial stability. Debt burden above critical levels, which is also confirmed by the Bank of Russia’s estimates, may entail an increase in the risks of households’ and real sector companies’ insolvency and their subsequent bankruptcy. As a result, this may deteriorate the banking sector’s financial sustainability due to the accumulation of non-performing loans and a decrease in the capital adequacy ratio. In turn, this may become a factor of a steep and long-lasting drop in credit activity, rising credit risk premia, a less efficient influence of monetary policy on the economy through interest rate changes, and – in the most adverse scenario – a source of crisis developments in the economy. Given the above factors, when assessing the impact of credit on the economy, the Bank of Russia not only focuses on the main monetary aggregates, but also considers a broad range of indicators measuring the functioning of the banking sector, including borrowers’ debt burden indicators. In addition, the Bank of Russia takes into account that credit activity may be impacted by macroprudential measures and changes in the banking regulation and, therefore, estimates the potential effects of such measures on the monetary policy transmission mechanism, as well as considers them in forecasting and decision-making.
The interaction between the above-described mechanisms influences the extent and pace of changes in credit activity resulting from interest rate movements. According to the Bank of Russia’s estimates, a rise or decline in the weighted average interest rate on ruble-denominated loans triggered by a revision of the Bank of Russia key rate causes a change in credit in the economy over the course of two years, with the largest portion of this effect manifesting itself within two quarters directly after the rate change. Supply and demand in the credit market are influenced not only by interest rates largely impacted by monetary policy, but also by a broad range of other factors. These factors include stages of the economic cycle, business climate, the quality of corporate governance, credit market participants’ sentiment and their risk appetite. In its analysis of lending trends, the Bank of Russia takes into account all the above factors.
In turn, changes in credit activity influence the dynamics of economic activity both over the horizon of up to one year and longer horizons (up to 2.5 years), including due to the related changes in debt burden. Interest rate movements changing the attractiveness of borrowing and saving for households influence the saving ratio. The higher is the saving ratio, the smaller is the portion of disposable income households spend to buy goods and services, which causes a shrinkage of consumer demand. And vice versa, when the saving ratio goes down, households’ consumption expands. The saving ratio is calculated on a net basis as the difference between investments in assets and lending growth, expressed as a fraction of household disposable income. According to the Bank of Russia’s estimates, if
2 The average rate weighted by the amount of loans for any maturities.

AppendicesMonetary Policy Guidelines
for 2021 – 2023 75
the interest rate on ruble-denominated retail loans changes, this results in a co-directional shift in the saving ratio. Over the course of the year, this effect may amplify since increasingly more people respond to a steady change in the interest rate, making decisions to save or borrow funds.
It should be noted that over the medium-term horizon the saving ratio fluctuates close to a relatively steady level depending on a set of stable factors. They include national cultural specifics (e.g. the attitude towards purchases using borrowed funds), the demographic situation, government policy, namely access to social welfare reducing the need to save, taxes on savings income, and other factors. Short-term fluctuations of the saving ratio around a steady level may be associated not only with interest rate movements, but also with other factors. Specifically, the saving ratio grows during the periods of economic turbulence because uncertainty increases and households seek to create safety cushions. Over the period of the pandemic, this factor was aggravated because opportunities to consume were limited amid the lockdown and, accordingly, households were building up their short-term savings intended to finance deferred consumption in the future.
Impacting the saving ratio, market interest rates determine the relative value of current and future consumption, and, given the current and expected income flow, influence the current level of consumer demand. Changes in market interest rates causing companies’ demand for new borrowings to rise or decline also influence investment demand dynamics. According to the Bank of Russia’s estimates, in Russia, this effect is less notable compared to the impact on consumer demand. This is largely associated with the prevailing portion of own funds used to make investments in the Russian economy. Despite the slight growth over recent decades, loans and other borrowings (including leasing companies’ funds) still account for as little as about 15% of fixed capital investment. In the future, the portion of borrowings used for funding investments (both through bank loans and bond issues) may be expected to slightly expand. However, given that changes in the structure of investment funding were sluggish in the past, this process will take a long time. Market interest rates influence consumer and investment demand, simultaneously impacting trends in demand for imports. As a result of the interaction of the above mechanisms, a reduction in interest rates drives a temporary acceleration of consumer and investment demand growth and forms a positive output gap, whereas a rise in interest rates, to the contrary, entails a negative output gap.
The impact of supply and demand dynamics on consumer prices. Changes in consumer, production and investment activity resulting from the dynamics of interest rates are translated into the adjustment of aggregate demand and supply, and, consequently, consumer prices. This is the final stage of the transmission. Fluctuations in output as a statistical result of the supply and demand interaction may amplify or weaken inflationary pressure in the economy. At the same time, in line with the global experience and the economic theory, prices can be driven only by such movements of output that deviate its level from the equilibrium, or the economy’s production capacity. Such a deviation is called an ‘output gap’ (see Box 11 ‘Concept of an economic equilibrium and deviations of key macroeconomic variables from such equilibrium (gaps)’). All else being equal, a significant positive output gap entails the risks of a steady deviation of inflation upwards from the target, while a negative gap may cause inflation to steadily deviate downwards from the target.

76 Monetary Policy Guidelines for 2021 – 2023 Appendices
According to the Bank of Russia’s estimates, a 1% output gap would change quarterly annualised inflation by 0.2–0.5 pp in the next quarter, increasing it in the case of a positive output gap and decelerating it in the case of a negative output gap. Moreover, proinflationary (disinflationary) influence is observed throughout the entire period when a positive (negative) output gap exists, and not only when it expands or shrinks.
Therefore, in accordance with the logic of the interest rate channel and related channels of the monetary policy transmission mechanism, a change in the key rate successively influences interest rates in the economy, monetary indicators and real sector indicators, translating into the adjustment of consumer price growth rates. The Bank of Russia estimates that it takes from three to six quarters for a key rate change to be fully transmitted into inflation dynamics.
• Foreign exchange channel
Changes in market interest rates driven by a revision of the Bank of Russia key rate also impact the relative attractiveness of investment in ruble- and foreign currency-denominated financial instruments. This changes foreign investors’ demand for Russian instruments and Russian investors’ demand for foreign instruments. Consequently, this makes the ruble exchange rate adjust, which in turn is an important driver of domestic price movements. This mechanism of the key rate’s influence on inflation is defined as the foreign exchange channel.
The notion of the foreign exchange channel is only used when foreign exchange movements are caused by the central bank’s operations. When the national currency weakens or strengthens due to internal and external factors which do not depend directly on the central bank, this is not related to the foreign exchange channel. Although these factors are beyond the scope of the monetary policy transmission mechanism, the Bank of Russia considers them in its analysis of the current situation, inflation forecasts and decision-making on monetary policy. The domestic foreign exchange market may also be influenced to a certain extent by the central bank’s foreign currency purchases and sales. However, under a floating exchange rate regime, these operations are not aimed at achieving any specific exchange rate or pace of its changes, but rather address individual tasks and are not intended to impact inflation or economic growth. If there are no financial stability risks, the influence of these operations on the foreign exchange market is almost neutral. The Bank of Russia considers fiscal rule-based operations in the domestic foreign exchange market as one of the assumptions when building its forecast underlying its key rate decisions.
In turn, exchange rate movements significantly impact inflation both directly through prices of imports and through a number of indirect factors. According to the Bank of Russia’s estimates, it usually takes one week for the exchange rate to respond to changes in the key rate and the overnight interbank rate. All else being equal, a 1 pp change in the overnight interbank rate leads to an approximately 0.9% adjustment of the real effective exchange rate of the ruble.3
The exchange rate directly impacts inflation in the consumer market both through prices for imported consumer goods and services and through prices for imported raw materials and components. Since the portion of imports is significant in the Russian market, the
3 The weighted average change in the real exchange rate of the ruble against the currencies of Russia’s main trading partners.

AppendicesMonetary Policy Guidelines
for 2021 – 2023 77
dynamics of the ruble exchange rate have a significant effect on inflation. In 2017–early 2020, imports accounted for no more than 39% of retail trade commodity resources (and food trade – no more than 28%).
Exchange rate movements indirectly impact inflation through the cost of exports and imports. A weakening of the national currency entails a rise in the cost of imports and reduces their relative attractiveness for domestic consumers, which expands opportunities for both import substitution and an increase in prices for domestic substitutes. The growth of the cost of exports in rubles driven by a weaker national currency creates an upward pressure on prices for those goods that are both exported and sold in the domestic market. As regards commodities, this also generates overall pressure due to costs.
According to Bank of Russia’s estimates, it takes six months after a change in the exchange rate of the ruble to have the largest effect on the dynamics of domestic prices. The latter may respond to the weakening of the ruble more significantly than to its strengthening, especially over a short-term horizon (see Box 12 ‘Estimating the exchange rate pass-through to inflation’). Among other things, such asymmetric response is associated with the specifics of the formation of households’ and businesses’ inflation expectations that are more sensitive to the weakening than to the strengthening of the ruble (see the subsection ‘Inflation expectations channel’ herein). However, it is also possible that the scale of the response of goods and service prices evens out over longer-term horizons. In this case, for example, the weakening of the ruble entails a short-term, but rather strong price response, whereas its strengthening causes a similar effect in terms of scale, but over a longer period. However, in order to obtain more reliable and robust estimates of the sensitivity of Russian inflation to exchange rate dynamics over long-term horizons, it is necessary to accumulate statistics for a longer period, during which the Russian economy would not face such serious structural shifts as in the recent past. In particular, the transition to a floating exchange rate in 2014 and inflation targeting in early 2015 were the most important of such shifts.
Furthermore, prices in various goods and service groups may respond differently to exchange rate fluctuations due to such factors as the competitiveness of Russian products in individual markets, the share of transportation costs, trading and warehousing charges in final product prices, and the level of tax burden. Specifically, prices of goods and services with a short storage or usage period respond to exchange rate movements faster and are more sensitive to the weakening of the ruble, rather than its strengthening. This is typical of food prices since the portion of imports is the highest exactly in the segment of short-life products. The response of non-food goods is more symmetrical. Long storage periods enable retailers to change prices more smoothly taking into account not only the periods of a weaker ruble, but also its subsequent adjustment upwards. According to estimates, in recent years a 1% weakening of the nominal effective exchange rate of the ruble pushes inflation upwards by no more than 0.1 pp over a six-month horizon. The response to a stronger ruble is considerably weaker. The development of import substitution, a gradual decrease in inflation expectations, and financial stability create conditions for a lower sensitivity of prices to exchange rate fluctuations. Amid the pandemic, imported services lost their significance and supplies of a range of imports became unsteady, which temporarily weakened and slowed down the impact of exchange rate movements on inflation.

78 Monetary Policy Guidelines for 2021 – 2023 Appendices
• Inflation expectations channel
The inflation expectations channel is a special channel of the transmission mechanism that supplements other channels impacting their functioning. Depending on their inflation expectations, economic agents make decisions regarding consumption, saving and investment, set interest rates, salaries and prices. The central bank may influence the dynamics of inflation expectations through its forecasts, statements and key rate decisions that are presumed to impact future inflation. More importantly, by setting an inflation target and ensuring its achievement through its monetary policy measures, the central bank creates conditions for anchoring inflation expectations to the target. The effectiveness of the central bank’s influence on inflation expectations depends on economic agents’ confidence in the central bank’s policy and the level of their financial literacy.
The Bank of Russia analyses expectations in all groups of economic agents as each of them has their specifics, thus influencing the process of pricing. In Russia, inflation expectations, especially those of businesses, have a significant effect on inflation.
Companies’ inflation expectations play a major role in shaping inflation trends since businesses set salaries and prices for products they manufacture. Enterprises need to be able to forecast future inflation to a greater extent, and have access to more information and better resources for its processing.
Households’ inflation expectations largely determine the dynamics of consumer demand, which ultimately impact goods and service prices. For instance, if households expect price growth to speed up in the future, this may expand consumer demand and make inflation rise faster and more significantly. It should be noted that households’ inflation expectations, both in global and Russian practice, may be the most adaptive, i.e. depend on previous inflation rates, as well as may be affected by other factors, including the demographic structure of the population. Households’ inflation expectations often tend to be exaggerated. When making its monetary policy decisions, the Bank of Russia takes into account these specifics, focusing on the dynamics of households’ inflation expectations, especially their substantial fluctuations.
Analysts’ and experts’ expectations may impact those of households and businesses, as well as the financial community’s expectations, resulting in respective changes in financial market indicators and interest rates. As compared with households’ and businesses’ expectations, analysts’ estimates usually rely on a more detailed analysis of a large scope of economic information and therefore may be closer to actual inflation readings.
Banks’ inflation expectations impact the dynamics of long-term credit and deposit interest rates. Thus, lower inflation expectations of the financial sector in 2016–2018 significantly contributed to the decrease in long-term loan rates. Furthermore, banks’ inflation expectations also influence their preferences regarding the maturity structure of their assets and liabilities and, accordingly, differences in the pace of the response of short- and long-term interest rates to key rate changes. For instance, in 2015–2016, amid relatively high uncertainty over future inflation dynamics, banks raised credit rates considerably faster and lowered them slower than deposit rates. Banks thus sought to be secured against unexpected inflation growth and, accordingly, a key rate increase, when they might expect a large number of depositors to transfer their funds to new deposits at higher interest rates, with loans issued earlier at relatively low rates remaining on their balance sheets.
AppendicesMonetary Policy Guidelines
for 2021 – 2023 79
Interest rates on banking operations may also be materially influenced by households’ and businesses’ inflation expectations. Specifically, households’ inflation expectations and their perception of current inflation may determine the lower bound of deposit rates which will be viewed as unreasonably low and unattractive if they drop beneath this level. When deposit rates approach this bound, they become less sensitive to a further decrease in the key rate. As a result, deposit rates and, accordingly, credit rates go down more slowly. This situation was observed in 2017–2018 H1.
The decline in inflation to its record lows and the Bank of Russia’s consistent monetary policy enhance confidence in the Bank of Russia’s policy and increase the role of its statements and forecasts in the formation of inflation expectations. Among other things, this helps businesses develop practices when they set salaries and prices for intermediate and final products with account of the inflation target. Higher confidence in monetary policy also decreases economic agents’ response to short-term price fluctuations caused, among other things, by non-monetary inflation factors when they make their decisions. As these trends strengthen and progress, long-term price stability will enhance, and the central bank will need fewer efforts to stabilise inflation if it deviates from the target due to short-term factors.
• Other channels
Along with the above-described channels of the transmission mechanism, economic literature also analyses a number of other channels, the majority of which are somehow connected with the movements of interest rates on financial instruments driven by key rate revisions. In particular, a rise and decline in the value of assets caused by interest rate changes impact not only owners’ capabilities to use these assets as collateral to secure their loans (see the subsection ‘The influence of interest rates on lending, savings, investments and consumption’ herein). An increase in the value of financial assets encourages their owners to expand their expenses, while its reduction, to the contrary, forces them to cut expenses (the welfare channel of the transmission mechanism). In recent decades, the number of financial asset owners has been growing (by mid-2020, Moscow Exchange registered over 5.3 million retail clients, which is five times more than five years ago), and the amount of investments in securities has been expanding (including unit investment funds’ units), which paves the way for this channel to become increasingly important in the future. However, bank deposits remain the dominant type of households’ savings in Russia, and deposit balances (in contrast to shares and bonds) are not revalued when market interest rates change. Securities only account for a small fraction in households’ savings. This limits the efficiency of the welfare channel in the Russian economy.
The welfare channel is closely connected with the cash flow channel which involves the redistribution of financial resources in the economy following changes in interest rates. If interest rates go down, incomes are redistributed from net creditors (persons whose investments in financial assets exceed their borrowings) to net debtors. As net creditors are usually conservative people who are less inclined to increase their expenses, this redistribution drives aggregate demand in the economy upwards.
Analysing the influence of interest rates on prices, experts sometimes speak of the cost channel. Its mechanism suggests that rising interest rates primarily affect producers’ costs (through debt servicing expenses), forcing them to simultaneously reduce output and raise

80 Monetary Policy Guidelines for 2021 – 2023 Appendices
prices for final products (while the logic of the interest rate channel implies that a rise in the key rate is expected to curb price growth). However, modern studies, including those based on Russian data, show that the impact of monetary policy on inflation through the interest rate channel is currently predominant (see Appendix 2 to the Monetary Policy Guidelines for 2019–2021).
The financial system is developing, and today’s forms of the transmission mechanism channels may considerably differ from the forms that used to prevail several decades ago. Nonetheless, in a number of studies, models and theoretical concepts developed decades ago to describe the then-modern transmission mechanism are used to analyse the monetary transmission forms that are existing at present. In particular, the credit channel of the transmission mechanism may be associated with the impact of changes in the monetary base (and, accordingly, bank refinancing and excess liquidity-absorbing operations) on credit activity and money supply. Two or three decades ago, such impact did exist, although it was gradually becoming less important. However, as the cashless payment system, the money market and the monetary policy operational procedure (see Section 4 ‘Monetary policy operational procedure in 2020 and in 2021-2023) developed, the level of the banking sector liquidity has become much less significant for the functioning of the credit market. In the current environment, credit supply is neither stimulated by bank refinancing operations carried out by the central bank, nor limited by liquidity-absorbing operations (see Box 9 ‘Banking sector liquidity and lending to the economy’).
• The effectiveness of the monetary policy transmission mechanism
The effectiveness of the transmission mechanism of monetary policy in terms of the intensity and pace of its influence on the economy and inflation largely depends on the development of the financial sector, economic agents’ confidence in financial institutions, the central bank and the national currency, and the extent of the impact of non-monetary factors on economic processes.
Financial markets and the banking system in Russia continue to evolve owing to financial resolution measures in the banking sector, a rise in households’ and businesses’ financial literacy, the extensive deployment of innovative technologies reducing market participants’ costs and speeding up transactions, the expansion of the range of financial services and better financial inclusion (see Section 1 ‘Monetary policy goals, principles and instruments’), as well as the enhancement of the monetary policy operational procedure (see Section 4 ‘Monetary policy operational procedure in 2020 and in 2021-2023’). The Bank of Russia contributes to the advancement of these processes within various types of its activity.
The steady decrease in the portion of foreign currency loans and deposits observed in recent years also helps reduce the impact of external factors on the domestic financial sector and increases the influence of domestic interest rates on decisions made by households and businesses. If this trend continues in the future, supported by, among other things, price and financial stability, it will positively impact the effectiveness of the monetary policy transmission mechanism.
Currently, the level, dynamics and volatility of prices in Russia are influenced by non-monetary factors, caused by both external economic conditions, including energy prices, and internal developments, such as inadequate competition, immature logistics infrastructure, insufficient domestic supply in certain categories of consumer products,

AppendicesMonetary Policy Guidelines
for 2021 – 2023 81
raw materials and investment goods, a shortage of qualified personnel, and heavy wear and tear of manufacturing equipment. By mitigating the impact of these factors, it is possible to reduce inflationary pressure and price volatility, which will contribute to a further decrease in inflation expectations and their sensitivity to one-off events. The influence of non-monetary factors on inflation will also weaken as a result of state authorities’ efforts implemented with the engagement of the Bank of Russia.
In 2020, the effectiveness of the monetary policy transmission mechanism was significantly affected by the pandemic-induced shocks. The shrinkage of consumer demand and its partial deferral, shifts in the structure of goods and service consumption, changes in the maturity structure of interest rates were obscuring and slowing the impact of monetary policy impulses on aggregate demand in the economy. However, this effect is short-term and will be weakening as the economy overcomes the aftermath of the pandemic.

82 Monetary Policy Guidelines for 2021 – 2023 Appendices
BOX 9 BANKING SECTOR LIQUIDITY AND LENDING TO THE ECONOMY
In 2017, the Russian banking sector faced a structural liquidity surplus. This means that credit institutions do not need any more to regularly borrow funds from the Bank of Russia to carry out their current operations. Furthermore, banks accumulate more funds in their correspondent accounts than they need to process payments and comply with the reserve requirements. Therefore, the Bank of Russia carries out operations to absorb liquidity, i.e. to raise excess liquidity from banks into deposits or to offer its own bonds. Banks’ returns on these operations are close to the Bank of Russia key rate.
As regards the banking sector’s consolidated balance sheet, it may suggest that the shift to a structural liquidity surplus caused an increase in the amount of resources banks may use to expand lending (Chart 1). Indeed, bank assets registered an expansion of liquid funds which may potentially be replaced with investments in less liquid assets – loans.
SIMPLIFIED STRUCTURE OF THE BANKING SECTOR BALANCE SHEET Chart 1
Banking sector with a structural deficit Banking sector with a structural surplus
Assets Liabilities Assets Liabilities
Loans
Deposits Loans
DepositsFunds raised from the Bank of Russia
Deposits with the Bank of Russia and OBRs
However, this assumption is not in line with the effect lending has on banks’ balance sheets. When a loan is extended, funds are credited into a borrower’s settlement account, with other bank assets remaining unchanged. Later on, the borrower may transfer these funds into an account with another bank or use them for settlements with counterparties. In this case, funds will be debited from the lending bank’s correspondent account and credited into the correspondent account with another bank, and the balance in the borrower’s account will reduce by the relevant amount in the bank’s liabilities. Nonetheless, total funds in the banking sector’s correspondent accounts (i.e. the banking sector liquidity) will remain unchanged.1
The lending bank may offset the liquidity outflow through either payments received, or operations in the interbank market (Chart 2). Therefore, making decisions on lending, banks assume that they will in any event be able to finance these operations from market sources or, at least, borrowings raised from the Bank of Russia. In other words, the supply of loans is not limited to the amount of available liquidity, whether for an individual bank or the banking sector as a whole. Moreover, if a bank has excess liquidity, it will not seek to use these funds exactly to increase lending to the real sector, since banks may always place excess liquidity in the money market or with the Bank of Russia. Hence, a liquidity inflow into banks in itself does not result in lending growth.
1 If a loan is disbursed in cash, funds are not credited into a borrower’s account; instead, the balance at the bank’s cash desk decreases. However, the borrower is most likely to spend the cash received to buy goods or services, and, therefore, the money will return to the cash desk of the same or another bank.

AppendicesMonetary Policy Guidelines
for 2021 – 2023 83
Balance sheet of Bank A Balance sheet of Bank B Banking sector’s balance sheet
Assets Liabilities Assets Liabilities Assets LiabilitiesBank A grants a loan to a borrower
+ loan + client account balance + loan + client account
balance
A borrower makes payments to a supplier
– correspondent account balance
– client account balance
+ correspondent account balance
+ client account balance
Bank A enters the interbank lending market; a transaction with Bank B
+ correspondent account balance
+ outstanding interbank loans
– correspondent account balance+ interbank loan claims
+ interbank lending claims
+ outstanding interbank loans
Result of transactions + loan + outstanding
interbank loans+ interbank loan claims
+ client account balance
+ loan + interbank lending claims
+ client account balance+ outstanding interbank loans
SCHEME OF CREDIT TRANSACTIONS Chart 2
The Bank of Russia, in turn, conducts liquidity-providing or -absorbing operations with banks in such an amount and on such terms that help maintain interbank lending rates (expressed through the RUONIA benchmark rate) close to the key rate. The Bank of Russia’s monetary policy operational procedure enables the regulator to efficiently limit the impact of changes in the banking sector liquidity on the cost of resources in the money market and, accordingly, other interest rates in the economy. This enhances the efficiency of the interest rate channel of the monetary policy transmission mechanism, which ultimately helps the Bank of Russia achieve the inflation target.

84 Monetary Policy Guidelines for 2021 – 2023 Appendices
BOX 10 TRANSFER CURVE AND THE SHAPING OF INTEREST RATES ON BANK OPERATIONS
The transfer curve is an instrument enabling a commercial bank to develop coordinated pricing for transactions in various market segments and, if necessary, flexibly adjust the structure of its balance sheet by choosing between various sources of funding and investments. A bank establishes a single internal (transfer) rate for each term. After this, in order to determine conditions for any transaction (whether a credit, deposit or stock exchange transaction) for a particular term, the bank needs only to set the transfer rate for this term and estimate costs and risks inherent in a particular transaction.
There is no single transfer curve for the banking sector. Each bank builds its own curve based on interbank lending rates, OFZ yields, or its internal estimates taking into account the specifics of the bank’s strategy. In addition, the use of the transfer curve is reasonable mostly for large banks that perform simultaneous transactions in multiple market segments and need to ensure the integrity and consistency of their interest rate policy. Small specialised banks, e.g. those operating only in deposit and credit markets, may simply establish two sets of interest rates – on asset- and liability-related transactions, without using transfer rates. However, large banks using the transfer curve in their pricing help strengthen the interconnection between financial market segments since the impact of particular significant events, including key rate changes, is simultaneously transmitted to all these segments.
For each type of asset-related transactions, the rate should not be beneath the transfer rate for the corresponding term plus costs and risk premia (both general and typical of this transaction type). Contrastingly, the rate on any type of liability-related transactions should not exceed the transfer rate less costs. As a result, regardless of the asset and liability structure, the spread between rates on asset- and liability-related transactions enables a bank to cover all necessary costs and risks and generate profit.
Key costs and risks comprise operational (transaction) costs, credit risks for individual segments and borrowers, and expenses for payments into the deposit insurance system and contributions to required reserves (see Appendix 7 to the Monetary Policy Guidelines for 2018–2020). The existence and scale of the factors that banks objectively need to consider when pricing their products explain why the difference between the level of interest rates for households and businesses and the Bank of Russia key rate is larger than that between interbank lending rates and the key rate for comparable terms.
Financial market parameters may exert additional influence on interest rates for the real sector of the economy. Such parameters include the extent of market segmentation, the level of competition for depositors’ funds or for higher-quality borrowers, the specifics of strategies pursued by individual market participants and of the financial sector regulation in general.
Changes in all the above factors may obscure the response of interest rates on deposits, loans and corporate bonds to changes in interbank lending rates and OFZ yields. Therefore, it is essential to assess this response, excluding the impact of the above factors.
It is possible to provide a number of examples from Russian practice when additional factors significantly affected the dynamics of credit and deposit rates in the economy in general or the specifics of the functioning of the transmission mechanism. In particular, in 2016–2017, banks’ cautious policy to borrower selection amid the recovery in the Russian economy pushed credit risk premia included in credit rates downwards and, accordingly, accelerated (along with expectations of a further key rate reduction) the decrease in credit market rates that were declining somewhat faster than the key rate and money market rates. In the segment of long-

AppendicesMonetary Policy Guidelines
for 2021 – 2023 85
term household loans, changes in the market structure were another driver of interest rate dynamics. The replacement of long-term consumer and car loans with lower-risk mortgage loans entailed a decline in interest rates in 2014 despite the growth of the key rate throughout the year, and afterwards their slower rise in 2015 H1 and faster decline in 2016 compared to the key rate and interbank interest rates.
As regards individual characteristics of the Russian financial sector, it is dominated by major banks in the main market segments. This affects the specifics of the functioning of the monetary policy transmission mechanism: large banks may be less responsive to various external and internal factors, including key rate changes, both because they seek to maintain their market positions and owing to a higher diversification of their assets and liabilities. Concurrently, financially resilient large banks enhance the sustainability of the banking system in general to negative developments in the external environment or the real sector, which improves the efficiency of the transmission mechanism in the long run.

86 Monetary Policy Guidelines for 2021 – 2023 Appendices
BOX 11 CONCEPT OF AN ECONOMIC EQUILIBRIUM AND DEVIATIONS OF KEY MACROECONOMIC VARIABLES FROM SUCH EQUILIBRIUM (GAPS)
In the context of macroeconomic policy, the concept of a long-run equilibrium is widely used. In a long-run equilibrium, all key economic indicators grow at a constant pace determined by fundamental factors. In other words, a long-run equilibrium implies not any specific point, but rather a steady path of economic development. When the central bank implements its monetary policy under the inflation targeting regime in a long-run equilibrium, consumer prices rise at a pace conforming to the inflation target, and economic growth rates are equal to potential and determined by the growth rate of total factor productivity and the pace of technological advancement.
The economy can remain in a long-run equilibrium for an indefinite period of time, provided there are no shocks that may trigger short-term deviations of the economy from the equilibrium. A situation where such a deviation occurs is called a ‘gap’. Such a gap may arise when economic growth rates, inflation, the exchange rate, unemployment, and other macroeconomic indicators deviate from their long-run equilibrium values. Economic publications refer to an output gap most often. Positive (proinflationary) or negative (deflationary) output gaps may entail a deviation of inflation and inflation expectations away from the target.
In an open economy, temporary deviations from an equilibrium may be associated with changes in both domestic economic conditions and the external economic environment. In turn, fundamental long-term factors may alter when affected by epidemics, natural disasters, social changes and other unpredictable shocks. A response of macroeconomic policy, including monetary policy, to shocks helps mitigate their consequences for the economy and ensures its prompt return to a long-run equilibrium.

AppendicesMonetary Policy Guidelines
for 2021 – 2023 87
BOX 12 ESTIMATING THE EXCHANGE RATE PASS-THROUGH TO INFLATION
In recent years, the conditions of the pass-through of ruble exchange rate movements to price dynamics have changed considerably. The shift to inflation targeting in 2015 was coupled with the transition to a floating exchange rate regime and changes in the mechanisms of the economy’s adjustment to exchange rate fluctuations. In addition, the decrease in prices for Russian exports and the financial and economic sanctions imposed against Russia significantly weakened the ruble in 2014–2016. The depreciation of the ruble made economic agents adjust to the new institutional conditions faster and fostered import substitution as a way to reduce the economy’s sensitivity to external factors. The introduction of a new fiscal rule in 2018 became another important mechanism smoothing the impact of fluctuations in the oil market, which is the core global market for Russia, on the Russian economy in general and the foreign exchange market in particular.
Exchange rate movements are translated into inflation through prices for imported and exported goods. Moreover, a weakening of the ruble affects inflation more significantly than its strengthening. This effect is known as asymmetry in the exchange rate pass-through to prices and is based on nominal rigidities: the economy cannot quickly change nominal parameters (primarily, wages and prices for goods and services of natural monopolies). It should be noted that the scale of the exchange rate pass-through to prices also depends on the extent of currency depreciation/appreciation since both manufacturers and consumers may respond differently to weak and strong exchange rate movements. This effect is known as the non-linearity of the pass-through and assumes that the response of prices to exchange rate fluctuations changes over time.
The Bank of Russia’s estimates confirm that the pass-through is asymmetric in the short run (within two quarters), i.e. consumer prices are less sensitive to the ruble’s strengthening than to its weakening. However, this effect does not manifest itself in the long run. The maximum (in absolute terms) short-run semi-elasticity1 of inflation associated with the depreciation of the ruble was recorded over the period of late 2014–early 2015 characterised by increased exchange rate volatility, which is in line with the previously published estimates.2 The short-run semi-elasticity of inflation related to the strengthening of the ruble is low and changes only slightly throughout the time horizon. In 2016–2018, as the economy adjusted to new conditions, inflation became considerably less sensitive to the ruble’s weakening. However, starting from 2017 H2, the elasticity of prices associated with the exchange rate somewhat increased, which might be connected with rising sanction pressure and generally higher external economic uncertainty. Over a longer-term horizon, the effect of the ruble’s strengthening accumulates, symmetrising the exchange rate pass-through to prices. The semi-elasticity of inflation related to the ruble exchange rate is within 0.1.
For analytical purposes, the Bank of Russia studies various indicators of underlying inflation, that is, steady price dynamics adjusted for one-off factors that are irrelevant for monetary policy. These factors usually comprise exchange rate fluctuations that may be caused by external developments, as well as other aspects. The above analysis of the pass-through makes it possible to estimate the inflation rate which corresponds to steady exchange rate dynamics, being one of the indicators of underlying inflation. In 2018, when the ruble weakened, this indicator demonstrates that exchange rate dynamics had proinflationary effect: annual inflation adjusted for import prices was lower than actual inflation.
1 Semi-elasticity shows a change in inflation in percentage points if the ruble exchange rate fluctuates by 1%.2 Monetary Policy Report, No. 1, March 2016.

88 Monetary Policy Guidelines for 2021 – 2023 Appendices
In 2020, the exchange rate pass-through was considerably impacted by the measures implemented to combat the spread of the coronavirus infection. Since there are almost no imported services, this reduces the scale of the exchange rate pass-through to inflation, and disruptions in supplies of a range of non-food goods extend the time lag of the said effect. Thus, the weakening of the ruble in March 2020 may affect inflation dynamics less significantly and later than in the previous cases of negative exchange rate shocks.

AppendicesMonetary Policy Guidelines
for 2021 – 2023 89
Households’ and businesses’ perception of inflation and their inflation expectations are essential for the efficient implementation of monetary policy. When economic agents’ inflation expectations are anchored at the inflation target, they do not change in response to arising one-off proinflationary or disinflationary factors. Such a situation requires no monetary policy response either. Conversely, when inflation expectations are not anchored and are sensitive to the impact of one-off factors, this creates the risk of a medium-term deviation of inflation from the target, thus requiring a monetary policy response. Hence, the Bank of Russia especially focuses on analysing economic agents’ inflation expectations and their perception of current inflation.
In recent years, both households and companies decreased their concerns over the problem of price growth. This is confirmed by the findings of a whole range of household surveys carried out by sociological services and the surveys of the Russian Union of Industrialists and Entrepreneurs (RSPP). According to data from the Levada Analytical Center, the percentage of Russians complaining about high inflation or price growth decreased in 2020 by one-third compared to 2015. InFOM’s surveys record an even more significant reduction (Chart 1). As shown by the annual survey of companies carried out by the RSPP, the portion of enterprises reporting price growth as a problem affecting their business totalled 29% in 2019 (vs 43% in 2014).1 However, Russian companies are
1 In the 2014 survey, this answer was specified as ‘Price growth’, while in the 2019 survey the wording was ‘Producer price growth’.
APPENDIX 2 HOUSEHOLDS’ AND BUSINESSES’ PERCEPTION OF INFLATION: SURVEY RESULTS
0
10
20
30
40
50
60
70
80
90
VCIOM InFOM Levada Romir
2015 2016 2017 2018 2019 2020
* The wordings of the question: VCIOM – ‘Please, choose the problems from the list you consider to be most important for the country in general’; InnFOM – ‘What are the social and economic problems in your region you have been most concerned about recently?’; Levada – ‘Which of the following problems in our society worry you the most and you consider them to be most urgent?’; Romir – ‘What are the internal problems of our society you are most concerned about?’.
Sources: VCIOM, InFOM, Levada Analytical Center, Romir Research Holding.
PERCENTAGE OF RUSSIANS COMPLAINING ABOUT INFLATION*(%)
Chart 1

90 Monetary Policy Guidelines for 2021 – 2023 Appendices
still highly concerned about rising tariffs. In 2019, 56% of respondents complained about growing tariffs as a problem affecting their business (Chart 2). This is 4 pp more than in 2018, which might be associated with the fact that tariffs for individual services for companies were rising faster due to the VAT rate increase at the beginning of the year.
The reason why households’ and businesses’ concerns about price growth decreased in recent years is that inflation was going down, stabilising close to the Bank of Russia’s target. However, inflation expectations remain unsteady and sensitive to the current perception of inflation which depends on short-term fluctuations in prices for individual goods and services.
0 10 20 30 40 50 60
Disruptions in supplies
Order cancellations or reductions
Growing prices for raw materials andservices
Rising demand
Declining demand
Labour force shortage
Shortage of working capital
Impossibility to do business
October 2020 September 2020 August 2020 July 2020 June 2020 May 2020 April 2020 March 2020 February 2020
* The survey was carried out every 1–2 weeks; the data provided are average for a month. The chart does not show the answers ‘Did not impact’ and ‘Other’.Source: Bank of Russia’s monitoring of businesses.
DISTRIBUTION OF ANSWERS TO THE QUESTION ‘HOW THE SITUATION CAUSED BY THE CORONAVIRUS IMPACTED YOUR COMPANY’S PERFORMANCE OVER THE PAST WEEK?’*(%)
Chart 3
0 10 20 30 40 50 60
Inadequate protection of property rightsUnfair competition
Corruption in government authoritiesLow quality of state management
Poor access to credit resourcesIneffective judiciary systemHigh administrative barriers
Growth of producer pricesDeclining demand
Excessive control and supervision over businessesShortage of qualified personnel
Excessively high taxesGrowth of rates
2018 2019
* Several answers may be selected; therefore, the overall value exceeds 100%.Source: RSPP’s report on business climate in Russia in 2019.
MAJOR PROBLEMS AFFECTING BUSINESS IN RUSSIA* ACCORDING TO THE RSPP SURVEY(%)
Chart 2

AppendicesMonetary Policy Guidelines
for 2021 – 2023 91
One of the signs that households’ and businesses’ inflation expectations remain unanchored was their substantial rise in March–April 2020 amid a short-term acceleration of price growth which became one of the earliest economic consequences of the coronavirus pandemic. The economic consequences of the anti-pandemic measures in 2020 H1 were the main source of pressure on producers’ costs and prices. In March–July 2020, companies monitored by the Bank of Russia reported that producer price growth along with the contraction of orders and demand were among the main consequences of the pandemic. In April, nearly one-half of respondents complained about a rise in prices for raw
29
32
43
54
60
80
0 10 20 30 40 50 60 70 80 90
Tense international situation
Hardships related to loan repayments
Ruble depreciation
Wage reductions
Job cuts at enterprises, unemployment growth
Growing prices for the majority of goods and services, inflation
* Several answers may be selected; therefore, the overall value exceeds 100%. The survey was conducted in July 2020.Source: Romir.
DISTRIBUTION OF ANSWERS TO THE QUESTION ‘WHICH ASPECTS OF THE CRISIS DO YOU CONSIDER TO BE THE KEY ONES?’(Romir survey, %)*
Chart 4
2
2
2
4
5
6
6
9
9
10
0 2 4 6 8 10 12
No stability, no confidence in the future
Trade war between the USA and China
Food crisis, threat of hunger
All information on the crisis, concerns about the future
Decline in incomes and people’s living standards, and related concerns about the future
Economic downfall and related concerns about the future
Higher unemployment and related concerns about the future
Price growth, inflation, ruble depreciation, and related concerns about the future
Oil crisis
Pandemic, quarantine, and countries’ isolation
* Those who did not see any news about the crisis did not answer this question; answers were provided by 79% of respondents. The cut-off percentage for the chart –2%. The survey was conducted in May 2020.
Source: InFOM.
DISTRIBUTION OF ANSWERS TO THE QUESTION ‘WHAT INFORMATION FROM THE NEWS ABOUT THE GLOBAL ECONOMIC CRISIS HAVE YOU BEST REMEMBERED OR HAS IMPRESSED YOU THE MOST?’(InFOM survey, %)*
Chart 5

92 Monetary Policy Guidelines for 2021 – 2023 Appendices
materials and components (Chart 3). By August, their percentage notably decreased, while still remaining high – over one-third of respondents. In September–October, it expanded again, to exceed 40%.
Faster price growth in March–April also increased households’ concerns: according to the survey by the Romir Research Holding, this acceleration was reported by 80% of respondents, which is more than the percentage of respondents complaining about job cuts, wage reductions and ruble depreciation (Chart 4). In April, during the self-isolation period, a large number of Russian regions faced an accelerated rise in prices for basic goods. According to InFOM’s surveys,2 the growth of prices for a range of food products, medicines and medical products was most notable for Russians over that period. In addition to personal experience, households’ perception of inflation was also affected by negative media coverage. According to InFOM’s survey carried out in May 2020, price growth and the oil crisis were similarly important for Russians. Compared to these topics, only news about the pandemic itself were mentioned by a larger number of respondents (Chart 5).
The Bank of Russia’s monetary policy and the mitigation of negative economic effects induced by the pandemic will help stabilise inflation and inflation expectations close to 4%.
2 http://www.cbr.ru/Collection/Collection/File/27820/inFOM_20-04.pdf.

AppendicesMonetary Policy Guidelines
for 2021 – 2023 93
The goal of the Bank of Russia’s monetary policy is to maintain inflation close to 4% on a continuous basis. However, the impact of monetary policy on the economy and inflation has a time lag. In addition, inflation may be affected by one-off factors, usually supply-side ones, the impact of which abates in a few months. If such factors arise, central banks generally do not respond to them with any monetary policy measures, provided that inflation expectations are anchored at the inflation target. Otherwise, this would amplify economic and price volatility. In this regard, it is essential to identify the effects of one-off factors on price dynamics and distinguish a steadier ‘core’ in the indicators of price movements, which would provide a better understanding to monetary authorities about medium-term price trends and the risks that underlying inflation may deviate from the target.
Rosstat’s Consumer Price Index (CPI) is the most widespread measure characterising price dynamics. These are the concepts underlying this index that are used to quantify the goal of the Bank of Russia’s monetary policy. In order to build this index, Rosstat monitors prices for over 500 goods and services on a monthly basis. Changes in their prices are weighted proportionately to the shares of respective product groups in household spending. The group of food products has the highest weight (nearly 37%), non-food goods account for 35% in consumer spending, and services – for 28%.
In order to identify underlying inflation, the Bank of Russia uses a wide set of indicators formed based on various approaches.1 These indicators comprise core inflation (calculated by Rosstat by excluding volatile and regulated components), median price growth which is a truncated measure of inflation, the inflation rate adjusted for temporary shocks and import prices that is assessed based on the econometric approach,2 and trend inflation measured through dynamic factor models.3 This is explained by the fact that the steady core of price dynamics cannot be observed directly, and the above measures are only a number of ways allowing its assessment. In order to ensure adequate analysis, it is necessary to have the entire set of indicators that may be expanded with additional indicators, if needed.
The indicator of core inflation is built and published by Rosstat. It is calculated based on the Consumer Price Index and is adjusted for the movements of prices and tariffs caused by administrative, one-off or seasonal factors. For instance, the CPI leaves out prices for strong alcoholic drinks, cigarettes and petrol including a large portion of excise duties, regulated tariffs for utility and transportation services, volatile prices for fruit and vegetables and a range of other food products (eggs, buckwheat, millet, sugar, and others). Core inflation shows the dynamics of prices for approximately 70% of the consumer basket used to calculate the CPI.
The dynamics of core inflation are generally close to inflation of all goods and services, but are more stable (Chart 1). Differences are most often caused by volatile changes in
1 Refer to Appendix 5 to the Monetary Policy Guidelines for 2018–2020.2 This indicator is built using the model described in the report ‘Studying the asymmetry and non-linearity of the exchange rate pass-through to prices’ (Working Paper Series, No. 45, 2019), http://www.cbr.ru/Content/Document/File/79935/wp_45.pdf.
3 Refer to the report ‘Evaluating the underlying inflation measures for Russia’ (Working Paper Series, No. 4, 2015), http://www.cbr.ru/Content/Document/File/16737/wps_4.pdf.
APPENDIX 3 INFLATION INDICATORS USED BY THE BANK OF RUSSIA

94 Monetary Policy Guidelines for 2021 – 2023 Appendices
prices for individual products and services that are not included into the calculation of core inflation, e.g. prices for fruit and vegetables in June 2017 and for petrol in April 2018–May 2019. In 2020 H1, the difference between inflation and core inflation was predominantly explained by the dynamics of fruit and vegetable prices.
An alternative measure that factors out volatile changes in prices for individual products and services is inflation excluding 20% of volatile components. In order to calculate this indicator, the CPI should be measured excluding goods and services demonstrating the highest price variance over recent months, which account for 20% in consumer spending. Thus, the resulting indicator, just as core inflation, factors out the dynamics of prices for individual volatile components, but the set of such components may vary every month.
In 2020, inflation dynamics excluding 20% of volatile components were much steadier compared to the CPI. This difference suggests that price fluctuations were mostly associated with products and services accounting for no more than 20% in consumer spending.
Median price growth is a key parameter characterising the distribution of goods and service price growth. The median divides the distribution of goods and service price growth into two equal parts where prices rise faster and slower than the median value. In terms of its structure, the median is weakly sensitive to price ups and downs (considerable rises and falls in prices for individual goods and services). Concurrently, general price trends typical of most goods and services remain.
This approach to the drawing of the median makes its dynamics steadier compared to the CPI. In 2020, median price growth stayed sufficiently stable, just as inflation excluding 20% of volatile components. This evidences that the observed acceleration of inflation was associated with a surge in prices only for a certain group of products and services, most of which had been also quickly rising in prices before.
Inflation adjusted for one-off shocks and imported inflation is measured based on the econometric model which makes it possible to identify the contributions of the main factors to price dynamics. Economic activity and inflation expectations form the stable component of inflation essential for the implementation of monetary policy. Imported
0
2
4
6
8
10
12
2016 2017 2018 2019 2020
Inflation Core inflationMedian Inflation adjusted for shocks and exchange rate fluctuationsInflation without 20% of volatile components Underlying inflation
Sources: Rosstat, Bank of Russia calculations.
CPI AND UNDERLYING INFLATION INDICATORS(%)
Chart 1

AppendicesMonetary Policy Guidelines
for 2021 – 2023 95
inflation and one-off shocks in local markets create temporary effects in price trends that are of low importance for achieving and maintaining medium-term price stability. The inflation rate net of the contribution of such short-term factors provides an understanding about general trends in price dynamics predominantly resulting from stable factors, which makes it useful for addressing the objectives of monetary policy.
Beginning from 2018, inflation adjusted for one-off factors and imported prices was slowing down, which reflected a decrease in inflation expectations with demand-side pressure on prices remaining moderate. However, in 2020 Q2, the growth of the stable component of inflation sped up, driven by higher inflation expectations, and was not offset by a decline in demand. This acceleration was temporary, that is, when price dynamics stabilise, inflation expectations will go down, while weak demand will continue to exert disinflationary pressure.
Underlying inflation is calculated using dynamic factor models. This approach makes it possible to identify general dynamics of a large number of economic indicators and specific shocks that are not typical of the majority of indicators.
Underlying inflation is considerably less volatile compared with the CPI. In 2020, it remains steadily below 4%, which suggests a low rate of inflation adjusted for one-off shocks.
However, the dynamics of each of these indicators have its own specific component associated not only with one-off sporadic factors, but also with long-term economic development processes. This is confirmed by the fact that the averaging of price growth indicators calculated using different methods over a horizon of several years does not result in the convergence of assessments. Hence, each of the underlying inflation indicators provides useful information on price dynamics, while the comprehensive analysis of all the indicators gives a better understanding of current price movements.
In the course of the analysis, it is critical to consider the specifics of different methods used to measure price dynamics. Thus, the analysis of medium-term price dynamics relies on price growth rates compared to the similar month of the previous year. The Bank
0
2
4
6
8
10
12
14
2016 2017 2018 2019 2020
Inflation Core inflation Median Inflation adjusted for shocks and exchange rate fluctuations
Sources: Rosstat, Bank of Russia calculations.
AVERAGE PRICE GROWTH FOR 12 MONTHS(the solid line shows average price growth for 48 months, the long-dash line – for 36 months, and the short-dash line – for 24 months)
Chart 2

96 Monetary Policy Guidelines for 2021 – 2023 Appendices
of Russia’s inflation target is expressed exactly as annual price growth. However, base effects may obscure annual inflation dynamics quite significantly. In addition, this indicator averages price growth rates observed over the last 12 months, which complicates the analysis of the current inflationary pressure.
Monthly price growth does not have the above drawbacks. Nonetheless, the movements of prices for a large number of goods and services are characterised by seasonal fluctuations, due to which it would be incorrect to compare neighbouring points in a time series. In order to factor out the impact of seasonal aspects on price dynamics, seasonal adjustment is applied.4 This makes it possible to analyse factors other than seasonality that influence prices. For instance, in May–June 2020, the rise in prices for milk products was minor (approximately 0.7% in annualised terms). However, as milk supply expands in summer, the growth of prices is always moderate and they may go down for a while. Adjusted for the impact of high milk supply typical of these months, the growth of prices for milk products in May–June is assessed at 8.0% (on average over the two months, in annualised terms).
If even after being seasonally adjusted, monthly price growth remains volatile, it is reasonable to analyse average price growth over several months (e.g. three months). This indicator is less sensitive to one-off price fluctuations and in most cases provides a very good assessment of current price dynamics.
Thus, the Bank of Russia uses a broad set of indicators to analyse price movements. The indicators showing the dynamics of prices for the stable component of the consumer basket make it possible to measure medium-term pressure on prices, adjusted for one-off and local shocks. One- and three-month inflation rates reflect current price movements which are most relevant for the analysis of inflation.
4 Refer to the Methodology for Consumer Price Index Seasonal Adjustment in the Bank of Russia, http://www.cbr.ru/Content/Document/File/108630/meth_cpi.pdf.
2019 2020
Jan Feb Mar Apr May Jun Jul Aug Sep Oct Nov Dec Jan Feb Mar Apr May Jun Jul Aug Sep
SAMoM SAAR 9.6 4.1 3.2 3.4 4.2 1.1 0.5 2.7 1.7 1.7 2.3 1.4 2.2 2.7 6.0 10.4 3.3 3.3 2.1 4.9 3.0
3MMA SAAR 7.3 7.0 5.6 3.6 3.6 2.9 1.9 1.4 1.6 2.0 1.9 1.8 2.0 2.1 3.6 6.3 6.6 5.6 2.9 3.5 3.3
YoY 5.0 5.2 5.3 5.2 5.1 4.7 4.6 4.3 4.0 3.8 3.5 3.0 2.4 2.3 2.5 3.1 3.0 3.2 3.4 3.6 3.7
Sources: Rosstat, Bank of Russia calculations.
RATIO OF VARIOUS INFLATION MEASURES(%)
Table 1

AppendicesMonetary Policy Guidelines
for 2021 – 2023 97
Beginning from the end of 2020 Q1, the development of Russia’s economy was seriously affected by the spread of the novel coronavirus infection, which is a non-monetary factor. The Government implemented a range of anti-pandemic measures (including the period of non-work days, restrictions on people’s movements, and social distancing requirements) which impacted economic development and price trends. Some of these effects were temporary, others are longer-lasting.
• Short-term effectsHigher price volatility. It was triggered by the implementation (from late March) and the
subsequent progressive easing (from mid-May) of the anti-pandemic restrictions in Russian regions and predominantly formed via two channels. The first one was associated with fluctuations in households’ demand for certain types of goods. Specifically, households’ preparations for the lockdown in late March–April entailed a surge in demand and prices for basic goods (non-perishable food products, popular remedies to prevent virus infections (garlic and lemons), hygiene items, and medicines). Contrastingly, since people’s travels and cargo transportation decreased over the period of non-work days in April–May, this pushed demand and prices for petrol down which then reversed upwards in June–July amid reviving activity (Charts 1 and 2).
The second channel driving price volatility was associated with the social distancing measures, namely the suspension and subsequent resumption of trade in non-food goods and services. Over the period of zero supply, prices were recorded as unchanged in statistics, while the resumption of trade could entail price spikes reflecting the market’s adjustment to the new conditions. This affected the pricing in the recreation and transportation markets most significantly (Chart 3). For instance, prices for sanatorium and health services remained technically unchanged in April–May when they were prohibited, but they then soared in June–August. Air fares fluctuated broadly, with air transportation to a range of destinations almost completely suspended due to the anti-pandemic restrictions.
APPENDIX 4 NON-MONETARY FACTORS OF INFLATION IN 2020: THE IMPACT OF PANDEMIC-RELATED RESTRICTIONS
-40
-20
0
20
40
60
80
100
120
140
160
-2
-1
0
1
2
3
4
5
6
7
8
2018 2019 2020
Pasta and cereals Potato, right-hand scale Lemons, right-hand scale
Sources: Rosstat, Bank of Russia calculations.
PRICES FOR CERTAIN FOOD GOODS(% growth on the previous month, SA)
Chart 1

98 Monetary Policy Guidelines for 2021 – 2023 Appendices
Lower rise in housing and utility rates than planned. Local authorities in a range of Russian regions (in 34 of 82, predominantly in the Central and Volga Federal Districts) made the decision either to postpone the indexation or to carry out only a partial indexation of housing and utility rates within the measures implemented to support households. As a result, the growth of housing and utility rates in Russia averaged as little as 2.96% in July (which is 0.35 pp more than in June). When the indexation is completed in the subsequent months, this will increase the annual growth of these rates. In September, their growth equalled 3.30%.
Proinflationary pressure of a weaker ruble at the end of 2020 Q1. In March, the exchange rate of the ruble drastically declined, which was induced by the weakening of the global economy resulting from the anti-pandemic restrictions implemented in a large number of countries worldwide. The weaker ruble entailed an upward pressure on prices for imported final and intermediate goods, which
-1
0
1
2
3
4
5
6
7
-0.5
0.0
0.5
1.0
1.5
2.0
2.5
3.0
3.5
2018 2019 2020
Medical goods Washing and cleaning products Petroleum products, right-hand scale
Sources: Rosstat, Bank of Russia calculations.
PRICES FOR CERTAIN NON-FOOD GOODS (% growth on the previous month, SA)
Chart 2
-6
-4
-2
0
2
4
6
8
2018 2019 2020
Sanatorium and health services Transport
Sources: Rosstat, Bank of Russia calculations.
PRICES FOR SANATORIUM AND HEALTH SERVICES(% growth on the previous month, SA)
Chart 3

AppendicesMonetary Policy Guidelines
for 2021 – 2023 99
was amplified by the surge in households’ demand. As a result, consumer prices for food imports and durable non-food goods (household appliances and electronics) rose considerably (Chart 4). In April–May, the restrictions affecting non-food retail curbed price growth. In June–August, as retailers recovered their operation and demand revived, the rise in prices resumed in this group of goods.
Another channel through which the weaker ruble impacted prices was the growth of export parity prices which pushed prices for grain and grain products upwards. Proinflationary risks were limited owing to the measures implemented by the Russian Government, namely the increase in export duties and grain interventions.
The above temporary effects caused by non-monetary reasons did not entail any direct risks for the medium-term inflation forecast. Therefore, the Bank of Russia took no monetary policy measures in response.
• Long-term effectsSecondary proinflationary consequences of short-term effects. Price spikes, pressure of the
weaker ruble on costs and prices, and generally higher uncertainty had longer-lasting secondary consequences affecting the process of the implementation of monetary policy. In February–April 2020, they increased households’ and businesses’ inflation expectations which are adaptive in nature. Inflation expectations remained elevated, which the Bank of Russia took into account when making its key rate decisions.
Disinflationary pressure of weaker economic activity and demand. However, as regards the implementation of monetary policy, the main factor was the downfall in economic activity instigated by the anti-pandemic restrictions in Russia and worldwide. Demand contracted faster and more considerably compared to the decline in potential output characterised by higher inertia, which entailed a deep negative output gap and strong disinflationary pressure. This created the risk of a steady and notable deviation of inflation downwards from the target over the medium-term horizon. In these conditions, the Bank of Russia significantly eased its monetary policy in order to maintain price stability. The Bank of Russia forecasts that given the monetary policy pursued, annual inflation will equal 3.9–4.2% in 2020, 3.5–4.0% in 2021, and will stay close to 4% further on.
-1.5
-1.0
-0.5
0.0
0.5
1.0
1.5
2.0
2.5
2018 2019 2020
Tea and coffee TV and radio goods Cars
Sources: Rosstat, Bank of Russia calculations.
PRICES FOR CERTAIN GOODS(% growth on the previous month, SA)
Chart 4

100 Monetary Policy Guidelines for 2021 – 2023 Appendices
APPENDIX 5 WORLD EXPERIENCE OF MONETARY POLICY AND MACROECONOMIC POLICY IN GENERAL: CRISIS RESOLUTION APPROACHES
By the outbreak of the crisis induced by the coronavirus pandemic, governments and central banks both in advanced and emerging market economies were already experiencing a decline in GDP growth, low or decelerating inflation, and a low level of interest rates. These conditions significantly differed from the situation of the 2008 crisis characterised by the overheating of a large number of economies and high inflation and interest rates. Since the initial conditions were different, this implies that governments and central banks had different possibilities to implement anti-crisis measures. The slump in the global economy in early 2020 forced governments and central banks to introduce a broad range of measures despite limited space for pursuing accommodative macroeconomic policy.
The initial conditions also varied across countries. After the global financial crisis, advanced economies had not yet shifted from accommodative to neutral monetary policy: interest rates in the economy remained low with inflation beneath central banks’ targets, while regulators’ balance sheets either had started only shortly before to contract after the completion of the quantitative easing programmes or were still expanding. Accommodative fiscal policy materially increased government liabilities. Emerging market economies were either easing their monetary policies, or had rather seriously eased their policies earlier in order to boost domestic demand amid the slowdown in the global economy and decelerating inflation. Despite lowering inflation, inflation expectations in a large number of emerging market economies were still rather volatile. Their exchange rates also remained highly sensitive to capital flows, with the ratio of the exchange rate pass-through to inflation staying high. The majority of emerging market economies had small public debt; however, since interest rates in the economy were still high, this created an extra burden for their budgets in terms of debt servicing. Hence, the main restrictions in advanced economies were zero or even negative interest rates and large public debt, while in emerging market economies those were high debt servicing costs, declining budget revenues, capital outflow risks, national currency depreciation, and inflation acceleration. Depending on the economy’s sensitivity to these risks, the opportunities of emerging market economies for easing their policies also differed.
In response to the current crisis, governments and central banks in both advanced and emerging market economies were to stabilise financial markets, maintain confidence in the financial system, and reduce the contraction of domestic demand. In order to address these tasks, central banks and governments implemented packages of monetary, macroprudential and fiscal policy measures. The scale and the set of these measures varied depending on the structural specifics of the economy, the maturity of financial markets, and macroeconomic policy restrictions in a particular country. As regards monetary policy, emerging market economies considerably decreased their policy rates, while advanced economies where space for rate cuts was much more limited either expanded or launched asset purchase programmes. Both advanced and emerging market economies granted substantial amounts of loans to financial institutions. In addition, the role of central banks as the lenders of last resort strengthened significantly. In the area of macroprudential policy, regulators eased their requirements for banks both in general and in relation to

AppendicesMonetary Policy Guidelines
for 2021 – 2023 101
transactions in particular sectors, which enhanced the efficiency of the adopted monetary policy measures, among other benefits. As regards fiscal policy, in the first place governments launched and continue to implement large-scale measures intended to financially support households and businesses.
Monetary policyIn March 2020, central banks in the majority of advanced economies responded to the
situation with reductions in their policy rates to the zero level (0.00–0.25% per annum). At the beginning of 2020, a range of advanced economies held their policy rates in the range of 0.75–1.75% per annum, which enabled central banks to decrease them to the level from 0.65 pp (the UK) to 1.5 pp (the USA, Canada, and Norway). The policy rates of the ECB, the Bank of Japan, the Swiss National Bank, and the Danish National Bank already equalled zero or were negative. Due to limited room for easing monetary policy through conventional measures, the central banks of the USA, the euro area, the UK, Japan, and Switzerland resumed or expanded their asset purchase programmes. Moreover, the amounts of purchases materially rose compared to 2008. In March–June 2020, the balance sheets of the four largest central banks of advanced economies1 increased by 8–15% of GDP, reaching 35–120% of GDP.2 Asset purchase programmes were launched for the first time by Canada, New Zealand and Australia where policy rates had already been cut almost to zero. In order to improve the efficiency of quantitative easing, a number of central banks carried out or started purchases with an established target value of yields on government bonds.
Having more space for policy easing through conventional measures, the central banks of emerging market economies cut their policy rates more significantly than advanced economies’ central banks. As in advanced economies, the central banks whose policy rates had been initially high (South Africa, Brazil, Argentina, Mexico, and Turkey) decreased them more notably. On the other hand, policy easing was progressive so as to prevent an excessive capital outflow and national currency depreciation. Despite more space for cutting their policy rates and no risks of steady deflation, a number of central banks in emerging market economies launched asset purchase programmes they had never used before. A small group of countries started and still continue asset purchases since their policy rates had already achieved the lower bound (Israel, Poland, Chile, and South Korea). However, in the majority of cases, central banks in emerging market economies purchased assets when they needed to provide emergency aid to maintain the operation of the financial sector. For this reason, the amounts of asset purchases in emerging market economies are lower than in advanced economies, totalling 0.2–2.8% of GDP. Furthermore, the central banks of emerging market economies generally purchased only government bonds, while central banks in advanced economies bought not only government bonds, but also municipal and corporate bonds. Speaking of asset purchases in emerging market economies, it is worth highlighting the case of Bank Indonesia that temporarily switched to the monetary financing of the state budget.
Amid the decline in the interbank market, an essential anti-crisis measure to support the banking sector was the expansion of its capabilities to raise liquidity. In the conditions of decreasing confidence in the market, higher demand for liquidity driven by the precautionary
1 The US Fed, the ECB, the Bank of Japan, and the Bank of England.2 In 2008, the balance sheets expanded by 4–11% of GDP, to 8–25% of GDP, over the first few months after the launch of the programmes.

102 Monetary Policy Guidelines for 2021 – 2023 Appendices
motive, and market participants’ elevated concerns about possibilities to raise funds in the future, including for long periods, central banks sought to guarantee access to liquidity for all financially sustainable counterparties. As in advance economies, central banks in emerging market economies employed the earlier used monetary policy instruments to support liquidity, including auctions and standing facilities. Moreover, a range of central banks managing liquidity within the interest rate corridor system (India, Indonesia, Korea, Mexico, and South Africa) started to satisfy requests at auctions in full amount, which contributed to the formation of the current liquidity surplus. In addition, a large number of central banks (specifically, in Australia, Canada, Israel, Brazil, Chile, South Korea, and Turkey) expanded their lists of collateral eligible for refinancing operations. A range of countries (Brazil, Indonesia, Croatia, and Iceland) decreased their required reserve ratios in order to release additional liquidity. Furthermore, a large number of central banks launched new instruments to supply liquidity for long terms or extended the terms of the existing instruments. In particular, the central banks of Indonesia and New Zealand are ready to provide liquidity for up to one year,3 and the central banks of Hungary and Croatia – for up to five years.
In addition to liquidity management operations, central banks in both advanced and emerging market economies launched programmes to supply liquidity for long terms in order to support lending to the economy, including a number of hardest-hit sectors, as well as programmes aimed at maintaining employment. These programmes differ substantially in terms of their parameters (the form of engagement of the central bank, time periods, distribution of risks, liquidity provision conditions) depending on the objectives of these programmes and the specifics of financial markets in particular countries. Thus, central banks in advanced economies predominantly purchase securities issues from non-financial companies conforming to a set of criteria (e.g. classified as SMEs). Specifically, these programmes are implemented by the US Fed, the Bank of England, and the ECB. Another form to support lending to the non-financial sector is to extend long-term central bank loans at preferential interest rates. In this case, credit institutions receiving these funds are obliged to comply with certain requirements. Namely, they may be required to maintain or expand their portfolios of loans disbursed to the non-financial sector or its individual segments (e.g. SMEs). Such loans are issued by the central banks of the UK, Chile, Israel, and New Zealand. If credit institutions breach requirements for raising funds, they will be obliged to repay loans ahead of schedule or at increased interest rates. Moreover, a range of central banks (the USA and Brazil) are implementing programmes to maintain employment, granting specialised preferential loans to pay salaries to employees who would otherwise be fired. Such programmes are generally implemented with the engagement of governments providing funds and taking risks, whether in full or in part.
A large number of central banks in emerging market economies (e.g. Brazil, Chile, Turkey, and South Africa) conducted foreign currency sales in the market in order to stabilise their exchange rates. In addition, a range of countries (e.g. Brazil, Korea, and Mexico) started to provide liquidity to banks in foreign currency, including through US Fed’s swap lines. Interventions in the foreign exchange market and the supply of foreign currency liquidity to banks helped decrease the debt burden on households, businesses and banks having foreign currency liabilities and limit the acceleration of inflation through the foreign exchange channel. However, the amounts of these operations were relatively small.
3 Excluding lending support schemes.
AppendicesMonetary Policy Guidelines
for 2021 – 2023 103
Generally, reserves shrank by no more than 10% over the three months after the outbreak of the crisis, except in Turkey where foreign currency reserves contracted by more than 40% over the period March–July 2020.
Anti-crisis financial regulation measuresSince economic activity was suspended as part of the anti-coronavirus measures, the
global crisis of 2020 deteriorated the parameters of the financial sector. This problem was observed in both economies where the financial sector accounts for a considerable portion in gross output and economies with emerging financial markets.
The situation in the real sector directly affected the financial industry. Macroprudential policy easing and a range of other financial regulation easing measures were an important part of the anti-crisis policy package. The progressive development of macroprudential instruments worldwide over the last decade enabled the banking sector to accumulate significant capital and liquidity buffers.
Therefore, although involving large economic losses, the current crisis is fundamentally different from the 2008 crisis since the financial sector has become much more sustainable. After a long period of the regulatory tightening, the easing helped the financial sector adjust to the crisis faster and expand its opportunities to provide lending to the economy.
In the first place, economies implemented countercyclical measures to maintain the pre-crisis assessments of the quality of bank assets. Specifically, the majority of economies (e.g. in the euro area, the UK, Canada, Japan, as well as India, Indonesia, and South Korea) made relevant decisions on how to assess the quality of assets directly affected by the anti-coronavirus measures. In addition, a range of economies (including the USA and the euro area) made the decision to ease IFRS 9 requirements considerably influencing the estimate of potential losses on loans and other assets.
Economies also took measures to maintain banks’ capital so as to help them adjust as fast as possible to the current situation and enable them to promptly recover credit activity. Thus, countercyclical capital buffers were released in full or in part (in all countries where this instrument had been earlier in place). Moreover, a large number of economies released permanent supervisory capital buffers: capital conservation buffers (e.g. in Brazil) and/or systemic importance buffers (e.g. in Canada and the Netherlands).
To enhance the effectiveness of the above measures, state authorities issued the requirements or recommendations for banks to limit dividend payouts and incentives to top managers and refrain from share buybacks. These measures were rather extensively used in a large number of countries, but were not implemented in a range of major economies (namely, in the USA).
As financial flows are volatile, the easing of liquidity requirements may support credit activity to a certain extent. To this end, central banks lowered liquidity ratios and required reserve ratios. Specifically, a range of emerging market economies eased their requirements for liquidity coverage ratios (namely, South Africa, provided that irrevocable credit lines remain effective to comply with this ratio) and lowered reserve requirements in foreign currencies (Indonesia).
In addition, a number of countries postponed the implementation of new standards or individual scheduled measures tightening their financial regulation (e.g. the USA, the UK, Japan, Singapore, Brazil, and Mexico). This also helped financial institutions focus on their adjustment to the new environment.

104 Monetary Policy Guidelines for 2021 – 2023 Appendices
Overall, the regulatory easing considerably improved the financial sector’s capacity to cover its current expenses and expand credit activity.
Fiscal policyGovernments implemented a package of fiscal stimulus measures in order to support
households and businesses, their solvency, and aggregate demand in the economy. Over the period of the current crisis, fiscal stimulus became especially important since the lockdown was preventing the monetary policy and regulatory easing from translating into the economy at a normal pace.
Direct transfers from the budget was the key channel to aid households. Support to companies was provided both in the form of budget-funded measures, including non-repayable subsidies from the budget and tax payment reductions/postponements, and extra-budgetary measures, such as lending and government guarantees on loans. Moreover, all the above measures help boost demand in the economy.
The amounts of government aid during this crisis significantly vary across countries, depending on the scope of monetary policy capabilities, space for fiscal policy easing, and the tightness of the anti-coronavirus restrictions imposed by governments. Countries with small public debt, low public debt servicing costs and high sovereign ratings enjoy more opportunities for fiscal policy easing, without disrupting the sustainability of public finance.
Since advanced economies have limited space for cutting their policy rates, incur low public debt servicing costs and are subject to tight restrictions on social contacts, the governments of these countries have scheduled large-scale fiscal stimulus programmes amounting to approximately 20% of GDP on average. The epidemiological situation in emerging market economies was better, and therefore their need in building up government expenditures was lower. In addition, although their public debt is relatively small, high public debt servicing costs limit their capabilities for fiscal easing. For raw commodity exporters, the slump in oil prices inducing budget contraction was another factor limiting their capacities to increase government expenditures and reduce taxes. Thus, due to the actual needs and existing restrictions, fiscal stimulus in emerging market economies was not as large-scale as in advanced economies, averaging about 5% of GDP.
ConclusionsMeasures implemented by countries worldwide are generally intended to successfully
weather the crisis. Nonetheless, experts4 consider that there is a range of challenges that may arise in macroeconomic policy in the near future. In order to adequately respond to these challenges, central banks and governments need to implement such policies that would mitigate long-term negative consequences of the coronavirus-induced crisis.
As the global economy comes out of recession, central banks will be shifting from accommodative to neutral monetary policy. However, if they attempt to return to normal policy too early, this may slow down economic recovery, while delayed normalisation of policy may trigger the risks of high inflation and bubbles in financial markets. This implies that it is crucial to select the proper time for switching from accommodative to neutral policy, and the strategy of this process should be clear and transparent.
The decline in banks’ profits, credit ratings, capitalisation and liquidity limits their capabilities to expand lending needed for prompt economic recovery. Furthermore, if borrowers’ quality continues to deteriorate, banks will need new buffers. In this regard,
4 BIS Annual Report (2020).

AppendicesMonetary Policy Guidelines
for 2021 – 2023 105
central banks should find a balance between measures to support current lending and maintain the banking system’s capitalisation and liquidity and measures intended to create safety cushions for banks.
Anti-crisis measures have expectedly increased public debt. It is absolutely critical for governments to maintain the sustainability of the public sector. Therefore, if necessary, they should be ready to substantially adjust their policies in order to secure the stability of public finance. The expansion of public debt makes governments seek to reduce the real debt burden through low rates and high inflation, which may affect central banks’ independence and, accordingly, confidence in their monetary policies. In order to prevent such a scenario, central banks shall pursue their monetary policies in strict compliance with their mandates.
Instrument type Measure
Advanced economies Emerging market economies
USA Euro area Japan UK Canada Australia Switzerland Brazil China India Indonesia Korea Mexico Thailand South
AfricaKey rate Key rate decrease + + + + + + + + + + + +
Lending / liquidity
General provision of liquidity + + + + + + + + + + + + + +
Specialised loans + + + + + + + + + + + +
Asset purchases / sales
Government bonds + + + + + + + + + + +Promissory notes + + + + + +Corporate bonds + + + + + + +Other private assets + + +
FX swaps / interventions
US dollar lines (swaps) + + + + + + + + +
Foreign exchange interventions + + + + + +
Prudential ratios and regulation
Capital requirements + + + + + + + + + + + + + +
Liquidity requirements + + + + + + + + + + + + + + +
Restrictions on payments + + + + + + + + + + + +
Market functioning + + + + + + + + + + + + + + +Source: BIS Annual Report (2020).
CENTRAL BANKS’ KEY MEASURES Table 1
Advanced economies Emerging market economies
USA Japan Germany France Italy Spain UK Brazil China India Korea Mexico South Africa
Healthcare support measures + + + + + + + + + + + + +Household support measuresDirect funds transfers + + + + + + + + + + + +Other measures to support employed people’s incomes + + + + + + + + + + + +Measures to subsidise wages + + + + + + + + + + +Tax reductions + + + + + + + + +Tax postponement + + + + + + + + +Measures to support businessesTax postponement + + + + + + + + + + + + +Measures to support liquidity + + + + + + + + + + + + +Tax reductions + + + + + + + + + + +Direct funds transfers + + + + + + +Source: BIS Annual Report (2020).
FISCAL STIMULUS MEASURES Table 2
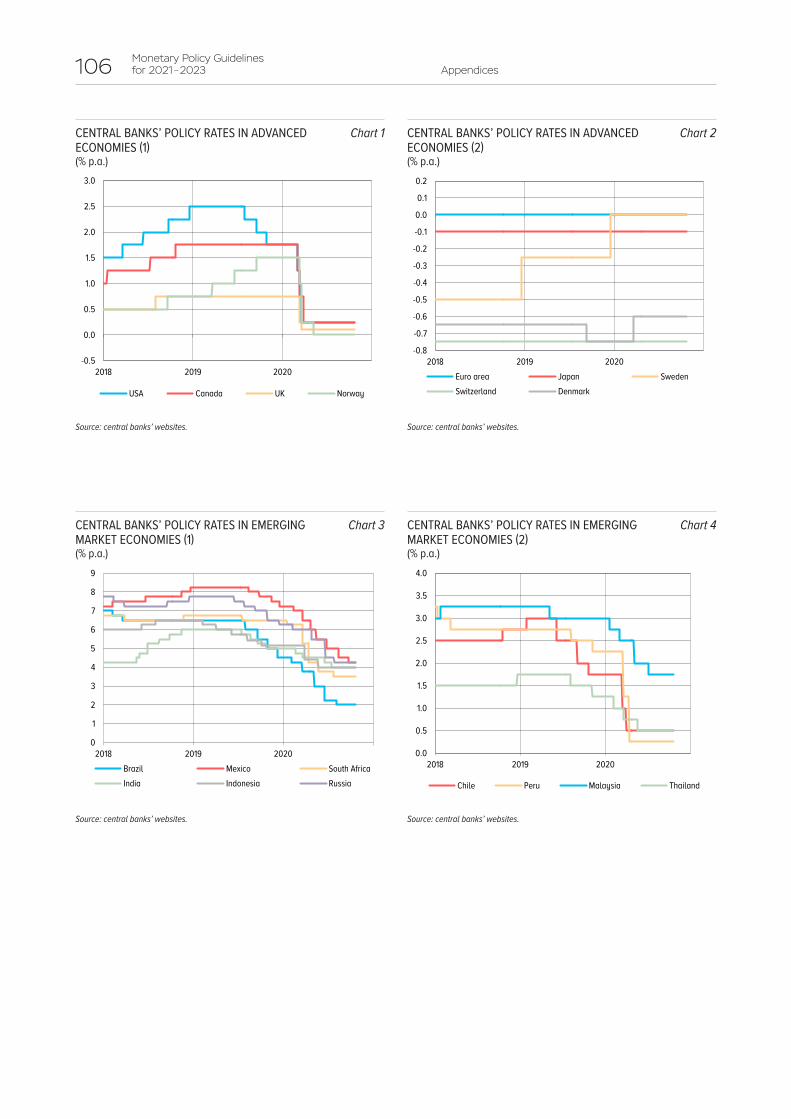
106 Monetary Policy Guidelines for 2021 – 2023 Appendices
-0.5
0.0
0.5
1.0
1.5
2.0
2.5
3.0
2018 2019 2020
USA Canada UK Norway
Source: central banks’ websites.
CENTRAL BANKS’ POLICY RATES IN ADVANCED ECONOMIES (1)(% p.a.)
Chart 1
-0.8
-0.7
-0.6
-0.5
-0.4
-0.3
-0.2
-0.1
0.0
0.1
0.2
2018 2019 2020Euro area Japan SwedenSwitzerland Denmark
Source: central banks’ websites.
CENTRAL BANKS’ POLICY RATES IN ADVANCED ECONOMIES (2)(% p.a.)
Chart 2
0
1
2
3
4
5
6
7
8
9
2018 2019 2020Brazil Mexico South AfricaIndia Indonesia Russia
Source: central banks’ websites.
CENTRAL BANKS’ POLICY RATES IN EMERGING MARKET ECONOMIES (1)(% p.a.)
Chart 3
0.0
0.5
1.0
1.5
2.0
2.5
3.0
3.5
4.0
2018 2019 2020
Chile Peru Malaysia Thailand
Source: central banks’ websites.
CENTRAL BANKS’ POLICY RATES IN EMERGING MARKET ECONOMIES (2)(% p.a.)
Chart 4

AppendicesMonetary Policy Guidelines
for 2021 – 2023 107
0
5
10
15
20
25
2008 2010 2012 2014 2016 2018 2020
Bank of England ECB US Fed Bank of Japan
Source: central banks’ websites.
G4 CENTRAL BANKS’ BALANCE SHEETS(trillions of US dollars)
Chart 7
0
20
40
60
80
100
120
140
160
2008 2010 2012 2014 2016 2018 2020
US Fed ECB Bank of Japan Bank of England
Source: central banks’ websites.
G4 CENTRAL BANKS’ BALANCE SHEETS(% of GDP)
Chart 8
90
100
110
120
130
140
2018 2019 2020
JP Morgan EM Currency Index (inv.) DXY Index
Note: the Dollar Index (DXY) is measured against a basket of six major currencies (EUR, JPY, GBP, CAD, SEK, CHF); the JP Morgan EM Currency Index tracks the movement of 10 major EM currencies against USD.Sources: Reuters, Bank of Russia calculations.
US DOLLAR EXCHANGE RATE AGAINST ADVANCED AND EMERGING MARKET ECONOMIES’ CURRENCIES(100 = 01.01.2018)
Chart 5
0
1
2
3
4
2018 2019 2020
EMEs Advanced economies
Note: advanced economies: USA, Euro area, Japan, UK, Canada, Norway, Sweden, Denmark, Switzerland; emerging market economies: Brazil, Mexico, South Africa, India, Indonesia, Russia, Chile, Peru, Malaysia, Thailand.Sources: Reuters, Bank of Russia calculations.
INFLATION IN ADVANCED AND EMERGING MARKET ECONOMIES (MEDIAN ACROSS GROUPS OF ECONOMIES)(% YoY)
Chart 6

108 Monetary Policy Guidelines for 2021 – 2023 Appendices
0
5
10
15
20
25
30
35
Turk
ey
Mexic
o
India
Russ
ia
Saud
i Ara
bia
Indon
esia
Fran
ce
Arge
ntina
Kore
a
Spain Ita
ly
China
Sout
h Afri
ca
Cana
da UK
Braz
il
Austr
alia
Germ
any
Japa
n
USA
Low
incom
eco
untri
es
Emer
ging m
arke
tec
onom
ies G20
Adva
nced
econ
omies
Extra costs and deferred income Capital infusions, loans, asset purchases, and guarantees
Source: IMF Fiscal Monitor Database (October 2020).
ANTI-CRISIS BUDGETARY MEASURES(% of GDP)
Chart 10
0
2
4
6
8
10
12
Low-income
economies
Oil-exporting
EMEs
EMEs Non-oil-exporting
EMEs
G20 Advancedeconomies
Quasi-fiscal measures Guarantees Provision of capital and loans Healthcare Other sectors
Note: red – budgetary measures; blue – extra-budgetary measures.Source: IMF Fiscal Monitor Database (October 2020).
ANTI-CRISIS BUDGETARY MEASURES (% of GDP)
Chart 9

AppendicesMonetary Policy Guidelines
for 2021 – 2023 109
Inflation targeting countries in the global economyThe portion of countries targeting inflation, whether de jure or de facto, in global GDP
reaches 75%. In 1989, New Zealand became the first country to switch to the inflation targeting regime. Since then, a large number of central banks started to gradually shift to the inflation targeting regime because the existing monetary policy regimes were not sufficiently effective. According to the IMF’s data, 41 countries have adopted this policy to date. They account for over one-third of world GDP. The USA and the euro area do not officially apply the inflation targeting regime; however, they strive to achieve inflation targets established in their medium-term plans.
Implementing the inflation targeting regime, central banks set inflation targets taking into account the structural and institutional specifics of the economy. In advanced economies, inflation, inflation expectations and interest rates are generally slightly lower than in emerging market economies. Hence, the target range in advanced economies is from 2% to 2.5%, while in emerging market economises this figure generally varies from 2.5% to 5%. It may take several years to bring high inflation down to the target level; therefore, some central banks set interim annual targets for inflation at the initial stage. Although inflation targeting countries’ policies may rely on common approaches, such aspects of the regime as the existence or absence of a range of permissible deviations and a particular time horizon for bringing inflation back to the target, and the specifics of the operational mechanisms may differ depending on the maturity of financial markets and the overall
APPENDIX 6 INFLATION AND MONETARY POLICY: CROSS-COUNTRY COMPARISONS
05
101520253035404550
1990
1992
1994
1996
1998
2000
2002
2004
2006
2008
2010
2012
2014
2016
2018
Advanced economiesEmerging market economies
Sources: IMF Annual Report on Exchange Arrangements and Exchange Restrictions (AREAER), 2018.
INFLATION-TARGETING ECONOMIES(number of countries)
Chart 1
0
10
20
30
40
50
60
70
80
1990
1992
1994
1996
1998
2000
2002
2004
2006
2008
2010
2012
2014
2016
2018
Advanced economiesEmerging market economiesEuro area*USA*
* The USA established its inflation target in 2012, and the euro area – after the introduction of the euro in 1999.
Sources: IMF Annual Report on Exchange Arrangements and Exchange Restrictions (AREAER), 2018.
PROPORTION OF INFLATION-TARGETING COUNTRIES IN WORLD ECONOMY(share in the global GDP, %)
Chart 2

110 Monetary Policy Guidelines for 2021 – 2023 Appendices
specifics of a particular country. For instance, the monetary policy strategy adopted by the USA in August 2020 may be characterised as a subtype of the inflation targeting regime having more flexible periods for bringing inflation back to the target.
Achievement of inflation targets after the implementation of the inflation targeting regime
During certain periods, inflation may significantly deviate from the target, but ultimately the majority of central banks targeting inflation are capable to successfully decrease inflation, with the deviations of inflation and inflation expectations remaining within the range of permissible fluctuations. In 82% of advanced economies the average deviation of inflation from the target after the launch of this regime is less than 1 pp, and in 83% of emerging market economies this deviation is below 2 pp.1 The variance in the levels of macroeconomic indicators is higher in economies with higher inflation targets. In countries with a long experience in inflation targeting (such as the UK, Canada, or Australia), inflation remains on average close to the target, which confirms that their monetary policies have been efficient.
1 Russia established the inflation target of 4% to be achieved by 2017. Beginning from mid-2017, the average deviation of inflation from 4% equals -0.7 pp.
South Korea (2)Norway (2)UK (2)Sweden (2)Japan (2)Israel (1-3)Thailand (1–3)New Zealand (2 ± 1)Canada (2 ± 1)Czech Republic (2 ± 1)Peru (2 ± 1)
Australia (2–3)Romania (2.5 ± 1)Poland (2.5 ± 1)Iceland (2.5 ± 1)
Albania (3)Georgia (3)Colombia (3 ± 1) Mexico (3 ± 1)Chile (3 ± 1)Hungary (3 ± 1)Philippines (3 ± 1)Costa Rica (3 ± 1)Indonesia (3 ± 1)Serbia (3 ± 1.5)
Russia (4)South Africa (3-6)Guatemala (4 ± 1)Dominican Republic (4 ± 1)Brazil (4± 1.5)Armenia (4 ± 1.5)India (4 ± 2)Paraguay (4 ± 2)
Uganda (5)Kazakhstan (4–6)Jamaica (4-6)Uruguay (3-7)Ukraine (5 ± 1)Moldova (5 ± 1.5)Turkey (5 ± 2)Ghana (8 ± 2)
1.5 2.5 3.5 4.5 5.0 5.5 6.04.03.02.0
Sources: IMF, central banks’ websites.
INFLATION TARGETS IN INFLATION-TARGETING ECONOMIES (%)
Chart 3

AppendicesMonetary Policy Guidelines
for 2021 – 2023 111
04812162024283236
-8
-4
0
4
8
New
Zeala
nd UK
Austr
alia
Cana
da
Czec
h Rep
ublic
Media
n
Norw
ay
Sout
h Kor
ea
Swed
en
Japa
n
Year
s
Devia
tion,
pp
Years passed after the implementation of the inflation targeting regime
Maximum
Upper quartile**
Lower quartile**
Minimum
* Highlighted is the established range of maximum permissible deviations in the above economies (+/- 1 pp).** The lower quartile is the value that has 25% of values in the sample below or equalling it. The upper quartile is the value that has 75% of values in the sample below or equalling it.Sources: IMF, central banks’ websites, Bank of Russia calculations.
ACHIEVEMENT OF INFLATION TARGETS AFTER THE IMPLEMENTATION OF THE INFLATION TARGETING REGIME IN ADVANCED ECONOMIES*
Chart 4
024681012141618202224262830323436
-10-8-6-4-202468
1012141618202224262830
Ukra
ine
Turk
ey
Indon
esia
Braz
il
Hung
ary
Serb
ia
Mexic
o
Sout
h Afri
ca
Kaza
khsta
n
Media
n
Arme
nia
Geor
gia
Israe
l
Thail
and
Polan
d
India
Chile
Philip
pines
Russ
ia
Alba
nia
Year
s
Devia
tion,
pp
Years passed after the implementation of the inflation targeting regime
MaximumUpper quartile**
Lower quartile** Minimum
* Highlighted is the established range of maximum permissible deviations in the above economies (+/- 2 pp).** The lower quartile is the value that has 25% of values in the sample below or equalling it. The upper quartile is the value that has 75% of values in the sample below or equalling it.Sources: IMF, central banks’ websites, Bank of Russia calculations.
ACHIEVEMENT OF INFLATION TARGETS AFTER THE IMPLEMENTATION OF THE INFLATION TARGETING REGIME IN EMERGING MARKET ECONOMIES*
Chart 5
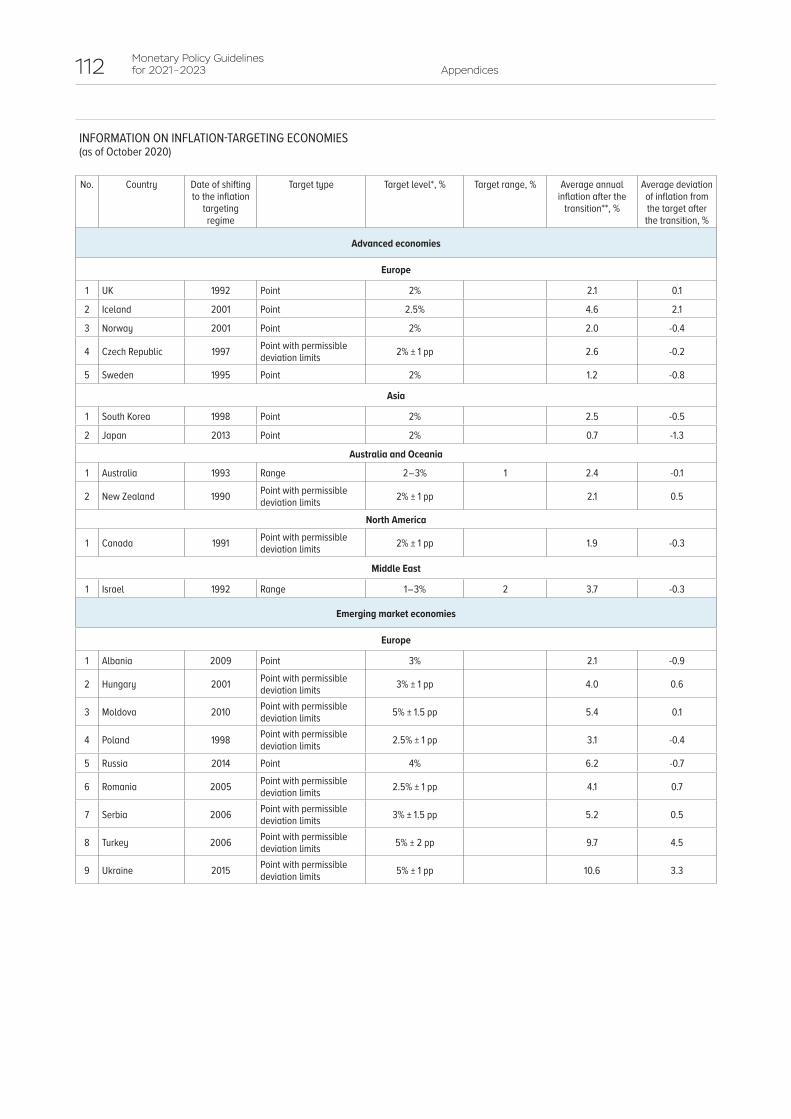
112 Monetary Policy Guidelines for 2021 – 2023 Appendices
No. Country Date of shifting to the inflation
targeting regime
Target type Target level*, % Target range, % Average annual inflation after the
transition**, %
Average deviation of inflation from the target after the transition, %
Advanced economies
Europe
1 UK 1992 Point 2% 2.1 0.1
2 Iceland 2001 Point 2.5% 4.6 2.1
3 Norway 2001 Point 2% 2.0 -0.4
4 Czech Republic 1997 Point with permissible deviation limits 2% ± 1 pp 2.6 -0.2
5 Sweden 1995 Point 2% 1.2 -0.8
Asia
1 South Korea 1998 Point 2% 2.5 -0.5
2 Japan 2013 Point 2% 0.7 -1.3
Australia and Oceania
1 Australia 1993 Range 2 – 3% 1 2.4 -0.1
2 New Zealand 1990 Point with permissible deviation limits 2% ± 1 pp 2.1 0.5
North America
1 Canada 1991 Point with permissible deviation limits 2% ± 1 pp 1.9 -0.3
Middle East
1 Israel 1992 Range 1 – 3% 2 3.7 -0.3
Emerging market economies
Europe
1 Albania 2009 Point 3% 2.1 -0.9
2 Hungary 2001 Point with permissible deviation limits 3% ± 1 pp 4.0 0.6
3 Moldova 2010 Point with permissible deviation limits 5% ± 1.5 pp 5.4 0.1
4 Poland 1998 Point with permissible deviation limits 2.5% ± 1 pp 3.1 -0.4
5 Russia 2014 Point 4% 6.2 -0.7
6 Romania 2005 Point with permissible deviation limits 2.5% ± 1 pp 4.1 0.7
7 Serbia 2006 Point with permissible deviation limits 3% ± 1.5 pp 5.2 0.5
8 Turkey 2006 Point with permissible deviation limits 5% ± 2 pp 9.7 4.5
9 Ukraine 2015 Point with permissible deviation limits 5% ± 1 pp 10.6 3.3
INFORMATION ON INFLATION-TARGETING ECONOMIES (as of October 2020)

AppendicesMonetary Policy Guidelines
for 2021 – 2023 113
No. Country Date of shifting to the inflation
targeting regime
Target type Target level*, % Target range, % Average annual inflation after the
transition**, %
Average deviation of inflation from the target after the transition, %
Latin America and the Caribbean
1 Brazil 1999 Point with permissible deviation limits
2020: 4.00% ± 1.5 pp
6.2 1.52021: 3.75% ± 1.5 pp
2022: 3.50% ± 1.5 pp
2 Guatemala 2005 Point with permissible deviation limits 4% ± 1 pp 5.0 0.3
3 Dominican Republic 2012 Point with permissible deviation limits 4% ± 1 pp 2.6 -1.4
4 Colombia 1999 Point with permissible deviation limits 3% ± 1 pp 4.9 0.6
5 Costa Rica 2018 Point with permissible deviation limits 3% ± 1 pp 1.5 -1.5
6 Mexico 2001 Point with permissible deviation limits 3% ± 1 pp 4.3 1.3
7 Paraguay 2011 Point with permissible deviation limits 4% ± 2 pp 3.8 -0.5
8 Peru 2002 Point with permissible deviation limits 2% ± 1% 2.6 0.5
9 Uruguay 2002 Range 3 – 7% 4 7.7 2.5
10 Chile 1999 Point with permissible deviation limits 3% ± 1 pp 3.2 0.1
11 Jamaica 2018 Range 4 – 6% 2 4.0 -1.0
Asia
1 India 2016 Point with permissible deviation limits 4% ± 2 pp 5.9 0.3
2 Indonesia 2005 Point with permissible deviation limits 3% ± 1 pp 6.0 1.2
3 Thailand 2000 Range 1 – 3% 2 1.9 0.1
4 Philippines 2002 Point with permissible deviation limits 3% ± 1 pp 3.7 -0.3
Middle East and Central Asia
1 Armenia 2006 Point with permissible deviation limits 4.0% ± 1.5 pp 3.5 -0.4
2 Georgia 2009 Point 3% 3.7 -1.3
3 Kazakhstan 2015 Range 4 – 6% for 2019-2021 2 8.1 2.0
Africa
1 Ghana 2002 Point with permissible deviation limits 8% ± 2 pp 12.9 4.8
2 Uganda 2011 Point 5% 6.4 1.4
3 South Africa 2000 Range 3 – 6% 3 5.6 1.1
* As of 2020, unless indicated otherwise. Inflation target is usually set for the overall consumer price index. Countries may use its value in the current month against the same month of the previous year, as of the end of the year, or its average over the year.
** Average annual inflation is calculated by the month.Sources: IMF, central banks’ websites.

114 Monetary Policy Guidelines for 2021 – 2023 Appendices
The main goal of the Bank of Russia’s monetary policy is to maintain inflation close to 4%, and its operational objective is to keep overnight interest rates in the money market close to the key rate. This strategy does not provide for setting and delivery on quantitative benchmarks for any other economic indicators, including monetary ones. In addition to the banking sector liquidity forecast, the Bank of Russia calculates the monetary programme indicators. They supplement the forecast indicators which the Bank of Russia takes into account when elaborating and implementing its monetary policy.
• Entry 1 ‘Monetary base (narrow definition)’
Growth of the monetary base over the forecast horizon will be favoured by an increase in the amount of cash in circulation. Beginning from the middle of March 2020, amid the anti-pandemic restrictions, both individuals and corporates increased their demand for cash, which entailed a significant rise in the amount of cash. The baseline and proinflationary scenarios assume that as economic activity goes back to normal, demand for cash will gradually return to its pre-pandemic levels. Accordingly, the amount of cash in circulation will be decreasing. However, this process will shift to 2021. The disinflationary and risk scenarios do not assume that cash will return to banks, if the epidemiological situation
APPENDIX 7 MONETARY PROGRAMME
2020 (actual)
Baseline scenario
2021 2022 2023 2024
1. Monetary base (narrow definition) 11.0 13.1 12.9 13.3 13.6
1.1. Cash in circulation (outside the Bank of Russia) 10.6 12.6 12.4 12.7 12.9
1.2. Required reserves** 0.4 0.4 0.5 0.6 0.7
2. Net international reserves 33.8 32.8 33.0 33.2 34.4
–– billions of US dollars*** 546 530 533 536 556
3. Net domestic assets -22.8 -19.8 -20.1 -19.9 -20.8
3.1. Net credit to general government -11.7 -10.1 -10.0 -10.1 -11.3
3.2. Net credit to banks -4.9 -3.5 -3.9 -3.6 -3.4
3.2.1. Gross credit to banks 0.7 1.0 0.5 0.5 0.5
3.2.1.1. Claims on refinancing operations**** 0.2 0.7 0.2 0.2 0.2
3.2.2. Bank correspondent accounts with the Bank of Russia -2.6 -2.6 -2.9 -3.2 -3.5
3.2.3. Bank deposits with the Bank of Russia and coupon OBRs -3.0 -1.9 -1.5 -1.0 -0.5
3.3. Other net non-classified assets***** -6.2 -6.2 -6.2 -6.2 -6.2* Monetary programme indicators calculated at a fixed exchange rate are based on the official exchange rate of the ruble as of the beginning of 2020.
** Credit institutions’ required reserves deposited with the Bank of Russia in ruble-denominated accounts (do not include funds in credit institutions’ correspondent accounts with the Bank of Russia taken into account within the required reserve averaging procedure).
*** The forecast change in net international reserves takes into account operations of Russia’s Ministry of Finance to buy (sell) foreign currency in the domestic foreign exchange market, as well as the reduction in banks’ liabilities on Bank of Russia refinancing operations in foreign currency, operations of the Bank of Russia to buy monetary gold, and settlements within USD/RUB sell/buy FX swaps.
**** Include claims on refinancing operations in rubles, including secured loans, repos and the Bank of Russia’s USD/RUB and EUR/RUB buy/sell FX swaps.***** Include operations with the use of funds of the state corporation Deposit Insurance Agency and the Fund of Banking Sector Consolidation, the Bank of Russia’s net interest
expenses, and foreign exchange revaluation of assets.Source: Bank of Russia.
FORECAST KEY INDICATORS FOR MONETARY AUTHORITIES’ ACCOUNTS (MONETARY PROGRAMME INDICATORS)*(trillions of rubles, unless indicated otherwise)
Table 1

AppendicesMonetary Policy Guidelines
for 2021 – 2023 115
worsens over the forecast horizon. In 2022–2023, the amount of cash in circulation will gradually get closer to its conventional path and will grow in line with nominal GDP trends. However, as before, the dynamics of this indicator over the forecast horizon will be substantially restrained by a wider use of cashless payments.
The amount of required reserves for ruble-denominated liabilities held in special accounts with the Bank of Russia will not change considerably. A slight increase in this indicator during the period in question is explained by the overall growth of money supply in the national definition.
• Entry 2 ‘Net international reserves’
The implementation of fiscal policy has a substantial impact on the monetary programme indicators. Changes in Entry 2 ‘Net international reserves’ will be predominantly promoted by the foreign exchange operations of Russia’s Ministry of Finance. Moreover, foreign currency sales are expected to take place in October–December 2020 in addition to the standard fiscal rule-based operations. The net amount of the above additional foreign currency sales will total 185 billion rubles, which corresponds to the amount needed to offset the foreign currency sales related to the Sberbank deal, the fiscal rule-based foreign currency purchases suspended in 2018 and in March–April 2020, and the proactive foreign currency sales carried out under the fiscal rule in March–April. Additionally, beginning from 26 October 2020, the Bank of Russia started to carry out foreign currency sales in the domestic market related to the deal with Aeroflot’s shares in the amount of 50 billion rubles.
FORECAST KEY INDICATORS FOR MONETARY AUTHORITIES’ ACCOUNTS (MONETARY PROGRAMME INDICATORS )*(trillions of rubles, unless indicated otherwise)
Table 2
2020 (actual)
Proinflationary scenario Disinflationary scenario Risk scenario
2021 2022 2023 2024 2021 2022 2023 2024 2021 2022 2023 2024
1. Monetary base (narrow definition) 11.0 13.3 13.1 13.5 13.8 13.3 13.3 13.7 14.0 13.3 13.5 14.0 14.3
1.1. Cash in circulation (outside the Bank of Russia) 10.6 12.8 12.6 12.9 13.1 12.8 12.8 13.1 13.3 12.8 13.0 13.4 13.6
1.2. Required reserves** 0.4 0.4 0.5 0.6 0.7 0.4 0.5 0.6 0.7 0.4 0.5 0.6 0.7
2. Net international reserves 33.8 32.8 31.9 31.2 31.2 32.8 31.7 31.1 31.7 32.8 30.6 28.7 27.8
––billions of US dollars*** 546 530 515 504 504 530 513 503 512 530 494 464 449
3. Net domestic assets -22.8 -19.6 -18.8 -17.7 -17.4 -19.6 -18.4 -17.5 -17.7 -19.6 -17.1 -14.8 -13.5
3.1. Net credit to general government -11.7 -10.1 -8.9 -8.1 -8.0 -10.1 -8.8 -8.1 -8.5 -10.1 -7.6 -5.7 -4.7
3.2. Net credit to banks -4.9 -3.3 -3.7 -3.4 -3.2 -3.3 -3.5 -3.2 -3.0 -3.3 -3.3 -2.9 -2.7
3.2.1. Gross credit to banks 0.7 1.0 0.5 0.5 0.5 1.0 0.5 0.5 0.6 1.0 0.5 0.5 0.8
3.2.1.1. Claims on refinancing operations**** 0.2 0.7 0.2 0.2 0.2 0.7 0.2 0.2 0.2 0.7 0.2 0.2 0.43.2.2. Bank correspondent accounts with the Bank of Russia -2.6 -2.6 -2.9 -3.2 -3.5 -2.6 -2.9 -3.1 -3.4 -2.6 -2.8 -3.0 -3.3
3.2.3. Bank deposits with the Bank of Russia and coupon OBRs -3.0 -1.7 -1.3 -0.8 -0.2 -1.7 -1.1 -0.6 -0.2 -1.7 -1.0 -0.4 -0.2
3.3. Other net non-classified assets***** -6.2 -6.2 -6.2 -6.2 -6.2 -6.2 -6.2 -6.2 -6.2 -6.2 -6.2 -6.2 -6.2* Monetary programme indicators calculated at a fixed exchange rate are based on the official exchange rate of the ruble as of the beginning of 2020.
** Credit institutions’ required reserves deposited with the Bank of Russia in ruble-denominated accounts (do not include funds in credit institutions’ correspondent accounts with the Bank of Russia taken into account within the required reserve averaging procedure).
*** The forecast change in net international reserves takes into account operations of Russia’s Ministry of Finance to buy (sell) foreign currency in the domestic foreign exchange market, as well as the reduction in banks’ liabilities on Bank of Russia refinancing operations in foreign currency, operations of the Bank of Russia to buy monetary gold, and settlements within USD/RUB sell/buy FX swaps.
**** Include claims on refinancing operations in rubles, including secured loans, repos and the Bank of Russia’s USD/RUB and EUR/RUB buy/sell FX swaps.***** Include operations with the use of funds of the state corporation Deposit Insurance Agency and the Fund of Banking Sector Consolidation, the Bank of Russia’s net interest
expenses, and foreign exchange revaluation of assets.Source: Bank of Russia.

116 Monetary Policy Guidelines for 2021 – 2023 Appendices
Changes in international reserves will also be driven by the Bank of Russia’s monetary gold purchases.
Allowing for various assumptions regarding oil prices in the Bank of Russia’s scenarios, net international reserves may total 28–34 trillion rubles as of the end of 2023.
• Entry 3 ‘Net domestic assets’
Entry 3.1 ‘Net credit to general government’Entry 3.1 ‘Net credit to general government’ comprises fiscal rule-based foreign currency
purchases, the transfer of earnings from the acquisition of the equity stake in Sberbank by the Russian Government, as well as the subsequent transfer to the budget of the Bank of Russia’s profit from this deal and the use of these funds to finance expenses.
Entry 3.2 ‘Net credit to banks’The value in Entry 3.2 ‘Net credit to banks’ will remain negative throughout the period
under review.The decrease in Entry 3.2.1 ‘Gross credit to banks’ is associated with the operations
involving the assignment of claims on Sberbank’s subordinated loan from the Bank of Russia to the Government of the Russian Federation. Entry 3.2.1.1 ‘Claims on refinancing operations’ includes banks’ operations to raise funds for longer terms, including through the use of specialised refinancing facilities. The calculation of the monetary programme for 2020 relies on the assumption that claims may increase within the limit for loans granted to support small and medium-sized enterprises. As this programme is terminated, debt on liquidity-providing operations is expected to decrease by a comparable amount.
In January–September 2020, average balances in credit institutions’ correspondent accounts with the Bank of Russia totalled 2.6 trillion rubles. As before, the forecast for the value in Entry 3.2.2 ‘Bank correspondent accounts with the Bank of Russia’ implies a uniform trajectory of required reserves averaging by credit institutions and an increase in this indicator during the period under review proportionally to growth in money supply in the national definition.
Entry 3.2.3 ‘Bank deposits with the Bank of Russia and coupon OBRs’ is a balancing component of the monetary programme in the context of the liquidity surplus. As a result of changes in other items of the monetary programme, the amount of deposits and coupon OBR placements may reach 0.2–0.5 trillion rubles by the end of 2023. The effect of the fiscal rule mechanism reduces the net impact of budget operations on the overall level of the banking sector liquidity. However, the outflow of funds due to the growing amount of cash in circulation causes a gradual decrease in the liquidity surplus.
Entry 3.3 ‘Other net non-classified assets’Over the forecast horizon, changes in Entry 3.3 are mainly associated with the payment
of interest by the Bank of Russia on standard liquidity-absorbing operations. They are partially offset through the repayment of funds provided by the Bank of Russia earlier for the financial rehabilitation of individual banks.

AppendicesMonetary Policy Guidelines
for 2021 – 2023 117
APPENDIX 8 CALENDAR OF KEY RATE DECISIONS FOR 2021
Date Event
12 February 2021
Bank of Russia Board of Directors’ key rate meeting
Press release on the key rate with the medium-term macroeconomic forecast (press release is to be published at 13:30 Moscow time)
Press conference by the Governor of the Bank of Russia (press conference is to start at 15:00 Moscow time)
20 February 2021 Release of the Monetary Policy Report
19 March 2021
Bank of Russia Board of Directors’ key rate meeting
Press release on the key rate (press release is to be published at 13:30 Moscow time)
Press conference by the Governor of the Bank of Russia (press conference is to start at 15:00 Moscow time)
23 April 2021
Bank of Russia Board of Directors’ key rate meeting
Press release on the key rate with the medium-term macroeconomic forecast (press release is to be published at 13:30 Moscow time)
Press conference by the Governor of the Bank of Russia (press conference is to start at 15:00 Moscow time)
4 May 2021 Release of the Monetary Policy Report
11 June 2021
Bank of Russia Board of Directors’ key rate meeting
Press release on the key rate (press release is to be published at 13:30 Moscow time)
Press conference by the Governor of the Bank of Russia (press conference is to start at 15:00 Moscow time)
23 July 2021
Bank of Russia Board of Directors’ key rate meeting
Press release on the key rate with the medium-term macroeconomic forecast (press release is to be published at 13:30 Moscow time)
Press conference by the Governor of the Bank of Russia (press conference is to start at 15:00 Moscow time)
2 August 2021 Release of the Monetary Policy Report
10 September 2021
Bank of Russia Board of Directors’ key rate meeting
Press release on the key rate (press release is to be published at 13:30 Moscow time)
Press conference by the Governor of the Bank of Russia (press conference is to start at 15:00 Moscow time)
22 October 2021
Bank of Russia Board of Directors’ key rate meeting
Press release on the key rate with the medium-term macroeconomic forecast (press release is to be published at 13:30 Moscow time)
Press conference by the Governor of the Bank of Russia (press conference is to start at 15:00 Moscow time)
1 November 2021 Release of the Monetary Policy Report
17 December 2021
Bank of Russia Board of Directors’ key rate meeting
Press release on the key rate (press release is to be published at 13:30 Moscow time)
Press conference by the Governor of the Bank of Russia(press conference is to start at 15:00 Moscow time)

118 Monetary Policy Guidelines for 2021 – 2023 Appendices
APPENDIX 9 MACROECONOMIC AND BANKING STATISTICS
Inflation Core inflation Growth of food prices
Growth of food prices1
Growth of fruit and vegetable
prices
Growth of non-food prices
Growth of prices for non-
food goods, excluding
petrol2
Growth of service prices
2016January 9.8 10.7 9.2 10.2 2.0 10.9 11.4 9.0February 8.1 8.9 6.4 7.8 -2.7 9.5 9.9 8.5March 7.3 8.0 5.2 6.7 -5.1 8.8 9.0 8.2April 7.3 7.6 5.3 6.3 -1.6 8.5 8.7 8.4May 7.3 7.5 5.6 6.4 0.0 8.4 8.5 8.4June 7.5 7.5 6.2 6.5 4.1 8.5 8.6 7.9July 7.2 7.4 6.5 6.7 4.2 8.4 8.7 6.5August 6.9 7.0 6.5 6.7 5.3 8.1 8.4 5.5September 6.4 6.7 5.9 6.4 1.9 7.5 7.9 5.6October 6.1 6.4 5.7 6.1 1.5 7.0 7.4 5.4November 5.8 6.2 5.2 6.0 -1.5 6.7 7.1 5.3December 5.4 6.0 4.6 6.0 -6.8 6.5 6.8 4.9
2017January 5.0 5.5 4.2 5.7 -7.6 6.3 6.4 4.4February 4.6 5.0 3.7 5.4 -9.0 5.7 5.7 4.3March 4.3 4.5 3.5 4.9 -7.6 5.1 5.0 4.2April 4.1 4.1 3.6 4.5 -3.1 4.7 4.6 4.1May 4.1 3.8 3.9 4.0 2.0 4.4 4.2 4.0June 4.4 3.5 4.8 3.8 11.6 4.0 3.8 4.1July 3.9 3.3 3.8 3.4 6.9 3.7 3.5 4.1August 3.3 3.0 2.6 2.9 -0.8 3.4 3.2 4.1September 3.0 2.8 2.0 2.5 -2.4 3.1 2.8 4.2October 2.7 2.5 1.6 2.0 -2.2 2.8 2.6 4.2November 2.5 2.3 1.1 1.4 -2.5 2.7 2.4 4.3December 2.5 2.1 1.1 1.0 1.2 2.8 2.3 4.4
2018January 2.2 1.9 0.7 0.8 -0.1 2.6 2.1 3.9February 2.2 1.9 0.9 0.7 2.4 2.5 2.1 3.7March 2.4 1.8 1.3 0.6 6.4 2.4 2.1 3.9April 2.4 1.9 1.1 0.7 4.2 2.7 2.3 4.0May 2.4 2.0 0.4 0.8 -2.8 3.4 2.5 4.0June 2.3 2.3 -0.2 1.1 -9.8 3.7 2.7 4.1July 2.5 2.4 0.5 1.4 -6.7 3.8 2.8 3.8August 3.1 2.6 1.9 1.7 3.3 3.8 2.9 3.7September 3.4 2.8 2.5 2.5 3.4 4.0 3.1 3.8October 3.5 3.1 2.7 3.1 -0.5 4.1 3.2 4.0November 3.8 3.4 3.5 3.8 0.8 4.2 3.3 3.8December 4.3 3.7 4.7 4.6 4.9 4.1 3.4 3.9
2019January 5.0 4.1 5.5 5.2 7.3 4.5 3.8 5.0February 5.2 4.4 5.9 5.5 9.1 4.6 4.0 5.1March 5.3 4.6 5.9 5.7 6.9 4.7 4.1 5.1April 5.2 4.6 5.9 5.8 6.1 4.5 4.0 5.0May 5.1 4.7 6.4 5.9 9.7 3.8 3.9 5.1June 4.7 4.6 5.5 5.6 4.2 3.5 3.8 4.9July 4.6 4.5 5.5 5.5 5.4 3.6 3.8 4.5August 4.3 4.3 5.0 5.4 1.3 3.5 3.7 4.4September 4.0 4.0 4.6 4.9 1.8 3.3 3.5 4.0October 3.8 3.7 4.2 4.3 3.4 3.2 3.4 3.8November 3.5 3.5 3.7 3.8 2.8 3.1 3.2 3.9December 3.0 3.2 2.6 3.1 -2.1 3.0 3.1 3.8
2020January 2.4 2.7 2.0 2.6 -2.6 2.5 2.7 2.8February 2.3 2.4 1.8 2.3 -2.2 2.3 2.4 3.0March 2.5 2.6 2.2 2.7 -1.9 2.5 2.7 3.0April 3.1 2.9 3.5 3.4 4.0 2.8 3.0 2.9May 3.0 2.9 3.3 3.5 1.6 2.8 3.0 3.0June 3.2 2.9 3.9 3.6 6.0 3.0 3.2 2.5July 3.4 3.0 4.2 3.7 7.6 3.1 3.3 2.5August 3.6 3.1 4.3 3.7 9.8 3.4 3.5 2.7September 3.7 3.3 4.4 3.8 9.8 3.8 4.0 2.5
1 Excluding fruit and vegetables.2 Bank of Russia’s assessment.Sources: Rosstat, Bank of Russia calculations.
CONSUMER PRICES BY GROUP OF GOODS AND SERVICES (% change on the same month of the previous year)
Table 1

AppendicesMonetary Policy Guidelines
for 2021 – 2023 119
Inflation Core inflation Growth of food prices
Growth of food prices1
Growth of fruit and vegetable
prices
Growth of non-food prices
Growth of prices for non-
food goods, excluding
petrol2
Growth of service prices
2016January 0.7 0.7 0.4 0.4 -0.2 0.7 0.8 1.0February 0.5 0.7 0.3 0.5 -1.5 0.8 0.9 0.5March 0.4 0.6 0.2 0.6 -3.1 0.8 0.8 0.3April 0.5 0.5 0.4 0.6 -0.9 0.6 0.6 0.4May 0.4 0.5 0.4 0.6 -1.5 0.5 0.5 0.4June 0.4 0.5 0.4 0.5 -0.9 0.6 0.5 0.3July 0.5 0.4 0.6 0.6 0.0 0.5 0.4 0.3August 0.5 0.4 0.7 0.5 2.5 0.4 0.4 0.4September 0.4 0.4 0.5 0.4 1.0 0.4 0.5 0.3October 0.4 0.4 0.5 0.4 1.9 0.4 0.4 0.2November 0.3 0.4 0.3 0.4 -0.5 0.3 0.4 0.3December 0.1 0.3 -0.1 0.4 -3.8 0.3 0.3 0.2
2017January 0.3 0.2 0.1 0.2 -0.9 0.5 0.5 0.5February 0.1 0.2 -0.2 0.1 -3.0 0.2 0.2 0.4March 0.1 0.2 -0.1 0.1 -1.6 0.2 0.2 0.2April 0.3 0.2 0.5 0.2 3.6 0.2 0.1 0.3May 0.4 0.2 0.6 0.2 3.7 0.2 0.1 0.3June 0.7 0.2 1.3 0.3 8.6 0.2 0.1 0.4July 0.0 0.2 -0.4 0.2 -4.1 0.2 0.2 0.2August -0.1 0.2 -0.7 0.1 -5.0 0.1 0.1 0.5September 0.1 0.2 -0.2 -0.1 -0.5 0.1 0.1 0.3October 0.2 0.2 0.1 -0.1 2.1 0.2 0.2 0.3November 0.1 0.1 -0.2 -0.1 -0.7 0.2 0.2 0.4December 0.2 0.1 -0.1 0.0 -0.2 0.3 0.2 0.3
2018January 0.1 0.1 -0.3 0.0 -2.1 0.3 0.3 0.2February 0.1 0.1 0.0 0.0 -0.6 0.2 0.2 0.2March 0.3 0.1 0.3 0.0 2.2 0.1 0.2 0.4April 0.4 0.3 0.3 0.1 1.4 0.4 0.3 0.5May 0.4 0.3 0.0 0.3 -3.1 0.9 0.3 0.3June 0.6 0.4 0.7 0.6 1.0 0.5 0.3 0.5July 0.2 0.4 0.3 0.4 -0.8 0.2 0.3 -0.1August 0.5 0.4 0.9 0.4 5.0 0.2 0.3 0.4September 0.4 0.4 0.5 0.6 -0.4 0.3 0.3 0.4October 0.3 0.4 0.3 0.6 -1.7 0.3 0.3 0.4November 0.4 0.4 0.5 0.7 0.5 0.3 0.3 0.3December 0.6 0.4 1.0 0.8 3.8 0.3 0.3 0.4
2019January 0.7 0.5 0.5 0.6 0.2 0.7 0.7 1.2February 0.3 0.4 0.4 0.3 1.0 0.3 0.3 0.4March 0.3 0.3 0.3 0.3 0.1 0.2 0.3 0.3April 0.3 0.3 0.3 0.2 0.7 0.2 0.2 0.4May 0.4 0.3 0.5 0.5 0.3 0.2 0.2 0.3June 0.1 0.3 -0.2 0.3 -4.0 0.3 0.2 0.4July 0.1 0.3 0.2 0.3 0.3 0.3 0.3 -0.5August 0.2 0.2 0.3 0.3 0.7 0.2 0.2 0.3September 0.1 0.0 0.2 0.1 0.1 0.1 0.1 0.1October 0.1 0.1 0.0 0.0 -0.1 0.2 0.2 0.3November 0.2 0.2 0.1 0.1 -0.2 0.2 0.2 0.4December 0.1 0.1 0.0 0.2 -1.1 0.2 0.2 0.2
2020January 0.2 0.1 0.0 0.0 -0.4 0.3 0.3 0.3February 0.2 0.1 0.2 0.0 1.3 0.1 0.1 0.5March 0.5 0.5 0.7 0.7 0.4 0.5 0.5 0.3April 0.8 0.5 1.6 0.9 6.8 0.5 0.5 0.3May 0.3 0.4 0.2 0.5 -2.0 0.3 0.3 0.4June 0.3 0.4 0.4 0.5 0.2 0.4 0.4 -0.1July 0.2 0.4 0.5 0.4 1.7 0.4 0.3 -0.4August 0.0 0.3 -0.8 0.3 -8.3 0.4 0.4 0.4September 0.3 0.2 0.2 0.2 0.2 0.5 0.5 0.0
1 Excluding fruit and vegetables.2 Bank of Russia’s assessment.Sources: Rosstat, Bank of Russia calculations.
CONSUMER PRICES BY GROUP OF GOODS AND SERVICES (% change on previous month, seasonally adjusted)
Table 2
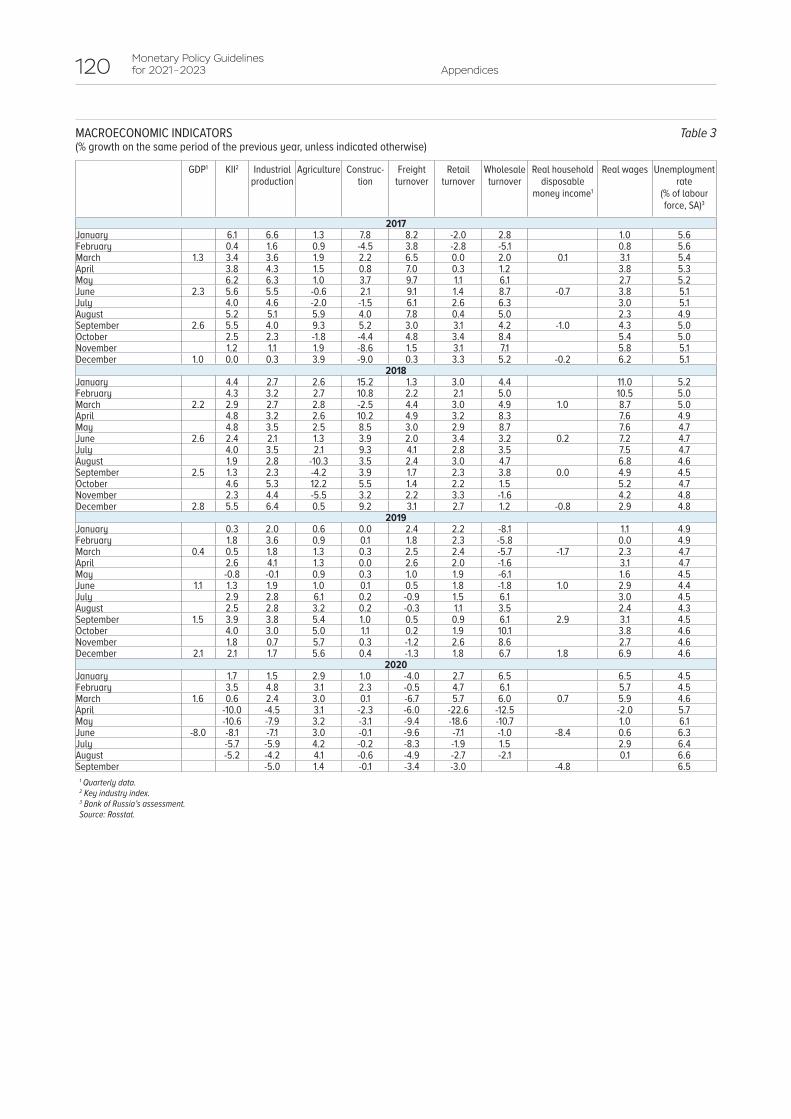
120 Monetary Policy Guidelines for 2021 – 2023 Appendices
GDP1 KII2 Industrial production
Agriculture Construc-tion
Freight turnover
Retail turnover
Wholesale turnover
Real household disposable
money income1
Real wages Unemployment rate
(% of labour force, SA)3
2017January 6.1 6.6 1.3 7.8 8.2 -2.0 2.8 1.0 5.6February 0.4 1.6 0.9 -4.5 3.8 -2.8 -5.1 0.8 5.6March 1.3 3.4 3.6 1.9 2.2 6.5 0.0 2.0 0.1 3.1 5.4April 3.8 4.3 1.5 0.8 7.0 0.3 1.2 3.8 5.3May 6.2 6.3 1.0 3.7 9.7 1.1 6.1 2.7 5.2June 2.3 5.6 5.5 -0.6 2.1 9.1 1.4 8.7 -0.7 3.8 5.1July 4.0 4.6 -2.0 -1.5 6.1 2.6 6.3 3.0 5.1August 5.2 5.1 5.9 4.0 7.8 0.4 5.0 2.3 4.9September 2.6 5.5 4.0 9.3 5.2 3.0 3.1 4.2 -1.0 4.3 5.0October 2.5 2.3 -1.8 -4.4 4.8 3.4 8.4 5.4 5.0November 1.2 1.1 1.9 -8.6 1.5 3.1 7.1 5.8 5.1December 1.0 0.0 0.3 3.9 -9.0 0.3 3.3 5.2 -0.2 6.2 5.1
2018January 4.4 2.7 2.6 15.2 1.3 3.0 4.4 11.0 5.2February 4.3 3.2 2.7 10.8 2.2 2.1 5.0 10.5 5.0March 2.2 2.9 2.7 2.8 -2.5 4.4 3.0 4.9 1.0 8.7 5.0April 4.8 3.2 2.6 10.2 4.9 3.2 8.3 7.6 4.9May 4.8 3.5 2.5 8.5 3.0 2.9 8.7 7.6 4.7June 2.6 2.4 2.1 1.3 3.9 2.0 3.4 3.2 0.2 7.2 4.7July 4.0 3.5 2.1 9.3 4.1 2.8 3.5 7.5 4.7August 1.9 2.8 -10.3 3.5 2.4 3.0 4.7 6.8 4.6September 2.5 1.3 2.3 -4.2 3.9 1.7 2.3 3.8 0.0 4.9 4.5October 4.6 5.3 12.2 5.5 1.4 2.2 1.5 5.2 4.7November 2.3 4.4 -5.5 3.2 2.2 3.3 -1.6 4.2 4.8December 2.8 5.5 6.4 0.5 9.2 3.1 2.7 1.2 -0.8 2.9 4.8
2019January 0.3 2.0 0.6 0.0 2.4 2.2 -8.1 1.1 4.9February 1.8 3.6 0.9 0.1 1.8 2.3 -5.8 0.0 4.9March 0.4 0.5 1.8 1.3 0.3 2.5 2.4 -5.7 -1.7 2.3 4.7April 2.6 4.1 1.3 0.0 2.6 2.0 -1.6 3.1 4.7May -0.8 -0.1 0.9 0.3 1.0 1.9 -6.1 1.6 4.5June 1.1 1.3 1.9 1.0 0.1 0.5 1.8 -1.8 1.0 2.9 4.4July 2.9 2.8 6.1 0.2 -0.9 1.5 6.1 3.0 4.5August 2.5 2.8 3.2 0.2 -0.3 1.1 3.5 2.4 4.3September 1.5 3.9 3.8 5.4 1.0 0.5 0.9 6.1 2.9 3.1 4.5October 4.0 3.0 5.0 1.1 0.2 1.9 10.1 3.8 4.6November 1.8 0.7 5.7 0.3 -1.2 2.6 8.6 2.7 4.6December 2.1 2.1 1.7 5.6 0.4 -1.3 1.8 6.7 1.8 6.9 4.6
2020January 1.7 1.5 2.9 1.0 -4.0 2.7 6.5 6.5 4.5February 3.5 4.8 3.1 2.3 -0.5 4.7 6.1 5.7 4.5March 1.6 0.6 2.4 3.0 0.1 -6.7 5.7 6.0 0.7 5.9 4.6April -10.0 -4.5 3.1 -2.3 -6.0 -22.6 -12.5 -2.0 5.7May -10.6 -7.9 3.2 -3.1 -9.4 -18.6 -10.7 1.0 6.1June -8.0 -8.1 -7.1 3.0 -0.1 -9.6 -7.1 -1.0 -8.4 0.6 6.3July -5.7 -5.9 4.2 -0.2 -8.3 -1.9 1.5 2.9 6.4August -5.2 -4.2 4.1 -0.6 -4.9 -2.7 -2.1 0.1 6.6September -5.0 1.4 -0.1 -3.4 -3.0 -4.8 6.5
1 Quarterly data.2 Key industry index.3 Bank of Russia’s assessment.Source: Rosstat.
MACROECONOMIC INDICATORS (% growth on the same period of the previous year, unless indicated otherwise)
Table 3

AppendicesMonetary Policy Guidelines
for 2021 – 2023 121
Loans to non-financial organisations
Loans to households
Household deposits
Government bond yield
Maturing in less than one
year
Maturing in more than one year
Maturing in less than one
year
Maturing in more than one year
Maturing in less than one
year1
Maturing in more than one year
One-year Five-year Ten-year
2017January 11.61 12.46 22.40 16.23 6.77 7.84 8.42 8.01 8.24February 11.48 11.67 21.06 16.00 6.54 7.30 8.83 8.12 8.23March 11.41 11.45 20.37 15.66 6.08 7.16 8.99 8.08 8.12April 11.02 11.31 20.57 15.42 6.52 7.13 8.64 7.92 7.92May 10.72 10.99 20.07 15.32 6.28 6.98 8.32 7.74 7.63June 10.68 10.36 19.89 15.08 5.88 6.73 8.04 7.82 7.77July 10.44 9.98 20.26 14.94 6.28 6.87 8.07 7.94 7.87August 10.41 10.42 20.07 14.50 6.28 6.89 7.88 7.82 7.81September 10.03 10.20 20.02 14.01 5.44 6.78 7.65 7.56 7.63October 9.82 9.82 18.52 13.66 5.86 6.28 7.50 7.46 7.62November 9.67 9.74 19.00 13.38 5.28 6.94 7.38 7.51 7.68December 9.43 9.41 18.99 12.92 5.38 6.39 6.98 7.27 7.64
2018January 9.14 8.61 18.99 13.52 5.72 6.66 6.66 7.03 7.51February 8.81 9.23 18.29 13.42 5.57 6.37 6.49 6.79 7.20March 8.77 9.22 17.41 13.39 5.59 6.21 6.19 6.67 7.18April 8.66 8.51 16.14 13.25 5.39 5.84 6.55 6.96 7.38May 8.75 8.61 17.79 13.20 5.46 5.98 6.57 7.04 7.49June 8.82 8.45 17.72 13.00 5.20 5.69 6.80 7.35 7.71July 8.75 8.61 17.12 12.94 5.13 5.73 6.90 7.47 7.80August 8.72 9.05 17.74 12.87 5.04 5.70 7.40 8.23 8.48September 9.00 9.24 17.50 12.50 5.21 6.02 7.56 8.60 8.91October 8.84 9.16 17.99 12.50 5.66 6.56 7.55 8.50 8.75November 8.94 9.45 17.82 12.38 5.98 6.75 7.71 8.59 8.86December 9.20 9.17 17.87 12.50 5.64 6.83 7.78 8.56 8.82
2019January 9.25 9.56 15.95 13.10 6.10 6.91 7.59 8.21 8.47February 9.29 9.74 15.54 13.08 6.24 7.02 7.69 8.07 8.36March 9.32 9.85 14.91 13.29 6.12 7.07 7.40 8.06 8.38April 9.25 9.63 15.06 13.37 5.82 6.92 7.61 7.99 8.33May 9.22 9.66 15.41 13.63 5.73 6.85 7.31 7.84 8.16June 9.11 9.35 15.25 13.35 5.79 6.75 7.21 7.46 7.67July 8.82 9.51 14.93 13.34 5.41 6.69 6.95 7.21 7.42August 8.61 8.97 14.60 13.05 5.27 6.49 6.82 7.10 7.37September 8.29 9.01 14.23 12.83 5.11 6.28 6.62 6.80 7.15October 8.17 9.30 13.74 12.67 4.99 6.16 6.25 6.46 6.79November 7.88 9.03 15.13 12.39 4.58 5.84 5.81 6.20 6.56December 7.83 8.26 14.83 12.05 4.74 5.56 5.58 6.16 6.53
2020January 7.47 8.43 15.00 12.38 4.56 5.48 5.39 5.95 6.33February 7.47 8.03 14.60 12.09 4.32 5.18 5.31 5.81 6.21March 7.84 8.20 14.19 11.84 4.32 4.89 6.18 6.91 7.27April 7.71 9.01 14.81 11.77 4.83 5.00 5.54 6.19 6.56May 7.28 8.26 14.39 11.59 4.11 4.90 4.81 5.24 5.86June 6.89 7.13 13.95 11.39 4.00 4.74 4.30 5.12 5.80July 6.27 7.42 13.63 10.85 3.51 4.31 4.21 5.17 5.99August 6.02 6.97 13.47 10.72 3.24 4.07 4.22 5.32 6.19
1 Excluding sight deposits.Source: Bank of Russia.
RUBLE INTEREST RATES ON CORE BANK DEPOSIT AND CREDIT OPERATIONS AND YIELDS ON CORE INSTRUMENTS OF THE GOVERNMENT SECURITIES MARKET(% p.a.)
Table 4

122 Monetary Policy Guidelines for 2021 – 2023 Appendices
Money supply (M2)
Broad money2 Deposits of the non-bank sector3 in national
currency
Deposits of the non-bank sector3 in foreign
currency4
Net foreign assets of
the banking system4
Claims on the economy2
Claims on households2
Claims on businesses2
Households Organisations Households Organisations
201701.01.2017 9.2 4.0 14.2 4.0 0.4 -13.7 0.1 3.5 1.4 4.001.02.2017 11.9 7.1 16.3 8.9 3.2 -6.4 2.4 4.4 1.6 5.101.03.2017 12.1 7.1 16.2 10.1 5.0 -8.0 4.7 4.8 1.9 5.601.04.2017 11.1 6.0 15.7 7.6 3.4 -11.4 3.7 5.1 3.1 5.701.05.2017 10.1 5.5 14.0 6.9 3.8 -11.3 1.6 5.3 4.1 5.601.06.2017 10.0 6.1 13.5 7.0 3.6 -7.2 5.7 5.6 4.8 5.801.07.2017 10.5 6.5 14.1 7.1 2.6 -7.1 6.1 5.8 5.9 5.801.08.2017 9.0 6.5 13.3 3.6 1.0 1.7 8.4 6.1 6.4 6.001.09.2017 9.0 6.5 12.7 3.9 0.2 1.6 6.6 6.9 7.7 6.601.10.2017 9.5 6.8 13.0 4.5 -1.6 2.2 7.0 7.8 8.6 7.501.11.2017 10.0 7.5 12.7 6.1 -2.7 4.7 6.8 8.8 9.7 8.501.12.2017 10.1 8.2 12.5 6.3 -1.9 8.5 9.2 9.7 11.0 9.3
201801.01.2018 10.5 8.6 12.6 7.9 -2.2 9.2 13.8 9.1 12.1 8.301.02.2018 9.4 7.4 11.3 7.4 -1.3 5.1 13.4 8.6 13.9 7.101.03.2018 9.3 6.6 11.8 5.6 -2.0 0.0 11.9 8.8 14.7 7.101.04.2018 9.9 7.6 12.6 5.3 -2.7 4.1 12.7 9.1 15.8 7.101.05.2018 11.5 8.5 14.0 7.5 -7.6 5.4 11.7 9.2 16.3 7.101.06.2018 10.3 7.7 13.2 4.7 -8.1 6.4 8.1 9.1 17.6 6.701.07.2018 11.4 8.3 12.8 8.4 -8.0 5.5 7.9 9.1 18.4 6.301.08.2018 11.8 8.1 13.3 8.8 -6.4 1.2 6.9 9.5 19.3 6.601.09.2018 12.6 8.2 13.0 11.3 -7.4 -1.6 7.1 9.0 19.9 5.901.10.2018 11.8 8.2 12.0 10.8 -7.4 2.3 8.1 9.0 20.8 5.501.11.2018 11.5 7.9 12.7 9.1 -7.1 2.6 9.0 9.0 21.4 5.301.12.2018 11.9 7.9 11.3 13.3 -5.7 -0.7 10.5 8.0 22.1 3.8
201901.01.2019 11.0 7.9 10.9 11.5 -4.7 1.9 11.2 8.7 21.8 4.801.02.2019 9.9 6.5 10.1 9.6 -3.0 -2.3 9.0 10.7 23.9 6.601.03.2019 9.9 7.9 9.7 11.0 -0.6 6.2 11.2 10.7 24.1 6.601.04.2019 8.9 7.0 9.0 10.4 2.3 3.8 11.1 10.7 23.5 6.801.05.2019 7.7 6.6 9.6 6.7 6.7 4.7 11.4 10.5 23.9 6.301.06.2019 8.0 6.7 9.4 8.7 8.8 2.3 15.1 10.5 23.6 6.401.07.2019 7.3 6.4 8.9 7.7 10.4 2.5 20.1 10.8 23.1 6.901.08.2019 7.8 7.0 8.4 10.8 10.2 3.4 17.5 10.0 22.2 6.101.09.2019 7.2 7.3 9.4 7.0 10.6 8.3 18.6 10.0 21.7 6.201.10.2019 9.1 8.0 10.4 11.1 12.3 1.2 18.7 10.2 21.1 6.601.11.2019 8.7 7.9 9.6 10.9 12.6 2.1 20.6 9.4 20.1 5.901.12.2019 9.6 8.3 10.7 11.0 10.5 1.0 17.8 10.2 19.0 7.3
202001.01.2020 9.7 7.6 10.4 12.4 10.6 -4.3 15.4 10.1 19.0 7.101.02.2020 10.7 8.0 11.0 13.6 6.9 -5.2 14.2 7.5 16.4 4.401.03.2020 11.0 7.9 10.8 13.9 3.0 -5.4 11.9 7.9 16.6 4.901.04.2020 13.4 9.1 10.2 18.0 -4.0 -4.8 10.8 9.1 16.8 6.301.05.2020 14.0 9.6 8.9 18.9 -5.7 -3.9 11.9 8.6 14.0 6.701.06.2020 13.6 9.3 8.6 15.5 -5.3 -3.3 10.2 8.2 12.6 6.701.07.2020 14.9 10.4 9.6 16.9 -6.3 -3.5 4.4 8.8 12.0 7.601.08.2020 15.5 11.1 10.1 16.4 -6.7 -1.2 10.3 9.0 12.4 7.701.09.2020 16.2 11.7 9.1 20.6 -6.4 -0.3 9.3 9.3 12.6 8.1
1 Calculated using data from the Banking System Survey (see Table 1.16 of the Bank of Russia Statistical Bulletin and the Statistics section of the Bank of Russia website).2 Adjusted for foreign currency revaluation.3 Resident individuals, resident non-financial and financial institutions (except banks).4 Calculated on the basis of data in billions of US dollars.Source: Bank of Russia.
MONETARY INDICATORS1
(% growth on the same period of the previous year)Table 5

AppendicesMonetary Policy Guidelines
for 2021 – 2023 123
Money supply (M2)
Broad money Deposits of the non-bank sector2 in national
currency
Deposits of the non-bank sector2 in foreign currency, billions of US
dollars
Net foreign assets of
the banking system, billions
of US dollars
Claims on the economy
Claims on households
Claims on businesses
Households Organisations Households Organisations
201701.01.2017 38,418 50,895 18,328 12,375 91.0 106.7 451.4 52,644 11,756 40,88801.02.2017 38,017 51,216 18,195 12,278 91.2 120.1 475.7 52,949 11,716 41,23301.03.2017 38,462 51,124 18,461 12,414 91.4 118.9 481.8 52,736 11,727 41,00901.04.2017 38,555 50,668 18,529 12,415 90.8 115.4 485.2 52,868 11,836 41,03201.05.2017 38,664 50,860 18,673 12,215 92.3 113.4 489.6 53,448 11,961 41,48801.06.2017 39,223 51,417 18,800 12,610 91.4 116.1 500.0 53,585 12,037 41,54801.07.2017 39,623 52,127 19,192 12,484 91.5 112.3 504.4 54,183 12,177 42,00601.08.2017 39,276 51,937 19,193 12,048 90.6 114.6 506.2 54,640 12,312 42,32901.09.2017 39,419 51,860 19,244 12,109 90.4 113.9 505.4 55,130 12,516 42,61501.10.2017 39,571 51,853 19,317 12,165 89.8 114.2 506.7 55,525 12,658 42,86701.11.2017 39,667 51,836 19,384 12,212 89.1 113.5 501.6 56,278 12,802 43,47601.12.2017 40,114 52,586 19,612 12,428 88.7 117.6 505.9 56,917 13,011 43,906
201801.01.2018 42,442 54,667 20,643 13,353 89.0 116.5 513.6 56,984 13,169 43,81501.02.2018 41,597 54,171 20,252 13,182 90.0 126.3 539.4 56,907 13,330 43,57801.03.2018 42,045 54,047 20,636 13,109 89.5 118.8 539.2 57,042 13,440 43,60301.04.2018 42,377 54,727 20,857 13,077 88.3 120.1 546.7 57,803 13,708 44,09501.05.2018 43,122 56,221 21,279 13,131 85.3 119.5 546.9 59,125 13,921 45,20401.06.2018 43,257 56,646 21,288 13,198 84.0 123.5 540.5 59,403 14,173 45,23001.07.2018 44,127 57,208 21,651 13,530 84.1 118.5 544.3 59,631 14,432 45,20001.08.2018 43,910 56,823 21,751 13,106 84.8 115.9 541.3 60,303 14,693 45,60901.09.2018 44,369 57,978 21,745 13,474 83.7 112.2 541.0 61,460 15,029 46,43101.10.2018 44,255 57,613 21,642 13,474 83.2 116.8 547.7 61,582 15,314 46,26801.11.2018 44,218 57,520 21,850 13,320 82.7 116.5 546.7 62,439 15,562 46,87701.12.2018 44,892 58,430 21,835 14,076 83.7 116.9 559.0 62,628 15,905 46,723
201901.01.2019 47,109 61,402 22,886 14,884 84.8 118.7 571.4 63,551 16,065 47,48501.02.2019 45,721 59,779 22,290 14,441 87.3 123.4 588.0 64,307 16,537 47,77001.03.2019 46,213 60,469 22,638 14,544 89.0 126.2 599.7 64,500 16,699 47,80101.04.2019 46,141 60,147 22,726 14,435 90.4 124.7 607.5 65,022 16,943 48,07801.05.2019 46,436 60,481 23,311 14,011 91.0 125.1 609.4 65,662 17,259 48,40301.06.2019 46,735 60,959 23,284 14,341 91.4 126.3 622.4 65,967 17,523 48,44401.07.2019 47,349 60,927 23,585 14,572 92.9 121.5 653.8 66,121 17,769 48,35201.08.2019 47,351 60,924 23,573 14,523 93.4 119.9 636.1 66,424 17,962 48,46301.09.2019 47,584 61,867 23,799 14,418 92.6 121.4 641.7 67,414 18,285 49,13001.10.2019 48,267 61,955 23,889 14,966 93.4 118.3 650.1 67,689 18,538 49,15101.11.2019 48,082 61,679 23,951 14,777 93.2 118.9 659.3 68,085 18,689 49,39601.12.2019 49,195 62,732 24,182 15,619 92.4 118.1 658.3 68,724 18,923 49,801
202001.01.2020 51,660 64,536 25,268 16,734 93.8 113.6 659.2 69,012 19,100 49,91201.02.2020 50,623 63,918 24,734 16,400 93.4 117.0 671.2 68,764 19,247 49,51701.03.2020 51,314 65,484 25,085 16,559 91.6 119.4 670.9 69,761 19,471 50,29101.04.2020 52,327 68,323 25,047 17,039 86.8 118.6 673.1 72,522 19,811 52,71101.05.2020 52,952 68,158 25,382 16,658 85.8 120.2 681.9 72,431 19,691 52,74001.06.2020 53,068 67,856 25,292 16,566 86.5 122.1 685.7 72,095 19,740 52,35601.07.2020 54,393 68,710 25,839 17,038 87.0 117.3 682.4 72,770 19,910 52,86001.08.2020 54,687 69,795 25,960 16,910 87.1 118.5 701.4 73,624 20,217 53,40701.09.2020 55,294 70,823 25,959 17,384 86.7 121.0 701.6 74,687 20,603 54,084
1 Calculated using data from the Banking System Survey (see Table 1.16 of the Bank of Russia Statistical Bulletin and the Statistics section of the Bank of Russia website).2 Resident individuals, resident non-financial and financial institutions (except banks).Source: Bank of Russia.
MONETARY INDICATORS1
(billions of rubles, unless indicated otherwise)Table 6

124 Monetary Policy Guidelines for 2021 – 2023 Appendices
Current account
Balance of trade
Goods exports
Goods imports
Balance of services
Service exports
Service imports
Balance of non-tradable components
Current account
Goods and services exports
Goods and services imports
billions of US dollars % of GDP2016
Q1 12.5 22.4 60.5 38.1 -4.9 10.4 15.3 -5.0
Q2 1.8 22.3 67.8 45.5 -6.0 12.6 18.6 -14.5
Q3 0.1 18.4 70.9 52.6 -7.2 13.9 21.0 -11.1
Q4 10.0 27.1 82.5 55.4 -5.9 13.7 19.7 -11.2
Year 24.5 90.2 281.7 191.5 -24.0 50.6 74.6 -41.8 1.9 26.0 20.8
2017
Q1 21.1 34.5 82.6 48.1 -5.3 12.3 17.5 -8.1
Q2 1.5 25.1 83.8 58.7 -7.7 14.7 22.4 -15.8
Q3 -3.4 20.6 84.4 63.8 -9.9 15.2 25.1 -14.0
Q4 12.9 34.4 102.1 67.7 -8.5 15.3 23.8 -13.1
Year 32.2 114.6 352.9 238.4 -31.3 57.5 88.9 -51.1 2.0 26.1 20.8
2018
Q1 30.2 44.0 101.6 57.5 -6.6 13.9 20.6 -7.2
Q2 18.4 45.5 108.9 63.4 -7.7 16.6 24.4 -19.3
Q3 28.1 47.8 110.6 62.7 -8.8 17.4 26.1 -11.0
Q4 39.0 57.7 122.9 65.2 -6.9 16.7 23.6 -11.8
Year 115.7 195.1 443.9 248.9 -30.1 64.6 94.7 -49.3 6.9 30.4 20.5
2019
Q1 33.5 47.0 102.6 55.7 -6.0 13.8 19.8 -7.5
Q2 9.9 39.4 101.4 62.0 -9.0 15.8 24.7 -20.5
Q3 10.7 37.9 103.3 65.4 -11.5 17.0 28.5 -15.7
Q4 11.2 41.0 112.5 71.6 -9.7 16.2 26.0 -20.0
Year 65.3 165.3 419.9 254.6 -36.2 62.8 99.0 -63.7 3.8 28.4 20.8
2020
Q1 22.1 32.4 88.6 56.2 -6.8 13.5 20.3 -3.5
Q2 -0.5 15.3 69.3 54.0 -2.3 9.8 12.1 -13.5
Q31 2.5 17.0 76.9 59.9 -3.1 10.7 13.8 -11.41 Estimate.Sources: Bank of Russia, Rosstat.
BALANCE OF PAYMENTS INDICATORS: CURRENT ACCOUNT Table 7

AppendicesMonetary Policy Guidelines
for 2021 – 2023 125
Financial account
(excluding reserves)
Balance for the public
sector
Balance for the private
sector
Banks’ liabilities
Other sectors’
liabilities
Banks’ assets Other sectors’ assets
Net errors and
omissions
Change in reserves
Balance of financial transactions of the
private sector
billions of US dollars % of GDP2016
Q1 6.9 1.2 5.8 -7.6 -0.3 -9.9 7.8 -3.0 2.6
Q2 -2.3 -3.6 1.3 -4.6 5.0 -4.4 6.2 1.6 4.4
Q3 -2.0 -4.3 2.3 -7.7 -2.3 -8.3 0.7 1.0 3.1
Q4 7.4 2.7 4.7 -7.3 14.4 -5.6 17.4 -5.0 -1.8
Year 10.1 -4.0 14.1 -27.1 16.9 -28.3 32.1 -5.4 8.2 1.4
2017
Q1 10.8 -5.9 16.7 -3.9 -3.6 13.6 -4.6 0.9 11.3
Q2 -2.1 -3.9 1.8 -11.7 13.0 -2.5 5.5 4.1 7.5
Q3 -10.7 -10.3 -0.4 -7.8 3.1 -16.3 11.1 -0.8 6.5
Q4 13.9 6.7 7.2 -4.2 1.8 0.8 4.0 -1.7 -2.7
Year 11.9 -13.3 25.2 -27.7 14.2 -4.4 16.1 2.6 22.6 1.5
2018
Q1 12.7 -6.6 19.3 -2.5 1.0 0.3 17.5 2.1 19.3
Q2 9.8 11.1 -1.3 -9.6 4.0 -5.7 -1.2 2.9 11.3
Q3 24.9 2.9 22.0 -3.8 -8.4 8.6 1.2 1.8 5.0
Q4 31.0 1.3 29.8 -9.2 -0.8 4.5 15.3 -4.7 2.6
Year 78.5 8.7 69.8 -25.0 -4.3 7.6 32.9 2.1 38.2 3.9
2019
Q1 12.3 -9.3 21.6 -3.2 5.7 9.2 14.9 -2.6 18.6
Q2 -5.2 -6.2 1.0 -6.7 13.0 6.6 0.8 1.7 16.6
Q3 -7.2 -3.6 -3.6 -7.9 5.5 -5.8 -0.2 -1.9 15.9
Q4 -3.8 -3.8 0.0 -2.1 1.0 -12.0 10.9 0.8 15.4
Year -3.9 -22.9 19.0 -19.8 25.2 -2.1 26.5 -2.0 66.5 1.3
2020
Q1 17.3 0.4 16.8 -6.8 -5.9 2.5 1.6 0.2 5.0
Q2 13.8 1.4 12.4 -9.2 6.5 -2.0 11.7 1.6 -12.9
Q32 3.2 -3.2 6.3 -3.6 -11.9 -8.7 -0.5 -1.5 -2.31 Signs according to BPM6.2 Estimate.Sources: Bank of Russia, Rosstat.
BALANCE OF PAYMENTS INDICATORS: FINANCIAL ACCOUNT1 Table 8

126 Monetary Policy Guidelines for 2021 – 2023 Appendices
Countries GDP growth, % change on the same quarter of the
previous year1
Inflation, % change on the same month of the
previous year2
Policy (target) rate of the central bank, % p.a.3
Interest rate on loans to the non-financial sector for up to 1 year / 1 year,
% p.a.4
Budgetary surplus/deficit in 2020, % of
GDP5
Australia -6.3 -0.3 0.25 4.80 -9.7Argentina -19.1 31.7 37.00 22.67 -Brazil -11.4 3.1 2.00 29.50 -9.4UK -21.7 0.5 0.10 0.50 -8.3Germany -11.3 -0.2 -0.50 1.95 -5.5India -23.9 7.3 4.00 9.05 -7.4Indonesia -5.3 1.4 4.00 9.54 -5.0Italy -17.7 -0.6 -0.50 2.14 -8.3Canada -12.7 0.5 0.25 2.70 -11.8China 4.9 1.7 3.85 4.35 -11.2Mexico -18.7 4.0 4.25 6.63 -4.2Russia -8.0 3.7 4.25 7.28 -4.8 Saudi Arabia -7.0 5.7 1.00 - -12.6USA -1.0 1.4 0.25 3.25 -15.4Turkey -9.9 11.8 10.25 9.75 -7.5France -18.9 0.0 -0.50 1.18 -9.2South Korea -17.1 1.0 0.50 2.82 -1.8South Africa -2.7 3.1 3.50 7.25 -13.3Japan -9.9 0.0 -0.1 0.99 -7.1EU -11.7 0.3 - - -7.21 GDP – data are provided for 2020 Q2 for: Australia, Brazil, India, the UK, Germany, Indonesia, Italy, Mexico, Russia, the USA, Turkey, France, South Africa, South Korea, Japan, the EU, Argentina, Saudi Arabia; for 2020 Q3 for: China.
2 Inflation – data are provided for September for: Brazil, Germany, India, Indonesia, Italy, China, Mexico, Russia, the USA, Turkey, France, Korea, the EU, Argentina, Japan, the UK, Canada and Saudi Arabia; for August for: South Aftrica; for 2020 Q2 for Australia.
3 Policy rate: the ECB’s deposit rate (-0.5%) is given for Germany, France, and Italy; and the deposit rate (-0.1%) – for Japan.4 Interest rate on loans to the non-financial sector: according to information from the IMF’s International Financial Statistics, CEIC.5 Budget surplus or deficit in 2020: according to the IMF’s World Economic Outlook, April 2020.Sources: national central banks and statistical agencies, ECB, Eurostat, IMF, CEIC, and Bloomberg.
KEY ECONOMIC INDICATORS OF G20 COUNTRIES (data as of 22 October 2020)
Table 9

AppendicesMonetary Policy Guidelines
for 2021 – 2023 127
APPENDIX 10 STATISTICS ON THE USE OF MONETARY POLICY INSTRUMENTS
Liability typeEffective period
01.12.2017 – 31.07.2018
01.08.2018 – 31.03.2019
01.04.2019 – 30.06.2019 From 01.07.20191
Banks with a universal licence and non-bank credit institutionsTo households in rubles
5.00 5.00 4.75 4.75Other liabilities in rublesTo non-resident legal entities in rublesTo households in foreign currency 6.00 7.00 7.00 8.00To non-resident legal entities in foreign currency
7.00 8.00 8.00 8.00Other foreign currency liabilitiesBanks with a basic licenceTo households in rubles
1.00 1.00 1.00 1.00Other liabilities in rublesTo non-resident legal entities in rubles 5.00 5.00 4.75 4.75To households in foreign currency 6.00 7.00 7.00 8.00To non-resident legal entities in foreign currency
7.00 8.00 8.00 8.00Other foreign currency liabilities1 Bank of Russia Ordinance No. 5158-U, dated 31 May 2019, ‘On Mandatory Reserve Requirements’. Refer to the press release, dated 31 May 2019, on the Bank of Russia website.Source: Bank of Russia.
REQUIRED RESERVE RATIOS (%)
Table 1

128 Monetary Policy Guidelines for 2021 – 2023 Appendices
Purp
ose
Instr
umen
t typ
eIn
strum
ent
Mat
urity
Freq
uenc
ySp
read
bet
ween
in
tere
st ra
tes a
nd
the
key
rate
(pp)
As o
f 01
.01.2
020
From
10
.02.
2020
From
27
.04.
2020
From
22
.06.
2020
From
27
.07.2
020
Liqui
dity
pro
visio
n
Stan
ding
facil
ities
Over
nigh
t loa
ns, l
omba
rd lo
ans,
loan
s sec
ured
by
non-
mar
keta
ble
asse
ts, re
pos,
FX sw
aps1
1 day
Daily
+1.0
07.2
57.0
06.
505.
505.
25
Loan
s sec
ured
by
non-
mar
keta
ble
asse
tsFr
om 2
to 5
49
days
2+1
.758.
007.7
57.2
56.
255.
00
Open
mar
ket o
pera
tions
(m
inim
um in
tere
st ra
tes)
Auct
ions
to p
rovid
e lo
ans s
ecur
ed b
y no
n-m
arke
tabl
e as
sets
3 m
onth
s2
Mon
thly
3+0
.25
6.50
6.25
5.75
4.75
4.50
Repo
auc
tions
1 yea
r2-
-
1 m
onth
+0.10
--
5.60
4.60
4.35
1 wee
kW
eekl
y4
6.25
(ke
y ra
te)
6.00
(ke
y ra
te)
5.50
(ke
y ra
te)
4.50
(ke
y ra
te)
4.25
(ke
y ra
te)
From
1 to
6 d
ays
Occa
siona
lly5
FX sw
ap a
uctio
ns1
From
1 to
2 d
ays
Liqui
dity
abs
orpt
ion
Open
mar
ket o
pera
tions
(m
axim
um in
tere
st ra
tes)
Depo
sit a
uctio
nsFr
om 1
to 6
day
s
1 wee
kW
eekl
y4
Stan
ding
facil
ities
De
posit
ope
ratio
ns1 d
ayDa
ily- 1
.00
5.25
5.00
4.50
3.50
4.00
1 The
inte
rest
rate
for t
he ru
ble
leg
is sp
ecifie
d; th
e in
tere
st ra
te fo
r the
fore
ign
curre
ncy
leg
equa
ls LIB
OR ra
tes o
n ov
erni
ght l
oans
in U
S do
llars
or e
uros
(dep
endi
ng o
n th
e cu
rrenc
y of
tran
sact
ions
).2 Lo
ans a
nd re
pos a
t a fl
oatin
g in
tere
st ra
te lin
ked
to th
e Ba
nk o
f Rus
sia ke
y ra
te.
3 Loan
auc
tions
are
not
hel
d fro
m A
pril 2
016;
repo
auc
tions
wer
e la
unch
ed in
May
202
0.4 E
ither
a re
po o
r a d
epos
it au
ctio
n is
held
dep
endi
ng o
n th
e sit
uatio
n wi
th liq
uidi
ty.
5 Fine
-tuni
ng o
pera
tions
.Fo
r ref
eren
ce: F
rom
1 Ja
nuar
y 20
16, t
he va
lue
of th
e Ba
nk o
f Rus
sia re
finan
cing
rate
equ
als i
ts ke
y ra
te a
s of t
he re
leva
nt d
ate.
So
urce
: Ban
k of R
ussia
.
INTE
REST
RAT
ES O
N M
ONET
ARY
POLIC
Y IN
STRU
MEN
TS(%
p.a
.)Ta
ble
2

AppendicesMonetary Policy Guidelines
for 2021 – 2023 129
Purp
ose
Instr
umen
t typ
eIn
strum
ent
Mat
urity
Freq
uenc
y
Bank
of R
ussia
’s cla
ims u
nder
liqui
dity
-pro
vidin
g in
strum
ents
and
liabi
litie
s und
er liq
uidi
ty-a
bsor
bing
instr
umen
ts
As o
f 01
.01.2
020
As o
f 01
.04.
2020
As o
f 01
.07.2
020
As o
f 01
.10.2
020
Liqui
dity
pro
visio
n
Stan
ding
facil
ities
Over
nigh
t loa
ns
1 day
Daily
0.0
0.0
0.0
0.0
Lom
bard
loan
s0.
00.
00.
00.
0
FX sw
aps
12.6
0.0
0.0
0.0
Repo
s0.
016
.70.
00.
3
Loan
s sec
ured
by
non-
mar
keta
ble
asse
tsFr
om 1
to 5
49 d
ays
5.15.1
5.15.1
Open
mar
ket o
pera
tions
Auct
ions
to p
rovid
e lo
ans s
ecur
ed b
y no
n-m
arke
tabl
e as
sets
3 m
onth
sM
onth
ly1
0.0
0.0
0.0
0.0
Repo
auc
tions
1 yea
r-
-5.
35.
31 m
onth
--
0.0
0.0
1 wee
kW
eekl
y20.
085
4.4
0.0
0.0
From
1 to
6 d
ays
Occ
asio
nally
3FX
swap
auc
tions
From
1 to
2 d
ays
0.0
0.0
0.0
0.0
Liqui
dity
abs
orpt
ion
Open
mar
ket o
pera
tions
De
posit
auc
tions
From
1 to
6 d
ays
696.
61,6
73.5
773.
499
9.2
1 wee
kW
eekl
y2
Auct
ions
for p
lace
men
t of c
oupo
n OB
RUp
to 3
mon
ths
Mon
thly
41,9
56.3
1,544
.270
8.2
818.
5
Stan
ding
facil
ities
De
posit
ope
ratio
ns1 d
ayDa
ily32
9.716
0.5
151.3
149.1
1 Loan
auc
tions
are
not
hel
d fro
m A
pril 2
016;
repo
auc
tions
wer
e la
unch
ed in
May
202
0.2 E
ither
a re
po o
r a d
epos
it au
ctio
n is
held
dep
endi
ng o
n th
e sit
uatio
n wi
th liq
uidi
ty.
3 Fine
-tuni
ng o
pera
tions
.4 B
asica
lly, a
new
OBR
issu
e is
offer
ed o
nce
a m
onth
and
subs
eque
ntly
– o
n a
week
ly b
asis.
If th
e re
porti
ng d
ate
falls
on
a we
eken
d or
hol
iday
, the
am
ount
of o
utsta
ndin
g co
upon
OBR
shou
ld b
e sp
ecifie
d in
cludi
ng th
e co
upon
yie
ld a
ccru
ed a
s of t
he fi
rst b
usin
ess
day
follo
wing
the
repo
rting
dat
e.So
urce
: Ban
k of R
ussia
.
BANK
OF R
USSI
A OP
ERAT
IONS
TO P
ROVI
DE A
ND A
BSOR
B RU
BLE
LIQUI
DITY
(b
illio
ns o
f rub
les)
Tabl
e 3

130 Monetary Policy Guidelines for 2021 – 2023 Appendices
APPENDIX 11 BANK OF RUSSIA ONE-WEEK AUCTION-BASED OPERATIONS IN 2021
In the situation of a structural liquidity surplus, the Bank of Russia is planning to hold one-week auctions in the form of deposit auctions. Should a one-week repo auction be held instead of a deposit auction, the Bank of Russia will publish relevant information on its website on the business day preceding the auction.
Auction date
Date of funds placement by credit institutions
Date of principal repayment and interest payment by the Bank of Russia
12.01.2021 13.01.2021 20.01.2021
19.01.2021 20.01.2021 27.01.2021
26.01.2021 27.01.2021 03.02.2021
02.02.2021 03.02.2021 10.02.2021
09.02.2021 10.02.2021 17.02.2021
16.02.2021 17.02.2021 24.02.2021
24.02.2021 24.02.2021 03.03.2021
02.03.2021 03.03.2021 10.03.2021
09.03.2021 10.03.2021 17.03.2021
16.03.2021 17.03.2021 24.03.2021
23.03.2021 24.03.2021 31.03.2021
30.03.2021 31.03.2021 07.04.2021
06.04.2021 07.04.2021 14.04.2021
13.04.2021 14.04.2021 21.04.2021
20.04.2021 21.04.2021 28.04.2021
27.04.2021 28.04.2021 05.05.2021
04.05.2021 05.05.2021 12.05.2021
11.05.2021 12.05.2021 19.05.2021
18.05.2021 19.05.2021 26.05.2021
25.05.2021 26.05.2021 02.06.2021
01.06.2021 02.06.2021 09.06.2021
08.06.2021 09.06.2021 16.06.2021
15.06.2021 16.06.2021 23.06.2021
22.06.2021 23.06.2021 30.06.2021
29.06.2021 30.06.2021 07.07.2021
06.07.2021 07.07.2021 14.07.2021
13.07.2021 14.07.2021 21.07.2021
20.07.2021 21.07.2021 28.07.2021
27.07.2021 28.07.2021 04.08.2021
03.08.2021 04.08.2021 11.08.2021
10.08.2021 11.08.2021 18.08.2021
17.08.2021 18.08.2021 25.08.2021
24.08.2021 25.08.2021 01.09.2021
31.08.2021 01.09.2021 08.09.2021
07.09.2021 08.09.2021 15.09.2021
14.09.2021 15.09.2021 22.09.2021

AppendicesMonetary Policy Guidelines
for 2021 – 2023 131
Auction date
Date of funds placement by credit institutions
Date of principal repayment and interest payment by the Bank of Russia
21.09.2021 22.09.2021 29.09.2021
28.09.2021 29.09.2021 06.10.2021
05.10.2021 06.10.2021 13.10.2021
12.10.2021 13.10.2021 20.10.2021
19.10.2021 20.10.2021 27.10.2021
26.10.2021 27.10.2021 03.11.2021
02.11.2021 03.11.2021 10.11.2021
09.11.2021 10.11.2021 17.11.2021
16.11.2021 17.11.2021 24.11.2021
23.11.2021 24.11.2021 01.12.2021
30.11.2021 01.12.2021 08.12.2021
07.12.2021 08.12.2021 15.12.2021
14.12.2021 15.12.2021 22.12.2021
21.12.2021 22.12.2021 29.12.2021

132 Monetary Policy Guidelines for 2021 – 2023 Appendices
APPENDIX 12 REQUIRED RESERVE AVERAGING PERIODS IN 2021
Averaging period to calculate required reserves for corresponding
reporting period
Averaging period duration (days)
For reference:
Reporting period
Required reserve regulation period
13.01.2021 – 09.02.2021 28 December 2020 22.01.2021 – 26.01.2021
10.02.2021 – 09.03.2021 28 January 2021 12.02.2021 – 16.02.2021
10.03.2021 – 06.04.2021 28 February 2021 15.03.2021 – 17.03.2021
07.04.2021 – 11.05.2021 35 March 2021 14.04.2021 – 16.04.2021
12.05.2021 – 08.06.2021 28 April 2021 18.05.2021 – 20.05.2021
09.06.2021 – 06.07.2021 28 May 2021 15.06.2021 – 17.06.2021
07.07.2021 – 10.08.2021 35 June 2021 14.07.2021 – 16.07.2021
11.08.2021 – 07.09.2021 28 July 2021 13.08.2021 – 17.08.2021
08.09.2021 – 12.10.2021 35 August 2021 14.09.2021 – 16.09.2021
13.10.2021 – 09.11.2021 28 September 2021 14.10.2021 – 18.10.2021
10.11.2021 – 07.12.2021 28 October 2021 16.11.2021 – 18.11.2021
08.12.2021 – 11.01.2022 35 November 2021 14.12.2021 – 16.12.2021

Monetary Policy Guidelines for 2021 – 2023 133
GLOSSARY
Banking sector liquidityCredit institutions’ ruble-denominated funds held in correspondent accounts with the
Bank of Russia primarily for making payments via the Bank of Russia’s payment system and for fulfilling the reserve requirements.
Bank of Russia key rateThe key rate is the main instrument of the Bank of Russia’s monetary policy and is
used to assess the stance and characteristics of monetary policy. Changes in the key rate influence credit and economic activity and, ultimately, help achieve the key goal of monetary policy. This is the interest rate on main operations carried out by the Bank of Russia to regulate the banking sector liquidity (it corresponds to the minimum interest rate at the Bank of Russia’s one-week repo auctions and to the maximum interest rate at the Bank of Russia’s one-week deposit auctions).
Consumer Price Index (CPI)The ratio of the value of a fixed set of goods and services in current-period prices to
its value in previous (reference) period prices. This index is calculated by the Federal State Statistics Service (Rosstat). The CPI reflects changes over time in the overall level of prices for goods and services purchased by households for consumption. The CPI is calculated based on data on the actual structure of consumer spending and is, therefore, the principal indicator of the cost of living. In addition, the CPI has a range of characteristics making it convenient for common use, namely a simple and clear method of construction, a monthly frequency of calculation, and timely publication.
Core inflationAn indicator of inflation characterising its steadiest part. Core inflation is measured
based on the Core Consumer Price Index (CCPI). The difference between the CCPI and the Consumer Price Index (CPI) is that the CCPI is calculated excluding changes in prices for certain products and services that are subject to the influence of administrative and seasonal factors (individual categories of fruit and vegetables, passenger transportation services, communications services, housing and utility services, motor fuel, etc.).
Credit default swap (CDS)A financial instrument enabling a buyer to insure against a certain credit event (e.g.
default) related to a third party’s financial obligations in exchange for regular payments of premia (CDS spread) to the CDS seller. The higher the premium paid, the more risky are the obligations that are the subject of the credit default swap.

134 Monetary Policy Guidelines for 2021 – 2023 Glossary
Financial stabilityA state of the financial system involving no systemic risks which, in the case of their
materialisation, might adversely affect the transformation of savings into investment and the real economy. Financial stability improves the resilience of the economy to both internal and external shocks.
Floating exchange rate regimeAn exchange rate regime where the central bank establishes no targets, including
operational ones, whether for the level of or for changes in the exchange rate, with the latter forming under the influence of market factors. However, the central bank reserves the right to purchase foreign currency in order to replenish the country’s international reserves or to sell foreign currency in the case of any threats to financial stability.
InflationA sustained rise in the overall level of goods and service prices in the economy. Inflation
is generally associated with changes over time in the price of the consumer basket, that is, a set of food products, non-food goods and services consumed by an average household (refer also to the article ‘Consumer Price Index (CPI)’).
Inflation expectationsEconomic agents’ expectations regarding price growth in the future. Inflation expectations
are formed by businesses, households, financial markets, and analysts. Economic agents make economic decisions and their plans for the future (including those related to consumption, saving, borrowing, investment, and loan and deposit rates) relying on their expectations. Inflation expectations impact inflation and are, therefore, a critical indicator for making monetary policy decisions.
Inflation targetingA strategy of monetary policy based on the following principles: price stability is the key
goal of monetary policy; the inflation target is clearly specified and announced; under a floating exchange rate regime, monetary policy influences the economy primarily through interest rates; monetary policy decisions are made based on the analysis of a wide range of macroeconomic indicators and their forecasts; the central bank seeks to provide clear benchmarks for households and businesses, including through enhancing communication transparency.
Liquidity-absorbing operationsReverse operations carried out by the Bank of Russia to absorb liquidity from credit
institutions. These are operations either to raise deposits or place Bank of Russia bonds.
Monetary baseThe total amount of the components of cash and credit institutions’ funds in Bank of
Russia accounts and bonds denominated in Russian rubles. Monetary base in the narrow definition comprises cash in circulation (outside the Bank of Russia) and credit institutions’ funds in required reserve accounts for ruble-denominated funds raised by credit institutions. The broad monetary base includes cash in circulation (outside the Bank of Russia) and credit institutions’ total funds in Bank of Russia accounts and bonds.

GlossaryMonetary Policy Guidelines
for 2021 – 2023 135
Money supplyThe total amount of Russian residents’ funds (excluding general government’s and credit
institutions’ funds). For the purposes of economic analysis, various monetary aggregates are calculated (М0, М1, М2, and М2Х).
Money supply in the national definition (M2 monetary aggregate)The total amount of cash in circulation outside the banking system and of the balances
of Russian residents (non-financial and financial (other than credit) institutions and individuals) in settlement, current and other demand accounts (including in bank card accounts), time deposits, and other raised term funds in the banking system denominated in Russian rubles, as well as interest accrued on them.
MSCI indicesA group of indices calculated by Morgan Stanley Capital International. The latter
calculates indices for individual countries (including Russia), global indices (for various regions, advanced and emerging market economies), and the World Index.
Neutral rate of interestThe level of the key rate when monetary policy neither slows down, nor speeds up
inflation.
Refinancing operationsReverse operations conducted by the Bank of Russia to provide liquidity to credit
institutions. They may be in the form of loans, repos, or FX swaps.
Required reserve ratiosRatios that are applied to credit institutions’ reservable liabilities to calculate the
regulatory value of required reserves. In accordance with Federal Law No. 86-FZ, dated 10 July 2002, ‘On the Central Bank of the Russian Federation (Bank of Russia)’, their values may range from 0% to 20%. These ratios are established by the Bank of Russia’s Board of Directors.
RUONIA (Ruble OverNight Index Average)A reference weighted interest rate on overnight ruble-denominated deposits in the
Russian interbank market. It reflects the estimated cost of banks’ unsecured borrowings with minimum credit risk. The Bank of Russia calculates RUONIA using the method developed by the National Finance Association together with the Bank of Russia, based on information on deposit transactions between the RUONIA panel banks. The list of the panel banks participating in the RUONIA calculation is formed by the National Finance Association and agreed upon with the Bank of Russia.
Russia’s balance of paymentsA statistical system reflecting all economic operations between residents and non-
residents of the Russian Federation over the course of the reporting period.
Share of foreign currency in bank deposits (loans)The portion of foreign currency-denominated deposits (loans) in the banking sector’s
overall portfolio of deposits (loans).

136 Monetary Policy Guidelines for 2021 – 2023 Glossary
Structural liquidity deficit / surplus of the banking sectorA structural deficit in the banking sector is a situation when credit institutions
demonstrate sustainable demand for liquidity from the Bank of Russia. A structural surplus is when credit institutions have a stable excess of liquidity and the Bank of Russia needs to carry out liquidity-absorbing operations. The estimated level of a structural liquidity deficit / surplus is the difference between the outstanding amount on refinancing operations and the amount of liquidity-absorbing operations of the Bank of Russia.
Transmission mechanismThe mechanism through which monetary policy decisions impact the economy in general
and price movements in particular; the process of the gradual transmission of the central bank’s signal regarding the maintenance of or a change in the key rate and its future path from financial market segments to the real sector of the economy and, ultimately, to the inflation rate. A change in the key rate is translated into the economy through multiple channels (interest rate, credit, foreign exchange, balance sheet, inflation expectations channels and other).

Monetary Policy Guidelines for 2021 – 2023 137
• 3MMA – three-month moving average
• bp – basis point (0.01 percentage points)
• BPM6 – the 6th edition of the IMF’s Balance of Payments and International Investment Position Manual
• Coupon OBR – Bank of Russia coupon bonds
• CPI – consumer price index
• ECB – European Central Bank
• EMEs – emerging market economies
• GDP – gross domestic product
• IBL – interbank loans
• IMF – International Monetary Fund
• InFOM – Institute of the Public Opinion Foundation
• Ministry of Economic Development – Ministry of Economic Development of the Russian Federation
• Ministry of Finance – Ministry of Finance of the Russian Federation
• NWF – National Wealth Fund
• OFZ – federal government bonds
• OPEC – Organization of the Petroleum Exporting Countries
• OPEC+ – Organization of the Petroleum Exporting Countries and 11 non-member countries which signed the agreement on oil production cuts
• pp – percentage point
• RUONIA – Ruble OverNight Index Average (reference weighted rate on overnight ruble deposits in the Russian interbank market)
• SA – seasonally adjusted
• SAAR – seasonally adjusted annualised rate
• SME – small and medium-sized enterprises
• US Fed – US Federal Reserve System
• VAT – value added tax
ABBREVIATIONS


