44
Monetary Policy in Colombia Hernando Vargas Banco de la República April 2005
| Date post: | 28-Dec-2015 |
| Category: |
Documents |
| Upload: | cuthbert-lyons |
| View: | 215 times |
| Download: | 1 times |
Monetary Policy in Colombia
Hernando Vargas
Banco de la República
April 2005

I. Monetary Policy Strategy
II. Recent Trends in the Economy
III. Monetary and Exchange Rate Policies
IV. Is Inflation picking up?
V. Is there an Asset Price Bubble?

I. Monetary Policy Strategy
• Inflation Targeting since 1999….
• …. with strong FX intervention since 2004

II. Recent Trends in the Economy

International conditions have favored growth and currency appreciation
• Terms of trade (Oil, Coal, Coffee etc)
• External Demand for “non-traditional” exports (Venezuela and the U.S.)
• Workers´ remittances
• Low external interest rates and sovereign spreads
• High FDI

Internal conditions have favored growth of output and aggregate demand
• Low domestic interest rates
• Improved balance sheets of the financial system, households and firms
• Growing business and consumer confidence
• Increasing productivity? (imports of capital goods and foreign competition)

Results: High growth rates of output and aggregate demand
Internal Demand and GDP(Real annual Growth)
0%1%2%3%4%5%6%7%8%9%
10%
2000 2001 2002 2003 2004 2005
Source: DANE
Internal Demand GDP

Results: Negative output gap possibly closing….
…. Although there is great uncertainty regarding the measures of output gap
Output Gap
-8.0%
-6.0%
-4.0%
-2.0%
0.0%
2.0%
4.0%
1995
T1
1996
T1
1997
T1
1998
T1
1999
T1
2000
T1
2001
T1
2002
T1
2003
T1
2004
T1
2005
T1
(% Potential Output)
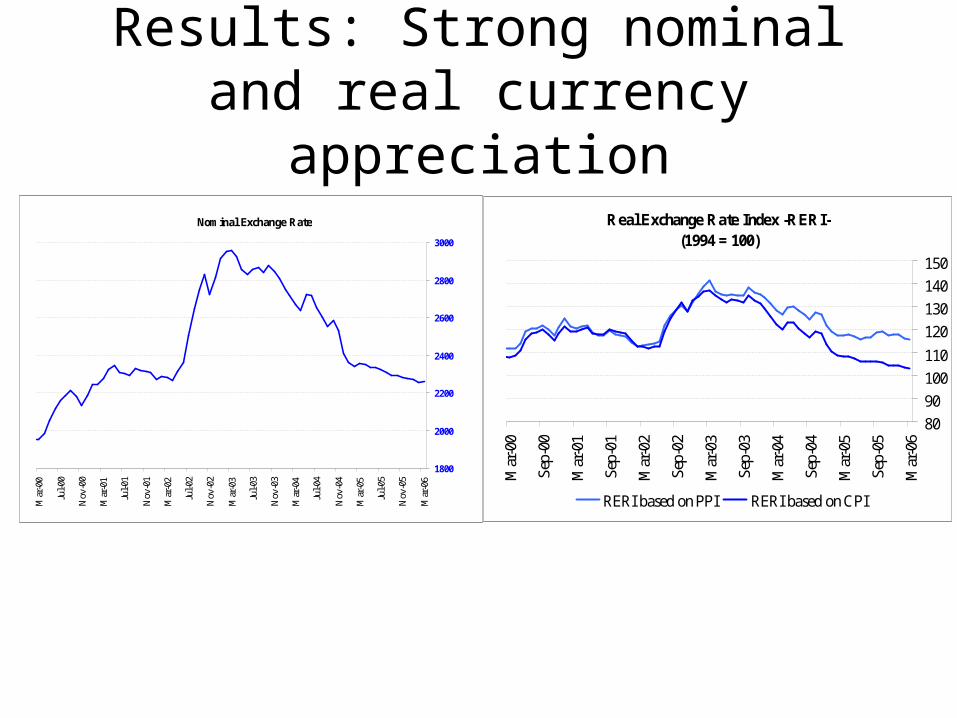
Results: Strong nominal and real currency appreciation
Nominal Exchange Rate
1800
2000
2200
2400
2600
2800
3000
Mar
-00
Jul-
00
Nov
-00
Mar
-01
Jul-
01
Nov
-01
Mar
-02
Jul-
02
Nov
-02
Mar
-03
Jul-
03
Nov
-03
Mar
-04
Jul-
04
Nov
-04
Mar
-05
Jul-
05
Nov
-05
Mar
-06
Real Exchange Rate Index -RERI- (1994 = 100)
80
90
100
110
120
130
140
150
Mar
-00
Sep-
00
Mar
-01
Sep-
01
Mar
-02
Sep-
02
Mar
-03
Sep-
03
Mar
-04
Sep-
04
Mar
-05
Sep-
05
Mar
-06
RERI based on PPI RERI based on CPI

Results: Decreasing inflation on target
Source: Banco de la República, DANE
Annual Consumer Inflation and Inflation Targets
3.5
4.5
5.5
6.5
7.5
8.5
9.5
10.5
Mar
-00
Jun-0
0
Sep
-00
Dec
-00
Mar
-01
Jun-0
1
Sep
-01
Dec
-01
Mar
-02
Jun-0
2
Sep
-02
Dec
-02
Mar
-03
Jun-0
3
Sep
-03
Dec
-03
Mar
-04
Jun-0
4
Sep
-04
Dec
-04
Mar
-05
Jun-0
5
Sep
-05
Dec
-05
Mar
-06
Inflation Target Annual Consumer Inflation Annual Non-Food Inflation

III. Monetary and Exchange Rate Policies
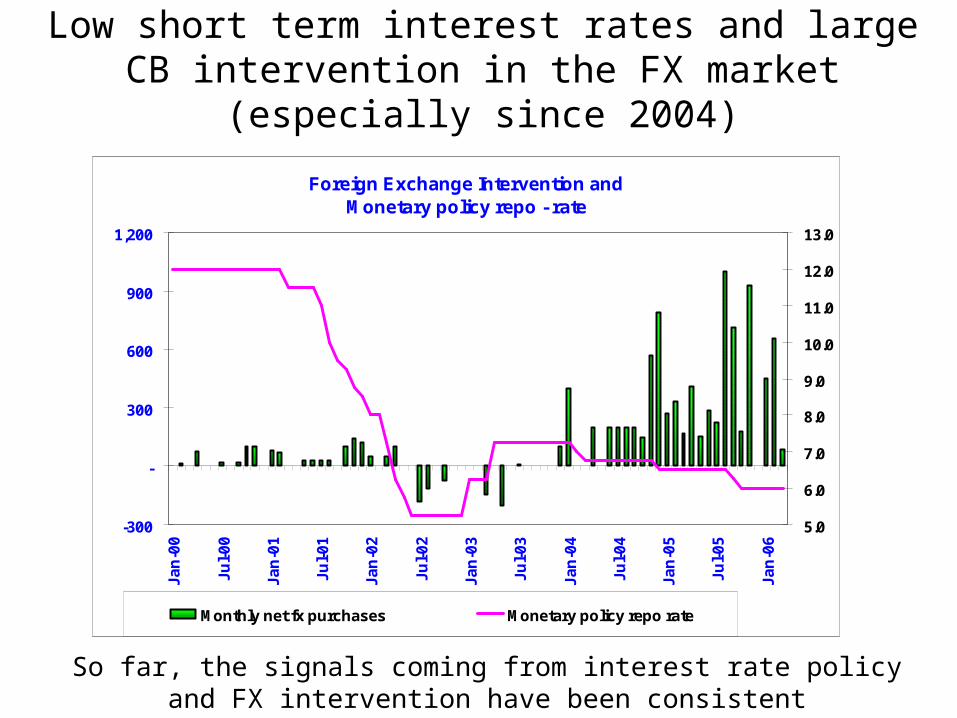
Low short term interest rates and large CB intervention in the FX market (especially since 2004)
So far, the signals coming from interest rate policy and FX intervention have been consistent
Foreign Exchange Intervention and Monetary policy repo - rate
-300
-
300
600
900
1,200
Ja
n-0
0
Ju
l-0
0
Ja
n-0
1
Ju
l-0
1
Ja
n-0
2
Ju
l-0
2
Ja
n-0
3
Ju
l-0
3
Ja
n-0
4
Ju
l-0
4
Ja
n-0
5
Ju
l-0
5
Ja
n-0
6
5.0
6.0
7.0
8.0
9.0
10.0
11.0
12.0
13.0
Monthly net fx purchases Monetary policy repo rate
%

Some features of FX intervention
• Discretionary intervention since september 2004 (before: “rules-based” auctions of options)
• No time-frame or amounts are announced
• No specific level of the exchange rate has been targeted
• Sterilization – CB has “defended” the short run interest rate:
– OMOs– Reductions in REPO loans to banks– Government deposits in the CB– Sales of international reserves to the Government

The FX exposure of the Government has been reduced…
CENTRAL GOVERNMENT GROSS DEBT1990-2005
0.0
10.0
20.0
30.0
40.0
50.0
60.0
% P
IB
Domestic 4.2 3.5 5.8 5.7 5.1 6.2 7.1 9.3 11.1 16.7 22.2 24.9 29.0 28.6 29.0 33.0
Foreign 12.7 11.7 10.8 8.9 7.2 7.4 7.2 8.6 11.2 14.9 18.3 22.1 25.4 24.8 20.7 16.8
Total 16.9 15.2 16.6 14.6 12.3 13.7 14.4 17.9 22.2 31.6 40.4 47.0 54.4 53.5 49.7 49.8
1990 1991 1992 1993 1994 1995 1996 1997 1998 1999 2000 2001 2002 2003 2004 2005
2003 pr 2004 pr 2005 prCurrent account (US$ Mill) -974.3 -938.4 -1,930.4Current account as % GDP -1.2 -1.0 -1.6Private sector - Capital and financial account (excludes FDI) (US$ Mill) -494.8 254.0 495.3FDI (US$ Mill) 820.0 2,974.6 5,568.8Public Sector - Capital and financial account (US$ Mill) 378.0 -36.1 -2,729.8Change in gross international reserves -183.8 2,541.1 1,728.7
Sells of international reserves to Central Government 0.0 500.0 3,250.0p: preliminarySource: Banco de la República
COLOMBIA - BALANCE OF PAYMENTS

…But market risk has increased in the financial system
(greater reliance on the domestic market)
Public debt holdings (TES) of Pension Funds (%)
16.12%
23.20% 23.36%
30.99%
37.27%
0%
10%
20%
30%
40%
50%
2001 2002 2003 2004 2005
Peso-denominated foreign debt: Attractive but limited option
Greater fiscal adjustment + better market risk regulation?
Investments as a percentage of total assetsCredit Institutions
7%
12%
17%
22%
27%
32%
37%
Feb
-97
Feb
-98
Feb
-99
Feb
-00
Feb
-01
Feb
-02
Feb
-03
Feb
-04
Feb
-05
Feb
-06

Why has the CB maintained low interest rates?
IT: Conditional inflation forecasts on target:
– Negative output gap– Currency appreciation– Inflation expectations close to targets
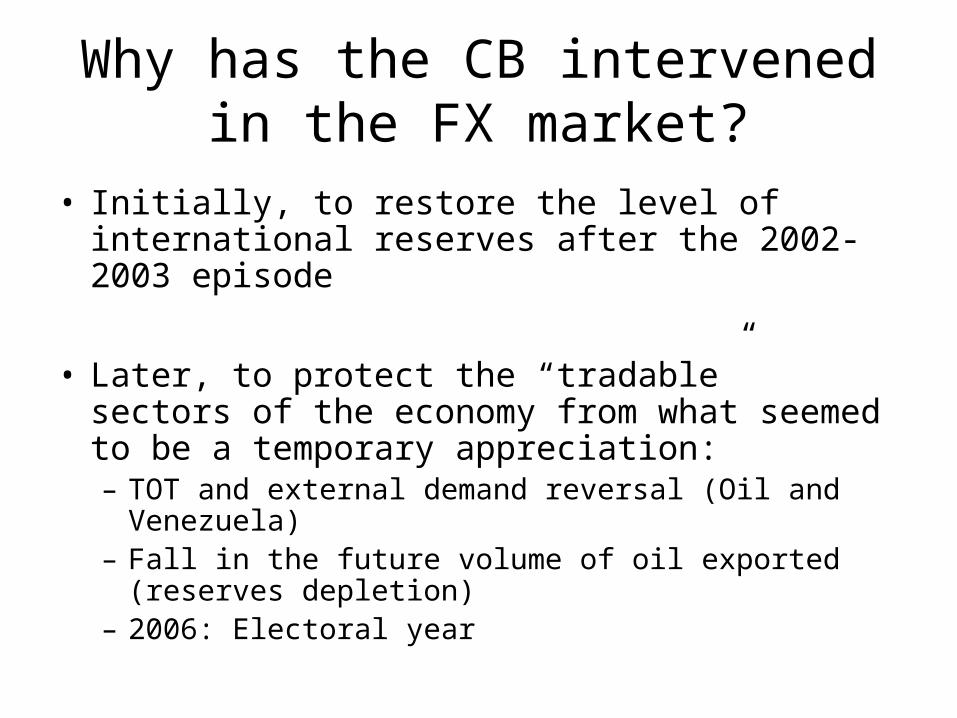
Why has the CB intervened in the FX market?
• Initially, to restore the level of international reserves after the 2002-2003 episode
• Later, to protect the “tradable” sectors of the economy from what seemed to be a temporary appreciation:– TOT and external demand reversal (Oil and
Venezuela)– Fall in the future volume of oil exported (reserves
depletion)– 2006: Electoral year

However, appreciation has lasted longer than expected…
• TOT did not fall. In particular, high oil prices have:– Increased the value of exports– Kept high growth rates in Venezuela and Ecuador – Attracted FDI
• External interest rates and spreads unexpectedly low for an unexpected longer period
• Strong coal exports and FDI• Purchases of Colombian corporations by foreign
investors …. Confidence?
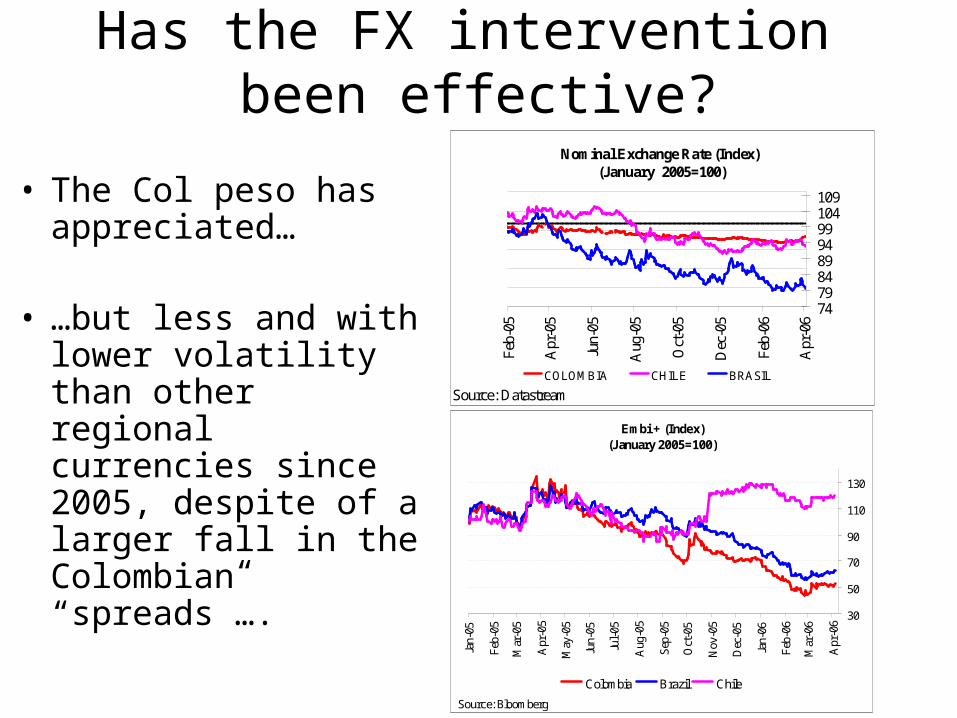
Has the FX intervention been effective?
• The Col peso has appreciated…
• …but less and with lower volatility than other regional currencies since 2005, despite of a larger fall in the Colombian “spreads”….
Nominal Exchange Rate (Index) (January 2005=100)
Feb-
05
Apr
-05
Jun-
05
Aug
-05
Oct
-05
Dec
-05
Feb-
06
Apr
-06
Source: Datastream
747984899499104109
COLOMBIA CHILE BRASIL
Embi + (Index)(January 2005=100)
30
50
70
90
110
130Ja
n-05
Feb
-05
Mar
-05
Apr
-05
May
-05
Jun-
05
Jul-
05
Aug
-05
Sep
-05
Oct
-05
Nov
-05
Dec
-05
Jan-
06
Feb
-06
Mar
-06
Apr
-06
Source: Bloomberg
Colombia Brazil Chile
• However, it is difficult to extract clear conclusions about the effectiveness of intervention:
– Counterfactual?– International comparisons require to control for other
effects
• If appreciation persists, there might be conflicts between FX intervention and the inflation target, especially if the output gap turns positive at a fast rate:
– Reduction of the credibility of the IT or the effectiveness of FX intervention
– Nevertheless, there is ample scope for sterilization:
• CB profits > 0• Small interest rate differential
IV. Is Inflation picking up?

External conditions in 2006-2007 still favor aggregate demand growth and appreciation
(or a small depreciation at best)
• High TOT in 2006 and no strong reversal in 2007
• High growth rates of trading partners
• No strong reversal in capital flows
• Possibly large FDI inflows (mining)
….Although this scenario is subject to great uncertainty, especially regarding capital flows

On the basis of this scenario we forecast a reduction of inflation in 2006 and a rise in
2007…Inflation Forecast
3.0
4.0
5.0
6.0
7.0
2003 Q4 2004 Q4 2005 Q4 2006 Q4 2007 Q4
(%)
3.0
4.0
5.0
6.0
7.0
(%)
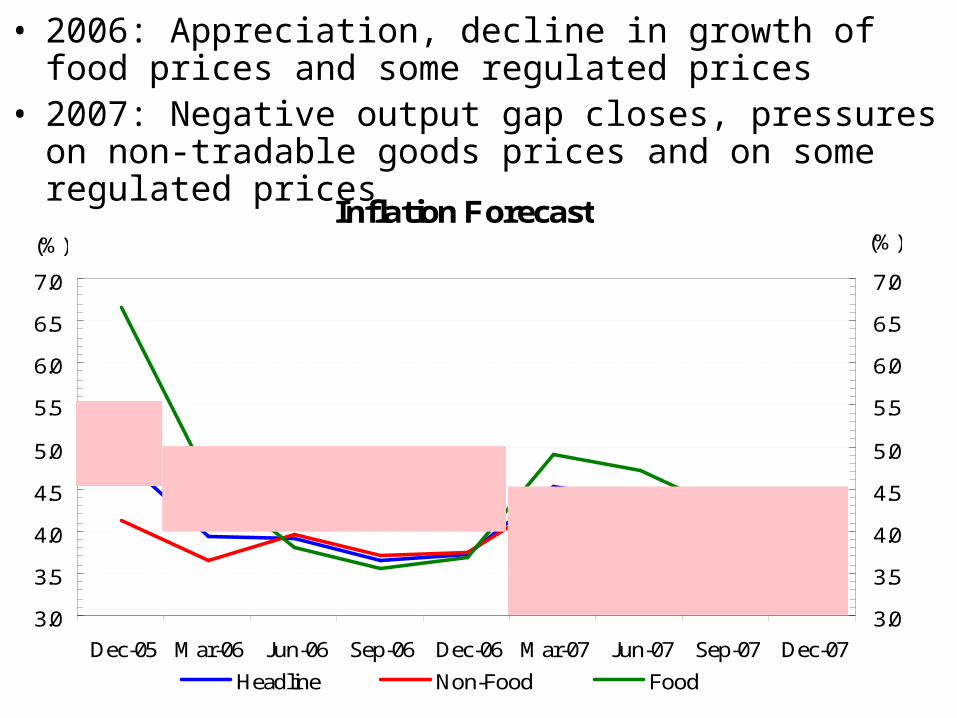
• 2006: Appreciation, decline in growth of food prices and some regulated prices
• 2007: Negative output gap closes, pressures on non-tradable goods prices and on some regulated prices
Inflation Forecast
3.0
3.5
4.0
4.5
5.0
5.5
6.0
6.5
7.0
Dec-05 Mar-06 Jun-06 Sep-06 Dec-06 Mar-07 Jun-07 Sep-07 Dec-07
(%)
3.0
3.5
4.0
4.5
5.0
5.5
6.0
6.5
7.0
(%)
Headline Non-Food Food

• The low initial level of real interest rates and the closure of the output gap (pressure on non-tradable goods prices) will require increases in the interest rates in the future…
• … However, the timing and the size of such moves will depend on the behavior of the economy. In particular, there is uncertainty on:
– The importance of the (one time effect?) increases in productivity and competition. F. ex. many non-tradable sectors still show low or decreasing rates of inflation (expectations or productivity/competition?)
– The evolution of the exchange rate: A faster reversal of the spreads or capital flows will probably require faster and larger increases of the interest rates

V. Is there an Asset Price Bubble?

….No or not a relevant one
• Two key macroeconomic variables:
• …do not show signs of large macro imbalances so far
• Three key asset prices: Real Estate, Stocks, Public Bonds
Current Account Real Fin. SystemBalance (% GDP)* Credit Growth**
2003 -1.2% 1.2%2004 -1.0% 1.7%2005 -1.6% 4.5%2006 -1.6% 10.0%
* 2006: Projection
* Gross local currency loans. Average for the year. 2006: First quarter.
Source: Banco de la República

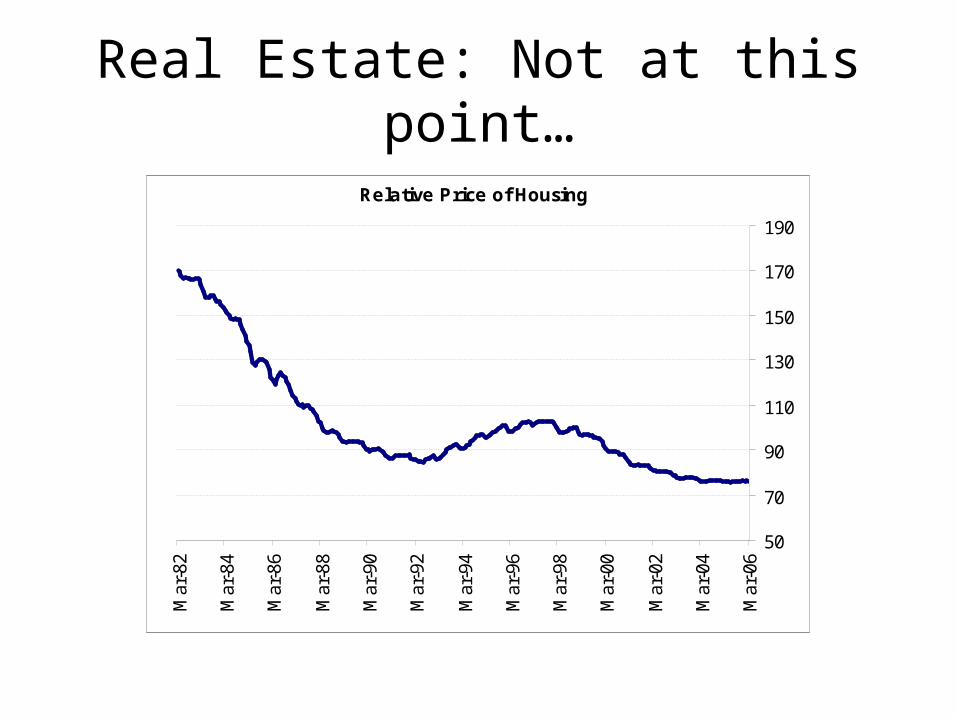
Real Estate: Not at this point…
Real Price of New Homes Sold
75
80
85
90
95
100
Ja
n-9
9
Ju
l-9
9
Ja
n-0
0
Ju
l-0
0
Ja
n-0
1
Ju
l-0
1
Ja
n-0
2
Ju
l-0
2
Ja
n-0
3
Ju
l-0
3
Ja
n-0
4
Ju
l-0
4
Ja
n-0
5
Ju
l-0
5
Ja
n-0
6
dec
emb
er/9
8=
10
0
Bogotá

Real Estate: Not at this point…
Price-Rent ratio for the Housing Market (New Houses)
(Average 1994-2005 = 100)
80
85
90
95
100
105
110
115
120
125
130
Jan
-94
Jan
-95
Jan
-96
Jan
-97
Jan
-98
Jan
-99
Jan
-00
Jan
-01
Jan
-02
Jan
-03
Jan
-04
Jan
-05
Jan
-06
Real Estate: Not at this point…
Relative Price of Housing
50
70
90
110
130
150
170
190
Mar
-82
Mar
-84
Mar
-86
Mar
-88
Mar
-90
Mar
-92
Mar
-94
Mar
-96
Mar
-98
Mar
-00
Mar
-02
Mar
-04
Mar
-06
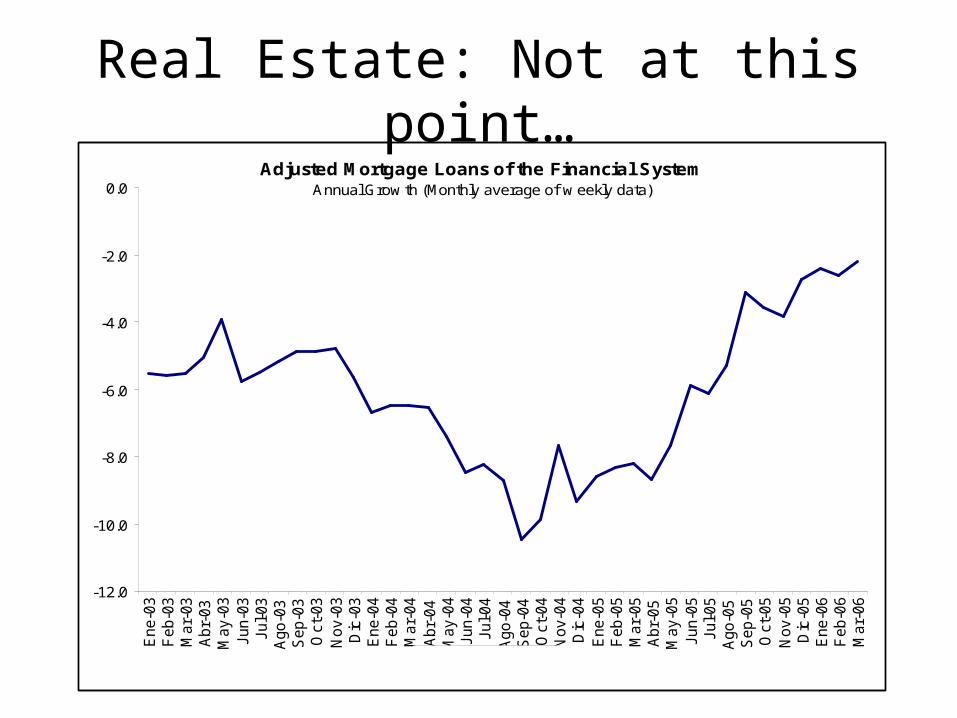
Real Estate: Not at this point…Adjusted Mortgage Loans of the Financial System
Annual Grow th (Monthly average of w eekly data)
-12.0
-10.0
-8.0
-6.0
-4.0
-2.0
0.0
Ene-0
3F
eb-0
3M
ar-
03
Abr-
03
May-0
3Jun-0
3Jul-03
Ago-0
3S
ep-0
3O
ct-
03
Nov-0
3D
ic-0
3E
ne-0
4F
eb-0
4M
ar-
04
Abr-
04
May-0
4Jun-0
4Jul-04
Ago-0
4S
ep-0
4O
ct-
04
Nov-0
4D
ic-0
4E
ne-0
5F
eb-0
5M
ar-
05
Abr-
05
May-0
5Jun-0
5Jul-05
Ago-0
5S
ep-0
5O
ct-
05
Nov-0
5D
ic-0
5E
ne-0
6F
eb-0
6M
ar-
06
Cartera bruta
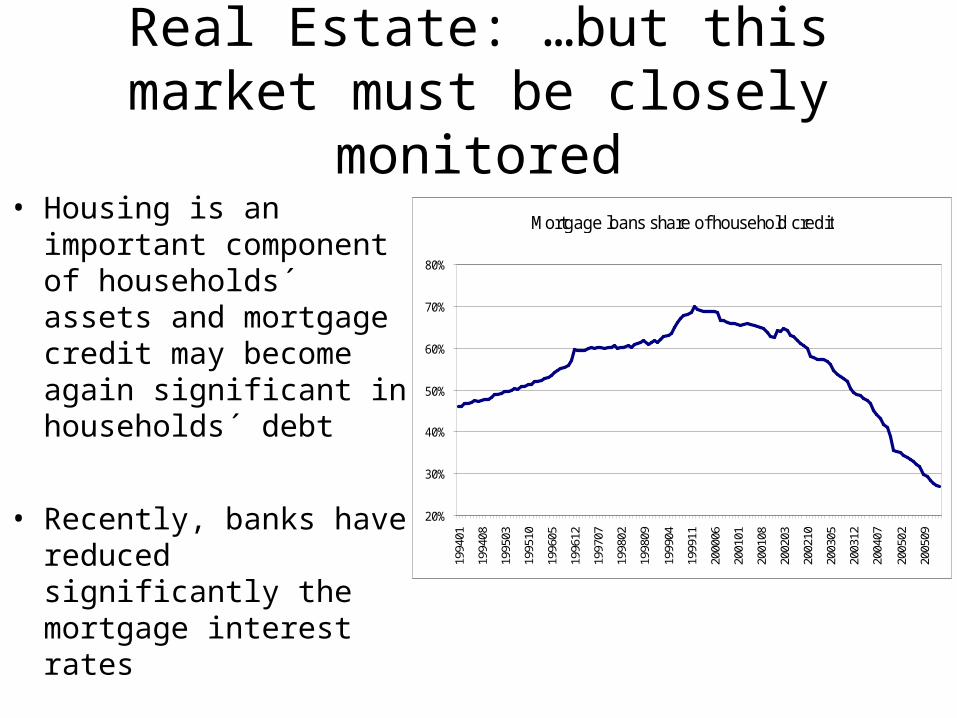
Real Estate: …but this market must be closely monitored
• Housing is an important component of households´ assets and mortgage credit may become again significant in households´ debt
• Recently, banks have reduced significantly the mortgage interest rates
Mortgage loans share of household credit
20%
30%
40%
50%
60%
70%
80%
1994
01
1994
08
1995
03
1995
10
1996
05
1996
12
1997
07
1998
02
1998
09
1999
04
1999
11
2000
06
2001
01
2001
08
2002
03
2002
10
2003
05
2003
12
2004
07
2005
02
2005
09

Stocks: Large price inceases related, among other things, to foreign purchases of colombian companies
Colombia Stock-Exchange General Index
10
30
50
70
90
110
130
150
Jul-0
2S
ep-0
2N
ov-0
2E
ne-0
3M
ar-0
3M
ay-0
3Ju
l-03
Sep
-03
Nov
-03
Ene
-04
Mar
-04
May
-04
Jul-0
4S
ep-0
4N
ov-0
4E
ne-0
5M
ar-0
5M
ay-0
5Ju
l-05
Sep
-05
Nov
-05
Ene
-06
Mar
-06
Ann
ual G
row
th (%
)
Colombia Stock-Exchange General IndexUS Dollars
0
20
40
60
80
100
120
140
160
180
Jul-
02
Se
p-0
2N
ov-
02
En
e-0
3M
ar-
03
Ma
y-0
3Ju
l-0
3S
ep
-03
No
v-0
3E
ne
-04
Ma
r-0
4M
ay-
04
Jul-
04
Se
p-0
4N
ov-
04
En
e-0
5M
ar-
05
Ma
y-0
5Ju
l-0
5S
ep
-05
No
v-0
5E
ne
-06
Ma
r-0
6
An
nu
al G
row
th (
%)
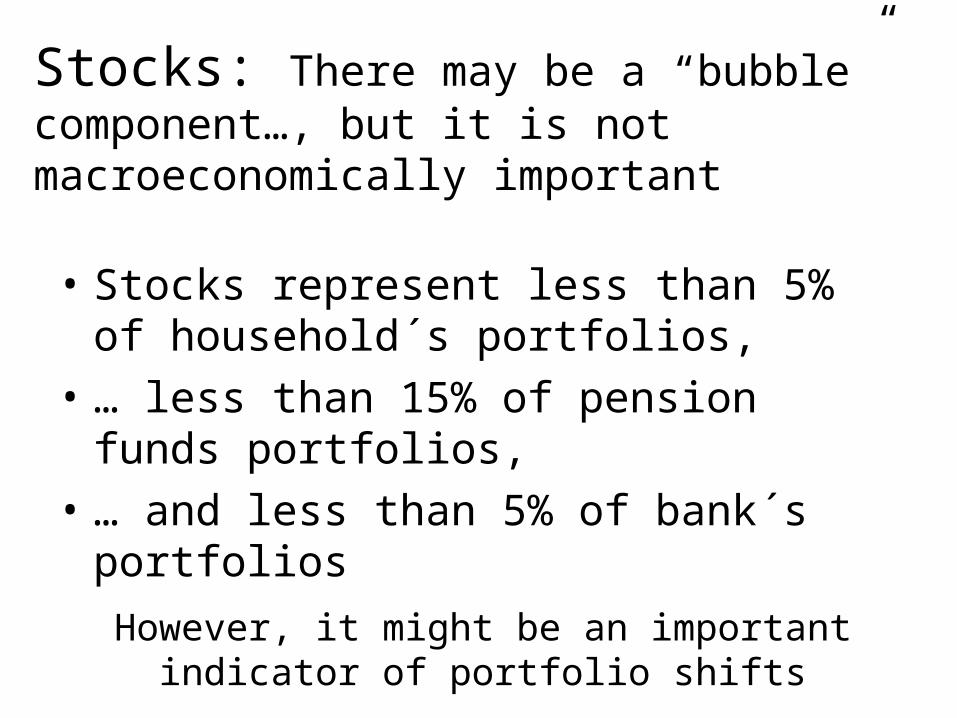
Stocks: There may be a “bubble” component…, but it is not macroeconomically important
• Stocks represent less than 5% of household´s portfolios,
• … less than 15% of pension funds portfolios,
• … and less than 5% of bank´s portfolios
However, it might be an important indicator of portfolio shifts

Domestic Public Bonds: Market risk is a concern, but prices are mostly related to external factors
10-yearTES Yield vs. 10-year US Treasuries Yield
-
2.0
4.0
6.0
8.0
10.0
12.0
14.0
16.0
18.0
2-Ja
n-03
2-M
ar-0
3
2-M
ay-0
3
2-Ju
l-03
2-S
ep-0
3
2-N
ov-0
3
2-Ja
n-04
2-M
ar-0
4
2-M
ay-0
4
2-Ju
l-04
2-S
ep-0
4
2-N
ov-0
4
2-Ja
n-05
2-M
ar-0
5
2-M
ay-0
5
2-Ju
l-05
2-S
ep-0
5
2-N
ov-0
5
2-Ja
n-06
2-M
ar-0
6
0.0
1.0
2.0
3.0
4.0
5.0
6.0
10-year TES Yield 10-year US Treasuries Yield
10-yearTES Yield vs. EMBI Colombia
-
2.0
4.0
6.0
8.0
10.0
12.0
14.0
16.0
18.0
02-J
an-0
3
02-M
ar-0
3
02-M
ay-0
3
02-J
ul-0
3
02-S
ep-0
3
02-N
ov-0
3
02-J
an-0
4
02-M
ar-0
4
02-M
ay-0
4
02-J
ul-0
4
02-S
ep-0
4
02-N
ov-0
4
02-J
an-0
5
02-M
ar-0
5
02-M
ay-0
5
02-J
ul-0
5
02-S
ep-0
5
02-N
ov-0
5
02-J
an-0
6
02-M
ar-0
6
0
100
200
300
400
500
600
700
800
10-year TES Yield EMBI Colombia

END

Workers´ Remittances
◄
COLOMBIA: WORKERS REMITTANCES1994-2005
788
1,297
1,578
2,021
2,454
3,0603,170
3,314
0
500
1000
1500
2000
2500
3000
3500
1998 1999 2000 2001 2002 2003 2004 2005
US
D M
illio
ns
Workers RemittancesSource: Balance of Payments- Banco de la República
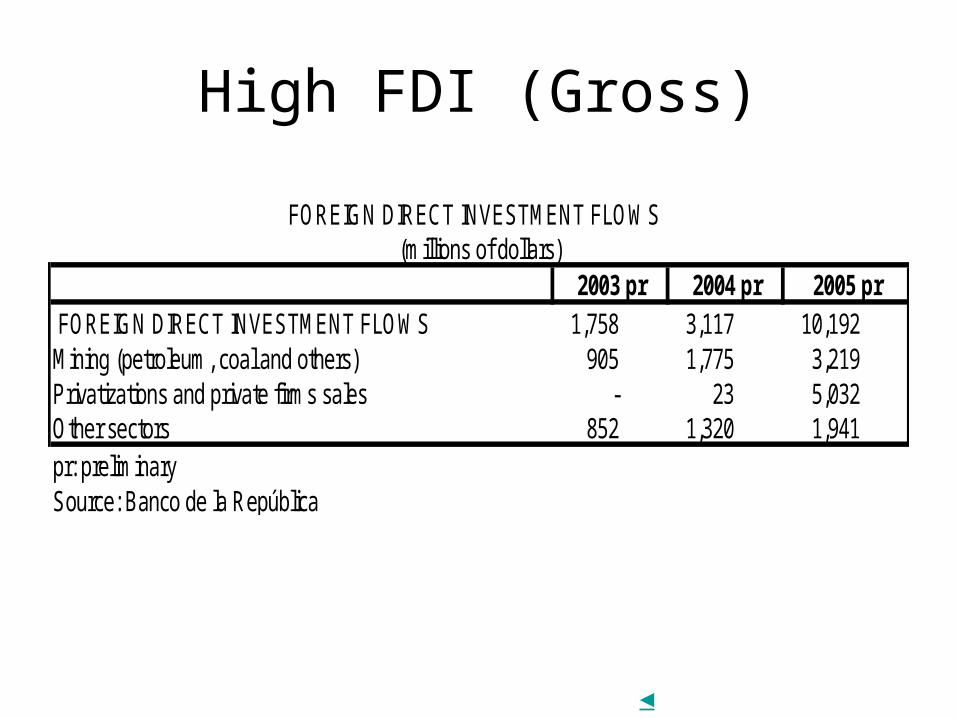
High FDI (Gross)
◄
FOREIGN DIRECT INVESTMENT FLOWS (millions of dollars)
2003 pr 2004 pr 2005 prFOREIGN DIRECT INVESTMENT FLOWS 1,758 3,117 10,192
Mining (petroleum, coal and others) 905 1,775 3,219 Privatizations and private firms sales - 23 5,032 Other sectors 852 1,320 1,941 pr: preliminarySource: Banco de la República
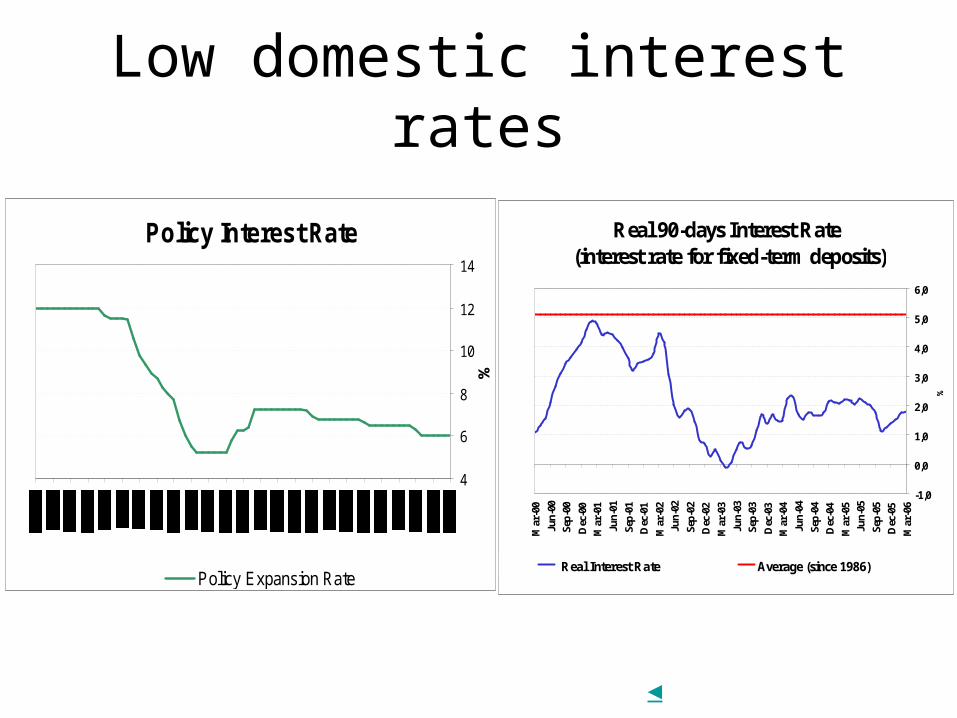
Low domestic interest rates
Policy Interest Rate
4
6
8
10
12
14
%
Policy Expansion Rate
◄
Real 90-days Interest Rate (interest rate for fixed-term deposits)
-1,0
0,0
1,0
2,0
3,0
4,0
5,0
6,0
Mar
-00
Jun-
00
Sep-
00
Dec
-00
Mar
-01
Jun-
01
Sep-
01
Dec
-01
Mar
-02
Jun-
02
Sep-
02
Dec
-02
Mar
-03
Jun-
03
Sep-
03
Dec
-03
Mar
-04
Jun-
04
Sep-
04
Dec
-04
Mar
-05
Jun-
05
Sep-
05
Dec
-05
Mar
-06
%
Real Interest Rate Average (since 1986)

Improvement of balance sheets of the financial system, households and firms
◄
Capital Adequacy RatioCredit Institutions
10%
11%
12%
13%
14%
15%
16%
17%
Feb
-96
Oct
-96
Jun-
97
Feb
-98
Oct
-98
Jun-
99
Feb
-00
Oct
-00
Jun-
01
Feb
-02
Oct
-02
Jun-
03
Feb
-04
Oct
-04
Jun-
05
Feb
-06
Households Financial Debt/Financial Assets
0%
10%
20%
30%
40%
50%
60%
70%
1996 1997 1998 1999 2000 2001 2002 2003
Private Corporate Sector Debt/Equity
0%
5%
10%
15%
20%
25%
30%
35%
2000 2001 2002 2003 2004

Growing business and consumer confidence
Consumer Confidence
25.1
13.9
-30
-20
-10
0
10
20
30
40
Nov
-01
Feb
-02
May
-02
Aug
-02
Nov
-02
Feb
-03
May
-03
Aug
-03
Nov
-03
Feb
-04
May
-04
Aug
-04
Nov
-04
Feb
-05
May
-05
Aug
-05
Nov
-05
Feb
-06
Source: Fedesarrollo
(Index)
◄
Manufacturing Cofidence Indicator(Trend component)
-30
-20
-10
0
10
20
Jan-
00A
pr-0
0Ju
l-00
Oct
-00
Jan-
01A
pr-0
1Ju
l-01
Oct
-01
Jan-
02A
pr-0
2Ju
l-02
Oct
-02
Jan-
03A
pr-0
3Ju
l-03
Oct
-03
Jan-
04A
pr-0
4Ju
l-04
Oct
-04
Jan-
05A
pr-0
5Ju
l-05
Oct
-05
Jan-
06
Source: Fedesarrollo and Banco de la República

Increasing productivity?
◄
Imports of Capital Goods(Last 12 Months)
3000
3500
4000
4500
5000
5500
6000
6500
7000
7500
8000
8500
May
-98
Sep
-98
Jan
-99
May
-99
Sep
-99
Jan
-00
May
-00
Sep
-00
Jan
-01
May
-01
Sep
-01
Jan
-02
May
-02
Sep
-02
Jan
-03
May
-03
Sep
-03
Jan
-04
May
-04
Sep
-04
Jan
-05
May
-05
Sep
-05
Jan
-06
Source: DANE
US$ Millions
-40%
-30%
-20%
-10%
0%
10%
20%
30%
40%
50%
Growth
Imports
Annual Growth

Inflation expectations close to targets
Annual Inflation Expectations Banks and Brokers
(Expectation made in month i for month i one year ahead)
4.0%
4.5%
5.0%
5.5%
6.0%
6.5%
Sep
-03
Nov
-03
Jan-
04
Mar
-04
May
-04
Jul-0
4
Sep
-04
Nov
-04
Jan-
05
Mar
-05
May
-05
Jul-0
5
Sep
-05
Nov
-05
Jan-
06
Mar
-06
◄
Annual Inflation Expectations Banks and Brokers
(Expectation made in month i for december of the same year)
4.0%
4.5%
5.0%
5.5%
6.0%
6.5%
7.0%
Sep
-03
Nov
-03
Jan-
04
Mar
-04
May
-04
Jul-0
4
Sep
-04
Nov
-04
Jan-
05
Mar
-05
May
-05
Jul-0
5
Sep
-05
Nov
-05
Jan-
06
Mar
-06


