47
Monetary Policy, Output Composition and the Great Moderation Benoît Mojon Federal Reserve Bank of Chicago WP 2007-07
Monetary Policy, Output Composition and the Great Moderation Benoît Mojon
Fe
dera
l Res
erve
Ban
k of
Chi
cago
WP 2007-07
Monetary Policy, Output Composition and the Great Moderation
Benoît Mojon� y
June 2007, (�rst draft: November 2005)
Abstract
This paper shows how US monetary policy contributed to the drop in the volatility of US output�uctuations and to the decoupling of household investment from the business cycle. I estimate amodel of household investment, an aggregate of non durable consumption and corporate sectorinvestment, in�ation and a short-term interest rate. Subsets of the models�parameters can varyalong independent Markov Switching processes.
A speci�c form of switches in the monetary policy regimes, i.e. changes in the size of monetarypolicy shocks, a¤ect both the correlation between output components and their volatility. A regimeof high volatility in monetary policy shocks, that spanned from 1970 to 1975 and from 1979 to1984 is characterized by large monetary policy shocks contributions to GDP components and by ahigh correlation of household investment to the business cycle. This contrasts with the 1960�s, the1976 to 1979 period and the post 1984 era where monetary policy shocks have little impact on the�uctuations of real output.
Keywords: business cycle volatility, monetary policy, Markov Switching VAR
JEL classi�cation: E3 E5
�E-mail address: [email protected]; Federal Reserve Bank of Chicago, on leave from the EuropeanCentral Bank. Tel.: 1-312-322-2303.
yI wish to express special thanks to Daniel Waggoner and Tao Zha for sharing their code and for invaluablesuggestions in the course of this research project. I also want to thank Klaus Adam, Michel Aglietta, FilippoAltissimo, Gadi Barlevi, Marco Bassetto, Jean Boivin, Anton Brender, Je¤ Campbell, Steve Cecchetti, LarryChristianno, Martin Eichenbaum, Charles Evans, Jonas Fisher, Domenico Giannone, Anil Kashyap, MicheleLenza, Simone Manganelli, Florence Pisani and Daniele Terlizzese for stimulative discussions as well as DavidMiller for outstanding research assistance. The paper re�ects the author�s view alone and neither the onesof the Federal Reserve Bank of Chicago nor the Federal Reserve System, nor the European Central Bank.

Monetary Policy, Output Composition and the Great Moderation 2
1. Introduction
This paper investigates the role of monetary policy in two related aspects of the greatmoderation: the mid 1980�s decline of US output volatility and the decoupling of householdinvestment expenditure from the business cycle. This decoupling, which was particularlyobvious during the 2001 recession, sharply contrasts with the high degree of co-movementbetween GDP components that prevailed before the mid-1980�s.Why has household investment become less correlated to other GDP components and
why does it matter for assessing the role of monetary policy in the reduction of US outputvolatility? Precisely, as this paper shows, because the monetary policy instability thatcharacterizes the �fteen years prior to the great moderation ampli�ed the �uctuations ofGDP components as well as their co-movement. This co-movement of two GDP componentsimplies, ceteris paribus, a higher variance of GDP.These results resolve an ongoing controversy on the role of monetary policy in the great
moderation of output �uctuations. A widely held view is that the reaction function of theFederal Reserve changed when Paul Volcker became Chairman of the FOMC (see for instance,Clarida, Galì and Gertler, 2000, Cogley and Sargent, 2005a, Lubik and Schorfheide, 2004,Boivin, 2006, and many others).1 In essence, the response of the short-term real interest ratesto in�ation increased, became positive and therefore stabilizing for nominal as well as forreal �uctuations. However, changes in the coe¢ cients of the central bank reaction functionhave little impact on the magnitude of output �uctuations. Lubik and Schorfheide (2004)�nd that, in the indeterminacy regime that best characterizes the data of the 1970�s, thesunspot shocks raise the variance of in�ation and the nominal interest rate, but have hardlyany impact on the variance of output. Stock and Watson (2003), who simulate post 1984monetary policy rules in the 1970�s, conclude that monetary policy "had the major impact ofbringing in�ation under control but happened not to have had a large e¤ect on the cyclicalvolatility of output". Moreover, several econometric tests have failed to reject stability inthe coe¢ cients of the monetary policy rule or the transmission of monetary policy.23
1See also the account of changes in the policy makers views on the controlability of in�ation and thedesirability of disin�ation in Romer and Romer (2002), DeLong (1997, 2003) and Cogley and Sargent (2005b).
2Bernanke and Mihov (1998) is an early example. Among the more recent contributions, Canova andGambeti (2005) showed that, although there is some evidence of coe¢ cient instability in the 1979-1982period, the response of interest rates to in�ation in the 1990�s is not clearly supperior to 1 nor to the esponseestimated in the 1970�s. They also show that the monetary policy transmission has changed little over thelast 40 years. See also Leeper and Zha (2003) and Canova (2005).
3Sims and Zha (2006) attempt to reconcile the con�icting econometric tests on changes in the "Taylor"coe¢ cient. They come to the view that one can �nd evidence of changes in the coe¢ cients of the FederalReserve reaction function if one is looking for such changes. Correspondinly, they stress that speci�cationswhere time variation is limited to the magnitude of the shocks hitting the economy have a much better �tof the data.

Monetary Policy, Output Composition and the Great Moderation 3
Against this background, I revisit the role of monetary policy in the mid-1980�s drop inoutput volatility using a two sector Markov Switching VAR of the US business cycle. Thetwo sectors are household investment, i.e. the sum of durable consumption and residentialinvestment, and the rest of domestic private sector demand (DPD, thereafter), i.e. thesum of non-durable consumption and corporate investment. This decomposition of outputis warranted because the drop of GDP variance is essentially the drop of the variance ofDPD, while net exports and government consumption play hardly any role, and the dropin the variance of DPD is owed largely to the decoupling of household investment from thebusiness cycle. The Markov Switching VAR estimation procedure that Sims, Waggoner andZha (2006) developed is then used to identify when the model�s parameters changed andwhich of these changes in�uenced the covariance of the two DPD components included inthe model.I �nd that the change in the size of monetary policy shocks is the only pattern of time
variation that has an impact on both the variance of DPD and the cross-correlation of itssub-components. DPD variance has been very high in regimes of high volatility of monetarypolicy shocks that have taken place from 1970 to 1975 and from 1979 to 1982, and lower inthe 1960s and between 1976 and 1979 and from 1985 to 2006. The regime of highly volatilemonetary policy shocks is one where these shocks have taken the business cycle in and out ofthe four recessions that took place between 1969 and 1982. This contrasts sharply with the1991 and especially with the 2001 recession, during which the monetary policy shocks didnot amplify the slowdown. Smaller monetary policy shocks reduce the relative importanceof a source of business cycle �uctuations that has, over the last 50 years, moved householdinvestment, household consumption and corporate sector investments together.These results bring a new perspective on the role of monetary policy in the great mod-
eration. They can be seen as an illustration of the impact of a particularly erratic monetarypolicy that largely conforms to the narrative analysis of monetary policy by Romer andRomer (2002). They stress that "in the 1970�s ... monetary policy was used aggressively tosupport rapid economic growth... in�ation became a problem and periodic severe recessionswere necessary to keep in�ation under check." The amplitude of unsystematic monetarypolicy during the early to mid-seventies and, as this paper shows, in the �rst years of PaulVolcker�s FOMC Chairmanship, added considerable real volatility. The reduced scale of theunsystematic monetary policy under Greenspan, i.e. not deviating from a systematic "lean-ing against the wind" interest rate rule, implies much smaller contributions of monetaryshocks to the volatility of GDP growth, in particular around the recessions of 1991 and 2001.These conclusions di¤er from the view that monetary policy had little e¤ects on the scale
of output �uctuations for essentially three reasons. First, the model focuses on a decompo-sition of output that is highly relevant for the understanding of the great moderation. Most

Monetary Policy, Output Composition and the Great Moderation 4
of the literature relies on one sector models (the above references and Boivin and Giannoni,2006, Benati, 2006, Benati and Mumtaz, 2007, Blinder and Reis, 2005, Stock and Watson,2002, 2003, Gordon, 2005, among others). A notable exception is Justiniano and Primiceri(2006), who analyze the great moderation using DGSE models that disentangle consump-tion from investment. In line with the state of the art estimated DSGE models, they usean investment measure that aggregates corporate and household investment. This paperfocuses on another decomposition of demand because household investment have been muchless correlated to either corporate investment or non durable consumption from 1985 to 2006than between 1965 and 1984.4
This decoupling is likely to re�ect structural changes in the �nancing of the householdsector. The required downpayment to issue mortgages has fallen steadily since 1976 and anincreasing number of households have used mortgage re�nancing as a source of cash in theevent of a decline in [long-term] interest rates (Canner et al., 2002). To the extent that long-term interest rates are correlated to the business cycle, more households have become able toshield their expenditure plans from business cycle induced reduction in income (Brender andPisani, 2005).5 Turning to automobiles, an important part of durable consumption, Rameyand Vine (2004) found that the volatility of inventories has dropped in line with in thepersistence of car sales, which is itself driven by changes in the dynamics of interest rates.6
E¤ectively, the last two US recessions, in 1991 and 2001,7 are characterized by an increasein the household leverage, which contrasts sharply with the four US recessions previous tothese two and may have helped dampen the business cycle. For all these reasons, I estimatea model that decomposes output to allow an explicit description of household investmentand compare its dynamics to the dynamics of other expenditure components of GDP.Second, the analysis presented in this paper estimates rather than imposes the dates
of changes in monetary policy regimes. The Sims, Waggoner and Zha (2006) estimationprocedure gives the possibility to test for regimes switches regarding either systematic orunsystematic monetary policy along Markov processes that are independent from the ones
4The correlation between the contribution of corporate investment and the contribution of durable con-sumption and residential investment to the growth rate of US GDP was 0.46 between 1965 Q1 and 1984 Q4.It was -0.14 between 1985 Q1 and 2006 Q3. Household investment has also become markedly less correlatedto non-durable and services consumption while the correlation betwen corporate investment and non durableand services consumption has not changed signi�cantly from the two decades before 1984 to the post 1984period.
5Campbell and Hercowitz (2006), Cecchetti et al. (2005), Dynan et al. (2006), and Fisher and Gervais(2006) have also pointed to the broader availability of �nancial instruments as a cause of macroeconomicstability.
6Herrera and Pesavento (2004) con�rm a link between the drop in the volatility of inventories and areduction in the volatility of manufacturing sales.
7The 2001 recession was actually the �rst time since 1947 when residitial investment kept a positivecontribution to GDP growth during a recession.

Monetary Policy, Output Composition and the Great Moderation 5
that govern potential changes in the variance of non policy shocks and the response of eachvariable of the model to these shocks. The estimation lumps together some of the 1970�swith a large period of Volcker Chairmanship of the FOMC as one regime of highly volatilemonetary policy shocks. The estimated sub-samples of monetary policy instability givethe model a much more precise account of the impact of monetary instability on output�uctuations than the common practise of considering all the observations before or after1979 or 1982 as one homogenous regime. In this respect, the results con�rm the importanceof abandoning the idea of once-and-for-all non stochastic regime switches (Sims and Zha,2006).Third, the impact of monetary policy on output �uctuations is not limited to changes
in the coe¢ cients of the policy rule and in particular to what has become refered to the"Taylor" coe¢ cient, i.e. the response of the interest rate to in�ation. While both changesin the coe¢ cients in the policy rule and changes in the size of monetary policy shocks areexplored, only the latter has a large e¤ect on the variance and covariance of GDP components.The paper goes as follows. Section 2 describes the changes in the covariance structure
of the expenditure components that add up to GDP. Section 3 brie�y presents the MarkovSwitching VAR model and the form of time variation that it can test. Section 4 presents thetiming of switches in the models parameters and how they impact the covariance structureof GDP components. Section 5 summarizes the main results and concludes.
2. Covariances of GDP components and the great moderation
2.1. Changes in correlations of GDP components
There is already a dense literature on the great moderation of US nominal and realbusiness cycle volatility (see the survey by Stock andWatson, 2002 and more recent referencesin Justiniano and Primiceri, 2006). Thanks to this literature, we know that the drop in realvolatility is very much shared across the di¤erent expenditure components that add up toGDP and that it all starts in 1984.Few papers also highlight that, beyond single components� volatility, the correlation
and hence the covariance of some speci�c component has contributed to the fall of GDPgrowth variance. These changes in correlation are important for two reasons. First, theyare suggestive of new endogenous adjustments of GDP components and thereby may leadus to the formulation of structural interpretation of the great moderation.8 Second, theyimply that one sector models could miss an essential characteristic of the greater stability of
8To some extent, because residuals re�ect our "ignorance", many economists consider the Good Luckexplanation of the Great Moderation as deeply unsatisfactory.
Monetary Policy, Output Composition and the Great Moderation 6
output �uctuations.Early on, Kahn et al. (2003) reported the change in the covariance of inventories, in-
vestment and sales. This evolution can be due to the impact of IT on the supply side ofinventories (McConnel and Perez-Quiros, 2000), to the impact of �nancial innovation on thedemand of durable goods or again to better monetary policy (Ramey and Vine, 2006). Morerecently, Irvine and Schuh (2005), who use a supply side decomposition of output, stressthat a large share of the output volatility decline is due to a reduction of the co-movementof sectorial business cycles. This result lead them to reject the Good Luck hypothesis. Galìand Gambetti (2007) stress the same intuition that, had good luck been prominent in thegreat moderation, we should not observe changes in the correlation of output components.Finally, Dynan et al (2005) show that savings and income have become more correlated
than they were, an evolution which should provide some form of automatic stabilization.This, again, could result from the improved completeness of the �nancial instruments avail-able to US households.In the following, I therefore propose to show whether and how the variance and the
covariance of GDP main components have changed over time. Following the analysis reportedin the �rst section of Stock and Watson (2002), I opt for the simplest form of time variation.I compare covariances across sub-samples and before and after 1984.9
2.2. The covariance matrix of DPD components contributions to the growth rate of GDP
My analysis of the (co)variance deviates slightly from Stock and Watson (2002) andothers in a small and but nevertheless useful respect. Given that GDP growth is a weightedaverage of the growth rate of GDP components, I compute the full covariance matrix of theGDP growth contributions of GDP components. The contributions are directly taken fromNIPA Table 1.1.2 published by the Bureau of Economic Analysis.To start with, I focus on six components of GDP: consumption of durable goods, con-
sumption of non-durable goods, consumption of services, �xed non-residential investment,residential investment and changes in inventories. These components, whose sum can belabelled DPD, are the most relevant because, as shown in Table 1, the variances and co-variances involving net exports and government consumption had little impact on the post-1984 drop in the volatility of GDP growth. Actually, from 1965-1984 to 1985-2007, thevariance of the DPD contribution to GDP growth has dropped more than the variance ofGDP growth.
9Actually, McConnel and Perez-Quiros (2000) estimated 1984 as the date of the break in the volatility ofUS GDP growth. Stock and Watson (2002) con�rmed that the fall in volatility is of a discrete nature andthat its most likely date is indeed 1984.

Monetary Policy, Output Composition and the Great Moderation 7
The second panel of the table reports two summary statistics of the covariance matrixof these six components for the full post 1947 sample, and three sub-samples of about twodecades each: 1976-1965, 1965-1984 and 1985-2006. Hence the post 1984 era can be comparedto samples of similar length. The �rst summary statistic is the trace of the covariance matrixwhich summarizes the change in volatility of each GDP component taken in isolation. Thesecond is the sum of the o¤-diagonal elements of the co-variance matrix, which allows us toassess the importance of co-movements in GDP components in the variance of GDP growthacross samples.10
I do this decomposition both for contributions to quarter on quarter annualized GDPgrowth rates (in the top panel) and for their �uctuations of periodicity comprised between6 and 32 quarters as extracted by a band pass �lter (in the bottom panel).First, Table 1 reveals that the great moderation is indeed remarkable. The variance of
the GDP growth rate is divided by �ve, from about 20 % of annualized qoq GDP growthrate in the second sub-sample (Column c) to 4 % in the third sub-sample (column d). Thevolatility of the DPD contribution drops by an even larger magnitude, which is why the restof this paper will abstract from net exports and government consumption.11
Second, the covariance terms in the variance of DPD fall from 11 %, i.e. nearly half ofthe variance DPD growth variance in the 1965-1984 sample to zero in the post 1985 sample.And the contribution of co-variances to the drop in variance after 1984 is even larger, inrelative terms, at business cycle frequencies.Taking a closer look at the data indicates that not all the 15 bilateral cross-correlations
between the 6 contributions to the growth rate of GDP have dropped over time. The bulkof the drop in the covariances after 1984 comes from the fall in the correlation between�household investments�, i.e. durable goods consumption plus residential investment (fhtthereafter) and the rest of DPD (ffcht, thereafter). The time series of these two sub-aggregate of GDP/DPD are reported in the top panels of Figure 1 and their variance andcovariance are given in Table 2. Both series have had smaller �uctuations after the mid-1980�s. In particular, fht has dropped much less in the two recessions of the post-1984sample than in ones preceding it (see Figure 1). US households have increased their leveragethrough out the last two decades (Report on the Survey of Consumer Finance, FederalReserve Monthly Bulletin 2006) including in 1991 and in 2001. This evolution may havedampened macroeconomic �uctuations in the sense that household investment becomes lessdependent on their current income (Brender and Pisani, 2005, Campbell and Hercowitz,10To �x ideas on the role of correlations and covariances in the variance of an aggregate, we have V ar(x+
y) = V ar(x) + V ar(y) + 2Cov(x; y) and Cov(x; y) = Cor(x; y)�pV ar(x)� V ar(y):
11The variance of the aggregate of net exports and government consumption also drops after 1984. However,its covariance with DPD becomes much less negative. This is why, altogether, net exports and governmentconsumption explain little in the drop of GDP variance around 1984.

Monetary Policy, Output Composition and the Great Moderation 8
2004). E¤ectively, the correlation between ffcht and fht has become slightly negative andthe covariance of household investment expenditure and the rest of DPD has stopped tocontribute positively to the variance of GDP.To sum up, the great moderation comes from a more stable DPD and the drop in the
correlation of two speci�c sub-aggregates of DPD accounts for a sizeable fraction of theoutput stabilization.12 This evolution may be related to transformations of the US �nancialsystem (Dynan et al, 2005, Fisher and Gervais, 2006, Campbell and Hercowitz, 2004 andreferences therein) and their e¤ects on household�s expenditure.It is important to stress that this sectorial decomposition of output is not the one usually
chosen to estimate DSGE models. Christiano, Eichenbaum and Evans (2005), Smets andWouters (2007) and their numerous followers bundle together corporate and household in-vestment as "investment" in the model. However, the correlation between the corporate andhoushold investment has dropped dramatically during the last three decades (see footnote 4).Because this correlation is a constitutive feature of the great moderation, it could be desirableto estimate a time varying parameters DSGE model that singles out household investmentto analyze the great moderation.13 Rather than addressing this ample task, the followingsections of the paper present the estimates of reduced-form models with time varying para-meters in the spirit of Cogley and Sargent (2005a), Canova and Gambetti (2006), Primiceri(2005), Sims and Zha (2006) among many others. These reduced-form models have theadvantage of being free of speci�c functional form assumptions necessary to estimate DSGEmodels.
3. A Markov Switching VAR evidence on the origin of the great moderation
3.1. The baseline model
The baseline VAR used for the analyzis models a vector of four endogenous variables:
y0t = (ffcht; fht; �t; it) (1)
12Stock and Watson (2005) showed that the drop of the variance of GDP growth is an internationalphenomenon. Unfortunately, we can�t replicate Table 1 for other countries because the quarterly nationalaccounts usually do not decompose investment into residential and non-residential. Moreover, quarterlynational accounts data are usually not available before 1980. Partial evidence, based on shorter time seriesof consumption and investment show some decline in the 1990�s of the correlation between the two maincomponents of GDP in the UK, Australia, Italy, Japan, Spain and Belgium, but neither in France nor in theNetherlands. I leave the systematic study of international data for future research. See also Cecchetti et al.(2006) for a cross-country assessment of the e¤ects of improvements in the conduct of monetary policy.13 Interestingly, two recent papers, Calza et al (2006) and Iacoviello and Neri (2007), single out residential
investment within estimated constant parameters DSGE models. See also the discussion in Monacelli (2006).

Monetary Policy, Output Composition and the Great Moderation 9
1) ffcht is the sum of the contributions to the GDP growth rate of the consumptionof non durable goods, consumption of services, non-residential �xed investment and changein inventories.2) fht, household investment, is the sum of the contributions to the GDP growth
rate of durable consumption and residential investment,3) �t is the in�ation rate of the GDP de�ator,4) it is the interest rate on federal funds.While the small number of variables may limit our ability to identify exogenous mone-
tary policy shock, this model is preferred as a baseline in order to maximize the chances todetect regime switches in the data. I however checked that the main results hold in mod-els that contain additional variables, including monetary aggregates, credit aggregates andcommodity prices.The model is estimated over the 1960-2006 sample with quarterly data.14 The identi�ca-
tion of monetary policy shocks is recursive as in Christiano, Eichenbaum and Evans (1999).In particular, the central bank information set comprises contemporaneous developments inthe other variables of the model. The three other shocks, which are not given any structuralinterpretation, are also orthogonalized via a Cholesky decomposition of the VAR innovations.One important shortcoming of analyzing the dynamics of y0t with a standard, constant
parameters, VAR model is that it would imply that the variables have a constant covariancematrix. It would therefore be totally at odd with the evidence of a decline in the varianceof US output. This is why we turn to the recently developed estimation procedure of Sims,Waggoner and Zha (2006).15
3.2. The Sims,Waggoner and Zha (SWZ) methodology
SWZ have developed a Bayesian estimation of VAR models where subsets of parametersof the VAR evolve along independent Markov Switching processes. This section gives a briefoverview of their approach. For a comprehensive presentation, the interested reader shouldreport to SWZ and the seminal contributions by Hamilton (1989, 1994) and Kim and Nelson(1999).Following SWZ, we assume that the time series of interest can be modelled as a VAR
which parameters depend on unobserved Markov Switching processes. The model can be
14The time series where obtained from the BEA web site and, for the interest rate, monetary, credit andthe index of commodity prices, from HAVER.15Another possibility would be to �t a VAR with drifting coe¢ cients and variance, as performed by
Canova and Gambeti (2006), Cogley and Sargent (2005a) and Primiceri (2005). A systematic comparison ofthe Markov Switching VARs and the VAR with drifting parameters would, however, goes beyond the scopeof this paper.

Monetary Policy, Output Composition and the Great Moderation 10
described as
y0
tA0(st) =pPi=1
y0
t�iAi(st) + "0
t��1(st)1 for � t � T (2)
wherep is the lag length,yt is an n dimensional vector of endogenous variables (e.g. (1)),each observation belongs to one of k states st with some probability and for each of the
k states of the model, A(k) is invertible and Ai(k) are n�n matrices and ��1(k) is an n�ndiagonal matrix.Q is a Markov transition matrix of which the element qi;j gives the probability that st is
in state i and st�1in state j.All qi;j � 0 and
Xj
qi;j = 1.
3.2.1. Restrictions on the time variation and the transition probability matrix
The pattern of time variation as formulated in (2) is so general that it may be impossibleto estimate for lack of degrees of freedom. Without restrictions on time variation, a VAR ofn macroeconomic variables with p lags and k states would imply the estimation of k � (n�(n� p+ 1) + (n� (n� 1)=2)) parameters for the VAR plus k � (k � 1) free elements in thematrix of cross-states transition probabilities Q.16 This is why SWZ introduced restrictionson the time variation patterns allowed in the model.First, the time variation of the parameters is constrained to the long run e¤ects of variable
j on variable i, though the lag structure of the impact is similar across states. This meansthat each additional state add only n� n more parameters on top of the (n� (n� p+ 1) +(n� (n� 1)=2)) that are estimated in the constant parameter VAR.Second, the transition probability matrix Q is the Kronecker product of � sub-transition
probability matrices Qk that are associated to independent Markov processes. Each of thesewill, eventually, govern changes in a subset of VAR parameters. We have
Q = Q1 :::Q�
where is the Kronecker product.Such a structure for Q greatly reduces the number of transition probabilities to be esti-
mated. In the case of our benchmark model, a 4 equations VAR, we allow the variance ofeach of the four shocks of the model to take one of two values between 1960 and 2006. In16To �x ideas, a 4 variables VAR with 4 lags and 12 regimes would imply that 1020 free parameters have
to be estimated.

Monetary Policy, Output Composition and the Great Moderation 11
other words, we associate an independent two states Markov process to the variance of eachshock. This amounts to allowing for 24 = 16 di¤erent states. An unrestricted transitionprobability matrix Q would require the estimation of 16 � (16 � 1) = 240 free parameters.Instead, the composition of four 2� 2 transition probability matrices involve the estimationof 8 free parameters.17
This formalization of the transition across regimes is very well suited for our purposebecause subsets of the parameters of a time series model can change value along independentMarkov processes. Hence changes in the coe¢ cients or the error term variance of each ofthe model�s equations can evolve depending on a speci�c Markov process. This is convenientbecause each subset of parameters may pertain to a speci�c economic hypothesis. The mainadvantage of this methodology over the one used by Sims and Zha (2006) is the ability to focuson particular parameters of the model and check whether the data point to regime switchingfor these parameters independently from regime switching that would signal changes of otherparameters of the model.For example, consider using a standard VAR of output growth, in�ation and the short-
term interest rate to assess the relative importance of �Good Luck, Good Practices andGood Policies�. A �rst Markov Process would be used to model �Good Luck�as potentialchanges in the size of the shocks a¤ecting output and in�ation. A second Markov Processwould be associated to �Good Practices�, i.e. to changes in the propagation of shocks tothe economy, i.e. the coe¢ cients of the output growth and the in�ation equations. A thirdMarkov Process would pertain to �Good Policies�, changes in the coe¢ cients of the centralbank interest rate rule.Provided the estimation spots 2 regimes for each of the three Markov processes, we now
would have characterized the sample period by 2^3 = 8 regimes. However, we can more easilyassess which one of the changes in the three subsets of parameters has indeed happened inthe mid-1980�s and whether this change of parameter translate into a sizeable impact on thevolatility of either in�ation or GDP growth. This approach can actually be taken a stepfurther allowing for instance the dynamics of in�ation to change at a di¤erent date than thedynamics of output growth. This would imply testing for altogether 16 states characterizingthe VAR parameters for the sample under review, though identifying the dates of regimeshifts separately for each subset of parameters. This procedure is clearly more tractablethan the one consisting of allowing for 16 states where all parameters can change and thenidentifying ex post which states correspond to this or that subset of parameters.
17The set up of SWZ further allows one to introduce linear restrictions on the elements of the transitionprobability matrices Q�:A typical application would be a zero restrictions to impose absorbing states. SeeSWZ section 2.

Monetary Policy, Output Composition and the Great Moderation 12
3.2.2. Estimation
First, the prior on the parameters �, which does not vary across states, is similar to the oneintroduced in Sims and Zha (1998), i.e. it is a generalization of Litterman�s prior. The priordistribution of the VAR coe¢ cients is normal while the prior distribution of the variances ofthe shocks is a gamma distribution.18 The prior for the elements of the transition probabilityhave a Dirilichet distribution (i.e. a convenient multidimensional Binomial distribution). Thediagonal elements of the transition probability are much larger than the o¤diagonal elementsto re�ect the view that the economy tends to stay in one state once it is in that state.19
The formulation of the prior uses the independence of the parameters of the model �,the transition probability Q and the an initial guess that at time 0 every states has an equalprobability 1=h: The posterior distribution of �, conditional on the data, the sequence ofstates and the transition probability matrix across states is estimated by sampling sequen-tially from the conditional distribution of the parameters similar to a Gibbs sampler (seeSWZ section 4).Given that the posteriors have unknown shapes the estimation is very computationally
intensive. However, SWZ have developed executables in C that can easily be implemented.20
The estimation of the mode of the posterior distribution takes up to one hour on a standardPC and the estimation of the marginal data density up to a couple of days for most of themodels reported in this paper.
4. Results
4.1. Model selection
I estimate several versions of the model which di¤er in terms of the set of parametersallowed to take di¤erent values across states of a Markov switching process and the numberof states these processes can have. Given that the estimation allows for large combinationsof time variation (actually twice the number of equations independent Markov Switchingprocesses) it is important to set a criterion for accepting or rejecting the relevance of each of
18The models are estimated with the same hyper parameters of the priors as Sims, Waggoner and Zha(1998), i.e., in the notation of Sims and Zha (1998), �0 = 1:0, �1 = 1:0, �2 = 1:0, �3 = 1:2, �4 = 0:1,�5 = 1:0 and �6 = 1:0.19Speci�cally, the prior distribution of the diagonal elements Qk has its mode at 0.85. In the two states
case, this implies that the prior value for the o¤ diagonal elements of Qk is 0.15. In the cases where threestates are allowed for in the estimation, we rule out transitions from state 1 to state 3 and from state 3 tostate 1 (q13 = q31 = 0). The prior mean for the transition probability from state 1 to state 2 and from state3 to state 2 is 0.15 and from state 2 to either state 1 or state 3 is 0.075.20Programs can be downloaded from Tao Zha�s webpage:http://home.earthlink.net/~tzha_center/

Monetary Policy, Output Composition and the Great Moderation 13
the time variation parts of the model. My criterion is to allow for time variation only wheneach of the states has probability 1 for at least some time in the sample.This criterion has e¤ectively restricted the variance of each shock to take up to three
states and the coe¢ cients up to two states. Additional states appear unlikely in the sensethat they typically never have a high or even positive probability for the sample period. The�t of the di¤erent versions of the model is reported in Table 3.The best �t is found for a variance only change model that allows for three di¤erent states
for the variance of the monetary policy shocks, two states for the in�ation shocks and 3 thatgovern jointly the two shocks of the �rst two equations of the model (ffcht and fht). The� matrix therefore takes up to 18 di¤erent values as the state of the model changes throughout the 1960-2006 sample.Second, among models that admit changes in their coe¢ cients, i.e. in A0 and A1:::A4,
the only one that improves the �t markedly with respect to the constant parameters modelallows for two states in the coe¢ cients of the interest rate equation. Moreover, allowing forchanges in coe¢ cients in more than one equation dramatically worsens the �t of the model.Third, models that combine two states for the coe¢ cients of the interest rate equation
and, in addition, allow for changes in the variance of the model�s shocks do relatively well,even if not as well as the best �tting model.The most surprising aspect of these results is that the only equation for which coe¢ cients
may have changed is the monetary policy rule.21 The major transformations of the USeconomy (increased openness, improved completeness of �nancial markets, the rise of ITtechnologies and other forms of technical changes), as well as the great moderation itselfwould naturally lead one to expect more changes in the propagation of shocks since 1960.The results may be taken as an indication that these changes are gradual in nature andtherefore hard to capture by models with "abrupt" Markov Switching processes.22
In principle, these results are also subject to the Benati and Surico (2006) critic, i.e. therisk that VARs estimate heteroscedasticity of shocks even in cases where the data generatingprocess admits a break in the coe¢ cients of the policy rule. However, we show that theMarkov Switching VAR can indeed capture changes in the coe¢ cients of the policy rulethough not the ones related to the Taylor principle.23
21This is also true in versions of the VAR that have more variables including, credit, money or the priceof commodities.22Evidence of such changes were indeed obtained with VAR with drifting coe¢ cients by Cogley and Sargent
(2005) and Primiceri (2006) but not by Canova and Gambetti (2006).23See also Leeper and Zha (2001) for a critical assessment of the impact of the Taylor principle on the
stability of macroeconomic models.

Monetary Policy, Output Composition and the Great Moderation 14
4.2. The constant parameter VAR benchmark
In the constant VAR model, which actually sets the prior for the estimates of the timevarying models (Sims, Waggoner and Zha, 2006), the impulse responses of the interest rateand the e¤ects of the monetary policy shocks are standard. The interest rate increases fol-lowing positive shocks to either of the two GDP components and following positive in�ationshocks. The model�s account of the transmission mechanism is also standard. A mone-tary policy tightening triggers a temporary decline in the two demand components and asomewhat delayed decline in in�ation.24
However, the time series of the shocks estimated in this constant parameter model (Figure2) show a sharp increase in their variance for the early 1970�s and the early 1990�s. Thereis also some milder evidence of heteroscedasticity of the three other shocks, which all tendto have a lower variance after 1990. This �rst evidence of time variation in the size of theshocks is then analyzed formally in the following sections.
4.3. The timing of regime switches
In this section, I describe the timing of regime switches for four cases of typical speci�-cation for the time variation that a¤ect subsets of the VAR parameters.
4.3.1. Case 1: 2 states for the variance of each equation�s shock
Let�s �rst assume that the variance of each shock can take one of two values and that thetiming of this change in values is independent across equations. I therefore have potentiallyfour independent changes in regimes along the sample period, i.e. we can have up to sixteendi¤erent states, each having a speci�c �. Although this model does not have the best �t, itprovides a good support to illustrate the e¤ects of time variation in this class of models.25
Figure 3 reports the time series of the probabilities of the high volatility regime for eachof the equations� orthogonalized residuals.26 Two observations are in order. First, theseestimates con�rm that the volatility of the shocks changes in the early to mid-1980s, i.e. whenKim and Nelson (1999), McConnel and Perez-Quiros (2000) and Stock and Watson (2002)date the great moderation. The shocks a¤ecting our �rst domestic demand component,in�ation and the federal funds rate drop around that time.
24The impulse responses are also standard in versions of the model where M1 and the prices of commoditiesare included. In particular, the shock to the interest rate, which triggers a decline in M1, can be interpretedas a money supply shock.25Sims and Zha (2006) have showed that models that assign independent Markov processes to states of
the variance of the structural shocks �t the US data very well. A result that this paper con�rms.26The time series of the 4 shocks are very similar to the ones reported in Figure 3.

Monetary Policy, Output Composition and the Great Moderation 15
Second, I notice that the change in the volatility of the shocks to the household investmentis dropping only in the early 1990s, and that the shocks a¤ecting the in�ation equation andthe monetary policy shocks have a higher volatility only between 1970 and 1985, with, forthe latter shock, an intermediary period of moderate volatility between 1976 Q227 and 1979Q2. This suggests that the great moderation may partly re�ect the end of a speci�c highvolatility episode, that took place in the 1970�s and early 1980�s and not strictly a secularevolution (as stressed by Blanchard and Simon, 2001). In particular, the high volatility ofthe monetary policy shock and the shock to the in�ation equation covers the period of thefour (NBER dated) recessions that took place between 1969 and 1982. It also shows that itis important that each shock can change variance independently from other shocks.
4.3.2. Case 2: Best �t model
Among speci�cations of changes in the states of the model�s variance, the one with thebest �t allows for three states for both equation 1 and 2, two states for the variance of theshock hitting the in�ation equation and three states for the variance of the monetary policyshocks. The grouping of the time variation for equation 1 and 2 is an information e¢ cientway to economize on parameters. Turning to the Monetary Policy shock variance, allowingfor a three regimes greatly improves the �t of the model (Table 3).The timing of the high volatility regimes is reported in Figure 4. The main change with
respect to the previous model is that I now have a regime of moderate volatility of themonetary policy shocks, from 1969 Q2 to 1972, and a high volatility regime which spansfrom 1973 Q3 to 1976 Q1, from 1979 Q4 to 1982 Q3 and for the last quarter of 1984.
4.3.3. Case 3: Changes in coe¢ cients
Among the speci�cations allowing for changes in the propagation of shocks, the modelsthat admit two states for the coe¢ cients of the interest rate equation are the only onesthat imply a signi�cant improvement in the �t of the model with respect to the constantparameter model or models with variance only changes. For all the other equations of thesystem, there is little support against the benchmark of no changes in the coe¢ cients. This�nding partially con�rm the conclusions of several previous studies that failed to rejectinstability in the VAR coe¢ cients.28
The �rst version of this model is one where I allow for 2 states for the coe¢ cients inthe interest rate equation with constant variances. This speci�cation is interesting to report27Dates of regime switching are given by the �rst observation when the probability of being in a regime is
supperior to 0.5.28See in particular, Bernanke and Mihov (1998), Canova (2005), Canova and Gambetti (2006) and Sims
and Zha (2006)

Monetary Policy, Output Composition and the Great Moderation 16
even if it does not have the best �t because some, like Benati and Surico (2006) have arguedthat VAR estimates tend to confuse changes in variances for what are actually changes incoe¢ cients of the reaction function.Interestingly, the dates of the changes in coe¢ cients of the interest rate equation coincide
with the dates estimated for a change in the variance of the monetary policy shock in thecase where these could change only for two states. The reaction function coe¢ cient changedfrom 1969 Q3 to 1975 Q4 and from 1979 Q4 to1985 Q4. The main change in the coe¢ cientsis not so much related to the "Taylor principle" as to the reaction of the interest rate to thehousehold investment and to the size of the monetary policy shocks.These results point to a timing of change in the central bank�s behavior that is very
di¤erent from the conclusions stressed in the literature so far (Clarida et al., 2000, Cogleyand Sargent, 2005a, Lubik and Schorfheide, 2004 and many others). First, it puts togetherin one regime the period when in�ation took o¤ and the Volker disin�ation of the early1980�s. The model therefore lumps together some of the Burns and most of the Volker eraas a distinctive regime that contrasts with the rest of the last half century. Perhaps moreimportantly the nature of the change in the systemic part of policy seems more related tochanges in the mix of response to di¤erent components of demand and to the variance ofthe monetary policy shock around the policy rule than to the reaction of the interest rate toin�ation.29
For the �rst part of the 1970�s and the �rst half of the 1980�s, the federal funds rateis estimated to react to household investment four times more than it responds to the restof domestic demand (Table 4 upper panel). Outside this regime, the interest rate responseto household investment becomes slightly negative, the response to the rest of domesticdemand and to in�ation increases slightly in the short run but hardly in the long run giventhat interest rates are estimated to be less autocorrelated in this other regime. The secondsizable di¤erence across regimes is that the standard deviation of monetary policy shocks arenearly �ve times as large in the former regime than in the latter. It therefore appears that,to some extent, the change in regime of the coe¢ cients actually accounts for a change in theamplitude of non-systematic monetary policy shocks.30 This result reinforces the case forthe importance of changes in the size of monetary policy shocks during this sample period.
29This second change is actually consistent with the variance-only-change versions of the model and itdrives most of the result that brings along the change in the share of the variance of demand that is due tointerest rate shocks. This was clear in simulations (not reporte for the sake of space) where the impact ofthe shocks was rescaled to analyse the sole e¤ects of the change in coe¢ cients.30 In the model�s speci�cation, the strucutral shocks are normalized to a variance of one in the case where
� is constant accross regimes so that the coe¢ cients measuring the impact of shocks on the variables belongsto the set of coe¢ cients that evolve across states. Therefore, the relative size of the e¤ects of these shockscan change change accross regimes together with all the coe¢ cients of a given equation.
Monetary Policy, Output Composition and the Great Moderation 17
4.3.4. Case 4: The Full Monty
A natural last step is to estimate models where both the variance of the shocks and thecoe¢ cients of the model can change. One version of these models combines three statesfor the variance of the �rst two shocks, two states for the variance of the in�ation equationshock, two states for the monetary policy shock and two states for the coe¢ cients of theinterest rate rule. The �t of this model slightly under-performs the �t of the variance onlychanges model presented as Case 2.To a large extent, the timing of regime switches in this version of the model corresponds
to a combination of case 2 and case 3 presented above. The coe¢ cients of the monetarypolicy rule change consistently from 1969 Q3 to 1975 Q4 and from 1979 Q4 to1985 Q4 withrespect to their value for the rest of the sample period (see the fourth panel of Figure 5 andthe bottom panel of Table 4). Turning to the variance of the monetary policy shocks, theestimates put a high probability of a higher variance regime from 1960Q1 to 1960 Q4 andfrom 1978 Q4 to 1982 Q3 than for the rest of the sample period. The variance of the othershocks of the model change at identical dates to the ones estimated for case 3.Altogether, as illustrated by these four typical speci�cations, there is ample evidence of
time variation in the parameters of the VAR. More speci�cally, each shock has changed inscale at di¤erent times and the scale of the monetary policy shocks changes has been thelargest. There is also some evidence of changes in the coe¢ cients, though, only for themonetary policy rule. Moreover, an important aspect of this regime switch is the change inthe impact of the monetary policy shock on the interest rate. It is therefore in part equivalentto versions of the model where only the variance of the shocks can change over time. Hence,a consistent result across all speci�cations of time variation that I have explored is thatunsytematic monetary policy has been more erratic for the �rst part of the 1970�s and fora few years after 1979 from what it was uniformly during the 1960�s, the post 1985 periodand from 1976 to 1979.
4.4. Regime switches and the variance of output
I can now use the models with time varying parameters to describe the evolution odoutput volatility. I compute the unconditional variance, the correlation of the variables andvariance decompositions for each of the states and analyze their evolution as given by theprobabilities of being in each state.31
31The results reported in this section and the next are based on the estimates obtained for the case 1 formof time variation, i.e. when each shocks can be in one of two states. Results for either case 2 or case 4, whichis itself a generalization of case 3, are essentially similar. Some of these results are presented in appendixtables A1 and A2.

Monetary Policy, Output Composition and the Great Moderation 18
Figure 6 reports the standard deviation of ffcht + fht, and the correlation of ffchtand fht, as implied by the changing states of the VARs parameters. These time series areweighted averages of these statistics across states where the weights are the probabilities ofbeing in each state.The time varying VAR captures the great moderation of output �uctuations quite well.
The standard deviation of DPD declines from a peak of nearly 5.0 percent in the late 1970�sto as low as 2.5 % in the early 1990�s. The model also shows a sizeable decline in thecorrelation between household investment and the rest of DPD in the early 1980�s.Figure 6 reports the evolution of domestic demand volatility and cross components cor-
relation, holding the volatility of the monetary policy component at the value it has in thehigh volatility regime. About half the drop in output volatility and all of the drop in cross-components correlation recovered by the model are associated to changes in the magnitudeof the monetary policy shocks.How did monetary policy contribute to the great moderation? The model�s answer to
this question is that monetary policy shocks have spurred the real �uctuations of the early1970�s and early 1980�s. And, because monetary policy shocks are a source of �uctations thatmoves GDP components in the same direction, regimes where the variance of these shocksis high are periods when the correlation between DPD components is higher. In facts, ascan be seen in Figure 1, the four recessions between 1969 and 1982 are characterized by thejoint decline of ffcht and fht.This interpretation is reinforced by the comparison of the forecast error decomposition
across states (Table 5). In the regimes of high volatility of the monetary policy shocks,the latter explain up to 44 and 53 % of the variance of the ffcht and fht at horizon 8to 16 quarters.32 This is much more than what is estimated in the constant parameterVAR model (see upper panel of Table 4, that averages all regimes) and even more than inthe pre-1970�s post 1985 regime, where monetary policy shocks have a negligible impact onDPD components. Moreover, it is remarkable that in the low volatility regime, most of thevariance of the monetary policy instrument can be traced back to developments in demandand in in�ation. In other words, monetary policy shocks have not been a source of instabilityexcept in the regimes where the volatility of monetary policy shocks is high.There results are robust to a number of changes in the spe�cication of time variation in
the model or the set of variables included in the VAR. The Markov Switching VARs impliesa large drop in the variance of DPD during the 1980�s and that the changes in the scaleof monetary policy shocks are the only ones that led to a drop in the variance and the
32These magnitude rise to 63 and 72 % (and to 50 and 59 %) for some of the regimes of high volatility inthe policy shocks in case 2 (in case 4). See Table A1 and A2.

Monetary Policy, Output Composition and the Great Moderation 19
correlation of DPD components in the �rst half of the 1980�s.33
4.5. Monetary policy and output �uctuations
The contribution of monetary policy shocks to output �uctuations can best be visualizedby the historical contribution of these shocks to the two components of DPD included in themodel. This is done in Figure 7 which reports the time series of monetary policy shocks andtheir historical contributions to the federal funds rate, to ffch and to cf , 34 together withthe dating of regime shifts as estimated with the SWZ methodology and NBER recessions.The top row of graph reports the timing of the high volatility when two regimes are allowedfor. The bottom two graphs show how, between 1969 and 1982, the monetary shocks explainthe evolution of both GDP components in and out of the recessions. This contrast sharplywith 1991 and 2001, when monetary policy shocks revamp the economy out of the recessionbut did not contribute much to getting it there in the �rst place.35
I also use the historical decomposition of the VAR to simulate a counterfactual experimentwhereby, for the full sample, the Monetary Policy shocks are re-scaled to a "Greenspanian"amplitude. As can be seen in Figure 8, this reduction of monetary policy shocks volatilitygreatly reduces the volatility of DPD between 1970 and the mid-1980�s. Monetary policyshocks had been essentially stimulative between 1970 and 1975. As the result, output appearto have been stimulated twice in 1972 and in 1976 by nearly 2 percent in excess of what itwould have been if the policy shocks had the same scale as in the 1960�s or under the Chair-manship of Greenspan. The reverse situation occurs from 1978 to 1984. An important aspectof this experiment though, is that the �rst subsample of monetary policy volatility comprisessome observations of "excessive tightening" and the second one, under the Chairmanship ofVolker, contains episodes of "excessive loosening" of the monetary policy instrument. Theseoccurences explain why the model outlines these two periods as one regime of excess volatil-ity of unsystematic monetary policy rather than two di¤erent regimes with di¤erent sets ofcoe¢ cients.33 In the case of the best �t model (case 2), the regime that spans from 1973 to 1975 and from 1979 to
1982, where the variance of monetary policy shocks is the highest, implies a correlation of 0.54 between thetwo DPD components, while this correlation is only 0.28 in the low volatility regime.34These are actually based on standard �xed parameter VARs, estimated by OLS. The times series of the
two GDP components are 4 quarters averages of the contributions in order to improve the readibility of thegraph. This transformation of the data does not change the timing of the regimes shifts estimated in theSWZ Markov Switching VARs.35Extending the sample period to include the second half of the 1950s indicates that the monetary policy
shock was stimulative during the 1957 recession and did contribute little to the 1960 recession. This reinforcesthe view that monetary policy had a special role in either triggering or reinforcing the recessions in the 1970�sand early 1980�s. See also the discussion in Romer and Romer (2002).
Monetary Policy, Output Composition and the Great Moderation 20
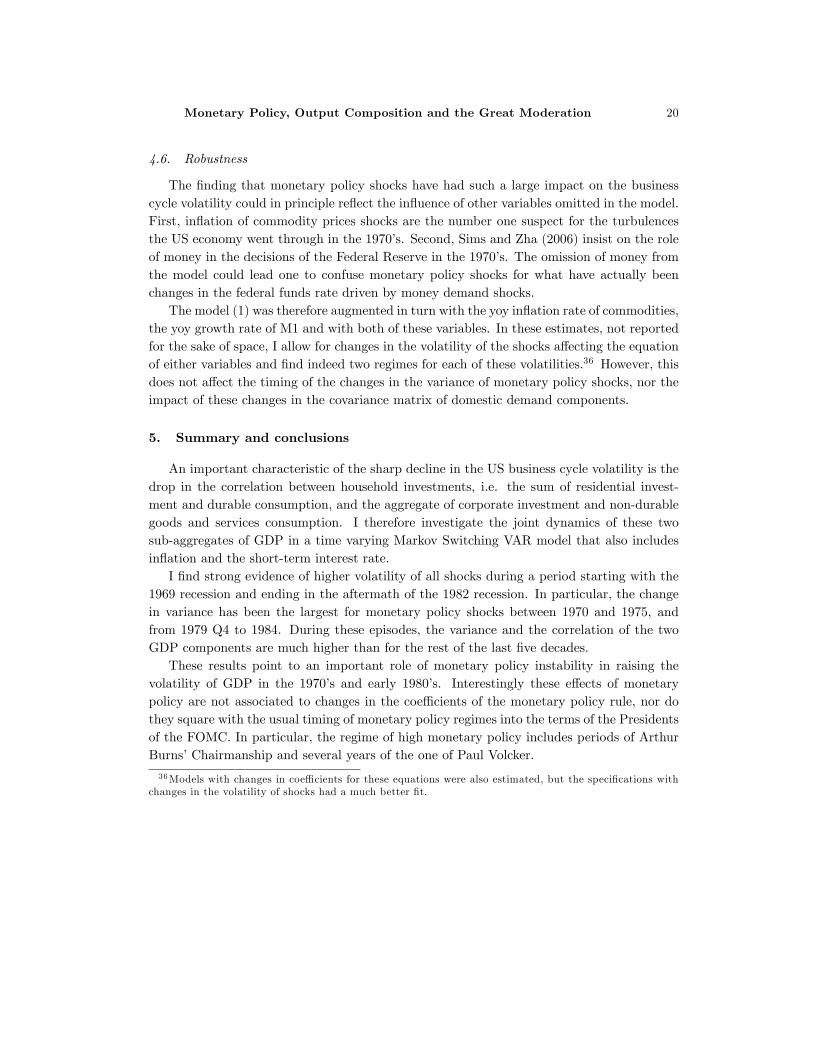
4.6. Robustness
The �nding that monetary policy shocks have had such a large impact on the businesscycle volatility could in principle re�ect the in�uence of other variables omitted in the model.First, in�ation of commodity prices shocks are the number one suspect for the turbulencesthe US economy went through in the 1970�s. Second, Sims and Zha (2006) insist on the roleof money in the decisions of the Federal Reserve in the 1970�s. The omission of money fromthe model could lead one to confuse monetary policy shocks for what have actually beenchanges in the federal funds rate driven by money demand shocks.The model (1) was therefore augmented in turn with the yoy in�ation rate of commodities,
the yoy growth rate of M1 and with both of these variables. In these estimates, not reportedfor the sake of space, I allow for changes in the volatility of the shocks a¤ecting the equationof either variables and �nd indeed two regimes for each of these volatilities.36 However, thisdoes not a¤ect the timing of the changes in the variance of monetary policy shocks, nor theimpact of these changes in the covariance matrix of domestic demand components.
5. Summary and conclusions
An important characteristic of the sharp decline in the US business cycle volatility is thedrop in the correlation between household investments, i.e. the sum of residential invest-ment and durable consumption, and the aggregate of corporate investment and non-durablegoods and services consumption. I therefore investigate the joint dynamics of these twosub-aggregates of GDP in a time varying Markov Switching VAR model that also includesin�ation and the short-term interest rate.I �nd strong evidence of higher volatility of all shocks during a period starting with the
1969 recession and ending in the aftermath of the 1982 recession. In particular, the changein variance has been the largest for monetary policy shocks between 1970 and 1975, andfrom 1979 Q4 to 1984. During these episodes, the variance and the correlation of the twoGDP components are much higher than for the rest of the last �ve decades.These results point to an important role of monetary policy instability in raising the
volatility of GDP in the 1970�s and early 1980�s. Interestingly these e¤ects of monetarypolicy are not associated to changes in the coe¢ cients of the monetary policy rule, nor dothey square with the usual timing of monetary policy regimes into the terms of the Presidentsof the FOMC. In particular, the regime of high monetary policy includes periods of ArthurBurns�Chairmanship and several years of the one of Paul Volcker.
36Models with changes in coe¢ cients for these equations were also estimated, but the speci�cations withchanges in the volatility of shocks had a much better �t.

Monetary Policy, Output Composition and the Great Moderation 21
One the one hand, the results are consistent with the view that Alan Greenspan hascreated little GDP volatility. On the other hand, they also also stress that the 1984 suddendrop in the US business cycle volatility largely re�ects the end of a very particular regime ofmonetary policy. One where monetary policy had such a large in�uence on the �uctuationsof demand components that they were highly correlated to one another, thereby furtherspurring the variance of GDP. After 1984, the Federal Reserve could be praised for havingmanaged to avoid the return to this type of interest rate instability as the short-term interestrate remained much closer to a "neutral" monetary policy stance. This may be seen as animportant achievement of Alan Greenspan.Three other aspects of the results should be highlighted. First, although the great mod-
eration comes largely from the variance of the VAR shocks, it does not imply that "GoodLuck" has been the driving factor of output stabilization. This paper has stressed the roleof unsystematic monetary policy which re�ects the distance of the interest rate from theestimated monetary policy rule. The paper showed how the drop in scale of non-systematicmonetary policy contributed to the mid-1980s drop of the variance and correlation of outputcomponents. Second, the results are consistent with the view that it is easier for the centralbank to avoid recessions or not having to trigger recessions when in�ation expectations areanchored than when they are not. They provide a quantitative assessment of the changesin the conduct of monetary policy described in the narrative analyzis of Romer and Romer(2002).Finally, I do not �nd changes in the propagation of shocks. The e¤ects of monetary policy
on the two GDP components that I analyze in the model have not changed. This is somewhatsurprising given the evolution of �nancial markets and, for instance, the increasing recourseof households to mortgage re�nancing at times of declining interest rates. The MarkovSwitching VAR simply did not capture changes in the coe¢ cients of demand componentsequations that would improve the �t of the model to the data. One potential explanation isthat Markov Switching regimes are not able to spot gradual changes in the coe¢ cients of themodel. It would be useful that future research �nd out whether time variation models withparameters�drift capture an evolution of GDP components�responses to monetary policy.
References
Ahmed S., An. Levin, and B.-A. Wilson (2004), �Recent U.S. Macroeconomic Stability:Good Policies, Good Practices, or Good Luck?� Review of Economics and Statistics86 (3): 824-832.

Monetary Policy, Output Composition and the Great Moderation 22
Baxter, M. and R. King (1999), �Measuring Business Cycles: Approximate Band-Pass FiltersFor Economic Time Series�, Review of Economics and Statistics 81(4), 575-593.
Benati L. and P. Surico (2006): �VAR Analyses of the Great Moderation�, mimeo, Bank ofEngland.
Benati L. and H. Mumtaz (2007), �US Evolving Macroeconomic Dynamics: A StructuralInvestigation�, ECB Working Paper 746.
Bernanke, B., and I. Mihov (1998): �Measuring Monetary Policy�, Quarterly Journal ofEconomics, 113 (3), 869�902.
Blanchard, O., and J. Simon (2001): �The Long and Large Decline in U.S. Output Volatility�,Brookings Papers on Economic Activity, 135-164.
Blinder A. And R. Reis (2005), �Understanding the Greenspan Standard�, Princeton Uni-versity, CEPS Working Paper No. 114.
Boivin, J. (2006): �Has U.S. Monetary Policy Changed? Evidence from Drifting Coe¢ cientsand Real-Time Data,�Journal of Money, Credit and Banking, 38 (5), 1149-1174.
Boivin J. and M.P. Giannoni (2006), �Has Monetary Policy Become More E¤ective?�, TheReview of Economics and Statistics, 88 (3): 445-462.
Brender A. and F. Pisani (2005): The New American Economy, Economica, Paris.
Calza A., T. Monacelli and L. Stracca (2007), �Mortgage Markets, Collateral Constraintsand Monetary Authority: Do Institutions Matter?�, CEPR Discussion Paper 6231.
Campbell J. and Z. Hercowitz (2004), �The Role of Households� Collateralized Debts inMacroeconomic Stabilization�, Federal Reserve Bank of Chicago WP 2004-24.
Canner G., K. Dynan and W. Passmore (2002): �Mortgage Re�nancing in 2001 and Early2002�, Federal Reserve Bulletin, December, 469-481.
Canova F. (2005), �Monetary Policy and the Evolution of the US Economy: 1948-2002�,Pompeu Fabra Universtity, mimeo.
Canova F. and L. Gambetti (2005): �Structural Changes in the US Economy: Bad Luck ofBad Policy?�, mimeo, University Pompeu Fabra.
Cecchetti SG, A Flores-Lagunes and S Krause (2005), �Assessing the Sources of Changesin the Volatility of Real Growth�, Proceedings of the Reserve Bank of Australia AnnualConference, 2005.

Monetary Policy, Output Composition and the Great Moderation 23
Cecchetti SG, A Flores-Lagunes and S Krause (2006),�Has Monetary Policy Become MoreE¢ cient? A Cross-Country Analysis�, The Economic Journal 116 (2), 408-433.
Christiano L., M. Eichenbaum and C. Evans (2005), �Nominal Rigidities and the DynamicE¤ects of a Shock to Monetary Policy�, Journal of Political Economy 113 (1), 1-45.
Christiano, L. J., M. Eichenbaum and C. Evans, (1999), "Monetary policy shocks: whathave we learned and to what end?�, in J. B. Taylor and M. Woodford (eds.), Handbookof Macroeconomics, Volume 1A, 65-148.
Clarida R., J. Galì and M. Gertler (2000), �Monetary policy rules and macroeconomic sta-bility: evidence and some theory�, Quarterly Journal of Economics 115 (1), 147-180.
Cogley, T., and T. J. Sargent (2005a): �Drifts and Volatilities: Monetary Policies andOutcomes in Post WWII U.S.�, Review of Economics Dynamics 8 (2), 262-302.
Cogley, T., and T. J. Sargent (2005b): �The Conquest of US In�ation: Learning and Ro-bustness to Model Uncertainty,�Review of Economics Dynamics 8 (2), 528-563.
DeLong B. (1997), �America�s Only Peacetime In�ation: the 1970�s�, in C. Romer and D.Romer (Editors), Reducing in�ation, NBER Studies in Business Cycles 30. University ofChicago Press.
DeLong B. (2003), �Comment on James Stock and Mark Watson, �Has the Business CycleChanged?�", in Monetary Policy and Uncertainty, Federal Reserve Bank of Kansas City,9-56.
Dynan K., D. Elmendorf and D. Sichel (2006). �Can Financial Innovation Explain the Re-duced Volatility of Economic Activity?�, Journal of Monetary Economics 53 (1), 123-150.
Fisher, J. and M. Gervais (2006), �First-Time Home Buyers�, 2006 Meeting Papers 432,Society for Economic Dynamics.
Galì J; and L; Gambetti (2007), �On the Sources of the Great Moderation�, Pompeu FabraUniverstity, mimeo.
Giannone D., L. Reichlin and L. Sala (2002), �Tracking Greenspan: Systematic and Unsys-tematic Monetary Policy Revisited�, IGiER mimeo.
Gordon R. (2005), �What Has Caused the Decline in US business Cycle Volatility?�, NBERworking paper 11777.
Monetary Policy, Output Composition and the Great Moderation 24
Hamilton J. (1989), �A New Approach to the Economic Analysis of Nonstationary TimeSeries and the Business Cycle�, Econometrica 57(2), 357-384.
Hamilton J. (1994), �Time Series Analysis�, Princeton University Press.
Herrera A.-M. and E. Pesavento (2004), �The Decline in U.S. Output Volatility: StructuralChanges and Inventory Investment�, mimeo, Michigan University.
Iacoviello M; and S. Neri (2007), �The Role of Housing Collateral in an Estimated Two-SectorModel of the US Economy�, Boston College mimeo.
Irvine F. and S. Schuh (2005), �The Roles of Co-Movement and Inventory Investment inthe Reduction of Output Volatility�, Federal Reserve Bank of Boston Working Paper No05-9.
Justiniano A. and G. Primiceri (2006), �The Time Varying Volatility of MacroeconomicFluctuations�, mimeo, Northwestern University.
Kahn, J., M. McConnell, and G. Perez-Quiros (2002), �On the Causes of the IncreasedStability of the U.S. Economy�, Federal Reserve Bank of New York, Economic PolicyReview 8 (1): 183-202.
Kim, C. and C. Nelson (1999): �State Space Models with Regime Switching�, MIT Press,London and Cambridge, Mass.
Leeper E; and T. Zha (2003), �Modest Policy Interventions�, Journal of Monetary Economics50 (8), 1673-1700.
Monacelli T. (2006), �New Keynesian Models , Durable Goods and Borrowing Constraints�,CEPR Discussion Paper 5916.
McConnell, M., and G. Perez-Quiros (2000), �Output Fluctuations in the United States:What Has Changed Since the Early 1980s?" American Economic Review 90, 1464-1476.
McConnell M., R. Peach and A. Al-Haschim (2003), �After the Re�nancing Boom: WillConsumers Scale Back Their Spending?�, Current Issues in Economics and Finance 9,No. 12.
Leeper E. and T. Zha (2001), �Assessing Simple Policy Rules: A View from a CompleteMacroeconomic Model�, Federal Reserve Bank of Saint-Louis Review, 83-110.
Lubik T. and F. Schorfheide (2004), �Testing for Indeterminacy: An application to U.S.Monetary Policy�, American Economic Review 94 (1), 190:217.

Monetary Policy, Output Composition and the Great Moderation 25
Primiceri G. (2005): �Time Varying Structural Vector Autoregressions and Monetary Pol-icy�, Review of Economic Studies 72, pp821-852.
Primiceri G. (forthcoming): �Why In�ation Rose and Fell: Policymakers�Beliefs and USPostwar Stabilization Policy,�Quarterly Journal of Economics.
Ramey, V. and D. Vine (2004) �Tracking the Source of the Decline in GDP Volatility: AnAnalysis of the Automobile Industry�,�NBER working paper 10384.
Ramey V. and D. Vine (2005), �Declining Volatility in the US Automobile Industry�, NBERWorking Paper 11596.
Romer C. and D. Romer, �The Evolution of Econmic Understanding and Postwar Stabiliza-tion Policy�, The Federal Reserve Bank of Kansas City - Economic Review.
Sellon G., (2002), �Changing U.S. �nancial system: Some Implications for the MonetaryTransmission�, The Federal Reserve Bank of Kansas City - Economic Review, FirstQuarter 2002.
Sims C., D. Waggoner and T. Zha (2006), �Methods for Inference in Large Multiple-EquationMarkov-Switching Models�, Federal Reserve Bank of Atlanta, mimeo.
Sims C. and T. Zha (1998), �Bayesian Methods for Dynamic Multivariate Models�, Interna-tional Economic Review 39(4), 949-968.
Sims C. and T. Zha (2006), �Were There Regime Switches in U.S. Monetary Policy?�,Forthcoming, American Economic Review.
Smets, F. and R. Wouters, (2007), �Shocks and Frictions in US Business Cycles: A BayesianDSGE Approach,� ECB Working Paper 722, forthcoming in the American EconomicReview.
Stock J., and M. Watson (2002), �Has the Business Cycle Changed and Why?" NBERMacroeconomics Annual 2002 : 159-218.
Stock J., and M. Watson (2003), �Has the Business Cycle Changed? Evidence and Expla-nations,� in Monetary Policy and Uncertainty, Federal Reserve Bank of Kansas City :9-56.
Stock J., and M. Watson (2005), �Understanding Changes in International Business CycleDynamics�, Journal of the European Economic Association 3 (5), 968-1006.

a b c d c - b d - c1947-2006 1947-1965 1965-1984 1985-2006
Quarterly growth rates and contributionsGDP growth rate variance 17 28 21 4 -6 -17 Domestic private demand contribution variance 20 33 25 5 -9 -20 Net exports+Government consumption variance 4 8 3 1 -5 -2 2 Covariance of the above 2 sub-aggregates of GDP -7 -14 -6 -2 8 5
Decomposition of DPD contribution variance Trace of the covariance matrix of its 6 components 13 23 13 5 -10 -8 Sum of off diagonal terms among the 6 components 7 10 11 0.0 1 -11
Band pass filtered (6,32,8) quarterly growth rates and contributionsGDP growth rate variance 8 18 8 2 -10 -7Domestic private demand growth rate variance 12 27 10 2 -17 -8 Trace of the covariance matrix of its 6 components 4 8 3 1 -5 -2 Sum of off diagonal terms among the 6 components 8 19 7 1 -12 -6
Table 1: Decomposition of the variance of the US Private Sector Domestic Demand into the variances and co-variances of its maincomponents
Notes: Domestic private demand (DPD) contribution to GDP growth is the sum of 6 sub-aggregates: residential investment, durable consumption, consumption of non-durable goods, consumption of services, fixed non-residential investment and inventory investment. The table decomposes the covariance matrix of these 6 sub-aggregates. All data come from "Table 1.1.2. Contributions to Percent Change in Real Gross Domestic Product". The Band Pass Filter methodology is presented inBaxter and King (1999).

a b c d c - b d - c1947-2006 1947-1965 1965-1984 1985-2006
Quarterly growth rates and contributionsDomestic private demand growth rate variance 20 33 25 5 -9 -20 Trace of the covariance matrix of its 2 components 3 27 17.6 5.5 -10 -12 Sum of off diagonal terms among the 2 components 17 6 7.1 -0.5 1 -8correlation of the 2 components 0.27 0.26 0.46 -0.14
Band pass filtered (6,32,8) quarterly growth rates and contributionsDomestic private demand growth rate variance 12 27 10 2 -17 -8.3 Trace of the covariance matrix of its 2 components 8 17 6.6 1.8 -10 -4.8 Sum of off diagonal terms among the 2 components 4 11 3.7 0.2 -7 -3.5correlation of the 2 components 0.65 0.71 0.63 0.20
Table 2: Decomposition of the variance of the US Private Sector Domestic Demand into the variances and co-variances ofHouseholds Investments and the aggregate of other components
Notes: Domestic private demand (DPD) contribution to GDP growth is the sum of 2 sub-aggregates: household investments defined as the sum of residentialinvestment and durable consumption and the aggregate of non-durable goods consumption, services consumption, fixed non-residential investment andinventory investment. The table decomposes the covariance matrix of these 2 sub-aggregates. All data come from "Table 1.1.2. Contributions to PercentChange in Real Gross Domestic Product".

Table 3: Marginal likelihood of 4 variables model depending on its form of time variation Marginal likelihood Marginal likelihood
Constant parameters VAR -1139.9Specifications with changes only in the variances Specifications with changes only in the coefficients
ffch fh dpgdp ffr ffch fh dpgdp ffrconstant constant constant 2 S -1085.5 Case 3 constant constant constant 2 S -1069.62 S constant constant constant -1131.1 2 S constant constant constant -1132.4constant 2 S constant constant -1136.4 constant 2 S constant constant -1135.2constant constant 2 S constant -1126.5 constant constant 2 S constant -1131.7constant constant constant 2 S -1085.5 constant constant constant 3 S -1070.7constant constant constant 3 S -1053.4 constant constant 2 S 2 S -1353.4constant constant 2 S 2 S -1072.1 constant constant 2 S 3 S -1609.8constant constant 2 S 3 S -1040.1 constant constant 3S 3 S -1085.5constant constant 3 S 2 S -1068.7constant 2 S 2 S 2 S -1068.6constant 2 S 2 S 3 S -1036.5
Case 1 2 S 2 S 2 S 2 S -1059.92 S 2 S 2 S 3 S -1027.8
2 S 2 S -1054.5Case 2 2 S 3 S -1022.5
3 S 3 S -1019.2
Specification with changes both in the variance and in the coefficientsVariances Coefficients
2 S 2 S 2 S 2 S constant constant constant 2 S -1032.22 S 2 S 2 S 3 S constant constant constant 2 S -1029.1
Case 4 2 S 2 S constant constant constant 2 S -1027.72 S 3 S constant constant constant 2 S -1024.6
Note: The variance of the shocks and the coefficients can be either constant; take one of 2 values (2S) or one of three values (3S). indicates models for which the results are discussed in the text.
3 S3 S
3 S3 S3 S

Table 4: Coefficients of the interest rate equation accross regimesVAR model (Case 3)
ff+ch cf dpgdp ffrRegime 1: 1969 Q3 to 1975 Q4 and 1979 Q4 to1985 Q4
0.04 0.18 0.02 0.98Regime 2: 1960's, 1976:Q1 to 1979:Q3 and post 1986Q1
0.05 0.00 0.05 0.95
VAR model (Case 4)ff+ch cf dpgdp ffr
Regime 1: 1969 Q3 to 1975 Q4 and 1979 Q4 to1985 Q40.05 0.20 0.03 0.97
Regime 2: 1960's, 1976:Q1 to 1979:Q3 and post 1986Q10.06 -0.01 0.04 0.95
Note: the table reports the sum of A0(j,4) and sum/lags of A(j,4)lags. Confidence intervals based on draws from the posterior distribution of the models parameters are avalaible upon request.

Table 5: Forecast error variance decomposition across states of different volatility of Monetary Policy Shocks
VAR model with constant parameterscontrib of MP shock to contrib to FFR of shocks to the equation of
ff+ch cf dpgdp ffr ff+ch cf dpgdp ffr4 quarters 14 21 3 64 19 4 14 648 quarters 16 21 2 47 25 8 20 4712 quarters 16 21 2 38 28 11 23 3816 quarters 16 21 2 33 28 12 27 33
VAR with time variation specification sv12 (ML=-1059.9)Regime 1: High MP shock volatility, 1969Q2 to 1975 Q4 and 1979Q4 to 1984Q4
contrib of MP shock to contrib to FFR of shocks to the equation of ff+ch cf dpgdp ffr ff+ch cf dpgdp ffr
4 quarters 30 48 9 90 5 1 4 908 quarters 43 53 8 80 8 5 7 8012 quarters 44 53 7 73 11 8 9 7316 quarters 44 53 10 68 12 9 12 68
Regime 2: Low MP shock volatility of the 1960's, the mid-1970's and the "Greenspan era"contrib of MP shock to contrib to FFR of shocks to the equation of
ff+ch cf dpgdp ffr ff+ch cf dpgdp ffr4 quarters 3 6 1 40 31 7 22 408 quarters 5 7 1 22 32 19 27 2212 quarters 5 7 1 16 33 24 27 1616 quarters 5 7 1 13 32 25 30 13Note: report the percent of the variance of the variables explained by the monetary policy shocks (left panel) and the contribution of the shocks of eachequation to the variance of the federal funds rate (right panel), all numbers are percentages. Confidence intervals based on draws from the posteriordistribution of the models parameters are avalaible upon request.

Corporate investment + non-durable consumption (ff+ch)
1960 1970 1980 1990 2000-10
-5
0
5
10Household investment (durables+ residential, fh)
1960 1970 1980 1990 2000-10
-5
0
5
10
Inflation of GDP deflator (dp)
1960 1970 1980 1990 20000
5
10
15
20Federal funds interest rate (ffr)
1960 1970 1980 1990 20000
5
10
15
20
Figure 1: Time series of contributions to GDP growth, GDP deflator inflation and the federal funds rate
Grey areas indicates the periods designated by the NBER as recessions

1960 1970 1980 1990 2000-6
-4
-2
0
2
4
6
8
10epsilon(ff+ch)
1960 1970 1980 1990 2000-5
-4
-3
-2
-1
0
1
2
3
4epsilon(fh)
1960 1970 1980 1990 2000-1
-0.5
0
0.5
1
1.5epsilon(dp)
1960 1970 1980 1990 2000-3
-2
-1
0
1
2
3
4
5
6Monetary Policy Shocks
Figure 2: Identified shocks as estimated in the constant parameters VAR model

Probability of being in a regime of high volatility for the orthogonalized residual of the ff+ch equation
1960 1965 1970 1975 1980 1985 1990 1995 2000 20050
0.5
1
same with respect to the fh equation
1960 1965 1970 1975 1980 1985 1990 1995 2000 20050
0.5
1
same with respect to the dp equation
1960 1965 1970 1975 1980 1985 1990 1995 2000 20050
0.5
1
Probability of being in a regime of high volatility for the monetary policy shocks
1960 1965 1970 1975 1980 1985 1990 1995 2000 20050
0.5
1
Figure 3: Case 1 model, Probabilities of being in high volatility states for the identified shocks
Grey areas indicates periods designated by the NBER as recessions

1960 1965 1970 1975 1980 1985 1990 1995 2000 20050
0.5
1
Probability of being in a regime of high volatility for the orthoganalized residual of the ff+ch and fh equation
same with respect to the dp equation
1960 1965 1970 1975 1980 1985 1990 1995 2000 20050
0.5
1
Probability of being in a regime of high volatility for the monetary policy shocks
1960 1965 1970 1975 1980 1985 1990 1995 2000 20050
0.5
1
Figure 4: Case 2 model, Probabilities of being in high volatility states for the identified shocks
(green-dotted for high blue full line for either high or intermediate volatility regimes) Grey areas indicates periods designated by the NBER as recessions
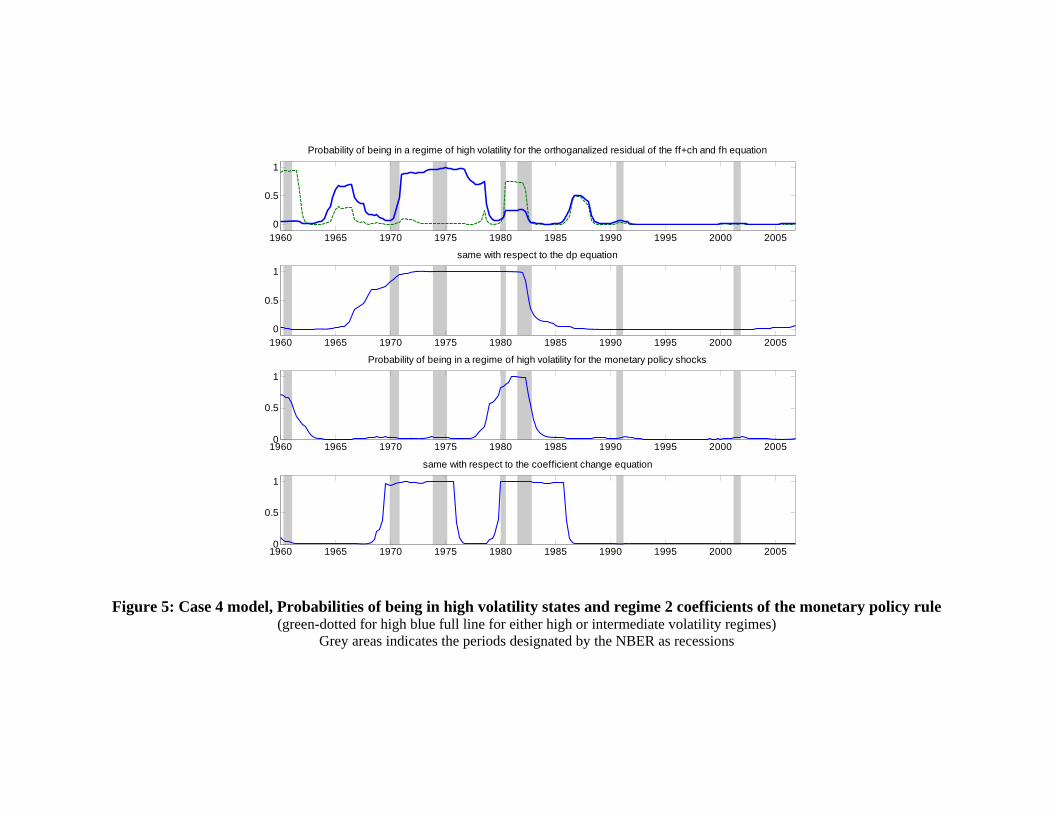
Probability of being in a regime of high volatility for the orthoganalized residual of the ff+ch and fh equation
1960 1965 1970 1975 1980 1985 1990 1995 2000 20050
0.5
1
same with respect to the dp equation
1960 1965 1970 1975 1980 1985 1990 1995 2000 20050
0.5
1
Probability of being in a regime of high volatility for the monetary policy shocks
1960 1965 1970 1975 1980 1985 1990 1995 2000 20050
0.5
1
same with respect to the coefficient change equation
1960 1965 1970 1975 1980 1985 1990 1995 2000 20050
0.5
1
Figure 5: Case 4 model, Probabilities of being in high volatility states and regime 2 coefficients of the monetary policy rule
(green-dotted for high blue full line for either high or intermediate volatility regimes) Grey areas indicates the periods designated by the NBER as recessions

Markov Switching VAR estimates of the standard deviation of Domestic Private Demand (full line) and its value when the volatility of monetary shocks stays high (dotted, green line)
1960 1965 1970 1975 1980 1985 1990 1995 2000 20052
3
4
5
6
idem for the correlation of household investment (fh) and the rest of DPD (ff+ch)
1960 1965 1970 1975 1980 1985 1990 1995 2000 20050
0.1
0.2
0.3
0.4
0.5
Figure 6: Time variation in the standard deviation of Domestic Private Demand (upper panel) and the correlation of its two
components (lower panel) and holding the variance of monetary policy shock at its highest level (green-dotted) Grey areas indicates the periods designated by the NBER as recessions

Monetary Policy Shocks and high volatility MP shock regime
1960 1970 1980 1990 2000-3
-2
-1
0
1
2
3
4
5
6Contribution of MP Shocks to the FFR (Blue), demeaned FFR (Green)
1960 1970 1980 1990 2000-5
0
5
10
Contribution of MP Shocks to FFCH (Blue), and demeaned FFCH (Green)
1960 1970 1980 1990 2000-6
-4
-2
0
2
4
6and to FH (Blue), demeaned FH (Green) and NBER recessions
1960 1970 1980 1990 2000-6
-4
-2
0
2
4
6
Figure 7: Monetary policy shocks, and their historical contribution to the federal funds rate and GDP components
Top panel: dark areas designate the period when the model estimates a higher volatility of monetary policy shocks. Bottom panel: grey areas indicates the periods designated by the NBER as recessions

Original and counterfactual scaled-down MP Shocks
1965 1970 1975 1980 1985 1990-3
-2
-1
0
1
2
3
4Contribution of original and scaled-down MP shocks (thick red line) to the FFR
1965 1970 1975 1980 1985 1990-10
-5
0
5
10
to DPD, demeanded DPD (Green)
1965 1970 1975 1980 1985 1990-6
-4
-2
0
2
4
6Additional Output Fluctuations due to Monetary Policy Volatility
1965 1970 1975 1980 1985 1990-3
-2
-1
0
1
2
3
Figure 8: Effects of scaling down monetary policy shocks on the federal funds rate and
the historical contribution of monetary policy shocks to Domestic Private Demand Top panel: dark areas designate the period when the model estimates a higher volatility of monetary policy shocks.
Bottom panel: grey areas indicates the periods designated by the NBER as recessions

Appendix: Additional TablesTable A1: Forecast error variance decomposition across states of different volatility of Monetary Policy ShocksBest fit VAR model, 3 regimes for the shocks f equation 1 and 2, 2 regimes for equation 3, 3 regimes for the MP Shocks (ML=-1022.9)Regime 1: High MP shock volatility, 1973 Q3 to 1976 Q1, from 1979 Q4 to 1982 Q3 and 1984 Q4
contrib of MP shock to contrib to FFR of shocks to the equation of ff+ch cf dpgdp ffr ff+ch cf dpgdp ffr
4 quarters 46 68 25 97 2 1 1 978 quarters 62 72 21 92 3 3 2 9212 quarters 63 72 20 89 5 4 2 8916 quarters 63 73 26 86 5 5 3 86
Regime 2: Moderately high MP shock volatility, 1969 Q1 to 1971 Q4contrib of MP shock to contrib to FFR of shocks to the equation of
ff+ch cf dpgdp ffr ff+ch cf dpgdp ffr4 quarters 9 19 3 74 14 5 7 748 quarters 17 23 3 56 18 15 11 5612 quarters 18 23 2 47 21 20 12 4716 quarters 18 23 4 41 22 22 14 41
Regime 3: Low MP shock volatility of the 1960's, the mid-1970's and the "Greenspan era"contrib of MP shock to contrib to FFR of shocks to the equation of
ff+ch cf dpgdp ffr ff+ch cf dpgdp ffr4 quarters 2 5 1 39 33 11 18 398 quarters 4 6 1 22 31 27 20 2212 quarters 4 6 0 16 32 32 20 1616 quarters 4 6 1 13 32 33 22 13Note: report the percent of the variance of the variables explained by the monetary policy shocks (left panel) and the contribution of the shocks of each equation tothe variance of the federal funds rate (right panel), all numbers are percentages.Confidence intervals based on draws from the posterior distribution of the modelsparameters are avalaible upon request.

Table A2: Forecast error variance decomposition across states of different volatility of Monetary Policy ShocksRegime 1: High Variance of Monetary Policy shocks and Coeffients combination 1 : Period 1979Q4 to 1982Q4
contrib of MP shock to contrib to FFR of shocks to the equation of ff+ch cf dpgdp ffr ff+ch cf dpgdp ffr
4 quarters 41 56 18 85 5 7 2 858 quarters 49 59 13 78 9 11 2 7812 quarters 50 59 12 74 11 13 3 7416 quarters 49 59 14 70 12 15 3 70
Regime 2: Low Variance of Monetary Policy shocks and Coeffients combination 1 : 1969 Q2 to 1975 Q4 and 1982 Q4 to1985 Q4contrib of MP shock to contrib to FFR of shocks to the equation of
ff+ch cf dpgdp ffr ff+ch cf dpgdp ffr4 quarters 18 28 6 63 13 18 5 638 quarters 24 30 4 52 19 24 5 5212 quarters 24 30 4 46 21 27 6 4616 quarters 24 30 5 42 22 28 7 42
Regime 3: High Variance of Monetary Policy shocks and Coeffients combination 2 : Period 1960 Q1 to 1960 Q4 and 1978 Q3 to 1979 Q3contrib of MP shock to contrib to FFR of shocks to the equation of
ff+ch cf dpgdp ffr ff+ch cf dpgdp ffr4 quarters 6 13 2 62 25 2 11 628 quarters 13 18 2 48 27 10 15 4812 quarters 14 18 2 40 28 15 17 4016 quarters 14 19 3 36 28 18 18 36
Regime 4: Low Variance of Monetary Policy shocks and Coeffients combination 1 : Period 1960's, 1976-1979 and post 1986 contrib of MP shock to contrib to FFR of shocks to the equation of
ff+ch cf dpgdp ffr ff+ch cf dpgdp ffr4 quarters 2 4 1 33 42 4 20 338 quarters 4 6 1 22 40 15 23 2212 quarters 5 6 1 17 38 21 24 1716 quarters 5 6 1 14 37 24 25 14Note: report the percent of the variance of the variables explained by the monetary policy shocks (left panel) and the contribution of the shocks of each equation to thevariance of the federal funds rate (right panel), all numbers are percentages. Confidence intervals based on draws from the posterior distribution of the modelsparameters are avalaible upon request.

1
Working Paper Series
A series of research studies on regional economic issues relating to the Seventh Federal Reserve District, and on financial and economic topics.
Standing Facilities and Interbank Borrowing: Evidence from the Federal Reserve’s WP-04-01 New Discount Window Craig Furfine Netting, Financial Contracts, and Banks: The Economic Implications WP-04-02 William J. Bergman, Robert R. Bliss, Christian A. Johnson and George G. Kaufman Real Effects of Bank Competition WP-04-03 Nicola Cetorelli Finance as a Barrier To Entry: Bank Competition and Industry Structure in WP-04-04 Local U.S. Markets? Nicola Cetorelli and Philip E. Strahan The Dynamics of Work and Debt WP-04-05 Jeffrey R. Campbell and Zvi Hercowitz Fiscal Policy in the Aftermath of 9/11 WP-04-06 Jonas Fisher and Martin Eichenbaum Merger Momentum and Investor Sentiment: The Stock Market Reaction To Merger Announcements WP-04-07 Richard J. Rosen Earnings Inequality and the Business Cycle WP-04-08 Gadi Barlevy and Daniel Tsiddon Platform Competition in Two-Sided Markets: The Case of Payment Networks WP-04-09 Sujit Chakravorti and Roberto Roson Nominal Debt as a Burden on Monetary Policy WP-04-10 Javier Díaz-Giménez, Giorgia Giovannetti, Ramon Marimon, and Pedro Teles On the Timing of Innovation in Stochastic Schumpeterian Growth Models WP-04-11 Gadi Barlevy Policy Externalities: How US Antidumping Affects Japanese Exports to the EU WP-04-12 Chad P. Bown and Meredith A. Crowley Sibling Similarities, Differences and Economic Inequality WP-04-13 Bhashkar Mazumder Determinants of Business Cycle Comovement: A Robust Analysis WP-04-14 Marianne Baxter and Michael A. Kouparitsas The Occupational Assimilation of Hispanics in the U.S.: Evidence from Panel Data WP-04-15 Maude Toussaint-Comeau

2
Working Paper Series (continued) Reading, Writing, and Raisinets1: Are School Finances Contributing to Children’s Obesity? WP-04-16 Patricia M. Anderson and Kristin F. Butcher Learning by Observing: Information Spillovers in the Execution and Valuation WP-04-17 of Commercial Bank M&As Gayle DeLong and Robert DeYoung Prospects for Immigrant-Native Wealth Assimilation: WP-04-18 Evidence from Financial Market Participation Una Okonkwo Osili and Anna Paulson Individuals and Institutions: Evidence from International Migrants in the U.S. WP-04-19 Una Okonkwo Osili and Anna Paulson Are Technology Improvements Contractionary? WP-04-20 Susanto Basu, John Fernald and Miles Kimball The Minimum Wage, Restaurant Prices and Labor Market Structure WP-04-21 Daniel Aaronson, Eric French and James MacDonald Betcha can’t acquire just one: merger programs and compensation WP-04-22 Richard J. Rosen Not Working: Demographic Changes, Policy Changes, WP-04-23 and the Distribution of Weeks (Not) Worked Lisa Barrow and Kristin F. Butcher The Role of Collateralized Household Debt in Macroeconomic Stabilization WP-04-24 Jeffrey R. Campbell and Zvi Hercowitz Advertising and Pricing at Multiple-Output Firms: Evidence from U.S. Thrift Institutions WP-04-25 Robert DeYoung and Evren Örs Monetary Policy with State Contingent Interest Rates WP-04-26 Bernardino Adão, Isabel Correia and Pedro Teles Comparing location decisions of domestic and foreign auto supplier plants WP-04-27 Thomas Klier, Paul Ma and Daniel P. McMillen China’s export growth and US trade policy WP-04-28 Chad P. Bown and Meredith A. Crowley Where do manufacturing firms locate their Headquarters? WP-04-29 J. Vernon Henderson and Yukako Ono Monetary Policy with Single Instrument Feedback Rules WP-04-30 Bernardino Adão, Isabel Correia and Pedro Teles

3
Working Paper Series (continued) Firm-Specific Capital, Nominal Rigidities and the Business Cycle WP-05-01 David Altig, Lawrence J. Christiano, Martin Eichenbaum and Jesper Linde Do Returns to Schooling Differ by Race and Ethnicity? WP-05-02 Lisa Barrow and Cecilia Elena Rouse Derivatives and Systemic Risk: Netting, Collateral, and Closeout WP-05-03 Robert R. Bliss and George G. Kaufman Risk Overhang and Loan Portfolio Decisions WP-05-04 Robert DeYoung, Anne Gron and Andrew Winton Characterizations in a random record model with a non-identically distributed initial record WP-05-05 Gadi Barlevy and H. N. Nagaraja Price discovery in a market under stress: the U.S. Treasury market in fall 1998 WP-05-06 Craig H. Furfine and Eli M. Remolona Politics and Efficiency of Separating Capital and Ordinary Government Budgets WP-05-07 Marco Bassetto with Thomas J. Sargent Rigid Prices: Evidence from U.S. Scanner Data WP-05-08 Jeffrey R. Campbell and Benjamin Eden Entrepreneurship, Frictions, and Wealth WP-05-09 Marco Cagetti and Mariacristina De Nardi Wealth inequality: data and models WP-05-10 Marco Cagetti and Mariacristina De Nardi What Determines Bilateral Trade Flows? WP-05-11 Marianne Baxter and Michael A. Kouparitsas Intergenerational Economic Mobility in the U.S., 1940 to 2000 WP-05-12 Daniel Aaronson and Bhashkar Mazumder Differential Mortality, Uncertain Medical Expenses, and the Saving of Elderly Singles WP-05-13 Mariacristina De Nardi, Eric French, and John Bailey Jones Fixed Term Employment Contracts in an Equilibrium Search Model WP-05-14 Fernando Alvarez and Marcelo Veracierto Causality, Causality, Causality: The View of Education Inputs and Outputs from Economics WP-05-15 Lisa Barrow and Cecilia Elena Rouse

4
Working Paper Series (continued) Competition in Large Markets WP-05-16 Jeffrey R. Campbell Why Do Firms Go Public? Evidence from the Banking Industry WP-05-17 Richard J. Rosen, Scott B. Smart and Chad J. Zutter Clustering of Auto Supplier Plants in the U.S.: GMM Spatial Logit for Large Samples WP-05-18 Thomas Klier and Daniel P. McMillen Why are Immigrants’ Incarceration Rates So Low? Evidence on Selective Immigration, Deterrence, and Deportation WP-05-19 Kristin F. Butcher and Anne Morrison Piehl Constructing the Chicago Fed Income Based Economic Index – Consumer Price Index: Inflation Experiences by Demographic Group: 1983-2005 WP-05-20 Leslie McGranahan and Anna Paulson Universal Access, Cost Recovery, and Payment Services WP-05-21 Sujit Chakravorti, Jeffery W. Gunther, and Robert R. Moore Supplier Switching and Outsourcing WP-05-22 Yukako Ono and Victor Stango Do Enclaves Matter in Immigrants’ Self-Employment Decision? WP-05-23 Maude Toussaint-Comeau The Changing Pattern of Wage Growth for Low Skilled Workers WP-05-24 Eric French, Bhashkar Mazumder and Christopher Taber U.S. Corporate and Bank Insolvency Regimes: An Economic Comparison and Evaluation WP-06-01 Robert R. Bliss and George G. Kaufman Redistribution, Taxes, and the Median Voter WP-06-02 Marco Bassetto and Jess Benhabib Identification of Search Models with Initial Condition Problems WP-06-03 Gadi Barlevy and H. N. Nagaraja Tax Riots WP-06-04 Marco Bassetto and Christopher Phelan The Tradeoff between Mortgage Prepayments and Tax-Deferred Retirement Savings WP-06-05 Gene Amromin, Jennifer Huang,and Clemens Sialm Why are safeguards needed in a trade agreement? WP-06-06 Meredith A. Crowley

5
Working Paper Series (continued) Taxation, Entrepreneurship, and Wealth WP-06-07 Marco Cagetti and Mariacristina De Nardi A New Social Compact: How University Engagement Can Fuel Innovation WP-06-08 Laura Melle, Larry Isaak, and Richard Mattoon Mergers and Risk WP-06-09 Craig H. Furfine and Richard J. Rosen Two Flaws in Business Cycle Accounting WP-06-10 Lawrence J. Christiano and Joshua M. Davis Do Consumers Choose the Right Credit Contracts? WP-06-11 Sumit Agarwal, Souphala Chomsisengphet, Chunlin Liu, and Nicholas S. Souleles Chronicles of a Deflation Unforetold WP-06-12 François R. Velde Female Offenders Use of Social Welfare Programs Before and After Jail and Prison: Does Prison Cause Welfare Dependency? WP-06-13 Kristin F. Butcher and Robert J. LaLonde Eat or Be Eaten: A Theory of Mergers and Firm Size WP-06-14 Gary Gorton, Matthias Kahl, and Richard Rosen Do Bonds Span Volatility Risk in the U.S. Treasury Market? A Specification Test for Affine Term Structure Models WP-06-15 Torben G. Andersen and Luca Benzoni Transforming Payment Choices by Doubling Fees on the Illinois Tollway WP-06-16 Gene Amromin, Carrie Jankowski, and Richard D. Porter How Did the 2003 Dividend Tax Cut Affect Stock Prices? WP-06-17 Gene Amromin, Paul Harrison, and Steven Sharpe Will Writing and Bequest Motives: Early 20th Century Irish Evidence WP-06-18 Leslie McGranahan How Professional Forecasters View Shocks to GDP WP-06-19 Spencer D. Krane Evolving Agglomeration in the U.S. auto supplier industry WP-06-20 Thomas Klier and Daniel P. McMillen Mortality, Mass-Layoffs, and Career Outcomes: An Analysis using Administrative Data WP-06-21 Daniel Sullivan and Till von Wachter

6
Working Paper Series (continued) The Agreement on Subsidies and Countervailing Measures: Tying One’s Hand through the WTO. WP-06-22 Meredith A. Crowley How Did Schooling Laws Improve Long-Term Health and Lower Mortality? WP-06-23 Bhashkar Mazumder Manufacturing Plants’ Use of Temporary Workers: An Analysis Using Census Micro Data WP-06-24 Yukako Ono and Daniel Sullivan What Can We Learn about Financial Access from U.S. Immigrants? WP-06-25 Una Okonkwo Osili and Anna Paulson Bank Imputed Interest Rates: Unbiased Estimates of Offered Rates? WP-06-26 Evren Ors and Tara Rice Welfare Implications of the Transition to High Household Debt WP-06-27 Jeffrey R. Campbell and Zvi Hercowitz Last-In First-Out Oligopoly Dynamics WP-06-28 Jaap H. Abbring and Jeffrey R. Campbell Oligopoly Dynamics with Barriers to Entry WP-06-29 Jaap H. Abbring and Jeffrey R. Campbell Risk Taking and the Quality of Informal Insurance: Gambling and Remittances in Thailand WP-07-01 Douglas L. Miller and Anna L. Paulson Fast Micro and Slow Macro: Can Aggregation Explain the Persistence of Inflation? WP-07-02 Filippo Altissimo, Benoît Mojon, and Paolo Zaffaroni Assessing a Decade of Interstate Bank Branching WP-07-03 Christian Johnson and Tara Rice Debit Card and Cash Usage: A Cross-Country Analysis WP-07-04 Gene Amromin and Sujit Chakravorti The Age of Reason: Financial Decisions Over the Lifecycle WP-07-05 Sumit Agarwal, John C. Driscoll, Xavier Gabaix, and David Laibson Information Acquisition in Financial Markets: a Correction WP-07-06 Gadi Barlevy and Pietro Veronesi Monetary Policy, Output Composition and the Great Moderation WP-07-07 Benoît Mojon


