41
Monetary Policy Statement February 2018

iRESERVE BANK OF NEW ZEALAND/MONETARY POLICY STATEMENT, FEBRUARY 2018
Monetary Policy StatementFebruary 2018
iiRESERVE BANK OF NEW ZEALAND/MONETARY POLICY STATEMENT, FEBRUARY 2018
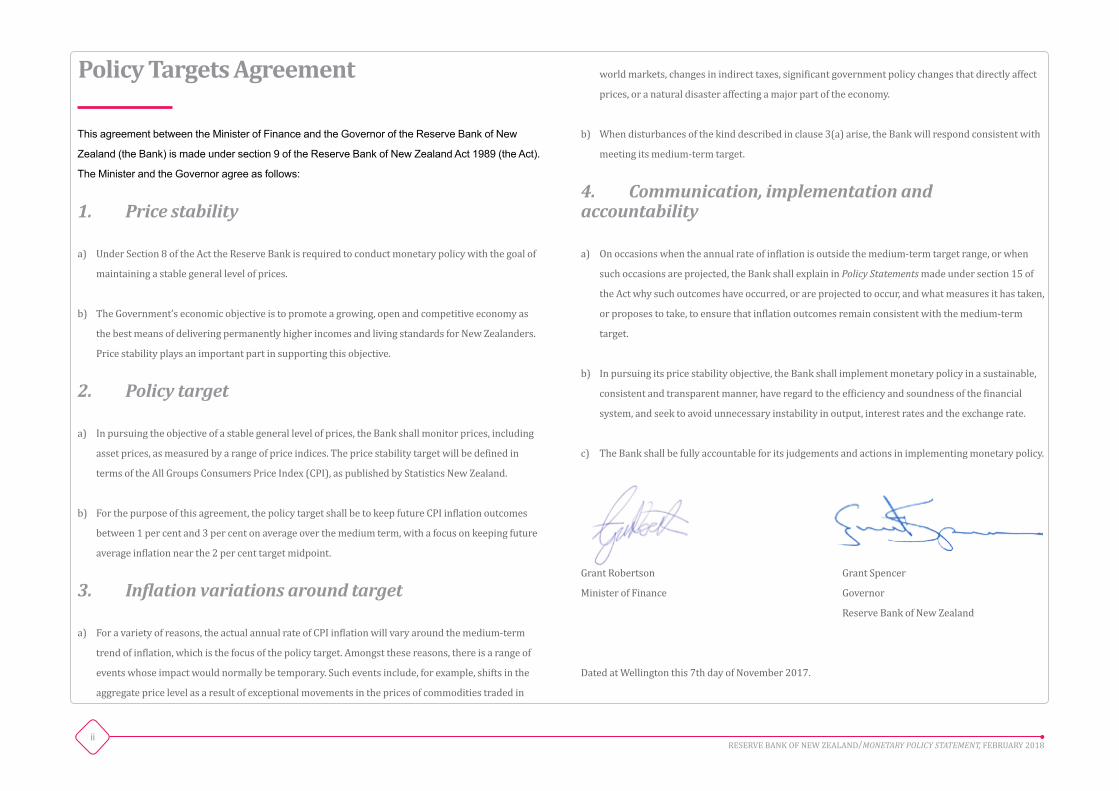
Policy Targets Agreement
This agreement between the Minister of Finance and the Governor of the Reserve Bank of New
Zealand (the Bank) is made under section 9 of the Reserve Bank of New Zealand Act 1989 (the Act).
The Minister and the Governor agree as follows:
1. Price stability
a) Under Section 8 of the Act the Reserve Bank is required to conduct monetary policy with the goal of
maintaining a stable general level of prices.
b) The Government’s economic objective is to promote a growing, open and competitive economy as
the best means of delivering permanently higher incomes and living standards for New Zealanders.
Price stability plays an important part in supporting this objective.
2. Policy target
a) In pursuing the objective of a stable general level of prices, the Bank shall monitor prices, including
asset prices, as measured by a range of price indices. The price stability target will be defined in
terms of the All Groups Consumers Price Index (CPI), as published by Statistics New Zealand.
b) For the purpose of this agreement, the policy target shall be to keep future CPI inflation outcomes
between 1 per cent and 3 per cent on average over the medium term, with a focus on keeping future
average inflation near the 2 per cent target midpoint.
3. Inflationvariationsaroundtarget
a) For a variety of reasons, the actual annual rate of CPI inflation will vary around the medium-term
trend of inflation, which is the focus of the policy target. Amongst these reasons, there is a range of
events whose impact would normally be temporary. Such events include, for example, shifts in the
aggregate price level as a result of exceptional movements in the prices of commodities traded in
world markets, changes in indirect taxes, significant government policy changes that directly affect
prices, or a natural disaster affecting a major part of the economy.
b) When disturbances of the kind described in clause 3(a) arise, the Bank will respond consistent with
meeting its medium-term target.
4. Communication,implementationandaccountability
a) On occasions when the annual rate of inflation is outside the medium-term target range, or when
such occasions are projected, the Bank shall explain in Policy Statements made under section 15 of
the Act why such outcomes have occurred, or are projected to occur, and what measures it has taken,
or proposes to take, to ensure that inflation outcomes remain consistent with the medium-term
target.
b) In pursuing its price stability objective, the Bank shall implement monetary policy in a sustainable,
consistent and transparent manner, have regard to the efficiency and soundness of the financial
system, and seek to avoid unnecessary instability in output, interest rates and the exchange rate.
c) The Bank shall be fully accountable for its judgements and actions in implementing monetary policy.
Grant Robertson
Minister of Finance
Dated at Wellington this 7th day of November 2017.
Grant Spencer
Governor
Reserve Bank of New Zealand
1RESERVE BANK OF NEW ZEALAND/MONETARY POLICY STATEMENT, FEBRUARY 2018
Monetary Policy StatementFebruary 2018
Projections finalised on 29 January 2018. Data finalised on 31 January 2018. Policy assessment finalised on 7 February 2018.
1. Policy assessment 3
2. Key policy judgements 4
3. International developments 12
4. Current domestic conditions 18
5. The macroeconomic outlook 29
Contents
2RESERVE BANK OF NEW ZEALAND/MONETARY POLICY STATEMENT, FEBRUARY 2018
Report and supporting notes published at:
http://www.rbnz.govt.nz/monetary-policy/monetary-policy-statement
Subscribe online: http://www.rbnz.govt.nz/email-updates
Copyright © 2018 Reserve Bank of New Zealand
This report is published pursuant to section 165A of the Reserve Bank of New Zealand Act 1989.
ISSN 1770-4829
3RESERVE BANK OF NEW ZEALAND/MONETARY POLICY STATEMENT, FEBRUARY 2018
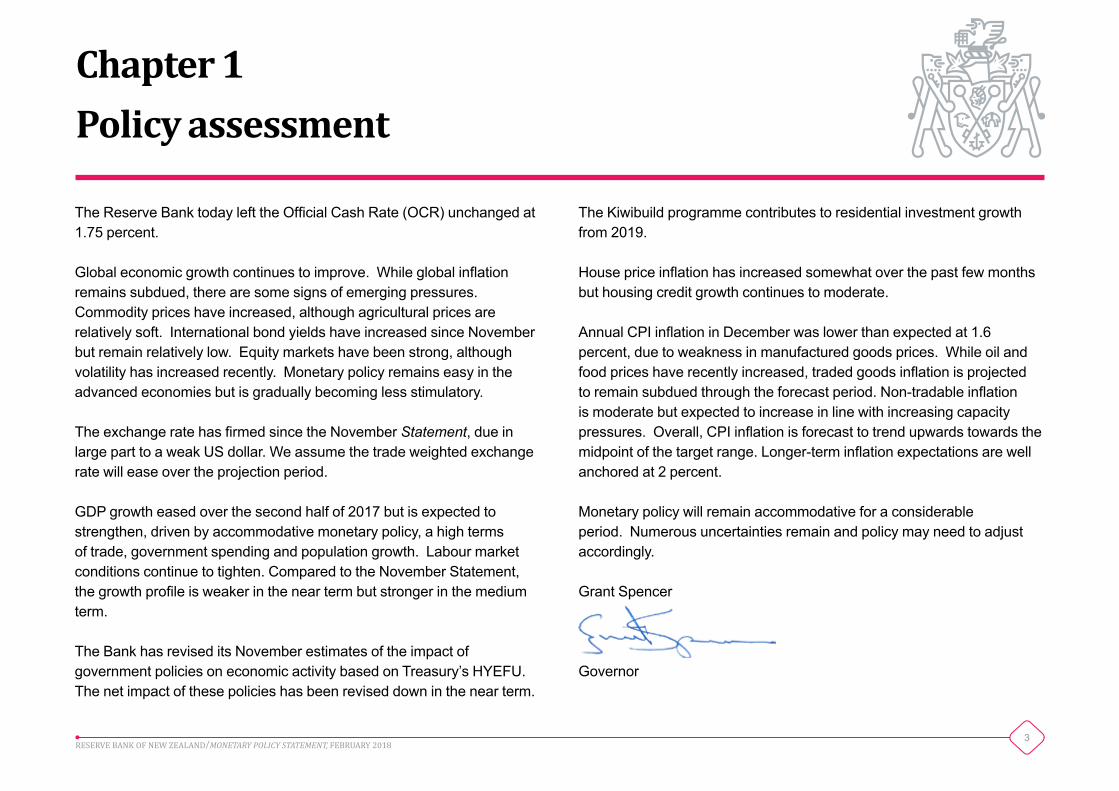
The Kiwibuild programme contributes to residential investment growth from 2019.
House price inflation has increased somewhat over the past few months but housing credit growth continues to moderate.
Annual CPI inflation in December was lower than expected at 1.6 percent, due to weakness in manufactured goods prices. While oil and food prices have recently increased, traded goods inflation is projected to remain subdued through the forecast period. Non-tradable inflation is moderate but expected to increase in line with increasing capacity pressures. Overall, CPI inflation is forecast to trend upwards towards the midpoint of the target range. Longer-term inflation expectations are well anchored at 2 percent.
Monetary policy will remain accommodative for a considerable period. Numerous uncertainties remain and policy may need to adjust accordingly.
Grant Spencer
Governor
Chapter 1Policy assessment
The Reserve Bank today left the Official Cash Rate (OCR) unchanged at 1.75 percent.
Global economic growth continues to improve. While global inflation remains subdued, there are some signs of emerging pressures. Commodity prices have increased, although agricultural prices are relatively soft. International bond yields have increased since November but remain relatively low. Equity markets have been strong, although volatility has increased recently. Monetary policy remains easy in the advanced economies but is gradually becoming less stimulatory.
The exchange rate has firmed since the November Statement, due in large part to a weak US dollar. We assume the trade weighted exchange rate will ease over the projection period.
GDP growth eased over the second half of 2017 but is expected to strengthen, driven by accommodative monetary policy, a high terms of trade, government spending and population growth. Labour market conditions continue to tighten. Compared to the November Statement, the growth profile is weaker in the near term but stronger in the medium term.
The Bank has revised its November estimates of the impact of government policies on economic activity based on Treasury’s HYEFU. The net impact of these policies has been revised down in the near term.
4RESERVE BANK OF NEW ZEALAND/MONETARY POLICY STATEMENT, FEBRUARY 2018
Chapter 2Key policy judgements
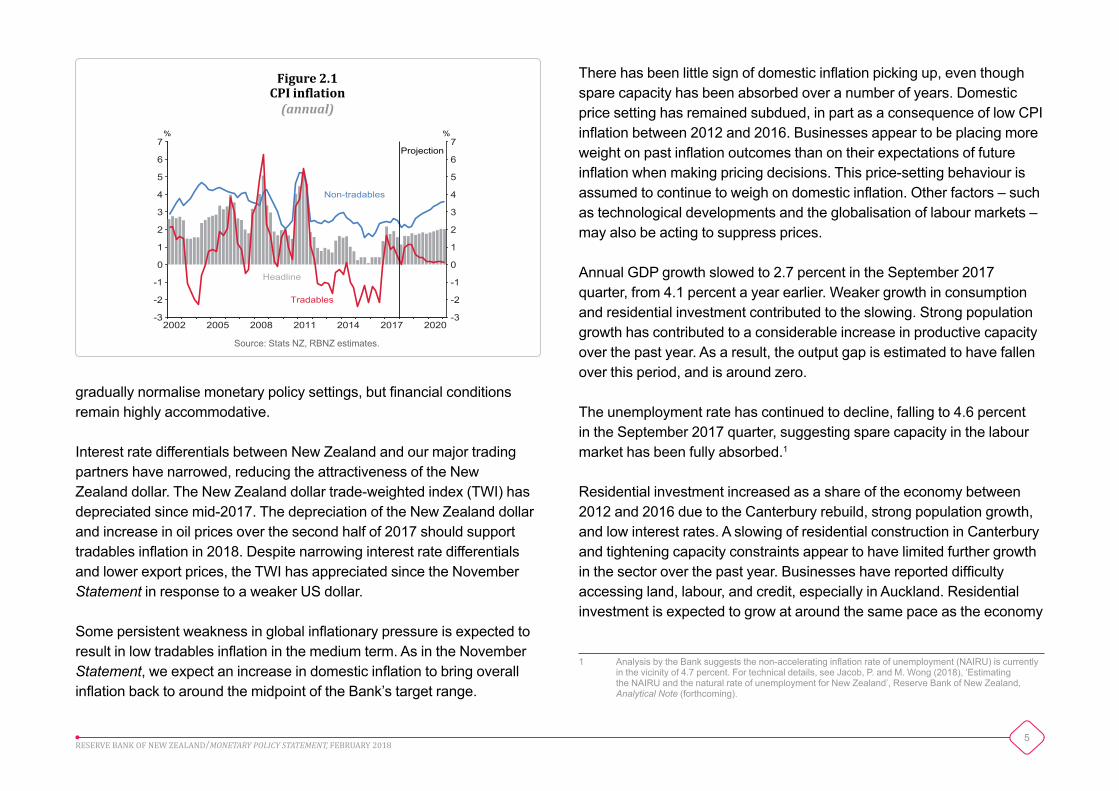
CPI inflation was stronger over 2017 than in the previous five years, reflecting an increase in tradables inflation caused by higher food and fuel prices (figure 2.1). Annual CPI inflation was 1.6 percent in the December 2017 quarter, weaker than the Bank and most forecasters had expected. The weakness was driven by softer tradables inflation. Headline inflation is expected to fluctuate over the coming year, partly as a result of variable tradables inflation and the removal of fees for the first year of tertiary education.
Underlying inflation remains low. The Bank’s preferred measures of core inflation were between 1.0 percent and 1.5 percent in the December 2017 quarter. Measures of domestic inflation, such as non-tradables inflation and wage inflation, remain below their historical averages.
Global economic conditions have continued to improve. There have been further broad-based improvements in the outlook for trading-partner growth, with risks to activity balanced over the medium term. With global activity improving and capacity pressure building, underlying inflation in our key trading partners is expected to increase gradually from its current low level. There are some signs of inflationary pressure emerging. Producer price inflation has increased in the United States, China, and Europe over the past six months. Major central banks continue to
• Annual CPI inflation, at 1.6 percent, was lower than forecast for the December 2017 quarter. Measures of underlying inflationary pressure remain low.
• GDP growth slowed through 2017, but is expected to improve over the projection, supported by elevated terms of trade, population growth, fiscal stimulus, and low interest rates.
• Monetary policy is expected to remain accommodative to support domestic demand, and to ensure domestic inflation increases and headline inflation settles near the target midpoint in the medium term.
• The key judgements underlying the policy stance are related to the impact of improving global conditions, changes in government policy, household spending, the current degree of capacity pressure, and price-setting behaviour.
5RESERVE BANK OF NEW ZEALAND/MONETARY POLICY STATEMENT, FEBRUARY 2018
2002 2005 2008 2011 2014 2017 2020-3
-2
-1
0
1
2
3
4
5
6
7
-3
-2
-1
0
1
2
3
4
5
6
7% %
Projection
Headline
Tradables
Non-tradables
Figure 2.1 CPI inflation(annual)
Source: Stats NZ, RBNZ estimates.
gradually normalise monetary policy settings, but financial conditions remain highly accommodative.
Interest rate differentials between New Zealand and our major trading partners have narrowed, reducing the attractiveness of the New Zealand dollar. The New Zealand dollar trade-weighted index (TWI) has depreciated since mid-2017. The depreciation of the New Zealand dollar and increase in oil prices over the second half of 2017 should support tradables inflation in 2018. Despite narrowing interest rate differentials and lower export prices, the TWI has appreciated since the November Statement in response to a weaker US dollar.
Some persistent weakness in global inflationary pressure is expected to result in low tradables inflation in the medium term. As in the November Statement, we expect an increase in domestic inflation to bring overall inflation back to around the midpoint of the Bank’s target range.
There has been little sign of domestic inflation picking up, even though spare capacity has been absorbed over a number of years. Domestic price setting has remained subdued, in part as a consequence of low CPI inflation between 2012 and 2016. Businesses appear to be placing more weight on past inflation outcomes than on their expectations of future inflation when making pricing decisions. This price-setting behaviour is assumed to continue to weigh on domestic inflation. Other factors – such as technological developments and the globalisation of labour markets – may also be acting to suppress prices.
Annual GDP growth slowed to 2.7 percent in the September 2017 quarter, from 4.1 percent a year earlier. Weaker growth in consumption and residential investment contributed to the slowing. Strong population growth has contributed to a considerable increase in productive capacity over the past year. As a result, the output gap is estimated to have fallen over this period, and is around zero.
The unemployment rate has continued to decline, falling to 4.6 percent in the September 2017 quarter, suggesting spare capacity in the labour market has been fully absorbed.1
Residential investment increased as a share of the economy between 2012 and 2016 due to the Canterbury rebuild, strong population growth, and low interest rates. A slowing of residential construction in Canterbury and tightening capacity constraints appear to have limited further growth in the sector over the past year. Businesses have reported difficulty accessing land, labour, and credit, especially in Auckland. Residential investment is expected to grow at around the same pace as the economy
1 Analysis by the Bank suggests the non-accelerating inflation rate of unemployment (NAIRU) is currently in the vicinity of 4.7 percent. For technical details, see Jacob, P. and M. Wong (2018), ‘Estimating the NAIRU and the natural rate of unemployment for New Zealand’, Reserve Bank of New Zealand, Analytical Note (forthcoming).
6RESERVE BANK OF NEW ZEALAND/MONETARY POLICY STATEMENT, FEBRUARY 2018
2002 2005 2008 2011 2014 2017 20201
2
3
4
5
6
7
8
9
1
2
3
4
5
6
7
8
9% %
Projection
Figure 2.2 Official Cash Rate
Source: RBNZ estimates.
over the next year. The KiwiBuild housing programme is assumed to generate faster growth in construction activity from 2019.
Annual house price inflation slowed to 4 percent in December 2017, from a peak of 16 percent in May 2016. Changes to loan-to-value ratio (LVR) requirements, a tightening in lending standards, and higher mortgage rates through the end of 2016 have moderated demand for housing. Weaker investor and overseas demand, pressure on affordability, and reduced expectations of future capital gains may have also contributed to the slowdown. While monthly house price inflation has increased since July, we expect this to moderate over the projection. Population growth is expected to slow and government policies are expected to dampen demand.
Annual consumption growth slowed to 3.4 percent in the September 2017 quarter. An increase in government transfers and allowances is expected to raise household incomes and contribute to consumption growth over the projection. Consumption is also expected to be supported by low interest rates, elevated terms of trade, and population growth. Low house price inflation is expected to have some dampening effect on consumption over the medium term.
In addition to KiwiBuild and an increase in transfers and allowances, higher government consumption is expected to support GDP growth over the projection. However, the degree of fiscal stimulus is smaller than assumed in the November Statement. The impact of transfers and allowances on aggregate demand is assumed to be more short-lived and KiwiBuild is assumed to start adding to residential investment later in the projection. These updated assumptions reflect new information from the Treasury’s Half Year Economic and Fiscal Update (HYEFU 2017) and the Bank’s analysis of how fiscal policies affect the economy.
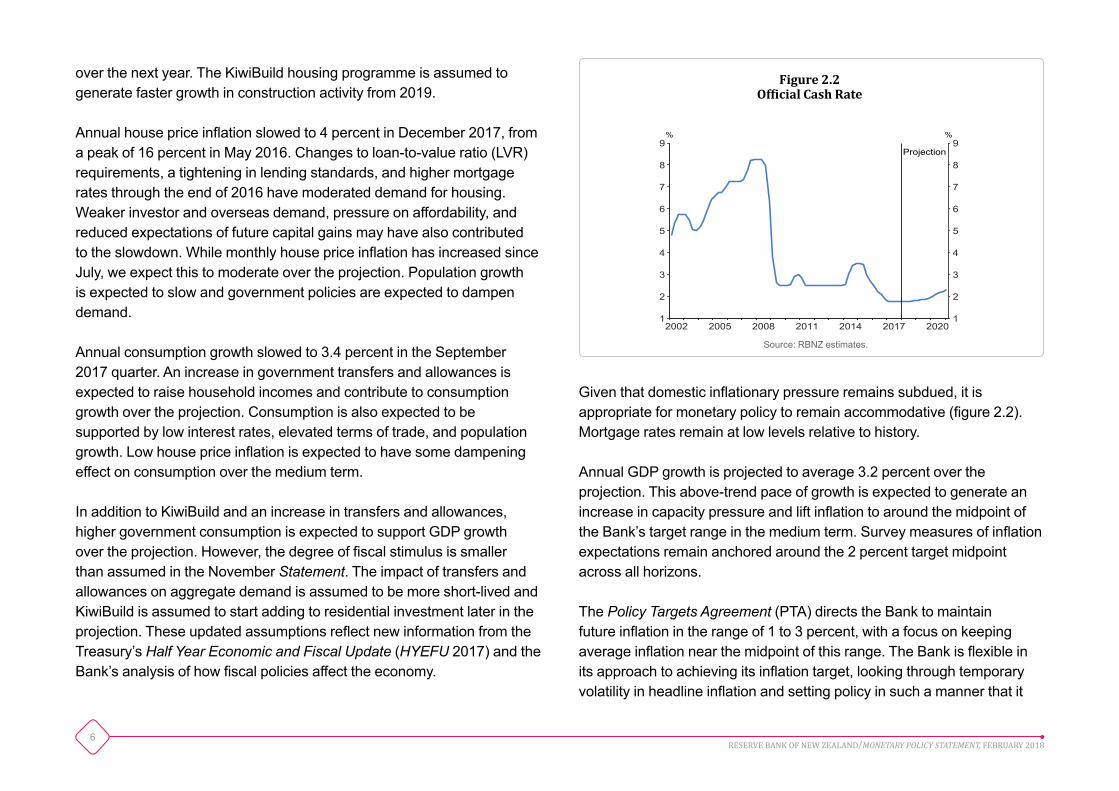
Given that domestic inflationary pressure remains subdued, it is appropriate for monetary policy to remain accommodative (figure 2.2). Mortgage rates remain at low levels relative to history.
Annual GDP growth is projected to average 3.2 percent over the projection. This above-trend pace of growth is expected to generate an increase in capacity pressure and lift inflation to around the midpoint of the Bank’s target range in the medium term. Survey measures of inflation expectations remain anchored around the 2 percent target midpoint across all horizons.
The Policy Targets Agreement (PTA) directs the Bank to maintain future inflation in the range of 1 to 3 percent, with a focus on keeping average inflation near the midpoint of this range. The Bank is flexible in its approach to achieving its inflation target, looking through temporary volatility in headline inflation and setting policy in such a manner that it
7RESERVE BANK OF NEW ZEALAND/MONETARY POLICY STATEMENT, FEBRUARY 2018
does not generate unnecessary volatility in output, interest rates, and the exchange rate. Following our usual practice, the Bank currently assumes a gradual return of inflation to the target midpoint. Using additional stimulus to generate a faster return to target would risk generating unnecessary volatility in the economy, as stimulus would need to be withdrawn as domestic inflationary pressure builds in the latter part of the projection. A premature tightening would risk undermining growth and employment, and could cause inflation to settle below the midpoint of the target range.
The economic projections set out in this Statement present the Bank’s conditional expectation of monetary policy settings necessary to meet the requirements of the PTA. There is always uncertainty around projections. Our assessment of the outlook and the appropriate stance of monetary policy depend on a range of judgements. The key assumptions and judgements are outlined below. If the assumptions underpinning the projections prove to be inconsistent with incoming data, or if risks to the projections materialise, the outlook for policy will be revised. The key risks around these assumptions are discussed in chapter 5.
Globaleconomicconditions
Global economic conditions are expected to improve further, partly because monetary policy remains highly stimulatory globally. Capacity pressure is expected to increase and inflation to pick up across our trading partners. As a result, central banks are expected to continue gradually removing monetary stimulus by raising interest rates and winding back quantitative easing.
Annual tradables inflation is expected to be below its historic average in the medium term. Improving global economic conditions and rising inflationary pressure could lead to higher tradables inflation
than assumed, although this would be a significant change from the experience of the past five years.
Annual net immigration is expected to fall by around 30,000 over the projection period. As the labour market in Australia strengthens, we assume departures from New Zealand will increase. Consistent with an anticipated tightening in visa requirements, arrivals are assumed to fall from their recent elevated levels. This slowdown is assumed to have a small dampening effect on inflationary pressure.
Other key assumptions are that:
• the New Zealand dollar TWI gradually falls to 73.5 by the end of the projection;
• the Dubai oil price declines from USD 66 per barrel currently, to around USD 55 per barrel by the end of the projection; and
• whole milk powder prices remain around the current level of close to USD 3,000 per metric tonne.
Domesticinflationarypressure
The level of GDP has been revised significantly higher since 2015 (see box C). This has not materially changed the Bank’s estimate of current capacity pressure from the assumption in the November Statement, as the Bank’s estimate of potential output has been revised by a similar amount. The estimated output gap is consistent with a range of indicators of capacity pressure and with low domestic inflation.
Annual house price inflation is forecast to stabilise at around 2 percent in the medium term. The observed increase in monthly house price inflation
8RESERVE BANK OF NEW ZEALAND/MONETARY POLICY STATEMENT, FEBRUARY 2018
over the second half of 2017 is assumed to be short-lived. Given low interest rates and excess demand for housing, house prices could rise by more than we have assumed.
The KiwiBuild housing programme is expected to generate faster growth in residential investment from 2019. With significant capacity constraints affecting the construction sector, there is a risk that KiwiBuild has a smaller effect on residential investment if private sector developments are delayed.
In these projections, low past inflation is assumed to dampen current and future inflation through price-setting behaviour. As CPI inflation
settles around the target midpoint over the medium term, this dampening influence is assumed to gradually dissipate. A higher minimum wage is assumed to boost wages both for those on the minimum wage and those earning just above it. The effects of the minimum wage changes could be more widespread and could affect firms’ pricing decisions by more than currently assumed.
Our central expectation is that capacity pressure will increase, leading to an upwards move in the OCR towards the end of the projection period. However, there are substantial upside and downside risks to the projections, reflecting the large degree of uncertainty in the current economic environment. The Bank judges these risks to be balanced.
9RESERVE BANK OF NEW ZEALAND/MONETARY POLICY STATEMENT, FEBRUARY 2018
Box A
Recent monetary policy decisions
From mid-2014 through to late 2015, a weakening in the outlook for global economic activity and an increase in supply of key commodities underpinned sharp falls in global commodity prices. The terms of trade declined sharply. While the New Zealand dollar TWI fell, it remained higher than would be expected given the decline in the terms of trade. Weak import prices and a higher-than-anticipated exchange rate contributed to a sustained period of negative tradables inflation.
Over the same period, non-tradables inflation did not strengthen as expected, given the Bank’s estimate of capacity pressure. The Bank reassessed the effect of stronger-than-expected growth in labour supply and potential output, and progressively revised down its estimate of capacity pressure. Bank analysis also suggested that businesses were putting more weight on past low inflation in their pricing decisions.1 That weak price-setting behaviour acted as a drag on medium-term inflationary pressure, requiring more monetary stimulus in order for the Bank to meet its inflation target.
The Bank initially held the OCR at 3.5 percent and progressively lowered the forward path for the OCR. With a growing risk that low inflation would persist, from June to December 2015 the Bank lowered the OCR by 100 basis points. At the December 2015 Statement, with the OCR at 2.5 percent, the Bank expected this degree of stimulus would be sufficient to see CPI inflation settle near the midpoint of the target range, but noted that it would reduce the OCR further if circumstances warranted.
1 McDermott, C J and O Karagedikli, (2017) ‘Inflation Expectations and Low Inflation in New Zealand,’ New Zealand Economic Papers, 2017, DOI: 10.1080/00779954.2017.1348386, and McDonald, C. (2017) ‘Does past inflation predict the future?’, Analytical Note AN 2017/04, Reserve Bank of New Zealand.
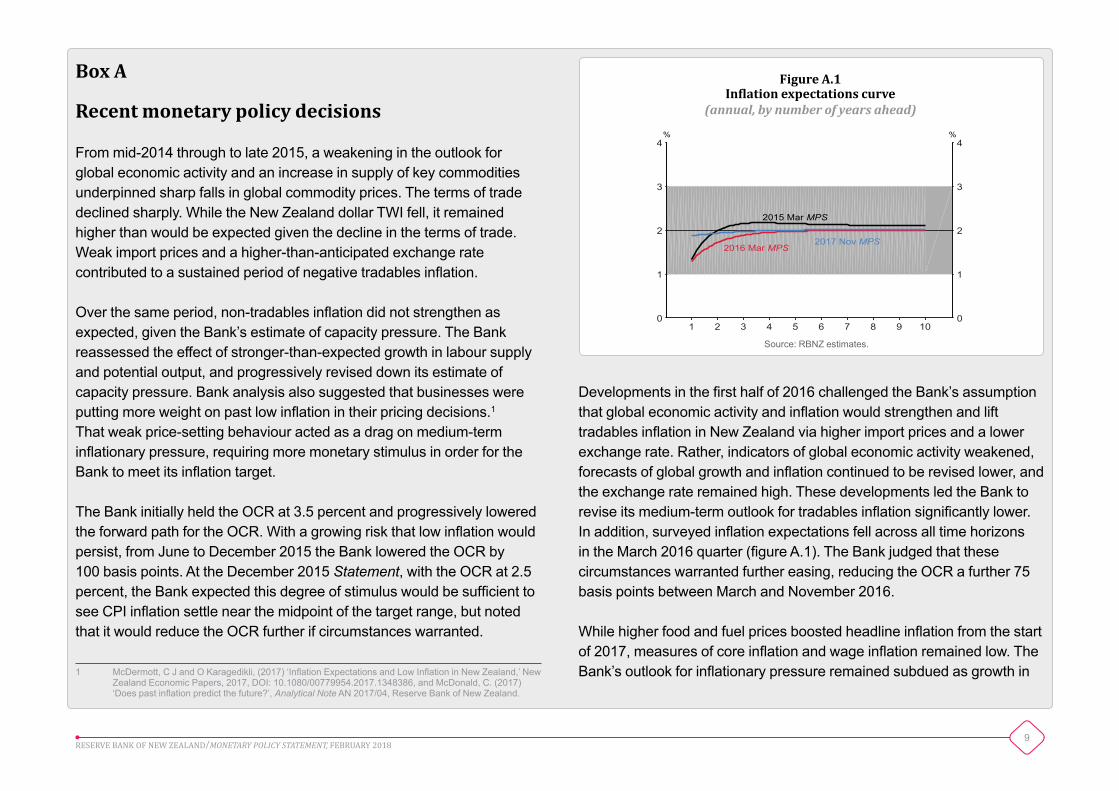
Developments in the first half of 2016 challenged the Bank’s assumption that global economic activity and inflation would strengthen and lift tradables inflation in New Zealand via higher import prices and a lower exchange rate. Rather, indicators of global economic activity weakened, forecasts of global growth and inflation continued to be revised lower, and the exchange rate remained high. These developments led the Bank to revise its medium-term outlook for tradables inflation significantly lower. In addition, surveyed inflation expectations fell across all time horizons in the March 2016 quarter (figure A.1). The Bank judged that these circumstances warranted further easing, reducing the OCR a further 75 basis points between March and November 2016.
While higher food and fuel prices boosted headline inflation from the start of 2017, measures of core inflation and wage inflation remained low. The Bank’s outlook for inflationary pressure remained subdued as growth in
1 2 3 4 5 6 7 8 9 100
1
2
3
4
0
1
2
3
4% %
2015 Mar MPS
2017 Nov MPS2016 Mar MPS
Figure A.1Inflation expectations curve
(annual,bynumberofyearsahead)
Source: RBNZ estimates.
10RESERVE BANK OF NEW ZEALAND/MONETARY POLICY STATEMENT, FEBRUARY 2018
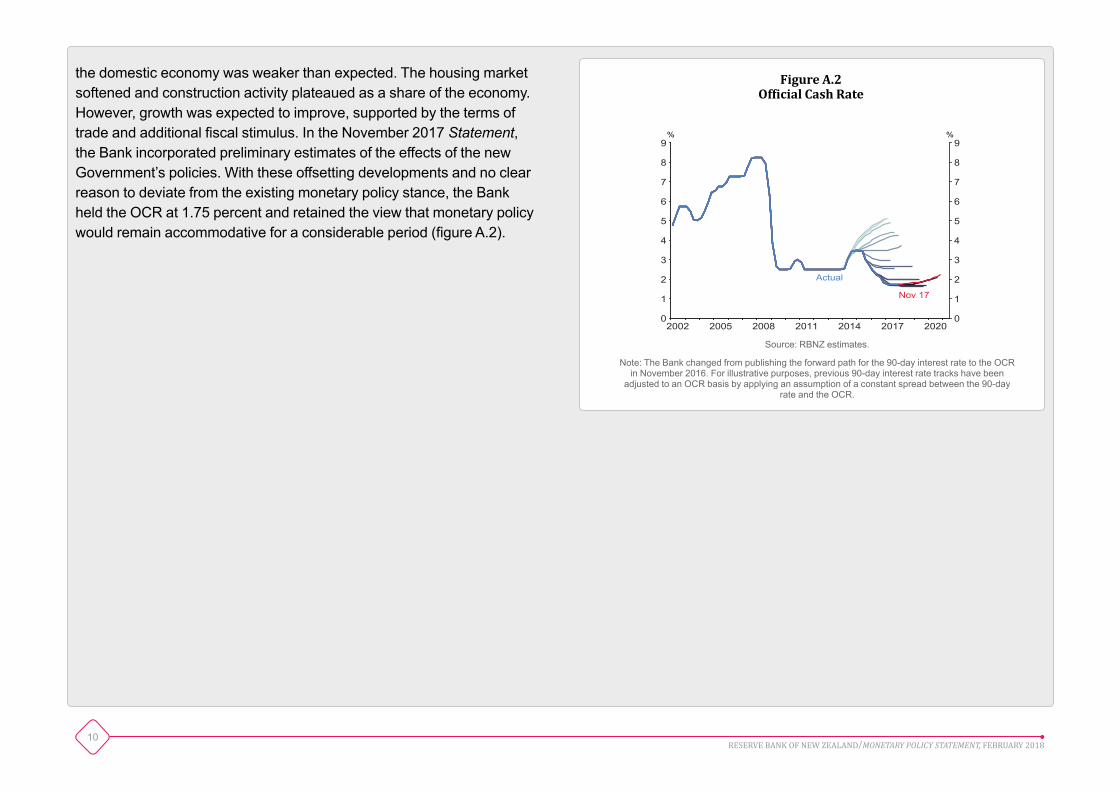
the domestic economy was weaker than expected. The housing market softened and construction activity plateaued as a share of the economy. However, growth was expected to improve, supported by the terms of trade and additional fiscal stimulus. In the November 2017 Statement, the Bank incorporated preliminary estimates of the effects of the new Government’s policies. With these offsetting developments and no clear reason to deviate from the existing monetary policy stance, the Bank held the OCR at 1.75 percent and retained the view that monetary policy would remain accommodative for a considerable period (figure A.2).
2002 2005 2008 2011 2014 2017 20200
1
2
3
4
5
6
7
8
9
0
1
2
3
4
5
6
7
8
9% %
Actual
Nov 17
Figure A.2 Official Cash Rate
Source: RBNZ estimates.
Note: The Bank changed from publishing the forward path for the 90-day interest rate to the OCR in November 2016. For illustrative purposes, previous 90-day interest rate tracks have been
adjusted to an OCR basis by applying an assumption of a constant spread between the 90-day rate and the OCR.
11RESERVE BANK OF NEW ZEALAND/MONETARY POLICY STATEMENT, FEBRUARY 2018
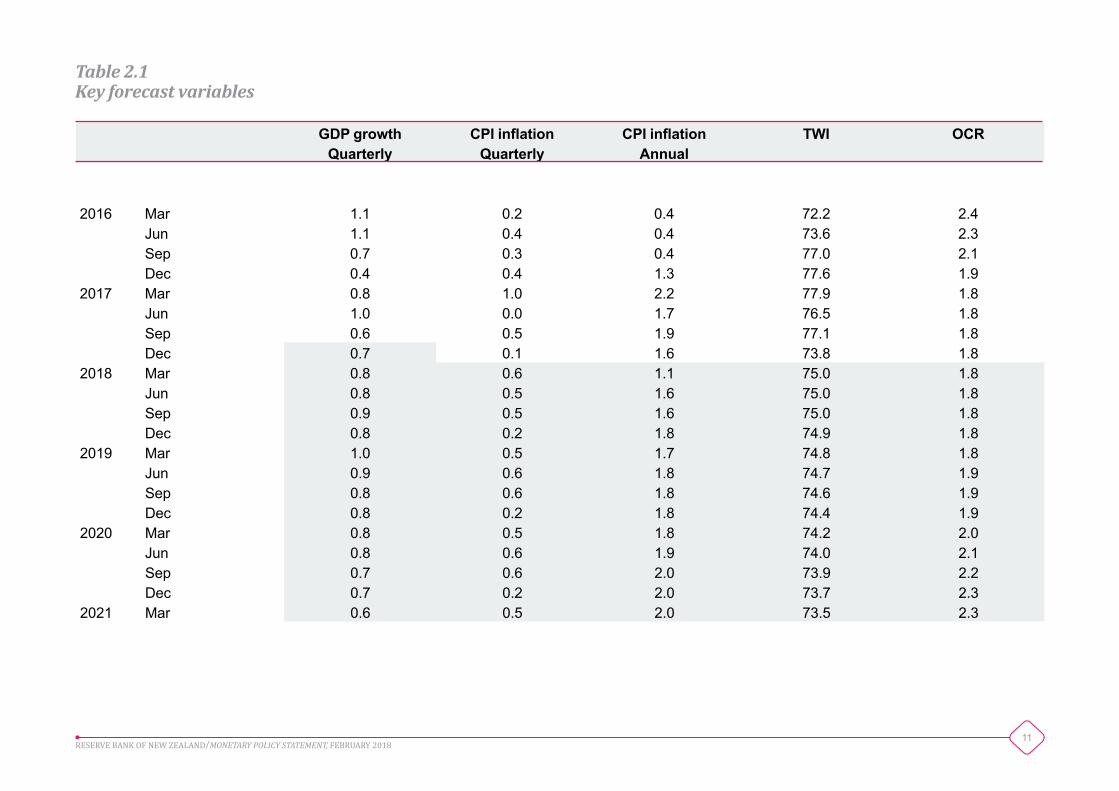
GDP growth CPI inflation CPI inflation TWI OCRQuarterly Quarterly Annual
2016 Mar 1.1 0.2 0.4 72.2 2.4 Jun 1.1 0.4 0.4 73.6 2.3 Sep 0.7 0.3 0.4 77.0 2.1 Dec 0.4 0.4 1.3 77.6 1.92017 Mar 0.8 1.0 2.2 77.9 1.8 Jun 1.0 0.0 1.7 76.5 1.8 Sep 0.6 0.5 1.9 77.1 1.8 Dec 0.7 0.1 1.6 73.8 1.82018 Mar 0.8 0.6 1.1 75.0 1.8 Jun 0.8 0.5 1.6 75.0 1.8 Sep 0.9 0.5 1.6 75.0 1.8 Dec 0.8 0.2 1.8 74.9 1.82019 Mar 1.0 0.5 1.7 74.8 1.8 Jun 0.9 0.6 1.8 74.7 1.9 Sep 0.8 0.6 1.8 74.6 1.9 Dec 0.8 0.2 1.8 74.4 1.92020 Mar 0.8 0.5 1.8 74.2 2.0 Jun 0.8 0.6 1.9 74.0 2.1 Sep 0.7 0.6 2.0 73.9 2.2 Dec 0.7 0.2 2.0 73.7 2.32021 Mar 0.6 0.5 2.0 73.5 2.3
Table 2.1 Keyforecastvariables
12RESERVE BANK OF NEW ZEALAND/MONETARY POLICY STATEMENT, FEBRUARY 2018
Chapter 3International developments
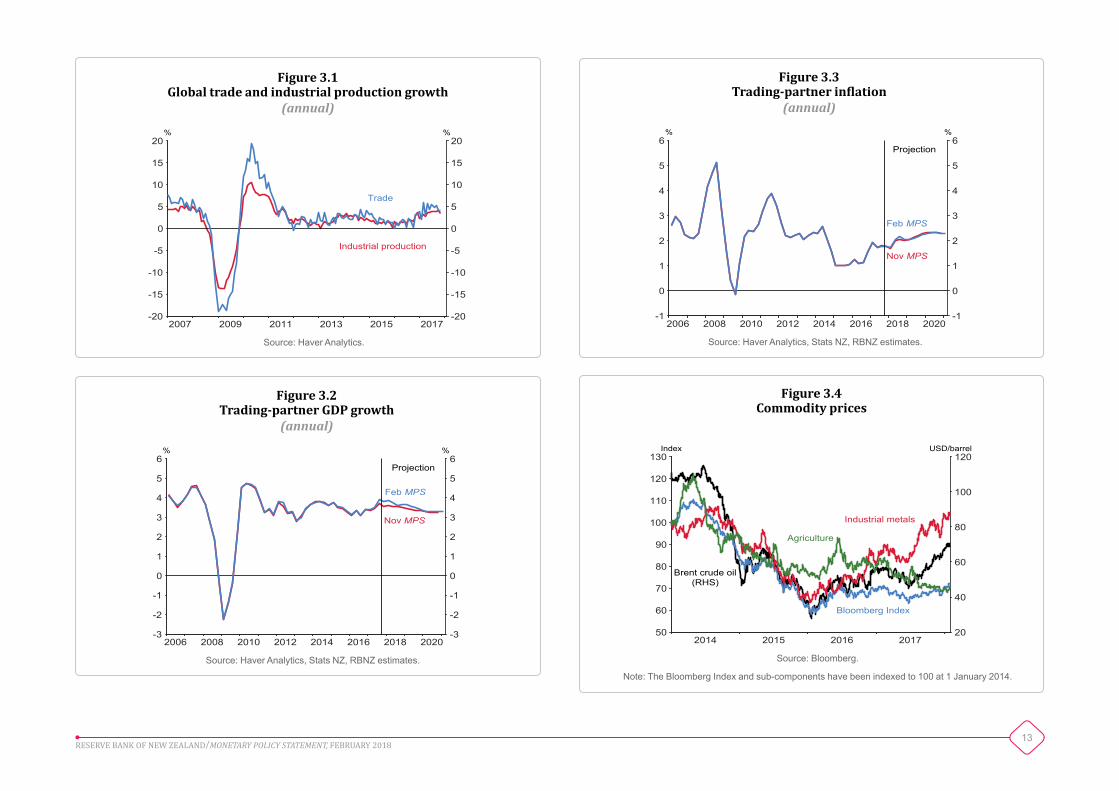
Economic indicators continue to show robust growth in activity in most major economies. Global trade increased over 2017, consistent with the increase in activity (figure 3.1). There have been further broad-based improvements to the growth outlook across New Zealand’s trading partners (figure 3.2), supported by accommodative financial conditions.
The outlook for trading-partner inflation has stabilised (figure 3.3), following downward revisions through 2017. There are some early signs that global inflationary pressure may be starting to build.
Oil prices have risen since the November Statement (figure 3.4), reflecting stronger global demand and restricted supply in some regions. A supply response by North American shale oil producers is expected to limit further upside to oil prices. Prices of industrial metals have also increased on the back of strengthening demand, and have been further supported by supply constraints for some products. In contrast, agricultural prices have remained soft.
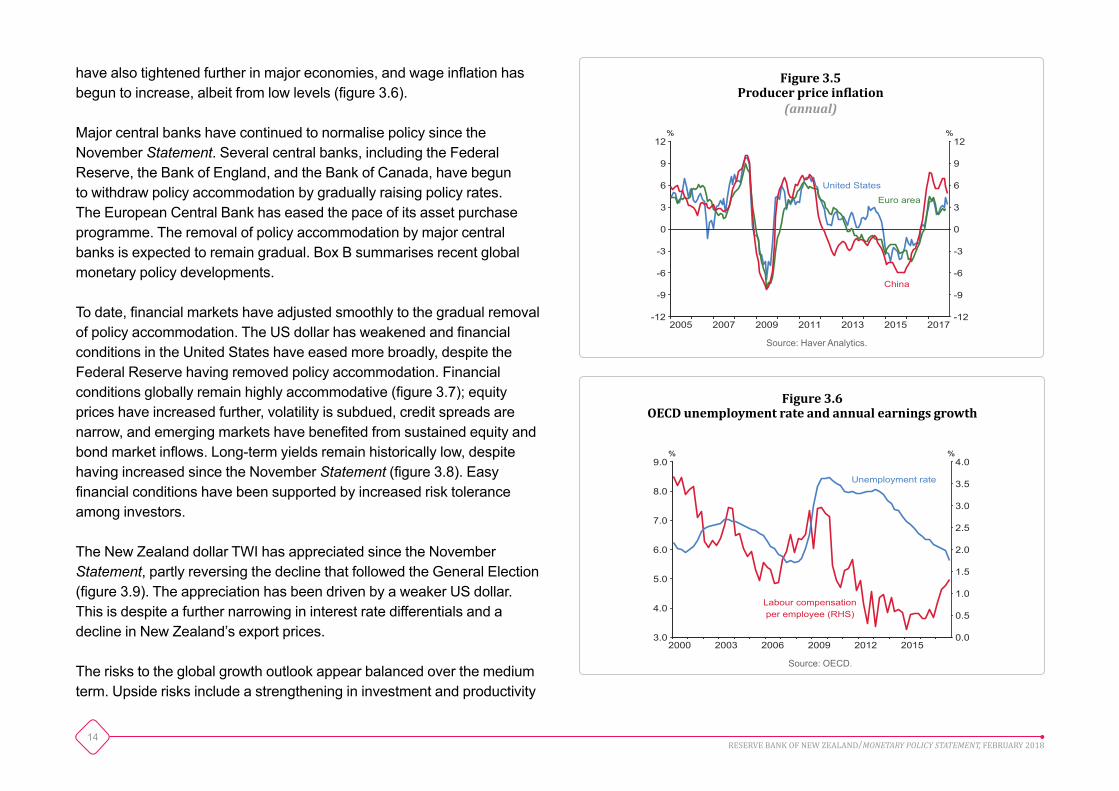
Increases in the prices of oil and industrial metals have fed through to higher producer prices globally (figure 3.5), suggesting there is inflationary pressure early in the supply chain. Labour market conditions
• Economic growth in major trading partners has continued to strengthen since the November Statement.
• Projections of trading-partner inflation have remained largely unchanged in recent months. However, there are some signs that inflationary pressure may be emerging.
• Central banks have continued to gradually normalise policy, but financial conditions remain highly accommodative.
• The risks to the global growth outlook appear balanced over the medium term, while risks to global inflationary pressure have tilted to the upside.
13RESERVE BANK OF NEW ZEALAND/MONETARY POLICY STATEMENT, FEBRUARY 2018
Figure 3.1Global trade and industrial production growth
(annual)
2007 2009 2011 2013 2015 2017-20
-15
-10
-5
0
5
10
15
20
-20
-15
-10
-5
0
5
10
15
20% %
Trade
Industrial production
Source: Haver Analytics.
2006 2008 2010 2012 2014 2016 2018 2020-3
-2
-1
0
1
2
3
4
5
6
-3
-2
-1
0
1
2
3
4
5
6% %
Nov MPS
Feb MPS
Projection
Figure 3.2Trading-partner GDP growth
(annual)
Source: Haver Analytics, Stats NZ, RBNZ estimates.
2014 2015 2016 201720
40
60
80
100
120
50
60
70
80
90
100
110
120
130Index USD/barrel
Bloomberg Index
Brent crude oil(RHS)
Industrial metals
Agriculture
Figure 3.4Commodity prices
Source: Bloomberg.
Note: The Bloomberg Index and sub-components have been indexed to 100 at 1 January 2014.
2006 2008 2010 2012 2014 2016 2018 2020-1
0
1
2
3
4
5
6
-1
0
1
2
3
4
5
6% %
Projection
Feb MPS
Nov MPS
Figure 3.3Trading-partner inflation
(annual)
Source: Haver Analytics, Stats NZ, RBNZ estimates.
14RESERVE BANK OF NEW ZEALAND/MONETARY POLICY STATEMENT, FEBRUARY 2018
2005 2007 2009 2011 2013 2015 2017-12
-9
-6
-3
0
3
6
9
12
-12
-9
-6
-3
0
3
6
9
12% %
United States
Euro area
China
Figure 3.5Producer price inflation
(annual)
Source: Haver Analytics.
have also tightened further in major economies, and wage inflation has begun to increase, albeit from low levels (figure 3.6).
Major central banks have continued to normalise policy since the November Statement. Several central banks, including the Federal Reserve, the Bank of England, and the Bank of Canada, have begun to withdraw policy accommodation by gradually raising policy rates. The European Central Bank has eased the pace of its asset purchase programme. The removal of policy accommodation by major central banks is expected to remain gradual. Box B summarises recent global monetary policy developments.
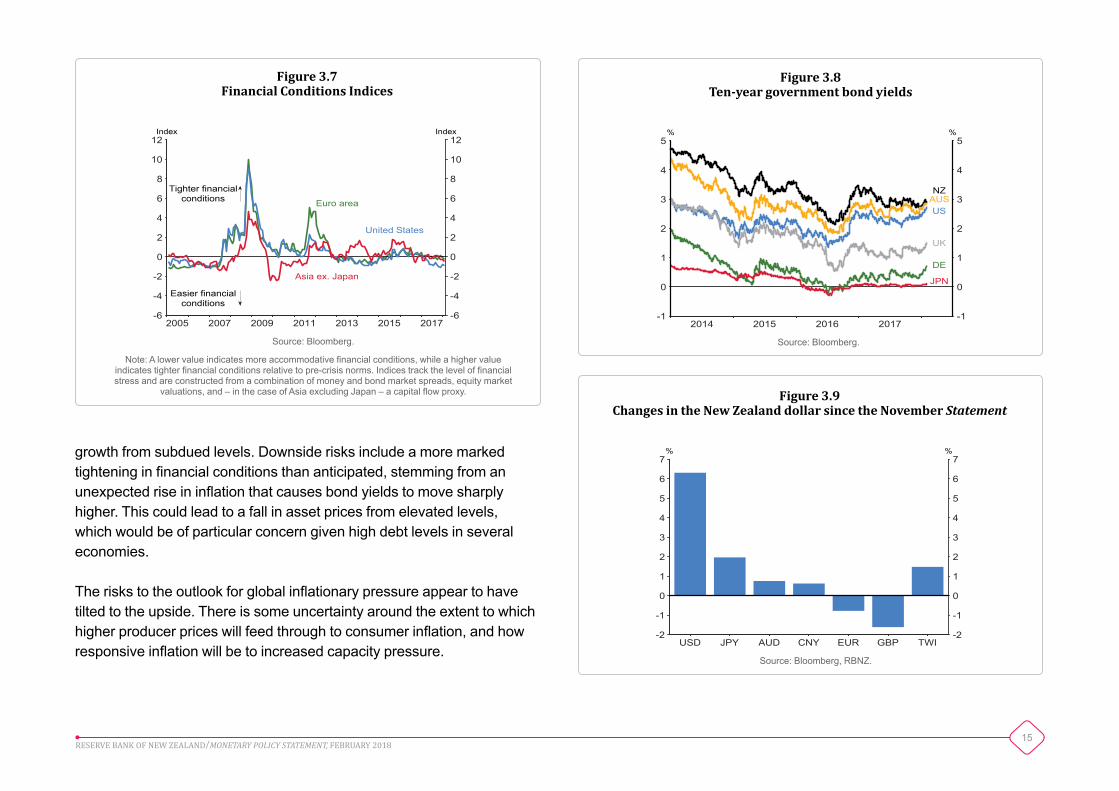
To date, financial markets have adjusted smoothly to the gradual removal of policy accommodation. The US dollar has weakened and financial conditions in the United States have eased more broadly, despite the Federal Reserve having removed policy accommodation. Financial conditions globally remain highly accommodative (figure 3.7); equity prices have increased further, volatility is subdued, credit spreads are narrow, and emerging markets have benefited from sustained equity and bond market inflows. Long-term yields remain historically low, despite having increased since the November Statement (figure 3.8). Easy financial conditions have been supported by increased risk tolerance among investors.
The New Zealand dollar TWI has appreciated since the November Statement, partly reversing the decline that followed the General Election (figure 3.9). The appreciation has been driven by a weaker US dollar. This is despite a further narrowing in interest rate differentials and a decline in New Zealand’s export prices.
The risks to the global growth outlook appear balanced over the medium term. Upside risks include a strengthening in investment and productivity
2000 2003 2006 2009 2012 2015 0.0
0.5
1.0
1.5
2.0
2.5
3.0
3.5
4.0
3.0
4.0
5.0
6.0
7.0
8.0
9.0% %
Unemployment rate
Labour compensation per employee (RHS)
Figure 3.6OECD unemployment rate and annual earnings growth
Source: OECD.
15RESERVE BANK OF NEW ZEALAND/MONETARY POLICY STATEMENT, FEBRUARY 2018
growth from subdued levels. Downside risks include a more marked tightening in financial conditions than anticipated, stemming from an unexpected rise in inflation that causes bond yields to move sharply higher. This could lead to a fall in asset prices from elevated levels, which would be of particular concern given high debt levels in several economies.
The risks to the outlook for global inflationary pressure appear to have tilted to the upside. There is some uncertainty around the extent to which higher producer prices will feed through to consumer inflation, and how responsive inflation will be to increased capacity pressure.
2005 2007 2009 2011 2013 2015 2017-6
-4
-2
0
2
4
6
8
10
12
-6
-4
-2
0
2
4
6
8
10
12Index Index
Euro area
United States
Asia ex. Japan
Tighter financialconditions
Easier financialconditions
Figure 3.7Financial Conditions Indices
Source: Bloomberg.
Note: A lower value indicates more accommodative financial conditions, while a higher value indicates tighter financial conditions relative to pre-crisis norms. Indices track the level of financial stress and are constructed from a combination of money and bond market spreads, equity market
valuations, and – in the case of Asia excluding Japan – a capital flow proxy.
2014 2015 2016 2017-1
0
1
2
3
4
5
-1
0
1
2
3
4
5% %
US
UK
DE
JPN
NZAUS
Figure 3.8Ten-year government bond yields
Source: Bloomberg.
USD JPY AUD CNY EUR GBP TWI-2
-1
0
1
2
3
4
5
6
7
-2
-1
0
1
2
3
4
5
6
7% %
Figure 3.9Changes in the New Zealand dollar since the November Statement
Source: Bloomberg, RBNZ.
16RESERVE BANK OF NEW ZEALAND/MONETARY POLICY STATEMENT, FEBRUARY 2018
Box B
Global monetary policy developments
Following the global financial crisis (GFC), an extraordinary amount of monetary policy stimulus has been needed globally to support economic activity and increase inflation. Policy rates of major central banks have been low for an extended period, in some cases constrained at the effective lower bound (figure B.1). Unconventional monetary policy has been used to provide additional stimulus. This unconventional monetary policy took the form of asset purchases – central bank purchases of government bonds and, in some cases, corporate bonds and equity market securities – resulting in an increase in the size of the balance sheets of major central banks (figure B.2).
With a strengthening global economy and spare capacity being absorbed, several central banks have begun normalising monetary policy settings by raising policy rates and slowing or reversing asset purchase programmes. Many uncertainties remain, including the persistence of weak inflationary pressure since the GFC, the relationship between labour market slack and inflation, the level of neutral interest rates, and the potency of borrowing cost increases in highly indebted economies. Policy normalisation is therefore expected to occur at a gradual pace.
UnitedStates
The Federal Reserve raised the federal funds target rate to 1.25-1.50 percent at its December policy meeting. It is expected to continue its gradual path of federal funds rate increases and gradual balance sheet reduction. Labour market conditions have continued to tighten, although
wage pressure remains modest to date. Core inflation has increased slightly as transitory factors waned.
Euroarea
The European Central Bank (ECB) reduced asset purchases in January 2018, from EUR 60 billion per month to EUR 30 billion per month. Purchases are due to end in September 2018, but the ECB notes that this could be extended, depending on economic conditions. Annual core inflation remains subdued at around 1 percent, and inflationary pressure is expected to increase only gradually.
UnitedKingdom
The Bank of England (BoE) raised Bank Rate from 0.25 percent to 0.5 percent in November 2017, and signalled that further rate increases are expected to occur at a gradual pace. The BoE is maintaining its current asset purchases at GBP 435 billion. Inflation is above target at 3 percent annually, in large part reflecting the depreciation of the pound sterling in the second half of 2016. However, the inflationary impulse of this depreciation may have peaked.
Japan
The Bank of Japan continues to target the 10-year government bond rate at around 0 percent and short-term interest rates at -0.1 percent. Growth is estimated to be above trend in Japan, with broad-based strength across consumption, business investment, and exports. However, inflation is still low, with annual core inflation (excluding food and energy) at 0.3 percent.
17RESERVE BANK OF NEW ZEALAND/MONETARY POLICY STATEMENT, FEBRUARY 2018
2007 2009 2011 2013 2015 2017-1
0
1
2
3
4
5
6
7
8
-1
0
1
2
3
4
5
6
7
8% %
United Kingdom
Euro area
United States
Australia
Japan
Figure B.1Central bank policy rates
Source: Bloomberg.
2007 2009 2011 2013 2015 20170
20
40
60
80
100
0
20
40
60
80
100% %
Federal ReserveBank of England
EuropeanCentral Bank
Bank ofJapan
Figure B.2Central bank balance sheets
(shareofGDP)
Source: Bloomberg, Haver Analytics, RBNZ estimates.
China
The People’s Bank of China (PBoC) maintains a “prudent and neutral” policy stance, with a focus on financial stability risks. Annual consumer price inflation remained slightly less than 2 percent during the second half of 2017, below the PBoC’s 3 percent target for the year. Core inflation has retained its upward trend, while producer price inflation is positive following several years of deflation.
Australia
The Reserve Bank of Australia has retained its neutral policy stance since mid-2016, with the cash rate at 1.5 percent. Inflation remains below target and wage growth is low. Employment growth has increased in recent months, but an elevated level of underemployment suggests that some labour market slack remains.
18RESERVE BANK OF NEW ZEALAND/MONETARY POLICY STATEMENT, FEBRUARY 2018
Chapter 4Current domestic conditions
Inflationarypressure
Headline inflation has been close to the middle of the target range since the start of 2017, supported by high food and fuel prices which lifted tradables inflation to around average levels. During this period, non-tradables inflation, core inflation, and wage inflation have all remained below average, partly due to the dampening effect of previous low inflation outturns.
Annual CPI inflation declined from 1.9 percent in the September 2017 quarter to 1.6 percent in the December quarter (figure 4.1). This was lower than forecast in the November Statement. The fall in headline inflation was largely due to lower tradables inflation.
Annual tradables inflation in the December 2017 quarter eased from 1.0 percent to 0.5 percent. The strength in the New Zealand dollar in the first half of 2017 appears to be continuing to dampen a range of tradable-goods prices. In contrast, prices of food and vehicle fuels – which are typically quite volatile – have been elevated since the beginning of 2017. The recent rise in crude oil prices should provide some support to tradables inflation in 2018.
• Annual CPI inflation fell in the December 2017 quarter, due to a fall in tradables inflation. Non-tradables inflation remains below average, consistent with low underlying inflationary pressure.
• Export prices weakened in the second half of 2017.
• The housing market remains subdued, despite some increase in house price inflation since August.
• Annual GDP growth slowed through 2017 as a result of weaker consumption and residential investment growth.
• The level of GDP was revised significantly higher for the past three years, but this has not materially changed the Bank’s estimate of current capacity pressure. General capacity pressure has tightened gradually over the past five years.
19RESERVE BANK OF NEW ZEALAND/MONETARY POLICY STATEMENT, FEBRUARY 2018
2002 2005 2008 2011 2014 2017-4
-2
0
2
4
6
8
-4
-2
0
2
4
6
8% %
Non-tradables
Tradables
Headline
Figure 4.1CPI inflation(annual)
Source: Stats NZ.
2010 2012 2014 2016 20180
1
2
3
4
5
6
0
1
2
3
4
5
6% %
Non-tradables
CPI
Figure 4.3CPI and non-tradables inflation
(annual)
Source: Stats NZ, RBNZ estimates.
Note: Dashed lines are forecasts of CPI and non-tradables inflation excluding the effect of the fees-free tertiary education programme.
2001 2004 2007 2010 2013 2016 -1
0
1
2
3
4
5
-1
0
1
2
3
4
5% %
Construction cost
Housing excludingconstruction
Othernon-tradables
Figure 4.2Contribution to non-tradables inflation
(annual,excludingGST)
Source: Stats NZ, RBNZ estimates.
Annual non-tradables inflation was 2.5 percent in the December 2017 quarter, and remains below average. Housing-related components have continued to support non-tradables inflation (figure 4.2). Construction costs (excluding land) increased by 5.3 percent in the year to the December 2017 quarter. Other components of non-tradables inflation have been persistently weak in recent years, partly due to smaller-than-usual increases in government charges. Non-tradables inflation is expected to remain subdued in 2018, reflecting the one-off effect of removing fees for the first year of tertiary education, which is expected to reduce headline inflation by 0.2 percentage points (figure 4.3).
20RESERVE BANK OF NEW ZEALAND/MONETARY POLICY STATEMENT, FEBRUARY 2018
2000 2003 2006 2009 2012 2015 0
1
2
3
4
5
0
1
2
3
4
5% %
1-year
10-year
2-year
Figure 4.5Inflation expectations
(annual)
Source: RBNZ estimates.
Note: Inflation expectations measures are estimates drawn at each time horizon from the RBNZ inflation expectations curve, based on surveys of businesses and professional
forecasters at different horizons.
Stats NZ updates the weights for individual goods and services in the CPI every three years, to reflect changes in household expenditure. New weights were incorporated in the December 2017 quarter, and had some dampening effect on measured inflation.
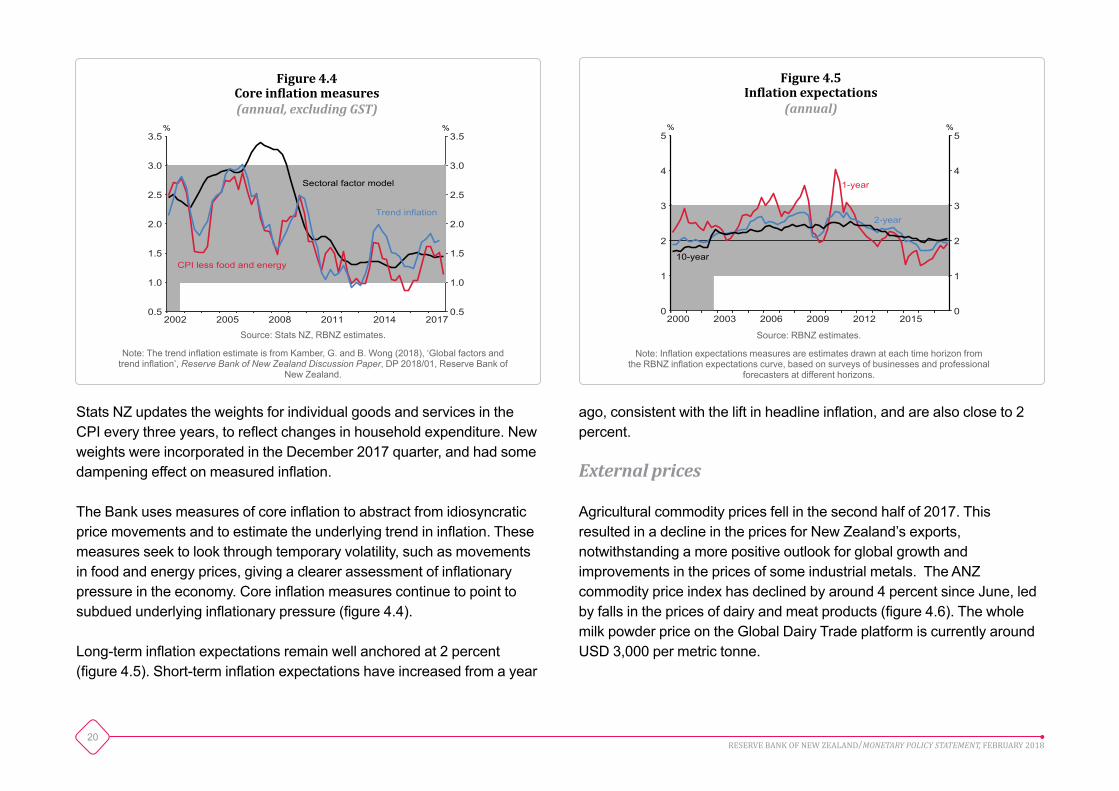
The Bank uses measures of core inflation to abstract from idiosyncratic price movements and to estimate the underlying trend in inflation. These measures seek to look through temporary volatility, such as movements in food and energy prices, giving a clearer assessment of inflationary pressure in the economy. Core inflation measures continue to point to subdued underlying inflationary pressure (figure 4.4).
Long-term inflation expectations remain well anchored at 2 percent (figure 4.5). Short-term inflation expectations have increased from a year
2002 2005 2008 2011 2014 20170.5
1.0
1.5
2.0
2.5
3.0
3.5
0.5
1.0
1.5
2.0
2.5
3.0
3.5% %
Sectoral factor model
CPI less food and energy
Trend inflation
Figure 4.4Core inflation measures(annual,excludingGST)
Source: Stats NZ, RBNZ estimates.
Note: The trend inflation estimate is from Kamber, G. and B. Wong (2018), ‘Global factors and trend inflation’, Reserve Bank of New Zealand Discussion Paper, DP 2018/01, Reserve Bank of
New Zealand.
ago, consistent with the lift in headline inflation, and are also close to 2 percent.
Externalprices
Agricultural commodity prices fell in the second half of 2017. This resulted in a decline in the prices for New Zealand’s exports, notwithstanding a more positive outlook for global growth and improvements in the prices of some industrial metals. The ANZ commodity price index has declined by around 4 percent since June, led by falls in the prices of dairy and meat products (figure 4.6). The whole milk powder price on the Global Dairy Trade platform is currently around USD 3,000 per metric tonne.
21RESERVE BANK OF NEW ZEALAND/MONETARY POLICY STATEMENT, FEBRUARY 2018
2006 2008 2010 2012 2014 2016 160
180
200
220
240
260
280
300
320
340
20
40
60
80
100
120
140
160USD/barrel Index
Dubai crudeoil price
ANZ commodityprice index (RHS)
Figure 4.6ANZ commodity price index and Dubai crude oil price
Source: ANZ, Thomson Reuters.
2006 2008 2010 2012 2014 2016 50
55
60
65
70
75
80
85
50
55
60
65
70
75
80
85Index Index
Figure 4.8New Zealand dollar TWI
Source: RBNZ.
2006 2008 2010 2012 2014 2016 0.8
0.9
1.0
1.1
1.2
1.3
0.8
0.9
1.0
1.1
1.2
1.3Index Index
Figure 4.7Terms of trade
(s.a.)
Source: Stats NZ, RBNZ estimates.
Crude oil prices have increased by almost 50 percent since mid-2017, supported by both demand and supply factors. Currently, the Dubai crude oil price is around USD 67 per barrel. The recent increase in oil prices has contributed to a rise in the prices of domestic vehicle fuels, which has supported tradables inflation over the second half of 2017.
New Zealand’s terms of trade increased by 6.7 percent over the year to the September 2017 quarter, and remain near historic highs. However, the terms of trade are expected to decline somewhat over coming quarters due to the combination of recent falls in export prices and increases in oil prices (figure 4.7).
The New Zealand dollar TWI has appreciated slightly since the November Statement (figure 4.8). Despite recent increases, the TWI remains lower than the level observed in mid-2017 and is expected to support tradables inflation in 2018.
22RESERVE BANK OF NEW ZEALAND/MONETARY POLICY STATEMENT, FEBRUARY 2018
2010 2012 2014 2016 4
5
6
7
8
9
4
5
6
7
8
9% %
Floating
1-year2-year
5-year
Figure 4.10Mortgage interest rates
Source: interest.co.nz.
Note: For each term the rate shown is the average of the latest rate on offer from ANZ, ASB, BNZ, and Westpac.
Domesticfinancialconditions
Bank funding costs eased slightly in the second half of 2017 (figure 4.9). Consistent with the decline in funding costs and a fall in the two-year swap rate, the average two-year mortgage rate has declined by around 15 basis points since June 2017 (figure 4.10). In contrast, most other mortgage rates have remained relatively stable. Mortgage rates are higher than a year ago across all terms, but remain low relative to history.
Populationandthehousingmarket
Net permanent and long-term (PLT) working-age immigration remains high, and is contributing to above-average population growth. Annual net inflows have declined slightly since mid-2017, from 62,000 working-age people in June 2017 to 59,000 in November. Monthly departures have risen gradually over the past year.
Monthly arrivals to New Zealand have remained elevated. In November, monthly arrivals were around 9,200 working-age people (figure 4.11). The number of people arriving on student and resident visas has declined since the start of the year. In contrast, the number of people arriving on work visas and the number of returning New Zealand residents have remained high.
2012 2013 2014 2015 2016 20171.5
2.0
2.5
3.0
3.5
4.0
4.5
5.0
5.5
6.0
1.5
2.0
2.5
3.0
3.5
4.0
4.5
5.0
5.5
6.0% %
Estimated weighted-average cost of new fundingRetail and corporate depositsForeign short-term wholesaleForeign term wholesaleDomestic term wholesale90-day interest rateOCR
Figure 4.9Private banks’ marginal funding costs
Source: Bloomberg, RBNZ estimates.
Note: The shaded areas measure the contribution of each funding source to overall marginal funding costs.
23RESERVE BANK OF NEW ZEALAND/MONETARY POLICY STATEMENT, FEBRUARY 2018
2000 2003 2006 2009 2012 2015 -2
-1
0
1
2
3
4
5
6
3
4
5
6
7
8
9
10000s 000s
Arrivals
Departures Net(RHS)
Figure 4.11Overseas arrivals and departures
(monthly,s.a.)
Source: Stats NZ, RBNZ estimates.
Note: The data shown are for permanent and long-term working-age arrivals and departures.
2010 2012 2014 2016 -1
0
1
2
3
4% %
Annual (RHS)
Monthly (s.a.)
-5
0
5
10
15
20
Figure 4.12House price inflation
Source: REINZ, RBNZ estimates.
Note: House price inflation refers to the REINZ Sale Price to Appraisal Ratio (SPAR) index.
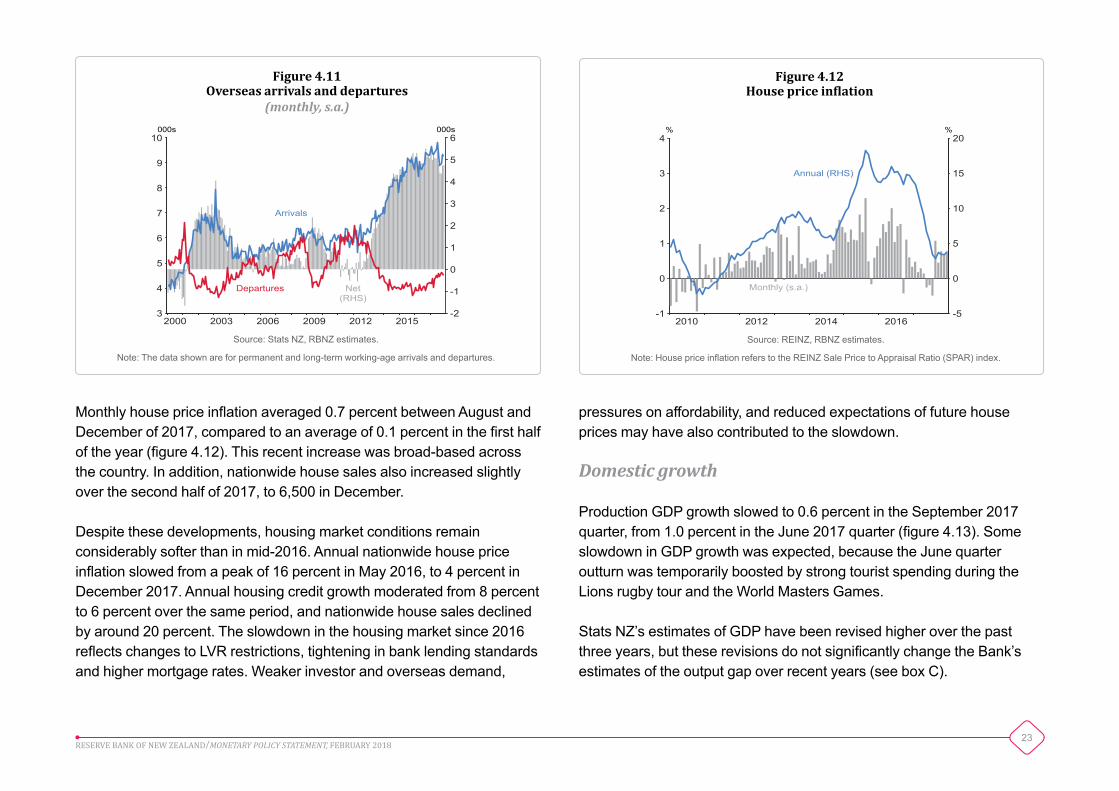
Monthly house price inflation averaged 0.7 percent between August and December of 2017, compared to an average of 0.1 percent in the first half of the year (figure 4.12). This recent increase was broad-based across the country. In addition, nationwide house sales also increased slightly over the second half of 2017, to 6,500 in December.
Despite these developments, housing market conditions remain considerably softer than in mid-2016. Annual nationwide house price inflation slowed from a peak of 16 percent in May 2016, to 4 percent in December 2017. Annual housing credit growth moderated from 8 percent to 6 percent over the same period, and nationwide house sales declined by around 20 percent. The slowdown in the housing market since 2016 reflects changes to LVR restrictions, tightening in bank lending standards and higher mortgage rates. Weaker investor and overseas demand,
pressures on affordability, and reduced expectations of future house prices may have also contributed to the slowdown.
Domesticgrowth
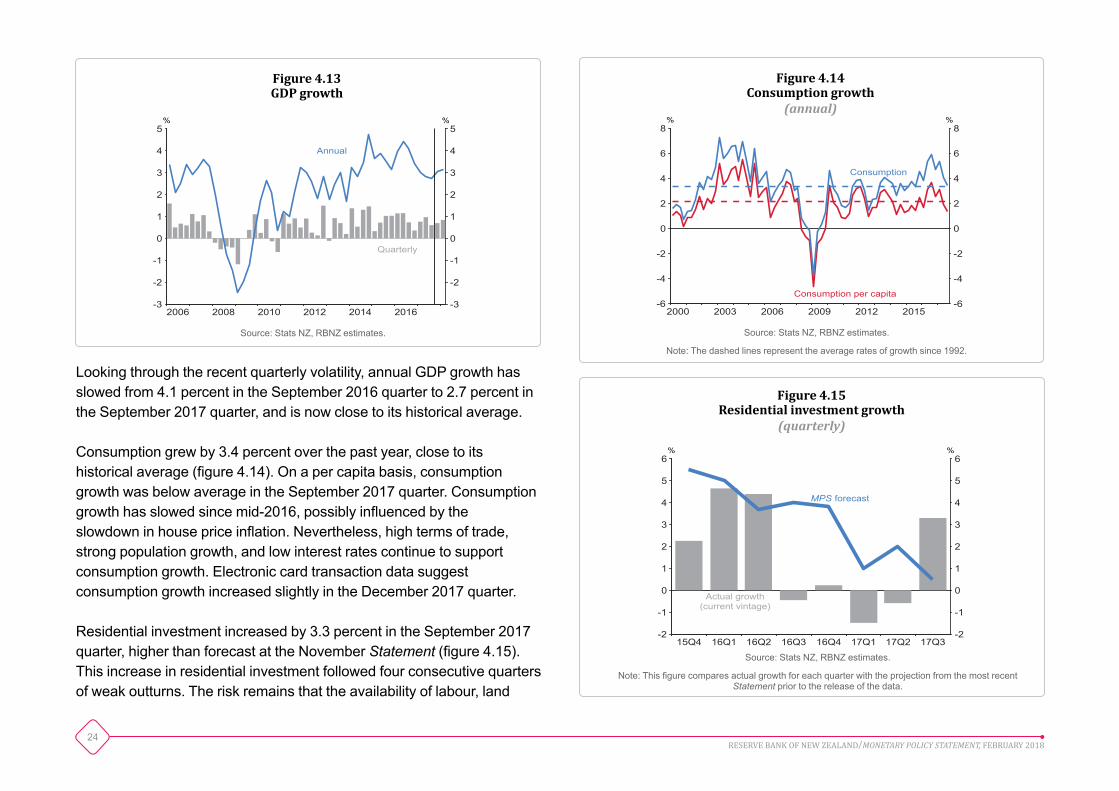
Production GDP growth slowed to 0.6 percent in the September 2017 quarter, from 1.0 percent in the June 2017 quarter (figure 4.13). Some slowdown in GDP growth was expected, because the June quarter outturn was temporarily boosted by strong tourist spending during the Lions rugby tour and the World Masters Games.
Stats NZ’s estimates of GDP have been revised higher over the past three years, but these revisions do not significantly change the Bank’s estimates of the output gap over recent years (see box C).
24RESERVE BANK OF NEW ZEALAND/MONETARY POLICY STATEMENT, FEBRUARY 2018
2000 2003 2006 2009 2012 2015 -6
-4
-2
0
2
4
6
8
-6
-4
-2
0
2
4
6
8% %
Consumption
Consumption per capita
Figure 4.14Consumption growth
(annual)
Source: Stats NZ, RBNZ estimates.
Note: The dashed lines represent the average rates of growth since 1992.
15Q4 16Q1 16Q2 16Q3 16Q4 17Q1 17Q2 17Q3-2
-1
0
1
2
3
4
5
6
-2
-1
0
1
2
3
4
5
6% %
MPS forecast
Actual growth(current vintage)
Figure 4.15Residential investment growth
(quarterly)
Source: Stats NZ, RBNZ estimates.
Note: This figure compares actual growth for each quarter with the projection from the most recent Statement prior to the release of the data.
Looking through the recent quarterly volatility, annual GDP growth has slowed from 4.1 percent in the September 2016 quarter to 2.7 percent in the September 2017 quarter, and is now close to its historical average.
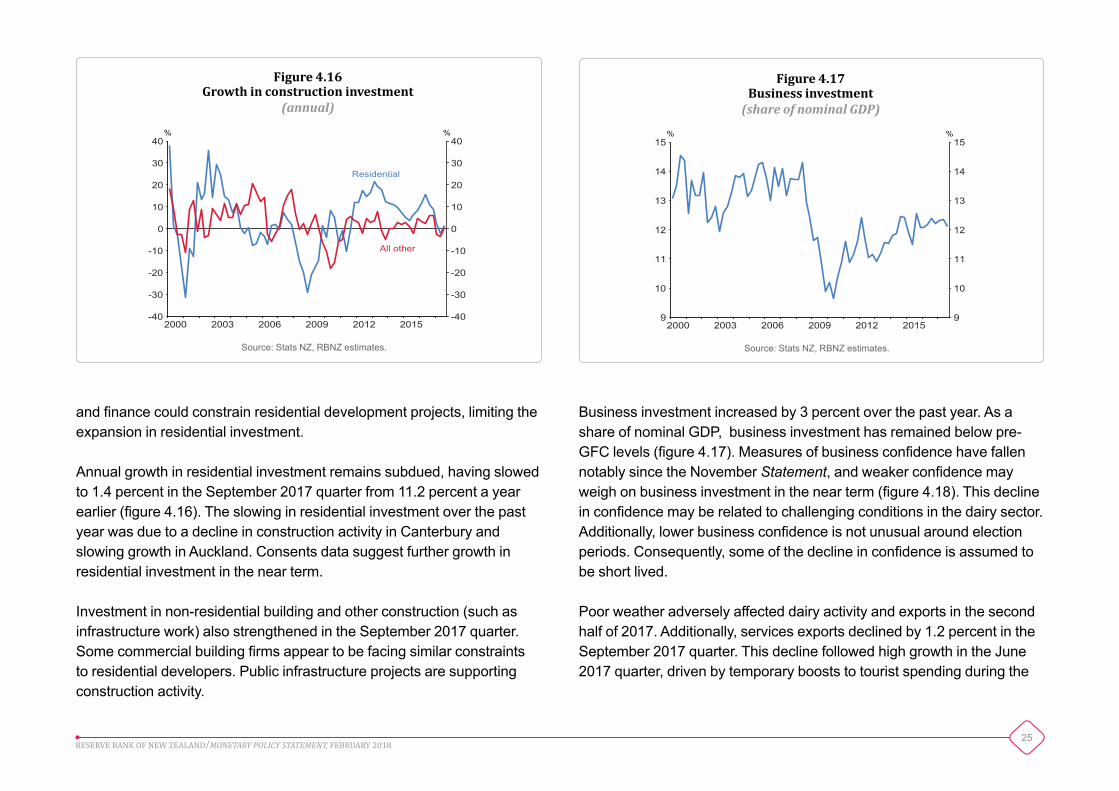
Consumption grew by 3.4 percent over the past year, close to its historical average (figure 4.14). On a per capita basis, consumption growth was below average in the September 2017 quarter. Consumption growth has slowed since mid-2016, possibly influenced by the slowdown in house price inflation. Nevertheless, high terms of trade, strong population growth, and low interest rates continue to support consumption growth. Electronic card transaction data suggest consumption growth increased slightly in the December 2017 quarter.
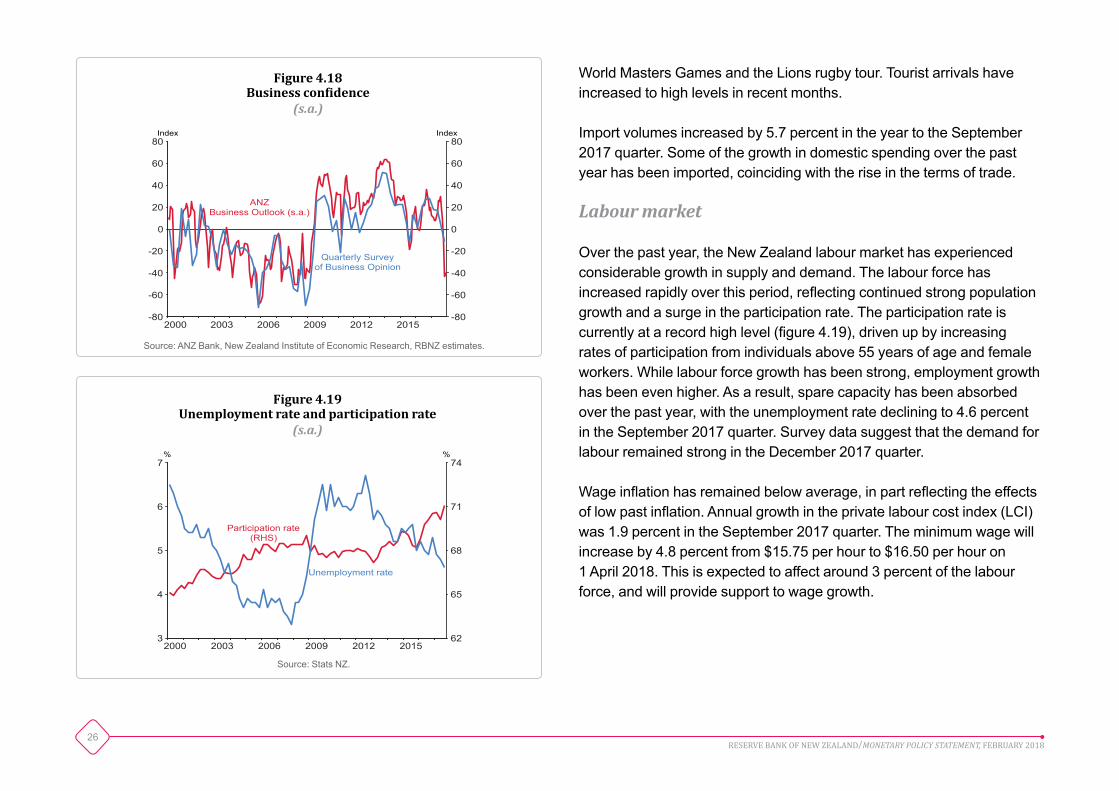
Residential investment increased by 3.3 percent in the September 2017 quarter, higher than forecast at the November Statement (figure 4.15). This increase in residential investment followed four consecutive quarters of weak outturns. The risk remains that the availability of labour, land
2006 2008 2010 2012 2014 2016 -3
-2
-1
0
1
2
3
4
5
-3
-2
-1
0
1
2
3
4
5% %
Annual
Quarterly
Figure 4.13GDP growth
Source: Stats NZ, RBNZ estimates.
25RESERVE BANK OF NEW ZEALAND/MONETARY POLICY STATEMENT, FEBRUARY 2018
2000 2003 2006 2009 2012 2015 -40
-30
-20
-10
0
10
20
30
40
-40
-30
-20
-10
0
10
20
30
40% %
Residential
All other
Figure 4.16Growth in construction investment
(annual)
Source: Stats NZ, RBNZ estimates.
2000 2003 2006 2009 2012 2015 9
10
11
12
13
14
15
9
10
11
12
13
14
15% %
Figure 4.17Business investment(shareofnominalGDP)
Source: Stats NZ, RBNZ estimates.
and finance could constrain residential development projects, limiting the expansion in residential investment.
Annual growth in residential investment remains subdued, having slowed to 1.4 percent in the September 2017 quarter from 11.2 percent a year earlier (figure 4.16). The slowing in residential investment over the past year was due to a decline in construction activity in Canterbury and slowing growth in Auckland. Consents data suggest further growth in residential investment in the near term.
Investment in non-residential building and other construction (such as infrastructure work) also strengthened in the September 2017 quarter. Some commercial building firms appear to be facing similar constraints to residential developers. Public infrastructure projects are supporting construction activity.
Business investment increased by 3 percent over the past year. As a share of nominal GDP, business investment has remained below pre-GFC levels (figure 4.17). Measures of business confidence have fallen notably since the November Statement, and weaker confidence may weigh on business investment in the near term (figure 4.18). This decline in confidence may be related to challenging conditions in the dairy sector. Additionally, lower business confidence is not unusual around election periods. Consequently, some of the decline in confidence is assumed to be short lived.
Poor weather adversely affected dairy activity and exports in the second half of 2017. Additionally, services exports declined by 1.2 percent in the September 2017 quarter. This decline followed high growth in the June 2017 quarter, driven by temporary boosts to tourist spending during the
26RESERVE BANK OF NEW ZEALAND/MONETARY POLICY STATEMENT, FEBRUARY 2018
World Masters Games and the Lions rugby tour. Tourist arrivals have increased to high levels in recent months.
Import volumes increased by 5.7 percent in the year to the September 2017 quarter. Some of the growth in domestic spending over the past year has been imported, coinciding with the rise in the terms of trade.
Labourmarket
Over the past year, the New Zealand labour market has experienced considerable growth in supply and demand. The labour force has increased rapidly over this period, reflecting continued strong population growth and a surge in the participation rate. The participation rate is currently at a record high level (figure 4.19), driven up by increasing rates of participation from individuals above 55 years of age and female workers. While labour force growth has been strong, employment growth has been even higher. As a result, spare capacity has been absorbed over the past year, with the unemployment rate declining to 4.6 percent in the September 2017 quarter. Survey data suggest that the demand for labour remained strong in the December 2017 quarter.
Wage inflation has remained below average, in part reflecting the effects of low past inflation. Annual growth in the private labour cost index (LCI) was 1.9 percent in the September 2017 quarter. The minimum wage will increase by 4.8 percent from $15.75 per hour to $16.50 per hour on 1 April 2018. This is expected to affect around 3 percent of the labour force, and will provide support to wage growth.
2000 2003 2006 2009 2012 2015 -80
-60
-40
-20
0
20
40
60
80
-80
-60
-40
-20
0
20
40
60
80Index Index
Quarterly Surveyof Business Opinion
ANZBusiness Outlook (s.a.)
Figure 4.18Business confidence
(s.a.)
Source: ANZ Bank, New Zealand Institute of Economic Research, RBNZ estimates.
2000 2003 2006 2009 2012 2015 62
65
68
71
74
3
4
5
6
7% %
Unemployment rate
Participation rate(RHS)
Figure 4.19Unemployment rate and participation rate
(s.a.)
Source: Stats NZ.
27RESERVE BANK OF NEW ZEALAND/MONETARY POLICY STATEMENT, FEBRUARY 2018
2010 2011 2012 2013 2014 2015 2016 20170
1
2
3
4
5
0
1
2
3
4
5% %
Revised
Previous
Figure C.1Production GDP growth
(annual)
Source: Stats NZ.
Box C
Revisions to GDP growth and capacity pressure
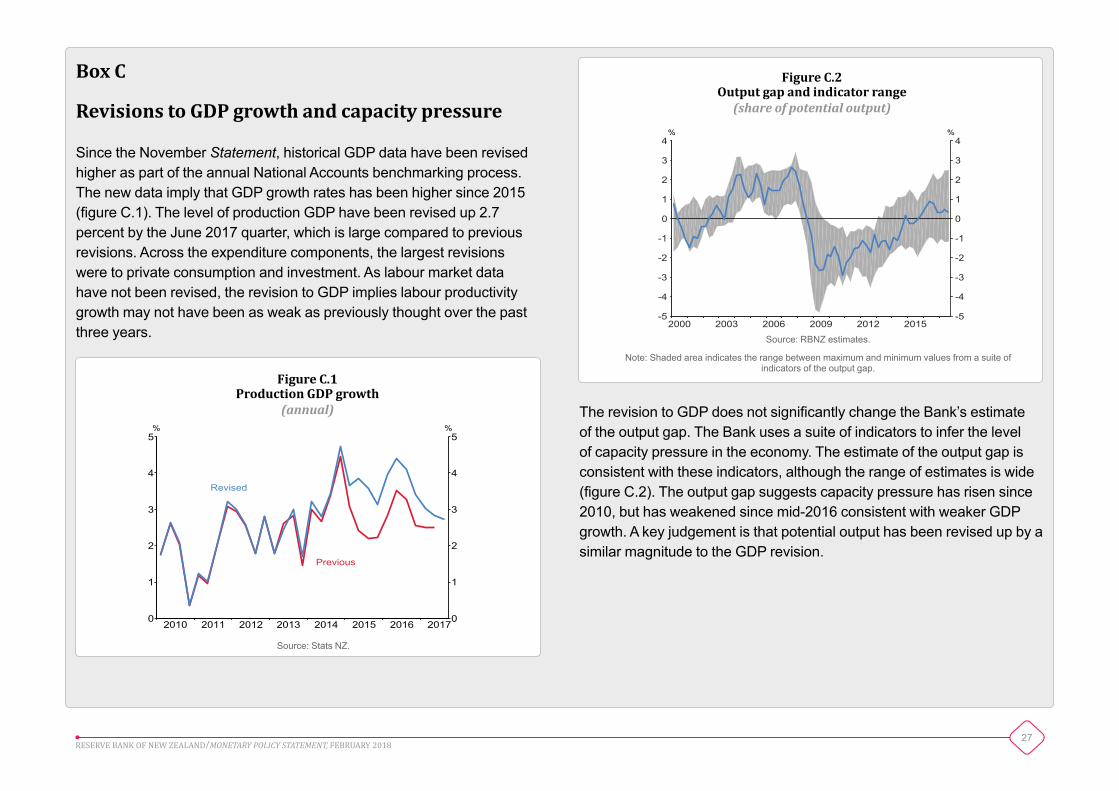
Since the November Statement, historical GDP data have been revised higher as part of the annual National Accounts benchmarking process. The new data imply that GDP growth rates has been higher since 2015 (figure C.1). The level of production GDP have been revised up 2.7 percent by the June 2017 quarter, which is large compared to previous revisions. Across the expenditure components, the largest revisions were to private consumption and investment. As labour market data have not been revised, the revision to GDP implies labour productivity growth may not have been as weak as previously thought over the past three years.
The revision to GDP does not significantly change the Bank’s estimate of the output gap. The Bank uses a suite of indicators to infer the level of capacity pressure in the economy. The estimate of the output gap is consistent with these indicators, although the range of estimates is wide (figure C.2). The output gap suggests capacity pressure has risen since 2010, but has weakened since mid-2016 consistent with weaker GDP growth. A key judgement is that potential output has been revised up by a similar magnitude to the GDP revision.
2000 2003 2006 2009 2012 2015 -5
-4
-3
-2
-1
0
1
2
3
4
-5
-4
-3
-2
-1
0
1
2
3
4% %
Figure C.2Output gap and indicator range(shareofpotentialoutput)
Source: RBNZ estimates.
Note: Shaded area indicates the range between maximum and minimum values from a suite of indicators of the output gap.
28RESERVE BANK OF NEW ZEALAND/MONETARY POLICY STATEMENT, FEBRUARY 2018
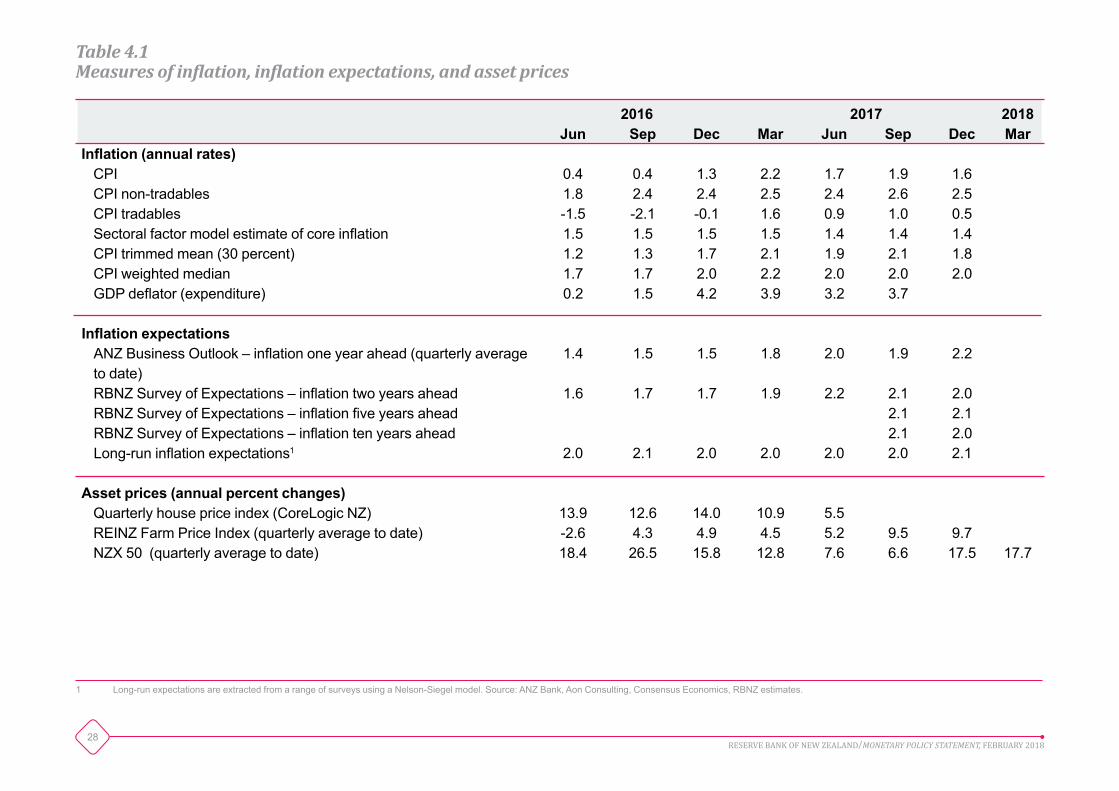
2016 2017 2018Jun Sep Dec Mar Jun Sep Dec Mar
Inflation (annual rates)CPI 0.4 0.4 1.3 2.2 1.7 1.9 1.6CPI non-tradables 1.8 2.4 2.4 2.5 2.4 2.6 2.5CPI tradables -1.5 -2.1 -0.1 1.6 0.9 1.0 0.5Sectoral factor model estimate of core inflation 1.5 1.5 1.5 1.5 1.4 1.4 1.4CPI trimmed mean (30 percent) 1.2 1.3 1.7 2.1 1.9 2.1 1.8CPI weighted median 1.7 1.7 2.0 2.2 2.0 2.0 2.0GDP deflator (expenditure) 0.2 1.5 4.2 3.9 3.2 3.7
Inflation expectationsANZ Business Outlook – inflation one year ahead (quarterly average to date)
1.4 1.5 1.5 1.8 2.0 1.9 2.2
RBNZ Survey of Expectations – inflation two years ahead 1.6 1.7 1.7 1.9 2.2 2.1 2.0RBNZ Survey of Expectations – inflation five years ahead 2.1 2.1RBNZ Survey of Expectations – inflation ten years ahead 2.1 2.0Long-run inflation expectations1 2.0 2.1 2.0 2.0 2.0 2.0 2.1
Asset prices (annual percent changes)Quarterly house price index (CoreLogic NZ) 13.9 12.6 14.0 10.9 5.5REINZ Farm Price Index (quarterly average to date) -2.6 4.3 4.9 4.5 5.2 9.5 9.7NZX 50 (quarterly average to date) 18.4 26.5 15.8 12.8 7.6 6.6 17.5 17.7
Table 4.1 Measuresofinflation,inflationexpectations,andassetprices
1 Long-run expectations are extracted from a range of surveys using a Nelson-Siegel model. Source: ANZ Bank, Aon Consulting, Consensus Economics, RBNZ estimates.
29RESERVE BANK OF NEW ZEALAND/MONETARY POLICY STATEMENT, FEBRUARY 2018
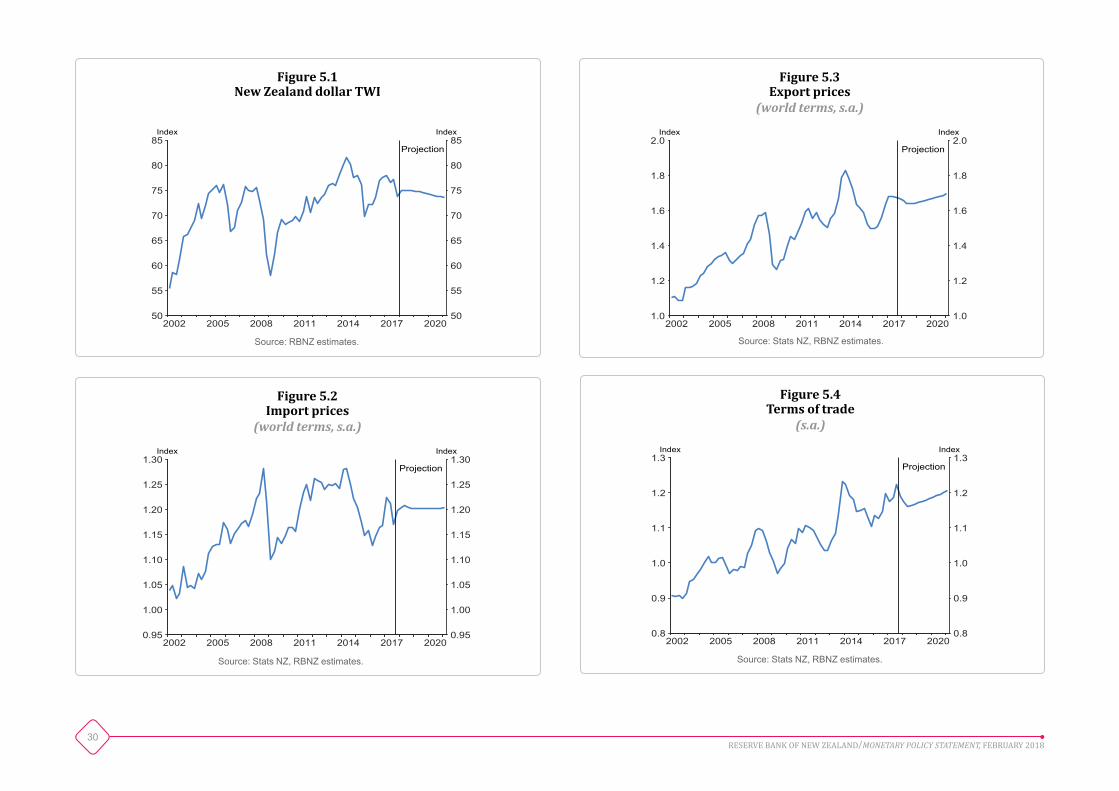
The New Zealand dollar TWI is assumed to be 2 percent higher in the near term than forecast in the November Statement. The TWI is projected to drift gradually lower over the projection, partly due to a rise in world interest rates relative to New Zealand (figure 5.1).
Import prices are assumed to increase in the near term and then remain stable (figure 5.2). Underlying this assumption, Dubai oil prices are assumed to decline towards USD 55 per barrel, while other import prices are assumed to increase gradually over the projection.
Export prices are expected to decline in the near term, partly reflecting lower dairy prices, before increasing over the medium term (figure 5.3). Whole milk powder prices are assumed to remain around USD 3,000 per metric tonne.
The terms of trade are expected to decline somewhat in the near term, mainly due to lower export prices (figure 5.4). The upward trend in the terms of trade is expected to resume over the remainder of the projection, as we assume the prices of imports, especially manufactured goods, remain weak relative to export prices.
• Annual tradables inflation is expected to be below average in the medium term. Global inflationary pressure increases only gradually over the projection, and the contribution of higher fuel and food prices to tradables inflation is short-lived.
• Population growth, elevated terms of trade, and fiscal policy are expected to support above-trend growth. Continued stimulatory monetary policy also contributes to strength in domestic demand.
• A rise in capacity pressure generates an increase in non-tradables inflation over the medium term, causing CPI inflation to settle near the target midpoint.
Chapter 5The macroeconomic outlook
30RESERVE BANK OF NEW ZEALAND/MONETARY POLICY STATEMENT, FEBRUARY 2018
2002 2005 2008 2011 2014 2017 20201.0
1.2
1.4
1.6
1.8
2.0
1.0
1.2
1.4
1.6
1.8
2.0Index Index
Projection
Figure 5.3 Export prices
(worldterms,s.a.)
Source: Stats NZ, RBNZ estimates.
2002 2005 2008 2011 2014 2017 20200.95
1.00
1.05
1.10
1.15
1.20
1.25
1.30
0.95
1.00
1.05
1.10
1.15
1.20
1.25
1.30Index Index
Projection
Figure 5.2 Import prices
(worldterms,s.a.)
Source: Stats NZ, RBNZ estimates.
2002 2005 2008 2011 2014 2017 202050
55
60
65
70
75
80
85
50
55
60
65
70
75
80
85Index Index
Projection
Figure 5.1 New Zealand dollar TWI
Source: RBNZ estimates.
2002 2005 2008 2011 2014 2017 20200.8
0.9
1.0
1.1
1.2
1.3
0.8
0.9
1.0
1.1
1.2
1.3Index Index
Projection
Figure 5.4 Terms of trade
(s.a.)
Source: Stats NZ, RBNZ estimates.
31RESERVE BANK OF NEW ZEALAND/MONETARY POLICY STATEMENT, FEBRUARY 2018
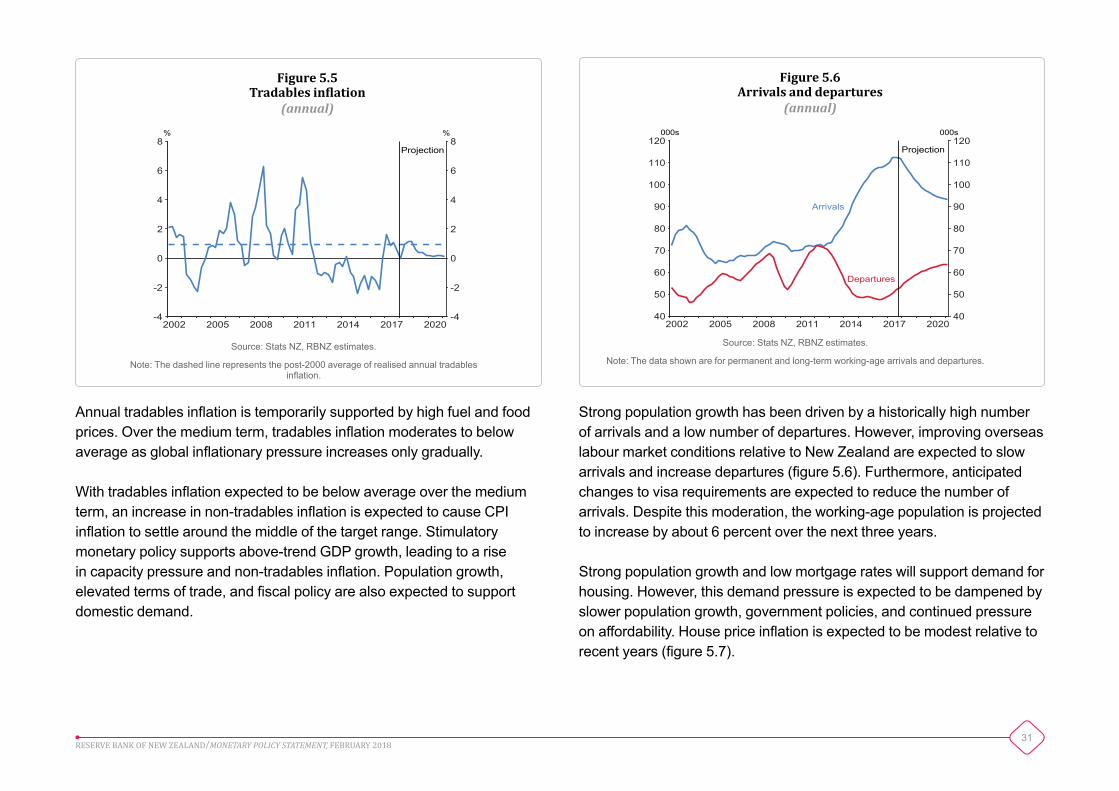
Annual tradables inflation is temporarily supported by high fuel and food prices. Over the medium term, tradables inflation moderates to below average as global inflationary pressure increases only gradually.
With tradables inflation expected to be below average over the medium term, an increase in non-tradables inflation is expected to cause CPI inflation to settle around the middle of the target range. Stimulatory monetary policy supports above-trend GDP growth, leading to a rise in capacity pressure and non-tradables inflation. Population growth, elevated terms of trade, and fiscal policy are also expected to support domestic demand.
Strong population growth has been driven by a historically high number of arrivals and a low number of departures. However, improving overseas labour market conditions relative to New Zealand are expected to slow arrivals and increase departures (figure 5.6). Furthermore, anticipated changes to visa requirements are expected to reduce the number of arrivals. Despite this moderation, the working-age population is projected to increase by about 6 percent over the next three years.
Strong population growth and low mortgage rates will support demand for housing. However, this demand pressure is expected to be dampened by slower population growth, government policies, and continued pressure on affordability. House price inflation is expected to be modest relative to recent years (figure 5.7).
2002 2005 2008 2011 2014 2017 202040
50
60
70
80
90
100
110
120
40
50
60
70
80
90
100
110
120000s 000s
Projection
Arrivals
Departures
Figure 5.6 Arrivals and departures
(annual)
Source: Stats NZ, RBNZ estimates.
Note: The data shown are for permanent and long-term working-age arrivals and departures.
2002 2005 2008 2011 2014 2017 2020-4
-2
0
2
4
6
8
-4
-2
0
2
4
6
8% %
Projection
Figure 5.5 Tradables inflation
(annual)
Source: Stats NZ, RBNZ estimates.
Note: The dashed line represents the post-2000 average of realised annual tradables inflation.

32RESERVE BANK OF NEW ZEALAND/MONETARY POLICY STATEMENT, FEBRUARY 2018
Despite strong underlying drivers, residential investment is assumed to increase more slowly than in previous years (figure 5.8). Capacity constraints are expected to limit residential investment growth over the next year. These constraints include labour shortages, difficulties in obtaining finance, and a lack of land with infrastructure in place. KiwiBuild is assumed to boost residential investment from mid-2019, consistent with HYEFU 2017.
Consumption growth is expected to be supported by stimulatory monetary policy, population growth, and elevated terms of trade. Expansionary fiscal policy, in the form of government transfers and allowances, provides an additional impetus to consumption. However, consumption growth is expected to slow over the medium term, reflecting an assumed slowing in population growth and modest house price inflation (figure 5.9).
2002 2005 2008 2011 2014 2017 2020-10
-5
0
5
10
15
20
25
-10
-5
0
5
10
15
20
25% %
Projection
AnnualQuarterly
Figure 5.7 House price inflation
Source: CoreLogic NZ, RBNZ estimates.
2002 2005 2008 2011 2014 2017 20204.0
4.5
5.0
5.5
6.0
6.5
7.0
7.5
8.0
4.0
4.5
5.0
5.5
6.0
6.5
7.0
7.5
8.0% %
Projection
Figure 5.8 Residential investment
(shareofpotentialoutput)
Source: Stats NZ, RBNZ estimates.
2002 2005 2008 2011 2014 2017 2020-4
-2
0
2
4
6
8
-4
-2
0
2
4
6
8% %
Projection
Figure 5.9 Consumption growth
(annual)
Source: Stats NZ, RBNZ estimates.
33RESERVE BANK OF NEW ZEALAND/MONETARY POLICY STATEMENT, FEBRUARY 2018
2002 2005 2008 2011 2014 2017 2020-3
-2
-1
0
1
2
3
-3
-2
-1
0
1
2
3% %
Projection
Figure 5.12 Output gap
(shareofpotentialoutput)
Source: RBNZ estimates.
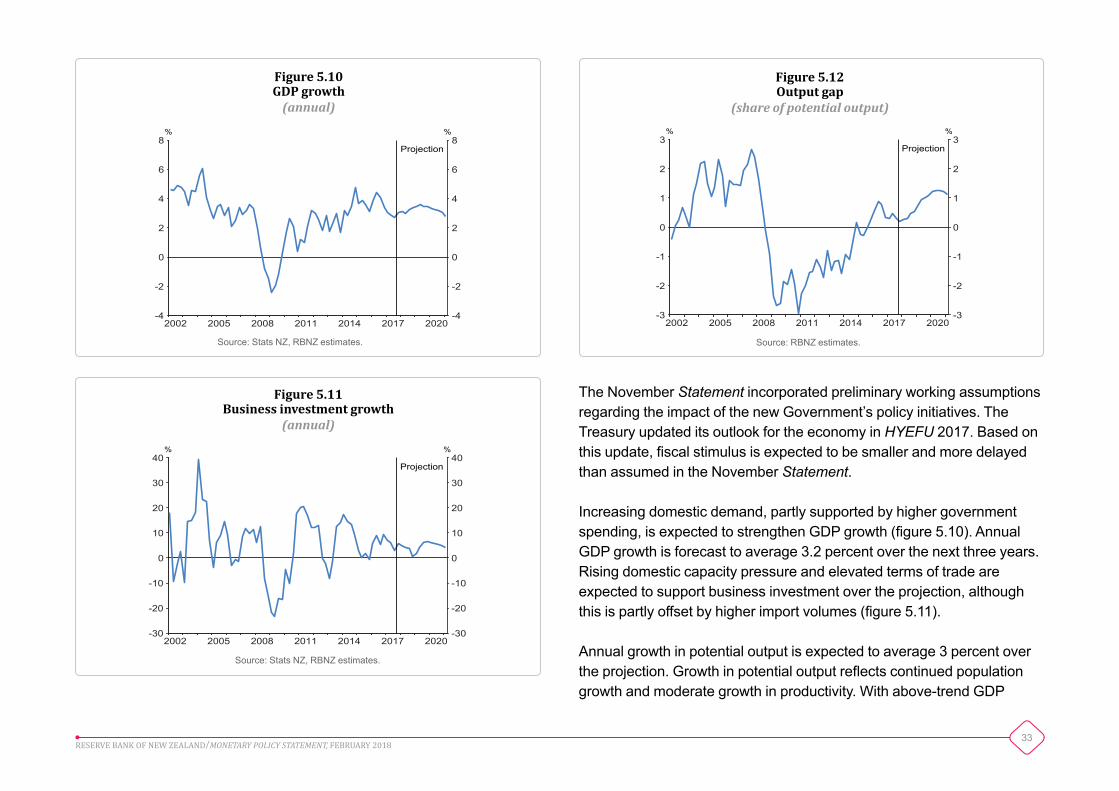
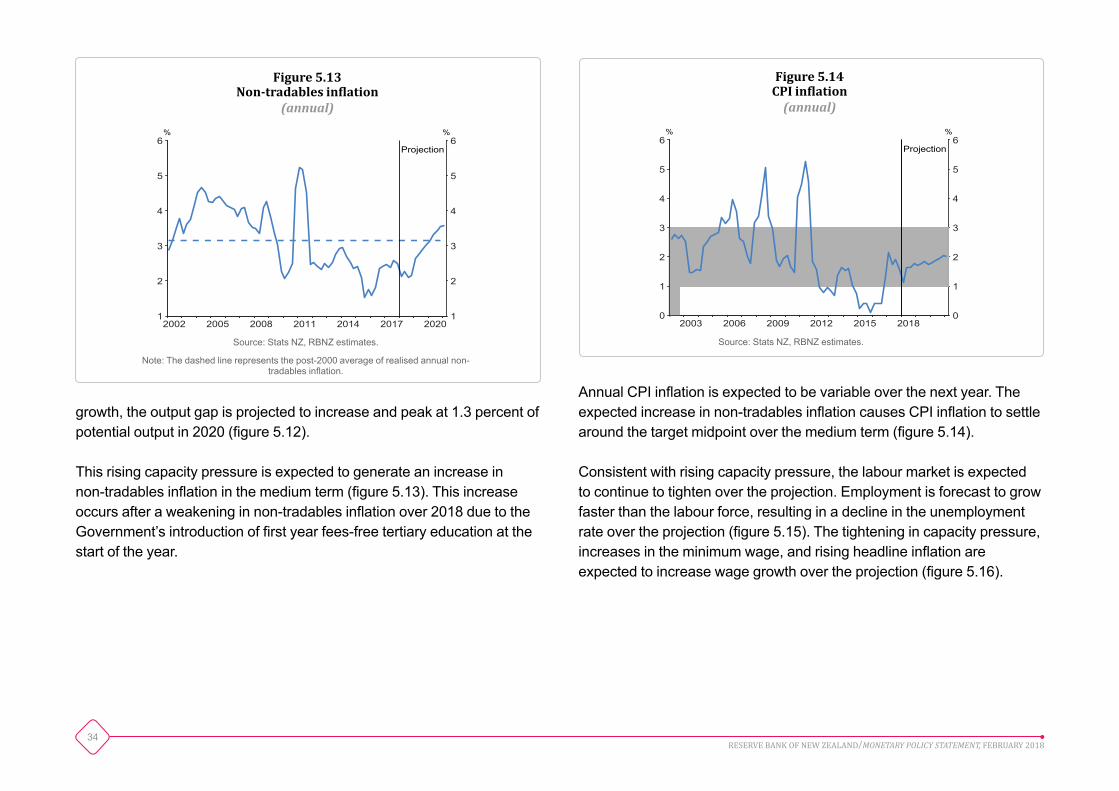
The November Statement incorporated preliminary working assumptions regarding the impact of the new Government’s policy initiatives. The Treasury updated its outlook for the economy in HYEFU 2017. Based on this update, fiscal stimulus is expected to be smaller and more delayed than assumed in the November Statement.
Increasing domestic demand, partly supported by higher government spending, is expected to strengthen GDP growth (figure 5.10). Annual GDP growth is forecast to average 3.2 percent over the next three years. Rising domestic capacity pressure and elevated terms of trade are expected to support business investment over the projection, although this is partly offset by higher import volumes (figure 5.11).
Annual growth in potential output is expected to average 3 percent over the projection. Growth in potential output reflects continued population growth and moderate growth in productivity. With above-trend GDP
2002 2005 2008 2011 2014 2017 2020-30
-20
-10
0
10
20
30
40
-30
-20
-10
0
10
20
30
40% %
Projection
Figure 5.11 Business investment growth
(annual)
Source: Stats NZ, RBNZ estimates.
2002 2005 2008 2011 2014 2017 2020-4
-2
0
2
4
6
8
-4
-2
0
2
4
6
8% %
Projection
Figure 5.10 GDP growth(annual)
Source: Stats NZ, RBNZ estimates.
34RESERVE BANK OF NEW ZEALAND/MONETARY POLICY STATEMENT, FEBRUARY 2018
2002 2005 2008 2011 2014 2017 20201
2
3
4
5
6
1
2
3
4
5
6% %
Projection
Figure 5.13 Non-tradables inflation
(annual)
Source: Stats NZ, RBNZ estimates.
Note: The dashed line represents the post-2000 average of realised annual non-tradables inflation.
2003 2006 2009 2012 2015 2018 0
1
2
3
4
5
6
0
1
2
3
4
5
6% %
Projection
Figure 5.14 CPI inflation (annual)
Source: Stats NZ, RBNZ estimates.
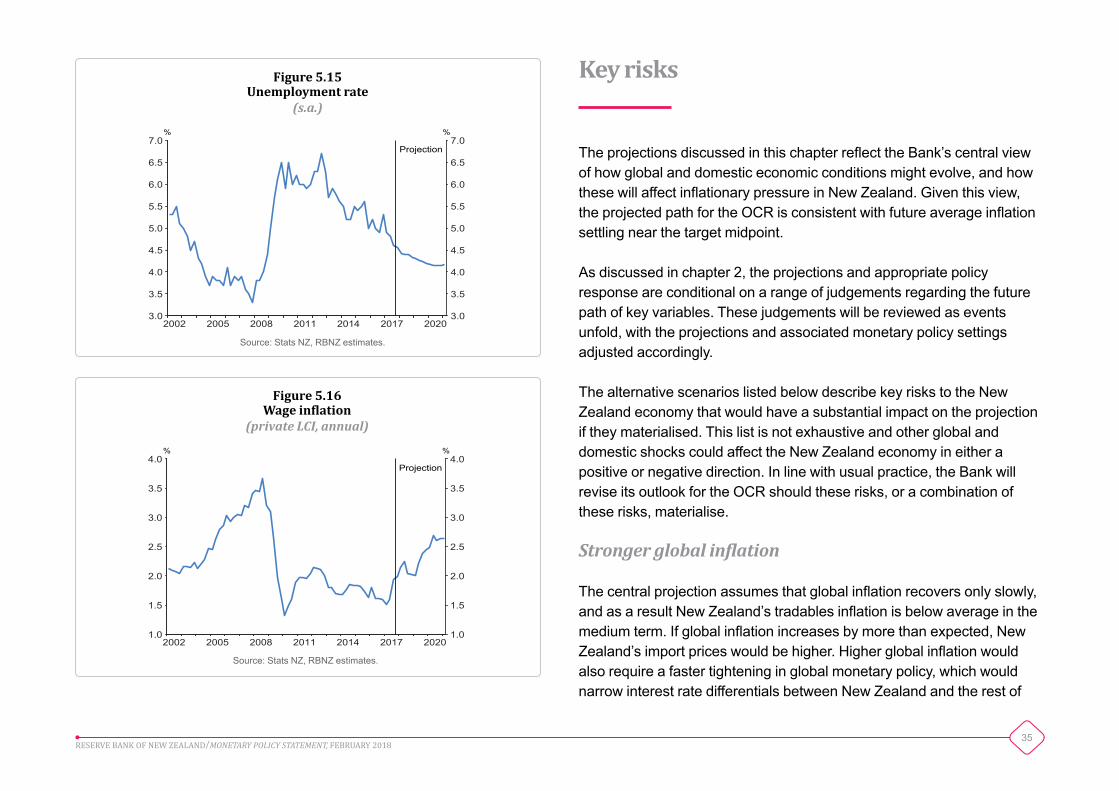
growth, the output gap is projected to increase and peak at 1.3 percent of potential output in 2020 (figure 5.12).
This rising capacity pressure is expected to generate an increase in non-tradables inflation in the medium term (figure 5.13). This increase occurs after a weakening in non-tradables inflation over 2018 due to the Government’s introduction of first year fees-free tertiary education at the start of the year.
Annual CPI inflation is expected to be variable over the next year. The expected increase in non-tradables inflation causes CPI inflation to settle around the target midpoint over the medium term (figure 5.14).
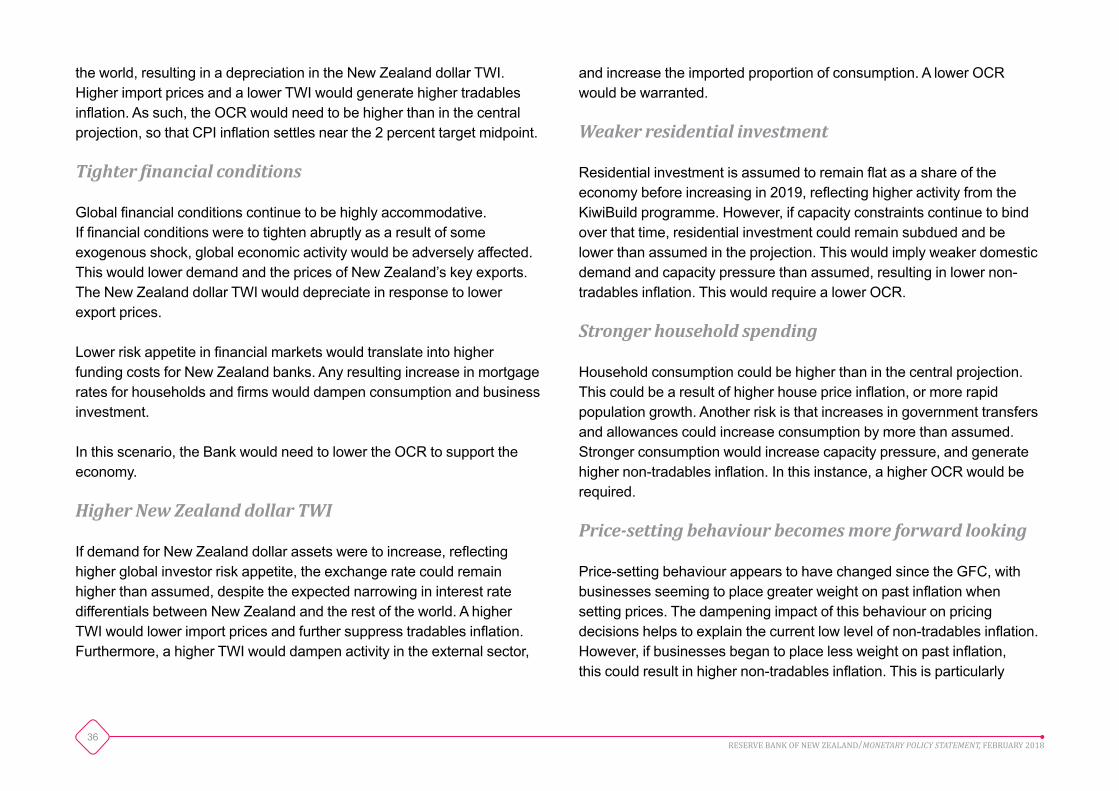
Consistent with rising capacity pressure, the labour market is expected to continue to tighten over the projection. Employment is forecast to grow faster than the labour force, resulting in a decline in the unemployment rate over the projection (figure 5.15). The tightening in capacity pressure, increases in the minimum wage, and rising headline inflation are expected to increase wage growth over the projection (figure 5.16).
35RESERVE BANK OF NEW ZEALAND/MONETARY POLICY STATEMENT, FEBRUARY 2018
2002 2005 2008 2011 2014 2017 20203.0
3.5
4.0
4.5
5.0
5.5
6.0
6.5
7.0
3.0
3.5
4.0
4.5
5.0
5.5
6.0
6.5
7.0% %
Projection
Figure 5.15 Unemployment rate
(s.a.)
Source: Stats NZ, RBNZ estimates.
2002 2005 2008 2011 2014 2017 20201.0
1.5
2.0
2.5
3.0
3.5
4.0
1.0
1.5
2.0
2.5
3.0
3.5
4.0% %
Projection
Figure 5.16 Wage inflation
(privateLCI,annual)
Source: Stats NZ, RBNZ estimates.
Key risks
The projections discussed in this chapter reflect the Bank’s central view of how global and domestic economic conditions might evolve, and how these will affect inflationary pressure in New Zealand. Given this view, the projected path for the OCR is consistent with future average inflation settling near the target midpoint.
As discussed in chapter 2, the projections and appropriate policy response are conditional on a range of judgements regarding the future path of key variables. These judgements will be reviewed as events unfold, with the projections and associated monetary policy settings adjusted accordingly.
The alternative scenarios listed below describe key risks to the New Zealand economy that would have a substantial impact on the projection if they materialised. This list is not exhaustive and other global and domestic shocks could affect the New Zealand economy in either a positive or negative direction. In line with usual practice, the Bank will revise its outlook for the OCR should these risks, or a combination of these risks, materialise.
Strongerglobalinflation
The central projection assumes that global inflation recovers only slowly, and as a result New Zealand’s tradables inflation is below average in the medium term. If global inflation increases by more than expected, New Zealand’s import prices would be higher. Higher global inflation would also require a faster tightening in global monetary policy, which would narrow interest rate differentials between New Zealand and the rest of
36RESERVE BANK OF NEW ZEALAND/MONETARY POLICY STATEMENT, FEBRUARY 2018
the world, resulting in a depreciation in the New Zealand dollar TWI. Higher import prices and a lower TWI would generate higher tradables inflation. As such, the OCR would need to be higher than in the central projection, so that CPI inflation settles near the 2 percent target midpoint.
Tighterfinancialconditions
Global financial conditions continue to be highly accommodative. If financial conditions were to tighten abruptly as a result of some exogenous shock, global economic activity would be adversely affected. This would lower demand and the prices of New Zealand’s key exports. The New Zealand dollar TWI would depreciate in response to lower export prices.
Lower risk appetite in financial markets would translate into higher funding costs for New Zealand banks. Any resulting increase in mortgage rates for households and firms would dampen consumption and business investment.
In this scenario, the Bank would need to lower the OCR to support the economy.
HigherNewZealanddollarTWI
If demand for New Zealand dollar assets were to increase, reflecting higher global investor risk appetite, the exchange rate could remain higher than assumed, despite the expected narrowing in interest rate differentials between New Zealand and the rest of the world. A higher TWI would lower import prices and further suppress tradables inflation. Furthermore, a higher TWI would dampen activity in the external sector,
and increase the imported proportion of consumption. A lower OCR would be warranted.
Weakerresidentialinvestment
Residential investment is assumed to remain flat as a share of the economy before increasing in 2019, reflecting higher activity from the KiwiBuild programme. However, if capacity constraints continue to bind over that time, residential investment could remain subdued and be lower than assumed in the projection. This would imply weaker domestic demand and capacity pressure than assumed, resulting in lower non-tradables inflation. This would require a lower OCR.
Strongerhouseholdspending
Household consumption could be higher than in the central projection. This could be a result of higher house price inflation, or more rapid population growth. Another risk is that increases in government transfers and allowances could increase consumption by more than assumed. Stronger consumption would increase capacity pressure, and generate higher non-tradables inflation. In this instance, a higher OCR would be required.
Price-settingbehaviourbecomesmoreforwardlooking
Price-setting behaviour appears to have changed since the GFC, with businesses seeming to place greater weight on past inflation when setting prices. The dampening impact of this behaviour on pricing decisions helps to explain the current low level of non-tradables inflation. However, if businesses began to place less weight on past inflation, this could result in higher non-tradables inflation. This is particularly
37RESERVE BANK OF NEW ZEALAND/MONETARY POLICY STATEMENT, FEBRUARY 2018
relevant in the current environment, with significant minimum wage increases expected over the projection. Higher expected wage growth could prompt businesses to become more forward looking in their price-setting behaviour. In this scenario, the resulting increase in non-tradables inflation would mean the OCR would need to be higher.
38RESERVE BANK OF NEW ZEALAND/MONETARY POLICY STATEMENT, FEBRUARY 2018
Actuals ProjectionsMarch year 2011 2012 2013 2014 2015 2016 2017 2018 2019 2020 2021
Final consumption expenditurePrivate 2.3 3.2 2.3 3.8 3.2 3.9 5.3 3.7 3.4 2.9 2.4Public authority 1.9 1.7 -0.2 2.1 3.2 2.5 2.0 5.0 2.7 1.4 0.4
Total 2.2 2.9 1.7 3.4 3.2 3.6 4.5 4.0 3.3 2.5 1.9
Gross fixed capital formationResidential 1.7 3.0 17.6 15.1 8.2 7.6 9.5 1.4 2.6 4.9 7.8Other 4.3 6.9 1.6 8.1 8.3 3.8 4.2 4.7 3.9 5.9 5.0
Total 3.7 6.0 5.0 9.8 8.2 4.7 5.5 3.8 3.6 5.7 5.7
Final domestic expenditure 2.5 3.5 2.4 4.7 4.3 3.8 4.8 3.9 3.4 3.3 2.9Stockbuilding1 0.7 0.3 -0.3 -0.2 0.5 -0.3 -0.1 -0.5 0.5 0.1 0.0Gross national expenditure 3.3 4.0 2.0 4.5 4.6 3.3 4.8 3.6 3.9 3.5 2.9
Exports of goods and services 2.8 2.2 3.1 -0.1 4.2 5.8 0.8 4.5 3.6 3.7 3.1Imports of goods and services 11.4 6.7 1.3 8.1 7.4 2.1 5.0 5.5 5.3 3.8 2.8
Expenditure on GDP 1.0 2.7 2.5 2.0 3.5 4.4 3.5 3.3 3.4 3.5 3.0
GDP (production) 1.6 2.3 2.2 2.6 3.7 3.6 3.7 2.9 3.3 3.5 3.1GDP (production, March qtr to March qtr) 1.2 3.0 1.8 3.2 3.7 4.0 3.0 3.1 3.5 3.4 2.8
Table 5.1 CompositionofrealGDPgrowth (annualaveragepercentchange,seasonallyadjusted,unlessspecifiedotherwise)
1 Percentage point contribution to the growth rate of GDP.
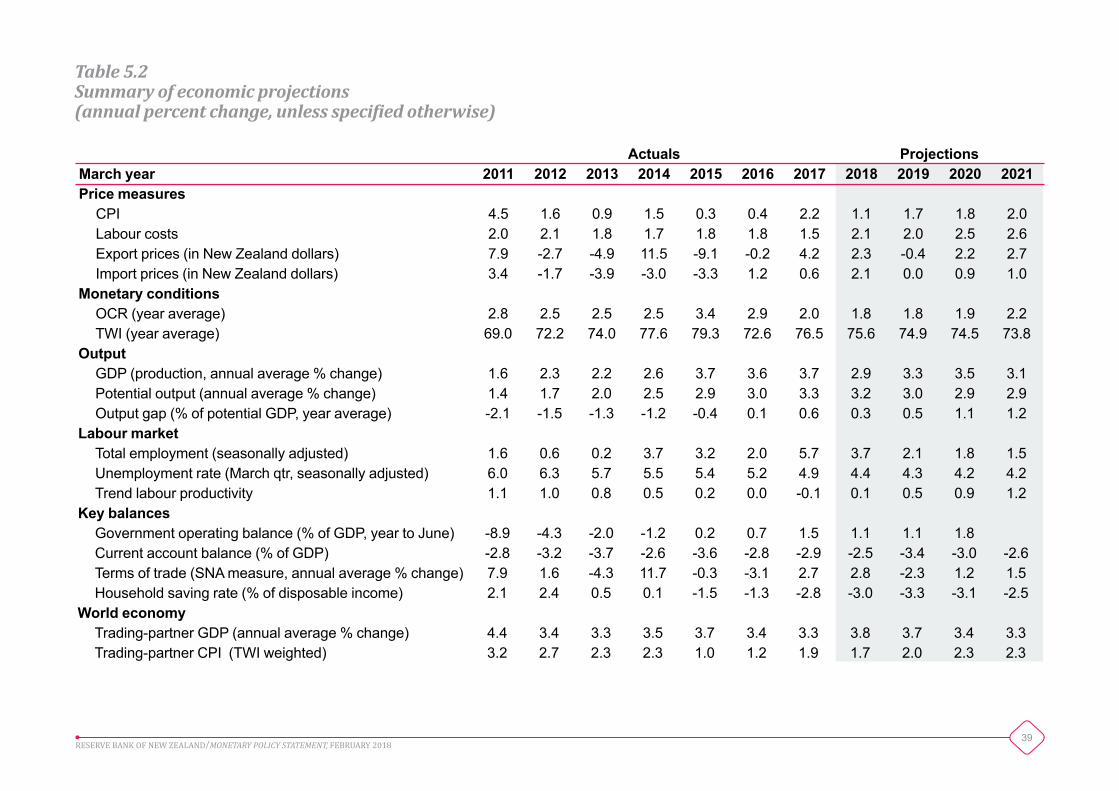
39RESERVE BANK OF NEW ZEALAND/MONETARY POLICY STATEMENT, FEBRUARY 2018
Actuals ProjectionsMarch year 2011 2012 2013 2014 2015 2016 2017 2018 2019 2020 2021Price measures
CPI 4.5 1.6 0.9 1.5 0.3 0.4 2.2 1.1 1.7 1.8 2.0Labour costs 2.0 2.1 1.8 1.7 1.8 1.8 1.5 2.1 2.0 2.5 2.6Export prices (in New Zealand dollars) 7.9 -2.7 -4.9 11.5 -9.1 -0.2 4.2 2.3 -0.4 2.2 2.7Import prices (in New Zealand dollars) 3.4 -1.7 -3.9 -3.0 -3.3 1.2 0.6 2.1 0.0 0.9 1.0
Monetary conditionsOCR (year average) 2.8 2.5 2.5 2.5 3.4 2.9 2.0 1.8 1.8 1.9 2.2TWI (year average) 69.0 72.2 74.0 77.6 79.3 72.6 76.5 75.6 74.9 74.5 73.8
OutputGDP (production, annual average % change) 1.6 2.3 2.2 2.6 3.7 3.6 3.7 2.9 3.3 3.5 3.1Potential output (annual average % change) 1.4 1.7 2.0 2.5 2.9 3.0 3.3 3.2 3.0 2.9 2.9Output gap (% of potential GDP, year average) -2.1 -1.5 -1.3 -1.2 -0.4 0.1 0.6 0.3 0.5 1.1 1.2
Labour marketTotal employment (seasonally adjusted) 1.6 0.6 0.2 3.7 3.2 2.0 5.7 3.7 2.1 1.8 1.5Unemployment rate (March qtr, seasonally adjusted) 6.0 6.3 5.7 5.5 5.4 5.2 4.9 4.4 4.3 4.2 4.2Trend labour productivity 1.1 1.0 0.8 0.5 0.2 0.0 -0.1 0.1 0.5 0.9 1.2
Key balancesGovernment operating balance (% of GDP, year to June) -8.9 -4.3 -2.0 -1.2 0.2 0.7 1.5 1.1 1.1 1.8Current account balance (% of GDP) -2.8 -3.2 -3.7 -2.6 -3.6 -2.8 -2.9 -2.5 -3.4 -3.0 -2.6Terms of trade (SNA measure, annual average % change) 7.9 1.6 -4.3 11.7 -0.3 -3.1 2.7 2.8 -2.3 1.2 1.5Household saving rate (% of disposable income) 2.1 2.4 0.5 0.1 -1.5 -1.3 -2.8 -3.0 -3.3 -3.1 -2.5
World economyTrading-partner GDP (annual average % change) 4.4 3.4 3.3 3.5 3.7 3.4 3.3 3.8 3.7 3.4 3.3Trading-partner CPI (TWI weighted) 3.2 2.7 2.3 2.3 1.0 1.2 1.9 1.7 2.0 2.3 2.3
Table 5.2 Summaryofeconomicprojections (annualpercentchange,unlessspecifiedotherwise)


