32 MONETARY POLICY & THE ECONOMY Q4/12 The Cross-Border Movement of Euro Banknotes and Austria’s TARGET2 Liabilities In the public and academic discussion on the payment system TARGET2, the high claims and liabilities of some euro area countries have mostly been associated with the financial crisis. The implicit assumption that TARGET2 balances would be close to zero without the financial crisis is both theoretically and empirically wrong, though. This study looks into the payment mechanisms that have caused the TARGET2 liabilities of the Oesterreichische Nationalbank (OeNB) to rise to a substantial level over the past ten years. The increase can be attributed to a structurally-induced inflow of banknotes to the OeNB, which is partly due to tourism but above all to the physical shipment of euro cash from countries outside monetary union into Austria. This central bank money, which comes to Austria as cash, leaves the country in cashless form, causing an equivalent increase in the OeNB’s TARGET2 liabilities. Structurally- induced in- and outflows of central bank money (in cashless form or as banknotes) can be observed in other euro area countries, too. Understanding these flows is essential for a correct interpretation of TARGET2 balances during and after the current crisis. JEL classification: E42, E52, E58, F32, F33 Keywords: Austria, EMU, TARGET2, currency abroad, banknote migration, balance of payments, payment system, financial crisis Clemens Jobst, Martin Handig, Doris Schneeberger 1 TARGET2 is the most important pay- ment system for euro-denominated large value transactions (Kokkola, 2010). It is operated jointly by the national cen- tral banks (NCBs) that form the Euro- system; cross-border payments between participants in the euro area are reflected in the balance sheets of the NCBs. At end-November 2012, the OeNB reported a EUR 39.2 billion TARGET2 liability in its balance sheet – this is the amount by which euro transfers from Austria via TARGET2 and its predecessor TARGET have exceeded such transfers into Austria since the inception of mon- etary union. The TARGET2 claims and liabili- ties of some euro area countries have increased sharply during the current financial and economic crisis, sparking a public debate in which some maintain that the high balances are problematic in themselves, while others interpret them as mere side effects of the banking and sovereign debt crisis and emphasize that they do not deserve special consid- eration. 2 What the two positions have in common is that they associate the high TARGET2 liabilities with the financial and economic crisis. The ECB itself writes in its 2011 Annual Report: “Before the financial and sovereign debt crisis, the NCBs’ TARGET2 claims and liabil- ities were relatively stable. This is because the cross-border payment flows tended to be broadly balanced across euro area countries.” (ECB, 2012a, p. 35). Even though the current size of claims and liabilities is without doubt connected to the crisis, the assertion that TARGET2 balances would be close to zero or at least stable without the crisis is both theoretically and empiri- cally wrong (Jobst, 2011; Jobst et al., Refereed by: Jens Ulbrich, Alexander Lipponer, Deutsche Bundesbank 1 Oesterreichische Nationalbank, Economic Analysis Division, clemens.jobst@oenb.at, Financial Statements and Treasury Risk Monitoring Division, martin.handig@oenb.at, and Cash and Payment Systems Management Division, doris.schneeberger@oenb.at. The authors thank René Dell’Mour, Alexander Lipponer, Maria Oberleithner, Markus Pammer, Silvia Schön, Helmut Stix and Jens Ulbrich for valuable suggestions and discussions. 2 The literature in this field has become very extensive. For the view that high TARGET2 balances pose a problem in themselves, see above all Sinn and Wollmershäuser (2012) and most contributions in ifo Schnelldienst (2011). For the argument that large TARGET2 balances are a side effect of the banking and sovereign debt crisis, see e.g. Allen and Moessner (2012), Bindseil and König (2012), Buiter et al. (2011), Cecchetti et al. (2012) and Ulbrich and Lipponer (2011). An econometric analysis that comes to the same conclusion can be found in Auer (2012).
Transcript
32 Monetary Policy & the econoMy Q4/12
the cross-Border Movement of euro Banknotes and austria’s tarGet2 liabilities
In the public and academic discussion on the payment system TARGET2, the high claims and liabilities of some euro area countries have mostly been associated with the financial crisis. The implicit assumption that TARGET2 balances would be close to zero without the financial crisis is both theoretically and empirically wrong, though. This study looks into the payment mechanisms that have caused the TARGET2 liabilities of the Oesterreichische Nationalbank (OeNB) to rise to a substantial level over the past ten years. The increase can be attributed to a structurally-induced inflow of banknotes to the OeNB, which is partly due to tourism but above all to the physical shipment of euro cash from countries outside monetary union into Austria. This central bank money, which comes to Austria as cash, leaves the country in cashless form, causing an equivalent increase in the OeNB’s TARGET2 liabilities. Structurally-induced in- and outflows of central bank money (in cashless form or as banknotes) can be observed in other euro area countries, too. Understanding these flows is essential for a correct interpretation of TARGET2 balances during and after the current crisis.
TARGET2 is the most important pay-ment system for euro-denominated large value transactions (Kokkola, 2010). It is operated jointly by the national cen-tral banks (NCBs) that form the Euro-system; cross-border payments between participants in the euro area are reflected in the balance sheets of the NCBs. At end-November 2012, the OeNB reported a EUR 39.2 billion TARGET2 liability in its balance sheet – this is the amount by which euro transfers from Austria via TARGET2 and its predecessor TARGET have exceeded such transfers into Austria since the inception of mon-etary union.
The TARGET2 claims and liabili-ties of some euro area countries have increased sharply during the current financial and economic crisis, sparking a public debate in which some maintain that the high balances are problematic
in themselves, while others interpret them as mere side effects of the banking and sovereign debt crisis and emphasize that they do not deserve special consid-eration.2 What the two positions have in common is that they associate the high TARGET2 liabilities with the financial and economic crisis. The ECB itself writes in its 2011 Annual Report: “Before the financial and sovereign debt crisis, the NCBs’ TARGET2 claims and liabil-ities were relatively stable. This is because the cross-border payment flows tended to be broadly balanced across euro area countries.” (ECB, 2012a, p. 35).
Even though the current size of claims and liabilities is without doubt connected to the crisis, the assertion that TARGET2 balances would be close to zero or at least stable without the crisis is both theoretically and empiri-cally wrong (Jobst, 2011; Jobst et al.,
Refereed by: Jens Ulbrich,
Alexander Lipponer, Deutsche Bundesbank
1 Oesterreichische Nationalbank, Economic Analysis Division, [email protected], Financial Statements and Treasury Risk Monitoring Division, [email protected], and Cash and Payment Systems Management Division, [email protected]. The authors thank René Dell’Mour, Alexander Lipponer, Maria Oberleithner, Markus Pammer, Silvia Schön, Helmut Stix and Jens Ulbrich for valuable suggestions and discussions.
2 The literature in this field has become very extensive. For the view that high TARGET2 balances pose a problem in themselves, see above all Sinn and Wollmershäuser (2012) and most contributions in ifo Schnelldienst (2011). For the argument that large TARGET2 balances are a side effect of the banking and sovereign debt crisis, see e.g. Allen and Moessner (2012), Bindseil and König (2012), Buiter et al. (2011), Cecchetti et al. (2012) and Ulbrich and Lipponer (2011). An econometric analysis that comes to the same conclusion can be found in Auer (2012).
the cross-Border Movement of euro Banknotes and austria’s tarGet2 liabilities
Monetary Policy & the econoMy Q4/12 33
2012; Boeckx and König, 2012).3 After all, the OeNB’s TARGET2 liabilities have not surged all of a sudden during the crisis but have grown slowly and continuously since the inception of monetary union.
This study examines the structural mechanisms of cross-border banknote flows and cashless payments that have caused the OeNB’s TARGET2 liabili-ties to increase to a substantial level over the past ten years. In order to understand TARGET2 balances we have to look at central bank money in both cash and cashless form, i.e. banknotes as well as balances held with an NCB which can be used in TARGET2 trans-actions. In fact, the increase in the OeNB’s TARGET2 liabilities has been accompanied by an accumulation of roughly equivalent claims in cash due to banknote inflows: At the end of November 2012, the OeNB disclosed claims of EUR 41.5 billion in its balance sheet related to the adjustment of banknotes in circulation, which means that, since the beginning of monetary union, most of the time more cash has been returned to the OeNB than the OeNB has put into circulation. This contribution shows that the OeNB’s TARGET2 balance can be largely explained by these struc-tural inflows, which, in turn, are asso-ciated with the large role tourism plays in the Austrian economy and, even more so, with the specific role of Austrian banks and the OeNB in the physical shipment of euro banknotes to and from countries outside the euro area.
This empirical result is not only relevant for an interpretation of Aus-
tria’s TARGET2 balance. It also shows that intra-Eurosystem claims and liabil-ities will not disappear after the end of the current crisis – for structural reasons positions can be expected to diverge ever more in the long run. At the same time, this result makes clear that restrictions on, or periodic settle-ment of, TARGET2 balances – as pro-posed e.g. by Sinn and Wollmershäuser (2012) – would not only be impractical but would also seriously impair the normal functioning of monetary union. Surprisingly, there are only few studies on the determinants of cash and cash-less payment flows in monetary union.4 A better understanding of these flows is indispensable if we wish to avoid the misinterpretation of claims and liabilities between the Eurosystem central banks.
1 Migration of Central Bank Money to and from Austria
TARGET2 transactions must be settled in central bank money. To initiate a payment, a commercial bank partici-pating in TARGET2 must have suffi-cient funds in its current account (or an adequately collateralized credit line) with its home central bank.
In case of a domestic TARGET2 transaction, the respective NCB simply debits the current account of the sending bank and credits the amount to the current account of the receiving bank. No cross-border claims or liabilities arise, as only one central bank is involved. In case of cross-border transactions, however, the ECB functions as the central counterparty.5 While the NCB that debited the current account of
3 See Haran and Bailey (2012) for some additional factors that may have an impact on TARGET2 balances but are unrelated to the crisis.
4 See Schautzer (2006), Schneeberger and Süß (2007) as well as Bartzsch et al. (2011a, 2011b) on banknote migration in monetary union.
5 This is a simplified description. In reality, all bilateral claims and liabilities are netted out and the resulting balance is transferred to or from the ECB at the end of each day. See Jobst et al. (2012) for a detailed description.
the cross-Border Movement of euro Banknotes and austria’s tarGet2 liabilities
34 Monetary Policy & the econoMy Q4/12
the sending bank now has a liability to the ECB, the NCB that credited the amount to the current account of the receiving bank now has a claim on the ECB.6 The sum total of all these bal-ances (net assets and liabilities) of the 18 Eurosystem central banks (including the ECB) is zero, as these balances sim-ply reflect the cross-border flows of available euro liquidity within a closed system. The existence of net balances between the NCBs and the ECB is a consequence of the decentralized nature of the organization of payments trans-fers in the euro area. If the euro area had only one central bank (as many other single currency regions do), all payment system participants would hold their accounts at this central bank, where all transactions would sum to zero.
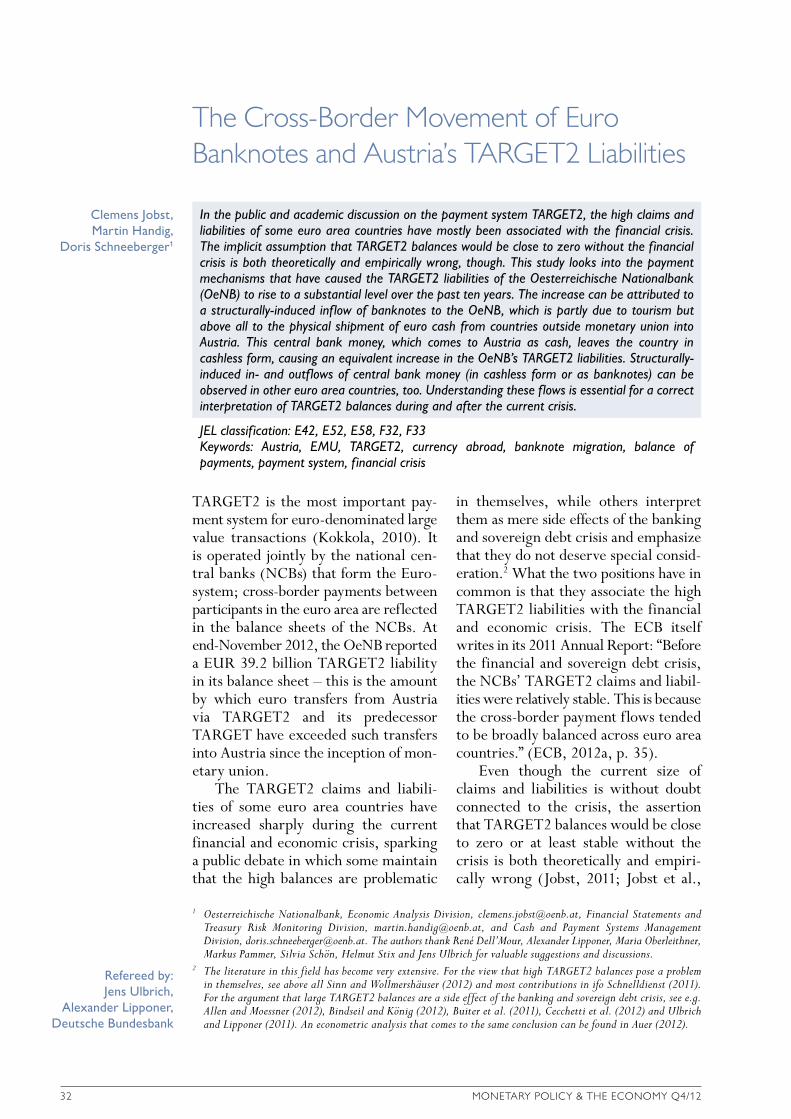
The value of payments settled every day in TARGET2 is substantial: Trans-actions involving Austrian participants alone have an average daily value of more than EUR 60 billion; the value of payments sent and received in the euro area as a whole is EUR 2,385 billion per day.7 This means that the average weekly value of TARGET2 transactions involving Austrian participants is roughly equivalent to the Austrian annual GDP. One-half of these transfers are domes-tic, while in cross-border transactions Germany is by far Austria’s most im-portant TARGET2 partner, both in terms of payments sent and payments received (chart 1).
Most of the time, payments sent and received tend to balance each other out over the course of a day. But if an NCB systematically records more incoming than outgoing payments (or vice versa), its claims (or liabilities) vis-à-vis the ECB increase over time. This is happening e.g. in Austria. In the first few years after the start of monetary union in 1999, the OeNB’s TARGET balance was positive most of the time.8 Since 2002, however – with the exception of the period between 2007 and 2010 – the OeNB has in most months transferred higher amounts to other euro area countries than the other way around (chart 2). As a result, the OeNB’s TARGET2 liabilities stood at EUR 39.2 billion by the end of November 2012.9
6 While this transaction leads to a shift in liabilities for the first central bank (lower current account liability, higher TARGET2 liability), it is a balance sheet expansion for the second central bank (higher current account liability, higher TARGET2 claim).
7 See the ECB’s TARGET Annual Report 2011; the data on Austria were provided by the OeNB.8 See Brandner and Grech (1999) for an overview of Austria’s TARGET claims and liabilities in the first year of
monetary union.9 Chart 2 shows the OeNB’s TARGET2 balance excluding the Term Auction Facility (TAF). TAFs are liquidity-
providing operations in U.S. dollar conducted as swap operations between the ECB and the NCBs. The Federal Reserve Bank of New York provides U.S. dollar liquidity to the ECB, which in turn provides it to the NCBs. The resulting non-interest bearing liabilities within the Eurosystem are included among the NCBs’ TARGET balances. Given that TAF balances are merely the result of a technical agreement (as they do not reflect cross-border payments in central bank money), the Austrian TARGET2 balances have been adjusted for TAFs.
Average volume 2009 to 2011, EUR billion
35
30
25
20
15
10
5
0Austrian senders
Daily TARGET2 Transactions
Chart 1
Source: OeNB.
AT DE FR NL ITECB BE LU Other
Austrian recipients
the cross-Border Movement of euro Banknotes and austria’s tarGet2 liabilities
Monetary Policy & the econoMy Q4/12 35
Besides credit institutions’ central bank balances, banknotes are the sec-ond form of central bank money.10 Like central bank balances, banknotes can also move freely in a monetary union. Banknotes withdrawn in one country can be used for payment in another country. Unlike transfers of electronic central bank money in TARGET2, this banknote migration goes undetected at first, though. Cash is anonymous, and it is impossible to tell which NCB origi-nally issued a banknote and when the banknote moved across borders.11 The migration from one country to another becomes at least partly evident, however, when banknotes are returned to another country’s NCB: The corresponding amount is credited to the current account of the commercial bank that returned the banknotes, and the current
account liabilities of this country’s NCB increase. As it is impossible to tell which NCB originally issued the banknote, the total value of banknotes in circula-tion declines in the balance sheets of all NCBs and the ECB. The country’s NCB to which the banknote was returned and whose liabilities have increased by the value of the banknote now receives a claim on the other Eurosystem central banks that is related to the adjustment of banknotes in circulation.12 If the net value of banknotes put into circulation by an NCB (i.e. banknotes issued minus banknotes withdrawn from circulation) is higher than its share based on the banknote allocation key, it reports a net liability arising from the adjustment of banknotes in circulation. If an NCB issues fewer banknotes than that, it accumulates a net claim.
10 There are many forms of money, which – depending on their characteristics – can be allocated to different monetary aggregates (M1, M2 etc.). Central bank money (or M0) is the narrowest aggregate. By definition, its holders have a direct claim on the central bank. Other forms of money, e.g. current account balances, represent a claim vis-à-vis a commercial bank or a savings bank. Converting such deposits into central bank money takes another step (withdrawal). Coins are not included here, as in the euro area they are not issued by the central banks and thus do not constitute central bank liabilities (in line with Article 106 paragraph 2 of the EC Treaty).
11 The first character of a banknote’s serial number is a letter that uniquely identifies the NCB that commissioned the printing of the banknote. This country code does not indicate which NCB first issued (or re-issued) the banknote, and is therefore unsuited for identifying the issuing central bank.
12 This is a simplified description. An example highlighting the effects on the NCBs’ and the ECB’s balance sheets is provided in the annex. For further details, see e.g. Handig and Holzfeind (2007) as well as Krsnakova and Oberleithner (2012).
the cross-Border Movement of euro Banknotes and austria’s tarGet2 liabilities
36 Monetary Policy & the econoMy Q4/12
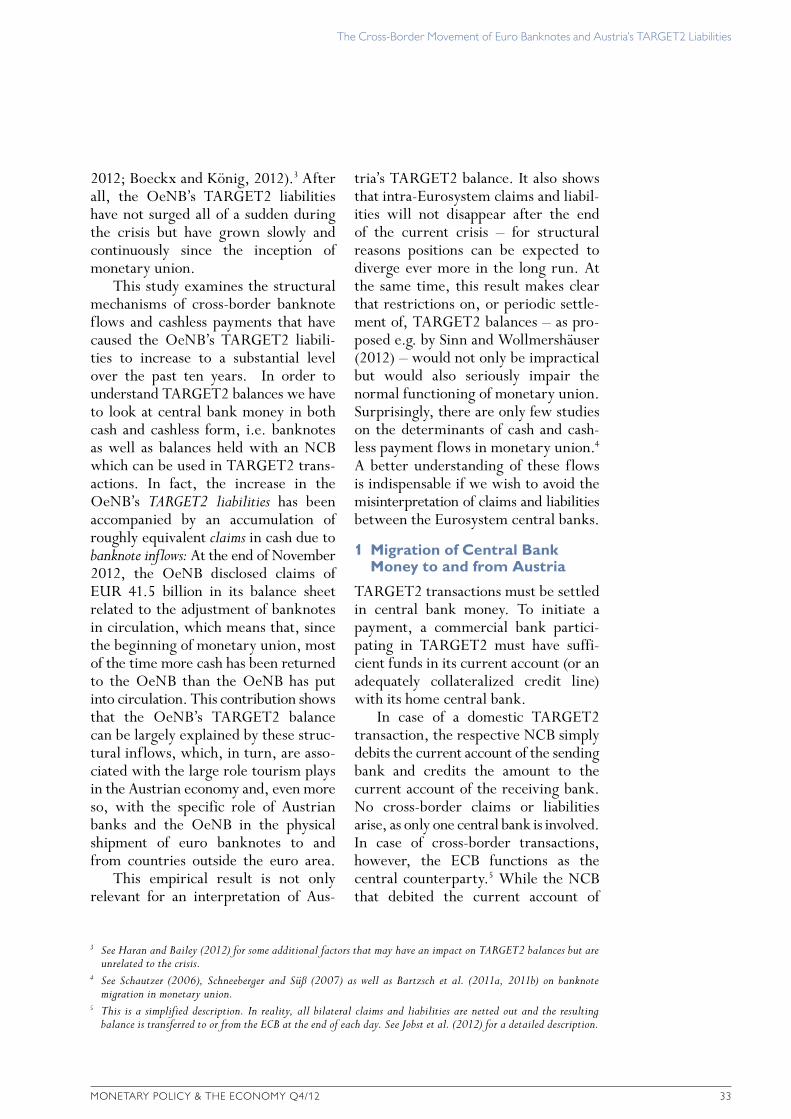
The volume of banknote flows – like that of cashless payments – is substantial: In 2011, the OeNB put banknotes worth EUR 66.4 billion into circulation, and banknotes in the amount of EUR 73.1 billion were returned to it. For the euro area as a whole, the value of banknotes taken out of circula-tion was EUR 1,108 billion, while that of banknotes put into circulation was EUR 1,128 billion. Chart 3 shows the monthly value of banknotes issued by and returned to the OeNB. In almost all months since 2002 – with the exception of a few months around the introduction of euro cash in 2002 and the onset of the financial crisis in 2008, which led to an extreme peak in the demand for banknotes in October 2008 (see also section 3.2) – more banknotes were returned to the OeNB than it put into circulation. A similar phenom-enon was observed within Austria during the schilling era, with banknotes mi-
grating from Vienna and Lower and Upper Austria to the Tyrol and Carinthia due to differences in the regional demand for cash.13 Today, similar banknote flows can be observed in monetary union, with Germany reporting net outflows and Austria reporting net inflows (see also box 1).
Chart 4 displays how banknotes issued and returned are reflected in the OeNB’s balance sheet. The graph for schilling banknotes in circulation shows an upward trend until the end of 2000, with typical seasonal fluctuations (above all due to the stronger demand for cash at the turn of the year). After the introduction of euro cash in early 2002, the value of schilling banknotes in circulation declined quickly. Since January 1, 2003, schilling banknotes have no longer been disclosed as banknotes in circulation.14 As described earlier, euro banknotes in circulation are allocated to the NCBs and the
13 Based on 1999 data.14 In 2002, schilling banknotes and coins lost the status of legal tender, and new rules were established regarding
the treatment of Eurosystem banknotes in the balance sheets of the Eurosystem NCBs (ECB/2001/15, as amended by ECB/2010/29).
the cross-Border Movement of euro Banknotes and austria’s tarGet2 liabilities
Monetary Policy & the econoMy Q4/12 37
ECB based on the banknote allocation key. The blue line represents the OeNB’s share in the sum total of euro banknotes in circulation, as disclosed in the balance sheet, whereas the orange line represents the actual net value of banknotes the OeNB put into circula-tion (i.e. banknotes put into minus those taken out of circulation). Starting in 2003, this net value declined quickly (chart 3), and even turned negative in 2006. In other words, between January 1, 2002, and the time of observation, more euro banknotes had been redeliv-ered to the OeNB than it had put into circulation. In 2007 and 2008, this net value increased markedly, given the heightened demand for euro cash above all in Eastern and Southeastern Europe at the onset of the financial crisis (see also section 3.2). Since 2009, though, more euro cash has again been returned to the OeNB than it had put into circu-lation.
Overall, the analysis of the cross-border movement of central bank money to and from Austria reveals systematic net inflows of cash as well as net outflows in the form of cashless transactions in TARGET2.
2 The Link between Banknote Migration and TARGET2
A comparison of Austria’s TARGET2 balances with data on the adjustment of banknotes in circulation reveals a re-markably parallel development (chart 5). In periods characterized by high net banknote inflows into Austria, more central bank money tends to be trans-ferred abroad via TARGET2, and vice versa (chart 6).
This need not be the case, though. Cross-border movements of banknotes are determined by payment habits and other characteristics of cash payments. Likewise, TARGET2 transfers result from a multitude of transactions and motivations. In principle, the two are independent of each other, and the correlations between TARGET2 bal-ances and the adjustment of banknotes in circulation as currently observed in other euro area countries are not high (box 1).
If, however, banknote inflows are substantial relative to the size of a country’s economy – as has verifiably been the case for Austria – these inflows must at least partly be offset by outbound TARGET2 transactions.
Source: OeNB. Monthly average values until end-2001, month-end values from 2002.
Austrian schilling Euro banknotes issued minus banknotes returnedEuro banknotes in circulation (balance sheet item)
Adj
ustm
ent
of b
ankn
otes
in c
ircul
atio
n
the cross-Border Movement of euro Banknotes and austria’s tarGet2 liabilities
38 Monetary Policy & the econoMy Q4/12
The argument goes like this: When a commercial bank delivers banknotes to the OeNB, the corresponding amount is credited to its current account with the OeNB. However, commercial banks need only relatively
small amounts of funds in their ac-counts with the central bank. This amount is determined above all by the minimum reserves the banks are required to hold on average with the central bank over the maintenance
Adjustment of banknotes in circulation TARGET2 (excluding TAF) Sum of the two items
Annual change in EUR billion
10
8
6
4
2
0
–2
–4
–6
–8
–102003
Correlation of Intra-Eurosystem Balances
Chart 6
Source: OeNB. This chart shows year-on-year changes of fourth-quarter averages.
Adjustment of banknotes in circulation TARGET2
2004 2005 2006 2007 2008 2009 2010 2011
the cross-Border Movement of euro Banknotes and austria’s tarGet2 liabilities
Monetary Policy & the econoMy Q4/12 39
period.15 It does not make sense for a commercial bank to hold larger deposits than that, as they are remunerated below market rates. As failure to com-ply with minimum reserve require-ments results in penalty interest, how-ever, commercial banks will aim at fulfilling their reserve requirements as precisely as possible on average over the reserve maintenance period, and at quickly withdrawing any excess funds.16
In the last pre-crisis year, 2006, the reserve requirements of all Austrian banks came to EUR 5.0 billion on aver-age. In the four years preceding the onset of the current crisis (2003 to 2006), the average net value of banknotes migrating to Austria was around EUR 5 billion per year. If the Austrian banks decided to deposit these banknotes and increase their balances over the course of one year, their reserves would be twice as high as necessary and desirable at the end of the year. Therefore it is only logical that the banks will seek to reduce their deposits. One way of doing this is by purchasing securities or granting loans
to domestic customers, but this would just lead to a transfer of central bank deposits between Austrian banks with-out reducing excess reserves deposited with the OeNB in the aggregate.
For the banking sector as a whole, there are only two options available for reducing excess reserves: The banks can either repay their outstanding loans to the OeNB or transfer the funds abroad (e.g. to purchase securities or repay loans). There are limits to the use of the first option, though: In the period from 2003 to 2007, Austrian banks had debt outstanding to the OeNB in the amount of EUR 8.9 billion on average. Even if the banks delivering banknotes to the OeNB were identical with those that had debt outstanding to the OeNB – which is not necessarily the case – it would have taken them only two years to repay all liabilities. Further inflows would have again led to an accumula-tion of excess reserves. Therefore, only the second option remains in the long run, i.e. transferring the funds abroad. Cross-border transactions (such as the
15 The main reason why commercial banks hold central bank deposits (apart from the fulfillment of reserve requirements) is their role in the settlement of payment system transactions. As mentioned earlier, large value payments in TARGET2 must be settled in central bank money. This is why banks’ deposits can fluctuate greatly in the course of a day.
16 In 2006, the reserves held by Austrian banks came to EUR 5.1 billion on average, which is 2.7% or EUR 133 million more than would have been required complying with the minimum reserve requirements. In the euro area, too, the liquidity situation was balanced until the fall of 2008, with reserves held by the banking sector being only negligibly higher than necessary. The situation changed when the full allotment policy was implemented in 2008. Therefore, the examples given above all refer to the years prior to 2007; see also box 1.
Box 1
Banknote Migration and TARGET: A Look at the Balance Sheets of Other Eurosystem Central Banks
The OeNB is not the only central bank in the Eurosystem to record systematic in- or outflows of central bank money in cash or cashless form. Especially for banknotes, continuous flows in one or the other direction can be observed for several countries. For instance, the net value of banknotes put into circulation (banknotes issued minus banknotes taken out of circulation) by the Deutsche Bundesbank since 2002 has exceeded the share allocated to it in accordance with the banknote allocation key by almost EUR 200 billion. The respective figure for the Banque de Luxembourg is EUR 70 billion. In contrast, a few other countries besides Austria have recorded net banknote inflows (or disproportionately low issuance): France (EUR 75 billion),
the cross-Border Movement of euro Banknotes and austria’s tarGet2 liabilities
40 Monetary Policy & the econoMy Q4/12
the Netherlands (EUR 30 billion) and Portugal (EUR 25 billion). For the smaller euro area countries, the respective balances from the adjustment of banknotes in circulation can be substantial as a ratio of nominal GDP: They are slightly above 10% for Portugal, almost 10% for both Austria and Ireland (albeit with a different sign) and 150% for Luxembourg. Interes-tingly, these in- and outflows have remained constant over time and have hardly changed at all during the financial crisis. The only exceptions are Belgium and Spain, where banknote flows reversed in 2008 (which is not necessarily connected to the financial crisis, however).
In- or outflows caused by structural factors can be observed for some countries also in TARGET, albeit at a significantly lower level. The chart below only shows the period up until 2007 for TARGET, i.e. the years before the crisis started to have a strong impact on TARGET balances. Until 2007, both Austria and Belgium were usually net exporters of central bank money in cashless form, whereas Italy was a net importer in most years. A comparison between banknote flows and TARGET balances shows, however, that a negative correlation between the two seems to have existed only in Austria and, to a somewhat lesser extent, in Belgium and Portugal. One possible explanation for the lacking correlation could be that in the other countries, banknote in- or outflows have so far not reached proportions that would make it necessary to offset them via TARGET.1
It should be noted that this mechanism is effective only if the liquidity situation in the euro area aggregate is balanced, with central bank reserves held by commercial banks being broadly equivalent to the amount necessary for the fulfillment of aggregate reserve require-ments. In contrast, when the situation in the euro area is characterized by excess liquidity, as has been the case since fall 2008, banks have no (or much less) incentive to reduce excess reserves. On aggregate, the excess liquidity must show in the deposit facility. In this case, net liquidity provision can also turn negative (on a large scale), as was observed e.g. for the Deutsche Bundesbank at the end of 2012. As soon as the crisis-related nonstandard measures have expired, though, the effects of structural payment flows should become visible again in the NCBs’ balance sheets.
1 The mechanism described in section 2 works asymmetrically. High cash inflows must be offset via TARGET as soon as the refinancing volume with the central bank has dropped to zero. This limit does not exist for cash outflows, however, as the banks can increase their refinancing volumes as long as they fulf ill the requirements for refinancing operations of the Eurosystem. This is why the Deutsche Bundesbank’s and the Banque centrale du Luxembourg’s liabilities from the adjustment of banknotes in circulation were not offset with TARGET claims but with higher claims stemming from monetary policy operations.
Annual average in EUR billion and in % of nominal GDP for 2007 and 2012
100
50
0
–50
–100
–150
–200
2003
2005
2007
2009
2011
Intra-Eurosystem Claims and Liabilities of Selected NCBs
Source: IMF International Financial Statistics. 2012 data refer to the period from January to August.
AT
Adjustment of banknotes in circulation TARGET
2003
2005
2007
2009
2011
BE
2003
2005
2007
2009
2011
DE
2003
2005
2007
2009
2011
GR
2003
2005
2007
2009
2011
ES
2003
2005
2007
2009
2011
FR
2003
2005
2007
2009
2011
IE
2003
2005
2007
2009
2011
IT
2003
2005
2007
2009
2011
LU
2003
2005
2007
2009
2011
NL
2003
2005
2007
2009
2011
PT
6.7% 6.8%4.2%1.3%
–0.6%
3.3%3.7%
–9.8%
11.8%
–8.7%–12.6%
–4.2%
1.7% 2.6%
–2.0%–0.1% –5.7%
1.5%0.5% 29.6%
–5.4%–9.3%–0.3%–0.2%
1.7% 6.4%13.7%4.6%
–112.4%–163.1%
0.0%
–3.8%
–6.7%
the cross-Border Movement of euro Banknotes and austria’s tarGet2 liabilities
Monetary Policy & the econoMy Q4/12 41
purchase of assets or the repayment of loans) are made via TARGET2, how-ever, and when central bank money is transferred abroad via TARGET2, the OeNB’s TARGET2 liabilities increase. This can explain why in Austria, TARGET2 balances and the adjustment of banknotes in circulation move (or rather, have to move) in tandem over a one- or two-year horizon.
A correct interpretation of the OeNB’s TARGET2 liabilities and their evolution over time requires that we examine the reasons for banknote migration into Austria.
3 Reasons for Banknote Migration into Austria
In the following, we distinguish between two main channels through which banknotes can move across borders. The first channel is persons traveling to Austria on business or vacation who pay their expenses in euro banknotes which they had earlier withdrawn from a bank
in their country of origin (or some-where else outside Austria). This cash spent on consumption is first credited to the bank account of the Austrian retailer or services provider; from there, it is passed on to the OeNB. The second channel is banks providing foreign exchange trading services (“wholesale banks”), which supply euro banknotes and coins to central banks, commercial banks and currency ex-change offices outside the euro area. They do not only ship cash abroad but also return it to Austria, which is another possible source of banknotes returned to the OeNB.
3.1 Cross-Border Cash Movements Due to Travel
International travel has traditionally been an important source of income for Austria. In 2011, visitors from abroad spent almost twice as much money in Austria as Austrian travelers spent abroad (EUR 14.3 billion against EUR
EUR billion Millions
1.0
0.5
0.0
–0.5
–1.0
–1.5
20
15
10
5
0
2003
Net Value of Banknotes Returned to the OeNB and Overnight Stays by Foreigners
the cross-Border Movement of euro Banknotes and austria’s tarGet2 liabilities
42 Monetary Policy & the econoMy Q4/12
7.5 billion).17 If these foreign visitors covered at least part of their expenses using cash they had brought from an-other country, this would be one possi-ble explanation for the large volume of banknotes returned to the OeNB.
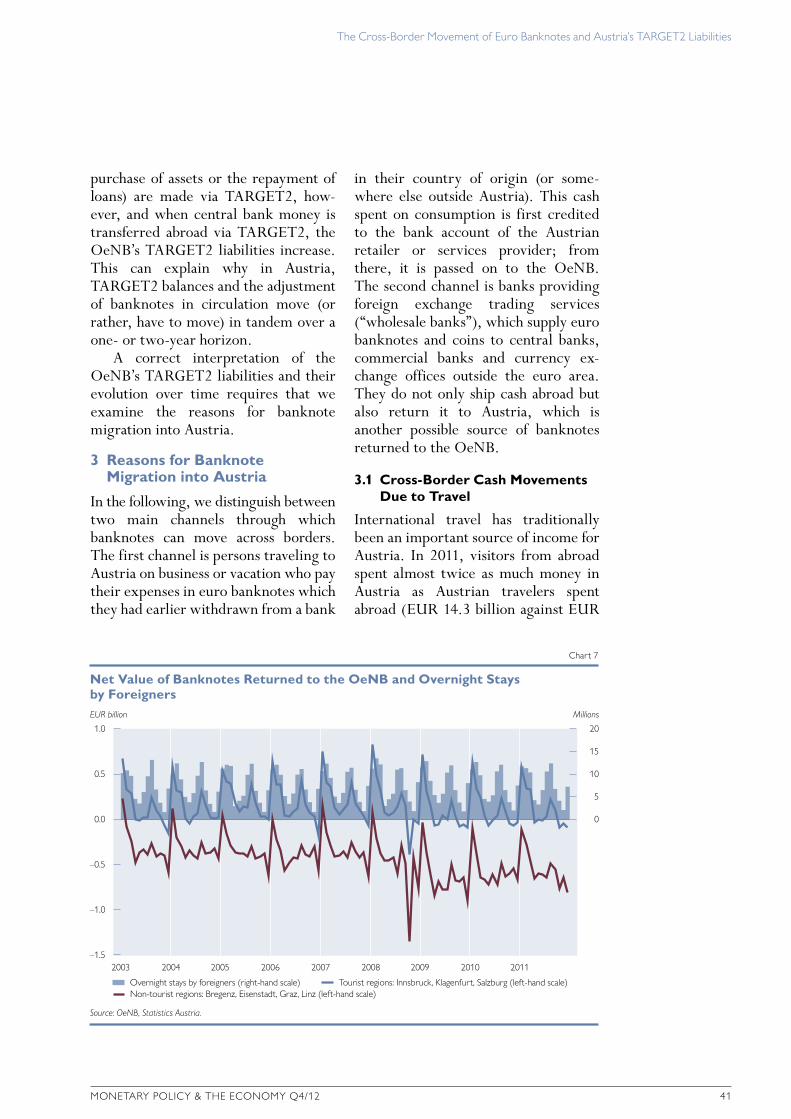
The seasonal fluctuations in the net value of banknotes returned to the OeNB provide first insights into the role of tourism. Chart 7 shows the monthly net value of cash delivered to the rele-vant OeNB offices. The seasonal pattern observed at offices in tourist regions (i.e. Innsbruck, Klagenfurt and Salzburg) differs markedly from that observed at the offices in the other regions (Bregenz, Eisenstadt, Graz and Linz). In regions attracting fewer tourists, net inflows are relatively constant over the year, and peaks are usually observed in December (when more banknotes are issued by the OeNB) and January (net backflows). These fluctuations are con-nected to the Christmas and year-end
holidays, and can be observed all across the euro area. The year-end effect is also notable in the tourist regions. In addi-tion, however, there are seasonal peaks with strong backflows in the periods from January to March and from July to September. This pattern corresponds to the summer and winter tourist sea-sons, as is evident from the strong cor-relation with overnight stays by foreign tourists.
For an assessment of how much cash is transported to Austria by travelers from abroad, we need information on the payment habits of foreign and Aus-trian tourists. This information is only available to a limited extent, though. Still, given that German visitors account for the lion’s share of net income from overnight stays in Austria (2011: 77%), the analysis is made easier by the fact that the Deutsche Bundesbank conducts regular surveys on the amount of cash carried by German travelers, which it uses in the compilation of the balance of payments (Deutsche Bundesbank, 2005). Based on the results of these surveys, Germans traveling across na-tional borders in the euro area carry an estimated share of around 40% of their travel expenses in euro cash. For Aus-tria, this means that German visitors bring around EUR 2.5 billion in cash to the country per year; for an estimate of the net amount of banknotes migrating to Austria this way, we would have to subtract the amount carried by Aus-trian travelers to Germany. Unfortu-nately, the relevant data for Austrian travelers are not available, but if we as-sume the two groups to have similar habits, the net annual inflow of banknotes to Austria would be EUR 1.5 billion to EUR 2 billion (chart 8).18
17 According to the OeNB’s balance of payments statistics.18 There are reasons to assume that cash usage habits vary widely across countries and population groups, so the
estimates provided here should be interpreted with caution.
EUR billion
10
8
6
4
2
0
–2
–4
–62002
Estimated Net Cash Inflows from Tourism and Total Banknote Migration
Chart 8
Source: OeNB, Deutsche Bundesbank. See text for details on the calculation method used.
Cash inflows from Germany Cash flows from/to the euro area excluding GermanyAnnual change in the adjustment of banknotes in circulation
2003 2004 2005 2006 2007 2008 2009 2010
the cross-Border Movement of euro Banknotes and austria’s tarGet2 liabilities
Monetary Policy & the econoMy Q4/12 43
This gives us an approximate idea of the net amount of banknote inflows to Austria from travel and tourism. Aus-tria’s travel balance of payments with other euro area countries is roughly in equilibrium, as net inflows from the Netherlands and, to a lesser extent, also from Belgium, Slovenia and Slova-kia are offset by net outflows to Italy, Greece and Spain. Assuming a cash ratio similar to that of German travel-ers, we estimate that the respective banknote flows between Austria and the euro area excluding Germany come to between minus and plus EUR 200 million (chart 8). Net cash inflows from these countries can play only a rather negligible role in explaining the extent of banknote migration to Austria.19
People traveling across borders for cheaper fuel are probably another source of cash inflows, as the comparatively low mineral oil tax in Austria is an incentive for car drivers from abroad (above all Germany and Italy) to refuel their vehicles in Austria. While it is safe to assume that some of these transac-tions are settled in cash, the sales are likely too small (estimated at around EUR 100 million annually) to provide a meaningful explanation for the extent of banknote migration to Austria.
Even though Austria does report cash inflows from tourism, chart 8 shows that this factor alone does not suffice: The estimated amount of around EUR 2 billion is well below the
approximately EUR 5 billion to EUR 6 billion in banknotes that have migrated to Austria in most years since 2002. Moreover, cash inflows from tourism have been stable over time and cannot explain the reversal in banknote migra-tion patterns between 2007 and 2009. While changes in travelers’ payment habits are conceivable (e.g. due to higher credit card use), such changes would occur slowly over time and would not lead to cyclical peaks in banknote movements as observed between 2007 and 2009 and again between 2010 and 2012.20
In the following we therefore take a closer look at the second channel of banknote migration to Austria: banks’ foreign exchange trading services.
3.2 Cross-Border Cash Movements Due to Foreign Currency Trading
The euro is the currency of one of the world’s largest and most developed economic areas with a financial sector of international significance, and con-sequently the euro’s importance extends far beyond the euro area. This interna-tional role of the euro is not limited to its use as an electronic means of payment, but also applies to euro cash (ECB, 2012b). Above all in Central, Eastern and Southeastern Europe (CESEE), the euro is considered to be a safe and stable par-allel currency and is used as a store of value and partly also as a means of pay-ment alongside local currencies (Ritz-berger-Grünwald and Scheiber, 2012).
19 Distinguishing between day trips and longer stays may lead to different results, as day trip visitors possibly carry a large share of their travel expenses in cash than people who stay longer. Given the lack of other data, we had to use the German cash ratio estimate for all other countries. If in the group of travelers from countries other than Germany the share of day trips in total trips is larger than the day trip share in the group of German travelers, Austria’s net cash inflows from these countries may be higher than estimated above. According to the results of OeNB household surveys in combination with relevant estimates by the statistical offices of other countries, however, Germans again account for the by far largest share of net cash inflows due to day trip visitors. Even if visitors from euro area countries excluding Germany carried a larger share of their travel expenses in cash, the resulting net inflows would still be too low to have a substantial impact on the results described above.
20 The fact that the seasonal patterns observed in the volume of banknotes returned in Austria’s tourist regions have hardly changed at all (chart 7) also suggests that cash inflows due to tourism have been broadly stable.
the cross-Border Movement of euro Banknotes and austria’s tarGet2 liabilities
44 Monetary Policy & the econoMy Q4/12
While it is impossible to tell exactly how many euro banknotes are in circu-lation outside the euro area, an esti-mate can be made based on the total value of euro banknotes shipped to destinations outside the euro area since 2001 minus the total value of euro banknotes returned. According to this estimate, the value of euro banknotes in circulation outside the euro area was around EUR 117 billion at end- December 2011, which equals around 13% of euro currency in circulation (chart 9) (ECB, 2012b, p. 20). This estimate is clearly a lower bound since there are many other channels apart from the banking system through which banknotes leave the euro area, e.g. tourism or workers’ remittances. There is reason to assume that euro cash outflows through these other channels exceed inflows. According to broader estimates, as much as 20% to 25% of euro cash (EUR 180 billion to EUR 225 billion) may be in circula-
tion outside the euro area (ECB, 2012b, p. 20).
The volume of net shipments of euro banknotes to banks outside the euro area has varied markedly over the years: Immediately after the adoption of the euro, legacy currency cash held outside the euro area (above all Deutsche mark) was converted into euro. Banknote exports continued to be strong until the end of 2004, how-ever, and then stagnated until early 2007. As the financial and economic crisis unfolded, foreign demand for euro banknotes rose again markedly, and showed a sharp spike when Lehman Brothers failed in fall 2008. While these banknotes were not shipped back to the euro area over the following months, the volume of additional net shipments abroad, too, was negligible until end-2010. A return to the 2002 to 2005 trend of continual net euro banknote shipments abroad has been observed since the beginning of 2011.
Net Shipments of Euro Banknotes to Destinations Outside the Euro Area
Chart 9
Source: ECB.
AT DE FR IT Other, net Total
the cross-Border Movement of euro Banknotes and austria’s tarGet2 liabilities
Monetary Policy & the econoMy Q4/12 45
The bulk of banknote shipments to and from banks outside the euro area is handled by specialized banks. Given the high logistical effort and security requirements involved, this market has significant economies of scale, which is reflected in the small number of large, internationally active players. Only around ten banks, in cooperation with very few Eurosystem NCBs, manage the supply (and return) of euro banknotes to (from) destinations outside the euro area. In the period from 2002 to 2009, almost three-quarters of all euro banknotes sent to destinations outside the euro area were provided by the Deutsche Bundesbank. Its share in return deliveries, at two-thirds, was slightly lower but still dominant.21
In the Eurosystem, the OeNB ranks second in terms of banknote shipments both to and from countries outside the euro area, accounting for slightly more than 10% of banknotes supplied and for one-quarter of banknotes returned between 2002 and 2009. Taken to-gether, the two central banks accounted for almost 90% of international euro cash shipments, while the other Euro-system NCBs were hardly involved at all. The prominent role of the Deutsche Bundesbank can be attributed above all to (i) the fact that Frankfurt airport is a major international hub and (ii) to its geographical proximity to Switzerland, whose banks play an important role in the global trading of foreign currency (Bartzsch et al., 2011a, p. 10–11). The comparatively large role played by the OeNB is also largely due to geo-graphical factors, especially Austria’s
proximity to CESEE – a region in which euro cash is used extensively – and the good flight connections to the region through Vienna airport.
This focus on CESEE also explains the notable difference between the OeNB’s relatively small share in banknote shipments to, and its rela-tively large share in backflows from, destinations outside the euro area: According to the results of surveys among wholesale banks about the ori-gin and destination of their banknote shipments (which the ECB has pub-lished since 2006 in its annual Review of the International Role of the Euro), fewer banknotes have been shipped to CESEE and Turkey than have been shipped back from these regions, with some fluctuations over the years.22 One prob-able explanation for these net back-flows is that part of the banknotes do not enter the region via the banking channel but are instead carried by tourists and migrant workers. These banknotes are ultimately returned to the banking system and shipped back to the Eurosystem.23 In light of the focus of Austrian wholesale banks on this region, the OeNB, too, records overall significantly higher backflows than shipments.
The different roles played by the Deutsche Bundesbank (supply) and the OeNB (backflows) in the global supply of euro banknotes become apparent in chart 9, which shows a breakdown by NCB of the wholesale banks’ net ship-ments. The Deutsche Bundesbank clearly emerges as the largest net supplier of euro cash, followed by the Banque de
21 This calculation is based on data provided in Bartzsch et al. (2011a, p. 11–12) and ECB (2010, p. 34).22 These figures should be interpreted with some caution, as not all relevant banks participate in the surveys or
provide information at the same level of detail about the destination and origin of their banknote shipments.23 Another factor could be a decline in cash hoarding thanks to increasing confidence in the banking system and
easier access to banking services in the region, with people converting their euro cash holdings into euro or local currency deposits. These excess banknotes would also be shipped back to the Eurosystem via the banking system (Ritzberger-Grünwald and Scheiber, 2012).
the cross-Border Movement of euro Banknotes and austria’s tarGet2 liabilities
46 Monetary Policy & the econoMy Q4/12
France and the Banca d’Italia. In con-trast, the OeNB is by far the largest net recipient of euro banknotes returned.24 Since the introduction of euro cash, backflows from abroad to the OeNB have outpaced cross-border shipments involving the OeNB by more than EUR 40 billion cumulatively. The NCBs’ dif-ferent roles are also reflected in their balance sheets: While the Deutsche Bundesbank has built up liabilities arising from the adjustment of banknotes in circulation, the OeNB has recorded increasing claims.
Cumulative net backflows to the OeNB (in the amount of EUR 40 billion) are in a similar range as the OeNB’s claims arising from the adjustment of banknotes in circulation, and chart 10 shows that the two also move in tandem over time.
To conclude, international shipments of euro banknotes seem to be the most important factor in explaining cash inflows to Austria. Tourism and other channels, like migrant workers carrying cash, play a subordinate role, at least with regard to banknote inflows. Indi-
rectly, these channels are potentially very significant, though, as they may be responsible for euro banknotes being transported to CESEE, from where they are later shipped back to the OeNB.
Looking at the role of foreign ex-change trading also helps clarify the con-nection discussed in section 2 between banknote migration and TARGET2 transactions. The banks offering whole-sale banknote services are specialized service providers. The banknotes they ship back to the OeNB were provided to them by other banks, therefore the banks trading in foreign currency have to quickly pass on to their customers the balances received through the ship-ment of notes to the OeNB. Many of these customers (commercial banks) are probably located outside Austria. Therefore, cross-border TARGET2 transfers will follow shortly after banknotes have been returned to the OeNB. This specific mechanism may explain the close connection between banknote shipments and TARGET2 balances in Austria.
24 For an analysis of these data at the regional level, see Schautzer (2006).
Net Backflows of Banknotes to the OeNB and Adjustment of Banknotes in Circulation
Chart 10
Source: OeNB.
Cumulative net backflows Adjustment of banknotes in circulation
the cross-Border Movement of euro Banknotes and austria’s tarGet2 liabilities
Monetary Policy & the econoMy Q4/12 47
4 ConclusionsHigh claims and liabilities between Eurosystem NCBs and the ECB in the payment system TARGET2 have sparked a heated public debate about the reasons and consequences of these balances. What is often overlooked, however, is that significant TARGET2 balances can arise even if national banking sectors are not facing funding difficulties that lead to greater dependence on central bank financing. In fact these balances arise in the normal functioning of monetary union. A case in point is the OeNB’s accumulation of TARGET2 liabilities in the amount of EUR 39.2 billion (as at end-November 2012) over the past ten years; at the same time, the OeNB holds similar-sized claims arising from the adjustment of banknotes in circulation.
Austria’s TARGET2 liabilities result from structural inflows of central bank money in the form of cash, which leaves the country again in cashless form via TARGET2. While foreign tourists car-rying cash account for some of these banknote inflows, international whole-sale trading of euro banknotes plays a much bigger role. A substantial share of these transactions is handled via the OeNB, and the value of banknotes returned to the OeNB every year exceeds that of banknotes it puts into circulation. This means that macroeco-nomic factors – which are frequently cited in the literature on TARGET2 balances – hardly play a role in explaining the OeNB’s large TARGET2 liabilities. Rather, microeconomic and structural factors in the payment system are of key importance.
From this, we can draw the following conclusions that are relevant beyond the specific case of Austria: First, an analysis of TARGET2 balances must
take into account both cross-border banknote flows and cashless transac-tions. While several recent studies on TARGET2 in fact mention banknotes, a more integrated analysis would be desirable.25 Second, there is no reason to assume that TARGET2 balances in the euro area will go back to zero after the end of the current banking and sovereign debt crisis. At present, the structural factors are masked by the crisis, but as soon as the crisis-related imbalances have been resolved, struc-tural factors will become more visible again. It is important to note that there is no limit on TARGET2 balances. If the trend observed in Austria remained the same (annual banknote inflows in the amount of EUR 5 billion to EUR 8 billion and comparable TARGET2 outflows), the OeNB’s TARGET2 lia-bilities would be between EUR 90 billion and EUR 120 billion in ten years’ time. An understanding of the structural development of TARGET2 balances requires in-depth knowledge about the structure of banknote logistics and the role of centralized liquidity management in international banking groups as well as an understanding of different re-gional or transaction-related prefer-ences in the use of cash. All these fac-tors are subject to change, and the trend in Austria’s TARGET2 balances may reverse again over the next ten years. The most important economic policy conclusion from all this is that any restrictions on, or periodic settle-ment of, TARGET2 balances (as has been proposed several times) would make no sense and, more importantly, would severely impair the normal func-tioning of monetary union, which re-quires the unrestricted flow of central bank money.
25 Jobst (2011), Boeckx and König (2012), Burgold and Voll (2012), Jobst et al. (2012), Whelan (2012).
the cross-Border Movement of euro Banknotes and austria’s tarGet2 liabilities
48 Monetary Policy & the econoMy Q4/12
ReferencesAllen, W. and R. Moessner. 2012. the liquidity consequences of the euro area Sovereign
Debt crisis. BiS Working Papers 390.Auer, R. 2012. What Drives tarGet2 Balances? evidence From a Panel analysis. Swiss national
Bank Working Papers 2012–15.Bartzsch, N., G. Rösl and F. Seitz. 2011a. Foreign Demand for euro Banknotes issued in
Germany: estimation Using Direct approaches. Discussion Paper Series 1. 20/2011. Deutsche Bundesbank.
Bartzsch, N., G. Rösl and F. Seitz. 2011b. Foreign Demand for euro Banknotes issued in Germany: estimation Using indirect approaches. Discussion Paper Series 1. 21/2011. Deutsche Bundesbank.
Bindseil, U. and P. König. 2012. tarGet2 and the european Sovereign Debt crisis. in: Kredit und Kapital 45(2). 135–174.
Boeckx, J. and P. König. 2012. tarGet2 Balances in the eurosystem: What they are and how to interpret them. in: revue Bancaire et Financière. December 8. 483–498.
Brandner, P. and H. Grech. 1999. Die rolle der oenB im europäischen Zahlungsverkehr. in: WiFo-Monatsberichte 12/1999. 789–796.
Buiter, W., E. Rahbari and J. Michels. 2011. tarGeting the Wrong Villain: tarGet2 and intra-eurosystem imbalances in credit Flows. in: citi Global economics View. June 9.
Burgold, P. and S. Voll. 2012. Mythos tarGet2 – ein Zahlungsverkehrssystem in der Kritik. Working Papers on Global Financial Markets 29. Universität Jena.
Cecchetti, S., R. McCauley and P. McGuire. 2012. interpreting tarGet2 Balances. BiS Working Papers 393.
Deutsche Bundesbank. 2005. recording cross-border cash transactions in the Balance of Payments. in: Monthly report March.
ECB. 2010. the international role of the euro.ECB. 2012a. annual report 2011.ECB. 2012b. the international role of the euro.Handig, M. and R. Holzfeind. 2007. euro Banknotes in circulation and the allocation of
Monetary income within the eurosystem. in: Monetary Policy & the economy Q1/07. oenB. 150–163.
Haran, P. and S. Bailey. 2012. analysis of recent Monetary operations & tarGet2 Develop-ments. in: central Bank of ireland Quarterly Bulletin 03/July 2012. 115–132.
ifo Schnelldienst. 2011. Die europäische Zahlungsbilanzkrise. issue 16.Jobst, C. 2011. a Balance Sheet View on tarGet – and Why restrictions on tarGet Would
have hit Germany First. July 19. www.VoxeU.org.Jobst, C., M. Handig and R. Holzfeind. 2012. Understanding tarGet2: the eurosystem’s
euro Payment System from an economic and Balance Sheet Perspective. in: Monetary Policy & the economy Q1/12. oenB. 81–91.
Kokkola, T. (ed.). 2010. the Payment System. Payments, Securities and Derivatives, and the role of the eurosystem. Frankfurt am Main: ecB.
Krsnakova, L. and M. Oberleithner. 2012. how euro Banknotes in circulation affect intra-eurosystem Balances. in: Monetary Policy & the economy Q1/12. oenB. 70–80.
Ritzberger-Grünwald, D. and T. Scheiber. 2012. euro cash in central, eastern and South-eastern europe. in: Monetary Policy & the economy Q1/12. oenB. 41–55.
Schautzer, A. 2006. Banknote Migration in the centroPe region. in: Proceedings of the oenB Workshop 9 “new regional economics in central european economies: the Future of centroPe”. 200–219.
the cross-Border Movement of euro Banknotes and austria’s tarGet2 liabilities
Monetary Policy & the econoMy Q4/12 49
Annex: Balance Sheet Presentation of Banknotes in Circulation in the Eurosystem – An ExampleThe presentation of euro banknotes in circulation in the NCBs’ and the ECB’s balance sheets follows a specific rule: The total value of euro banknotes in circulation is determined by subtracting the total value of banknotes taken out of circulation from that put into circu-lation by all Eurosystem NCBs. This net amount is then allocated among the members of the Eurosystem in accor-dance with the banknote allocation key. First, a share of 8% is allocated to the ECB, even though the ECB does not, in fact, put any banknotes into circula-tion. Then the remaining 92% are distributed among the Eurosystem NCBs in accordance with the capital key. This key is based on the NCBs’ shares in the fully paid-up capital of the ECB under Article 29 of the ESCB/ECB Statute. The NCBs’ capital shares – which reflect, in equal weighting, the respec-tive country’s share in the total popula-tion and its share in the GDP of all 27 EU Member States – are adjusted every five years and whenever a new country joins the EU to reflect up-to-date statistical data. Any changes in the adjusted total value of banknotes in circulation also cause changes in the intra-Eurosystem balances arising from the adjustment of banknotes in circula-tion. These balances represent the difference between the individual NCBs’ shares in circulating banknotes as
reported in the balance sheet on the one hand, and the net value of banknotes they actually put into circulation (minus those returned to them) on the other.
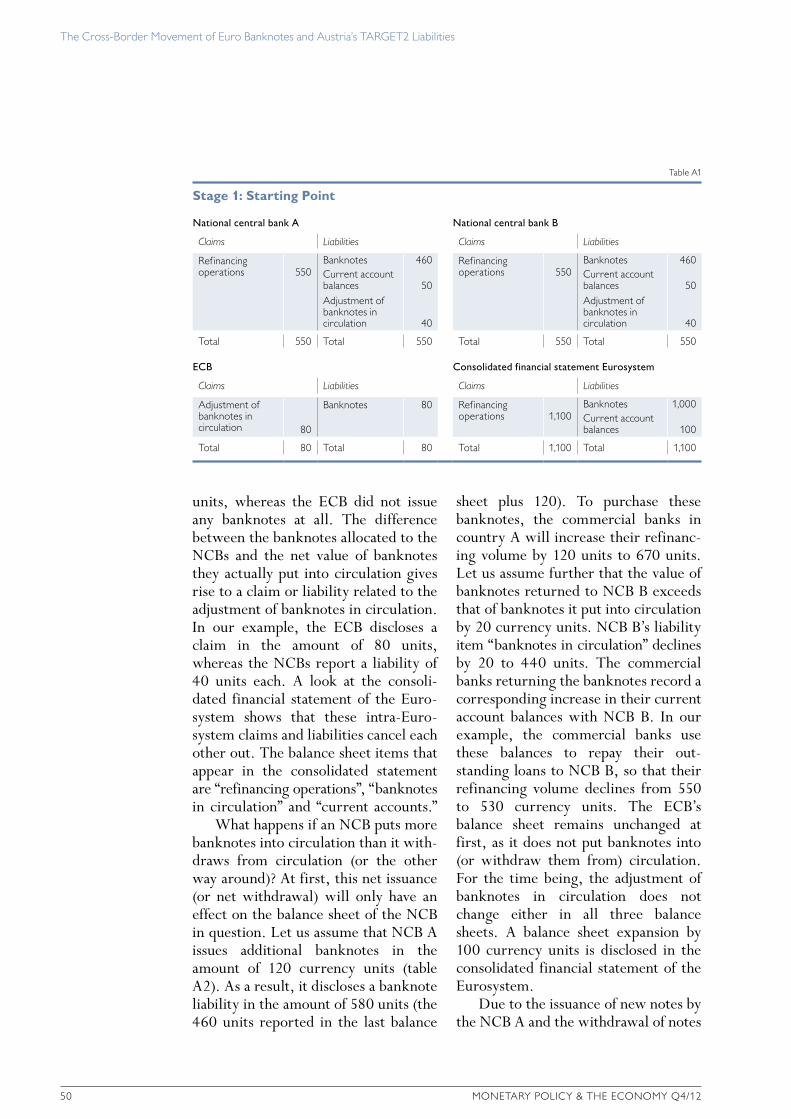
This is best explained using an example. Let us assume that the Euro-system consists of the ECB and two NCBs (A and B) only and that the two NCBs each hold 50% of the ECB’s capital. The NCBs conduct refinancing operations that allow commercial banks to obtain current account holdings, which are used for the fulfillment of reserve requirements and for purchasing banknotes. Let us assume further that the two NCBs each issued banknotes in the amount of 500 currency units, while their current account balances come to 50 units each, and the volume of refinancing operations is 550 units, respectively.
Table A1 shows the balance sheets of the NCBs and the ECB as well as the consolidated financial statement of the Eurosystem. The total value of banknotes in circulation is 1,000 cur-rency units. In line with the rule de-scribed above, 8% of that (i.e. 80 cur-rency units) is allocated to the ECB. The other 920 units are distributed among NCB A and NCB B in propor-tion to their assumed shares in the capi-tal key (i.e. 50% each in our example), so that the balance sheets of the two NCBs now disclose an amount of 460 units, respectively, under the liability item “banknotes in circulation.” In fact, however, both NCBs issued banknotes with a value of 500 currency
Schneeberger, D. and G. Süß. 2007. austria’s experience with euro Migration since the cash changeover. in: Monetary Policy & the economy Q1/07. oenB. 128–137.
Sinn, H.-W. and T. Wollmershäuser. 2012. target loans, current account Balances and capital Flows: the ecB’s rescue Facility. in: international tax and Public Finance 19(4). 468–508.
Ulbrich, J. and A. Lipponer. 2011. Die europäische Zahlungsbilanzkrise. in: ifo Schnelldienst 16. 69–72.
Whelan, K. 2012. tarGet2 and central Bank Balance Sheets. UcD centre for economic research Working Paper Series WP12/29.
the cross-Border Movement of euro Banknotes and austria’s tarGet2 liabilities
50 Monetary Policy & the econoMy Q4/12
units, whereas the ECB did not issue any banknotes at all. The difference between the banknotes allocated to the NCBs and the net value of banknotes they actually put into circulation gives rise to a claim or liability related to the adjustment of banknotes in circulation. In our example, the ECB discloses a claim in the amount of 80 units, whereas the NCBs report a liability of 40 units each. A look at the consoli-dated financial statement of the Euro-system shows that these intra-Euro-system claims and liabilities cancel each other out. The balance sheet items that appear in the consolidated statement are “refinancing operations”, “banknotes in circulation” and “current accounts.”
What happens if an NCB puts more banknotes into circulation than it with-draws from circulation (or the other way around)? At first, this net issuance (or net withdrawal) will only have an effect on the balance sheet of the NCB in question. Let us assume that NCB A issues additional banknotes in the amount of 120 currency units (table A2). As a result, it discloses a banknote liability in the amount of 580 units (the 460 units reported in the last balance
sheet plus 120). To purchase these banknotes, the commercial banks in country A will increase their refinanc-ing volume by 120 units to 670 units. Let us assume further that the value of banknotes returned to NCB B exceeds that of banknotes it put into circulation by 20 currency units. NCB B’s liability item “banknotes in circulation” declines by 20 to 440 units. The commercial banks returning the banknotes record a corresponding increase in their current account balances with NCB B. In our example, the commercial banks use these balances to repay their out-standing loans to NCB B, so that their refinancing volume declines from 550 to 530 currency units. The ECB’s balance sheet remains unchanged at first, as it does not put banknotes into (or withdraw them from) circulation. For the time being, the adjustment of banknotes in circulation does not change either in all three balance sheets. A balance sheet expansion by 100 currency units is disclosed in the consolidated financial statement of the Eurosystem.
Due to the issuance of new notes by the NCB A and the withdrawal of notes
table a1
Stage 1: Starting Point
National central bank A National central bank B
Claims Liabilities Claims Liabilities
refinancing operations 550
Banknotes 460 refinancing operations 550
Banknotes 460current account balances 50
current account balances 50
adjustment of banknotes in circulation 40
adjustment of banknotes in circulation 40
total 550 total 550 total 550 total 550
ECB Consolidated financial statement Eurosystem
Claims Liabilities Claims Liabilities
adjustment of banknotes in circulation 80
Banknotes 80 refinancing operations 1,100
Banknotes 1,000current account balances 100
total 80 total 80 total 1,100 total 1,100
the cross-Border Movement of euro Banknotes and austria’s tarGet2 liabilities
Monetary Policy & the econoMy Q4/12 51
by the NCB B, the allocation of banknotes in circulation to the Eurosystem cen-tral banks no longer corresponds to the banknote allocation key. The necessary adjustment is made on the last working day of each month (table A3).
For this purpose, the total value of banknotes in circulation (1,100 cur-rency units) is again reduced by 8% (i.e. 88 currency units), which are allocated to the ECB. The remaining 92% are distributed among the two
NCBs in proportion to their share in the ECB’s paid-up capital (in this case, evenly). Both NCBs now disclose banknote liabilities in the amount of 506 currency units. This leads to a change in the claims and liabilities aris-ing from the adjustment of banknotes in circulation: While the ECB discloses an equivalent increase in banknote claims and liabilities to 88 currency units, NCB A reports an increase in its liabilities arising from the adjustment
table a2
Stage 2: NCB A Issues Additional Banknotes
National central bank A National central bank B
Claims Liabilities Claims Liabilities
refinancing operations 670
Banknotes 580 refinancing operations 530
Banknotes 440current account balances 50
current account balances 50
adjustment of banknotes in circulation 40
adjustment of banknotes in circulation 40
total 670 total 670 total 530 total 530
ECB Consolidated financial statement Eurosystem
Claims Liabilities Claims Liabilities
adjustment of banknotes in circulation 80
Banknotes 80 refinancing operations 1,200
Banknotes 1,100current account balances 100
total 80 total 80 total 1,200 total 1,200
table a3
Stage 3: Balance Sheets Are Adjusted
National central bank A National central bank B
Claims Liabilities Claims Liabilities
refinancing operations 670
Banknotes 506 refinancing operations 530
Banknotes 506current account balances 50
current account balances 50
adjustment of banknotes in circulation 114
adjustment of banknotes in circulation 26
total 670 total 670 total 556 total 556
ECB Consolidated financial statement Eurosystem
Claims Liabilities Claims Liabilities
adjustment of banknotes in circulation 88
Banknotes 88 refinancing operations 1,200
Banknotes 1,100current account balances 100
total 88 total 88 total 1,200 total 1,200
the cross-Border Movement of euro Banknotes and austria’s tarGet2 liabilities
52 Monetary Policy & the econoMy Q4/12
of banknotes in circulation from 40 to 114 currency units, and NCB B’s liability of 40 units turns into a small claim in the amount of 26 units. The divergent development of the two NCBs’ balances from the adjustment of banknotes in circulation reflects the difference between the net value of banknotes issued by the two over the past month. This adjustment has no effect on the consolidated financial statement of the Eurosystem.
Table A4 illustrates a variant of the example, in which the commercial banks in country B use their additional
balances in the amount of 20 currency units (resulting from banknote redeliv-eries to NCB B) to transfer funds to their business partners in country A (instead of repaying outstanding loans to NCB B, as they did in the example above). The transaction is made via TARGET2, creating a TARGET2 lia-bility for NCB B and a TARGET2 claim for NCB A. The commercial banks in country A use the additional balances to repay their outstanding loans to NCB A. The consolidated financial statement of the Eurosystem is still identical to the one presented in table A3.
table a4
Stage 4: TARGET2 Transfers
National central bank A National central bank B
Claims Liabilities Claims Liabilities
refinancing operations 650
Banknotes 506 refinancing operations 550
Banknotes 506current account balances 50
current account balances 50
tarGet2 20 adjustment of banknotes in circulation 114