23
Monitoring and control of drinking water quality Selection of key-parameters Techneau February 2007
Monitoring and control of drinking water quality Selection of key-parameters
Techneau February 2007
© 2006 TECHNEAU TECHNEAU is an Integrated Project Funded by the European Commission under the Sixth Framework Programme, Sustainable Development, Global Change and Ecosystems Thematic Priority Area (contractnumber 018320). All rights reserved. No part of this book may be reproduced, stored in a database or retrieval system, or published, in any form or in any way, electronically, mechanically, by print, photoprint, microfilm or any other means without prior written permission from the publisher
Monitoring and control of drinking water quality Selection of key-parameters
Techneau February 2007
This report is: PU = Public
Colofon
Title Monitoring and control of drinking water quality – Selection of key-parameters Author(s) Margreet Mons, Beate Hambsch, Frank Sacher Quality Assurance All WA 3 partners Deliverable number D 3.1.1 and D 3.2.2
Monitoring and control of drinking water quality © TECHNEAU - 1 - February 2007
Summary
Monitoring and control technologies are indispensable for the production of safe drinking water. They allow for the surveillance of source water quality and the detection of biological and chemical threats, thus defining the boundary conditions for the subsequent treatment and providing early-warning in case of unexpected contaminations. They are mandatory for the permanent control of the treatment process and the efficacy of each single treatment step, and they safeguard the high quality of finished water. Furthermore, appropriate analytical techniques are indispensable for the detection of changes in water quality during distribution and for monitoring drinking water quality at consumers’ tap. Reliable monitoring technologies contribute to a large extent to the consumers’ trust in a high drinking water quality. This report handles about different locations and purposes in which monitoring and control technologies need to be applied and the respective biological and chemical water quality parameters that provide essential information for water suppliers. The following purposes for water quality monitoring are considered:
- Catchment characterisation - Source water characterisation - Performance of treatment technologies - Overall treatment effect/water quality status (before entering
distribution network) - Detection of quality changes during distribution - Monitoring of water quality at consumers’ tap
For each purpose tables with selected microbiological and chemical key-parameters are presented, together with the criteria for selection. Criteria for selection were:
A. Health-related parameter B. Parameter listed in EU Drinking Water Directive 98/83/EC (DWD). C. Parameter for process control D. Aesthetic parameter E. Early-warning parameter F. Emerging water quality parameter (usually not new parameters, but
recently emerged as being of interest). At the end of the report all tables have been combined into one major monitoring table for all purposes.
Monitoring and control of drinking water quality © TECHNEAU - 2 - February 2007
Contents
Summary 1
Contents 2
1 Introduction 3
2 Method 4 2.1 Purpose for monitoring 4 2.2 Criteria for selection of parameters 5
3 Selection of key-parameters 6 3.1 Catchment characterisation 6 3.2 Source water characterisation 6 3.3 Monitoring of performance of treatment technologies 7 3.4 Overall treatment effect/water quality status before entering distribution network 16 3.5 Detection of quality changes during distribution 17 3.6 Safeguarding water quality at consumers’ tap 18 3.7 Overall results 18
Monitoring and control of drinking water quality © TECHNEAU - 3 - February 2007
1 Introduction
Monitoring and control technologies are indispensable for the production of safe drinking water. They allow for the surveillance of source water quality and the detection of biological and chemical threats, thus defining the boundary conditions for the subsequent treatment and providing early-warning in case of unexpected contaminations. They are mandatory for the permanent control of the treatment process and the efficacy of each single treatment step, and they safeguard the high quality of finished water. Furthermore, appropriate analytical techniques are indispensable for the detection of changes in water quality during distribution and for monitoring drinking water quality at consumers’ tap. Reliable monitoring technologies contribute to a large extent to the consumers’ trust in a high drinking water quality. Following the overall objective of the TECHNEAU project, the major objective of WA 3 is to provide a set of analytical techniques and methods that ensure the provision of safe high quality drinking water that has the trust of the consumers. Existing monitoring technologies will be evaluated according to their suitability for application in controlling water quality in the whole drinking water production process. Evaluation criteria will not only be analytical parameters like sensitivity or reproducibility but will include criteria like ease-of-use, robustness, maintenance, and costs. Latest results from ongoing research projects in this field will be followed and will also be included in the evaluation process. In addition to this, new and innovative monitoring technologies like effect-related DNA-arrays or electronic nose technology will be developed, optimized and tested. The current report was produced within WP 3.1 of the TECHNEAU project and describes ‘fields of application’ and ‘key-parameters for water quality control’. It will handle about different locations and purposes in which monitoring and control technologies need to be applied and the respective biological and chemical water quality parameters that provide essential information for water suppliers.
Monitoring and control of drinking water quality © TECHNEAU - 4 - February 2007
2 Method
2.1 Purpose for monitoring The parameters that are a priority for monitoring and the analytical tools that can be applied for this purpose are highly dependent on the nature of the supply system that is considered. What kind of water is used as source: surface water from a densely populated area, or well protected deep groundwater? What treatment steps are applied and in what condition is the distribution system? These aspects will influence the requirements and possibilities for monitoring and control. To select key-parameters for water quality monitoring, the first question is about the purpose for monitoring. The purpose will then determine what key-parameters need to be monitored. Of course the prime purpose of monitoring is to safeguard water quality and to prevent actual and perceived health risks. However, depending on point in the treatment process different parameters are relevant to measure. Removal efficiencies of treatment steps for certain compounds need also to be taken into consideration in determining the need to monitor. As can be seen below, the purpose of monitoring is closely related to the location of monitoring. Within this report, the following purposes for water quality monitoring are considered:
- Catchment characterisation - Source water characterisation - Performance of treatment technologies - Overall treatment effect/water quality status (before entering
distribution network) - Detection of quality changes during distribution - Monitoring of water quality at consumers’ tap
In chapter 3, tables with selected key-parameters will be presented for each purpose. Both microbiological and chemical parameters are included therein. It should be noted that these tables have been developed with the focus on what should at least be routinely monitored and not on what could be monitored. For instance, if certain pollutants are found to be present in the source water, the performance of the treatment technologies applied in that specific situation needs to be monitored as well. However as the level of contamination will vary within supplies and between supplies, no general statements can be made at this moment. In addition it should be emphasized that in this report no choice is made regarding the way of analysis that should or could be used. If, for instance, organic micropollutants need to be monitored this can be done with several techniques (HPLC, MS, effect tests etc.). The choice for the analytical technique to be used will be made in WP 3.1.3 and 3.1.4 and reported separately in a later stage of the TECHNEAU project.
Monitoring and control of drinking water quality © TECHNEAU - 5 - February 2007
The selection of microbiological parameters is based on a table in the WHO book “Assessing microbial safety of drinking water: Improving approaches and methods” and a table in the WEKNOW report (3rd Expert Working Group Microbial Quality: Indicators, 17-18/03/2005), but the tables have been adapted according to the special focus of this report. The parameters included in the tables are general by nature. Depending on the special situation of a water supplier and the results of previous monitoring programmes, additional parameters could be of relevance and should be included in the monitoring. Monitoring frequencies will not be discussed in this report as this is not the main objective of WP 3.1. At the end of the TECHNEAU project, when the relevant monitoring technologies have been identified, some examples for defined scenarios will be given on how to work with these tables (for example for small groundwater supplies, or for systems comprising different treatment steps).
2.2 Criteria for selection of parameters The key-parameters in the following tables have been selected according to several criteria. For each parameter the relevant criteria for selection are indicated in the tables. A group of parameters was classified according to a given criterion if at least one member of the group fulfils this criterion (e.g. pesticides are classified as “health-related parameter” as some pesticides fulfil this criterion). The criteria for selection of parameters were:
A. Health-related parameter B. Parameter listed in EU Drinking Water Directive 98/83/EC (DWD).
The EU DWD is the only legislation that was taken into account. National DWDs and the Water Framework Directive (WFD) were left out.
C. Parameter for process control D. Aesthetic parameter E. Early-warning parameter F. Emerging water quality parameter. Usually these are not new
parameters, but they have recently emerged as being of interest. Emerging parameters are not regulated in the DWD.
Monitoring and control of drinking water quality © TECHNEAU - 6 - February 2007
3 Selection of key-parameters
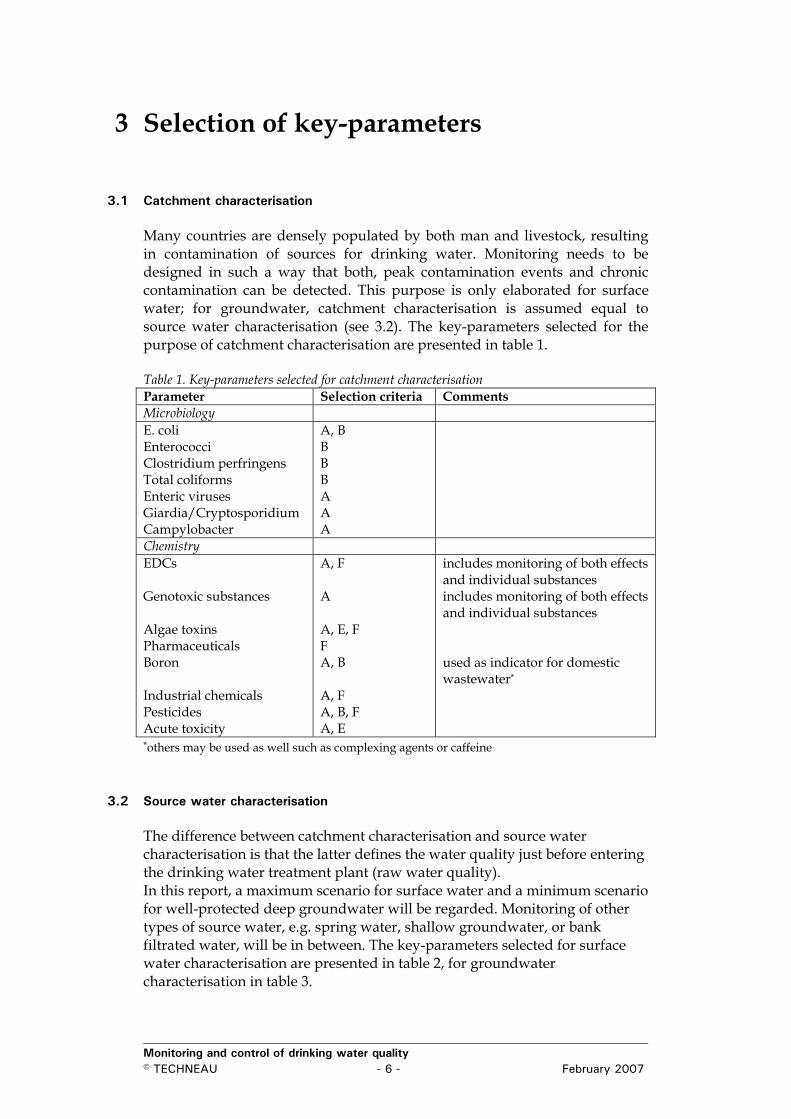
3.1 Catchment characterisation Many countries are densely populated by both man and livestock, resulting in contamination of sources for drinking water. Monitoring needs to be designed in such a way that both, peak contamination events and chronic contamination can be detected. This purpose is only elaborated for surface water; for groundwater, catchment characterisation is assumed equal to source water characterisation (see 3.2). The key-parameters selected for the purpose of catchment characterisation are presented in table 1. Table 1. Key-parameters selected for catchment characterisation Parameter Selection criteria Comments Microbiology E. coli Enterococci Clostridium perfringens Total coliforms Enteric viruses Giardia/Cryptosporidium Campylobacter
A, B B B B A A A
Chemistry EDCs Genotoxic substances Algae toxins Pharmaceuticals Boron Industrial chemicals Pesticides Acute toxicity
A, F A A, E, F F A, B A, F A, B, F A, E
includes monitoring of both effects and individual substances includes monitoring of both effects and individual substances used as indicator for domestic wastewater*
*others may be used as well such as complexing agents or caffeine
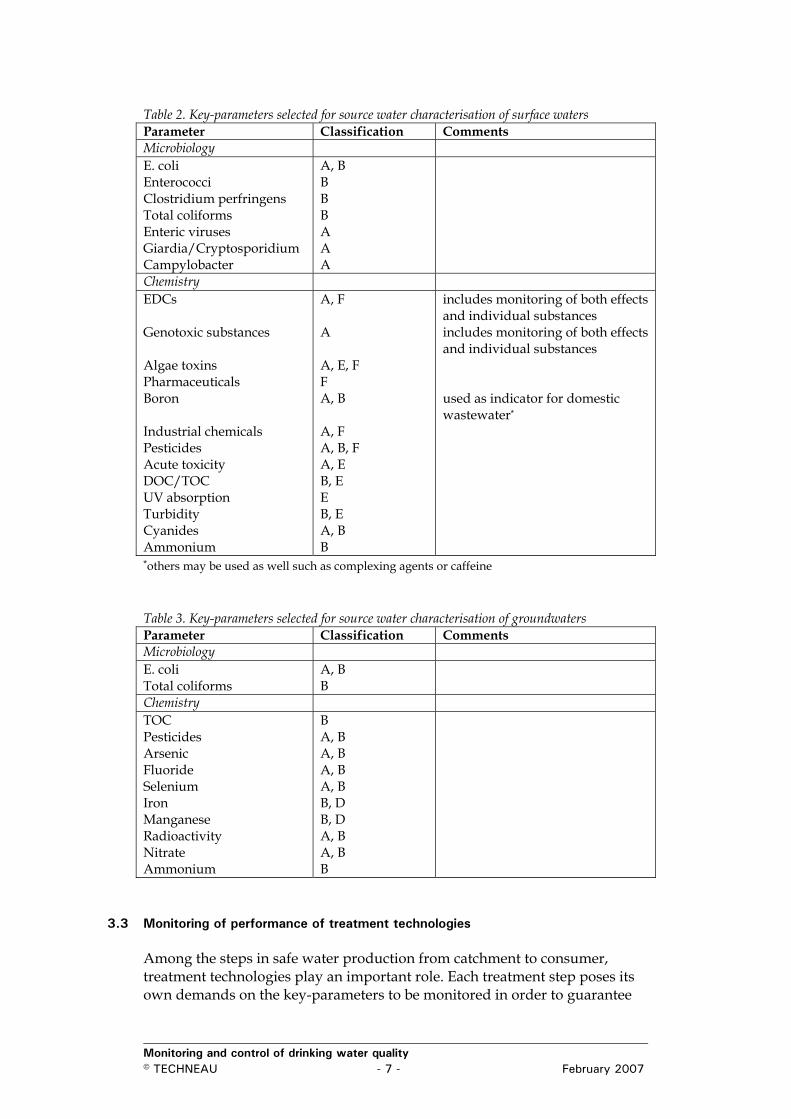
3.2 Source water characterisation The difference between catchment characterisation and source water characterisation is that the latter defines the water quality just before entering the drinking water treatment plant (raw water quality). In this report, a maximum scenario for surface water and a minimum scenario for well-protected deep groundwater will be regarded. Monitoring of other types of source water, e.g. spring water, shallow groundwater, or bank filtrated water, will be in between. The key-parameters selected for surface water characterisation are presented in table 2, for groundwater characterisation in table 3.
Monitoring and control of drinking water quality © TECHNEAU - 7 - February 2007
Table 2. Key-parameters selected for source water characterisation of surface waters Parameter Classification Comments Microbiology E. coli Enterococci Clostridium perfringens Total coliforms Enteric viruses Giardia/Cryptosporidium Campylobacter
A, B B B B A A A
Chemistry EDCs Genotoxic substances Algae toxins Pharmaceuticals Boron Industrial chemicals Pesticides Acute toxicity DOC/TOC UV absorption Turbidity Cyanides Ammonium
A, F A A, E, F F A, B A, F A, B, F A, E B, E E B, E A, B B
includes monitoring of both effects and individual substances includes monitoring of both effects and individual substances used as indicator for domestic wastewater*
*others may be used as well such as complexing agents or caffeine Table 3. Key-parameters selected for source water characterisation of groundwaters Parameter Classification Comments Microbiology E. coli Total coliforms
A, B B
Chemistry TOC Pesticides Arsenic Fluoride Selenium Iron Manganese Radioactivity Nitrate Ammonium
B A, B A, B A, B A, B B, D B, D A, B A, B B
3.3 Monitoring of performance of treatment technologies Among the steps in safe water production from catchment to consumer, treatment technologies play an important role. Each treatment step poses its own demands on the key-parameters to be monitored in order to guarantee
Monitoring and control of drinking water quality © TECHNEAU - 8 - February 2007
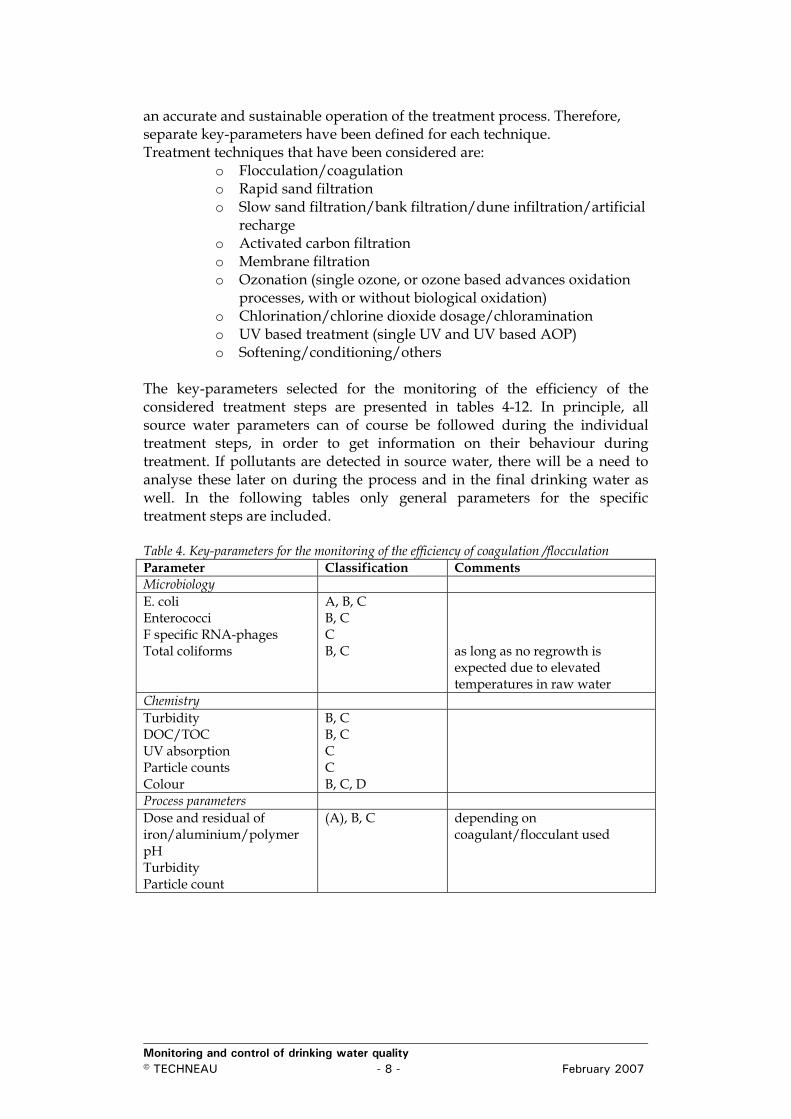
an accurate and sustainable operation of the treatment process. Therefore, separate key-parameters have been defined for each technique. Treatment techniques that have been considered are:
o Flocculation/coagulation o Rapid sand filtration o Slow sand filtration/bank filtration/dune infiltration/artificial
recharge o Activated carbon filtration o Membrane filtration o Ozonation (single ozone, or ozone based advances oxidation
processes, with or without biological oxidation) o Chlorination/chlorine dioxide dosage/chloramination o UV based treatment (single UV and UV based AOP) o Softening/conditioning/others
The key-parameters selected for the monitoring of the efficiency of the considered treatment steps are presented in tables 4-12. In principle, all source water parameters can of course be followed during the individual treatment steps, in order to get information on their behaviour during treatment. If pollutants are detected in source water, there will be a need to analyse these later on during the process and in the final drinking water as well. In the following tables only general parameters for the specific treatment steps are included. Table 4. Key-parameters for the monitoring of the efficiency of coagulation /flocculation Parameter Classification Comments Microbiology E. coli Enterococci F specific RNA-phages Total coliforms
A, B, C B, C C B, C
as long as no regrowth is expected due to elevated temperatures in raw water
Chemistry Turbidity DOC/TOC UV absorption Particle counts Colour
B, C B, C C C B, C, D
Process parameters Dose and residual of iron/aluminium/polymer pH Turbidity Particle count
(A), B, C depending on coagulant/flocculant used
Monitoring and control of drinking water quality © TECHNEAU - 9 - February 2007
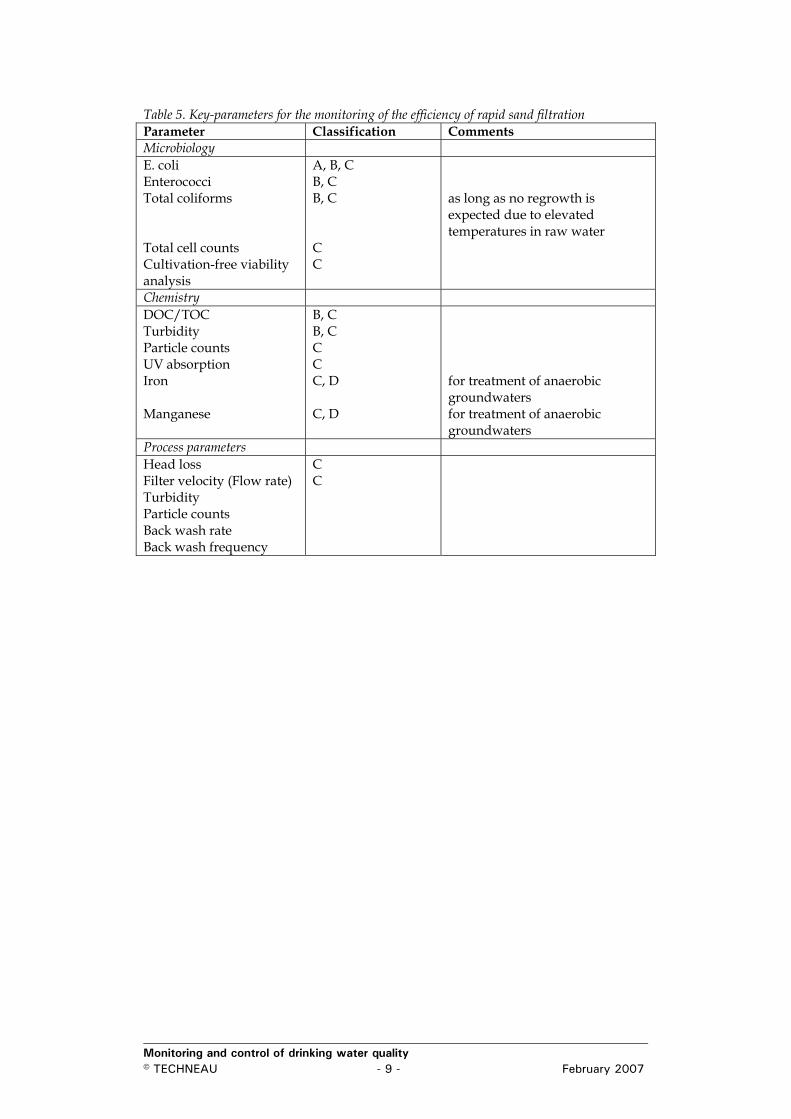
Table 5. Key-parameters for the monitoring of the efficiency of rapid sand filtration Parameter Classification Comments Microbiology E. coli Enterococci Total coliforms Total cell counts Cultivation-free viability analysis
A, B, C B, C B, C C C
as long as no regrowth is expected due to elevated temperatures in raw water
Chemistry DOC/TOC Turbidity Particle counts UV absorption Iron Manganese
B, C B, C C C C, D C, D
for treatment of anaerobic groundwaters for treatment of anaerobic groundwaters
Process parameters Head loss Filter velocity (Flow rate) Turbidity Particle counts Back wash rate Back wash frequency
C C
Monitoring and control of drinking water quality © TECHNEAU - 10 - February 2007
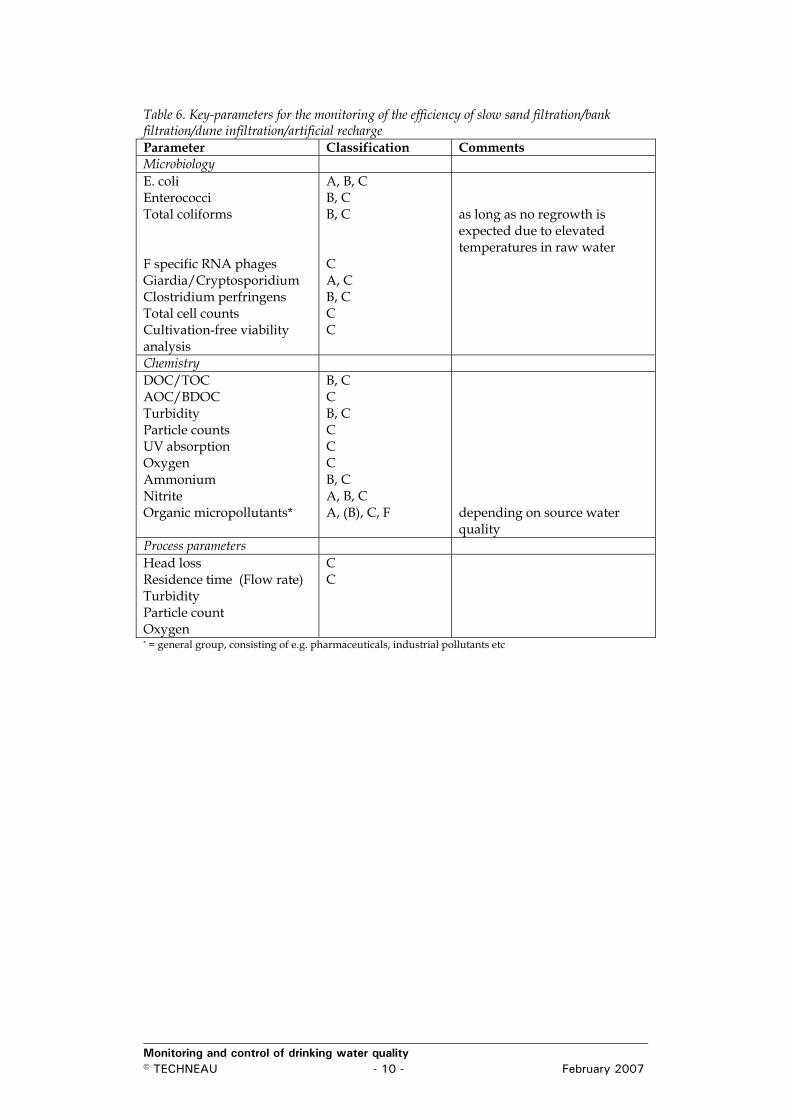
Table 6. Key-parameters for the monitoring of the efficiency of slow sand filtration/bank filtration/dune infiltration/artificial recharge Parameter Classification Comments Microbiology E. coli Enterococci Total coliforms F specific RNA phages Giardia/Cryptosporidium Clostridium perfringens Total cell counts Cultivation-free viability analysis
A, B, C B, C B, C C A, C B, C C C
as long as no regrowth is expected due to elevated temperatures in raw water
Chemistry DOC/TOC AOC/BDOC Turbidity Particle counts UV absorption Oxygen Ammonium Nitrite Organic micropollutants*
B, C C B, C C C C B, C A, B, C A, (B), C, F
depending on source water quality
Process parameters Head loss Residence time (Flow rate) Turbidity Particle count Oxygen
C C
* = general group, consisting of e.g. pharmaceuticals, industrial pollutants etc
Monitoring and control of drinking water quality © TECHNEAU - 11 - February 2007
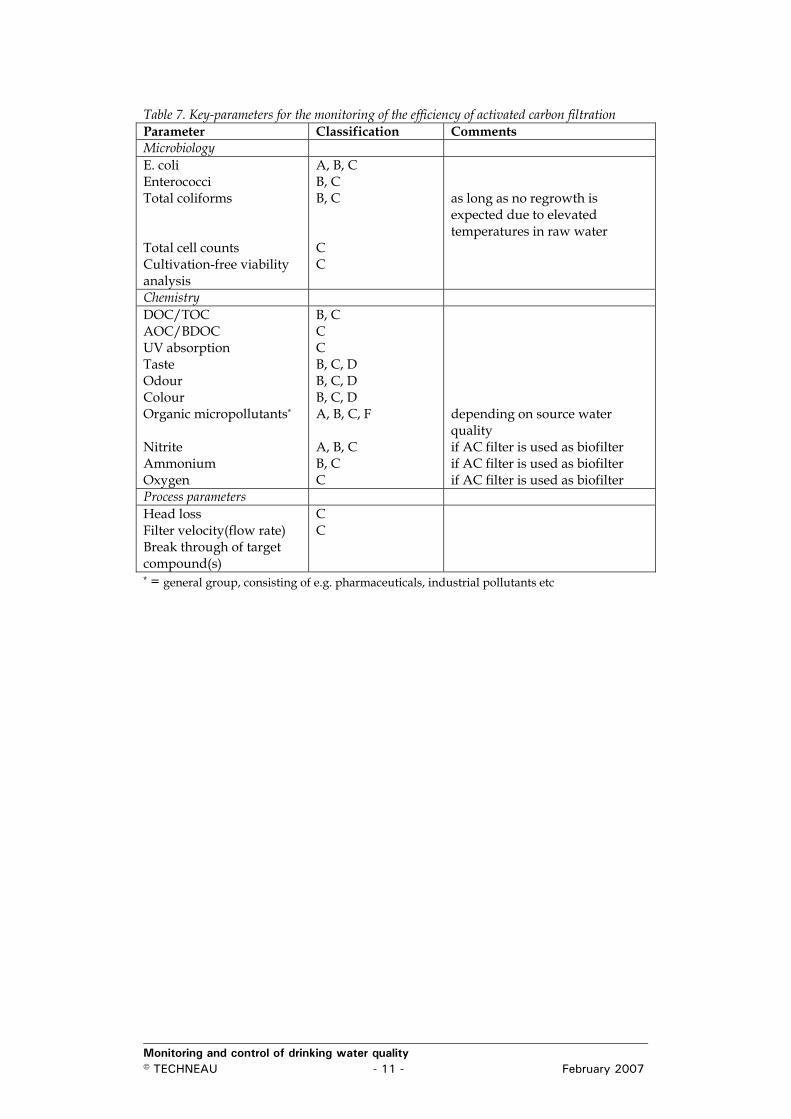
Table 7. Key-parameters for the monitoring of the efficiency of activated carbon filtration Parameter Classification Comments Microbiology E. coli Enterococci Total coliforms Total cell counts Cultivation-free viability analysis
A, B, C B, C B, C C C
as long as no regrowth is expected due to elevated temperatures in raw water
Chemistry DOC/TOC AOC/BDOC UV absorption Taste Odour Colour Organic micropollutants*
Nitrite Ammonium Oxygen
B, C C C B, C, D B, C, D B, C, D A, B, C, F A, B, C B, C C
depending on source water quality if AC filter is used as biofilter if AC filter is used as biofilter if AC filter is used as biofilter
Process parameters Head loss Filter velocity(flow rate) Break through of target compound(s)
C C
* = general group, consisting of e.g. pharmaceuticals, industrial pollutants etc
Monitoring and control of drinking water quality © TECHNEAU - 12 - February 2007
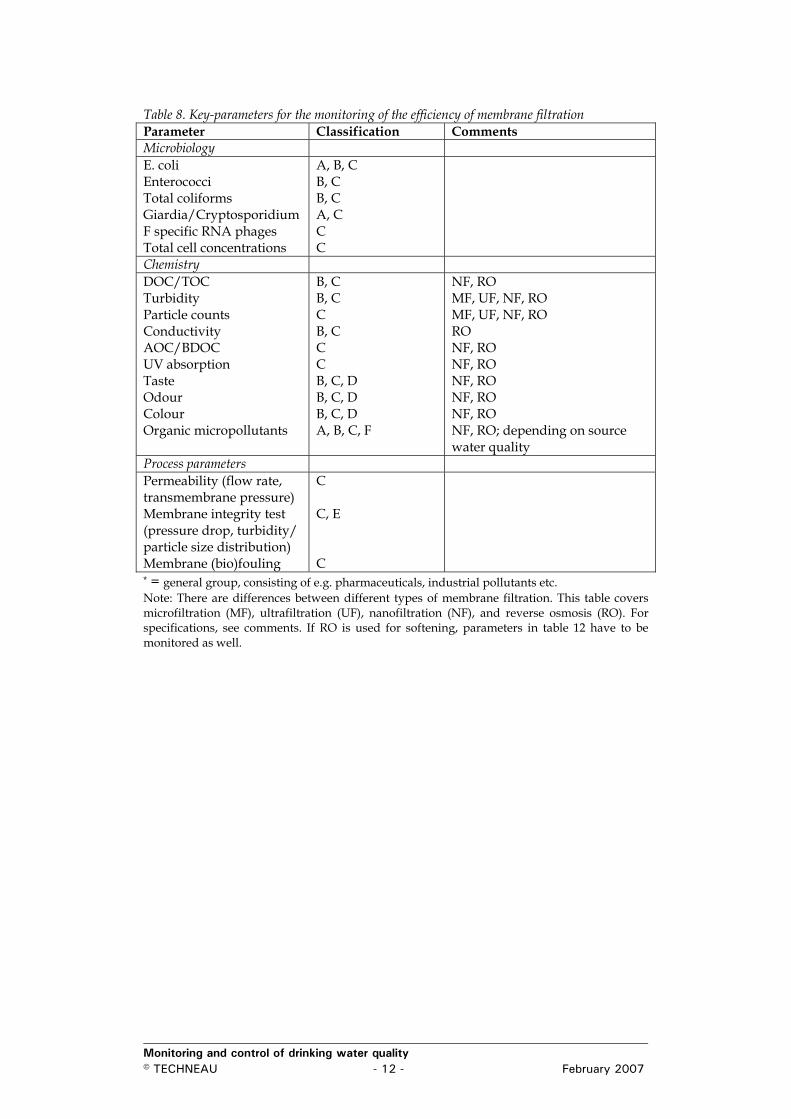
Table 8. Key-parameters for the monitoring of the efficiency of membrane filtration Parameter Classification Comments Microbiology E. coli Enterococci Total coliforms Giardia/Cryptosporidium F specific RNA phages Total cell concentrations
A, B, C B, C B, C A, C C C
Chemistry DOC/TOC Turbidity Particle counts Conductivity AOC/BDOC UV absorption Taste Odour Colour Organic micropollutants
B, C B, C C B, C C C B, C, D B, C, D B, C, D A, B, C, F
NF, RO MF, UF, NF, RO MF, UF, NF, RO RO NF, RO NF, RO NF, RO NF, RO NF, RO NF, RO; depending on source water quality
Process parameters Permeability (flow rate, transmembrane pressure) Membrane integrity test (pressure drop, turbidity/ particle size distribution) Membrane (bio)fouling
C C, E C
* = general group, consisting of e.g. pharmaceuticals, industrial pollutants etc. Note: There are differences between different types of membrane filtration. This table covers microfiltration (MF), ultrafiltration (UF), nanofiltration (NF), and reverse osmosis (RO). For specifications, see comments. If RO is used for softening, parameters in table 12 have to be monitored as well.
Monitoring and control of drinking water quality © TECHNEAU - 13 - February 2007
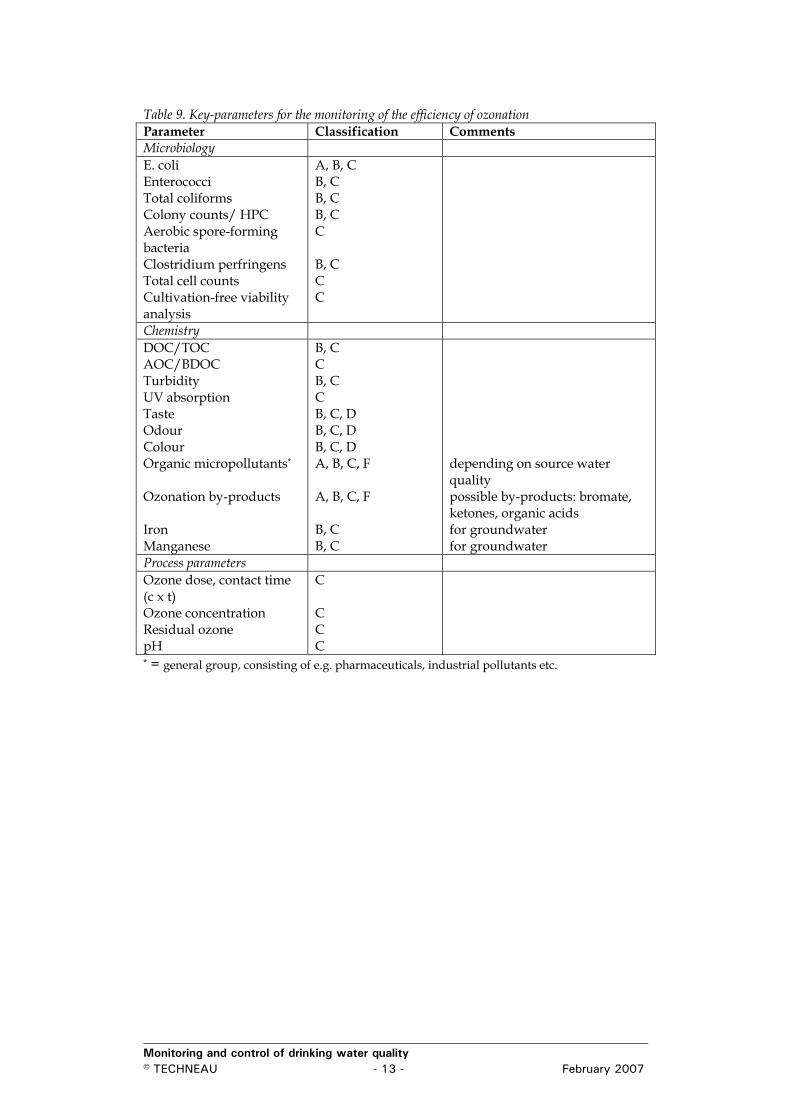
Table 9. Key-parameters for the monitoring of the efficiency of ozonation Parameter Classification Comments Microbiology E. coli Enterococci Total coliforms Colony counts/ HPC Aerobic spore-forming bacteria Clostridium perfringens Total cell counts Cultivation-free viability analysis
A, B, C B, C B, C B, C C B, C C C
Chemistry DOC/TOC AOC/BDOC Turbidity UV absorption Taste Odour Colour Organic micropollutants*
Ozonation by-products Iron Manganese
B, C C B, C C B, C, D B, C, D B, C, D A, B, C, F A, B, C, F B, C B, C
depending on source water quality possible by-products: bromate, ketones, organic acids for groundwater for groundwater
Process parameters Ozone dose, contact time (c x t) Ozone concentration Residual ozone pH
C C C C
* = general group, consisting of e.g. pharmaceuticals, industrial pollutants etc.
Monitoring and control of drinking water quality © TECHNEAU - 14 - February 2007
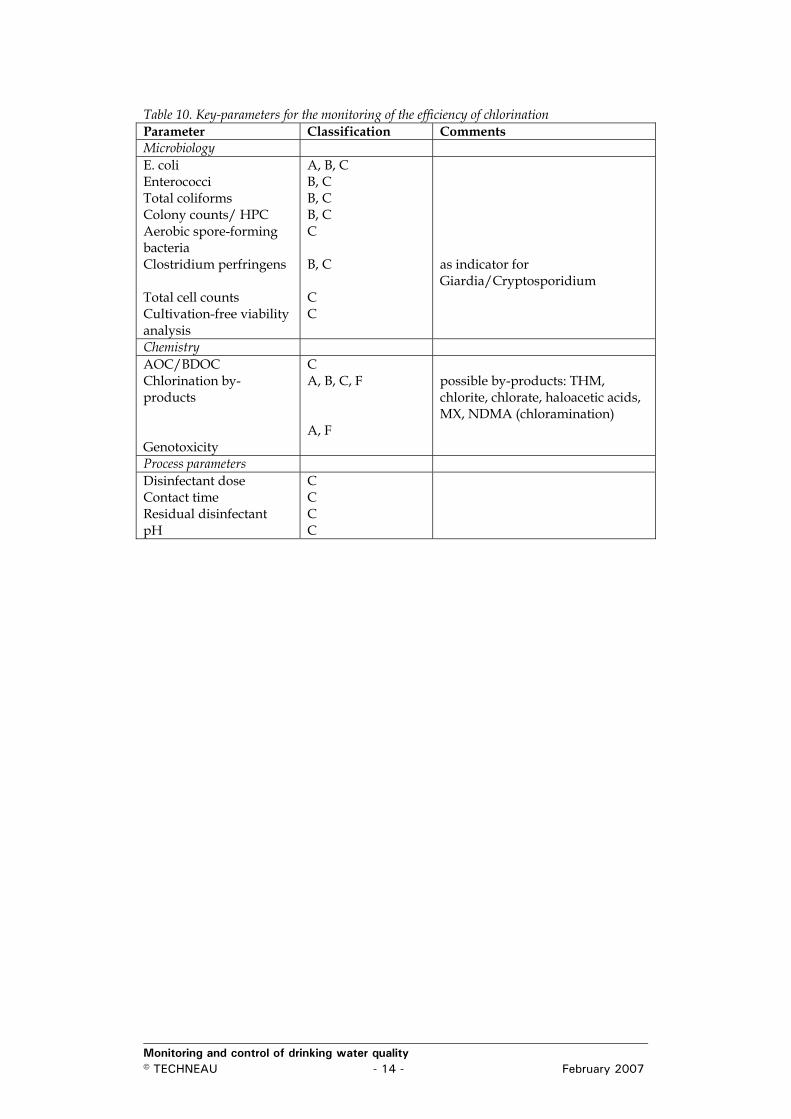
Table 10. Key-parameters for the monitoring of the efficiency of chlorination Parameter Classification Comments Microbiology E. coli Enterococci Total coliforms Colony counts/ HPC Aerobic spore-forming bacteria Clostridium perfringens Total cell counts Cultivation-free viability analysis
A, B, C B, C B, C B, C C B, C C C
as indicator for Giardia/Cryptosporidium
Chemistry AOC/BDOC Chlorination by-products Genotoxicity
C A, B, C, F A, F
possible by-products: THM, chlorite, chlorate, haloacetic acids, MX, NDMA (chloramination)
Process parameters Disinfectant dose Contact time Residual disinfectant pH
C C C C
Monitoring and control of drinking water quality © TECHNEAU - 15 - February 2007
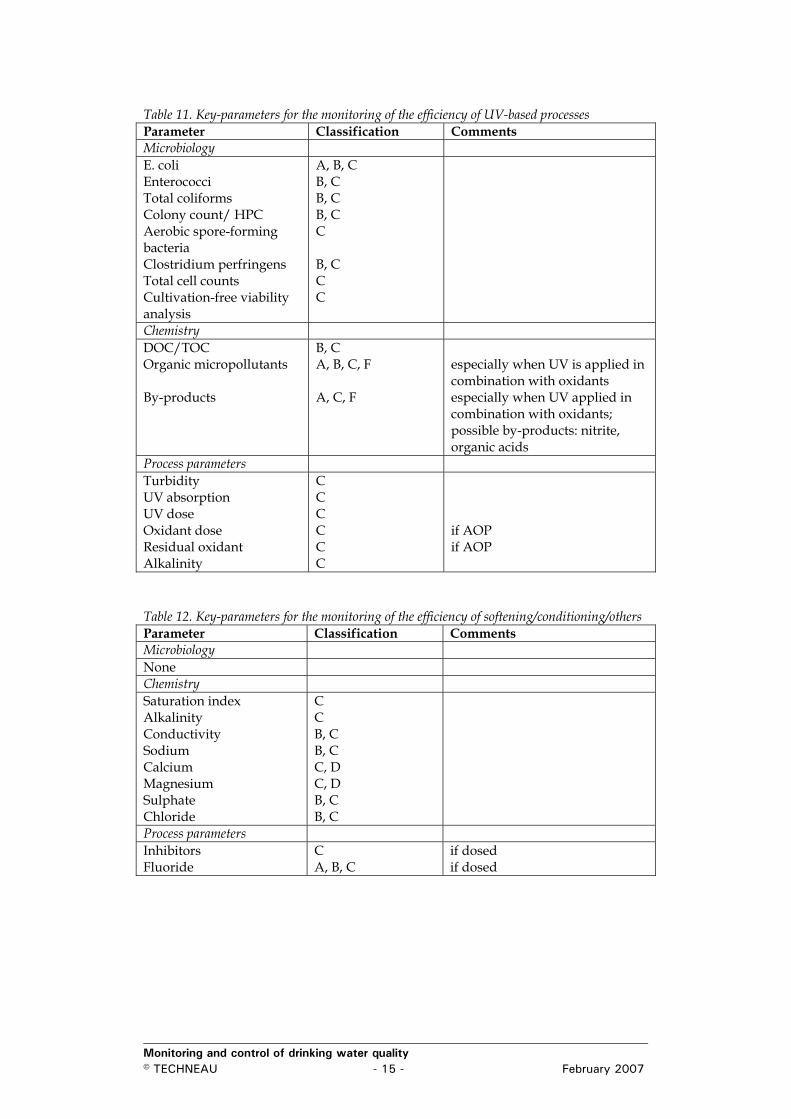
Table 11. Key-parameters for the monitoring of the efficiency of UV-based processes Parameter Classification Comments Microbiology E. coli Enterococci Total coliforms Colony count/ HPC Aerobic spore-forming bacteria Clostridium perfringens Total cell counts Cultivation-free viability analysis
A, B, C B, C B, C B, C C B, C C C
Chemistry DOC/TOC Organic micropollutants By-products
B, C A, B, C, F A, C, F
especially when UV is applied in combination with oxidants especially when UV applied in combination with oxidants; possible by-products: nitrite, organic acids
Process parameters Turbidity UV absorption UV dose Oxidant dose Residual oxidant Alkalinity
C C C C C C
if AOP if AOP
Table 12. Key-parameters for the monitoring of the efficiency of softening/conditioning/others Parameter Classification Comments Microbiology None Chemistry Saturation index Alkalinity Conductivity Sodium Calcium Magnesium Sulphate Chloride
C C B, C B, C C, D C, D B, C B, C
Process parameters Inhibitors Fluoride
C A, B, C
if dosed if dosed
Monitoring and control of drinking water quality © TECHNEAU - 16 - February 2007
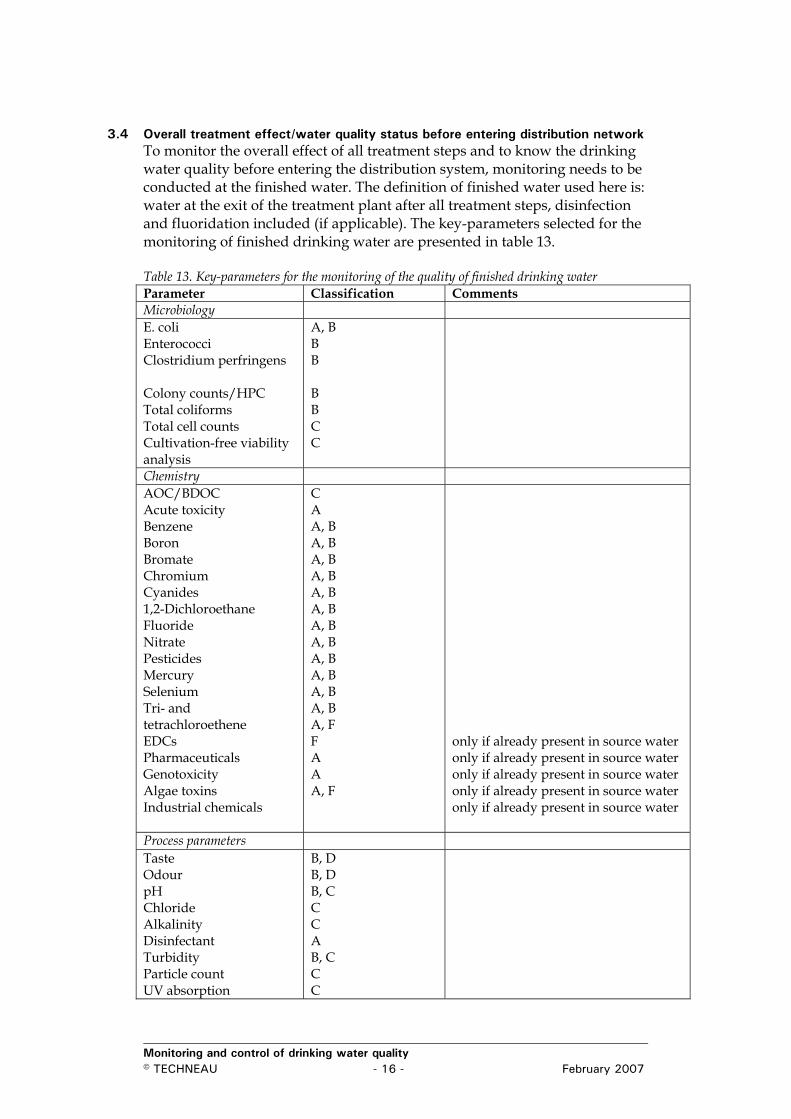
3.4 Overall treatment effect/water quality status before entering distribution network To monitor the overall effect of all treatment steps and to know the drinking water quality before entering the distribution system, monitoring needs to be conducted at the finished water. The definition of finished water used here is: water at the exit of the treatment plant after all treatment steps, disinfection and fluoridation included (if applicable). The key-parameters selected for the monitoring of finished drinking water are presented in table 13. Table 13. Key-parameters for the monitoring of the quality of finished drinking water Parameter Classification Comments Microbiology E. coli Enterococci Clostridium perfringens Colony counts/HPC Total coliforms Total cell counts Cultivation-free viability analysis
A, B B B B B C C
Chemistry AOC/BDOC Acute toxicity Benzene Boron Bromate Chromium Cyanides 1,2-Dichloroethane Fluoride Nitrate Pesticides Mercury Selenium Tri- and tetrachloroethene EDCs Pharmaceuticals Genotoxicity Algae toxins Industrial chemicals
C A A, B A, B A, B A, B A, B A, B A, B A, B A, B A, B A, B A, B A, F F A A A, F
only if already present in source water only if already present in source water only if already present in source water only if already present in source water only if already present in source water
Process parameters Taste Odour pH Chloride Alkalinity Disinfectant Turbidity Particle count UV absorption
B, D B, D B, C C C A B, C C C
Monitoring and control of drinking water quality © TECHNEAU - 17 - February 2007
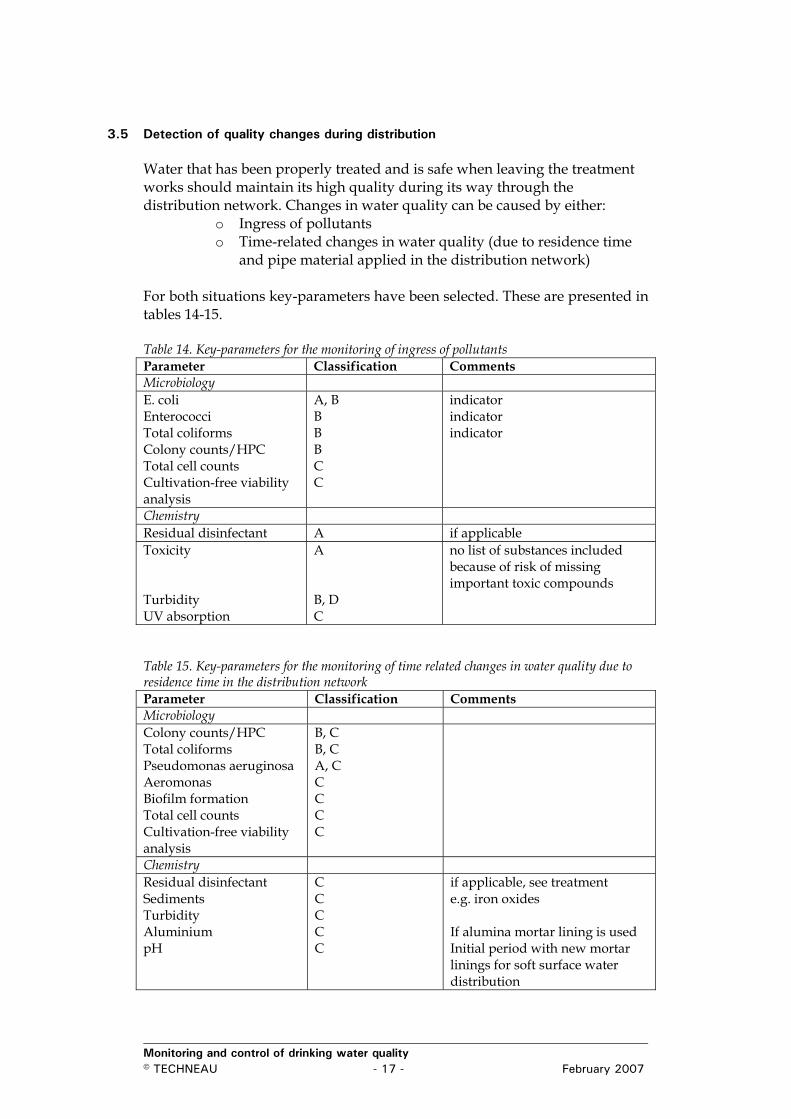
3.5 Detection of quality changes during distribution Water that has been properly treated and is safe when leaving the treatment works should maintain its high quality during its way through the distribution network. Changes in water quality can be caused by either:
o Ingress of pollutants o Time-related changes in water quality (due to residence time
and pipe material applied in the distribution network) For both situations key-parameters have been selected. These are presented in tables 14-15. Table 14. Key-parameters for the monitoring of ingress of pollutants Parameter Classification Comments Microbiology E. coli Enterococci Total coliforms Colony counts/HPC Total cell counts Cultivation-free viability analysis
A, B B B B C C
indicator indicator indicator
Chemistry Residual disinfectant A if applicable Toxicity Turbidity UV absorption
A B, D C
no list of substances included because of risk of missing important toxic compounds
Table 15. Key-parameters for the monitoring of time related changes in water quality due to residence time in the distribution network Parameter Classification Comments Microbiology Colony counts/HPC Total coliforms Pseudomonas aeruginosa Aeromonas Biofilm formation Total cell counts Cultivation-free viability analysis
B, C B, C A, C C C C C
Chemistry Residual disinfectant Sediments Turbidity Aluminium pH
C C C C C
if applicable, see treatment e.g. iron oxides If alumina mortar lining is used Initial period with new mortar linings for soft surface water distribution
Monitoring and control of drinking water quality © TECHNEAU - 18 - February 2007
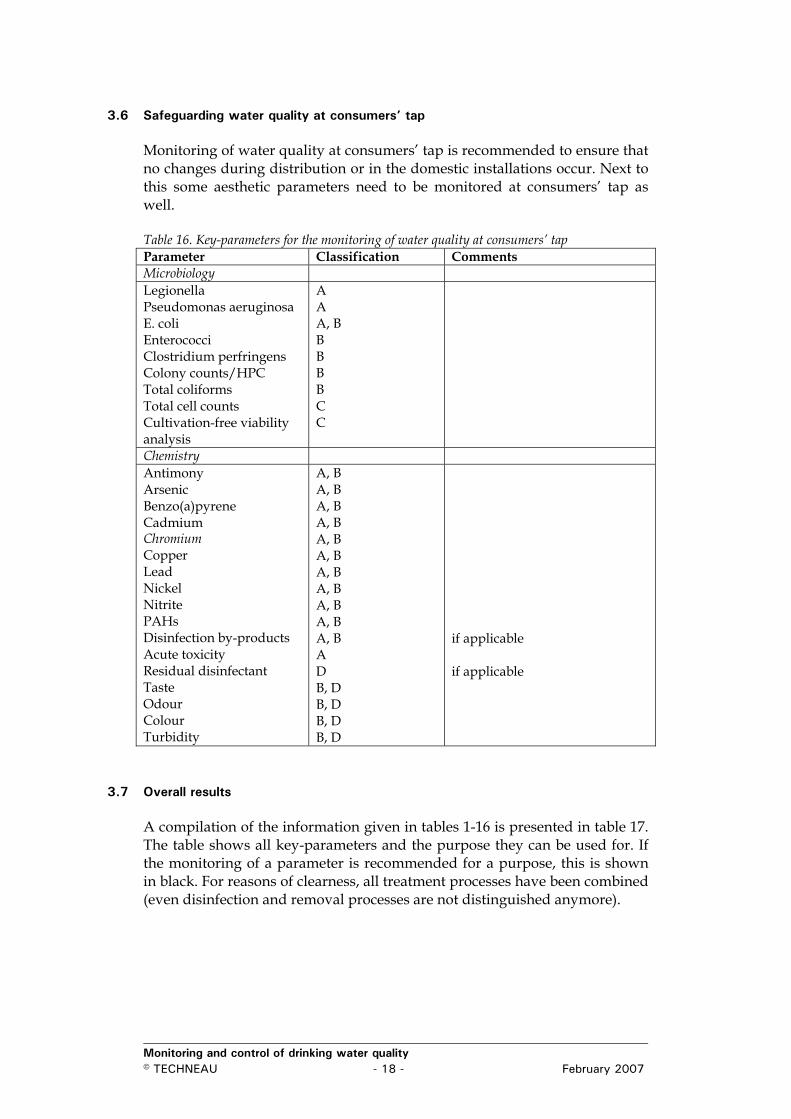
3.6 Safeguarding water quality at consumers’ tap Monitoring of water quality at consumers’ tap is recommended to ensure that no changes during distribution or in the domestic installations occur. Next to this some aesthetic parameters need to be monitored at consumers’ tap as well. Table 16. Key-parameters for the monitoring of water quality at consumers’ tap Parameter Classification Comments Microbiology Legionella Pseudomonas aeruginosa E. coli Enterococci Clostridium perfringens Colony counts/HPC Total coliforms Total cell counts Cultivation-free viability analysis
A A A, B B B B B C C
Chemistry Antimony Arsenic Benzo(a)pyrene Cadmium Chromium Copper Lead Nickel Nitrite PAHs Disinfection by-products Acute toxicity Residual disinfectant Taste Odour Colour Turbidity
A, B A, B A, B A, B A, B A, B A, B A, B A, B A, B A, B A D B, D B, D B, D B, D
if applicable if applicable
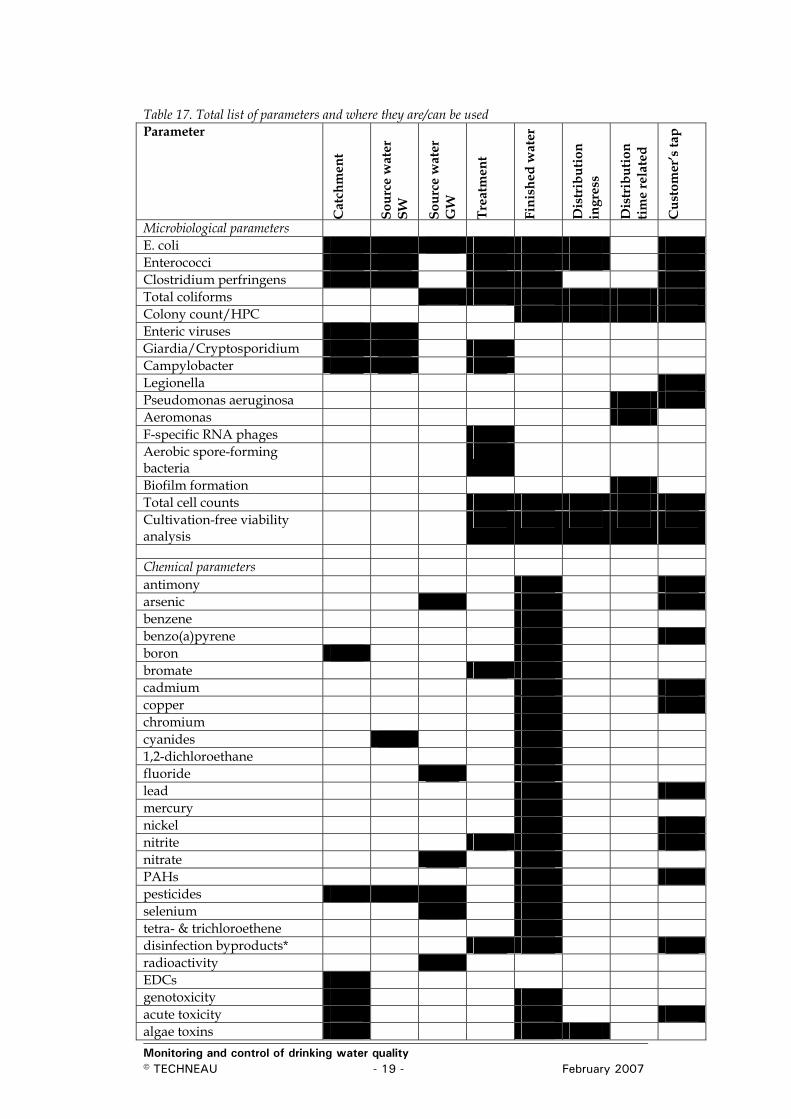
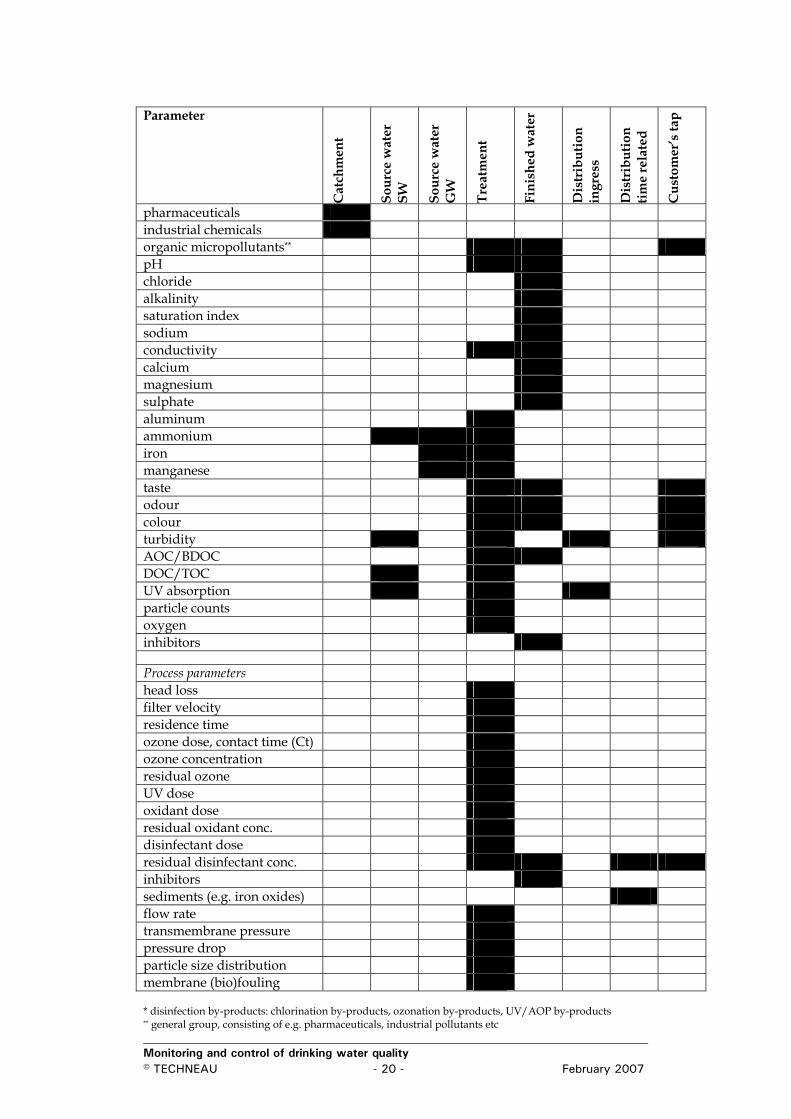
3.7 Overall results A compilation of the information given in tables 1-16 is presented in table 17. The table shows all key-parameters and the purpose they can be used for. If the monitoring of a parameter is recommended for a purpose, this is shown in black. For reasons of clearness, all treatment processes have been combined (even disinfection and removal processes are not distinguished anymore).
Monitoring and control of drinking water quality © TECHNEAU - 19 - February 2007
Table 17. Total list of parameters and where they are/can be used Parameter C
atch
men
t
Sour
ce w
ater
SW
Sour
ce w
ater
G
W
Trea
tmen
t
Fini
shed
wat
er
Dis
trib
utio
n in
gres
s
Dis
trib
utio
n tim
e re
late
d
Cus
tom
er’s
tap
Microbiological parameters E. coli Enterococci Clostridium perfringens Total coliforms Colony count/HPC Enteric viruses Giardia/Cryptosporidium Campylobacter Legionella Pseudomonas aeruginosa Aeromonas F-specific RNA phages Aerobic spore-forming bacteria
Biofilm formation Total cell counts Cultivation-free viability analysis
Chemical parameters antimony arsenic benzene benzo(a)pyrene boron bromate cadmium copper chromium cyanides 1,2-dichloroethane fluoride lead mercury nickel nitrite nitrate PAHs pesticides selenium tetra- & trichloroethene disinfection byproducts* radioactivity EDCs genotoxicity acute toxicity algae toxins
Monitoring and control of drinking water quality © TECHNEAU - 20 - February 2007
Parameter C
atch
men
t
Sour
ce w
ater
SW
Sour
ce w
ater
G
W
Trea
tmen
t
Fini
shed
wat
er
Dis
trib
utio
n in
gres
s
Dis
trib
utio
n tim
e re
late
d
Cus
tom
er’s
tap
pharmaceuticals industrial chemicals organic micropollutants** pH chloride alkalinity saturation index sodium conductivity calcium magnesium sulphate aluminum ammonium iron manganese taste odour colour turbidity AOC/BDOC DOC/TOC UV absorption particle counts oxygen inhibitors Process parameters head loss filter velocity residence time ozone dose, contact time (Ct) ozone concentration residual ozone UV dose oxidant dose residual oxidant conc. disinfectant dose residual disinfectant conc. inhibitors sediments (e.g. iron oxides) flow rate transmembrane pressure pressure drop particle size distribution membrane (bio)fouling * disinfection by-products: chlorination by-products, ozonation by-products, UV/AOP by-products ** general group, consisting of e.g. pharmaceuticals, industrial pollutants etc


