65
Monitoring and Evaluation Plan Nicaragua (3/23/2010)
Monitoring and Evaluation Plan
Nicaragua
(3/23/2010)

2
Monitoring and Evaluation Plan: Nicaragua Program
The M&E Plan contains the following sections:
1. Introduction ..................................................................................................................................... 3 2. Summary of Program and Project Activities ................................................................................... 3 3. Program Impact .............................................................................................................................. 4
(a) Economic Impact ............................................................................................................................ 4 (b) Program Logic ................................................................................................................................ 5 (c) Beneficiaries ................................................................................................................................... 6 (d) Assumptions and Risks .................................................................................................................. 7
4. Monitoring Component ................................................................................................................... 8 (a) Monitoring Indicators ...................................................................................................................... 9 (b) Baselines and Targets .................................................................................................................. 17 (c) Disaggregating Data by Gender, Age, and Income ...................................................................... 17 (d) Performance Assessments and Reports ...................................................................................... 17 (e) Data Quality Reviews ................................................................................................................... 17
5. Software for Monitoring and Evaluation ........................................................................................ 18 6. Evaluation Component ................................................................................................................. 18
(a) Intermediate and Final Evaluations .............................................................................................. 18 (b) Qualitative Evaluation ................................................................................................................... 31 (c) Other Evaluations ......................................................................................................................... 32
7. MCA-Nicaragua Staff M&E Responsibilities ................................................................................. 32 (a) M&E Director and M&E Specialist Responsibilities ...................................................................... 33
8. Budget ........................................................................................................................................... 34 9. Annexes ................................................................................................................................................... 35 Annex I: Indicator Tracking Table ............................................................................................................... 35 Annex II: M&E Work Plan ............................................................................................................................. 44 Annex III: Changes to the M&E Plan ........................................................................................................... 47
3
Introduction
The Monitoring and Evaluation (M&E) plan is an essential and integral component of any MCC program. The Nicaragua M&E Plan serves the following functions:
- Describes the goal of the Program and explains how the MCC and MCA-Nicaragua will monitor Program progress and benefits, in order to determine whether the Program is achieving its intended results.
- Serves as a guide for Program implementation and management, so that MCA-Nicaragua staff and Board of Directors, as well as Implementing Entities, understand the results they are responsible for achieving; and beneficiaries and stakeholders are aware of progress towards those results.
- Provides a framework that will alert stakeholders to problems during the Program implementation and provides the basis for making any needed Program adjustments.
- Describes impact evaluations that assess the causal relationship between the Program and its Goal.
This M&E Plan is considered a binding document; any failure to comply with its stipulations could result in suspension of disbursements. It may be modified or amended as necessary only with the approval of MCC, as long as it remains consistent with the requirements of the Compact and other relevant supplemental agreements.
1. Summary of Program and Project Activities Nicaragua’s proposal identified three constraints to growth: insecure property rights, poor transportation infrastructure, and low-profit agriculture. The program aims to reduce poverty and encourage economic growth by addressing these three constraints. The final impact evaluation will examine the program’s effect on raising income, i.e. economic growth, in the region. Specifically, the five-year, $175-million MCA-Nicaragua Program has the following objectives:
- reduce transportation costs between Leon/Chinandega and domestic, regional, and global markets;
- increase investment by strengthening property rights; and - increase value-added and productivity of farms and enterprises.
Three Projects will be implemented by MCA-Nicaragua to accomplish the objectives above: (a) The Transportation Project includes two activities:
(i) rehabilitation of three segments of the N-I highway, totaling 18 km, in the Pacific Corridor;
(ii) rehabilitation of up to 49 km of secondary roads; and The NI Highway activity and the technical assistance to the Ministry of Transportation and Infrastructure were terminated in June 2009. (b) The Property Regularization Project included six activities, which were also terminated in June 2009:
(i) Institutional Capacity Building: Provide technical support to government institutions to implement and sustain land tenure regularization reforms in León.
(ii) Cadastral Mapping: Conduct area-wide cadastral mapping in León to obtain current property descriptions to be recorded in a geographic information system.
4
(iii) Land Tenure Regularization: Clarify land tenure, dispute resolution, and improve formal documentation of property rights.
(iv) Database Installation: Link municipal and national registry and cadastral databases in León through the installation of the Cadastral and Registry Information System (SIICAR in Spanish).
(v) Protected Areas Demarcation: Demarcate and legally validate the boundaries of four environmentally-sensitive protected areas, regularize land rights within the perimeter of each, and facilitate the adoption of land use management plans by occupants therein.
(vi) Analysis and Communications: Fund short-term technical assistance, policy analysis and outreach activities to promote the participation, use and sustainability of the improved property registration system.
(c) The Rural Business Development Project will establish a Rural Business Development Project (RBDP) to:
(i) Rural Business Development Services: Expand higher-profit agriculture and agribusiness by providing business development services, disseminating market information, developing improved production techniques;
(ii) Technical and Financial Assistance: To help small- and medium-size farms and agribusinesses transition to higher-profit activities, provide technical and financial assistance to these enterprises, including support that will directly offset certain costs of small farms; and
(iii) Grants to Improve Water Supply for Farming and Forest Production: Based on a watershed management action plan, provide grants to improve the water supply for irrigation and facilitate higher value, sustainable agriculture and forestry in the upper watershed areas of the region.
2. Program Impact
(a) Economic Impact
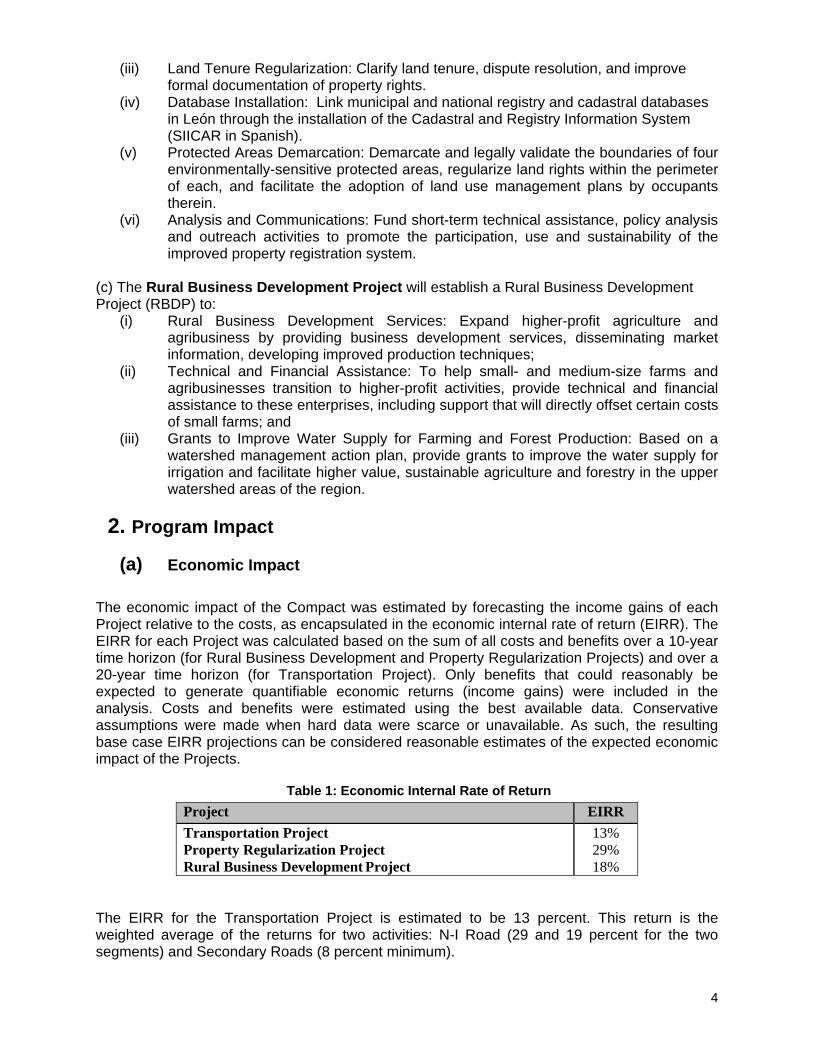
The economic impact of the Compact was estimated by forecasting the income gains of each Project relative to the costs, as encapsulated in the economic internal rate of return (EIRR). The EIRR for each Project was calculated based on the sum of all costs and benefits over a 10-year time horizon (for Rural Business Development and Property Regularization Projects) and over a 20-year time horizon (for Transportation Project). Only benefits that could reasonably be expected to generate quantifiable economic returns (income gains) were included in the analysis. Costs and benefits were estimated using the best available data. Conservative assumptions were made when hard data were scarce or unavailable. As such, the resulting base case EIRR projections can be considered reasonable estimates of the expected economic impact of the Projects.
Table 1: Economic Internal Rate of Return
Project EIRR
Transportation Project 13% Property Regularization Project 29% Rural Business Development Project 18%
The EIRR for the Transportation Project is estimated to be 13 percent. This return is the weighted average of the returns for two activities: N-I Road (29 and 19 percent for the two segments) and Secondary Roads (8 percent minimum).
5
The EIRR for the Rural Business Development Project is estimated to be 18 percent, calculated as a weighted average of the Rural Business Development Project (16%) and Improvement of Water Supply (10%) activities. The specific activities for the improvement of water supply for farming and forest production will be determined over the course of the Program. These activities, however, will be required to achieve at least a 10 % economic internal rate of return. The EIRR for the Property Project is estimated to be 29%.
(b) Program Logic
Transportation Project: Estimates for roads, are based on the direct benefits derived from reduced travel time, reduced vehicle operating costs, and increased traffic use. These economic benefits are easily estimated both ex-ante for Project assessment and ex-post for Project evaluation. Indirect benefits stemming from changes in market prices and improved services, such as education, health, and additional investment stimulated by reduced transport costs have not been included in this calculation. However, changes in market prices and availability of goods will be tracked to have a better understanding of the economic impact of the Transportation Project. A more detailed description of how the Program will impact, including these indirect benefits, is included in the Evaluation Component. Property Regularization Project: Recent studies in Nicaragua show that regularizing property rights through land titling and property registration have been associated with a 30% increase in asset values and a 10% increase in the probability of landholders undertaking additional investments in the property. A clearer definition of property rights through improved land titling is expected to benefit the economy through various channels: by increasing the private returns to investments on land, by improving the ability to use land to leverage credit, by reducing high costs of land related transactions, and by reducing the need for defensive expenditures to protect property rights. The estimate to get economic internal returns is: the estimate of increase in land value, and savings in transactions costs. For the increase in land values, we use an average of estimates from studies in both Honduras and Nicaragua, which gives us a 22% increase. These benefits are consolidated in a cash flow model with a horizon of ten years. Property values are assumed to grow at a constant rate necessary to achieve the full 22% increase by year 10. Regarding saved transactions costs, each parcel is assumed to be subject to two transactions over the ten year period, occurring in the fifth and the tenth year, each transaction is assumed to cost 50 percent less than absent current costs. Rural Business Development Project: To estimate the economic benefit of the Rural Business Development Project, the change in on-farm income resulting from the Project based on data from similar projects in Nicaragua and data from Australia was estimated. As a baseline, it was assumed that one manzana of land (0.7 Hectares) generates $100 in net income under current production practices. Three illustrative crops were chosen: plantain, cashew and organic sesame that approximately generate, respectively, US$2,700, US$850 and US$1191 in average net income per manzana, from a menu of crops suitable to Nicaragua’s growing conditions.
1 Since crop income fluctuates over time, the numbers presented are estimates for net income at Year 5.

6
Benefits, in the form of increased income per manzana, begin to occur after 12 months of the Project intervention. In addition to on-farm benefits, it was estimated that 7,000 new jobs will be generated as a result of this farm transition. Expected income gains from these new jobs were calculated using an average annual wage rate of $500 and discounting this wage rate by 0.5 to account for the opportunity cost of labor. The economic internal rate of return for these activities, which does not include the Improvement of Water Supply Activity, is 16%. The specific activities for the Improvement of Water Supply Activities will be determined over the course of the Activities. These activities, however, will be required to achieve at least a 10% economic internal rate of return. Since 10 percent is the minimum, we expect that the actual average economic rate of return will exceed 10%.
(a) Beneficiaries2
MCC updated its approach to counting beneficiaries, which can be found at on MCC’s website under Guidelines for Beneficiary Analysis. Recognizing that there are often several reasonable ways to estimate potential beneficiaries, this guidance was designed to enhance the consistency of practices across MCC compacts.
The Nicaragua Compact is expected to raise the incomes of approximately 120,515 Nicaraguans by 2026. These beneficiary estimates were calculated using 2005 census data adjusted for population growth by year 2026. The approach used to estimate the number of people benefitting from each Project avoids double-counting beneficiaries within each Project, especially for the Transportation Project, where two roads serve the same town. In addition, the estimation approach avoids double-counting beneficiaries between the two Projects, but only when reporting beneficiary estimates for the entire Compact. In the Nicaragua Compact, there is significant beneficiary overlap between the two Projects because the Projects are all in the Departments of Leon and Chinadega, a relatively small area. Numbers are not presented in the table below for the Property Regularization Project or the NI highway activity, as both activities were terminated.
PROJECT BENEFICIARIES Transportation 97,110 Rural Business Development
46,810
Compact 120,5153
The Transportation Project is expected to increase the incomes of approximately 97,110 people living in the Districts of Leon and Chinandega by year 2026.4 This estimate accounts for beneficiary overlap between activities of the Transportation Project; specifically the Municipality of Somotillo, whose inhabitants benefit from both the Cinco Pinos (S1) Road and the Villanueva-Guasaule (V-G) Road.
2 These are the latest beneficiary estimates for Nicaragua as of the date of approval of this version of the M&E Plan. Beneficiary estimates are often updated as new information and data is available. All updates will be posted to the MCC public website, http://www.mcc.gov/mcc/panda/activities/beneficiary/index.shtml. 3 This Compact beneficiary estimate is not the sum of the Transportation and Rural Business Development beneficiaries because we assume that 50% of the Rural Business Development beneficiaries will also benefit from the Transportation Project. Therefore the Compact estimate counts only half or 23,405 of the Rural Business Development beneficiaries 4 Using 2005 census data and a population growth multiplier of 1.23%, the population living within 5 km of each side of the roads was estimated. To estimate the population living within 5 kilometres of the road, average population densities (population/kilometers2) for each municipality were used.
7
The Rural Business Development Project is expected to increase the incomes of 46,810 people living in the Districts of Leon and Chinandega5. Beneficiary numbers are not presented in the table for terminated projects or activities. Although there were no beneficiaries from the NI highway activity, the Property Regularization Project succeeded in titling 2,865 parcels of land of which 2,454 were urban parcels and 411 were rural parcels. Because some households have more than one land parcel in both rural and urban areas, the number of land parcels to be titled does not directly translate into the number of households. On average, a rural household has 1.5 parcels, while an urban household has 1.1 parcels.6 It is estimated that this Project gave titles to approximately 2,504 unique households, which translates to 13,251 people (assuming 5.29 people/household)7. At least some of these households are expected to make additional income-generating investments after having received these titles, although this is not likely to significantly affect the total number of beneficiaries from the Compact.
(b) Assumptions and Risks
The Program’s impact is based on specific assumptions about the linkages between individual Projects Activities and the long-term Goal of increasing income. Assumptions inform the economic returns analysis while risks external to Program implementation are likely to affect Program success. These assumptions and risks are presented below for each of the three Projects.
Table 2: Assumptions and Risks
For the Program Risks
The country does not comply with MCC’s eligibility requirements
Transportation Project Assumptions
That economic benefit is derived from reduced vehicle operating costs and travel time
That traffic increases at a rate of about 6 % per year That the return on the secondary roads will be at least 8 %
That the poor will benefit from reduced travel time on their daily commute, which will allow them to use the time savings for other productive activities
That reduced transportation costs will increase productivity and job creation in labor-intensive farming
Risks
5 The beneficiary estimate of 46,810 people does not account for double‐counting beneficiaries between Projects, which is estimated to be 50% or 23,405. In other words, we expect 23,405 of the total 46,810 Rural Business Development beneficiaries to also benefit from the Transportation Project. The Rural Business Development Project expects to train 9,362 farmers in a variety of technical areas. The farmers will use this technical training to develop and implement business plans. We assume that the farmers implementing business plans are all from unique households; therefore, we expect 9,362 households with an average household size of 5 people, resulting in 46,810 individuals to benefit from the Project. 6 Data comes from the Tierra survey, a MCA‐N funded survey of households in Leon and Chinandega. The survey consisted of a land module that was administered to all households that were part of the 2005 Living Standards Measurement Survey conducted in Nicaragua by the National Institute of Development Information (Spanish acronym INIDE). INIDE conducted the Tierra survey for MCA‐N. The following tables present data from the Tierra module. 7 Data comes from the Tierra survey, a MCA‐N funded survey of households in Leon and Chinandega. The survey consisted of a land module that was administered to all households that were part of the 2005 Living Standards Measurement Survey conducted in Nicaragua by the National Institute of Development Information (Spanish acronym INIDE). INIDE conducted the Tierra survey for MCA‐N. The following tables present data from the Tierra module.
8
The potential for resettlement and relocation is not 100% known. Resettlement in general is an issue that when not handled well has the potential to cause significant controversy
3. Monitoring Component
The M&E Plan measures the results of the Program using quantitative, objective and reliable data (“Indicators”). Each Indicator has one or more expected results that specify the expected value and the expected time by which each result will be achieved (“Target”). The M&E Plan will measure and report four types of Indicators, where applicable.
First, the Compact Goal Indicators (each, a “Goal Indicator”) will measure the impact that the Program has on the incomes of Nicaraguans who are affected by the Program (collectively, “Beneficiaries”).
Property Regularization Project Assumptions
That titled properties have a higher average value than those without title; if titled, it’s estimated that the value will increase
That land titling increases investment on a parcel of property, thereby raising income (in a range of 2.5 to 3%)
That land titling reduces property transaction costs, creating greater savings and income
That greater land tenure security will improve the overall investment climate and encourage environmental protection
Risks
Institutional reforms which might affect the pace and quality of the project implementation.
Law Number 512 is implemented and INPRUR (Reformed Rural and Urban Property Institute) subsumes the land titling agency responsible for urban and rural land reform, USG does not allow any support related to INPRUR This is no longer a risk, because the institution, INPRUR, was dissolved in February 2008.
Difficulty in getting firm decisions, taken by the inter-institutional committee that advises PRODEP on its strategic decisions.
Potential failure to sustain political commitment after elections.
The election campaign introduces or promotes tenure insecurity.
Rural Business Development Project
Assumptions
That the project allows a farmer to successfully transition from subsistence agriculture to higher-value crops.
That the farmers transition to a combination of plantain (1/3), cashew (1/3), and organic sesame (1/3) or activities of similar or higher-value added potential.
That without the project, each manzana has a net income of $100 per year
That the average area of farm transitions to higher-value crops is between 1 and 5 manzanas.
That the average project investment per farmer is US$3,728
Risks
Natural disasters impacting beneficiaries
Price risk of crops
Crop plagues and diseases

9
Second, Objective Indicators (each, an “Objective Indicator”) will measure the final results of the Projects in order to monitor their success according to the Objectives.
Third, Outcome Indicators (each, an “Outcome Indicator”) will measure the intermediate results of goods and services delivered under the Project in order to provide an early measure of the likely impact of the Projects on the Objectives.
Fourth, Project Activity Indicators (each, an “Activity Indicator”) will measure the delivery of key goods and services in order to monitor the pace of Project Activities execution.
(a) Monitoring Indicators
The following tables provide a list of Goal, Objective, Outcome, and Activity indicators for each MCA-Nicaragua project, along with the entity responsible for collecting the data and the frequency of data collection. The overall Compact goal is economic growth and poverty reduction, as measured by the increase in income of beneficiaries by means of the evaluation impact. Activity-level indicators are considered notional; implementing entities will be developing activity level indicators for each project, some of which may be incorporated into the M&E plan. In addition, as new information becomes available, indicator definitions, data sources, and other details contained in the Tables 4 to 7 below may be refined.

Table 3: Compact Goal Indicator
Goal Indicator Details Responsible Entity
Source
Frequency of Data
Collection Economic Growth and Poverty Reduction
Increase in income of Beneficiaries (annual US$ millions)
Equals the sum of the increases in income for each Project
beneficiaries, as measured by each project level goal indicator.
Impact Evaluation
Consultancy hired
by MCC and
consultancies hired
by MCA
Analytical Report
based on Household
Surveys and Data
collection for Roads
Base Line Year 3 and
Year 5
Income gains of Secondary Roads upgrade
Derived a) due to increase gains of production and b) due to reduced vehicle operating costs and travel time in the secondary roads. The report for these indicators starts in year 5 because the roads will be rehabilitated until year 2010.
Design Consultancy / MCA-Nicaragua /
FIDEG
Final Report of the secondary Road design
and Report in year 5
Base Line Year 5
Income gains of Property Regularization
Expected income gains are defined as annual increase in property value per manzana multiplied by the number of regularized manzanas. The report for these indicators starts in year 5 because an increase in the income is expected after 2 years that the property is regularized.
Impact Evaluation Consultancy hired
by MCC
Analytical Report based on Household
Surveys
Baseline, Year 3 and
Year 5
Income gains of Rural Business Development. Beneficiaries: businesses assisted by the program
For Beneficiaries: Expected income gains are defined as the increase in Value Added to of the Farm, calculated as profits of a typical high-value added crop minus the profits of subsistence agriculture (US$100), per manzana, per the number of manzanas harvested. For example, a typical high value-added crop is defined as the average of plantain, cashew and organic sesame, crops suitable for Nicaragua.
Impact Evaluation Consultancy hired
by MCC
Analytical Report based on Household
Surveys
Baseline, Year 3 and
Year 5
Income gains of Rural Business Development, Employees of businesses in value chain
Expected income gains are defined as Value Added from Employment, calculated as an average annual wage rate of $500 * the number of jobs created *0.5 (0.5 = discount for wages earned of those previously employed).
Impact Evaluation Consultancy hired
by MCC
Analytical Report based on Household
Surveys
Baseline, Year 3 and
Year 5
Income gains of Improvement of Water Supply for Farming and Forest Production
Expected income gains will be determined when the specific improvement of water supply activities are specified, and will require a minimum economic internal rate of return of 10% and an acceptable internal rate of return at least of 8%. Specific improvement of water supply activities is expected to be determined by the end of Year 1. Disaggregated by income level, gender and age where appropriate.
MCA Consultancy
Analytical Report based on Household
Surveys and/or specialized studies
Baseline, and Year 5
Indicator from Terminated Project
11
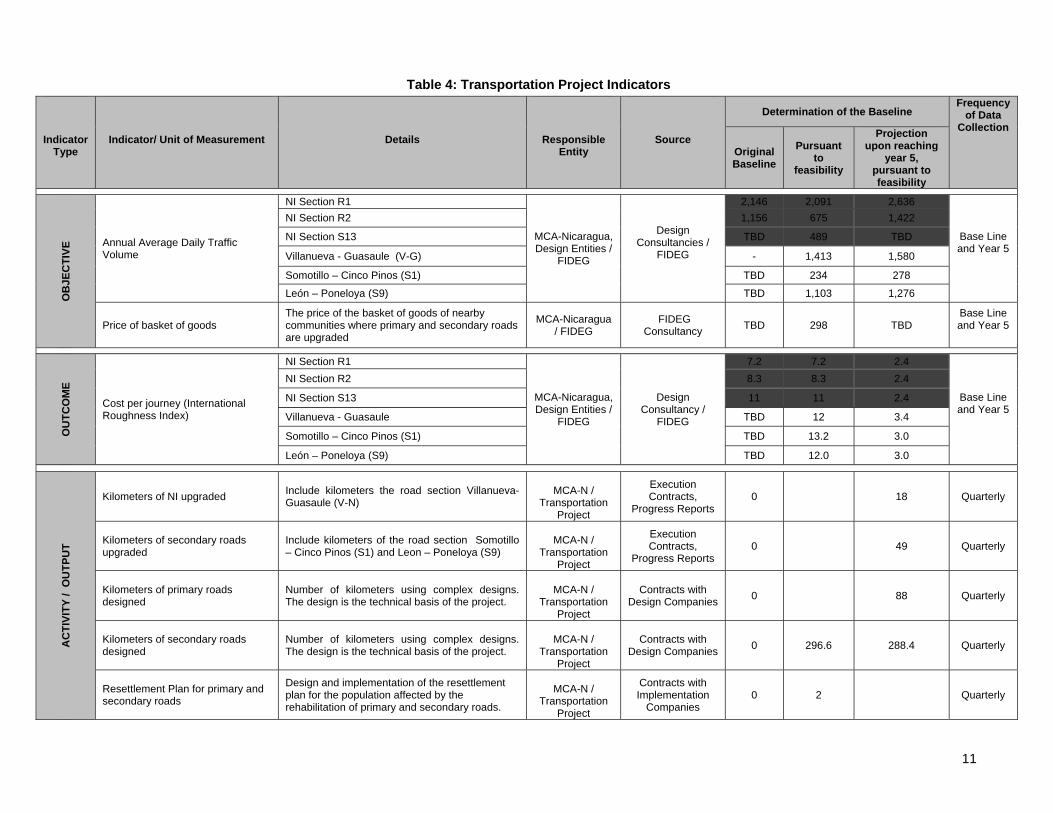
Table 4: Transportation Project Indicators
Indicator Type
Indicator/ Unit of Measurement
Details
Responsible Entity
Source
Determination of the Baseline Frequency
of Data Collection
Original Baseline
Pursuant to
feasibility
Projection upon reaching
year 5, pursuant to feasibility
OB
JEC
TIV
E Annual Average Daily Traffic
Volume
NI Section R1
MCA-Nicaragua, Design Entities /
FIDEG
Design Consultancies /
FIDEG
2,146 2,091 2,636
Base Line and Year 5
NI Section R2 1,156 675 1,422
NI Section S13 TBD 489 TBD
Villanueva - Guasaule (V-G) - 1,413 1,580
Somotillo – Cinco Pinos (S1) TBD 234 278
León – Poneloya (S9) TBD 1,103 1,276
Price of basket of goods The price of the basket of goods of nearby communities where primary and secondary roads are upgraded
MCA-Nicaragua / FIDEG
FIDEG Consultancy
TBD 298 TBD Base Line and Year 5
OU
TC
OM
E
Cost per journey (International Roughness Index)
NI Section R1
MCA-Nicaragua, Design Entities /
FIDEG
Design Consultancy /
FIDEG
7.2 7.2 2.4
Base Line and Year 5
NI Section R2 8.3 8.3 2.4
NI Section S13 11 11 2.4
Villanueva - Guasaule TBD 12 3.4
Somotillo – Cinco Pinos (S1) TBD 13.2 3.0
León – Poneloya (S9) TBD 12.0 3.0
AC
TIV
ITY
/ O
UT
PU
T
Kilometers of NI upgraded Include kilometers the road section Villanueva-Guasaule (V-N)
MCA-N /
Transportation Project
Execution Contracts,
Progress Reports 0 18 Quarterly
Kilometers of secondary roads upgraded
Include kilometers of the road section Somotillo – Cinco Pinos (S1) and Leon – Poneloya (S9)
MCA-N /
Transportation Project
Execution Contracts,
Progress Reports 0 49 Quarterly
Kilometers of primary roads designed
Number of kilometers using complex designs. The design is the technical basis of the project.
MCA-N /
Transportation Project
Contracts with Design Companies
0 88 Quarterly
Kilometers of secondary roads designed
Number of kilometers using complex designs. The design is the technical basis of the project.
MCA-N /
Transportation Project
Contracts with Design Companies
0 296.6 288.4 Quarterly
Resettlement Plan for primary and secondary roads
Design and implementation of the resettlement plan for the population affected by the rehabilitation of primary and secondary roads.
MCA-N /
Transportation Project
Contracts with Implementation
Companies 0 2 Quarterly
12
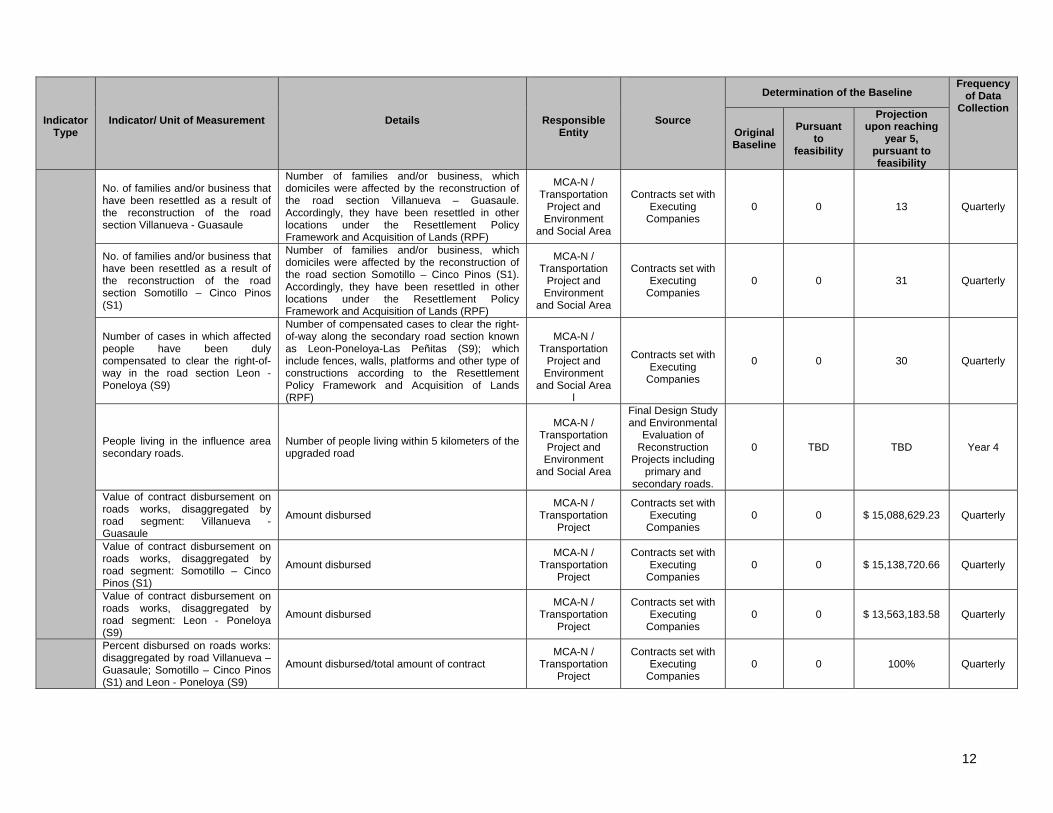
Indicator Type
Indicator/ Unit of Measurement
Details
Responsible Entity
Source
Determination of the Baseline Frequency
of Data Collection
Original Baseline
Pursuant to
feasibility
Projection upon reaching
year 5, pursuant to feasibility
No. of families and/or business that have been resettled as a result of the reconstruction of the road section Villanueva - Guasaule
Number of families and/or business, which domiciles were affected by the reconstruction of the road section Villanueva – Guasaule. Accordingly, they have been resettled in other locations under the Resettlement Policy Framework and Acquisition of Lands (RPF)
MCA-N / Transportation
Project and Environment
and Social Area
Contracts set with Executing
Companies 0 0 13 Quarterly
No. of families and/or business that have been resettled as a result of the reconstruction of the road section Somotillo – Cinco Pinos (S1)
Number of families and/or business, which domiciles were affected by the reconstruction of the road section Somotillo – Cinco Pinos (S1). Accordingly, they have been resettled in other locations under the Resettlement Policy Framework and Acquisition of Lands (RPF)
MCA-N / Transportation
Project and Environment
and Social Area
Contracts set with Executing
Companies 0 0 31 Quarterly
Number of cases in which affected people have been duly compensated to clear the right-of-way in the road section Leon - Poneloya (S9)
Number of compensated cases to clear the right-of-way along the secondary road section known as Leon-Poneloya-Las Peñitas (S9); which include fences, walls, platforms and other type of constructions according to the Resettlement Policy Framework and Acquisition of Lands (RPF)
MCA-N /
Transportation Project and
Environment and Social Area
l
Contracts set with
Executing Companies
0 0 30 Quarterly
People living in the influence area secondary roads.
Number of people living within 5 kilometers of the upgraded road
MCA-N / Transportation
Project and Environment
and Social Area
Final Design Study and Environmental
Evaluation of Reconstruction
Projects including primary and
secondary roads.
0 TBD TBD Year 4
Value of contract disbursement on roads works, disaggregated by road segment: Villanueva - Guasaule
Amount disbursed MCA-N /
Transportation Project
Contracts set with Executing
Companies 0 0 $ 15,088,629.23 Quarterly
Value of contract disbursement on roads works, disaggregated by road segment: Somotillo – Cinco Pinos (S1)
Amount disbursed MCA-N /
Transportation Project
Contracts set with Executing
Companies 0 0 $ 15,138,720.66 Quarterly
Value of contract disbursement on roads works, disaggregated by road segment: Leon - Poneloya (S9)
Amount disbursed MCA-N /
Transportation Project
Contracts set with Executing
Companies 0 0 $ 13,563,183.58 Quarterly
Percent disbursed on roads works: disaggregated by road Villanueva – Guasaule; Somotillo – Cinco Pinos (S1) and Leon - Poneloya (S9)
Amount disbursed/total amount of contract MCA-N /
Transportation Project
Contracts set with Executing
Companies 0 0 100% Quarterly
13
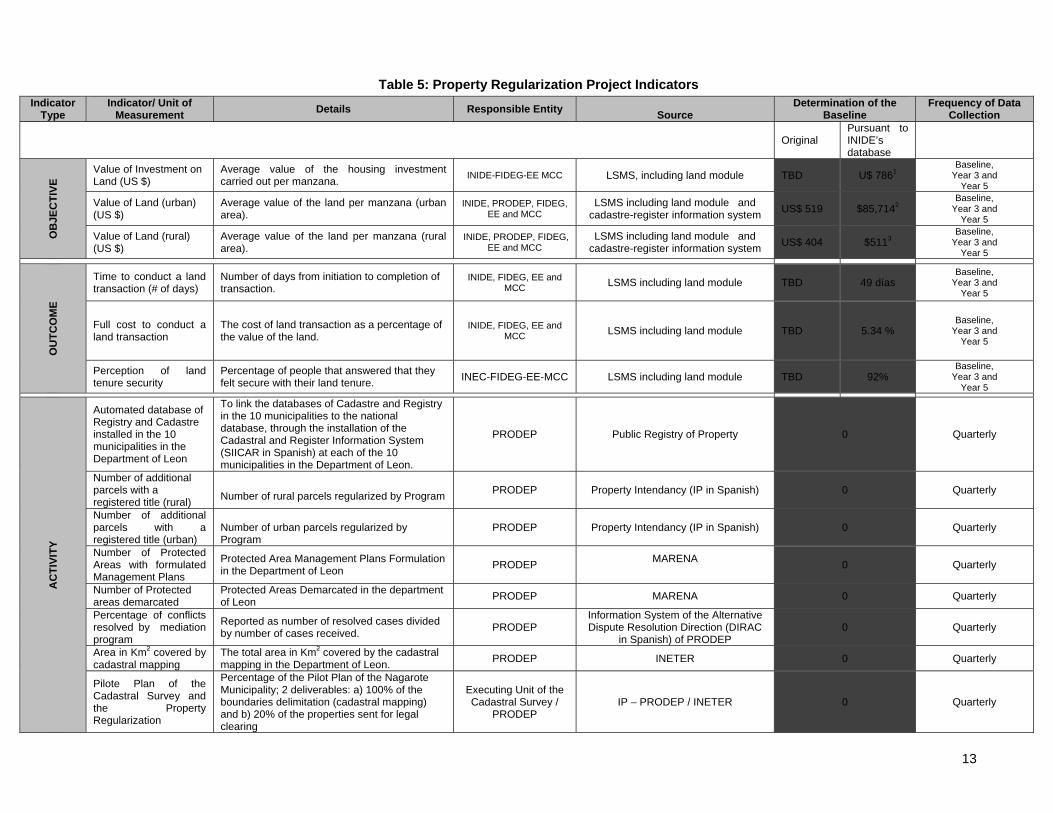
Table 5: Property Regularization Project Indicators Indicator
Type Indicator/ Unit of
Measurement Details Responsible Entity
Source
Determination of the Baseline
Frequency of Data Collection
Original Pursuant to INIDE’s database
OB
JEC
TIV
E Value of Investment on
Land (US $) Average value of the housing investment carried out per manzana.
INIDE-FIDEG-EE MCC LSMS, including land module TBD U$ 7861 Baseline,
Year 3 and Year 5
Value of Land (urban) (US $)
Average value of the land per manzana (urban area).
INIDE, PRODEP, FIDEG, EE and MCC
LSMS including land module and cadastre-register information system
US$ 519 $85,7142 Baseline,
Year 3 and Year 5
Value of Land (rural) (US $)
Average value of the land per manzana (rural area).
INIDE, PRODEP, FIDEG, EE and MCC
LSMS including land module and cadastre-register information system
US$ 404 $5113 Baseline,
Year 3 and Year 5
OU
TC
OM
E
Time to conduct a land transaction (# of days)
Number of days from initiation to completion of transaction.
INIDE, FIDEG, EE and MCC LSMS including land module TBD 49 días
Baseline, Year 3 and
Year 5
Full cost to conduct a land transaction
The cost of land transaction as a percentage of the value of the land.
INIDE, FIDEG, EE and MCC LSMS including land module TBD 5.34 %
Baseline, Year 3 and
Year 5
Perception of land tenure security
Percentage of people that answered that they felt secure with their land tenure.
INEC-FIDEG-EE-MCC LSMS including land module TBD 92% Baseline,
Year 3 and Year 5
AC
TIV
ITY
Automated database of Registry and Cadastre installed in the 10 municipalities in the Department of Leon
To link the databases of Cadastre and Registry in the 10 municipalities to the national database, through the installation of the Cadastral and Register Information System (SIICAR in Spanish) at each of the 10 municipalities in the Department of Leon.
PRODEP Public Registry of Property 0 Quarterly
Number of additional parcels with a registered title (rural)
Number of rural parcels regularized by Program
PRODEP Property Intendancy (IP in Spanish) 0 Quarterly
Number of additional parcels with a registered title (urban)
Number of urban parcels regularized by Program
PRODEP Property Intendancy (IP in Spanish) 0 Quarterly
Number of Protected Areas with formulated Management Plans
Protected Area Management Plans Formulation in the Department of Leon
PRODEP MARENA
0 Quarterly
Number of Protected areas demarcated
Protected Areas Demarcated in the department of Leon
PRODEP MARENA 0 Quarterly
Percentage of conflicts resolved by mediation program
Reported as number of resolved cases divided by number of cases received.
PRODEP Information System of the Alternative Dispute Resolution Direction (DIRAC
in Spanish) of PRODEP 0 Quarterly
Area in Km2 covered by cadastral mapping
The total area in Km2 covered by the cadastral mapping in the Department of Leon.
PRODEP INETER 0 Quarterly
Pilote Plan of the Cadastral Survey and the Property Regularization
Percentage of the Pilot Plan of the Nagarote Municipality; 2 deliverables: a) 100% of the boundaries delimitation (cadastral mapping) and b) 20% of the properties sent for legal clearing
Executing Unit of the Cadastral Survey /
PRODEP IP – PRODEP / INETER 0 Quarterly
14
Indicator Type
Indicator/ Unit of Measurement
Details Responsible Entity
Source Determination of the
Baseline Frequency of Data
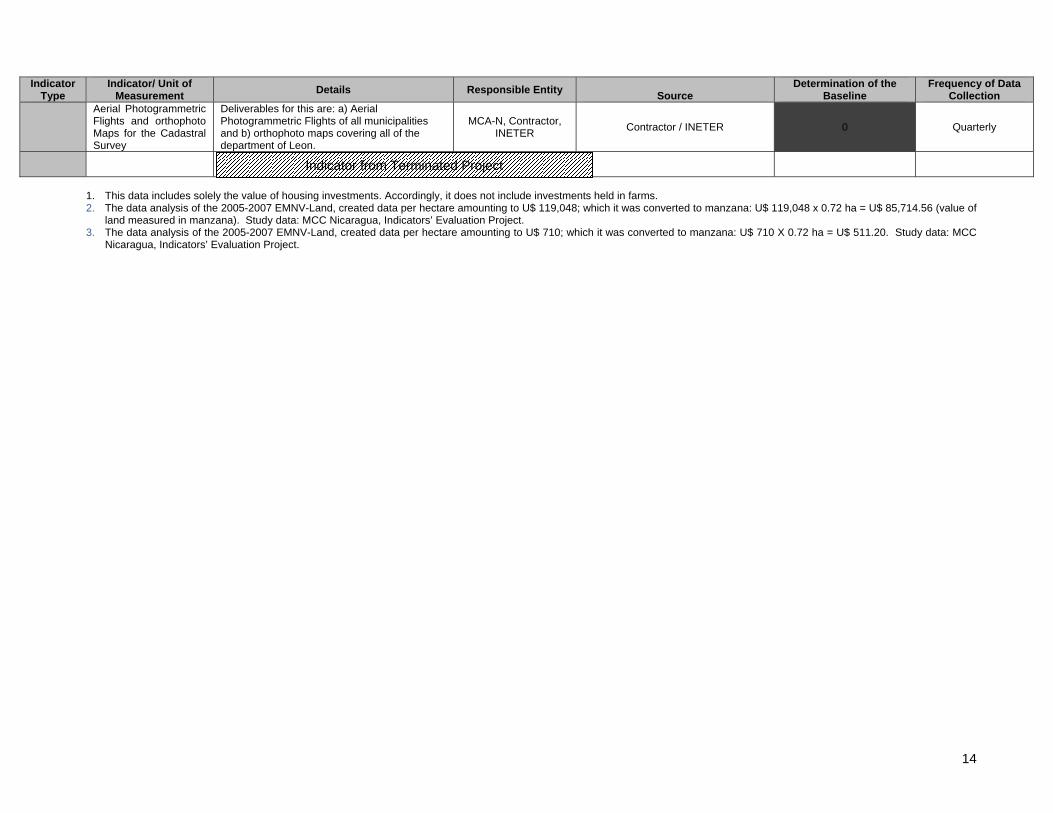
Collection Aerial Photogrammetric Flights and orthophoto Maps for the Cadastral Survey
Deliverables for this are: a) Aerial Photogrammetric Flights of all municipalities and b) orthophoto maps covering all of the department of Leon.
MCA-N, Contractor, INETER
Contractor / INETER 0 Quarterly
1. This data includes solely the value of housing investments. Accordingly, it does not include investments held in farms. 2. The data analysis of the 2005-2007 EMNV-Land, created data per hectare amounting to U$ 119,048; which it was converted to manzana: U$ 119,048 x 0.72 ha = U$ 85,714.56 (value of
land measured in manzana). Study data: MCC Nicaragua, Indicators’ Evaluation Project. 3. The data analysis of the 2005-2007 EMNV-Land, created data per hectare amounting to U$ 710; which it was converted to manzana: U$ 710 X 0.72 ha = U$ 511.20. Study data: MCC
Nicaragua, Indicators’ Evaluation Project.
Indicator from Terminated Project
15
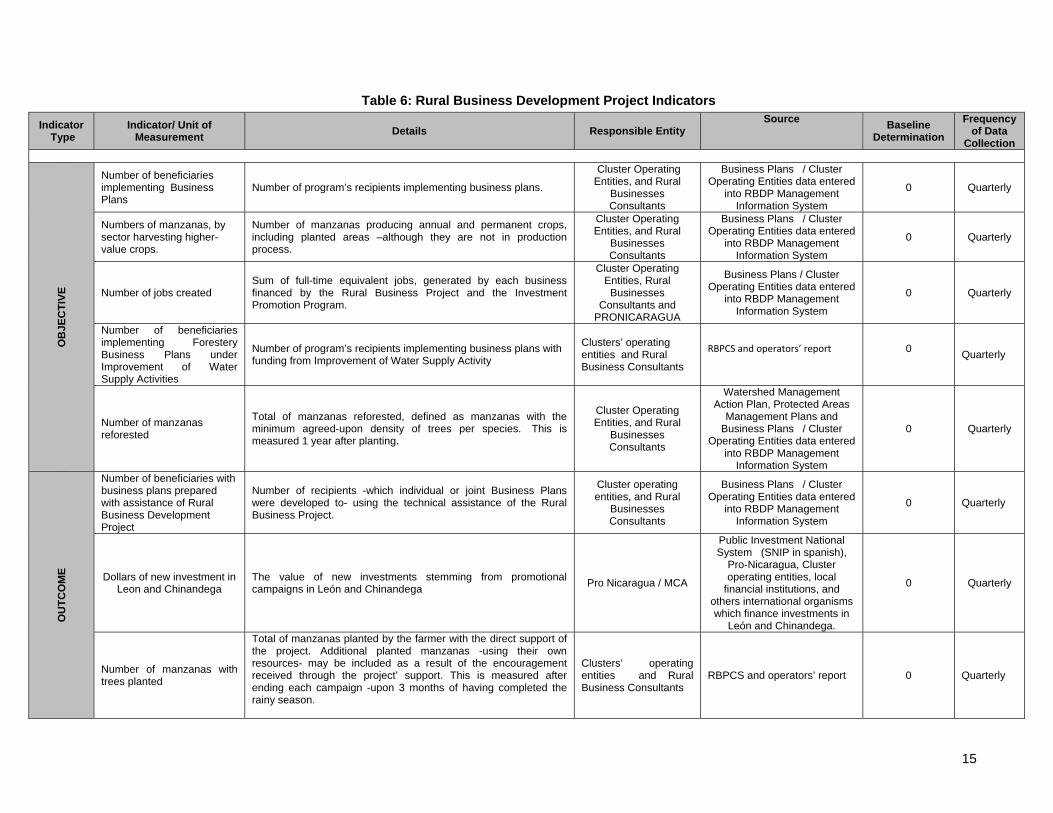
Table 6: Rural Business Development Project Indicators
Indicator Type
Indicator/ Unit of Measurement
Details Responsible Entity Source
Baseline Determination
Frequency of Data
Collection
OB
JEC
TIV
E
Number of beneficiaries implementing Business Plans
Number of program’s recipients implementing business plans.
Cluster Operating Entities, and Rural
Businesses Consultants
Business Plans / Cluster Operating Entities data entered
into RBDP Management Information System
0 Quarterly
Numbers of manzanas, by sector harvesting higher-value crops.
Number of manzanas producing annual and permanent crops, including planted areas –although they are not in production process.
Cluster Operating Entities, and Rural
Businesses Consultants
Business Plans / Cluster Operating Entities data entered
into RBDP Management Information System
0 Quarterly
Number of jobs created Sum of full-time equivalent jobs, generated by each business financed by the Rural Business Project and the Investment Promotion Program.
Cluster Operating Entities, Rural
Businesses Consultants and
PRONICARAGUA
Business Plans / Cluster Operating Entities data entered
into RBDP Management Information System
0 Quarterly
Number of beneficiaries implementing Forestery Business Plans under Improvement of Water Supply Activities
Number of program’s recipients implementing business plans with funding from Improvement of Water Supply Activity
Clusters’ operating entities and Rural Business Consultants
RBPCS and operators’ report
0
Quarterly
Number of manzanas reforested
Total of manzanas reforested, defined as manzanas with the minimum agreed-upon density of trees per species. This is measured 1 year after planting.
Cluster Operating Entities, and Rural
Businesses Consultants
Watershed Management Action Plan, Protected Areas
Management Plans and Business Plans / Cluster
Operating Entities data entered into RBDP Management
Information System
0 Quarterly
OU
TC
OM
E
Number of beneficiaries with business plans prepared with assistance of Rural Business Development Project
Number of recipients -which individual or joint Business Plans were developed to- using the technical assistance of the Rural Business Project.
Cluster operating entities, and Rural
Businesses Consultants
Business Plans / Cluster Operating Entities data entered
into RBDP Management Information System
0 Quarterly
Dollars of new investment in Leon and Chinandega
The value of new investments stemming from promotional campaigns in León and Chinandega
Pro Nicaragua / MCA
Public Investment National System (SNIP in spanish),
Pro-Nicaragua, Cluster operating entities, local
financial institutions, and others international organisms which finance investments in
León and Chinandega.
0 Quarterly
Number of manzanas with trees planted
Total of manzanas planted by the farmer with the direct support of the project. Additional planted manzanas -using their own resources- may be included as a result of the encouragement received through the project’ support. This is measured after ending each campaign -upon 3 months of having completed the rainy season.
Clusters’ operating entities and Rural Business Consultants
RBPCS and operators’ report 0 Quarterly

16
Indicator Type
Indicator/ Unit of Measurement
Details Responsible Entity Source
Baseline Determination
Frequency of Data
Collection
AC
TIV
ITY
Value of the Technical Assistance and Support and Financial Services delivered to beneficiaries of the program
Amount spent by RBDP on technical assistance, support services and financial assistance provided to the beneficiaries of the RBDP.
MCA-N RBDP and Fiscal Agent
Information Systems of the Fiscal Agent and MCA-Nicaragua,
0 Quarterly
Value of the beneficiaries’ investment
Value of investment in Business Plans made by beneficiaries. Disaggregated by source of funding, beneficiary income level, gender and age where appropriate
MCA-N RBDP Information Systems of the MCA-Nicaragua 0 Quarterly
Development of Watershed Management Action Plan
Indicators to be determined base on the Watershed Management Action Plan
Executing entities of Watershed
Management Plan
Watershed Management Plan, Protected Areas Management Plans, Conservancy Plans, agreements, and Projects with municipal governments. .
0 Quarterly
Funds disbursed for Improvement of Water Supply for Farming and Forest Production projects
Investments in low scale irrigation schemes, soil conservancy structures, commercial reforestation activities, reforestation and other water management measures.
Executing entities of Watershed
Management Plan and Fiscal Agent
Watershed Management Plan, Protected Areas Management Plans, Site Conservancy Plans, agreements, and Projects with municipal governments.
0 Quarterly
DISAGGREGATED BY SECTOR AND INICIAL PERIOD OF PARTICIPATION
Total cost of production The cost of production per manzana for each beneficiary will be summed and then divided by the number of beneficiaries. This will be reported by sector (livestock, agriculture, forestry, etc).
Cluster operating entities and Rural
Businesses Consultants
Business Plans / Cluster Operating Entities data entered
into RBDP Management Information System
Baseline of each Business Plan (average
will be calculated)
Quarterly
Price per unit sold The sale price per unit sold for each beneficiary will be summed and then divided by the number of beneficiaries. This will be reported by sector (livestock, agriculture, forestry, etc)
Cluster operating entities and Rural
Businesses Consultants
Business Plans / Cluster Operating Entities data entered
into RBDP Management Information System
Baseline of each Business Plan (average
will be calculated)
Quarterly
Volume sold The number of units produced per manzana for each beneficiary will be summed and then divided by the number of beneficiaries. This will be reported by sector (livestock, agriculture, forestry, etc).
Cluster operating entities and Rural
Businesses Consultants
Business Plans / Cluster Operating Entities data entered
into RBDP Management Information System
Baseline of each Business Plan (average
will be calculated)
Quarterly
* Each Business Plan will include a quarterly follow-up mechanism. ** Disaggregated by income level, gender and age where feasible and appropriate.

(b) Baselines and Targets
Targets for some of the Property Regularization Indicators have been modified since the Compact was negotiated. In all cases, targets are derived directly from the Compact economic and beneficiary analyses. All targets refer to the end of the relevant period. Indicators will be disaggregated by gender, age and/or income, per the requirements listed in the following section. Baseline and target values for all indicators are presented in Annex I.
(c) Disaggregating Data by Gender, Age, and Income
Reporting on the following indicators will be disaggregated by gender, age, and/or income, whenever practicable: Rural Business Development Project:
Number of beneficiaries implementing Business Plans Numbers of manzanas by sector harvesting higher-value crops Number of jobs created Number of beneficiaries with business plans prepared with assistance of Rural Business
Development Project Value of the Technical Assistance and Support and Financial Services delivered to
beneficiaries of the program Value of the beneficiaries’ investment Total cost of production Price per unit sold Volume sold Number of beneficiaries implementing Forestery Business Plans under Improvement of
Water Supply Activities Number of manzanas of beneficiaries implementing Forestry Business Plans under
Improvement of Water Supply Activities Number of manzanas of beneficiaries with business plans prepared under Improvement
of Water Supply Activities
(d) Performance Assessments and Reports MCA-Nicaragua shall submit to MCC Quarterly Performance Assessments and Annual Reports. The main M&E report is the Indicator Tracking Table, submitted quarterly, which reports progress on the indicators. Details of all reporting requirements can be found on MCC’s website.
(e) Data Quality Reviews
Independent, third party reviewer(s) will assess the quality of the data gathered through the M&E reporting system, to ensure that all data reported is as valid, reliable, and timely as resources will

18
allow. While Project Managers and implementers of Project Activities are responsible for reporting accurate data to the Director of Monitoring and Evaluation, Data Quality Reviews will verify the quality and the consistency of performance data across different implementation units and reporting institutions. Results of Data Quality Reviews will be provided to MCC and posted on the MCA-Nicaragua website. For more details on data quality reviews, see MCC’s Policy for Monitoring and Evaluation of Compacts and Threshold Programs, http://www.mcc.gov/mcc/bm.doc/policy-051209-mande.pdf
4. Software for Monitoring and Evaluation In order to process the Monitoring and Evaluation requirements, MCA-Nicaragua developed an information system using the following software: 1. A tool system aimed at processing the business intelligence ((business intelligence BI) that
will allow the output and processing of information arisen from operating databases, as well as processing such information and showing the results in the analytical way required by those responsible for the market’s decision-making (decision makers).
2. Rural Business Plan Control System (RBPCS), which will help to plan and follow up the
Business Plan for each recipient, containing the indicator system of the M&E Plan.
3. Registration systems for information detailed in the recipients’ business plans, containing technical indicators of the following clusters: agricultural, livestock and forestry, which are managed by their respective operator. They also support the RBPCS.
4. Integral System for Project Management (ISPM), entirely records the matrix of the program’s
logic framework and the information related to planning and follow up of MCA-N program’s operation. It is disaggregated by project, works on annual intervals and includes financial and procurement issues.
5. MCA-Nicaragua website is used to release all type of information related to the program’s
development through different detail levels: newsletters, annual reports, disbursement requests, Board of Directors’ minute books, tender processes, among others.
5. Evaluation Component
(a) Intermediate and Final Evaluations
An independent evaluator (“the Evaluator”) will conduct an intermediate evaluation and also a final evaluation upon the program’s completion (“Final Evaluation”.) At the very least, the Intermediate and Final Evaluations will:
(i) evaluate the effectiveness and efficiency of Project’s Activities. (ii) estimate -using a statistically valid mode- the causal relation between the Projects and
the Compact Goal. (iii) identify the Program’s unexpected results (both positive and negative.) (iv) highlight lessons learned that might be applied to similar projects and
The intermediate evaluation of the program will be executed upon reaching year 3 of the Compact. The Final Evaluation will be carried out upon reaching year 5.
19
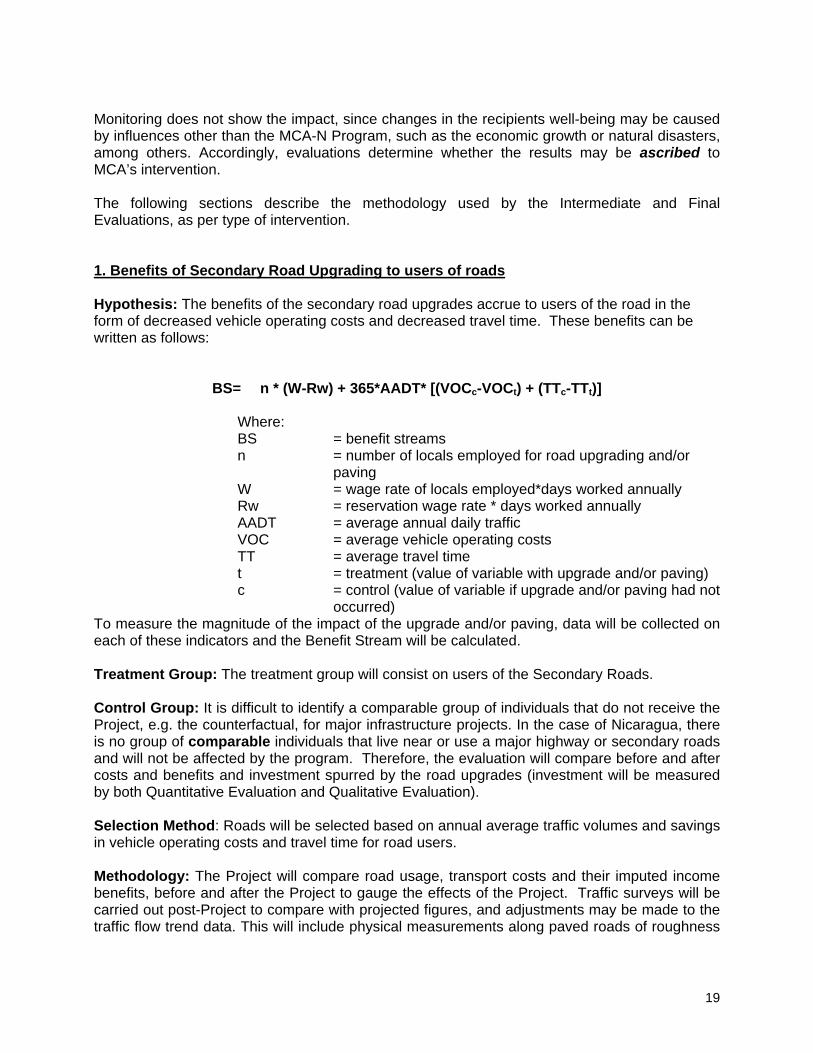
Monitoring does not show the impact, since changes in the recipients well-being may be caused by influences other than the MCA-N Program, such as the economic growth or natural disasters, among others. Accordingly, evaluations determine whether the results may be ascribed to MCA’s intervention. The following sections describe the methodology used by the Intermediate and Final Evaluations, as per type of intervention. 1. Benefits of Secondary Road Upgrading to users of roads Hypothesis: The benefits of the secondary road upgrades accrue to users of the road in the form of decreased vehicle operating costs and decreased travel time. These benefits can be written as follows:
BS= n * (W-Rw) + 365*AADT* [(VOCc-VOCt) + (TTc-TTt)] Where: BS = benefit streams n = number of locals employed for road upgrading and/or
paving W = wage rate of locals employed*days worked annually Rw = reservation wage rate * days worked annually AADT = average annual daily traffic VOC = average vehicle operating costs TT = average travel time t = treatment (value of variable with upgrade and/or paving) c = control (value of variable if upgrade and/or paving had not
occurred) To measure the magnitude of the impact of the upgrade and/or paving, data will be collected on each of these indicators and the Benefit Stream will be calculated. Treatment Group: The treatment group will consist on users of the Secondary Roads. Control Group: It is difficult to identify a comparable group of individuals that do not receive the Project, e.g. the counterfactual, for major infrastructure projects. In the case of Nicaragua, there is no group of comparable individuals that live near or use a major highway or secondary roads and will not be affected by the program. Therefore, the evaluation will compare before and after costs and benefits and investment spurred by the road upgrades (investment will be measured by both Quantitative Evaluation and Qualitative Evaluation). Selection Method: Roads will be selected based on annual average traffic volumes and savings in vehicle operating costs and travel time for road users. Methodology: The Project will compare road usage, transport costs and their imputed income benefits, before and after the Project to gauge the effects of the Project. Traffic surveys will be carried out post-Project to compare with projected figures, and adjustments may be made to the traffic flow trend data. This will include physical measurements along paved roads of roughness

20
indices. The benefit/cost stream will be a function over time of increments in traffic volumes; decreases in journey costs and time; and real Project costs. Secondary Roads. For secondary roads, an initial task will be to verify MTI traffic volume and IRI data on proposed roads, daily traffic volumes disaggregated by vehicle types, numbers of passengers per car or bus, freight contents, as well as reviewing MTI procedures for data collection. This in-depth review of MTI data and new traffic surveys will provide a solid foundation for later traffic surveys. Subsequent traffic surveys may be performed as early as 6 months following completion of each segment. 2. Benefit of Road Upgrading to communities Hypothesis: The benefits of the Road Upgrading Activity accrue to communities living within the zone of influence of the road upgraded. These benefits can be written as follows:
BS = [(PtT – PtT1)- (PcT – PcT1)] Where: BS = benefit stream Y = prices
t = treatment (people living within zone of influence of road) c = control (comparable people living outside zone of influence of
road) T = time at month and year of measurement T1 = time at month and year when participant entered the Project
To measure the magnitude of the impact of the Road Activity, data will be collected on prices and availability of goods in markets near the upgraded roads and near similar roads that are not upgraded. To calculate Benefit Stream, the difference in prices and availability of goods between markets within the zone of influence of the road and markets outside of this zone of influence will be estimated. Treatment Group: Markets within zone of influence of road(s) Control Group: Comparable markets outside of zone of influence of road(s). Selection Method: Roads will be selected based on annual average traffic volumes and savings in vehicle operating costs and travel time for road users. Methodology: MCA-Nicaragua will collect data on a standard basket of goods at markets in treatment and control communities before and after the road upgrade. 3. Increase of income as a result of the Property Regularization and Rural Business Development (Rural Homes) Hypothesis: Both the Property Regularization Project and the Rural Business Development Project are hypothesized to increase incomes and asset values for individuals who benefit from these Projects. The goal of the evaluation is to estimate the impact of a project treatment T (property regularization only, rural business development only or both property regularization and rural business development together) that is implemented after time period 1.This impact can be defined using the following difference-in-difference expression:

21
DT = [ )()( 1212
CCTT yyyy ]
Where DT = the impact of the Project(s) y = an outcome variable of interest (e.g.,
household Income, land value, etc.) subscripts 1 and 2 = time (1 is the time before the treatment; 2
is the time after the treatment) superscript C =values for the counterfactual or control
group. superscript T = values for beneficiaries of the Project(s) or
treatment group.
In words, the treatment effect is defined as the change in y (e.g., income) that an individual experiences following the treatment less the change in y of that the same individual (or an adequate control person) would have experienced over the same time period without the treatment. As this expression makes clear, identification of the treatment effect requires observation of treatment and control groups both before and after the treatment. The actual econometric method that will be utilized to estimate DT will be determined later, depending on the exact character of the control group and other considerations. Additional information (of the sort found in standard living standards measurement surveys) will be required for estimation. Treatment Groups: A number of countries, including Nicaragua, have invested in property regularization programs with the idea that regularized land titles will promote broadly based growth. The evidence on these programs in isolation is mixed. By combining a Property Regularization with a Rural Business Development Project the Nicaragua program opens the door to understanding the impact of regularizing land titles both in isolation and in combination with business services. In particular, the program will permit observation and evaluation of the following four treatment regimes:
Without Rural
Business Development
With Rural Business
Development
Without Property Regularization
(i) [late/late] (ii) [late/early]
With Property Regularization (iii) [early/late (iv) [early/early]
Selection Method: Ideally, the goal would be to randomly allocate eligible program beneficiaries between these four treatment regimes. Comparison of treatment group (iv) with control group (i), using the difference-in-difference estimator sketch above, would permit identification of the full impact of the Nicaraguan program. Comparison of groups (iv) and (iii) would permit us to see the additional value added to property regularization efforts when they are combined with rural business development. The other pair-wise comparisons (iv with ii; and, ii with iii) would also provide valuable information on program effectiveness.

22
Control Group: The challenge of this and any other impact evaluation is to obtain an adequate control group. Because the benefits of the Property Regularization Project will be extended to everyone, a quasi-randomized project implementation strategy should make it possible to obtain adequate controls. Those receiving regularized land titles early in the life of the program will serve as the treated (row 2 in the table above), while those receiving later in the program will serve as controls (row 1). PRODEP has already identified a geographic rollout strategy that will be adequate for this purpose. Unfortunately, this seemingly straightforward approach may have to be modified slightly at the analytical stage as roughly 40% of the households in the late treated areas already hold more or less clear titles. These earlier titles were not randomly distributed and emerged from a demand-driven framework. Identification of a control group for rural business development is more challenging as this project is demand driven—that is, services have to be requested and will not be extended to everyone. Nevertheless, the Rural Business Development Project, parallel to the property regularization component, will be rolled out at different times in different (quasi-randomly selected) areas of León and Chinandega. Households treated with business services (column 2 in the table above) will thus come from early treated communities, while those from late treated communities will form the controls. To reflect this basic design, the table above contains a dual early/late designation for each treatment cell. The first indicator refers to the timing of Property Regularization Project. The second indicates the timing for treatment with the Rural Business Services Project. Sampling Strategy: Random sampling of households within zones designated for early receipt of the Rural Business Development Project is unlikely to yield many direct project beneficiaries. In order to assure adequate representation of direct beneficiaries, a stratified random sampling will be used in both (early) treatment and control (late treatment) areas. The MCA-Nicaragua Office of Rural Business Development will provide a simple ex ante scoring model that can be used to predict those households who are likely to take up the offer of business services. Information for the scoring model will be derived from the agricultural census, and the sample will be drawn from the universe of agricultural producer households listed in the census. Over-sampling households with high scores in both treatment and control areas will yield a sample which should include reasonable numbers of direct beneficiaries (or people in the control areas who will eventually become beneficiaries when the business services program reaches them. The sample derived this way will be called the Ex Ante Sample. The full sample will NOT, however, be drawn from high score households alone. A portion of the sample will be retained for randomly drawn households from each area. The presence of these households will permit analysis of the spill-over of business services benefits to households that are not direct beneficiaries. While the above strategy should work, it is possible that the ex ante scoring model will fail to accurately predict the demand-driven program take-up. To guard against this eventuality, a fraction (25%) of sample observations will be drawn from the list of those who actually enroll in the Rural Business Development Project. The characteristics of these actual beneficiaries will be used to modify the scoring model so that a similar ex post sample can be simultaneously taken in the late treatment/control geographic units. The sample derived through this procedure will be called the Ex Post Sample.
23
It is understood that some individuals from outside the specifically designated rollout zones will independently contact the rural business project and seek support. These individuals will not be included in the sample. Survey Rounds: The first or baseline survey round will take place as soon as possible after the Rural Business Development Project is able to supply a scoring model and a geographic program rollout strategy. Ideally, the ex ante sample will be interviewed of 2007. The ex post sample will be interviewed as close to that time as is practical. However, the exact timing of that sample will depend on the timing and speed of the actual program recruitment. The second survey round will take place approximately one to two years after the baseline ( 2009). The exact timing will need to be coordinated with the implementation plan of the Rural Business Development Project. The idea is to have the second round surveys take place before the Rural Business Development and the Property Regularization Projects are extended to the ‘late’ areas. Analysis of the second round data will permit identification of program effects. Finally, a third survey round of data will be taken during the final year of the program (2011). By this time, households located in control (later treatment areas) should have been treated. This will open the door to ‘continuous treatment’ methods in which variation in the extent of treatments (e.g., months with regularized title; months with business services) can be used to identify program effect. This method (which requires that the extent of treatment is randomly determined) will permit a more extensive look at the dynamic effects of the MCA-Nicaraguan Program. This should be especially important in terms of understanding longer term investment effects in both productive assets as well as human capital assets (e.g., children’s education). Due to changes experienced by the program (termination of the property project,) adjustments to the evaluation methodology have been made in relation to the property’s intervention, as follows: C1. Summary Changes in the implementation of the land titling and property regularization program in León and Chinandega require modification of the originally proposed impact evaluation design if we are to reliably measure the impacts of the business services and land titling programs in these departments. For reasons outlined in the remainder of this memo, the new impact evaluation strategy requires that:
1. All 630 households in the impact evaluation survey in the department of Chinandega (where a cadastral sweep was largely by 2008) receive fully registered land titles as soon as possible in 2009. Excluded from this request are households located in the San Pedro and Santo Tomas municipalities as these are ineligible for private titles given their proximity to the border with Honduras.
2. Impact evaluation survey households in the municipalities of León, La Paz Centro and Nagarote be divided into two groups. One group (129 households) will be prioritized for immediate registration of their titles during 2009, and the other group (255 households) will be given lower priority with title not finalized and registered until after mid-2010.
3. Accommodation be made for immediate (2009) ‘on-demand’ titling services for 102 households located in 18 communities in the León municipalities of El Sauce and Achuapa. Impact evaluation resources will be used to bring these selected households to the land titling office.
4. All of the above requests apply to households whose land is in the reform sector and households whose land is in the private (non-reform) sector.
24
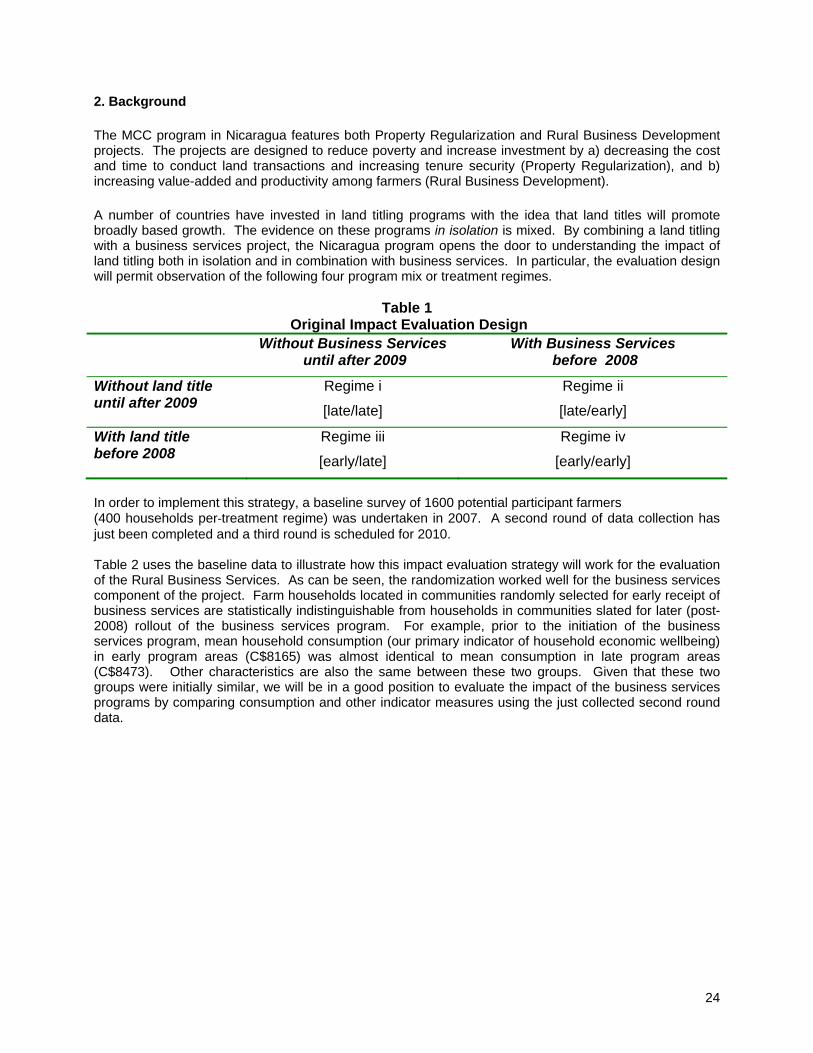
2. Background
The MCC program in Nicaragua features both Property Regularization and Rural Business Development projects. The projects are designed to reduce poverty and increase investment by a) decreasing the cost and time to conduct land transactions and increasing tenure security (Property Regularization), and b) increasing value-added and productivity among farmers (Rural Business Development).
A number of countries have invested in land titling programs with the idea that land titles will promote broadly based growth. The evidence on these programs in isolation is mixed. By combining a land titling with a business services project, the Nicaragua program opens the door to understanding the impact of land titling both in isolation and in combination with business services. In particular, the evaluation design will permit observation of the following four program mix or treatment regimes.
Table 1 Original Impact Evaluation Design
Without Business Services until after 2009
With Business Services before 2008
Without land title until after 2009
Regime i
[late/late]
Regime ii
[late/early]
With land title before 2008
Regime iii
[early/late]
Regime iv
[early/early]
In order to implement this strategy, a baseline survey of 1600 potential participant farmers (400 households per‐treatment regime) was undertaken in 2007. A second round of data collection has just been completed and a third round is scheduled for 2010. Table 2 uses the baseline data to illustrate how this impact evaluation strategy will work for the evaluation of the Rural Business Services. As can be seen, the randomization worked well for the business services component of the project. Farm households located in communities randomly selected for early receipt of business services are statistically indistinguishable from households in communities slated for later (post-2008) rollout of the business services program. For example, prior to the initiation of the business services program, mean household consumption (our primary indicator of household economic wellbeing) in early program areas (C$8165) was almost identical to mean consumption in late program areas (C$8473). Other characteristics are also the same between these two groups. Given that these two groups were initially similar, we will be in a good position to evaluate the impact of the business services programs by comparing consumption and other indicator measures using the just collected second round data.
25
Table 2 Randomization Results for Rural Business Services
Indicators from 2007 Baseline Survey
Without Business Services until after 2009
With Business Services before 2008
Household Consumption ($C per-month)
8473 8165
Farm Size (mzs) 41.4(median=20.0) 34.8 (median=20.0)
Farmer Age (years) 52 50
Farmer education (years)
4 4
The initial randomization scheme was less successful for the titling program. Unlike the rollout of the business services program (where we could randomize at the level of micro communities), the technical requirements of cadastral mappings required that randomization be undertaken with much larger geographic groupings. The departments of Chinandega and León were broken up into macro geographic blocks. These blocks were then randomly slated for either early or late receipt of land titling services according to a rollout schedule that we designed in cooperation with PRODEP. Analogous to Table 2, Table 3 shows the results of this randomization scheme for the initial early and late land titling sub-samples. As can be seen, mean consumption is significantly different between the two groups with the early title group enjoying consumption levels some 20% higher on average than the late titling control group. There are differences for some of the other variables as well. These differences reflect our inability to randomize the provision of early titling services at a more micro or household level. Analytically, we would have addressed these shortcomings by relying on other statistical methods to control for some of these pre-existing differences between early and late treatment households. Table 4 takes all this information and displays the mean consumption levels between the households allocated to the different program regimes illustrated in Table 1 above. As can be seen, the differences between households slated for early and late titling persist. Nonetheless, we would have been poised to carry out a reliable impact evaluation by using matching and other methods to ‘balance’ the early and late titling groups.
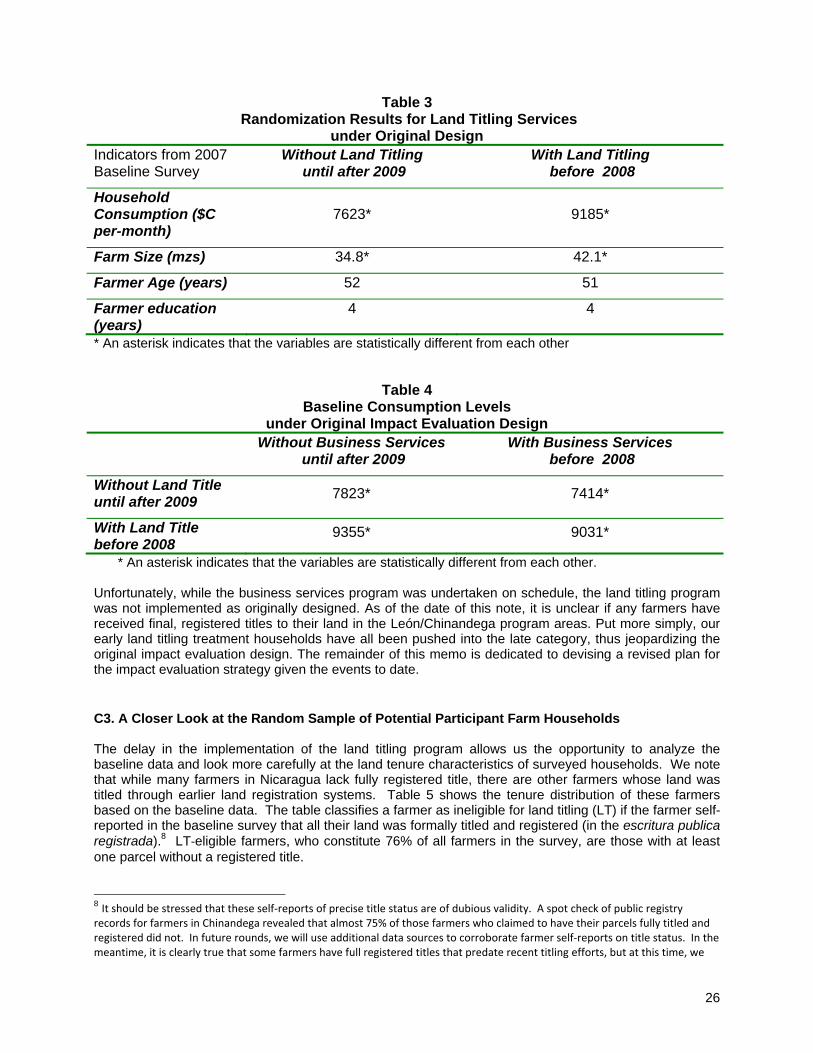
26
Table 3 Randomization Results for Land Titling Services
under Original Design Indicators from 2007 Baseline Survey
Without Land Titling until after 2009
With Land Titling before 2008
Household Consumption ($C per-month)
7623* 9185*
Farm Size (mzs) 34.8* 42.1*
Farmer Age (years) 52 51
Farmer education (years)
4 4
* An asterisk indicates that the variables are statistically different from each other
Table 4 Baseline Consumption Levels
under Original Impact Evaluation Design Without Business Services
until after 2009 With Business Services
before 2008
Without Land Title until after 2009
7823* 7414*
With Land Title before 2008
9355* 9031*
* An asterisk indicates that the variables are statistically different from each other.
Unfortunately, while the business services program was undertaken on schedule, the land titling program was not implemented as originally designed. As of the date of this note, it is unclear if any farmers have received final, registered titles to their land in the León/Chinandega program areas. Put more simply, our early land titling treatment households have all been pushed into the late category, thus jeopardizing the original impact evaluation design. The remainder of this memo is dedicated to devising a revised plan for the impact evaluation strategy given the events to date. C3. A Closer Look at the Random Sample of Potential Participant Farm Households The delay in the implementation of the land titling program allows us the opportunity to analyze the baseline data and look more carefully at the land tenure characteristics of surveyed households. We note that while many farmers in Nicaragua lack fully registered title, there are other farmers whose land was titled through earlier land registration systems. Table 5 shows the tenure distribution of these farmers based on the baseline data. The table classifies a farmer as ineligible for land titling (LT) if the farmer self-reported in the baseline survey that all their land was formally titled and registered (in the escritura publica registrada).8 LT‐eligible farmers, who constitute 76% of all farmers in the survey, are those with at least one parcel without a registered title.
8 It should be stressed that these self‐reports of precise title status are of dubious validity. A spot check of public registry records for farmers in Chinandega revealed that almost 75% of those farmers who claimed to have their parcels fully titled and registered did not. In future rounds, we will use additional data sources to corroborate farmer self‐reports on title status. In the meantime, it is clearly true that some farmers have full registered titles that predate recent titling efforts, but at this time, we

27
Because land titling processes are different between former agrarian reform parcels9 versus parcels that were always private land, it is important to note that 904 out of 1221 LT‐eligible households have some tenure irregularity in a plot that is not from the reform sector (i.e. private land). These data highlight the need to include both reform and private land in any titling program that seeks to comprehensively address land tenure issues. We also show the division of households between two departments of Leon and Chinandega because the partial land titling work completed to date varies by department.
Table 5 Tenure Distribution of Sampled Potential Participant Farm Households
Leon Chinandega
Both Departments
LT-eligible households
Irregular tenure only on ‘private’ plots
333 321 654
Irregular tenure only on reform sector plots
137 180 317
Irregular tenure on both ‘private’ and reform sector plots
121 129 250
Total LT-Eligible households 591 630 1221
LT-ineligible households
All plots ‘private’ 184 83 267 All plots reform sector 30 14 44 Both ‘private’ and reform sector plots
47 21 68
Total LT-ineligible households 261 118 379 C4. Logic of the Revised Impact Evaluation Strategy The implementation delay for the property regularization program implies that we will not observe any farmers who have been randomly assigned to treatment status (iii) (regularized title without business services) shown in Table 1 above. In response, we have developed a revised impact evaluation strategy to account for changes in the rollout of titling services in León and Chinandega. This new strategy will still permit an evaluation of the impact of the business project (BP) in isolation, land titling in isolation and the combination of business services plus land titling. Figure 1 is a graphical representation of how each of these impacts could be estimated, IF a random selection of farmers is chosen to receive land titling in 2009. Random selection of farmers will ensure that one can compare program impacts across similar groups. It is crucial to have, on average, similar groups receiving the BP and LT services in each round of implementation, so the rest of this document discusses how to ensure that we have similar groups.
are not yet sure who they are. 9 Land is said to be from the reform sector if a plot that has at least one of these characteristics mentioned by the farmer: (a) if the plot was bought to some beneficiary of the Agrarian reform; (b) if at the date the farmer got that plot, there was a title of the agrarian reform, “ titulo supletorio” or “constancia de asignacion” for that plot; (c) if the current document that the farmer has is an agrarian reform title, titulo supletorio or constancia de asignacion; (d) if the farmer said that he/she currently is trying to get a “titulo supletorio”; (e) if the current document owned by the farmer said that the owner is some government institution; and/or (f) if the farmer said that the current document that he owns was made by the INRA, OTR or MIDINDRA.

28
The horizontal axis of Figure 1 displays the different points of time at which we have or will have household survey data. The vertical axis shows our key outcome indicator of household well‐being (per‐capita consumption). For illustrative purposes, the trajectories plotted on the graph show what we would expect to see if both property regularization and business services enhance household well‐being. Households can be divided into two groups: those that had tenure irregularities and are LT-eligible (shown by the solid lines) and those that did not irregularities and are LT-ineligible (shown by the dashed lines).10 As noted above, those that had fully regularized tenure by 2007 were likely a self-selected group. Note that we draw the lines for the already full titled households at a higher level. We do this to both reflect the hypothesis that titled households should already be doing better and also because the baseline data reveals that these household had 2007 consumption levels above those of farm households without fully regularized title. Following the baseline survey, each of these groups was randomly split into two, with a portion of each receiving immediate access to business services (blue lines), and another group not receiving those services (red line). The uptake rate of those offered business services was high. Our original design would have further subdivided the solid line groups into a sub‐groups that also received immediate regularization of their property rights. However, as mentioned above, this did not occur because of implementation delays in the land titling program. Our revised proposal is to randomly allocate the tenure insecure farmers into two groups: those that will have their property regularized immediately in 2009, and those who will not receive tenure regularization until 2010 or later. The methods for determining this randomization will vary across sub‐regions depending on the existing state of the titling program. Note that it is not possible to further delay the entrance of any
10 A unit’s tenure status was not known until after the baseline survey.

29
eligible farmers into the business services programs. We will thus not be able to see any households randomly assigned treatment status iii in Table 1 above. We will however be able to see a set of households with (pre‐2007) secure title and no business services. Combined with the other groups shown in Figure 1 this will allow us fairly reliable inference on the impacts of the different program elements alone, and in combination. Our plan is to eventually employ so‐called continuous treatment estimators (that specify program impact as a function of the duration of exposure to the program) which should allow estimation of the short‐ and medium‐run impact curves shown in Figure 1. C5. Implementation of the Modified Randomization Strategy The modified design relies in the basic idea of selecting farmers (or groups of them) from the Business Program sample to receive the benefit of titling regularization during 2009. Additionally, there will be another list of farmers for whom land titling benefits will be postponed until after June of 2010. Given that it is not administratively feasible to instantly provide titling services to all households, the proposed random division of households into earlier and later recipients of titling services is unavoidable and fair. Because of the nature of the land titling activities undertaken to date are different in Leon and Chinandega, we will discuss our strategy in each of these departments separately. C5.1 Randomization strategy in the Department of León It is our understanding that MCA’s 2008 land tenure regularization program completed the cadastral sweep in the 70% of the rural area in the municipality of Nagarote. Preliminary land titling (cadastral) work has not yet been carried out in the other areas of the León Department. In order to assure that a selection of our surveyed farmers receive titles as soon as possible, we propose randomly selecting survey clusters in León for early titling in 2009. All households in the selected clusters will be offered an invitation to regularize their parcels of land. Even though this invitation is for the farmers that are in the survey sample, other farmers from the community would be offered the same land tilting services. Thus, the invitation would be extended to any individual living in the community and would consist of free transport to the relevant land‐titling office and food for farmers that decide to regularize his/her parcels. For example, there are 206 surveyed farmers in the municipalities of Achuapa and El Sauce where will implement this encouragement design. Table 6 displays the proposed randomization strategy by community for these two municipalities.
Table 6 Encouragement Design to Exploit On‐demand Titling Program
Municipalities of El Sauce y Achuapa (Department of León)
Municipality Communities where invitations will be
redistributed in 2009
Communities where invitations will not
be distributed
El Sauce
Santa Barbara El Pilón
San Nicolás San José
San Ramón Sabana Grande
Los Tololos La Tejera
Las Mercedes
Achuapa
El Rodeito San Nicolás
Sabana la Villa Lagartilllo El Salitre Guaruma El Portillo
Santa Rosa
Las Tablas La Sandino Los Llanitos La Calera El Barro
El Carrizo El Cacao Flor N° 1

30
Lo Caraos La Perla
Ojo de Agua Río Arriba
Total farmers 102 104
There are 384 surveyed farmers in the municipalities of Leon, La Paz Centro and Nagarote. We will do a imilar selection of communities, such that one third of them will be invited early in 2009. However, there would be some chance that individual randomization can be carried out in at least those communities where cadastral work has already been carried. We will make a final decision on the random allocation of farmers in these municipalities once we obtain more complete information on the status of the titling program and PRODEP’s work plan for the 2009 year. C5.2 Randomization Strategy in the Department of Chinandega In Chinandega, the Intendencia de la Propiedad (IP) started in 2008 the regularization of 2020 parcels belonging to the agrarian reform sector. In particular, there were 1280 households benefited in the municipalities of Cinco Pinos, San Francisco del Norte, Chinandega, El Viejo, Villanueva y Somotillo. In 2009, the Intendencia de la Propiedad will continue working in these municipalities that group the 78% of the Chinandega households that are in the Business program sample. Furthermore, given the existence of the Agrarian Law of 1917, it is not feasible to issue private titles in San Pedro and Santo Tomas del Norte. Then, farmers living in these municipalities cannot be benefited by a titling program. Based on these facts, almost every farmer from Chinandega that is in the Business program sample and whose land has an origin in the agrarian reform sector should be considered as early treatment in 2008. Given the advanced nature of the titling program in the Department of Chinandega (and the legal limitations to the titling of parcels in the border municipalities, we have little choice about the random distribution of titles in this region. Going forward, we assume that every farmer in the sample who is located in the Chinandega department will be benefited by the titling program in 2009, with the exception of the ineligible farmers in the San Pedro and Santo Tomas municipalities. C5.3 Ex Ante Analysis of Effectiveness of Revised Impact Evaluation Strategy Tables 7 and 8 report the mean of per‐capita consumption (as measured at the 2007 baseline survey) that would result from implementing the modified randomization strategy described above11. We have included in this table both farms that we described in Section 3 as “Land Titling-ineligible and Land titling-eligible.” As explained in footnote 1 above, we lack confidence in our self-reported data on which farmers are LT- ineligible. However, it is clear that those who self-report as LT-ineligible are substantially better off than farmers who do not. As discussed above, it is unclear whether their higher level of economic wellbeing is a cause or a consequence of their title status.
Table 7 Randomization Results for Land Titling Services
under Modified Design
11 For purposes of this ex ante analysis, we assumed an individual level randomization in the municipalities of Leon, La Paz Centro and Nagarote. As mentioned in the prior section, the final design may include some micro‐level clustering of treatment assignment. Given that analysis shows that there is no design effect induced by the use of our business clusters, we do not anticipate that this slightly higher level randomization will unbalance treatment and control groups.
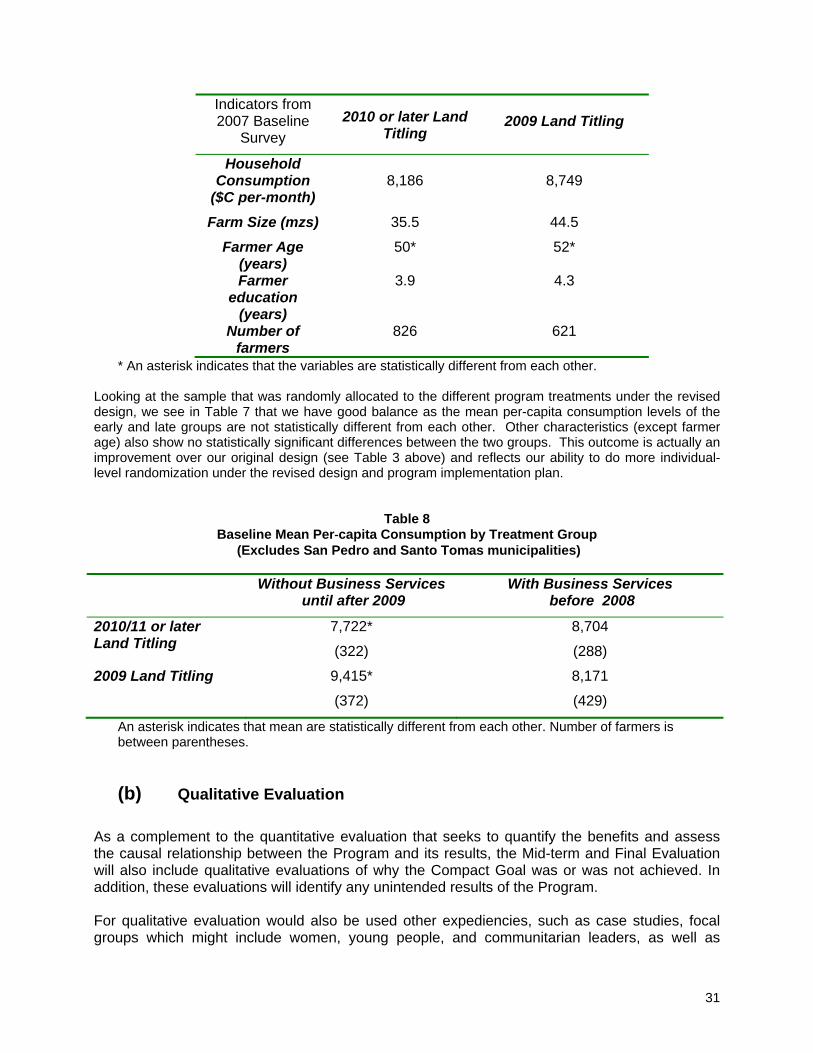
31
Indicators from 2007 Baseline
Survey
2010 or later Land Titling
2009 Land Titling
Household Consumption
($C per-month) 8,186 8,749
Farm Size (mzs) 35.5 44.5
Farmer Age (years)
50* 52*
Farmer education
(years)
3.9 4.3
Number of farmers
826 621
* An asterisk indicates that the variables are statistically different from each other.
Looking at the sample that was randomly allocated to the different program treatments under the revised design, we see in Table 7 that we have good balance as the mean per-capita consumption levels of the early and late groups are not statistically different from each other. Other characteristics (except farmer age) also show no statistically significant differences between the two groups. This outcome is actually an improvement over our original design (see Table 3 above) and reflects our ability to do more individual-level randomization under the revised design and program implementation plan.
Table 8 Baseline Mean Per‐capita Consumption by Treatment Group
(Excludes San Pedro and Santo Tomas municipalities)
Without Business Services until after 2009
With Business Services before 2008
2010/11 or later Land Titling
7,722*
(322)
8,704
(288)
2009 Land Titling 9,415*
(372)
8,171
(429)
An asterisk indicates that mean are statistically different from each other. Number of farmers is between parentheses.
(b) Qualitative Evaluation
As a complement to the quantitative evaluation that seeks to quantify the benefits and assess the causal relationship between the Program and its results, the Mid-term and Final Evaluation will also include qualitative evaluations of why the Compact Goal was or was not achieved. In addition, these evaluations will identify any unintended results of the Program. For qualitative evaluation would also be used other expediencies, such as case studies, focal groups which might include women, young people, and communitarian leaders, as well as

32
communitarian profiles. With the purpose to obtain information from the communities, which have experienced a direct impact of the program, e.g. community’s wellbeing perception, number of formal and registered businesses, infrastructure, among other socio-economical and demographical characteristics; at the same time that from the value-added condition generated towards the community, as a result of the program’s intervention. Transportation Project. The evaluation will measure additional benefits from highway projects, not captured by traffic flow data. These benefits should accrue to sectors whose ratio of transport costs to production price is relatively high; such as the light manufacturing sector and agriculture. In response to lower transportation costs these sectors are likely to increase investment and employment. To approach these issues, case studies will be carried out on a sample of beneficiary areas to review issues such as creation of new businesses or expansion of existing ones, due to improved road infrastructure. These would illustrate the economic transformations that take place when roads are upgraded.
(c) Other Evaluations
In addition to the Final and Mid-term Evaluation, to be completed at the end of the Compact period, MCC and MCA-Nicaragua will conduct interim evaluations of the Projects and the Program as a whole. Additional ad hoc evaluations may consist of studies related to Projects and/or Activities, focus groups to elicit beneficiary and stakeholder feedback, and feedback from beneficiaries that have left the Program, among others. All evaluations must be conducted by a third-party contracted through a competitive procurement process with the MCC approvals established in the Procurement Agreement.
6. MCA-Nicaragua Staff M&E Responsibilities MCA-Nicaragua trough the M&E Direction has the responsibility for: designing and implementing a continuous monitoring program according to the stipulated in the Monitoring Component; carrying out the Program’s Evaluation Component; administrating the Quality Data Evaluation Contracts; evaluating the impact of the three Projects of the Program –which include data gathering, baseline, treatment groups, control groups, focus groups, and methodological and instrumental implications of the evaluation, as mention in section 6. At the same time will be responsible for the Qualitative Evaluations and other particular evaluations required during the Program’s execution. In addition, it will have to keep the Beneficiaries, Board of Directors, MCC and other relevant actors informed of the results of the evaluations. The M&E Director will work closely to the Directors of the three Projects. Especially close to the Rural Business Director, in order to define the concept and design of the Investment Administration System; to revise the resulting data of the monitoring and evaluation; to back-up decision making based on up-dated information; to ensure that the executing entities will carry out the monitoring activities and will support the evaluations; to comply with the indicators accomplishment time under own responsibility; among others.

33
(a) M&E Director and M&E Specialist Responsibilities
The M&E Director is responsible for the overall M&E strategy and implementation of related activities within the Program and via partners, plus providing timely and relevant information to Program stakeholders. The M&E Director will have the following responsibilities:
- Guide the set up of the M&E system and strategy, including data-collection, data-analysis and reporting systems, and oversee its effective implementation by implementing partners
- Ensure that data are disaggregated by gender, age and income level, where practicable
- Confirm that data collection from INIDE is occurring as scheduled and as programmed
- Oversee the installation of hardware and software for M&E, including the Management Information System, and coordinate with the Specialist in MIS
- Directly participate in the monitoring of individual program components through site visits, review of Project reports and review of secondary data
- Regularly review M&E data with decision makers to ensure that Projects are accomplishing objectives and, if changes are warranted, that timely decisions on corrective actions are made and implemented
- Support the preparation of the Quarterly and Annual Reports from the Projects, executing entities, technical and administrative units to be presented to MCC
- Ensure that these reports are made public and easily accessible on the MCA-Nicaragua web page
- Develop close working relationships with Program participants and stakeholders - Ensure that staff and implementing partners are receiving adequate support to be
able to implement their M&E functions - Work closely with Administration and Finance Manager on reporting requirements
and timing of financial disbursements - Ensure that data quality is satisfactory by overseeing the process for selecting
independent data quality reviewers, ensuring regular data quality reviews and responding to findings from these reviews
The M&E Director will work closely with the Management Information System (MIS) Specialist. The management information system will be used as a tool for regular reports, both financial and technical, planning activities and monitoring purposes. The MIS Specialist responsibilities include:
- Identify hardware & software needs of the Program - Set up, in coordination with Administration and Finance and Monitoring and
Evaluation Directors, a computerized, comprehensive, user-friendly management information system for the program and all its components that is compatible with other systems used by the Nicaraguan government
- Create and administer a web page for the MCA Program - Design formats of reports for the board, MCC and other stakeholders - Prepare quarterly progress reports with inputs from implementing entities and
beneficiaries to be presented to Executive Director and MCC - Post all technical, financial and progress reports, bidding requests and awards, job
opportunities, etc. on program website

34
The M&E Director will work closely with the MIS Specialist on the Rural Businesses Project, to guarantee the monitoring and compliance according to M&E targets and indicators. M&E Specialist responsibilities include:
- Assist the Rural Development Office in monitoring and evaluating Business Plans - Monitor, in coordination with the specialists team, the compliance with the Rural
Business Project Indicators - Oversee the accomplishment of performance targets linked to the Rural Business
Project - Design formats for reports, which facilitate M&E rural business information
management - Assist the Rural Business Direction in monitoring and evaluating the indicators
pointed out in the Business Plans - Work closely with the M&E Director and the Information Systems Specialist, for
designing and implementing M&E’s Automated Information System, focusing on aspects related to rural businesses
- Assist M&E Direction in field supervisions, required data analysis for the indicators, and progress reports submission
7. Budget The cost of the M&E program is estimated at $ 2.5 million. The costs have been derived on the basis of a detailed examination of necessary resources and unit costs for each component. All line items a) are rounded up to the nearest thousand dollars, and b) allow for projected inflation. This budget will be revised when procurement are awarded and as new information becomes available.
Table 8: M&E Estimated Budget Item Year 1 Year 2 Year 3 Year 4 Year 5 Total
Procurements Data Collection 37,742 219,902 190,362 61,770 291,609 801,385 Data Quality Review 0 43,895 75,800 85,826 92,410 297,931 INEC Contract: LSMS plus Land Module 8,107 5,637 0 0 90,000 103,744 Other studies 13,926 53,910 55,003 173,103 233,229 529,171 Specials studies 395,277 256,852 652,129
Design, development and maintenance of M&E’s system. (including software) 34,256 25,314 3,630 0 0 63,200 M&E visits and Project supervision * 2,280 5,777 1,383 3,000 0 12,440 Training and capacity building 0 0 0 20,000 20,000 40,000
Total 96,311 354,435 326,178 738,976 984,100
2,500,000 * Does not include operative expenses for M&E Director, M&E Rural Businesses Specialist, and MIS
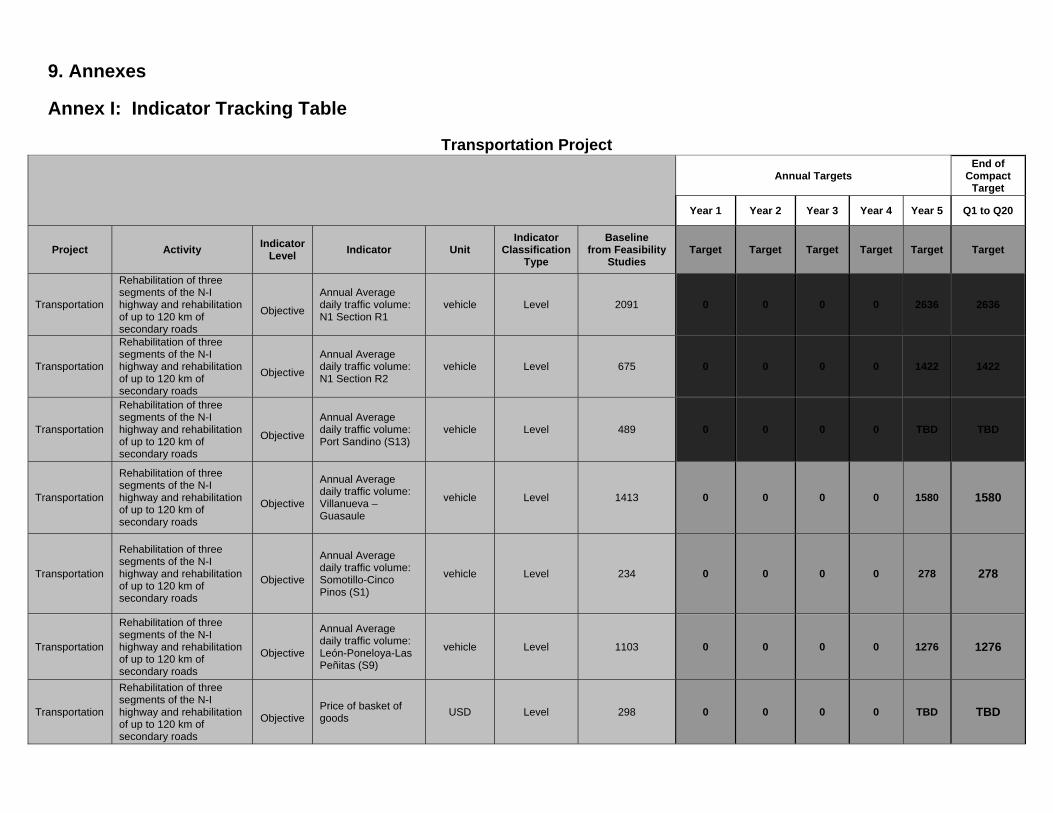
9. Annexes
Annex I: Indicator Tracking Table
Transportation Project
Annual Targets End of
Compact Target
Year 1 Year 2 Year 3 Year 4 Year 5 Q1 to Q20
Project Activity Indicator
Level Indicator Unit
Indicator Classification
Type
Baseline from Feasibility
Studies Target Target Target Target Target Target
Transportation
Rehabilitation of three segments of the N-I highway and rehabilitation of up to 120 km of secondary roads
Objective
Annual Average daily traffic volume: N1 Section R1
vehicle Level 2091 0 0 0 0 2636 2636
Transportation
Rehabilitation of three segments of the N-I highway and rehabilitation of up to 120 km of secondary roads
Objective
Annual Average daily traffic volume: N1 Section R2
vehicle Level 675 0 0 0 0 1422 1422
Transportation
Rehabilitation of three segments of the N-I highway and rehabilitation of up to 120 km of secondary roads
Objective
Annual Average daily traffic volume: Port Sandino (S13)
vehicle Level 489 0 0 0 0 TBD TBD
Transportation
Rehabilitation of three segments of the N-I highway and rehabilitation of up to 120 km of secondary roads
Objective
Annual Average daily traffic volume: Villanueva – Guasaule
vehicle Level 1413 0 0 0 0 1580 1580
Transportation
Rehabilitation of three segments of the N-I highway and rehabilitation of up to 120 km of secondary roads
Objective
Annual Average daily traffic volume: Somotillo-Cinco Pinos (S1)
vehicle Level 234 0 0 0 0 278 278
Transportation
Rehabilitation of three segments of the N-I highway and rehabilitation of up to 120 km of secondary roads
Objective
Annual Average daily traffic volume: León-Poneloya-Las Peñitas (S9)
vehicle Level 1103 0 0 0 0 1276 1276
Transportation
Rehabilitation of three segments of the N-I highway and rehabilitation of up to 120 km of secondary roads
Objective
Price of basket of goods
USD Level 298 0 0 0 0 TBD TBD
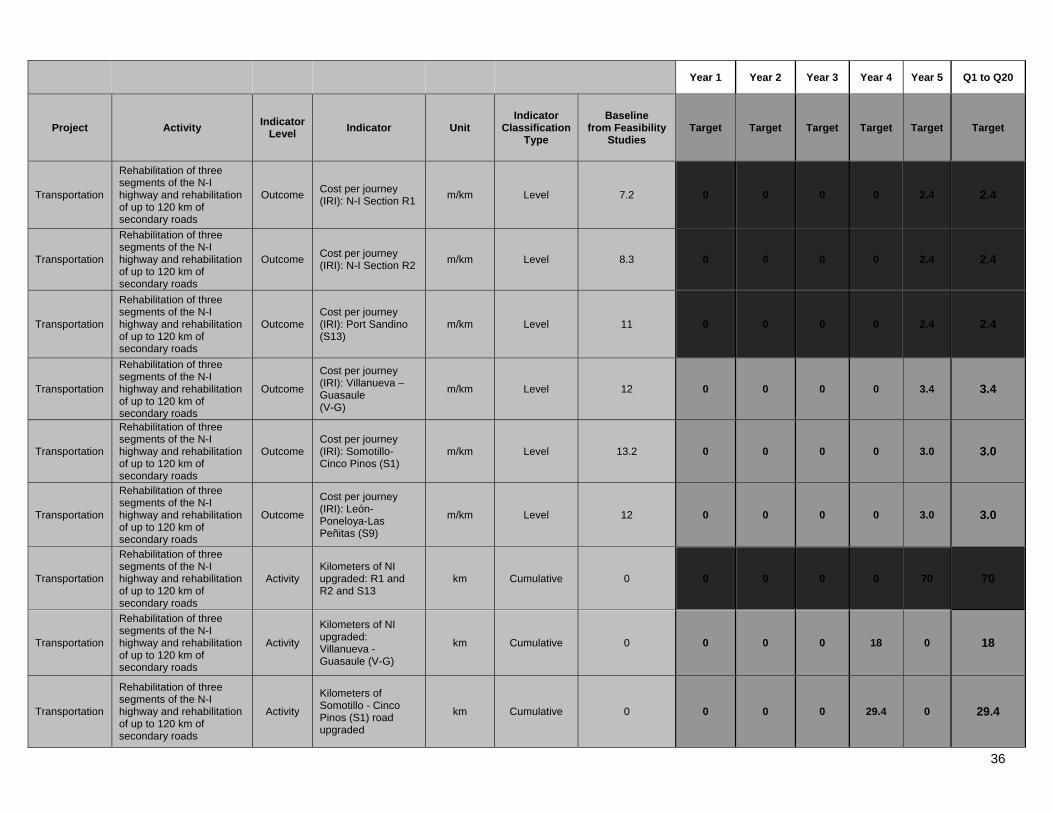
36
Year 1 Year 2 Year 3 Year 4 Year 5 Q1 to Q20
Project Activity Indicator
Level Indicator Unit
Indicator Classification
Type
Baseline from Feasibility
Studies Target Target Target Target Target Target
Transportation
Rehabilitation of three segments of the N-I highway and rehabilitation of up to 120 km of secondary roads
Outcome Cost per journey (IRI): N-I Section R1
m/km Level 7.2 0 0 0 0 2.4 2.4
Transportation
Rehabilitation of three segments of the N-I highway and rehabilitation of up to 120 km of secondary roads
Outcome Cost per journey (IRI): N-I Section R2
m/km Level 8.3 0 0 0 0 2.4 2.4
Transportation
Rehabilitation of three segments of the N-I highway and rehabilitation of up to 120 km of secondary roads
Outcome Cost per journey (IRI): Port Sandino (S13)
m/km Level 11 0 0 0 0 2.4 2.4
Transportation
Rehabilitation of three segments of the N-I highway and rehabilitation of up to 120 km of secondary roads
Outcome
Cost per journey (IRI): Villanueva – Guasaule (V-G)
m/km Level 12 0 0 0 0 3.4 3.4
Transportation
Rehabilitation of three segments of the N-I highway and rehabilitation of up to 120 km of secondary roads
Outcome Cost per journey (IRI): Somotillo-Cinco Pinos (S1)
m/km Level 13.2 0 0 0 0 3.0 3.0
Transportation
Rehabilitation of three segments of the N-I highway and rehabilitation of up to 120 km of secondary roads
Outcome
Cost per journey (IRI): León-Poneloya-Las Peñitas (S9)
m/km Level 12 0 0 0 0 3.0 3.0
Transportation
Rehabilitation of three segments of the N-I highway and rehabilitation of up to 120 km of secondary roads
Activity Kilometers of NI upgraded: R1 and R2 and S13
km Cumulative 0 0 0 0 0 70 70
Transportation
Rehabilitation of three segments of the N-I highway and rehabilitation of up to 120 km of secondary roads
Activity
Kilometers of NI upgraded: Villanueva - Guasaule (V-G)
km Cumulative 0 0 0 0 18 0 18
Transportation
Rehabilitation of three segments of the N-I highway and rehabilitation of up to 120 km of secondary roads
Activity
Kilometers of Somotillo - Cinco Pinos (S1) road upgraded
km Cumulative 0 0 0 0 29.4 0 29.4

37
Year 1 Year 2 Year 3 Year 4 Year 5 Q1 to Q20
Project Activity Indicator
Level Indicator Unit
Indicator Classification
Type
Baseline from Feasibility
Studies Target Target Target Target Target Target
Transportation
Rehabilitation of three segments of the N-I highway and rehabilitation of up to 120 km of secondary roads
Activity Kilometers of León - Poneloya (S9) road upgraded
km Cumulative 0 0 0 0 19.6 0 19.6
Transportation
Rehabilitation of three segments of the N-I highway and rehabilitation of up to 120 km of secondary roads
Activity
Kilometers of designed NI Sección R1 (Nejapa - Santa Rita)
km Cumulative 0 0 22 0 0 0 22
Transportation
Rehabilitation of three segments of the N-I highway and rehabilitation of up to 120 km of secondary roads
Activity
Kilometers of designed NI Sección R2 (Santa Rita - Izapa)
km Cumulative 0 0 36 0 0 0 36
Transportation
Rehabilitation of three segments of the N-I highway and rehabilitation of up to 120 km of secondary roads
Activity Kilometers of designed Puerto Sandino (S13)
km Cumulative 0 0 12 0 0 0 12
Transportation
Rehabilitation of three segments of the N-I highway and rehabilitation of up to 120 km of secondary roads
Activity Kilometers of designed Villanueva – Guasaule (V-G)
km Cumulative 0 0 18 0 0 0 18
Transportation
Rehabilitation of three segments of the N-I highway and rehabilitation of up to 120 km of secondary roads
Activity Kilometers of designed Somotillo - Cinco Pinos (S1)
km Cumulative 0 0 29.4 0 0 0 29.4
Transportation
Rehabilitation of three segments of the N-I highway and rehabilitation of up to 120 km of secondary roads
Activity
Kilometers of designed Cinco Pinos - San Francisco del Norte (S2)
km Cumulative 0 0 15.6 0 0 0 15.6
Transportation
Rehabilitation of three segments of the N-I highway and rehabilitation of up to 120 km of secondary roads
Activity
Kilometers of designed Cinco Pinos - San Pedro (S3)
km Cumulative 0 0 9.7 0 0 0 9.7

38
Year 1 Year 2 Year 3 Year 4 Year 5 Q1 to Q20
Project Activity Indicator
Level Indicator Unit
Indicator Classification
Type
Baseline from Feasibility
Studies Target Target Target Target Target Target
Transportation
Rehabilitation of three segments of the N-I highway and rehabilitation of up to 120 km of secondary roads
Activity Kilometers of designed Villanueva - El Sacue (S4)
km Cumulative 0 0 40.5 0 0 0 40.5
Transportation
Rehabilitation of three segments of the N-I highway and rehabilitation of up to 120 km of secondary roads
Activity Kilometers of designed El Sauce - Achuapa (S5)
km Cumulative 0 0 22.4 0 0 0 22.4
Transportation
Rehabilitation of three segments of the N-I highway and rehabilitation of up to 120 km of secondary roads
Activity
Kilometers of designed Santa Teresa - Las Brisas (S6)
km Cumulative 0 0 13.5 0 0 0 13.5
Transportation
Rehabilitation of three segments of the N-I highway and rehabilitation of up to 120 km of secondary roads
Activity
Kilometers of designed La Paz Centro - Malpaisillo (S7)
km Cumulative 0 0 37.2 0 0 0 37.2
Transportation
Rehabilitation of three segments of the N-I highway and rehabilitation of up to 120 km of secondary roads
Activity Kilometers of designed Malpaisillo - Villanueva (S8)
km Cumulative 0 0 36.4 0 0 0 36.4
Transportation
Rehabilitation of three segments of the N-I highway and rehabilitation of up to 120 km of secondary roads
Activity
Kilometers of designed León - Poneloya - Las Peñitas (S9)
km Cumulative 0 0 19.6 0 0 0 19.6
Transportation
Rehabilitation of three segments of the N-I highway and rehabilitation of up to 120 km of secondary roads
Activity
Kilometers of designed Empalme Jiquilillo - Padre Ramos (S10)
km Cumulative 0 0 11.7 0 0 0 11.7
Transportation
Rehabilitation of three segments of the N-I highway and rehabilitation of up to 120 km of secondary roads
Activity
Kilometers of designed Achuapa - San Juan de Limay (S11)
km Cumulative 0 0 16.2 0 0 0 16.2

39
Year 1 Year 2 Year 3 Year 4 Year 5 Q1 to Q20
Project Activity Indicator
Level Indicator Unit
Indicator Classification
Type
Baseline from Feasibility
Studies Target Target Target Target Target Target
Transportation
Rehabilitation of three segments of the N-I highway and rehabilitation of up to 120 km of secondary roads
Activity
Kilometers of designed San Juan de Limay - La Sirena (S12)
km Cumulative 0 0 36.3 0 0 0 36.3
Transportation
Rehabilitation of three segments of the N-I highway and rehabilitation of up to 120 km of secondary roads
Activity Resettlement Plan for primary and secondary roads
Plan Incremental 0 0 0 1 1 0 2
Transportation
Rehabilitation of three segments of the N-I highway and rehabilitation of up to 120 km of secondary roads
Activity
No. of families and/or business that have been resettled as a result of the reconstruction of the road Villanueva Guasale
Families/ Businesses
Cumulative 0 0 0 1 13 0 13
Transportation
Rehabilitation of three segments of the N-I highway and rehabilitation of up to 120 km of secondary roads
Activity
No. of families and/or business that have been resettled as a result of the reconstruction of the road Cinco Pinos Somotillo (S1)
Families/ Businesses
Cumulative 0 0 0 0 31 0 31
Transportation
Rehabilitation of three segments of the N-I highway and rehabilitation of up to 120 km of secondary roads
Activity
Number of cases in which affected people have been duly compensated to clear the right-of-way in the road section Leon - Poneloya (S9)
Cases Cumulative 0 0 0 0 30 0 30
Transportation
Rehabilitation of three segments of the N-I highway and rehabilitation of up to 120 km of secondary roads
Activity People living in the influence area of secondary roads.
People Cumulative 0 0 0 0 0 0 0
Transportation
Rehabilitation of three segments of the N-I highway and rehabilitation of up to 120 km of secondary roads
Process milestone
Amount disbursed Villanueva – Guasaule
USD Cumulative 0 0 0 0 0 0
15,088,629
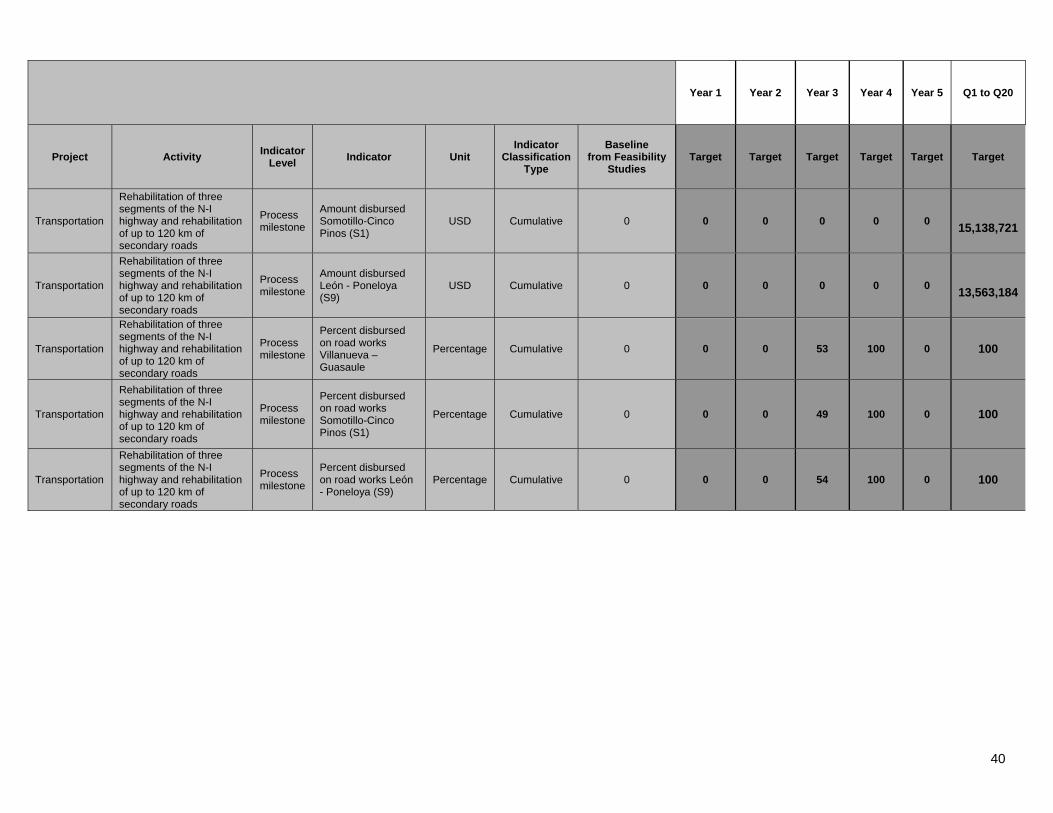
40
Year 1 Year 2 Year 3 Year 4 Year 5 Q1 to Q20
Project Activity Indicator
Level Indicator Unit
Indicator Classification
Type
Baseline from Feasibility
Studies Target Target Target Target Target Target
Transportation
Rehabilitation of three segments of the N-I highway and rehabilitation of up to 120 km of secondary roads
Process milestone
Amount disbursed Somotillo-Cinco Pinos (S1)
USD Cumulative 0 0 0 0 0 0
15,138,721
Transportation
Rehabilitation of three segments of the N-I highway and rehabilitation of up to 120 km of secondary roads
Process milestone
Amount disbursed León - Poneloya (S9)
USD Cumulative 0 0 0 0 0 0
13,563,184
Transportation
Rehabilitation of three segments of the N-I highway and rehabilitation of up to 120 km of secondary roads
Process milestone
Percent disbursed on road works Villanueva – Guasaule
Percentage Cumulative 0 0 0 53 100 0 100
Transportation
Rehabilitation of three segments of the N-I highway and rehabilitation of up to 120 km of secondary roads
Process milestone
Percent disbursed on road works Somotillo-Cinco Pinos (S1)
Percentage Cumulative 0 0 0 49 100 0 100
Transportation
Rehabilitation of three segments of the N-I highway and rehabilitation of up to 120 km of secondary roads
Process milestone
Percent disbursed on road works León - Poneloya (S9)
Percentage Cumulative 0 0 0 54 100 0 100
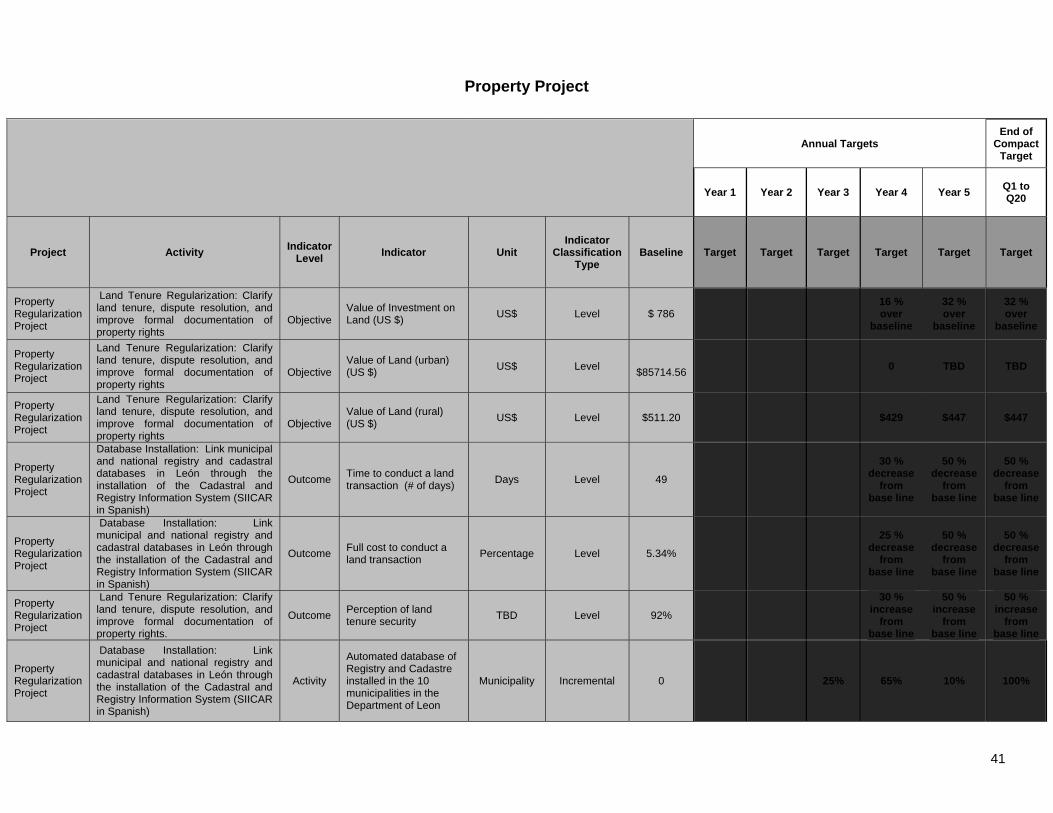
41
Property Project
Annual Targets End of
Compact Target
Year 1 Year 2 Year 3 Year 4 Year 5 Q1 to Q20
Project Activity Indicator
Level Indicator Unit
Indicator Classification
Type Baseline Target Target Target Target Target Target
Property Regularization Project
Land Tenure Regularization: Clarify land tenure, dispute resolution, and improve formal documentation of property rights
Objective
Value of Investment on Land (US $)
US$ Level $ 786 16 % over
baseline
32 % over
baseline
32 % over
baseline
Property Regularization Project
Land Tenure Regularization: Clarify land tenure, dispute resolution, and improve formal documentation of property rights
Objective
Value of Land (urban) (US $)
US$ Level
$85714.56 0 TBD TBD
Property Regularization Project
Land Tenure Regularization: Clarify land tenure, dispute resolution, and improve formal documentation of property rights
Objective
Value of Land (rural) (US $)
US$ Level $511.20 $429 $447 $447
Property Regularization Project
Database Installation: Link municipal and national registry and cadastral databases in León through the installation of the Cadastral and Registry Information System (SIICAR in Spanish)
Outcome Time to conduct a land transaction (# of days)
Days Level 49
30 % decrease
from base line
50 % decrease
from base line
50 % decrease
from base line
Property Regularization Project
Database Installation: Link municipal and national registry and cadastral databases in León through the installation of the Cadastral and Registry Information System (SIICAR in Spanish)
Outcome Full cost to conduct a land transaction
Percentage Level 5.34%
25 % decrease
from base line
50 % decrease
from base line
50 % decrease
from base line
Property Regularization Project
Land Tenure Regularization: Clarify land tenure, dispute resolution, and improve formal documentation of property rights.
Outcome Perception of land tenure security
TBD Level 92%
30 % increase
from base line
50 % increase
from base line
50 % increase
from base line
Property Regularization Project
Database Installation: Link municipal and national registry and cadastral databases in León through the installation of the Cadastral and Registry Information System (SIICAR in Spanish)
Activity
Automated database of Registry and Cadastre installed in the 10 municipalities in the Department of Leon
Municipality Incremental 0 25% 65% 10% 100%

42
Year 1 Year 2 Year 3 Year 4 Year 5
Q1 to Q20
Project Activity Indicator
Level Indicator Unit
Indicator Classification
Type Baseline Target Target Target Target Target Target
Property Regularization Project
Land Tenure Regularization: Clarify land tenure, dispute resolution, and improve formal documentation of property rights
Activity Number of additional parcels with a registered title (urban)
parcel Incremental 0 5,500 8,800 7,700 22,000
Property Regularization Project
Land Tenure Regularization: Clarify land tenure, dispute resolution, and improve formal documentation of property rights
Activity Number of additional parcels with a registered title (rural)
Parcel Incremental 0 5,250 8,400 7,350 21,000
Property Regularization Project
Protected Areas Demarcation Activity Number of Protected Areas with formulated Management Plans
protected area
Incremental 0 2 1 1 0 4
Property Regularization Project
Protected Areas Demarcation Activity Number of Protected areas demarcated
protected area
Incremental 0 3 1 0 0 4
Property Regularization Project
Land Tenure Regularization: Clarify land tenure, dispute resolution, and improve formal documentation of property rights
Activity Percentage of conflicts resolved by mediation program
% Level 0 80% 90% 90% 90%
Property Regularization Project
Cadastral Mapping: Conduct area-wide cadastral mapping in León to obtain current property descriptions to be recorded in a geographic information system
Activity Area in Km2 covered by cadastral mapping
Km2 Incremental 0 598.4 2650.2 1889.4 5138
Property Regularization Project
Cadastral Mapping: Conduct area-wide cadastral mapping in León to obtain current property descriptions to be recorded in a geographic information system
Activity
Pilote Plan of the Cadastral Survey and the Property Regularization
Percent Incremental 0 100% 0 0 100%
Property Regularization Project
Cadastral Mapping: Conduct area-wide cadastral mapping in León to obtain current property descriptions to be recorded in a geographic information system
Activity
Aerial Photogrammetric Flights and orthophoto Maps for the Cadastral Survey
Percent Incremental 0 100% 0 0 100%
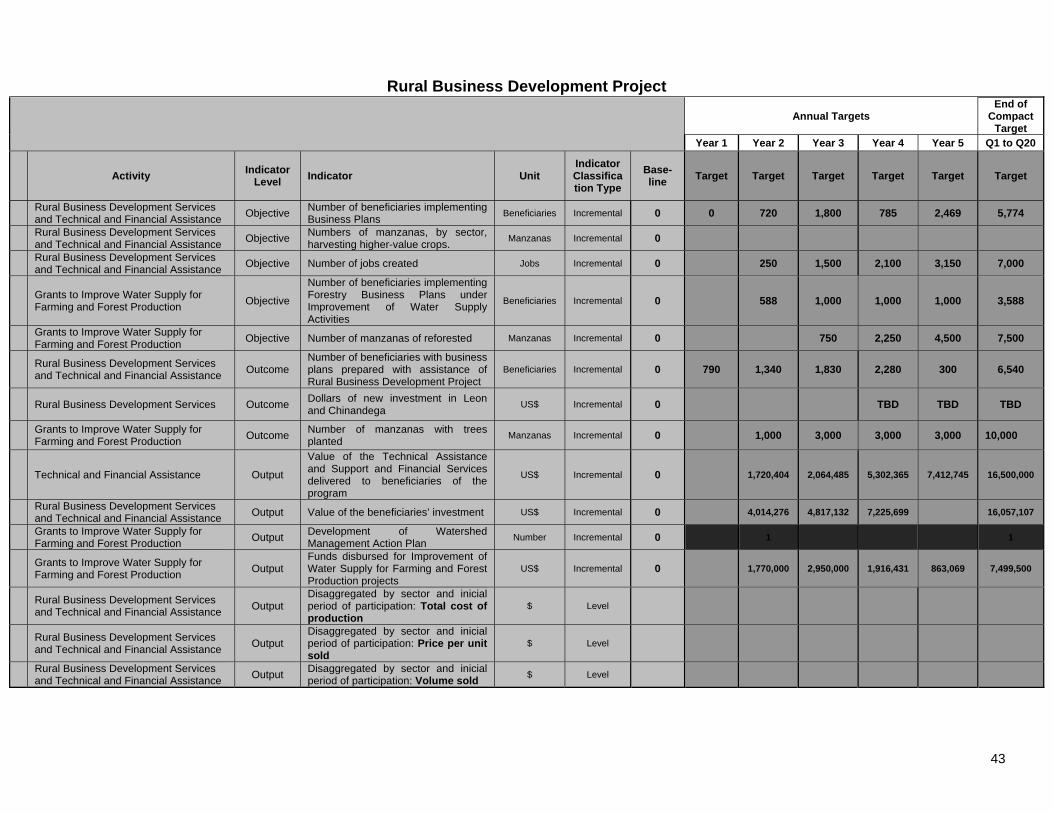
43
Rural Business Development Project
Annual Targets
End of Compact
Target Year 1 Year 2 Year 3 Year 4 Year 5 Q1 to Q20
Activity Indicator
Level Indicator Unit
Indicator Classification Type
Base-line
Target Target Target Target Target Target
Rural Business Development Services and Technical and Financial Assistance
Objective Number of beneficiaries implementing Business Plans
Beneficiaries Incremental 0 0 720 1,800 785 2,469 5,774
Rural Business Development Services and Technical and Financial Assistance
Objective Numbers of manzanas, by sector, harvesting higher-value crops.
Manzanas Incremental 0
Rural Business Development Services and Technical and Financial Assistance
Objective Number of jobs created Jobs Incremental 0 250 1,500 2,100 3,150 7,000
Grants to Improve Water Supply for Farming and Forest Production
Objective
Number of beneficiaries implementing Forestry Business Plans under Improvement of Water Supply Activities
Beneficiaries Incremental 0 588 1,000 1,000 1,000 3,588
Grants to Improve Water Supply for Farming and Forest Production
Objective Number of manzanas of reforested Manzanas Incremental 0 750 2,250 4,500 7,500
Rural Business Development Services and Technical and Financial Assistance
Outcome Number of beneficiaries with business plans prepared with assistance of Rural Business Development Project
Beneficiaries Incremental 0 790 1,340 1,830 2,280 300 6,540
Rural Business Development Services Outcome Dollars of new investment in Leon and Chinandega
US$ Incremental 0 TBD TBD TBD
Grants to Improve Water Supply for Farming and Forest Production
Outcome Number of manzanas with trees planted
Manzanas Incremental 0 1,000 3,000 3,000 3,000 10,000
Technical and Financial Assistance Output
Value of the Technical Assistance and Support and Financial Services delivered to beneficiaries of the program
US$ Incremental 0 1,720,404 2,064,485 5,302,365 7,412,745 16,500,000
Rural Business Development Services and Technical and Financial Assistance
Output Value of the beneficiaries’ investment US$ Incremental 0 4,014,276 4,817,132 7,225,699
16,057,107
Grants to Improve Water Supply for Farming and Forest Production
Output Development of Watershed Management Action Plan
Number Incremental 0 1 1
Grants to Improve Water Supply for Farming and Forest Production
Output Funds disbursed for Improvement of Water Supply for Farming and Forest Production projects
US$ Incremental 0 1,770,000 2,950,000 1,916,431 863,069 7,499,500
Rural Business Development Services and Technical and Financial Assistance
Output Disaggregated by sector and inicial period of participation: Total cost of production
$ Level
Rural Business Development Services and Technical and Financial Assistance
Output Disaggregated by sector and inicial period of participation: Price per unit sold
$ Level
Rural Business Development Services and Technical and Financial Assistance
Output Disaggregated by sector and inicial period of participation: Volume sold
$ Level
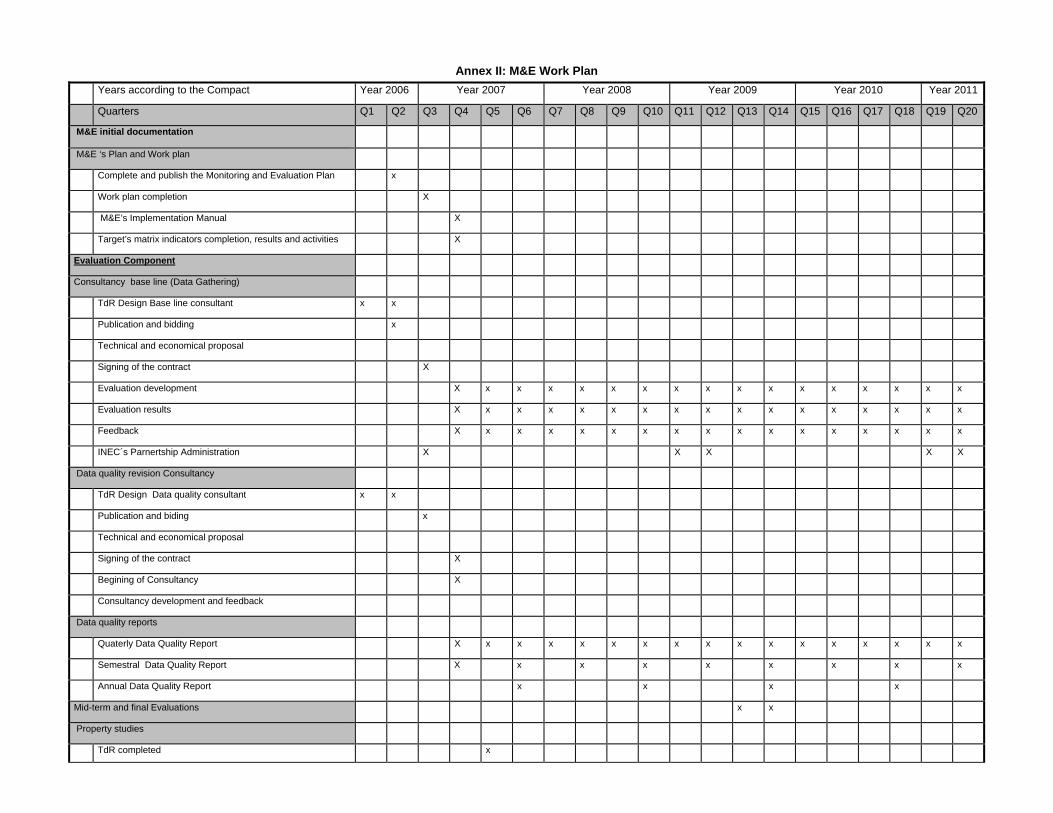
Annex II: M&E Work Plan
Years according to the Compact Year 2006 Year 2007 Year 2008 Year 2009 Year 2010 Year 2011
Quarters Q1 Q2 Q3 Q4 Q5 Q6 Q7 Q8 Q9 Q10 Q11 Q12 Q13 Q14 Q15 Q16 Q17 Q18 Q19 Q20
M&E initial documentation
M&E ‘s Plan and Work plan
Complete and publish the Monitoring and Evaluation Plan x
Work plan completion X
M&E’s Implementation Manual X
Target’s matrix indicators completion, results and activities X
Evaluation Component
Consultancy base line (Data Gathering)
TdR Design Base line consultant x x
Publication and bidding x
Technical and economical proposal
Signing of the contract X
Evaluation development X x x x x x x x x x x x x x x x x
Evaluation results X x x x x x x x x x x x x x x x x
Feedback X x x x x x x x x x x x x x x x x
INEC´s Parnertship Administration X X X X X
Data quality revision Consultancy
TdR Design Data quality consultant x x
Publication and biding x
Technical and economical proposal
Signing of the contract X
Begining of Consultancy X
Consultancy development and feedback
Data quality reports
Quaterly Data Quality Report X x x x x x x x x x x x x x x x x
Semestral Data Quality Report X x x x x x x x x
Annual Data Quality Report x x x x
Mid-term and final Evaluations x x
Property studies
TdR completed x
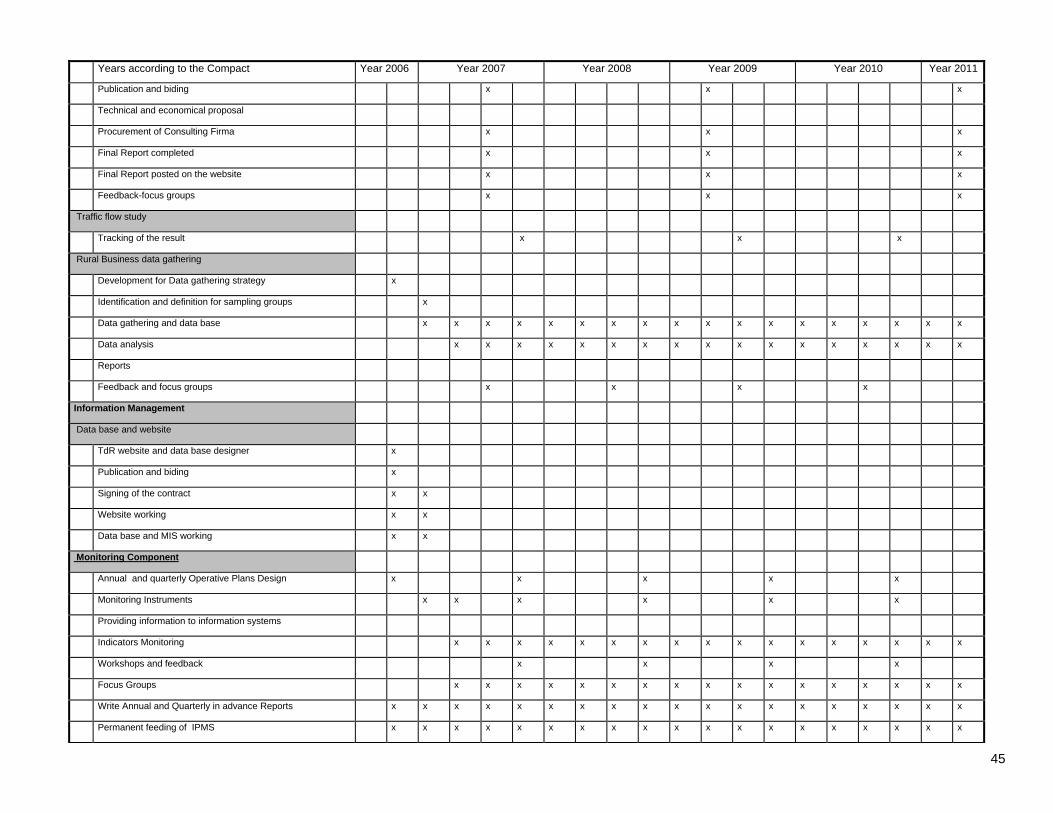
45
Years according to the Compact Year 2006 Year 2007 Year 2008 Year 2009 Year 2010 Year 2011
Publication and biding x x x
Technical and economical proposal
Procurement of Consulting Firma x x x
Final Report completed x x x
Final Report posted on the website x x x
Feedback-focus groups x x x
Traffic flow study
Tracking of the result x x x
Rural Business data gathering
Development for Data gathering strategy x
Identification and definition for sampling groups x
Data gathering and data base x x x x x x x x x x x x x x x x x x
Data analysis x x x x x x x x x x x x x x x x x
Reports
Feedback and focus groups x x x x
Information Management
Data base and website
TdR website and data base designer x
Publication and biding x
Signing of the contract x x
Website working x x
Data base and MIS working x x
Monitoring Component
Annual and quarterly Operative Plans Design x x x x x
Monitoring Instruments x x x x x x
Providing information to information systems
Indicators Monitoring x x x x x x x x x x x x x x x x x
Workshops and feedback x x x x
Focus Groups x x x x x x x x x x x x x x x x x
Write Annual and Quarterly in advance Reports x x x x x x x x x x x x x x x x x x x
Permanent feeding of IPMS x x x x x x x x x x x x x x x x x x x
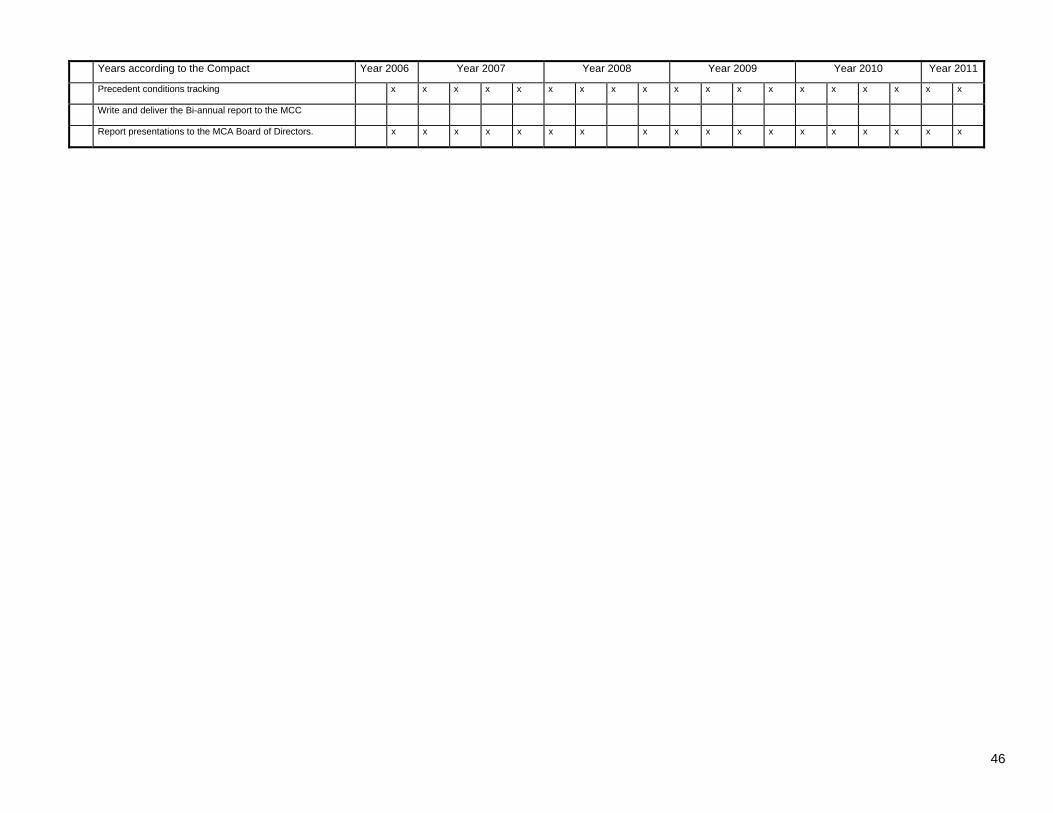
46
Years according to the Compact Year 2006 Year 2007 Year 2008 Year 2009 Year 2010 Year 2011
Precedent conditions tracking x x x x x x x x x x x x x x x x x x x
Write and deliver the Bi-annual report to the MCC
Report presentations to the MCA Board of Directors. x x x x x x x x x x x x x x x x x x

Annex III: Changes to the M&E Plan
The M&E Plan de 2006 – 2007 actualized for a memorando (2007-2008):
Nicaragua M&E Indicator Modifications General Table April 20, 2006
Targets
Year
Indicator Baseline 1 2 3 4 5
Time to conduct a land transaction
Modified 65 days 30% decrease
from baseline
40% decrease
from baseline
50% decrease
from baseline
Compact 65 days 15.9% decrease
from baseline
29.3% decrease
from baseline
40.5% decrease
from baseline
50% decrease
from baseline
Full cost to conduct a land transaction
Modified 6.5% 25% decrease
from baseline
50% decrease
from baseline
Compact 6.5% 25% decrease
from baseline
50% decrease
from baseline
Perception of tenure security
Modified TBD 30% increase
over baseline
50% increase
over baseline
Compact TBD 30% decrease
from baseline
50% increase
over baseline
Targets
Year
Indicator 1 2 3 4 5 Total
Protected areas demarcated
Modified 3 1 4
Compact 0.40 3.6 4
Number of Protected Area Management Plans Implemented
Modified 2 1 1 4
Compact 1 1 1 1 4
Percentage of conflicts resolved by program mediation (reported as number resolved divided by number received) Changed from: Number of conflicts resolved by program mediation
Modified 80% 90% 90%
Compact 500
2,000
1,500
4,000
Submitted by: MCA-Nicaragua Date: April 20, 2006 Country: Nicaragua

48
Project: Property Regularization Project Indicator: Time to conduct a land transaction Modification: Revision to annual distribution of targets Justification: In preparation for entry into force, MCC held a series of discussions to review the disbursement agreement content with the implementing entity that will carry out this project under an agreement with MCA-Nicaragua. In light of MCC early experience in other countries, the discussions of performance targets from the M&E plan concluded that the placement of targets in the first and second year for certain indicators did not adequately account for the timeline for general start up processes, final establishment of baselines and procurement processes. While the targets set in the compact could be met, several were considered to be at risk of not being met because of this. For each such indicator, MCC agreed to a shift based on the need to accommodate more realistic start up timelines and the view that the change would not have any significant effect on the projected economic rate of return. For this particular indicator, dropping the target of 15.9 percent in Year 2 would have no significant effect on the projected economic rate of return and MCC considers it appropriate to delete it from the M&E plan. The final goal of a 50% reduction will still be fully met.
Targets
Year
Indicator Baseline 1 2 3 4 5
Time to conduct a land transaction
Modified 65 days 30% decrease from baseline
40% decrease from
baseline
50% decrease
from baseline Compact 65 days 15.9% decrease
from baseline 29.3%
decrease from baseline
40.5% decrease from
baseline
50% decrease
from baseline
Project: Property Regularization Project Indicator: Full cost to conduct a land transaction Modification: Revision to annual distribution of targets Justification: In preparation for entry into force, MCC held a series of discussions with the implementing entity that will carry out this project under an agreement with MCA-Nicaragua to review the disbursement agreement content. In light of MCC early experience in other countries, the discussions of performance targets from the M&E plan concluded that the placement of targets in the first and second year for certain indicators did not adequately account for the timeline for general start up processes, final establishment of baselines and procurement processes. While the targets set in the compact could be met, several were considered to be at risk of not being met because of this. For each such indicator, MCC agreed to a shift based on the need to accommodate more realistic start up timelines and the view that the change would not have any significant effect on the projected economic rate of return. For this particular indicator, shifting the target of 25 percent reduction in year 2 to year 3 would have no significant effect on the projected economic rate of return and MCC considers it an appropriate modification. . The final goal of a 50% reduction will still be fully met.
Targets
Year
Indicator Baseline 1 2 3 4 5
Full cost to conduct a land transaction
Modified 6.5% 25% decrease
from baseline
50% decrease from baseline
Compact 6.5% 25% decrease from baseline
50% decrease from baseline
Project: Property Regularization Project Indicator: Perception of tenure security Modification: Revision to annual distribution of targets Justification: In preparation for entry into force, MCC held a series of discussions with the implementing entity that will carry out this project under an agreement with MCA-Nicaragua to review the disbursement agreement content. In light of MCC early experience in other countries, the discussions of performance targets from the M&E plan concluded that the placement of targets in the first and second year for certain indicators did not adequately account for the timeline for general start up processes, final establishment of
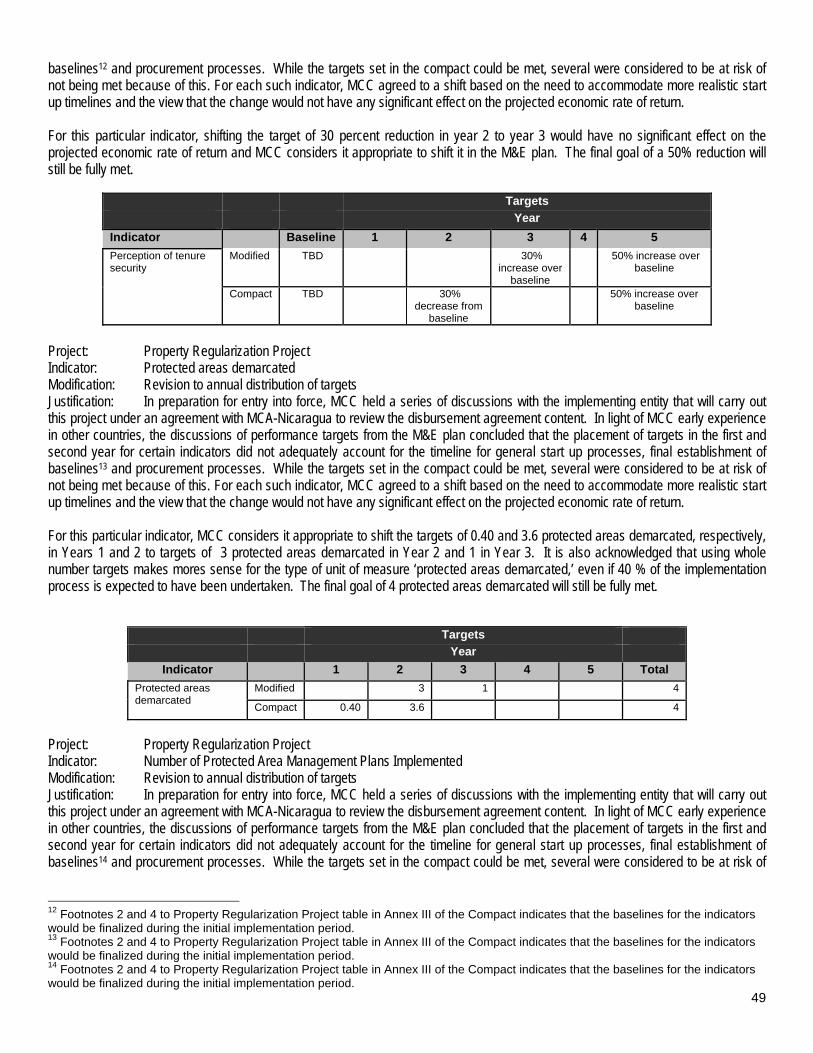
49
baselines12 and procurement processes. While the targets set in the compact could be met, several were considered to be at risk of not being met because of this. For each such indicator, MCC agreed to a shift based on the need to accommodate more realistic start up timelines and the view that the change would not have any significant effect on the projected economic rate of return. For this particular indicator, shifting the target of 30 percent reduction in year 2 to year 3 would have no significant effect on the projected economic rate of return and MCC considers it appropriate to shift it in the M&E plan. The final goal of a 50% reduction will still be fully met.
Targets
Year
Indicator Baseline 1 2 3 4 5
Perception of tenure security
Modified TBD 30% increase over
baseline
50% increase over baseline
Compact TBD 30% decrease from
baseline
50% increase over baseline
Project: Property Regularization Project Indicator: Protected areas demarcated Modification: Revision to annual distribution of targets Justification: In preparation for entry into force, MCC held a series of discussions with the implementing entity that will carry out this project under an agreement with MCA-Nicaragua to review the disbursement agreement content. In light of MCC early experience in other countries, the discussions of performance targets from the M&E plan concluded that the placement of targets in the first and second year for certain indicators did not adequately account for the timeline for general start up processes, final establishment of baselines13 and procurement processes. While the targets set in the compact could be met, several were considered to be at risk of not being met because of this. For each such indicator, MCC agreed to a shift based on the need to accommodate more realistic start up timelines and the view that the change would not have any significant effect on the projected economic rate of return. For this particular indicator, MCC considers it appropriate to shift the targets of 0.40 and 3.6 protected areas demarcated, respectively, in Years 1 and 2 to targets of 3 protected areas demarcated in Year 2 and 1 in Year 3. It is also acknowledged that using whole number targets makes mores sense for the type of unit of measure ‘protected areas demarcated,’ even if 40 % of the implementation process is expected to have been undertaken. The final goal of 4 protected areas demarcated will still be fully met.
Targets
Year
Indicator 1 2 3 4 5 Total
Protected areas demarcated
Modified 3 1 4
Compact 0.40 3.6 4
Project: Property Regularization Project Indicator: Number of Protected Area Management Plans Implemented Modification: Revision to annual distribution of targets Justification: In preparation for entry into force, MCC held a series of discussions with the implementing entity that will carry out this project under an agreement with MCA-Nicaragua to review the disbursement agreement content. In light of MCC early experience in other countries, the discussions of performance targets from the M&E plan concluded that the placement of targets in the first and second year for certain indicators did not adequately account for the timeline for general start up processes, final establishment of baselines14 and procurement processes. While the targets set in the compact could be met, several were considered to be at risk of
12 Footnotes 2 and 4 to Property Regularization Project table in Annex III of the Compact indicates that the baselines for the indicators would be finalized during the initial implementation period. 13 Footnotes 2 and 4 to Property Regularization Project table in Annex III of the Compact indicates that the baselines for the indicators would be finalized during the initial implementation period. 14 Footnotes 2 and 4 to Property Regularization Project table in Annex III of the Compact indicates that the baselines for the indicators would be finalized during the initial implementation period.
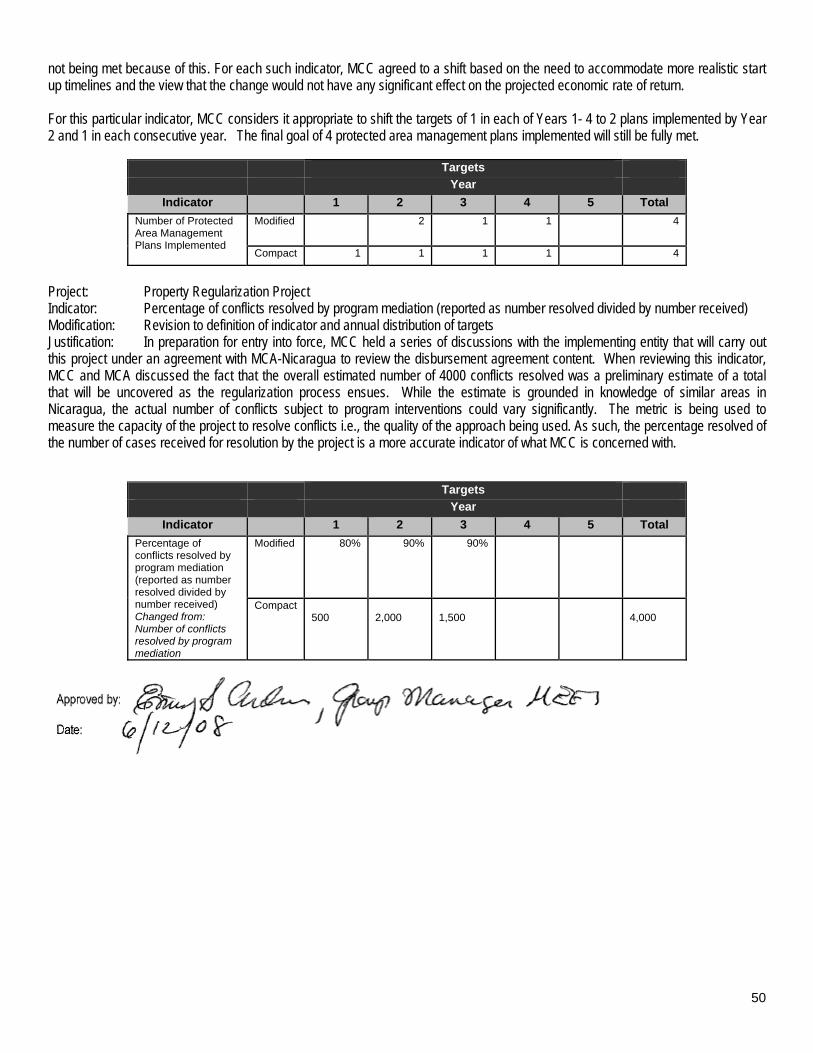
50
not being met because of this. For each such indicator, MCC agreed to a shift based on the need to accommodate more realistic start up timelines and the view that the change would not have any significant effect on the projected economic rate of return. For this particular indicator, MCC considers it appropriate to shift the targets of 1 in each of Years 1- 4 to 2 plans implemented by Year 2 and 1 in each consecutive year. The final goal of 4 protected area management plans implemented will still be fully met.
Targets
Year
Indicator 1 2 3 4 5 Total
Number of Protected Area Management Plans Implemented
Modified 2 1 1 4
Compact 1 1 1 1 4
Project: Property Regularization Project Indicator: Percentage of conflicts resolved by program mediation (reported as number resolved divided by number received) Modification: Revision to definition of indicator and annual distribution of targets Justification: In preparation for entry into force, MCC held a series of discussions with the implementing entity that will carry out this project under an agreement with MCA-Nicaragua to review the disbursement agreement content. When reviewing this indicator, MCC and MCA discussed the fact that the overall estimated number of 4000 conflicts resolved was a preliminary estimate of a total that will be uncovered as the regularization process ensues. While the estimate is grounded in knowledge of similar areas in Nicaragua, the actual number of conflicts subject to program interventions could vary significantly. The metric is being used to measure the capacity of the project to resolve conflicts i.e., the quality of the approach being used. As such, the percentage resolved of the number of cases received for resolution by the project is a more accurate indicator of what MCC is concerned with.
Targets
Year
Indicator 1 2 3 4 5 Total
Percentage of conflicts resolved by program mediation (reported as number resolved divided by number received) Changed from: Number of conflicts resolved by program mediation
Modified 80% 90% 90%
Compact 500
2,000
1,500
4,000

51
Modifications to Indicators in the Monitoring and Evaluation Plan Submitted by: MCA-Nicaragua Date: September 10, 2009 Country: Nicaragua Project: Transportation Indicator: Income gains of N-I Road upgrade Modification: Annual Review Justification: This indicator was removed since the program has changed; accordingly, it is no longer relevant. Such
provision was included in the Monitoring and Evaluation Policy of Compacts and Threshold Programs, Paragraph 5.2.1., cause No. 1, Change in Indicators. The partial termination of the Program in Nicaragua -expressed in a letter issued by MCC’s Directory and dated 06/10/09- determined to cut off the reconstruction of the primary road NI. Accordingly, this indicator will not be evaluated. Currently, a road section (18Km) of the primary road “Villanueva-Guasaule” is being reconstructed using funds from the Transportation Project, which is part of the Panamerican road connecting the Central American isthmus. This project was not included in the Compact. Accordingly, the impact of this road will be evaluated through annual average indicators related to daily traffic volume, roughness rate and improved kilometers.
Goal Indicator Details Responsible
Entity
Source
Frequency of Data
Collection
Economic Growth and Poverty Reduction
Income gains of N-I Road upgrade
Derived from reduced vehicle operating costs and travel time in the N-I Road. The report for these indicators starts in year 6 because the roads will be rehabilitated until year 2011.
Design Consultancy /
MCA-Nicaragua / FIDEG
Final Report of the N-I Road design and
Report in year 5
Base Line Year 5
Project: Property Indicator: Income gains of Property Regularization Modification: Annual Review Justification: This indicator was removed as a result of changes in the scope of the Project; accordingly, this indicator is no
longer relevant. Such provision was included in the Monitoring and Evaluation Policy of Compacts and Threshold Programs, Paragraph 5.2.1., cause No. 1, Change in Indicators. The partial termination of the Program in Nicaragua -expressed in a letter issued by MCC’s Directory and dated 06/10/09- determined to terminate entirely the property project.
Goal Indicator Details Responsible
Entity
Source Frequency of
Data Collection Economic Growth and Poverty Reduction
Income gains of Property Regularization
Expected income gains are defined as annual increase in property value per manzana multiplied by the number of regularized manzanas. The report for these indicators starts in year 5 because an increase in the income is expected after 2 years that the property is regularized.
Impact Evaluation Consultancy hired by MCC
Analytical Report based on Household Surveys
Baseline, Year 3 and Year 5
Project: Transportation Indicator: Gap between farm-gate price and free-on-board price Modification: Annual Review Justification: This indicator was removed because its quality was poorer than it was originally considered, although this indicator
was selected for inclusion in the plan. Such provision was included in the Monitoring and Evaluation Policy of Compacts and Threshold Programs, Paragraph 5.2.1., cause No. 4, Change in Indicators. This objective indicator was intended to measure the change in income as a result of the program actions aimed at the reconstruction of roads. There are other indicators in the M&E Plan that will measure more effectively the change in income, such as the price indicator of the family shopping basket, which it will be sufficient for this purpose.
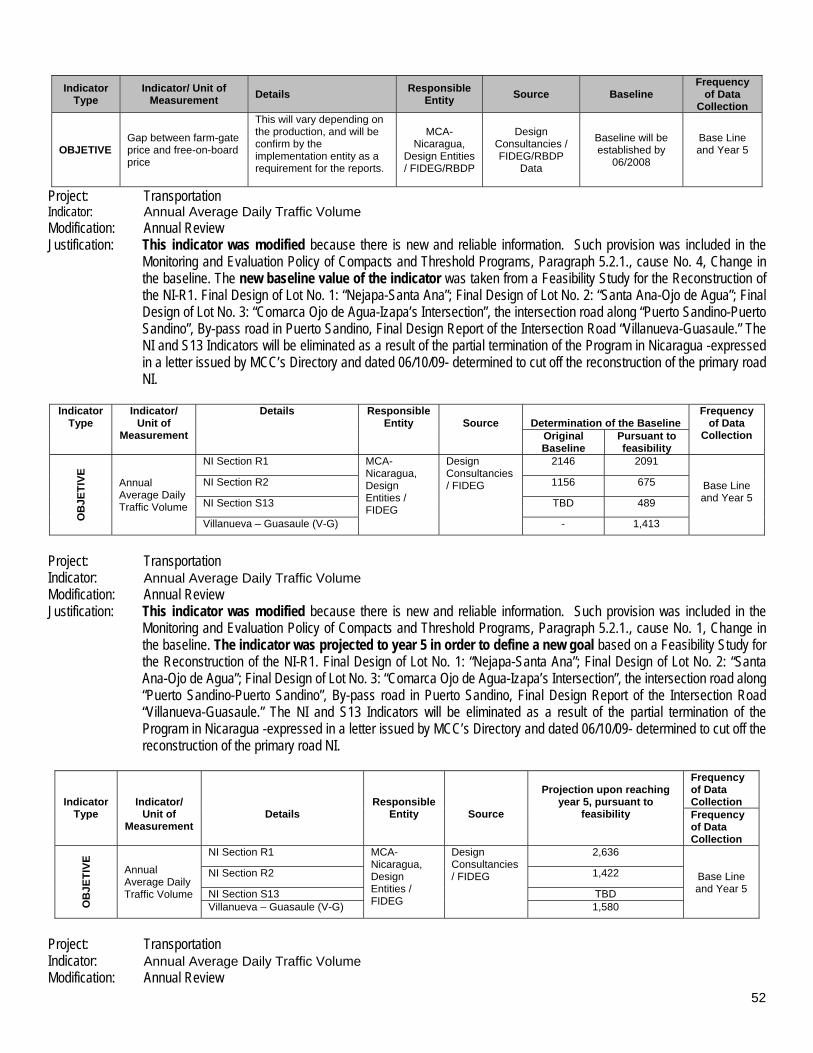
52
Indicator Type
Indicator/ Unit of Measurement
Details Responsible
Entity
Source Baseline
Frequency of Data
Collection
OBJETIVE Gap between farm-gate price and free-on-board price
This will vary depending on the production, and will be confirm by the implementation entity as a requirement for the reports.
MCA-Nicaragua,
Design Entities / FIDEG/RBDP
Design Consultancies / FIDEG/RBDP
Data
Baseline will be established by
06/2008
Base Line and Year 5
Project: Transportation Indicator: Annual Average Daily Traffic Volume Modification: Annual Review Justification: This indicator was modified because there is new and reliable information. Such provision was included in the
Monitoring and Evaluation Policy of Compacts and Threshold Programs, Paragraph 5.2.1., cause No. 4, Change in the baseline. The new baseline value of the indicator was taken from a Feasibility Study for the Reconstruction of the NI-R1. Final Design of Lot No. 1: “Nejapa-Santa Ana”; Final Design of Lot No. 2: “Santa Ana-Ojo de Agua”; Final Design of Lot No. 3: “Comarca Ojo de Agua-Izapa’s Intersection”, the intersection road along “Puerto Sandino-Puerto Sandino”, By-pass road in Puerto Sandino, Final Design Report of the Intersection Road “Villanueva-Guasaule.” The NI and S13 Indicators will be eliminated as a result of the partial termination of the Program in Nicaragua -expressed in a letter issued by MCC’s Directory and dated 06/10/09- determined to cut off the reconstruction of the primary road NI.
Indicator
Type Indicator/
Unit of Measurement
Details Responsible Entity
Source
Determination of the Baseline
Frequency of Data
Collection Original Baseline
Pursuant to feasibility
OB
JET
IVE
Annual Average Daily Traffic Volume
NI Section R1 MCA-Nicaragua, Design Entities / FIDEG
Design Consultancies / FIDEG
2146 2091
Base Line and Year 5
NI Section R2 1156 675
NI Section S13 TBD 489
Villanueva – Guasaule (V-G) - 1,413
Project: Transportation Indicator: Annual Average Daily Traffic Volume Modification: Annual Review Justification: This indicator was modified because there is new and reliable information. Such provision was included in the
Monitoring and Evaluation Policy of Compacts and Threshold Programs, Paragraph 5.2.1., cause No. 1, Change in the baseline. The indicator was projected to year 5 in order to define a new goal based on a Feasibility Study for the Reconstruction of the NI-R1. Final Design of Lot No. 1: “Nejapa-Santa Ana”; Final Design of Lot No. 2: “Santa Ana-Ojo de Agua”; Final Design of Lot No. 3: “Comarca Ojo de Agua-Izapa’s Intersection”, the intersection road along “Puerto Sandino-Puerto Sandino”, By-pass road in Puerto Sandino, Final Design Report of the Intersection Road “Villanueva-Guasaule.” The NI and S13 Indicators will be eliminated as a result of the partial termination of the Program in Nicaragua -expressed in a letter issued by MCC’s Directory and dated 06/10/09- determined to cut off the reconstruction of the primary road NI.
Indicator Type
Indicator/ Unit of
Measurement
Details
Responsible Entity
Source
Projection upon reaching
year 5, pursuant to feasibility
Frequency of Data CollectionFrequency of Data Collection
OB
JET
IVE
Annual Average Daily Traffic Volume
NI Section R1 MCA-Nicaragua, Design Entities / FIDEG
Design Consultancies / FIDEG
2,636
Base Line and Year 5
NI Section R2 1,422
NI Section S13 TBD Villanueva – Guasaule (V-G) 1,580
Project: Transportation Indicator: Annual Average Daily Traffic Volume Modification: Annual Review

53
Justification: This indicator was modified because there is new and reliable information. Such provision was included in the Monitoring and Evaluation Policy of Compacts and Threshold Programs, Paragraph 5.2.2., cause No. 1, Change in the baseline. The new baseline value of the indicator was taken from Feasibility Studies, Environmental Evaluations and the Final Design of the Project aimed at the Reconstruction of Secondary Roads, such as the S1 Project “Somotillo-Cinco Pinos” and S9 Project “Leon-Poneloya-Las Peñitas.”
Indicator
Type Indicator/
Unit of Measurement
Details Responsible Entity Source
Determination of the Baseline
Frequency of Data
Collection Original Baseline
Pursuant to feasibility
OB
JET
IVE
Annual Average Daily Traffic Volume
Somotillo – Cinco Pinos (S1)
MCA-Nicaragua, Design Entities / FIDEG
Design Consultancies / FIDEG
TBD
234
Base Line and Year 5
León – Poneloya (S9)
TBD
1,103

54
Project: Transportation Indicator: Annual Average Daily Traffic Volume Modification: Annual Review Justification: This indicator was modified because there is new and reliable information. Such provision was included in the
Monitoring and Evaluation Policy of Compacts and Threshold Programs, Paragraph 5.2.2., cause No. 1, Change in the baseline. The indicator was projected to year 5 in order to define a new goal based on Feasibility Studies, Environmental Evaluations and the Final Design of the Project aimed at the Reconstruction of Secondary Roads, such as the S1 Project “Somotillo-Cinco Pinos” and S9 Project “Leon-Poneloya-Las Peñitas.”
Indicator Type
Indicator/ Unit of
Measurement Details
Responsible Entity
Source
Projection upon reaching
year 5, pursuant to feasibility
Frequency of Data
Collection
OB
JET
IVE
Annual Average Daily Traffic Volume
Somotillo – Cinco Pinos (S1) MCA-Nicaragua, Design Entities / FIDEG
Design Consultancies / FIDEG
278
Base Line and Year 5
León – Poneloya (S9)
1,276
Project: Transportation Indicator: Cost per Journey (International Roughness Index) Modification: Annual Review Justification: This indicator was modified because there is new and reliable information. Such provision was included in the
Monitoring and Evaluation Policy of Compacts and Threshold Programs, Paragraph 5.2.2., cause No. 1, Change in the baseline. The new baseline value of the indicator was taken from a Feasibility Study for the Reconstruction of the NI-R1. Final Design of Lot No. 1: “Nejapa-Santa Ana”; Final Design of Lot No. 2: “Santa Ana-Ojo de Agua”; Final Design of Lot No. 3: “Comarca Ojo de Agua-Izapa’s Intersection”, the intersection road along “Puerto Sandino-Puerto Sandino”, By-pass road in Puerto Sandino, Final Design Report of the Intersection Road “Vilanueva-Guasaule.” The NI and S13 Indicators will be eliminated as a result of the partial termination of the Program in Nicaragua -expressed in a letter issued by MCC’s Directory and dated 06/10/09- determined to cut off the reconstruction of the primary road NI.
Indicator Type
Indicator/ Unit of Measurement
Details Responsible
Entity
Source
Determination of the Baseline Frequency of Data
Collection Original Baseline
Pursuant to feasibility
OU
TC
OM
E
Cost per journey (International Roughness Index)
NI Section R1 MCA-Nicaragua, Design Entities / FIDEG
Design Consultancy / FIDEG
7.2 7.2 Base Line and Year 5
NI Section R2 8.3 8.3
NI Section S13 11 11
Villanueva – Guasaule (V-G) TBD 12
Project: Transportation Indicator: Cost per Journey (International Roughness Index) Modification: Annual Review Justification: This indicator was modified because there is new and reliable information. Such provision was included in the
Monitoring and Evaluation Policy of Compacts and Threshold Programs, Paragraph 5.2.2., cause No. 1, Change in the baseline. The indicator was projected to year 5 in order to define a new goal based on a Feasibility Study for the Reconstruction of the NI-R1. Final Design of Lot No. 1: “Nejapa-Santa Ana”; Final Design of Lot No. 2: “Santa Ana-Ojo de Agua”; Final Design of Lot No. 3: “Comarca Ojo de Agua-Izapa’s Intersection”, the intersection road along “Puerto Sandino-Puerto Sandino”, By-pass road in Puerto Sandino, Final Design Report of the Intersection Road “Villanueva-Guasaule.” The NI and S13 Indicators will be eliminated as a result of the partial termination of the Program in Nicaragua -expressed in a letter issued by MCC’s Directory and dated 06/10/09- determined to cut off the reconstruction of the primary road NI.
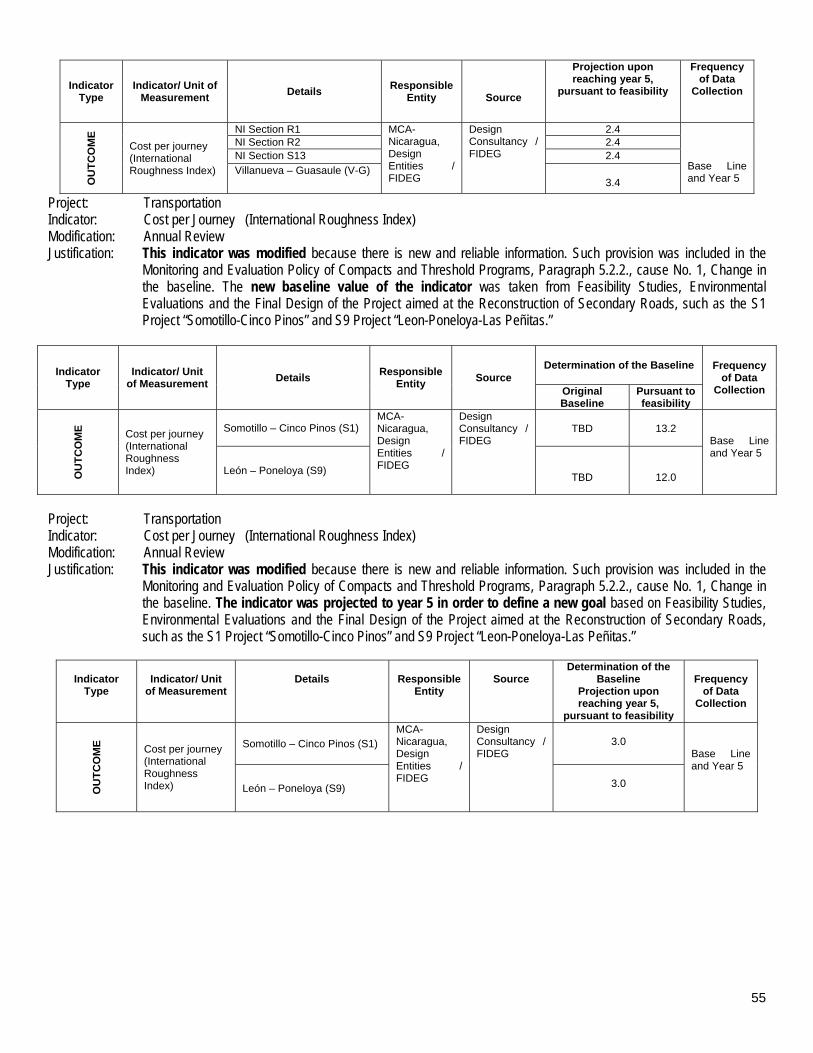
55
Indicator Type
Indicator/ Unit of Measurement
Details Responsible
Entity
Source
Projection upon reaching year 5,
pursuant to feasibility
Frequency of Data
Collection O
UT
CO
ME
Cost per journey (International Roughness Index)
NI Section R1 MCA-Nicaragua, Design Entities / FIDEG
Design Consultancy / FIDEG
2.4 Base Line and Year 5
NI Section R2 2.4 NI Section S13 2.4 Villanueva – Guasaule (V-G)
3.4
Project: Transportation Indicator: Cost per Journey (International Roughness Index) Modification: Annual Review Justification: This indicator was modified because there is new and reliable information. Such provision was included in the
Monitoring and Evaluation Policy of Compacts and Threshold Programs, Paragraph 5.2.2., cause No. 1, Change in the baseline. The new baseline value of the indicator was taken from Feasibility Studies, Environmental Evaluations and the Final Design of the Project aimed at the Reconstruction of Secondary Roads, such as the S1 Project “Somotillo-Cinco Pinos” and S9 Project “Leon-Poneloya-Las Peñitas.”
Indicator Type
Indicator/ Unit of Measurement
Details Responsible
Entity Source
Determination of the Baseline Frequency of Data
Collection Original Baseline
Pursuant to feasibility
OU
TC
OM
E
Cost per journey (International Roughness Index)
Somotillo – Cinco Pinos (S1) MCA-Nicaragua, Design Entities / FIDEG
Design Consultancy / FIDEG
TBD
13.2
Base Line and Year 5
León – Poneloya (S9)
TBD
12.0
Project: Transportation Indicator: Cost per Journey (International Roughness Index) Modification: Annual Review Justification: This indicator was modified because there is new and reliable information. Such provision was included in the
Monitoring and Evaluation Policy of Compacts and Threshold Programs, Paragraph 5.2.2., cause No. 1, Change in the baseline. The indicator was projected to year 5 in order to define a new goal based on Feasibility Studies, Environmental Evaluations and the Final Design of the Project aimed at the Reconstruction of Secondary Roads, such as the S1 Project “Somotillo-Cinco Pinos” and S9 Project “Leon-Poneloya-Las Peñitas.”
Indicator Type
Indicator/ Unit
of Measurement
Details
Responsible
Entity
Source
Determination of the Baseline
Projection upon reaching year 5,
pursuant to feasibility
Frequency
of Data Collection
OU
TC
OM
E
Cost per journey (International Roughness Index)
Somotillo – Cinco Pinos (S1) MCA-Nicaragua, Design Entities / FIDEG
Design Consultancy / FIDEG
3.0
Base Line and Year 5
León – Poneloya (S9)
3.0

56
Project: Transportation Indicator: i. No. of families and/or business that have been resettled as a result of the reconstruction of the road section
“Villanueva – Guasaule” ii. No. of families and/or business that have been resettled as a result of the reconstruction of the road section
“Somotillo – Cinco Pinos (S1)” iii. Number of cases in which affected people have been duly compensated to clear the right-of-way in the road
section Leon - Poneloya (S9) iv. People living in the influence area of secondary roads. v. Value of contract disbursement on roads works, disaggregated by road segment vi. Percent disbursed on roads works, disaggregated by road segment
Modification: Annual Review Justification: Six new indicators were added since the existing indicators does not comply sufficiently with the “adequacy” criteria
of indicators (i.e. taken as a whole, the existing indicators were not sufficient to measure properly their progress with regard to outputs). Such provision was included in the Monitoring and Evaluation Policy of Compacts and Threshold Programs, Paragraph 5.2.1., cause No. 3, Change in Indicators. The M&E Plan No. 2, 2007-2008, set an indicator to measure resettlements action resulting from the reconstruction of primary roads and secondary pathways that were being executed through the preparation of 2 Resettlement Plans –one for each type of road/pathways. Upon completing this indicator, it turned to be feasible setting the number of families to be resettled along the primary road “Villanueva – Guasaule” and the secondary road “Somotillo – Cinco Pinos”. There are no resettled families along the road section “Leon-Poneloya-Las Peñitas;” accordingly, the number of construction works to be carried out was established as compensation in order to reestablish the right-of-way. Contract values and disbursements will be tracked to monitor the progression of the activity and are common indicators required for most MCC road projects.
Indicator Type
Indicator/ Unit of Measurement
Details Responsible
Entity
Source
Determination of the Baseline
Frequency of Data
Collection Original Baseline
Pursuant to
feasibility
Projection upon reaching
year 5, pursuant to feasibility
ACTIVITY
No. families and/or business that have been resettled as a result of the reconstruction of the road section Villanueva - Guasaule
Number of families and/or business, which domiciles were affected by the reconstruction of the road section Villanueva – Guasaule. Accordingly, they have been resettled in other locations under the Resettlement Policy Framework and Acquisition of Lands (RPF)
MCA-N / Transportation
Project and Environment and Social
Area
Contracts set with Executing
Companies
0
13
13
Quarterly
No. of families and/or business that have been resettled as a result of the reconstruction of the road section Somotillo – Cinco Pinos (S1)
Number of families and/or business, which domiciles were affected by the reconstruction of the road section Somotillo – Cinco Pinos (S1). Accordingly, they have been resettled in other locations under the Resettlement Policy Framework and Acquisition of Lands (RPF)
MCA-N / Transportation
Project and Environment and Social
Area
Contracts set with Executing
Companies
0
31
31
Quarterly
Number of cases in which affected people have been duly compensated to clear the right-of-way in the road section Leon - Poneloya (S9)
Number of compensated cases to clear the right-of-way along the secondary road section known as Leon-Poneloya-Las Peñitas (S9); which include fences, walls, platforms and other type of constructions according to the Resettlement Policy Framework and Acquisition of Lands (RPF)
MCA-N /
Transportation Project and
Environment and Social
Area l
Contracts set
with Executing Companies
0
30
30
Quarterly
People living in the influence area of secondary roads.
Number of people living within 5 kilometers of the upgraded road
MCA-N / Transportation
Project and Environment and Social
Area
Final Design Study and
Environmental Evaluation of
Reconstruction Projects including
primary and secondary
roads.
0 TBD TBD Year 4

57
Indicator Type
Indicator/ Unit of Measurement
Details Responsible
Entity
Source
Determination of the Baseline
Frequency of Data
Collection Original Baseline
Pursuant to
feasibility
Projection upon reaching
year 5, pursuant to feasibility
ACTIVITY
Value of contract disbursement on roads works, disaggregated by road segment: Villanueva - Guasaule
Amount disbursed/total amount of contract
MCA-N / Transportation
Project
Contracts set
with Executing Companies
0 0 $
15,088,629.23 Quarterly
Value of contract disbursement on roads works, disaggregated by road segment: Somotillo – Cinco Pinos (S1)
Amount disbursed/total amount of contract
MCA-N / Transportation
Project
Contracts set
with Executing Companies
0 0 $
15,138,720.66 Quarterly
Value of contract disbursement on roads works, disaggregated by road segment Leon - Poneloya (S9)
Amount disbursed/total amount of contract
MCA-N / Transportation
Project
Contracts set
with Executing Companies
0 0 $
13,563,183.58 Quarterly
Percent disbursed on roads works: Villanueva - Guasaule
Amount disbursed / total amount of contract
MCA-N / Transportation
Project
Contracts set
with Executing Companies
0 0
100%
Quarterly
Percent disbursed on roads works: Somotillo – Cinco Pinos (S1)
Amount disbursed / total amount of contract
MCA-N / Transportation
Project
Contracts set
with Executing Companies
0 0
100%
Quarterly
Percent disbursed on roads works: Leon - Poneloya (S9)
Amount disbursed / total amount of contract
MCA-N / Transportation
Project
Contracts set
with Executing Companies
0 0 100%
Quarterly
Project: Property Indicator: i. Value of land investment (US $)
ii. Value of land (urban) (US $) iii. Value of land (rural) (US $) iv. Time required to execute the land transaction (# days) vii. Total cost to carry out the land transaction viii. Security perception on land tenure.
Modification: Annual Review Justification: These indicators were modified because there is new and reliable information, such as data arisen from a new
survey. Such provision was included in the Monitoring and Evaluation Policy of Compacts and Threshold Programs, Paragraph 5.2.2., cause No. 1, Change in the baseline. The new baseline value of the indicator was taken from the Household Survey Land Modules in Leon and Chinandega, conducted by INIDE for purposes of measuring the Living Standards. In addition to report on the baseline, all indicators of the Property Project, including these below, will be eliminated in the future as a result of the partial termination of the Program in Nicaragua -expressed in a letter issued by MCC’s Directory and dated 06/10/09- determined to cut off the Property Project.
Indicator
Type
Indicator/ Unit of Measurement
Details Responsible
Entity
Source Determination of the
Baseline
Frequency of Data
Collection
Original Pursuant to INIDE’s database
OB
JET
IVE
S
Value of Investment on Land (US $)
Average value of the housing investment carried out per manzana.
INIDE-FIDEG-EE MCC
LSMS, including land module
TBD U$ 7861 Baseline, Year 3 and Year 5
Value of Land (urban) (US $)
Average value of the land per manzana (urban area).
INIDE, PRODEP, FIDEG, EE and
MCC
LSMS including land module and cadastre-register
information system
US$ 519
$85,7142 Baseline, Year 3 and Year 5

58
Indicator
Type
Indicator/ Unit of Measurement
Details Responsible
Entity
Source Determination of the
Baseline
Frequency of Data
Collection
Value of Land (rural) (US $)
Average value of the land per manzana (rural area).
INIDE, PRODEP, FIDEG, EE and
MCC
LSMS including land module and cadastre-register
information system
US$ 404
$5113 Baseline, Year 3 and Year 5
OU
TC
OM
E
Time to conduct a land transaction (# of days)
Number of days from initiation to completion of transaction.
INIDE, FIDEG, EE and MCC
LSMS including land module
TBD 49 días Baseline, Year 3 and Year 5
Full cost to conduct a land transaction
The cost of land transaction as a percentage of the value of the land.
INIDE, FIDEG, EE and MCC
LSMS including land module
TBD 5.34 % Baseline, Year 3 and Year 5
Perception of land tenure security
Perception of land security from the point of view of land owners
INEC-FIDEG-EE-MCC
LSMS including land module
TBD 92% Baseline, Year 3 and Year 5

59
Project: Property Indicator: All indicators related to Property Project Modification: Annual Review Justification: Indicators related to the property project will be removed as a result of changes in the scope of the Project
which determined such Indicator as irrelevant. Such provision was included in the Monitoring and Evaluation Policy of Compacts and Threshold Programs, Paragraph 5.2.1., cause No. 1, Change in Indicators. The partial termination of the Program in Nicaragua -expressed in a letter issued by MCC’s Directory and dated 06/10/09- determined to terminate entirely the property project. Four indicators are not being removed because the work was completed, i.e. the targets were met, for these indicators. These indicators are: Number of Protected Areas with Formulated Management Plans Number of Protected Areas demarcated Pilot Plan of the Cadastral Survey and Property Regularization Aerial Photogrammetric Flights and Orthophoto Maps for the Cadastral Survey
Indicator
Type
Indicator/ Unit of Measurement
Details Responsible Entity
Source Determination of the
Baseline
Frequency of Data
Collection
Original Pursuant to INIDE’s database
GO
AL
Income gains of Property Regularization
Expected income gains are defined as annual increase in property value per manzana multiplied by the number of regularized manzanas. The report for these indicators starts in year 5 because an increase in the income is expected after 2 years that the property is regularized
Impact Evaluation Consultancy hired by MCC
Analytical Report based on
Household Surveys
0 0 Baseline,
Year 3 and Year 5
OB
JET
IVE
S
Value of Investment on Land (US $)
Average value of the housing investment carried out per manzana.
INIDE-FIDEG-EE
MCC
LSMS, including land module
TBD U$ 7861 Baseline, Year 3 and Year 5
Value of Land (urban) (US $)
Average value of the land per manzana (urban area).
INIDE, PRODEP, FIDEG, EE and MCC
LSMS including land module and cadastre-register
information system
US$ 519
$85,7142 Baseline, Year 3 and Year 5
Value of Land (rural) (US $)
Average value of the land per manzana (rural area).
INIDE, PRODEP, FIDEG, EE and MCC
LSMS including land module and cadastre-register
information system
US$ 404
$5113 Baseline, Year 3 and Year 5
OU
TC
OM
E
Time to conduct a land transaction (# of days)
Number of days from initiation to completion of transaction.
INIDE, FIDEG, EE and MCC
LSMS including land module
TBD 49 días Baseline, Year 3 and Year 5
Full cost to conduct a land transaction
The cost of land transaction as a percentage of the value of the land.
INIDE, FIDEG, EE and MCC
LSMS including land module
TBD 5.34 % Baseline, Year 3 and Year 5
Perception of land tenure security
Perception of land security from the point of view of land owners
INEC-FIDEG-EE-MCC
LSMS including land module
TBD 92% Baseline, Year 3 and Year 5
A
CT
IVIT
Y
Automated database of Registry and Cadastre installed in the 10 municipalities in the Department of Leon
To link the databases of Cadastre and Registry in the 10 municipalities to the national database, through the installation of the Cadastral and Register Information System (SIICAR in Spanish) at each of the 10 municipalities in the Department of Leon.
PRODEP Public Registry of
Property 0 Quarterly
Number of additional parcels with a registered title (rural)
Number of rural parcels regularized by Program
PRODEP Property
Intendancy (IP in Spanish)
0
Quarterly Number of additional parcels with a registered title (urban)
Number of urban parcels regularized by Program
PRODEP Property
Intendancy (IP in Spanish)
0 Quarterly
Percentage of conflicts resolved by mediation program
Reported as number of resolved cases divided by number of cases received.
PRODEP
Information System of the
Alternative Dispute
0 Quarterly
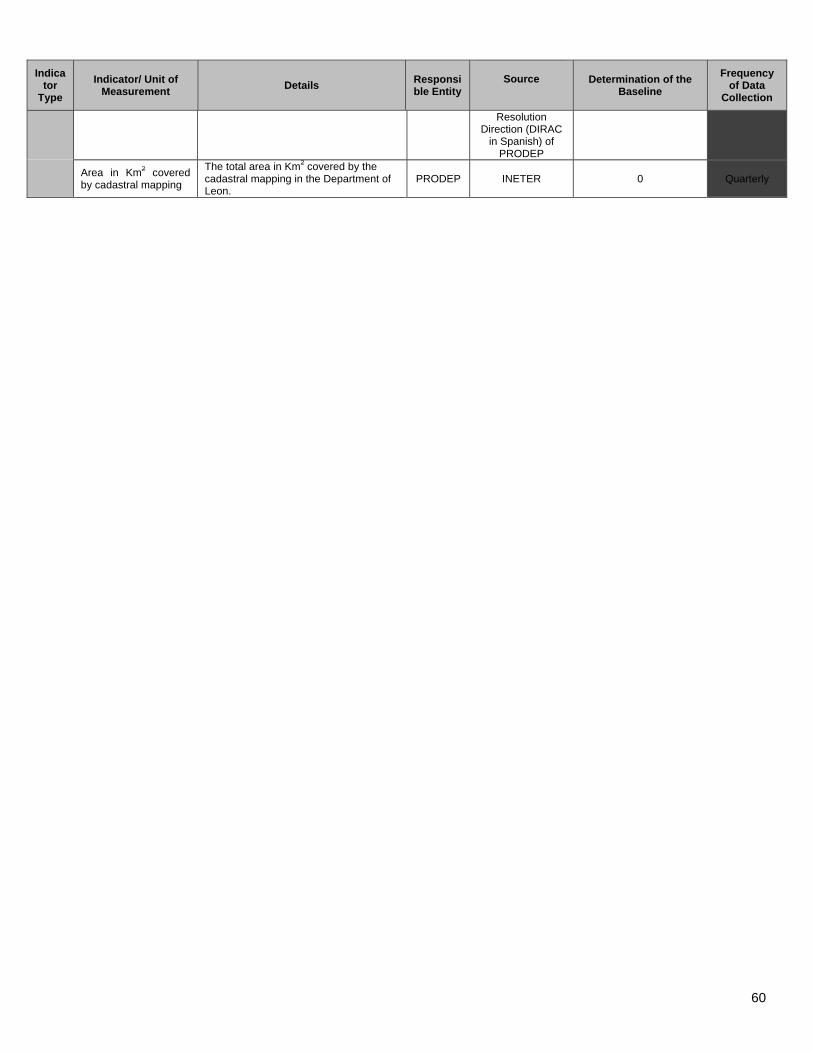
60
Indicator
Type
Indicator/ Unit of Measurement
Details Responsible Entity
Source Determination of the
Baseline
Frequency of Data
Collection
Resolution Direction (DIRAC
in Spanish) of PRODEP
Area in Km2 covered by cadastral mapping
The total area in Km2 covered by the cadastral mapping in the Department of Leon.
PRODEP INETER 0 Quarterly

61
Project: Rural Business Indicator: Income gains of Rural Business Development. Beneficiaries: businesses assisted by the program and employees of
farmers and businesses assisted by the program. Modification: Annual Review Justification: The indicator was modified and baseline value was calculated (due to new, credible information emerging from
the baseline survey conducted by FIDEG). In relation to the modification of the description, a descriptive quality of an existing indicator may be changed, such as the following: definition, source, frequency, etc. Such provision was included in the Monitoring and Evaluation Policy of Compacts and Threshold Programs, Paragraph 5.2.1., cause No. 3, Change in Indicators. The increase in recipients’ income will be measured by impact evaluation instruments implemented through a Household Survey of the Rural Business and Property Projects.
Indicator Type
Indicator/ Unit of Measurement
Details Responsible Entity
Source Determination of
the Baseline
Frequency of Data
Collection
Goal
Income gains of Rural Business Development. Beneficiaries: businesses assisted by the program and employees of farmers and businesses assisted by the program.
For Beneficiaries: Expected income gains were defined as the increase in Value Added to of the Farm, calculated as profits of a typical high-value added crop minus the profits of subsistence agriculture (US$100), per manzana per the number of manzanas harvested. For example, a typical high value-added crop is defined as the average of plantain, cashew and organic sesame, crops suitable for Nicaragua. The report for these indicators begins until the year 6 of initiated the project (2012), since these cultures(culturing) do not produce up to at least three years after planted. For Employees: Expected income gains were calculated as the labor costs of the Beneficiary business. Targets for this indicator do not begin until Year 6, because tree crops do not produce yields for at least three years after planting.
Impact Evaluation Consultancy hired by MCC.
Analytical Report based on Household Surveys
C$ 8,473.00 (Cordobas per
month/household)
Baseline, Year 3 and Year 5
Project: Rural Business Indicator: Number of manzanas with trees planted Modification: Annual Review Justification: The indicator was modified. A descriptive quality of an existing indicator may be changed, such as the following:
definition, source, frequency, etc. Such provision was included in the Monitoring and Evaluation Policy of Compacts and Threshold Programs, Paragraph 5.2.1., cause No. 3, Change in Indicators. The indicator was modified to reflect program changes, specifically the change from irrigation infrastructure and commercial reforestation to only reforestation.
Indicator Type
Indicator/ Unit of Measurement
Details Responsible Entity Source
Baseline Determination
Frequency of Data
Collection
OLD
Number of manzanas harvesting higher-value crops with irrigation or commercial reforestation under Improvement of Water Supply Activities (cumulative)
Number of manzanas transformed to higher-value and lower-risk crops, commercial reforestation or reforestation carried out by the farmer, which include planted areas even if they are not in production. The transformed manzanas will be obtained from the Watershed Management Action Plan, as well as the information on Protected Areas Management Plans and Integrated Business Plans
Cluster Operating Entities, and Rural Businesses Consultants
Watershed Management Action Plan, Protected Areas Management Plans and Business Plans / Cluster Operating Entities data entered into RBDP Management Information System
0 Quarterly
NEW Number of manzanas reforested
Total of manzanas reforested, defined as manzanas with the minimum agreed-upon density of trees per
Cluster Operating Entities, and Rural Businesses
RBPCS and operators’ report
0 Quarterly
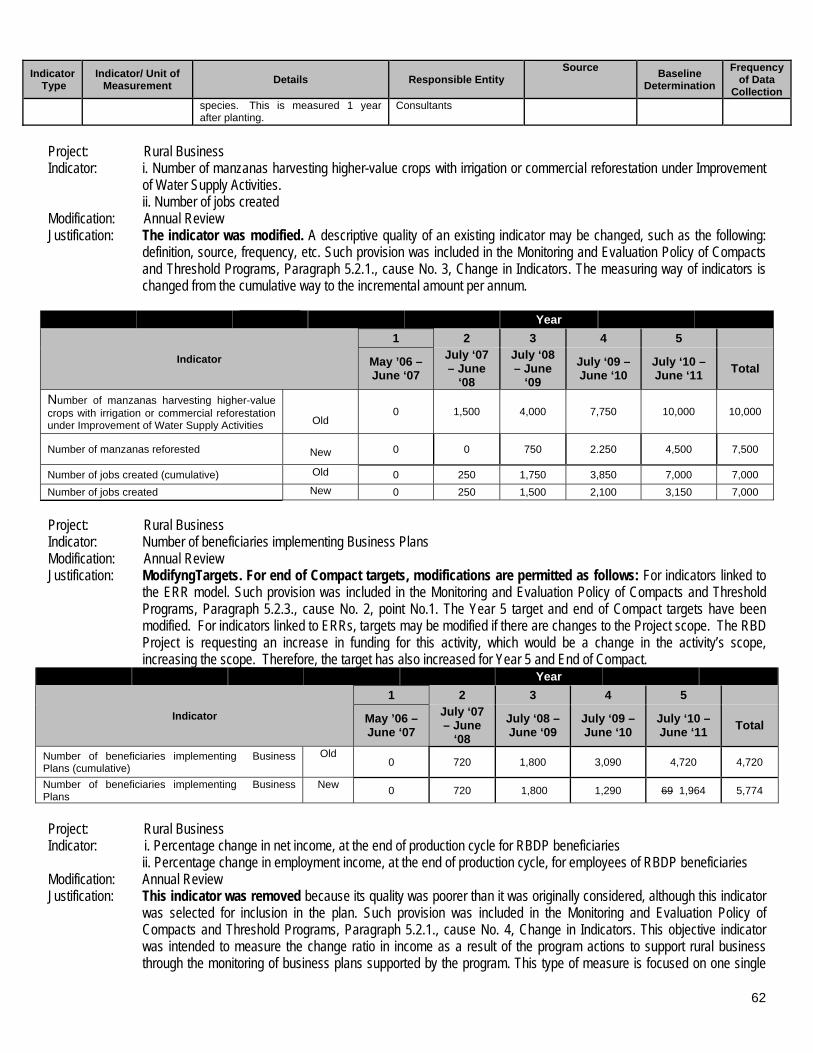
62
Indicator Type
Indicator/ Unit of Measurement
Details Responsible Entity Source
Baseline Determination
Frequency of Data
Collection species. This is measured 1 year after planting.
Consultants
Project: Rural Business Indicator: i. Number of manzanas harvesting higher-value crops with irrigation or commercial reforestation under Improvement
of Water Supply Activities. ii. Number of jobs created
Modification: Annual Review Justification: The indicator was modified. A descriptive quality of an existing indicator may be changed, such as the following:
definition, source, frequency, etc. Such provision was included in the Monitoring and Evaluation Policy of Compacts and Threshold Programs, Paragraph 5.2.1., cause No. 3, Change in Indicators. The measuring way of indicators is changed from the cumulative way to the incremental amount per annum.
Year
Indicator
1 2 3 4 5
May ’06 – June ‘07
July ‘07 – June
‘08
July ‘08 – June
‘09
July ‘09 – June ‘10
July ‘10 – June ‘11
Total
Number of manzanas harvesting higher-value crops with irrigation or commercial reforestation under Improvement of Water Supply Activities
Old 0 1,500 4,000 7,750 10,000 10,000
Number of manzanas reforested
New 0 0 750 2.250 4,500 7,500
Number of jobs created (cumulative) Old 0 250 1,750 3,850 7,000 7,000
Number of jobs created New 0 250 1,500 2,100 3,150 7,000
Project: Rural Business Indicator: Number of beneficiaries implementing Business Plans Modification: Annual Review Justification: ModifyngTargets. For end of Compact targets, modifications are permitted as follows: For indicators linked to
the ERR model. Such provision was included in the Monitoring and Evaluation Policy of Compacts and Threshold Programs, Paragraph 5.2.3., cause No. 2, point No.1. The Year 5 target and end of Compact targets have been modified. For indicators linked to ERRs, targets may be modified if there are changes to the Project scope. The RBD Project is requesting an increase in funding for this activity, which would be a change in the activity’s scope, increasing the scope. Therefore, the target has also increased for Year 5 and End of Compact.
Year
Indicator
1 2 3 4 5
May ’06 – June ‘07
July ‘07 – June
‘08
July ‘08 – June ‘09
July ‘09 – June ‘10
July ‘10 – June ‘11
Total
Number of beneficiaries implementing Business Plans (cumulative)
Old 0 720 1,800 3,090 4,720 4,720
Number of beneficiaries implementing Business Plans
New 0 720 1,800 1,290 69 1,964 5,774
Project: Rural Business Indicator: i. Percentage change in net income, at the end of production cycle for RBDP beneficiaries
ii. Percentage change in employment income, at the end of production cycle, for employees of RBDP beneficiaries Modification: Annual Review Justification: This indicator was removed because its quality was poorer than it was originally considered, although this indicator
was selected for inclusion in the plan. Such provision was included in the Monitoring and Evaluation Policy of Compacts and Threshold Programs, Paragraph 5.2.1., cause No. 4, Change in Indicators. This objective indicator was intended to measure the change ratio in income as a result of the program actions to support rural business through the monitoring of business plans supported by the program. This type of measure is focused on one single
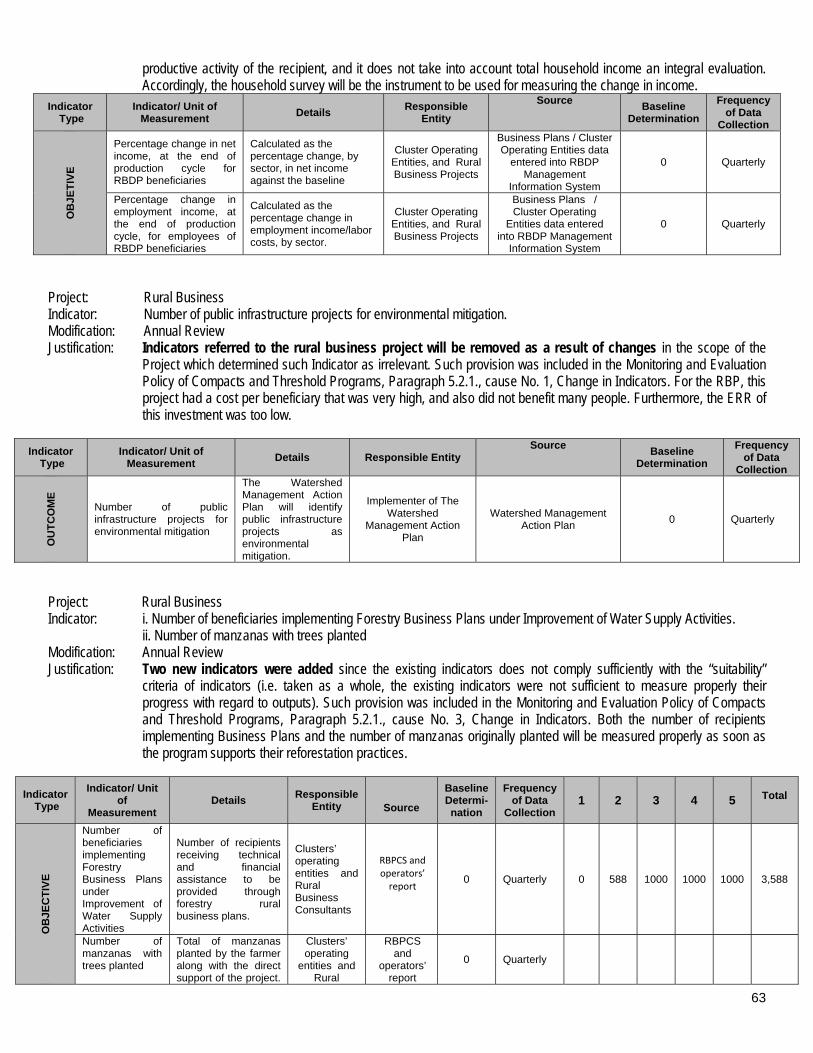
63
productive activity of the recipient, and it does not take into account total household income an integral evaluation. Accordingly, the household survey will be the instrument to be used for measuring the change in income.
Indicator Type
Indicator/ Unit of Measurement
Details Responsible
Entity
Source Baseline
Determination
Frequency of Data
Collection
OB
JET
IVE
Percentage change in net income, at the end of production cycle for RBDP beneficiaries
Calculated as the percentage change, by sector, in net income against the baseline
Cluster Operating Entities, and Rural Business Projects
Business Plans / Cluster Operating Entities data
entered into RBDP Management
Information System
0 Quarterly
Percentage change in employment income, at the end of production cycle, for employees of RBDP beneficiaries
Calculated as the percentage change in employment income/labor costs, by sector.
Cluster Operating Entities, and Rural Business Projects
Business Plans / Cluster Operating
Entities data entered into RBDP Management
Information System
0 Quarterly
Project: Rural Business Indicator: Number of public infrastructure projects for environmental mitigation. Modification: Annual Review Justification: Indicators referred to the rural business project will be removed as a result of changes in the scope of the
Project which determined such Indicator as irrelevant. Such provision was included in the Monitoring and Evaluation Policy of Compacts and Threshold Programs, Paragraph 5.2.1., cause No. 1, Change in Indicators. For the RBP, this project had a cost per beneficiary that was very high, and also did not benefit many people. Furthermore, the ERR of this investment was too low.
Indicator Type
Indicator/ Unit of Measurement
Details Responsible Entity Source
Baseline Determination
Frequency of Data
Collection
OU
TC
OM
E
Number of public infrastructure projects for environmental mitigation
The Watershed Management Action Plan will identify public infrastructure projects as environmental mitigation.
Implementer of The Watershed
Management Action Plan
Watershed Management Action Plan
0 Quarterly
Project: Rural Business Indicator: i. Number of beneficiaries implementing Forestry Business Plans under Improvement of Water Supply Activities.
ii. Number of manzanas with trees planted Modification: Annual Review Justification: Two new indicators were added since the existing indicators does not comply sufficiently with the “suitability”
criteria of indicators (i.e. taken as a whole, the existing indicators were not sufficient to measure properly their progress with regard to outputs). Such provision was included in the Monitoring and Evaluation Policy of Compacts and Threshold Programs, Paragraph 5.2.1., cause No. 3, Change in Indicators. Both the number of recipients implementing Business Plans and the number of manzanas originally planted will be measured properly as soon as the program supports their reforestation practices.
Indicator Type
Indicator/ Unit of
Measurement Details
Responsible Entity
Source
Baseline Determi-nation
Frequency of Data
Collection 1 2 3 4 5
Total
OB
JEC
TIV
E
Number of beneficiaries implementing Forestry Business Plans under Improvement of Water Supply Activities
Number of recipients receiving technical and financial assistance to be provided through forestry rural business plans.
Clusters’ operating entities and Rural Business Consultants
RBPCS and operators’ report
0
Quarterly
0
588
1000
1000
1000
3,588
Number of manzanas with trees planted
Total of manzanas planted by the farmer along with the direct support of the project.
Clusters’ operating
entities and Rural
RBPCS and
operators’ report
0
Quarterly
64
Indicator Type
Indicator/ Unit of
Measurement Details
Responsible Entity
Source
Baseline Determi-nation
Frequency of Data
Collection 1 2 3 4 5
Total
Additional planted manzanas -using their own resources- may be included as a result of the encouragement received through the project’ support. This is measured after ending each campaign -upon 3 months of having completed the rainy season.
Business Consultants
0
1000
3000
3000
3000
10,000
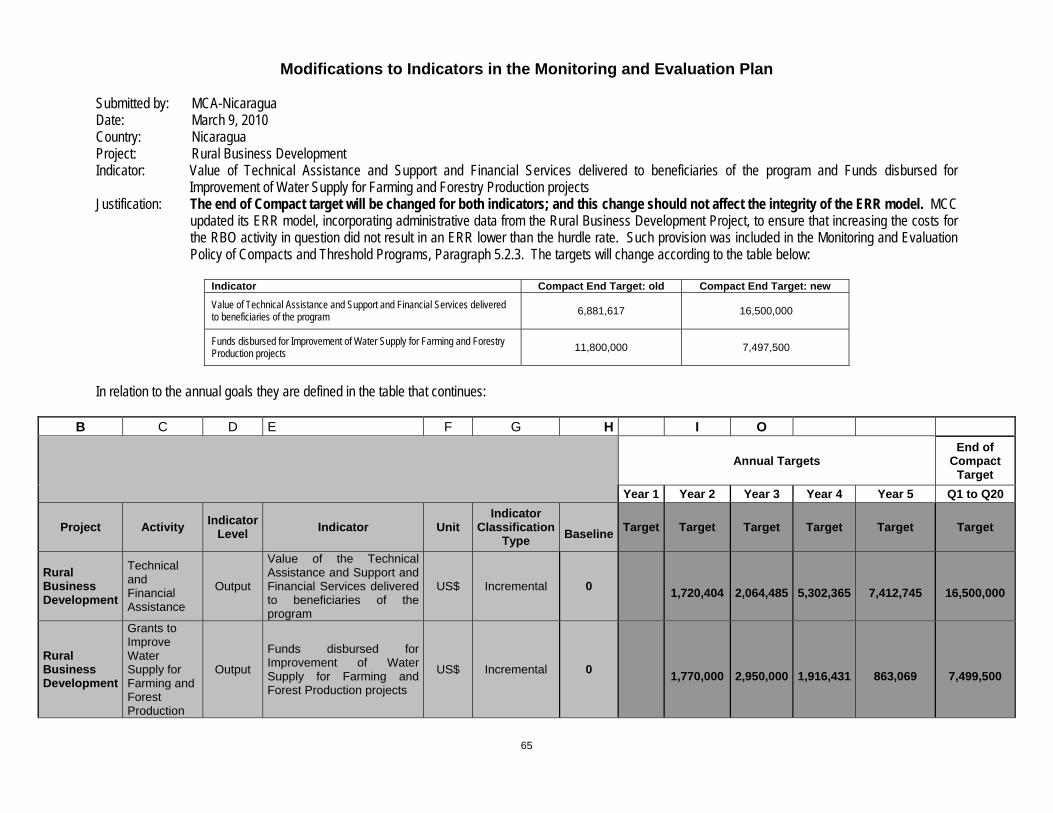
65
Modifications to Indicators in the Monitoring and Evaluation Plan Submitted by: MCA-Nicaragua Date: March 9, 2010 Country: Nicaragua Project: Rural Business Development Indicator: Value of Technical Assistance and Support and Financial Services delivered to beneficiaries of the program and Funds disbursed for
Improvement of Water Supply for Farming and Forestry Production projects Justification: The end of Compact target will be changed for both indicators; and this change should not affect the integrity of the ERR model. MCC
updated its ERR model, incorporating administrative data from the Rural Business Development Project, to ensure that increasing the costs for the RBO activity in question did not result in an ERR lower than the hurdle rate. Such provision was included in the Monitoring and Evaluation Policy of Compacts and Threshold Programs, Paragraph 5.2.3. The targets will change according to the table below:
Indicator Compact End Target: old Compact End Target: new
Value of Technical Assistance and Support and Financial Services delivered to beneficiaries of the program 6,881,617 16,500,000
Funds disbursed for Improvement of Water Supply for Farming and Forestry Production projects
11,800,000 7,497,500
In relation to the annual goals they are defined in the table that continues:
B C D E F G H I O
Annual Targets
End of Compact
Target
Year 1 Year 2 Year 3 Year 4 Year 5 Q1 to Q20
Project Activity Indicator
Level Indicator Unit
Indicator Classification
Type
Baseline
Target Target Target Target Target Target
Rural Business Development
Technical and Financial Assistance
Output
Value of the Technical Assistance and Support and Financial Services delivered to beneficiaries of the program
US$ Incremental 0
1,720,404
2,064,485
5,302,365
7,412,745
16,500,000
Rural Business Development
Grants to Improve Water Supply for Farming and Forest Production
Output
Funds disbursed for Improvement of Water Supply for Farming and Forest Production projects
US$ Incremental 0
1,770,000
2,950,000
1,916,431
863,069
7,499,500


