MONITORING OCEAN-ATMOSPHERE INTERACTIONS IN WESTERN BOUNDARY CURRENT EXTENSIONS Meghan F. Cronin (1) , Nicholas Bond (2) , James Booth (3) , Hiroshi Ichikawa (4) , Terrence M. Joyce (5) , Kathryn Kelly (6) , Masahisa Kubota (7) , Bo Qiu (8) , Chris Reason (9) , Mathieu Rouault (10) , Chris Sabine (11) , Toshiro Saino (12) , Justin Small (13) , Toshio Suga (14) , Lynne D. Talley (15) , LuAnne Thompson (16) , Robert A. Weller (17) (1) NOAA Pacific Marine Environmental Laboratory, 7600 Sandpoint Way NE, Seattle, WA 98115, USA, Email: [email protected](2) Joint Institute for the Study of Atmosphere and Ocean, University of Washington, Seattle, WA, USA, Email: [email protected](3) University of Washington, Seattle WA, USA, Email: [email protected](4) Japan Agency for Marine-Earth Science and Technology, Yokosuka, Japan, Email: [email protected](5) Woods Hole Oceanographic Institution, Woods Hole, MA, USA, Email: [email protected](6) Applied Physics Laboratory, University of Washington, Seattle, WA, USA, Email: [email protected](7) Tokai University, Shizuoka, Japan, Email: [email protected](8) University of Hawaii, Honolulu, HI, USA, Email: [email protected](9) University of Cape Town, Rondebosch, Cape Town, South Africa, Email: [email protected](10) University of Cape Town, Rondebosch, Cape Town, South Africa, Email: [email protected](11) NOAA Pacific Marine Environmental Laboratory, Seattle, WA, USA, Email: [email protected](12) Japan Agency for Marine-Earth Science and Technology, Yokosuka, Japan, Email: [email protected](13) Naval Research Laboratory, Stennis Space Center, MS, USA, Email: [email protected](14) Tohoku University, Sendai, Japan, Email: [email protected](15) Scripps Institution of Oceanography, University of California San Diego, San Diego, CA, USA, Email: [email protected](16) University of Washington, Seattle, WA, USA, Email: [email protected](17) Woods Hole Oceanographic Institution, Woods Hole, MA, USA, Email: [email protected]ABSTRACT Western boundary currents as they extend eastward into the ocean basin (referred to here as WBCEs) are regions of intense air-sea interaction, where the ocean loses heat and moisture to the atmosphere and absorbs carbon dioxide. Air-sea interactions in WBCEs can affect weather and climate both locally and remotely, on time scales of days to decades. Thus significant societal benefit can be achieved by improving their representation in numerical models of the atmosphere and ocean. To this end, WBCE data are needed for assimilation into numerical models, for assessment of model realism, and for analyses of climate processes. WBCE include the Kuroshio Extension in the North Pacific, the Gulf Stream in the North Atlantic, the Agulhas Return Current in the South Indian Ocean, the East Australian Current in the South Pacific, and the Brazil-Malvinas Confluence in the South Atlantic. The open-ocean strong currents, sharp fronts, and energetic synoptic variability make WBCEs challenging regions to observe, but existing technology will allow comprehensive sustained observations of these important regions. While our primary focus is on monitoring ocean-atmosphere interactions and ocean ventilation related to heat and freshwater exchanges, these depend upon the location of the current, depth of temperature anomalies (heat content), and the three- dimensional circulation, features that also can affect the distribution of biogeochemical properties. The observing system strategy developed here thus attempts to provide a coordinated system that would act as a framework for multidisciplinary observations. 1. INTRODUCTION As part of the global heat balance, excess solar radiation received in the tropics must be carried poleward where it is lost as longwave radiation. In the tropics, both the ocean and atmosphere contribute to this meridional heat transport; but poleward of 35° latitude, the atmospheric transport accounts for 78% of the total in the Northern Hemisphere and 92% in the Southern Hemisphere [1]. The present paper focuses on the transition regions where warm western boundary currents extend eastward into the ocean basins and loose heat to the atmosphere through large latent and sensible heat fluxes (Fig. 1). These western boundary current extensions (WBCEs) include the Kuroshio Extension in the North Pacific, the Gulf Stream in the North Atlantic, the Agulhas Return Current in the South Indian Ocean, the East Australian Current system in the South Pacific, and the Brazil- Malvinas Confluence in the South Atlantic.
Transcript
MONITORING OCEAN-ATMOSPHERE INTERACTIONS IN WESTERN BOUNDARY CURRENT EXTENSIONS
Meghan F. Cronin(1), Nicholas Bond(2), James Booth(3), Hiroshi Ichikawa(4), Terrence M. Joyce(5), Kathryn
Kelly(6), Masahisa Kubota(7), Bo Qiu(8), Chris Reason(9), Mathieu Rouault(10), Chris Sabine(11), Toshiro Saino(12), Justin Small(13), Toshio Suga(14), Lynne D. Talley(15), LuAnne Thompson(16), Robert A. Weller(17)
(1)NOAA Pacific Marine Environmental Laboratory, 7600 Sandpoint Way NE, Seattle, WA 98115, USA, Email: [email protected]
(2)Joint Institute for the Study of Atmosphere and Ocean, University of Washington, Seattle, WA, USA, Email: [email protected]
(3)University of Washington, Seattle WA, USA, Email: [email protected] (4)Japan Agency for Marine-Earth Science and Technology, Yokosuka, Japan, Email: [email protected]
(5)Woods Hole Oceanographic Institution, Woods Hole, MA, USA, Email: [email protected] (6)Applied Physics Laboratory, University of Washington, Seattle, WA, USA, Email: [email protected]
(9)University of Cape Town, Rondebosch, Cape Town, South Africa, Email: [email protected] (10)University of Cape Town, Rondebosch, Cape Town, South Africa, Email: [email protected] (11)NOAA Pacific Marine Environmental Laboratory, Seattle, WA, USA, Email: [email protected]
(12)Japan Agency for Marine-Earth Science and Technology, Yokosuka, Japan, Email: [email protected] (13)Naval Research Laboratory, Stennis Space Center, MS, USA, Email: [email protected]
(14)Tohoku University, Sendai, Japan, Email: [email protected] (15)Scripps Institution of Oceanography, University of California San Diego, San Diego, CA, USA, Email:
Western boundary currents as they extend eastward into the ocean basin (referred to here as WBCEs) are regions of intense air-sea interaction, where the ocean loses heat and moisture to the atmosphere and absorbs carbon dioxide. Air-sea interactions in WBCEs can affect weather and climate both locally and remotely, on time scales of days to decades. Thus significant societal benefit can be achieved by improving their representation in numerical models of the atmosphere and ocean. To this end, WBCE data are needed for assimilation into numerical models, for assessment of model realism, and for analyses of climate processes. WBCE include the Kuroshio Extension in the North Pacific, the Gulf Stream in the North Atlantic, the Agulhas Return Current in the South Indian Ocean, the East Australian Current in the South Pacific, and the Brazil-Malvinas Confluence in the South Atlantic. The open-ocean strong currents, sharp fronts, and energetic synoptic variability make WBCEs challenging regions to observe, but existing technology will allow comprehensive sustained observations of these important regions. While our primary focus is on monitoring ocean-atmosphere interactions and ocean ventilation related to heat and freshwater exchanges, these depend upon the location of the current, depth of
temperature anomalies (heat content), and the three-dimensional circulation, features that also can affect the distribution of biogeochemical properties. The observing system strategy developed here thus attempts to provide a coordinated system that would act as a framework for multidisciplinary observations.
1. INTRODUCTION
As part of the global heat balance, excess solar radiation received in the tropics must be carried poleward where it is lost as longwave radiation. In the tropics, both the ocean and atmosphere contribute to this meridional heat transport; but poleward of 35° latitude, the atmospheric transport accounts for 78% of the total in the Northern Hemisphere and 92% in the Southern Hemisphere [1]. The present paper focuses on the transition regions where warm western boundary currents extend eastward into the ocean basins and loose heat to the atmosphere through large latent and sensible heat fluxes (Fig. 1). These western boundary current extensions (WBCEs) include the Kuroshio Extension in the North Pacific, the Gulf Stream in the North Atlantic, the Agulhas Return Current in the South Indian Ocean, the East Australian Current system in the South Pacific, and the Brazil-Malvinas Confluence in the South Atlantic.
In both hemispheres, the large WBCE surface heat loss tends to occur during wintertime when the air is substantially cooler than the sea surface temperature (SST) and, with the exception of the Agulhas Return Current (ARC), prevailing winds are from the continent. Due to the large landmasses in the Northern Hemisphere (NH), wintertime continental air blowing across the Gulf Stream (GS) and Kuroshio Extension (KE) are particularly cold and dry. Large surface fluxes of sensible and latent heat are also associated with storms in WBCE regions, which advect extremely cold and dry air over the warmer boundary currents. These synoptic events are responsible for the majority of heat loss in the ARC.
Mid-latitude storms develop when upper level atmospheric circulation is properly phased with baroclinic zones in the atmospheric boundary layer (ABL). These baroclinic zones can be enhanced or even generated by land-sea contrasts and SST fronts. In the case of southern Africa, continental air-masses are warmer than the water to the south of the landmass (which terminates at about 34°S) even in wintertime due to adiabatic warming as the air descends the interior 1500-m-high plateau, and thus the continental air contributes to the meridional ABL baroclinicity. Due to these sources of ABL baroclinicity, and the proximity to the Jet Stream, WBCE SST fronts tend to be co-located with genesis regions of the wintertime stormtracks (the climatological paths of extratropical cyclones) over the ocean basins [2]. Because the storms tend to advect cold air equatorward and warm air poleward, the net effect of these transient storms is to extract heat from the ocean and then transport the heat poleward within the atmosphere.
The large heat transfers from the ocean to the atmosphere in WBCEs have both local and remote effects. The temperature fronts associated with these currents affect the stability and pressure gradient within the ABL and result in corresponding frontal structures
in the surface winds [3, 4] and clouds [5, 6]. Studies also show evidence that the frontal effects may extend to the top of the troposphere [7] and can influence storm development [8, 9]. Heat and moisture exchanges in WBCE regions can also contribute to convective rainfall over a broad region, extending over nearby landmasses and the interior ocean basins, and appear to have impacts on the large-scale atmospheric circulation [2]. There are large uncertainties, however, in air-sea fluxes obtained from climatological data, atmospheric models, and remotely sensed data [10, 11, 12]. Consequently, improvements in the representation of air-sea interaction in WBCE regions in numerical models could lead to improved weather and climate predictability locally and remotely, including for landmasses both to the west and to the east of the WBCE.
There are significant challenges for a WBCE observing system. WBCEs are highly variable open ocean jets that are narrow, deep, and fast. The GS, KE, and ARC are roughly comparable in current speed, transport, and vertical structure [13]. Streamwise analyses of the GS and KE show surface speeds can exceed 2 m/s. At 1000 m, the mean speeds of the jets are 0.3 m/s, while at 2000 m they are less than 0.1 m/s [14, 15]. At the confluence of the Brazil and Malvinas Currents (BMC) near the western boundary, surface speeds can exceed 0.5 m/s due to the juxtaposition of the barotropic Malvinas structure (bottom speeds >0.1 m/s) and the highly baroclinic Brazil Current structure (<0.1 m/s at 300 dbar) [16, 17]. The EAC system is the weakest of all WBCEs, but nevertheless reaches surface speeds of almost 1 m/s before separation, decreasing to about 0.2 m/s after separating into several filaments [18].
The width of a WBCE jet is typically less than l00 km. Although the temperature front on the poleward edge of the jet (referred to as the “North Wall” in the Gulf Stream and as the Subtropical Front in the Southern Hemisphere) is strongest, a front on the equatorward edge of the jet sometimes also exists, making the WBCE appear as a narrow tongue of warm water. In the North Pacific, the presence of the southern branch of the subpolar gyre (the Oyashio) to the north of the KE results in an additional SST front and a double jet structure referred to as the Kuroshio-Oyashio Extension (KOE). Likewise, at the BMC, the subtropical Brazil current system merges with the cold Malvinas current, a northward extension of the Antarctic Circumpolar Current (ACC). The ACC also flows parallel to the ARC, resulting in multiple SST fronts.
All WBCE systems show large and variable meanders in their jet path, evident in the SST fronts. Meanders can grow and propagate along the front over the course of a week. These path variations affect not only the location of the upper jet, but also the deep circulation. Observations in the GS [19] and KE [20] show that
Figure 1. Climatological mean net surface heat flux into the ocean from the OAFLUX product [43]. White contours indicate mean dynamic sea level [53].
large amplitude meanders can spin up deep circulations to form full water column vortices with speeds near the bottom in excess of 0.2 m/s. Meanders can cause enhanced cross frontal exchange of water both through the secondary vertical and cross-frontal flow associated with meanders [21] and through the detachment of cold-core cyclonic rings equatorward of the jet and warm-core anticyclonic rings poleward of the jet when the meanders are highly convoluted. Within the Agulhas retroflection region, rings are periodically shed and drift into the South Atlantic [22]. Brazil Current rings are a noted source of variability in the southwest Atlantic [23] and the EAC has long been known for its regular eddy shedding [18]. Meander activity thus can have a substantial impact upon the large-scale water mass and biogeochemical distributions.
Air-sea interaction over longer time scales is affected not only by the SST, but also by upper ocean heat content anomalies, which allow the ocean temperature to remain relatively constant despite large heat loss to the atmosphere. In all WBCEs, year-to-year heat content anomalies can be large within the jet and in the recirculation gyre equatorward of the jet where the top of the thermocline is ~300–500 m deep. Recirculation gyres are found in the retroflection regions where the jets leave the continental margins and extend eastward into the basins [13, 24, 25]. In these region equatorward of the jets, Subtropical Mode Water [26] can be found below the seasonal thermocline and above the main thermocline and acts as a reservoir of thermal anomalies over 5–10 years.
The WBCE observing system must be designed to capture decadal variations in the WBCEs. Various aspects of the KE system, including location of the jet, its SST, strength of its mean flow and meanders, and size of the recirculation gyres, have significant decadal variability, with linkages to the wind from several years prior in the central North Pacific [25]. In the Gulf Stream, decadal variability is less pronounced, but may be related to the North Atlantic Oscillations and interactions with the deep western boundary current associated with variations in the Atlantic Meridional Overturning Circulation (Atlantic MOC, or AMOC) [27, 28]. Strategies for monitoring the AMOC are discussed in this issue by [29]. If decadal predictability of the climate system exists, the heat anomalies must remain coherent within the ocean over long time scales before they are released to the atmosphere within the Tropics or in WBCEs. Decadal predictability thus rests upon understanding the pathways of these heat anomalies within the ocean, and their interaction with the atmosphere.
In addition to decadal variability, WBCE systems can also have significant long term changes. For example, IPCC model projections indicate that it is very likely
that the MOC will slow down in the next century [30]. Within the Agulhas Current system, significant warming trends have been observed that appear to be due to augmentation of its transport in response to an increased wind stress curl in the South Indian Ocean [31]. A common feature of coupled model simulations is a projected poleward shift and strengthening of the westerlies and likewise a poleward shift and weakening of the storm track [32, 33, 30]. These anthropogenic changes are expected to be particularly large in the SH. Thus developing the observing system for the SH WBCEs is of high priority.
While our focus is primarily upon physical observations, the proposed observing system has much in common with monitoring systems for carbon and other biogeochemical and ecosystem cycles. As shown in Fig. 2, WBCEs are characterized by some of the largest air-sea fluxes of carbon dioxide found in the world’s oceans [34]. Carbon uptake is associated with wintertime heat loss by the WBCE. As SSTs drop, surface water CO2 concentrations drop, increasing the thermodynamic drive for the ocean to absorb CO2 from the atmosphere. Subduction and formation of mode waters in these regions move the sequestered CO2 into the ocean interior resulting in an anthropogenic CO2 sink. Primary production and ultimately ecosystem structure and function are likely quite sensitive to the temperature fronts, vertical stratification, and three-dimensional ocean circulation.
2. WBCE COORDINATED OBSERVING SYSTEM ELEMENTS
The ultimate goal of the WBCE observing systems is to provide data necessary to generate accurate, regional weather maps of the atmosphere and ocean and fluxes across the air-sea interface, and estimates of the biogeochemical distributions and ecosystems. To this end, WBCE data are needed for assimilation into numerical models, for assessing these models, and for assessing processes within the climate system affecting these states.
Figure 2. Climatological mean annual sea-air CO2 flux (grams C m-2 yr-1) for the reference year 2000 (non-El Niño conditions). Adapted from [34]. White contours indicate mean dynamic sea level [53].
The WBCE observing systems (Figs. 3–4) thus will comprise elements of the global observing system (e.g., satellites, Argo floats, OceanSITES moorings, Volunteer Observing Ships), although with specific observing strategies optimized for WBCE regions. Because WBCEs are open ocean currents, the observing strategies will differ from those devised for the currents as they flow poleward along the continental margins [35]. Likewise, because of the strong currents, sharp fronts and active synoptic events in both the atmosphere and ocean, the WBCE observing system will differ from the system designed for the slow, basin-scale motion of the gyres.
2.1 WBCE Data for Ocean and Atmosphere State Estimates
For mapping the oceanic and atmospheric circulations, stratification, and property distributions, and their variations, high-resolution models that assimilate satellite and in situ data are required. While we limit the discussion here to surface and subsurface measurements, other atmospheric measurements such as cloud properties, top of atmosphere radiation, and aerosols are important for assimilating into Numerical Weather Prediction (NWP) models. During intensive field process studies, in situ data can be used to generate synoptic maps of the vertical structure in both the atmosphere and ocean. This, however, is not feasible for a long-term monitoring system, hence the need for assimilation with the best possible monitoring products.
2.1.1 Satellite observations of SST [36], vector winds [37], and sea level [38] are the most crucial data used for generating oceanic and atmospheric state estimates from numerical models. It is critical that these satellite missions continue.
Of the surface fields that must be monitored, SST is perhaps the most critical. SST is used for forcing atmospheric NWP models, for computing flux products, and for assimilating into ocean models. Within WBCE regions, clouds associated with the SST front make satellite all-weather microwave SST measurements essential. Surface winds are important for driving ocean models, for generating flux products, and for assimilating into NWP. Because the deep atmospheric response to the WBCE SST is associated with surface wind convergence, vector winds (not just wind speed) are critical. For this reason, QuikSCAT quality surface wind measurements must continue as part of the integrated climate observing system. Sea level is also essential for assimilating into ocean models. Sea level provides information about the surface geostrophic currents and heat content and therefore is a major constraint upon the ocean models. A continuous record of remotely sensed sea level is crucial to resolve decadal variability. Because of the frontal structure and energetic mesoscale and synoptic variability, increased resolution from wide-swath altimeters and construction of a high-resolution merged sea level product are particularly important for WBCE regions. Sea surface salinity can also provides an important constraint upon ocean models and the development of satellite salinity measurements should be continued. For biogeochemical
Figure 3. Coordinated observing system in the Kuroshio-Oyashio Extension (left) and the Gulf Stream (right), superimposed upon the NOAA Optimum Interpolation SST blended with AVHRR and AMSR data for 15 March 2006. Squares indicate flux reference sites; diamonds indicate biogeochemical reference stations. Black indicates existing stations; grey indicates proposed sites. Dots indicate location of Argo floats during the 10-day period 10-20 March 2006. Magenta dots indicate Argo floats deployed during KESS. The KESS study region is indicated by the box in the left panel. The CLIMODE study region (thick box) and SYNOP study regions (thin boxes) are indicated in the right panel. The Oleander repeat section is indicated by a green line.
models, remotely sensed chlorophyll is needed and it needs to be accurate even under cloudy conditions, which are often found in WBCEs.
Satellite observations are also necessary for generating air-sea flux estimates. Air-sea flux products can be generated through compilation of various surface measurements (e.g., the Japanese Ocean Flux data sets with Use of Remote sensing Observations (JOFURO) [39], through NWP model products (e.g., the National Centers for Environmental Prediction (NCEP) reanalyses [40, 41]; European Centre for Medium-Range Weather Forecasts (ECMWF) reanalysis [42]), or through the combination of these types of products (e.g., the Objectively Analyzed Air-Sea Fluxes (OAFlux) [43]). For computation of satellite-based heat and moisture flux products, in addition to the SST and wind measurements discussed above, remotely sensed measurements of air-temperature, specific humidity, surface radiation, and rain that resolve the synoptic and frontal variability in all weather conditions are required.
2.1.2 Underway data from ships (see also 2.3.3 below) can also provide significant data coverage for assimilation into NWP models since the NH and parts of the SH WBCEs are in shipping lanes. Volunteer Observing Ship (VOS) program measurements of sea level pressure (SLP) are of high value for assimilation, and can be of particular value in WBCE regions. The ABL baroclinicity associated with SST fronts is reflected in the SLP; the Laplacian of SLP is related to surface wind convergence and deep atmospheric convection [7]. Underway ship measurements can provide the necessary resolution for evaluating these second derivatives. Although ships tend to avoid regions of extremely low SLP due to winter storms and warm season typhoons and hurricanes, the data they provide prior to the events can be important for forecasting the system development through improved model initialization.
In addition to the physical measurements, biogeochemical and ecosystem models need reliable estimates of other variables including CO2, oxygen, and chlorophyll. Underway pCO2 and biogeochemical measurements can be used to generate CO2 flux maps and evaluate mechanisms responsible for CO2 variability in surface waters to better constrain global flux estimates.
2.1.3 Drifter measurements of SST and SLP and other measurements are critical in the SH, where VOS are sparse. When drogued, drifter displacement rates can be used to estimate surface currents. Drifter technology is rapidly advancing. Other important WBCE drifter measurements include surface salinity, waves, pCO2, and net surface heat flux.
2.1.4 Enhanced Argo float sampling is recommended for WBCEs. Subsurface temperature and salinity profiles from Argo floats can be used for assimilation into ocean models. As shown in Fig. 3, enhanced Argo sampling associated with process studies in the North Pacific resulted in a float distribution that generally met or exceeded the standard target of 1 float per 3° × 3° box per 10 days. This standard sampling target, however, is relatively coarse for WBCE regions where the width of the oceanic jet, half wavelength of meanders, and the jet’s advective and meander time scales would argue for a sampling target of closer to 1 float per 1° latitude × 2° longitude box per 5 days. In contrast, for the same 10-day period, there were no Argo floats in a large 4° latitude × 8° longitude region of the GS’s southern recirculation gyre. Samples can be increased by a factor of two by having floats rise every 5 days rather than 10 days, or by having twice as many floats seeded in the region. For the purpose of data assimilation, it is preferable to have a 10-day sample rate from twice as many floats, since these floats will tend to have a more random distribution and will tend to last longer. On the other hand, as discussed later, for
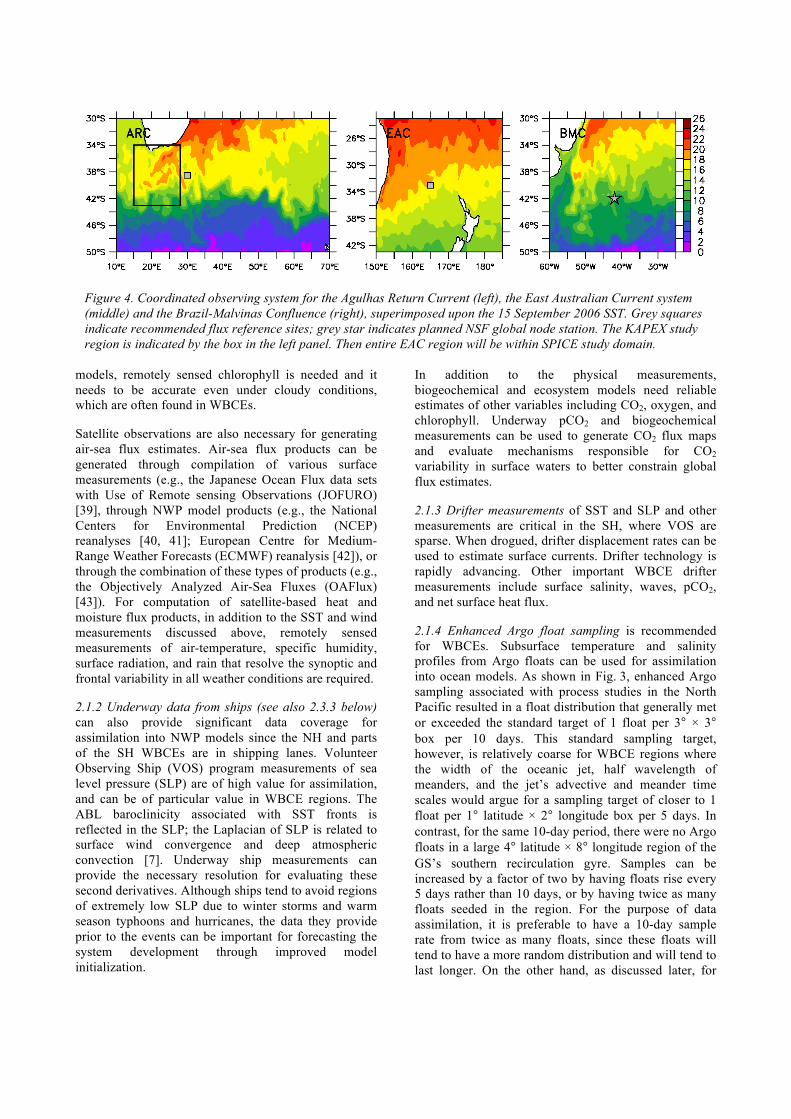
Figure 4. Coordinated observing system for the Agulhas Return Current (left), the East Australian Current system (middle) and the Brazil-Malvinas Confluence (right), superimposed upon the 15 September 2006 SST. Grey squares indicate recommended flux reference sites; grey star indicates planned NSF global node station. The KAPEX study region is indicated by the box in the left panel. Then entire EAC region will be within SPICE study domain.
water mass transformation analyses, the 5-day sample rate is preferable. Argo floats deployed during the recent Kuroshio Extension System Study (KESS) also had a 1500 db parking depth. WBCE jets can be strongly baroclinic: the flow at 1000 db can be more than three times larger than that at 2000 db. In these baroclinic systems, a deeper parking depth may be justified. Finally, it should be noted that even with the relatively dense sampling, synoptic maps could not be computed directly from the KESS profiles. Indeed, none of the in situ observational networks that comprise the sustained WBCE observing system are capable of resolving both the spatial and temporal synoptic variability. Synoptic mapping of subsurface fields requires a high-resolution ocean model that assimilates surface fields (e.g., sea level and SST) and the subsurface Argo profiles.
2.2 WBCE Data for Assessing Models
Although numerical models can provide a relatively complete representation of the properties and three-dimensional circulations in the atmosphere and ocean, they cannot be considered to represent reality until they are verified. Because assimilation schemes weigh each observation and model error differently, the assimilation products will not be identical to the data that has been assimilated. Thus, satellite, Argo, VOS, and other assimilated data can still be used for assessing model products. Ideally, however, the reference data used to assess a model should not be assimilated into the product. The OceanSITES program [44] has a mandate to provide time series of such reference data. Each station has a unique World Meteorological Organization (WMO) number containing the digits “84,” signifying reference data. Operational meteorological and oceanographic centers can thus use their real-time data in weather forecasts and withhold them from reanalysis products.
2.2.1 Surface flux reference moorings with subsurface measurements should be located within the highest air-sea flux regions in each of the five systems. In all cases, these locations are within or equatorward of the separated boundary current. At present, there are no flux reference stations operating in any WBCE other than the KOE system. In the Gulf Stream, a flux reference station at the former site of the CLIMODE surface mooring is recommended (Fig. 3). A National Science Foundation (NSF) Ocean Observing Initiative global node is being planned for 42°S, 42°W, which is poleward of the BMC front. If this site is to capture high air-sea fluxes in the BMC, we strongly recommend a more northern location. Of the three Southern Hemisphere (SH) WBCEs (Fig. 4), ARC has the largest heat fluxes and thus an ARC flux reference station is highly recommended. SH WBCE are significantly different than NH WBCEs. An increased uncertainty in their fluxes is expected due to overall lack of
observations in the SH. Likewise, even in the Gulf Stream, there are many significant differences in the geometry of the landmasses and MOCs that can effect the air-sea interactions. Thus it is not sufficient to have a reference station in just one WBCE system. Each WBCE should have its own reference stations. Furthermore, within the WBCEs, multiple reference stations can be justified since sharp fronts modify the air-masses and separate fundamentally different water masses, ecosystems, and dynamical systems. Reference stations generally are visited by a ship at least once per year. These cruises can augment the integrated observing system by providing opportunities for deploying drifters and floats and making underway measurements.
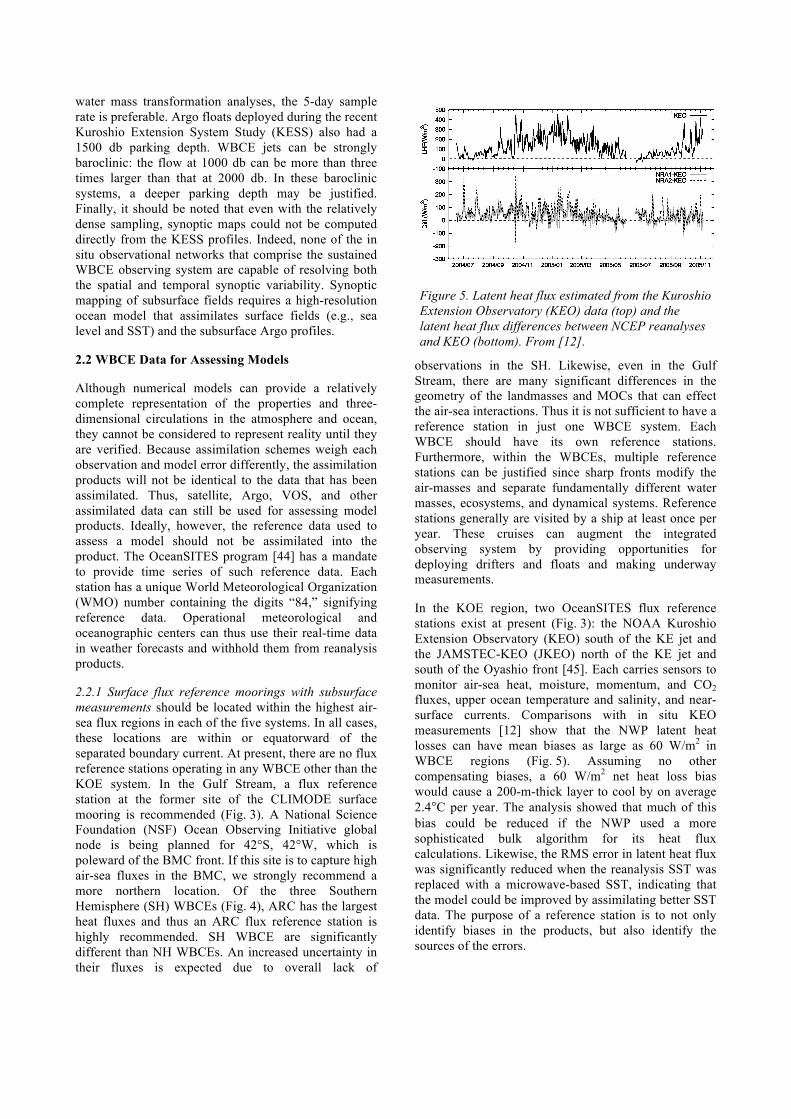
In the KOE region, two OceanSITES flux reference stations exist at present (Fig. 3): the NOAA Kuroshio Extension Observatory (KEO) south of the KE jet and the JAMSTEC-KEO (JKEO) north of the KE jet and south of the Oyashio front [45]. Each carries sensors to monitor air-sea heat, moisture, momentum, and CO2 fluxes, upper ocean temperature and salinity, and near-surface currents. Comparisons with in situ KEO measurements [12] show that the NWP latent heat losses can have mean biases as large as 60 W/m2 in WBCE regions (Fig. 5). Assuming no other compensating biases, a 60 W/m2 net heat loss bias would cause a 200-m-thick layer to cool by on average 2.4°C per year. The analysis showed that much of this bias could be reduced if the NWP used a more sophisticated bulk algorithm for its heat flux calculations. Likewise, the RMS error in latent heat flux was significantly reduced when the reanalysis SST was replaced with a microwave-based SST, indicating that the model could be improved by assimilating better SST data. The purpose of a reference station is to not only identify biases in the products, but also identify the sources of the errors.
Figure 5. Latent heat flux estimated from the Kuroshio Extension Observatory (KEO) data (top) and the latent heat flux differences between NCEP reanalyses and KEO (bottom). From [12].
2.2.2 Biogeochemical reference stations are generally located away from the fronts, in regions of well-defined water masses. This simplifies interpretation of the observed variability. Having stations near the WBCE fronts, however, can help characterize the large signals in these dynamic regions. As shown in Fig. 3, a JAMSTEC biogeochemical reference station (K2) exists north of the Oyashio front in the subpolar gyre, and a JAMSTEC biogeochemical reference station (S1) is recommended for the Subtropical Mode Water region of the recirculation gyre south of the Kuroshio Extension. With these sites to constrain the subpolar and subtropical signals, biogeochemical measurements at KEO and JKEO can be used to characterize the jet’s impact on the local biogeochemistry.
Within the GS system, subsurface measurements have been collected at Hydrostation “S”, near Bermuda, since 1954 and the biological reference station, Bermuda Atlantic Time Series (BATS), was initiated in 1989 [46]. At present, however, there are no mooring reference stations, physical or biogeochemical, at BATS or in the open ocean GS system. Likewise, at present, there are also no biogeochemical reference stations in the SH WBCE regions. Biogeochemical measurements are planned, however, for the NSF global node station south of the BMC.
2.2.3 Process studies can also provide useful WBCE data for assessing models. Because of their limited duration, data sets from these studies do not generally capture the interannual–decadal variability. Likewise, some model or satellite products may not extend back to the historical process studies. Intensive field studies, however, are an effective way to determine the scales of variability and processes in effect. Historical WBCE process studies include: the 1986–1988 Gulf Stream SYNoptic Ocean Processes (SYNOP); the 2004–2006 Kuroshio Extension System Study (KESS); and the 2005–2007 Gulf Stream CLIvar MODE water Dynamics Experiment (CLIMODE). SYNOP and KESS data can be found at http://uskess.org; CLIMODE data can be found at http://climode.org. In 1988–1990, an intensive field study took place in the BMC [47]; The Cape of Good Hope Experiment (KAPEX) and the Mixing of Agulhas Rings Experiment (MARE) took place in the southern Agulhas system in 1997/98 and 1999/2000, respectively (see special issue of Deep-Sea Research Part II [48]). The Southwest Pacific Ocean circulation and Climate Experiment (SPICE) field operations in the Solomon, Coral, and Tasman Seas are planned for 2008–2012. Further information regarding SPICE can be found at http://www.ird.nc/UR65/ SPICE/spice.html. Future process studies in WBCE regions should strive to be more multidisciplinary, including physical, geochemical, and biological scientists to provide a more comprehensive view of the relevant processes occurring in these regions.
2.3 WBCE Data for Assessing Ocean and Atmosphere Climate Processes
The WBCE observing system should be capable of providing data to identify the relevant processes that impact the climate system in these regions of very large air-sea interaction. In particular, these data should allow evaluation of the WBCE contribution to global heat, moisture, momentum, and energy budgets. The data should also allow estimation of upper ocean ventilation, including heat and carbon storage. The resulting properties stored within the ocean can provide a memory of the atmospheric state during the period of ventilation, potentially providing predictability over longer timescales.
2.3.1 Coordinated observing systems. Although each platform alone cannot monitor the complete balance of processes, much can be done by using data from a combination of platforms. For example, satellite data can provide or be combined to provide net surface heat, moisture, and momentum fluxes, while subsurface (in situ) data are needed to determine the net effect of the fluxes on the upper ocean budgets. Flux moorings can evaluate the surface forcing and vertical and temporal response, and can be combined with other data sets to estimate advective processes. Subsurface bio-geochemical moorings can be paired with surface flux moorings to determine the effects of surface forcing on the biogeochemistry in the water column. In addition, mechanistic relationships can be identified through co-variation analyses of sets of variables, e.g., precipitation and SST, mode water thickness and mixed layer depth, mode water thickness and thermocline depth, CO2 flux and heat flux. Such analyses can lead to improved parameterizations of unresolved processes in numerical models and can provide stringent tests for model assessments. Improved understanding of the system’s variability and the mechanics of this variability would also greatly aid decision makers and resource managers who must explain the choices to their constituents.
2.3.2 For ventilation analyses, it is recommended that a subset of Argo floats should profile every 5 days. Water mass formation occurs during a limited time in winter each year, and is strongly modulated by the frequency of winter storms. A basic principal of time series analysis is that the observing system must sample at least twice as frequently as the variations in the system observed. Thus an Argo sample rate of 10 days is insufficient if data from Argo floats are to be used for understanding water mass transformation. KESS and CLIMODE analyses have shown, however, that the wintertime water transformations caused predominately by synoptic atmospheric forcing could be traced with 5-day sampling floats [49, 50].
It is also recommended that a subset of the Argo floats in the WBCE regions, and especially those with more frequent sampling, also include oxygen sensors in addition to the standard temperature and salinity sensors [51]. Variations in subsurface oxygen concentrations reflect changes in the balance between supply through circulation and ventilation and consumption by respiratory processes. Oxygen also helps constrain the biological impacts on the carbon distributions, allowing improved estimates of anthropogenic carbon uptake and storage. Oxygen can also reflect changes in water mass ventilation rates, a particularly important issue in the WBCE regions.
2.3.3 For frontal and transport analyses, underway monitoring on repeat sections is recommended. Large transports of mass and heat are fundamental characteristics of western boundary currents, yet are very difficult to monitor. Because of the deep currents and the tight recirculations to the north and south of the jet, it is not sufficient to simply monitor the surface current. To estimate the net transport from the WBCE to the interior, the fully meandering jet and its recirculation gyres must be monitored. Furthermore, because this transport is expected to vary over a range of timescales, the measurements should be repeated at regular intervals. Repeat sections by a ship with underway ADCP measurements provide one of the few ways to monitor WBCE currents and transport. Since 1992, the Oleander has made weekly ADCP transects of the Gulf Stream between Norfolk and Bermuda. Since 1977, once a month, volunteers through the Ship of Opportunity Program (SOOP) ride the ship to make eXpendable Bathy Thermograph (XBT) measurements, surface salinity, and towed phytoplankton concentration measurements [52]. If feasible, a similar type of repeat section is recommended for the other WBCEs. At minimum, repeat sections en route to reference station sites should be made. Important underway measurements on repeat sections include not only surface and subsurface temperature and salinity, and ADCPs, but also surface meteorological variables, atmospheric profiles, and biogeochemical and carbon variables such as pCO2. Frontal structure analyses could then be carried out for a full suite of variables.
3. SUMMARY
Western Boundary Current Extensions are key locations for air-sea interaction in mid-latitudes, and are also regions where high spatial resolution is necessary to capture first order features. WBCE observing systems are necessary for providing data for assimilating into weather, ocean, and climate models and for assessing their products. Decadal predictability of the climate system relies on processes within WBCE. Thus continuous monitoring for more than a season or two are essential to verify potential modes of predictability. A
WBCE observing system can serve as a basic framework for multidisciplinary observations. Stakeholders for this system include: operational meteorological and oceanographic centers, international research programs, model assessments, state of the climate assessments, carbon markets, and ecosystem and fisheries managers. With these principles in mind, we make the following recommendations:
• It is essential that the satellite records for SST, wind speed and direction, and sea level be maintained uninterrupted. These and other important remote measurements must have sufficient resolution and accuracy to resolve synoptic and frontal variability in the WBCEs under all-weather conditions.
• Each WBCE system should have an OceanSITES reference station or an array of reference stations that includes both physical and biogeochemical measurements. At least one station should be within the high-flux region of the WBCE. Establishing a Southern Hemisphere site is of highest priority.
• Underway pCO2 measurements are critical for understanding air-sea gas exchange variability in WBCE regions. Additionally, atmospheric pressure measurements from VOS and surface drifters are needed for assimilation in NWP models, and for their validation in real time. Other VOS and drifter measurements should also be encouraged.
• Enhanced Argo float sampling in the WBCEs is necessary in order to achieve the targets set by the global Argo program. A subset of the Argo floats should have 5-day profiling rates and carry oxygen sensors for ventilation studies.
• Each WBCE system should have a repeat section of underway physical and biogeochemical measurements that cross the jet and, ideally, its recirculation gyres.
• The biogeochemical and physical observing systems should be coordinated to serve the broad community.
ACKNOWLEDGEMENTS
This CWP was proposed by the US CLIVAR Working Group on Ocean–Atmosphere Interactions in Western Boundary Currents http://www.usclivar.org/wbc.php. Ideas were vetted at an open workshop, organized by the working group and held in Phoenix, AZ, in January 2009. Heat flux and SST data were provided by the Asia-Pacific Data-Research Center. The CO2 flux data was provided by the Ferret group at NOAA PMEL. The Rio05 mean sea level was produced by CLS Space Oceanography Division and provided by Aviso.
REFERENCES
1. Trenberth, K.E. & Caron, J.M. (2001). Estimates of Meridional Atmosphere and Ocean Heat Transports. J. Climate 14, 3433–3443.
2. Nakamura, H., Sampe, T., Goto, A., Ohfuchi, W. &. Xie, S.-P. (2008). On the Importance of Midlatitude Oceanic Frontal Zones for the Mean State and Dominant Variability in the Tropospheric Circulation. Geophys. Res. Lett. 35, doi:10.1029/2008GL034010.
4. Pezzi, L.P., Souza, R.B., Dourado, M.S., Garcia, C.A.E., Mata, M.M. & Silva-Dias, M.A.F. (2005). Ocean-Atmosphere in situ Observations at the Brazil-Malvinas Confluence Region. Geophys. Res. Lett. 32, L22603, doi:10.1029/2005GL023866.
5. Small, R.J., deSzoeke, S.P., Xie, S.P., O’Neill, L., Seo, H., Song, Q., Cornillon, P., Spall, M. & Minobe, S. (2008). Air-Aea Interaction Over Ocean Fronts and Eddies. Dyn. Atm. Oceans 45, 274–319.
6. Tokinaga, H., Tanimoto, Y., Xie, S.-P., Sampe, T., Tomita, H. & Ichikawa, H. (2009). Ocean Frontal Effects on the Vertical Development of Clouds Over the Western North Pacific: In situ and Satellite Observations. J. Climate 22, 4241–4260.
7. Minobe, S., Kuwano-Yoshida, A., Komori, N., Xie, S. & Small, R.J. (2008). Influence of the Gulf Stream on the Troposphere. Nature 452, 206–209.
8. Reason, C.J.C. (2001). Evidence for the Influence of the Agulhas Current on Regional Atmospheric Circulation Patterns. J. Climate 14, 2769–2778.
9. Businger, S., Graziano, T.M., Kaplan, M.L. & Rozumalski, R.A. (2005). Cold-Air Cyclogenesis Along the Gulf-Stream Front: Investigation of Diabatic Impacts on Cyclone Development, Frontal Structure, and Track. Meteor. Atmos. Phys. 88, 65–90.
10. Moore, G.W.K. & Renfrew, I.A. (2002). An Assessment of the Surface Turbulent Heat Fluxes From the NCEP Reanalysis Over
Western Bboundary Currents. J. Climate 15, 2020–2037.
11. Rouault, M., Reason, C.J.C., Lutjeharms, J.R.E. & Beljaars, A. (2003). Underestimation of Latent and Sensible Heat Fluxes Above the Agulhas Current in NCEP and ECMWF Analyses. J. Climate 16, 776–782.
12. Kubota, M., Iwabe, N., Cronin, M. & Tomita, H. (2008). Surface Heat Fluxes From the NCEP/NCAR and NCEP/DOE Reanalyses at the Kuroshio Extension Observatory Buoy Site. J. Geophys. Res. 113, C02009, doi:10.1029/ 2007JC004338.
13. Schmitz, W.J. (1995). On the Eddy Field in the Agulhas Retroflection, With Some Global Considerations. J. Geophys. Res. 101, 16,259–16,271.
14. Johns, W.E., Shay, T.J., Bane, J.M. & Watts, D.R. (1995). Gulf Stream Structure, Transport, and Recirculation Near 68°W. J. Geophys. Res. 100, 817–838.
15. Jayne, S.R., Hogg, N.G., Waterman, S.N., Rainville, L., Donohue, K.A., Watts, D.R., Tracey, K.L., McClean, J.L., Maltrud, M.E., Qiu, B., Chen, S. & Hacker, P. (2009). The Kuroshio Extension and its Recirculation Gyres. Deep-Sea Res. I, doi:10.1016/j.dsr.2009.08.006.
16. Goni, G., Kamholz, S., Garzoli, S. & Olson, D. (1996). Dynamics of the Brazil-Malvinas Confluence Based on Inverted Echo Sounders and Altimetry. J. Geophys. Res. 101(C7), 16,273–16,289.
17. Vivier, F. & Provost, C. (1999). Direct Velocity Measurements in the Malvinas Current. J. Geophys. Res. 104(C9), 21,083–21,103.
18. Ridgway, K.R. & Dunn, J.R. (2003). Mesoscale Structure of the Mean East Australian Current System and its Relationship with Topography. Prog. Oceanogr. 56, 189–222.
19. Cronin, M. & Watts, D.R. (1996). Eddy-Mean Flow Interaction in the Gulf Stream at 68°W: Part I. Eddy Energetics. J. Phys. Oceanogr. 26, 2107–2131.
20. Park, J.-H., Watts, D.R., Donohue, K.A., & Jayne, S.R. (2008). A Comparison of in situ Bottom Pressure Array Measurements With GRACE Estimates in the Kuroshio Extension. Geophys. Res. Lett. 35, L17601, doi:10.1029/ 2008GL034778.
21. Bower, A.S., & Rossby, H.T. (1989). Evidence of Cross-Frontal Exchange Processes in the Gulf Stream Based on Isopycnal RAFOS Float Data. J. Phys. Oceanogr. 19, 1177–1190.
22. Lutjeharms, J.R.E & van Ballegooyen, R.C., (1988). The Retroflection of the Agulhas Current. J. Phys. Oceanogr. 18(11), 1570–1583.
23. Goni, G. & Wainer, I. (2001). Investigation of the Brazil Current Front Variability From Altimeter Data. J. Geophys. Res. 106(C12), 31,117–31,128.
24. Wang, W. & Lozier, M.S. (1995). An Estimate of the Climatological Mean Circulation in the Western North Atlantic. J. Mar. Res. 53, 1059–1080.
25. Qiu, B. & Chen, S. (2005). Variability of the Kuroshio Extension Jet, Recirculation Gyre, and Mesoscale Eddies on Decadal Time Scales. J. Phys. Oceanogr. 35, 2090–2103.
26. Hanawa, K. & Talley, L.D. (2001). Mode Waters. In: G. Siedler et al., editors, Ocean Circulation and Climate—Observing and Modelling the Global Ocean, Academic Press, 373–386.
27. Joyce, T.M., Deser, C. & Spall, M.A. (2000). The Relation between Decadal Variability of Subtropical Mode Water and the North Atlantic Oscillation. J. Climate 13, 2550–2569.
28. Peña-Molino, B. & Joyce, T.M. (2008). Variability in the Slope Water and its Relation to the Gulf Stream Path. Geophys. Res. Lett. 35, L03606, doi:10.1029/2007GL032183.
29. Cunningham, S., Baringer, M., Toole, J., Osterhaus, S., Fisher, J., Piaola, A., McDonagah, E., Lozier, S., Send, U., Kanzow, T., Marotzke, J., Rhein, M., Garzoli, S., Rintoul, S., Speich, S., Wijffels, S., Talley, L., Baehr, J., Meinen, C., Treguier, A.-M. & Lherminier, P. (2010). The Present and Future System for Measuring the Atlantic Meridional Overturning Circulation and Heat Transport. In Proceedings of the “OceanObs’09: Sustained Ocean Observations and Information for Society” Conference (Vol. 2), Venice, Italy, 21–25 September 2009, Hall, J., Harrison, D.E., and Stammer, D., Eds., ESA Publication WPP-306.
30. Solomon, S., Qin, D., Manning, M., Chen, Z., Marquis, M., Averyt, K.B., Tignor, M. & Millers, H.L. (eds.) (2007). Contribution of Working Group I to the Fourth Assessment Report of the Intergovernmental Panel on
Climate Change. Cambridge University Press, Cambridge, UK and NY, NY USA, 996 pp.
31. Rouault, M., Penven, P. & Pohl, B. (2009). Warming in the Agulhas Current System Since the 1980s. Geophys. Res. Lett. 36, L12602, doi:10.1029/2009GL037987.
32. Yin, J.H. (2005). A Consistent Poleward Shift of the Storm Tracks in Simulations of 21st century climate. Geophys. Res. Lett. 32, L18701, 10.1029/2005GL023684.
33. Fyfe, J.C. & Saenko, O.A. (2006). Simulated Changes in the Extratropical Southern Hemisphere Winds and Currents. Geophys. Res. Lett. 33, L06701, doi:10.1029/2005GL025332.
34. Takahashi, T., Sutherland, S.C., Wanninkhof, R., Sweeney, C., Feely, R.A., Chipman, D.W., Hales, B., Friederich, G., Chavez, F., Watson, A., Bakker, D.C.E., Schuster, U., Metzl, N., Yoshikawa-Inoue, H., Ishii, M., Midorikawa, T., Sabine, C., Hopemma, M., Olafsson, J., Arnarson, T.S., Tilbrook, B., Johannessen, T., Olsen, A., Bellerby, R., de Baar, H.J.W., Nojiri, Y., Wong, C.S. & Delille, B. (2007). Climatological Mean and Decadal Change in Surface Ocean pCO2, and Net Sea-Air CO2 Flux Over the Global Oceans. Deep-Sea Res. [in press].
35. Send, U., Davis, R., Fischer, J., Imawaki, S., Kessler, W., Meinen, C., Owens, B., Roemmich, D., Rossb, T., Rudnick, D., Toole, J., Wijffles, S. & Beal, L. (2010a). A global boundary current circulation observing network. In Proceedings of the “OceanObs’09: Sustained Ocean Observations and Information for Society” Conference (Vol. 2), Venice, Italy, 21–25 September 2009, Hall, J., Harrison, D.E., and Stammer, D., Eds., ESA Publication WPP-306.
36. Donlon, C., Casey, K., Gentemann, C., LeBorgne, P., Robinson, I., Reeynolds, R., Merchant, C., Llewellyn-Jones, D., Minnett, P., Piolle, J., Cornillon, P., Rayner, N., Brandon, T., Vazquez, J., Armstrong, E., Beggs, H., Barton, I., Wick, G., Castro, S., Hoeyer, J., May, D., Arino, O., Poulter, D., Evans, R., Mutlow, C., Bingham, A. & Harris, A. (2010). Successes and Challenges for the Modern Sea Surface Temperature Observing System. In Proceedings of the “OceanObs’09: Sustained Ocean Observations and Information for Society” Conference (Vol. 2), Venice, Italy, 21–25 September 2009, Hall, J., Harrison, D.E., and Stammer, D., Eds., ESA Publication WPP-306.
37. Bourassa, M., M., Bonekamp, H., Chang, P., Chelton, D., Edson, R., Fraklin, J., He, Y., Hersback, H., Hilburn, K., Lee, T., Liu, W., Long, D., Kelly, K., Knabb, R., Lehner, S., Perrie, W., Portabella, M., Powell, M., Rodriguez, E., Smith, D., Stoffelen, A., Swail, V., Wentz, F. & Courney, J. (2010). Remotely Sensed Winds and Wind Stresses for Marine Forecasting and Ocean Modeling. In Proceedings of the “OceanObs’09: Sustained Ocean Observations and Information for Society” Conference (Vol. 2), Venice, Italy, 21–25 September 2009, Hall, J., Harrison, D.E., and Stammer, D., Eds., ESA Publication WPP-306.
38. Wilson, S., Parisot, F., Escudier, P., Fellous, J.L., Benveniste, J., Bonekamp, H., Drinkwater, M., Fu, L., Jacobs, G., Lin, M., Lindstrom, E., Miller, L., Sharma, R., Thouvenot, E. (2010). Ocean Surface Topography Constellation: The Next 15 Years in Satellite Altimetry. In Proceedings of the “OceanObs’09: Sustained Ocean Observations and Information for Society” Conference (Vol. 2), Venice, Italy, 21–25 September 2009, Hall, J., Harrison, D.E., and Stammer, D., Eds., ESA Publication WPP-306.
39. Kubota, M., Iwasaka, N., Kizu, S., Konda, M. & Kutsuwada, K. (2002). Japanese Ocean Flux Data Sets With use of Remote Sensing Observations (J-OFURO). J. Oceanogr. 58, 213–225.
40. Kalnay, E., Kanamitsu, M., Kistler, R., Collins, W., Deaven, D., Gandin, L., Iredell, M., Saha, S., White, G., Woollen, J., Zhu, Y., Chelliah, M., Ebisuzaki, W., Higgins, W., Janowiak, J., Mo, K.C., Ropelewski, C., Wang, J., Leetmaa, A., Reynolds, R., Jenne, R. & Joseph, D. (1996). The NCEP/NCAR 40-Year Reanalysis Project. Bull. Amer. Meteor. Soc. 77, 437–471.
41. Kanamitsu, M., Ebisuzxaki, W., Woolen, J., Yang, S.-K., Hnilo, J., Fiorino, M. & Potter, G.L. (2002). NCEP–DOE AMIP-II Reanalysis (R-2). Bull. Amer. Meteor. Soc. 83, 1631–1643.
42. Gibson, J.K., Kallberg, P., Uppala, S., Hernandez, A., Nomura, A. & Serrano, E. (1997). ERA Description: Part I. ECMWF Reanalysis Project Report Series, ECMWF, 72 pp.
43. Yu, L. & Weller, R.A. (2007). Objectively Analyzed Air-Sea Heat Fluxes for the Global Ice-Free Oceans (1981–2005). Bull. Amer. Meteor. Soc. 88, 527–539.
44. Send, U., Weller, R., Wallace, D., Chavez, F., Lampitt, R., Dickey, T., Honda, M., Nittis, K., Lukas, R., McPhaden, M. & Feely, R. (2010b). OceanSITES. In Proceedings of the “OceanObs’09: Sustained Ocean Observations and Information for Society” Conference (Vol. 2), Venice, Italy, 21–25 September 2009, Hall, J., Harrison, D.E., and Stammer, D., Eds., ESA Publication WPP-306.
45. Cronin, M.F., Meinig, C., Sabine, C.L., Ichikawa, H. & Tomita, H. (2008). Surface Mooring Network in the Kuroshio Extension. IEEE Systems Special Issue on GEOSS 2(3), 424–430.
46. Phillips, H.E. & Joyce, T.M. (2007). Bermuda’s Tale of Two Time-Series: Hydrostation S and BATS. J. Phys. Oceanogr. 37, 554–571.
47. Garzoli, S.L., et al. (1990). Confluence 1988–1990; An Intensive Study of the Southwestern Atlantic. Eos Trans. AGU 71(41), 1131.
48. Richardson, P.L., Lutjeharms, J.R.E. & Boebel, O. (2003). Introduction to the “Inter-Ocean Exchange Around Southern Africa,” Deep Sea Res. II 50, 1–12.
49. Navarro, B. & Talley, L. (2008). Evolution of Eighteen Degree Water and Deep Mixed Layer Oxygen and Properties from Profiling Floats During CLIMODE. Eos Trans. AGU 89(53), Fall Meet. Suppl., Abstract.
50. Qiu, B., Hacker, P., Chen, S., Donohue, K.A., Watts, D.R., Mitsudera, H., Hogg, N.G. & Jayne, S.R. (2006). Observations of the Subtropical Mode Water Evolution From the Kuroshio Extension System Study. J. Phys. Oceanogr. 36, 457–473.
51. Gruber, N., Doney, S.C., Emerson, S.R., Gilbert, D., Kobayashi, T., Kortzinger, A., Johnson, G. C., Johnson, K.S., Riser, S.C. & Ulloa, O. (2010). Adding Oxygen to Argo: Developing a Global in-situ Observatory for Ocean Deoxygenation and Biogeochemistry. In Proceedings of the “OceanObs’09: Sustained Ocean Observations and Information for Society” Conference (Vol. 2), Venice, Italy, 21–25 September 2009, Hall, J., Harrison, D.E., and Stammer, D., Eds., ESA Publication WPP-306.
52. Goni, G., Roemmich, D., Molinari, R., Meyers, G., Rossby, T., Sun, C., Boyer, T., Baringer, M., Garzoli, S., Vissa, G., Swart, S., Keeley, R. & Maes, C. (2010). The Ship of Opportunity Program. In Proceedings of the “OceanObs’09:
Sustained Ocean Observations and Information for Society” Conference (Vol. 2), Venice, Italy, 21–25 September 2009, Hall, J., Harrison, D.E., and Stammer, D., Eds., ESA Publication WPP-306.
53. Rio, M.-H. & Hernandez, F. (2004). A Mean Dynamic Topography Computed Over the World Ocean From Altimetry, in situ Measurements, and a Geoid Model. J. Geophys. Res. 109, C12032, doi:10.1029/2003JC002226.