he study of adsorption of particles onto surfaces iselevant to colloid science and biophysics, and it iselated to a variety of practical problems such ashemisorption, catalysis, and biopolymer immobiliza-ion. Particle adsorption at the solid–liquid inter-ace refers to a process that leads to an increase in thearticle concentration in the region adjacent to theolid interface. In the absence of a chemical reactionnd of convective fluxes, adsorption is driven by vaner Waals and electrostatic forces and is modulatedy Brownian motion and hydrodynamic interac-ions.1 Particle adsorption depends on the bulk con-entration near the surface, the form of the particles,nd the forces involved in the interaction among par-icles and between the particles and the surface. At
M. C. Pena-Gomar �[email protected]�, Ma. L. Gonzalez-onzalez, and E. Perez are with the Instituto de Fısica, Univer-
idad Autonoma de San Luis Potosi, Alvaro Obregon 64, 78000 Sanuis Potosi, San Luis Potosi, Mexico. A. Garcıa-Valenzuela isith the Centro de Ciencias Aplicadas y Desarrollo Tecnologico,niversidad Nacional Autonoma de Mexico, Ciudad Universitaria,partado Postal 70-168, Mexico Distrito Federal, 04510, Mexico.. Anto-Roca is with CD6-Universitat Politecnica de Catalunya,arrer Colom, 2, E-08222 Terrassa, Espana.
Received 27 April 2004; revised manuscript received 20 August004; accepted 27 August 2004.0003-6935�04�325963-08$15.00�0
resent, particle adsorption cannot be described by aeneral theory, and it is, in fact, a complex problem.2Random sequential adsorption �RSA� is the sim-
lest model used to describe this process. It trans-orms the physical problem into a statistical one thatescribes the particle adsorption as a random pro-ess. This model consists of placing the particles onhe surface, one by one, under the following two con-itions: �i� once a particle is adsorbed, its position isermanently fixed and �ii� two particles do not over-ap in the range of their interaction.3,4 These condi-ions are satisfied when the particle–surfacenteraction is dominant and when there is no diffu-ion of the particles onto the surface. The RSAodel implicitly assumes that the particles are ad-
orbed in a monolayer. This model has been appliedo the adsorption of biological and colloidal particlesnto a flat surface ever since it was experimentallybserved that these systems are irreversibly ad-orbed in monolayer form onto the surface.5–7 Whenhe interaction among particles is due only to particleolume, RSA is able to predict the maximum surfaceoverage ��max, also called the jamming limit� of 0.547or this adsorption process.1 Interacting particlesan be studied with this same formalism by definitionf an effective interaction range.8 A particle ad-orbed onto the surface produces an exclusion vol-me, defined by the interaction with other particles,hat can be greater than its own volume.9
escribe this process.1,10 The solution of this equa-ion depends strongly on the surface exclusion effectcondition �ii� above�. In the simplest case, the RSApproach, the dependence of the surface coverage ���n time yields the power law �max � � � t�1�2 near theamming limit.11,12
RSA is a special case of particle adsorption, but otherhysical situations can be present. Particle adsorp-ion can be limited by the diffusive process of particlesrom the solution to the surface.12 Furthermore, par-icle diffusion on the surface can be faster than particledsorption, allowing a thermodynamic equilibrium ofhe particle on the surface.12,13 In both cases maxi-um adsorption and kinetic behaviour are different
rom those in the RSA model. Indeed, the behavior ofultilayers formed by particles of different charges14
hould be different from that predicted by the RSAodel. To validate the use of the models to solve a
ariety of problems associated with particle adsorp-ion, we require experimental techniques that mea-ure the surface coverage fraction in real time with ainimum perturbation to the system.Optical methods have shown a good performance in
his type of study. Experiments can be carried outn situ without any special preparation, and datacquisition can be relatively fast. Therefore opticalethods may allow the determination of not only thenal state of the film but also the kinetics of thedsorption process. Optical microscopy has beenreviously used to study the particle distribution on aurface covered by large particles ��1 m� under thenfluence of gravity,15 as well as adsorption in theresence of convective forces.16 Optical reflectom-try17 and ellipsometry18 have also been used to studyarticle adsorption. One advantage of these tech-iques is that they can be used to study the adsorp-ion of small particles �1 m�. However, it is not arivial task to analyse the adsorption of particles thatorm layers on a surface by use of reflectometry andllipsometry. Analysis of the experimental data ob-ained with these techniques requires the use of mod-ls for interpretation.18
A simple technique for real-time monitoring of andsorption process that may offer high sensitivity ishe use of laser reflectometry near the critical angleLRCA�. Basically one needs a prism that is in con-act with a suspension of particles and that measureshe reflectance of a laser beam incident near the crit-cal angle on the prism side. This technique has al-eady been used to measure variations in the effectivendex of refraction of a suspension of particles,19 inhich it was observed that particle adsorption onto therism interface produced strong changes in reflec-ance.
The purpose of the present study is to establish thepplicability of LRCA to monitoring in real time thedsorption of particles onto a flat interface and tovaluate this technique’s sensitivity. To this end,e prepared water suspensions of electrically
harged latex particles and placed them in contactith an optical prism while measuring the reflec-
ance of a laser beam near the critical angle as a g
unction of time. Positive and negative particlesere used in this study. The volume fraction of par-
icles was kept low so that the measured signals wereue mainly to the particles adsorbed onto the inter-ace. The adsorption of particles forming a mono-ayer on the glass interface was confirmed by optical
icroscopy. Sequential injections of positive andegative particles were also carried out in this study.
. Experiments
. Latex Particles and Cleaning Process
atex particles were made of poly�styrene� byurfactant-free emulsion polymerization. Positivend negative particles were synthesized by use of-2�-azobis �2-methylpropionamidine� dihydrochlo-ide and persulfate of potassium, respectively, andhe following recipe: water, 18.0 ml; styrene �mono-er�, 1.0 ml; and different initiator amounts depend-
ng on the electrical charge and size of the particle.he synthesis was carried out at 70 °C and 750 rpm
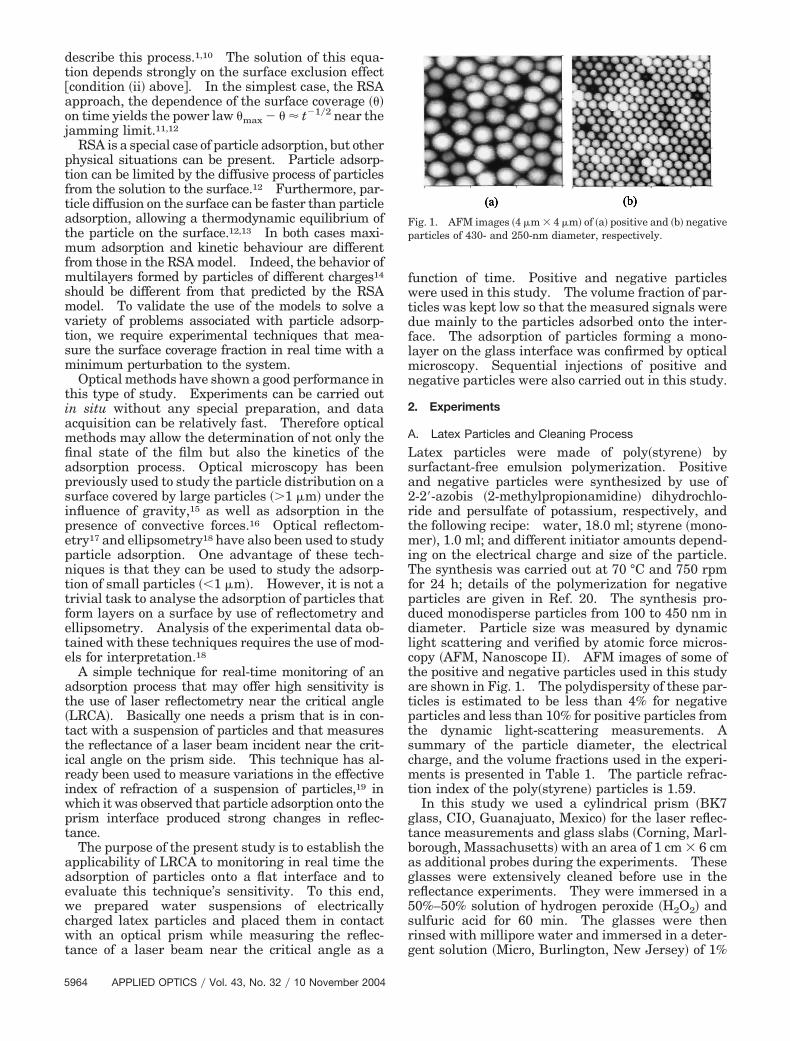
or 24 h; details of the polymerization for negativearticles are given in Ref. 20. The synthesis pro-uced monodisperse particles from 100 to 450 nm iniameter. Particle size was measured by dynamicight scattering and verified by atomic force micros-opy �AFM, Nanoscope II�. AFM images of some ofhe positive and negative particles used in this studyre shown in Fig. 1. The polydispersity of these par-icles is estimated to be less than 4% for negativearticles and less than 10% for positive particles fromhe dynamic light-scattering measurements. Aummary of the particle diameter, the electricalharge, and the volume fractions used in the experi-ents is presented in Table 1. The particle refrac-
ion index of the poly�styrene� particles is 1.59.In this study we used a cylindrical prism �BK7
lass, CIO, Guanajuato, Mexico� for the laser reflec-ance measurements and glass slabs �Corning, Marl-orough, Massachusetts� with an area of 1 cm � 6 cms additional probes during the experiments. Theselasses were extensively cleaned before use in theeflectance experiments. They were immersed in a0%–50% solution of hydrogen peroxide �H2O2� andulfuric acid for 60 min. The glasses were theninsed with millipore water and immersed in a deter-
ig. 1. AFM images �4 m � 4 m� of �a� positive and �b� negativearticles of 430- and 250-nm diameter, respectively.
ent solution �Micro, Burlington, New Jersey� of 1%
vrw
B
WcsTmpawipHbaopwtuarl�nsdepabssta6sasfm
fi
twlfrapoTbmBoatsdwsrtwp
pasowoTesbpett
C
Psc
FPic
olume at 80 °C for 20 min. Finally they wereinsed many times with millipore water. Glassesere used immediately after this cleaning process.
. LRCA Technique
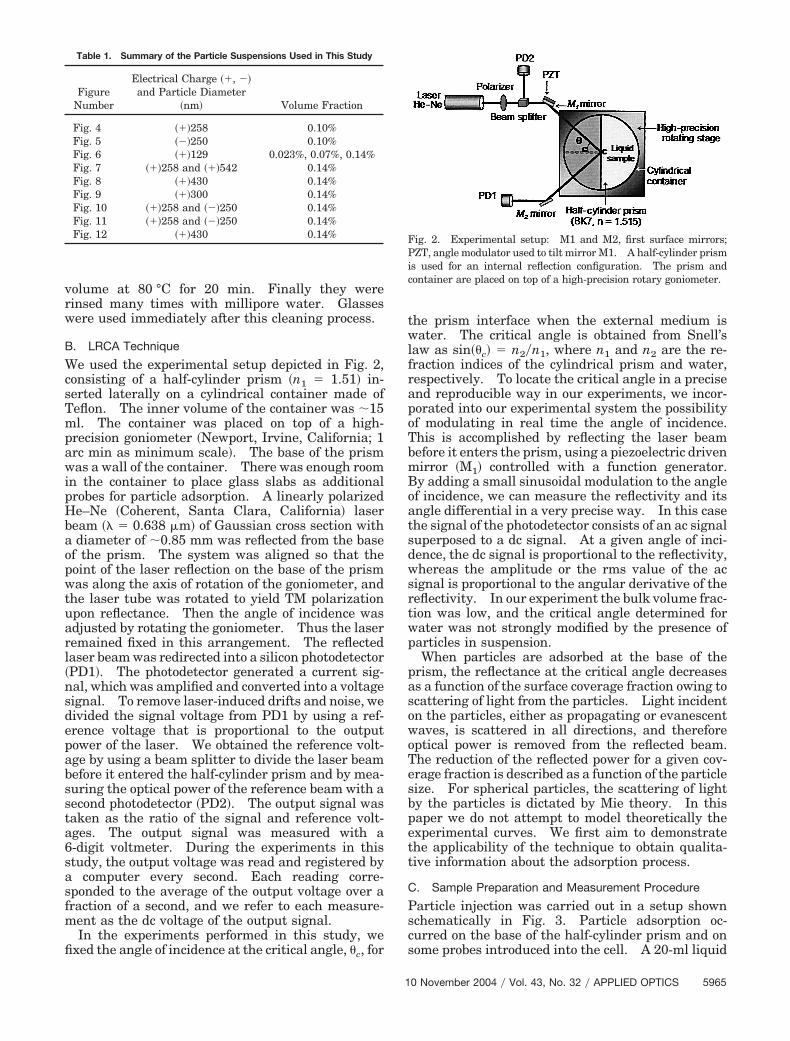
e used the experimental setup depicted in Fig. 2,onsisting of a half-cylinder prism �n1 1.51� in-erted laterally on a cylindrical container made ofeflon. The inner volume of the container was �15l. The container was placed on top of a high-
recision goniometer �Newport, Irvine, California; 1rc min as minimum scale�. The base of the prismas a wall of the container. There was enough room
n the container to place glass slabs as additionalrobes for particle adsorption. A linearly polarizede–Ne �Coherent, Santa Clara, California� laseream �� 0.638 m� of Gaussian cross section withdiameter of �0.85 mm was reflected from the base
f the prism. The system was aligned so that theoint of the laser reflection on the base of the prismas along the axis of rotation of the goniometer, and
he laser tube was rotated to yield TM polarizationpon reflectance. Then the angle of incidence wasdjusted by rotating the goniometer. Thus the laseremained fixed in this arrangement. The reflectedaser beam was redirected into a silicon photodetectorPD1�. The photodetector generated a current sig-al, which was amplified and converted into a voltageignal. To remove laser-induced drifts and noise, weivided the signal voltage from PD1 by using a ref-rence voltage that is proportional to the outputower of the laser. We obtained the reference volt-ge by using a beam splitter to divide the laser beamefore it entered the half-cylinder prism and by mea-uring the optical power of the reference beam with aecond photodetector �PD2�. The output signal wasaken as the ratio of the signal and reference volt-ges. The output signal was measured with a-digit voltmeter. During the experiments in thistudy, the output voltage was read and registered by
computer every second. Each reading corre-ponded to the average of the output voltage over araction of a second, and we refer to each measure-ent as the dc voltage of the output signal.In the experiments performed in this study, we
Table 1. Summary of the Particle Suspensions Used in This Study
xed the angle of incidence at the critical angle, �c, for s
1
he prism interface when the external medium isater. The critical angle is obtained from Snell’s
aw as sin��c� n2�n1, where n1 and n2 are the re-raction indices of the cylindrical prism and water,espectively. To locate the critical angle in a precisend reproducible way in our experiments, we incor-orated into our experimental system the possibilityf modulating in real time the angle of incidence.his is accomplished by reflecting the laser beamefore it enters the prism, using a piezoelectric drivenirror �M1� controlled with a function generator.y adding a small sinusoidal modulation to the anglef incidence, we can measure the reflectivity and itsngle differential in a very precise way. In this casehe signal of the photodetector consists of an ac signaluperposed to a dc signal. At a given angle of inci-ence, the dc signal is proportional to the reflectivity,hereas the amplitude or the rms value of the ac
ignal is proportional to the angular derivative of theeflectivity. In our experiment the bulk volume frac-ion was low, and the critical angle determined forater was not strongly modified by the presence ofarticles in suspension.When particles are adsorbed at the base of the
rism, the reflectance at the critical angle decreasess a function of the surface coverage fraction owing tocattering of light from the particles. Light incidentn the particles, either as propagating or evanescentaves, is scattered in all directions, and thereforeptical power is removed from the reflected beam.he reduction of the reflected power for a given cov-rage fraction is described as a function of the particleize. For spherical particles, the scattering of lighty the particles is dictated by Mie theory. In thisaper we do not attempt to model theoretically thexperimental curves. We first aim to demonstratehe applicability of the technique to obtain qualita-ive information about the adsorption process.
. Sample Preparation and Measurement Procedure
article injection was carried out in a setup shownchematically in Fig. 3. Particle adsorption oc-urred on the base of the half-cylinder prism and on
ig. 2. Experimental setup: M1 and M2, first surface mirrors;ZT, angle modulator used to tilt mirror M1. A half-cylinder prism
s used for an internal reflection configuration. The prism andontainer are placed on top of a high-precision rotary goniometer.
ome probes introduced into the cell. A 20-ml liquid
ample was injected into the container, and the sus-ension flowed by gravitational force into the cylin-rical container. The level of the liquid sample inhe cylindrical container was controlled by the level ofhe hose used to drain the cell. The angle of inci-ence was fixed at the critical angle. This angle wasetermined by modulation of the angle of incidencend by location of the angular position for which thec signal in the photodetector is maximum. Oncehe angle of incidence was fixed, the modulator wasurned off. Then, the particles in suspension werenjected by adding the particle suspension to con-ainer A and by draining the water from the cylindri-al container. The reflectance was recorded a fewinutes before particle injection to monitor the entire
dsorption process. For sequential injection of pos-tive and negative particles, positive particles wereisplaced with water and negative particles were in-ected. This process was repeated with the positivend negative particles in alternate roles. All thexperiments were carried out at room temperature.
. Optical Microscopy Images
uring the experiments the glass probes were re-oved from the container at different times along the
article adsorption process. These probes served tonspect the state of the particle adsorption at the cor-esponding times by optical microscopy. We used annverted microscope �Olympus, Model IX71�, theifferential-interference-contrast–Nomasky tech-ique, and an aprochromatic objective of 100:1 magni-cation to improve the contrast. Images wereigitalized with a CCD camera �Hitachi, KP-161� andent to a computer for analysis. Surface coverage wasetermined by use of software in the public domain.21
. Results and Discussion
. Particle Adsorption
dsorption of positive and negative particles on bare
ig. 3. Schematic representation of the injection system and theomemade flux cell.
lass surface was studied through independent ex- b
eriments, the results of which are reported in Figs.and 5. In these experiments the reflectance signal
dc voltage� for an angle of incidence near the criticalngle was monitored as a function of time. We ob-erved different signal behaviors, depending on theharge of the latex particles. The results shown inig. 4 correspond to positive particles of 258-nm di-meter at a volume fraction of 0.1% denoted as �250m, 10%�. The first arrow indicates when the par-icles were injected. After injection the reflectanceignal started to decrease with time, implying thatarticle adsorption was in progress. Particle ad-orption is expected for the positive particles becausehe glass surface is negatively charged. A cleaningrocess, which consists of gently rubbing a soft piecef cotton on the base of the prism, resets the adsorp-ion process. Two cleaning processes, denoted by ar-ows, are shown in Fig. 4 at 734 and 1738 s. Afterleaning, the signal returned to its original value,ndicating a reversible process. A similar experi-
ent was conducted for slightly smaller negative par-icles at the same volume fraction �250 nm, 0.1%�,nd adsorption is not observed. The reflectance sig-al at the critical angle versus time is plotted in Fig.. The first arrow indicates when the particles werenjected; the second, when the cleaning process wasracticed. Between these two arrows, the dc signaloes not change, indicating that negative particles
ig. 4. Reflectance signal as a function of time for positive parti-les �diameter, 258 nm; volume fraction, 0.1%�. The first arrowndicates when the particles are injected. The second and thirdrrows indicate when the film of particles adsorbed onto the sur-ace is cleaned.
ig. 5. Reflectance signal as a function of time for negative par-icles �diameter, 250 nm; volume fraction, 0.1%�. The second ar-ow indicates when the surface is cleaned. The signal is constant
etween these two arrows, indicating that there was no adsorption.
atdt6
tsotbnePfiscscp0WFs0t
tf�ctssaa0prs
pisTats
p2flcpTstec3sppb
gottptFf2istsms
Fi0
Fif
re not adsorbed, as expected, and that negative par-icles are repelled by the negative glass surface. Thec signal remains stable and is modified only duringhe cleaning process conducted at approximately97 s.We can deduce from these experiments that elec-
rical forces drive particle adsorption on the glassurface. Positive particles are adsorbed efficientlynto the surface and produce a variation in the in-ensity of the light reflected. Negative particles cane localized near the surface, forming a structureear the surface22; however, particles do not get closenough to the surface to scatter light efficiently.article adsorption onto a bare glass surface is there-
ore referred to as adsorption of positive particles. Its interesting to observe the dependence of the ad-orption kinetics on the volume fraction of the parti-les in suspension and on their size. The effect of theuspension volume fraction can be seen from theurves shown in Fig. 6. We followed the adsorptionrocess at three different volume fractions, 0.023%,.07%, and 0.14% with particles of 129-nm diameter.e observe a clear difference between the curves.
or example, at the 0.14% volume fraction, the ad-orption stopped after 1400 s, whereas, for the.023% volume fraction, it takes 10 times longer forhe adsorption process to stop, which is at �14,000 s.
Although we do not expect a linear relation be-ween the change in the reflected signal and the sur-ace coverage fraction, we can define adsorption time�� as the time it takes the reflected intensity to de-rease to e�1 37% of its initial value. At this time,he light intensity has decreased appreciably and theignal is close to the plateau, where maximum ad-orption occurs and an equilibrium is reached. Thedsorption times obtained from the curves in Fig. 6re 561, 1660, and 7257 s for volume fractions of.14%, 0.07%, and 0.023%, respectively. This de-endence is easily confirmed because the curveseach the same plateau independently of the suspen-
ig. 6. Reflectance curves showing the adsorption kinetics of pos-tive particles for different volume fractions �0.023%, 0.07%, and.14%�. Particle diameter, 129 nm.
ion volume fraction. This constant plateau also im- f
1
lies that the final reflectance near the critical angles basically independent of the volume fraction of theuspended particles used in our experiments.herefore the change in reflectance caused by thedsorbed particles on the surface is more importanthan the change in reflectance that is due to particlesuspended in water.Figure 7 shows the effect of the particle size on the
article adsorption process for particle diameters of48 and 542 nm at 0.14% volume fraction. The ef-ect of the particle size on the adsorption process isess evident in these experiments because reflectanceurves depend on the particle size and because thelateau has a different value for each particle size.his difference could be due to the final surface den-ity of adsorbed particles, but it could also be due tohe difference in light scattered by particles of differ-nt sizes. The latter effect is probably the case, be-ause � for the two particles is comparable �233 and37 s for particles of 129- and 271-nm diameter, re-pectively� and because the plateau decreases witharticle size. Therefore the adsorption kinetics de-end much less strongly on particle size than on theulk volume density of the particles.We designed a simple experiment to obtain pro-
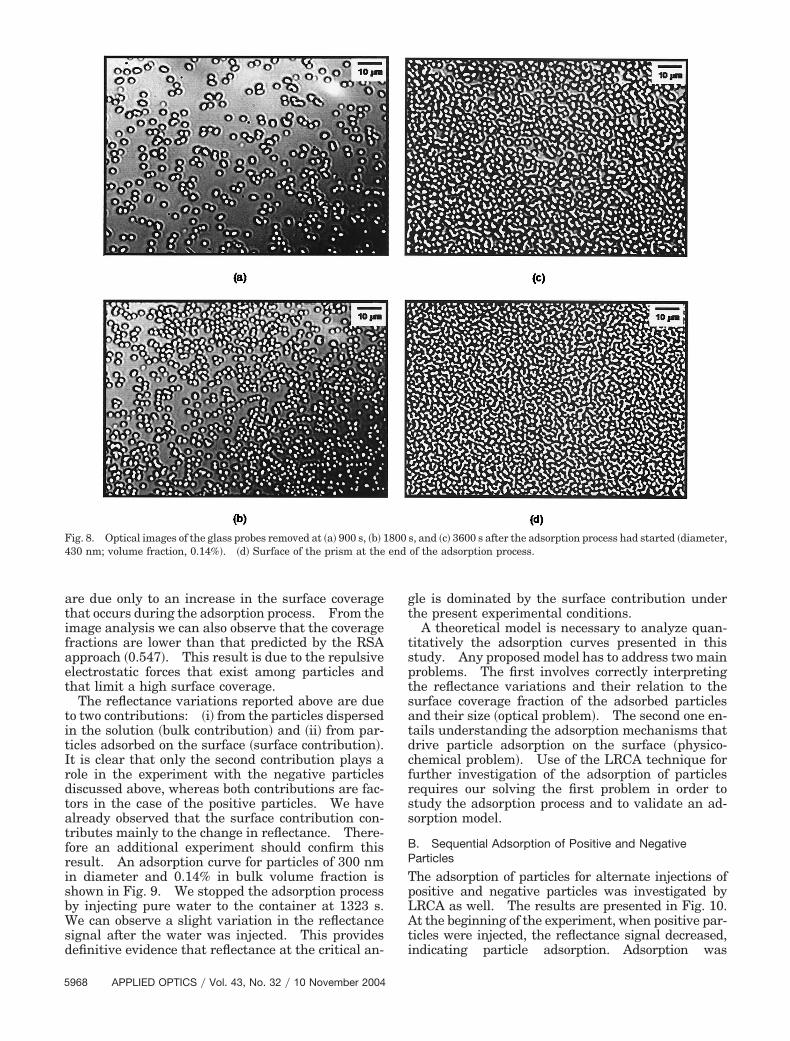
ressive images of the adsorption process. Particlesf 300 nm at a volume fraction of 0.14% were moni-ored, and three probes were removed at differentimes during the process. The images of theserobes are shown in Fig. 8, in which we can observehe adsorbed particles at 900, 1800, and 3600 s inigs. 8�a�, 8�b�, and 8�c�, respectively. The coverage
ractions for these images are determined to be 9%,2%, and 37%, respectively. An image of the prisms also shown in Fig. 8�d�. We can observe that theurface coverage is greater �47%� in the image andhat the structure of particles is similar to that ob-erved in the probes. These images allow us toake an important observation: Particles are ad-
orbed in the form of a monolayer on the glass sur-
ig. 7. Reflectance curves showing the adsorption kinetics of pos-tive particles of different diameters �258 and 542 nm�. Volumeraction, 0.14%.
ace. This indicates that changes in the reflectance
re due only to an increase in the surface coveragehat occurs during the adsorption process. From themage analysis we can also observe that the coverageractions are lower than that predicted by the RSApproach �0.547�. This result is due to the repulsivelectrostatic forces that exist among particles andhat limit a high surface coverage.
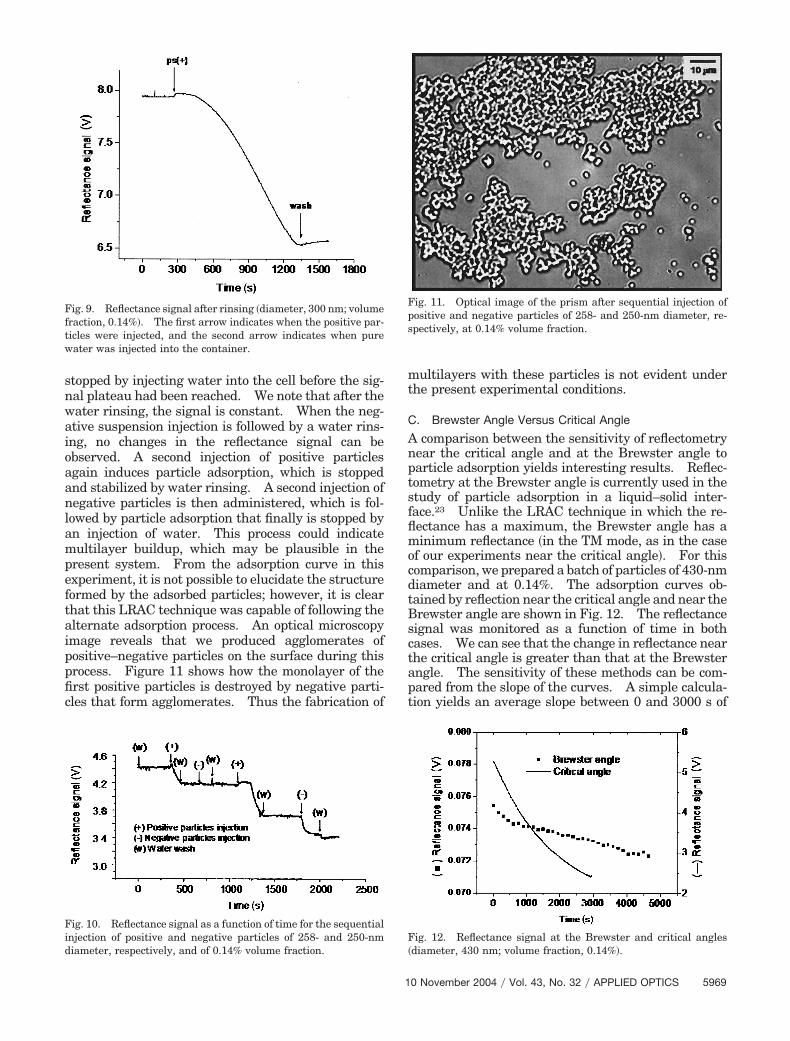
The reflectance variations reported above are dueo two contributions: �i� from the particles dispersedn the solution �bulk contribution� and �ii� from par-icles adsorbed on the surface �surface contribution�.t is clear that only the second contribution plays aole in the experiment with the negative particlesiscussed above, whereas both contributions are fac-ors in the case of the positive particles. We havelready observed that the surface contribution con-ributes mainly to the change in reflectance. There-ore an additional experiment should confirm thisesult. An adsorption curve for particles of 300 nmn diameter and 0.14% in bulk volume fraction ishown in Fig. 9. We stopped the adsorption processy injecting pure water to the container at 1323 s.e can observe a slight variation in the reflectance
ignal after the water was injected. This provides
ig. 8. Optical images of the glass probes removed at �a� 900 s, �b� 130 nm; volume fraction, 0.14%�. �d� Surface of the prism at the
efinitive evidence that reflectance at the critical an- i
le is dominated by the surface contribution underhe present experimental conditions.
A theoretical model is necessary to analyze quan-itatively the adsorption curves presented in thistudy. Any proposed model has to address two mainroblems. The first involves correctly interpretinghe reflectance variations and their relation to theurface coverage fraction of the adsorbed particlesnd their size �optical problem�. The second one en-ails understanding the adsorption mechanisms thatrive particle adsorption on the surface �physico-hemical problem�. Use of the LRCA technique forurther investigation of the adsorption of particlesequires our solving the first problem in order totudy the adsorption process and to validate an ad-orption model.
. Sequential Adsorption of Positive and Negativearticles
he adsorption of particles for alternate injections ofositive and negative particles was investigated byRCA as well. The results are presented in Fig. 10.t the beginning of the experiment, when positive par-
icles were injected, the reflectance signal decreased,
s, and �c� 3600 s after the adsorption process had started �diameter,of the adsorption process.
800
ndicating particle adsorption. Adsorption was
snwaioaanlampeftaippfic
mt
C
AnptsfflmocdtBsctap
Fftwater was injected into the container.
Fid
Fpspectively, at 0.14% volume fraction.
topped by injecting water into the cell before the sig-al plateau had been reached. We note that after theater rinsing, the signal is constant. When the neg-tive suspension injection is followed by a water rins-ng, no changes in the reflectance signal can bebserved. A second injection of positive particlesgain induces particle adsorption, which is stoppednd stabilized by water rinsing. A second injection ofegative particles is then administered, which is fol-
owed by particle adsorption that finally is stopped byn injection of water. This process could indicateultilayer buildup, which may be plausible in the
resent system. From the adsorption curve in thisxperiment, it is not possible to elucidate the structureormed by the adsorbed particles; however, it is clearhat this LRAC technique was capable of following thelternate adsorption process. An optical microscopymage reveals that we produced agglomerates ofositive–negative particles on the surface during thisrocess. Figure 11 shows how the monolayer of therst positive particles is destroyed by negative parti-
les that form agglomerates. Thus the fabrication of t
iameter, respectively, and of 0.14% volume fraction.F�
1
ultilayers with these particles is not evident underhe present experimental conditions.
. Brewster Angle Versus Critical Angle
comparison between the sensitivity of reflectometryear the critical angle and at the Brewster angle toarticle adsorption yields interesting results. Reflec-ometry at the Brewster angle is currently used in thetudy of particle adsorption in a liquid–solid inter-ace.23 Unlike the LRAC technique in which the re-ectance has a maximum, the Brewster angle has ainimum reflectance �in the TM mode, as in the case
f our experiments near the critical angle�. For thisomparison, we prepared a batch of particles of 430-nmiameter and at 0.14%. The adsorption curves ob-ained by reflection near the critical angle and near therewster angle are shown in Fig. 12. The reflectanceignal was monitored as a function of time in bothases. We can see that the change in reflectance nearhe critical angle is greater than that at the Brewsterngle. The sensitivity of these methods can be com-ared from the slope of the curves. A simple calcula-
ig. 9. Reflectance signal after rinsing �diameter, 300 nm; volumeraction, 0.14%�. The first arrow indicates when the positive par-icles were injected, and the second arrow indicates when pure
ion yields an average slope between 0 and 3000 s of
ig. 10. Reflectance signal as a function of time for the sequentialnjection of positive and negative particles of 258- and 250-nm
ig. 11. Optical image of the prism after sequential injection ofositive and negative particles of 258- and 250-nm diameter, re-
ig. 12. Reflectance signal at the Brewster and critical angles
.63 � 10�4 V�s near the critical angle and 2.6 � 10�7
�s for the Brewster angle. The slope for RLCA ispproximately 3000 times greater than that for therewster angle. This is an important difference inensitivity. The rms value of the noise in both curves,stimated from the raw data, was found to be approx-mately the same. Therefore the increase in sensitiv-ty implies an improvement in resolution under theame experimental conditions.
. Conclusions
he present study shows that LRCA may be a power-ul tool in the study of particle adsorption. LRCA wasroposed as a simple, high-sensitivity technique forhe study of particle adsorption onto a flat surface. Inhis study we used electrically charged polyestyreneatex particles. Experimental results showed thatorces of electrical origin drive particle adsorption.ositive particles are adsorbed onto a negative glassurface, whereas negative particles are not adsorbednto this surface. A sequential adsorption experi-ent that used positive and negative particles was
lso investigated. With the help of optical micros-opy, we found that adsorbed positive particles formedonolayers on the glass surface and that the maxi-um surface coverage is less than 47%. However, for
equential adsorption, the monolayer formed for posi-ive particles is destroyed by the negative particleshat form agglomerates on the glass surface. Weave estimated the adsorption time of positive parti-les with diameters in the range of a few hundredanometers at low concentrations �volume fractionsrom 0.023% to 0.14%� to be of the order of minutes.
e found experimentally that the change in reflec-ance near the critical angle is dominated by scatteringrom particles adsorbed onto the surface rather thanrom particles suspended in the solution and thatRCA is considerably more sensitive than reflectom-try at the Brewster angle under the same experimen-al conditions. We expect that our experimentalesults will lead to the development of theoretical mod-ls for analyzing LRCA curves.
We acknowledge financial support from Biomolec-lar Material Project of Consejo Nacional de Cienca yecnologıa �Mexico� �Er026� Fondo de apoyo a la in-estigacion de la Universidad Autonoma de San Luisotosı �C03-FAI-11-19.54� and cooperation projectniversidad Nacional Autonoma de Mexico–niversidad Autonoma de San Luis Potosı �UNAM–ASLP� �2003�. M.-C. Pena-Gomar is research
ellow of PROMEP �063-2003�. We appreciate thessistance of F. Arteaga-Larios of the Instituto deısica de la Universidad Autonoma de San Luis Po-
osı �IFUASLP� and J.-L. Menchaca �IFUASLP� withhe particle synthesis and the atomic force micro-cope pictures, respectively. We thank Dr. J.-L.rauz-Lara �IFUASLP� for use of the optical micros-
opy facilities. We also thank Asur Guadarrama-antana of the Centro de Ciencias Aplicadas yesarrollo Tecnologico �CCADET-UNAM� for techni-
eferences1. Z. Adamczyk, “Adsorption of particles: theory,” in Encyclope-
dia of Surface and Colloid Science, A. T. Hubbard, ed. �Aca-demic, San Diego, Calif., 2002�, pp. 499–516.
2. J. W. Evans, “Random and cooperative sequential adsorption,”Rev. Mod. Phys. 65, 1281–1329 �1993�.
3. B. Widon, “Random sequential addition of hard spheres to avolume,” J. Chem. Phys. 44, 3888–3894 �1996�.
4. L. Hinrichsen, J. Feder, and T. Jossang, “Geometry of randomsequential adsorption,” J. Stat. Phys. 44, 793–827 �1986�.
5. J. Feder and I. J. Giaver, “Adsorption of ferritin,” J. ColloidInterface Sci. 78, 144–154 �1980�.
6. Z. Adamczyk, B. Siwek, M. Zembala, and P. Belouschek, “Ki-netics of localized adsorption of colloid particles,” Adv. Colloid.Interface Sci. 48, 151–280 �1994�.
7. B. Vincent, C. A. Young, and Th. Tadros, “Adsorption of small,positive particles onto large negative particles in the presenceof polymer. Part 1—adsorption isotherms,” J. Chem. Soc.Faraday Trans. 1 76, 665–673 �1980�.
8. Z. Adamczyk and P. Weronsky, “Random sequential adsorp-tion of spheroidal particles: kinetics and jamming limit,”J. Chem. Phys. 105, 5562–5573 �1996�.
9. Z. Adamczyk and P. Weronski, “Role of electrostatic interac-tions in particle adsorption,” Adv. Colloid Interface Sci. 63,41–149 �1996�.
0. P. Schaaf and J. Talbot, “Surface exclusion effects in adsorp-tion processes,” J. Chem. Phys. 91, 4401–4409 �1989�.
1. R. H. Swendsen, “Dynamics of random sequential adsorption,”Phys. Rev. A 24, 504–508 �1981�.
2. P. Schaaf and J. Talbot, “Kinetics of random sequential ad-sorption,” Phys. Rev. Lett. 62, 175–177 �1989�.
3. P. Shaaf, A. Johner, and J. Talbot, “Asymptotic behavior ofparticles deposition,” Phys. Rev. Lett. 66, 1603–1605 �1991�.
4. M. R. Bohmer, “Effects of polymers on particle adsorption onmacroscopic surfaces studied by optical reflectometry,” J. Col-loid Interface Sci. 197, 251–256 �1998�.
5. P. Wojtaszczyk, P. Shaaf, B. Senger, M. Zembala, and J. C.Voegel, “Statistical properties of surface covered by largespheres,” J. Chem. Phys. 9, 7198–7208 �1993�.
6. Z. Adamczyk, P. Warszynski, L. Szyk-Warszynska, and P.Weronsky, “Role of convection in particle deposition at solidsurface,” Colloids Surf. A 165, 157–187 �2000�.
7. E. K. Mann, E. A. van der Zeeuw, J. M. Koper, P. Shaff, and D.Bedeaux, “Optical properties of surface covered with latex par-ticles: comparison with theory,” J. Phys. Chem. 99, 790–797�1995�.
8. R. Cornelis van Duijvenbode, “Nanoparticle adsorption: re-flections on ellipsometry,” Ph.D. dissertation �University ofLeiden, Leiden, The Netherlands, 2001�.
9. A. Garcıa-Valenzuela, M. Pena-Gomar, and C. Fajardo-Lira,“Measuring and sensing a complex refractive index by laserreflection near the critical angle,” Opt. Eng. 41, 1704–1716�2002�.
0. A. Kotara, K. Furusawa, and Y. Takeda, “Colloid chemicalstudies of polystyrene lattices polymerized without any sur-faceative agents,” Kolloid Z. Z. Polym. 239, 677–681 �1970�.
1. W. Rasband, Image J �version 1.30�, National Institutes ofHealth, Bethesda, Md., 2003; available at http://rsb.info.nih.gov/ij/.
2. F. Jimenez-Angeles and M. Lozada-Cassou, “A model macro-ions solution next to a charged wall: overcharging, chargereversal and charge inversion by macroions,” J. Phys. Chem B108, 7286–7296 �2004�.
3. G. H. Meeten, “Refractive index errors in the critical-angleand the Brewster-angle methods applied to absorbing andheterogeneous materials,” Meas. Sci. Technol. 8, 728–733