Monitoring ReportPrepared on 03/26/2019. Investment Data as of 12/31/2018.
Account Holdings as of 12/31/2018.
Prepared For:
Sample Client
Prepared By: M.D.C. Advisors Pittsburgh, 15276 United States
This report has been created by your financial consultant under a license agreement with Fi360, Inc. Your financial consultant and Fi360 are notaffiliated. This report is designed to provide performance data and other information regarding a portfolio of investments. Your financial consultant issolely responsible for any advice or recommendations provided. In some cases, this portfolio may be an investment option that is available (orproposed to be made available) in a defined contribution plan. To the extent that this report is used by the financial consultant with respect to anydefined contribution plan, any such use, advice, or recommendation is solely the responsibility of such financial consultant, including advice orrecommendations as to the suitability of any investment options for the defined contribution plan.
Please see important disclosures in the Statement of Additional Disclosures. Investors should consider the investment objectives, risks, charges,and expenses of a fund before investing. Prospectuses containing this and other information about the underlying funds included in a portfolio areavailable by contacting your financial consultant. Please read the prospectus carefully before investing to make sure that the fund is appropriate foryour goals and risk tolerance. Past performance is no guarantee of future results.
Monitoring ReportInvestment Data as of 12/31/2018. Account Holdings as of 12/31/2018.
STANDARDIZED PERFORMANCE DISCLOSURE
PAGE 2 OF 21
Standardized Returns for the quarter-ended 12/31/2018. Returns for periods of less than one year are not annualized. Standardized returnsassume reinvestment of dividends and capital gains. It depicts performance without adjusting for the effects of taxation, but are adjusted to reflectsales charges and ongoing fund expenses. If adjusted for taxation, the performance quoted would be significantly reduced. Any sales charge used inthe calculation was obtained from the fund’s most recent prospectus and/or shareholder report. If sales charges are waived (for example, for investorsin a qualified retirement plan), the performance numbers may be higher. Please contact your financial advisor for further information on whetherloads are waived on the investment options in your account.
Mutual funds and Exchange Traded Funds (ETFs) are sold by prospectus. Please consider the investment objectives, risks, charges and expensescarefully before investing. The prospectus, and, if available, the summary prospectus, which contains this and other information, can be obtainedby calling your financial advisor. Read the prospectus and, if available, the summary prospectus carefully before you invest. The performanceinformation shown represents past performance and is not a guarantee of future results. Investment returns and principal value of an investment willfluctuate so that when shares are redeemed, they may be worth more or less than their original cost. Current performance may be higher or lowerthan the data shown. For the most recent month-end performance, visit www.fi360.com/directory.
For ETFs, the market price used to calculate the Market Value (MKT) return is the midpoint between the highest bid and the lowest offer on theexchange on which the shares of the Fund are listed for trading, as of the time the Fund’s NAV is calculated. If you trade your shares at another time,your return may differ.
Investment and insurance products: NOT FDIC-INSURED/ NO Bank Guarantee/ MAY Lose Value
Monitoring ReportInvestment Data as of 12/31/2018. Account Holdings as of 12/31/2018.
Fi360 FIDUCIARY SCORE® SUMMARY
PAGE 5 OF 21
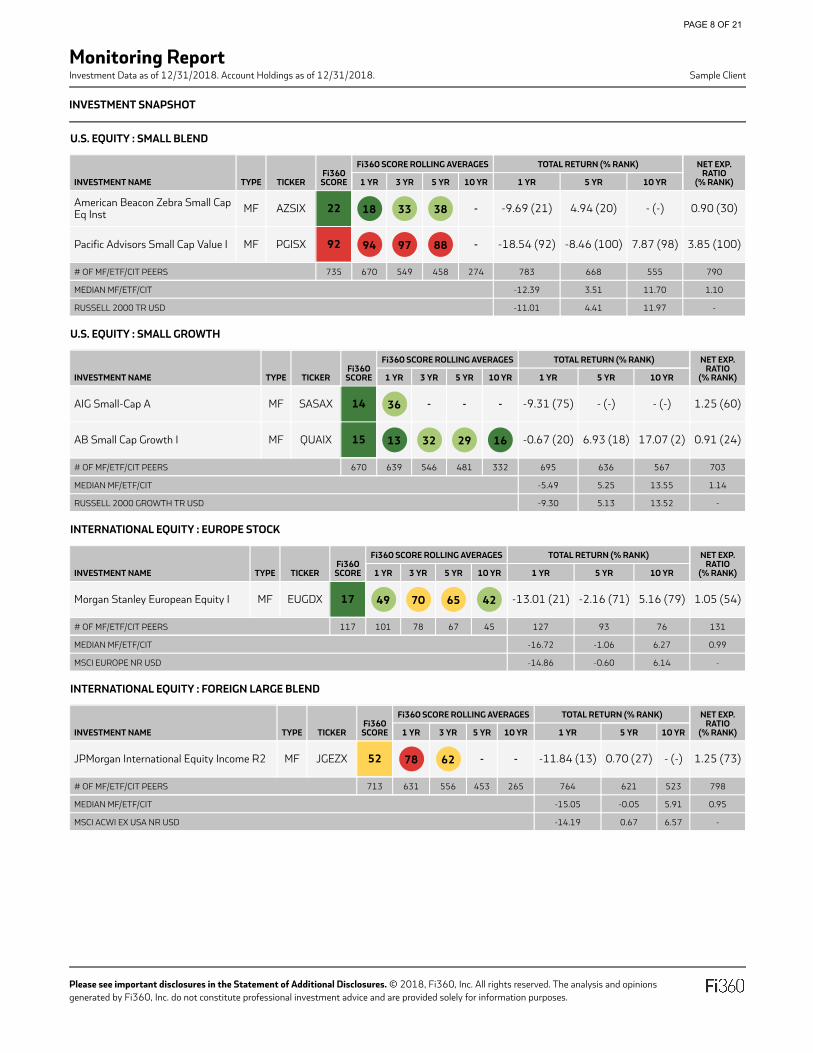
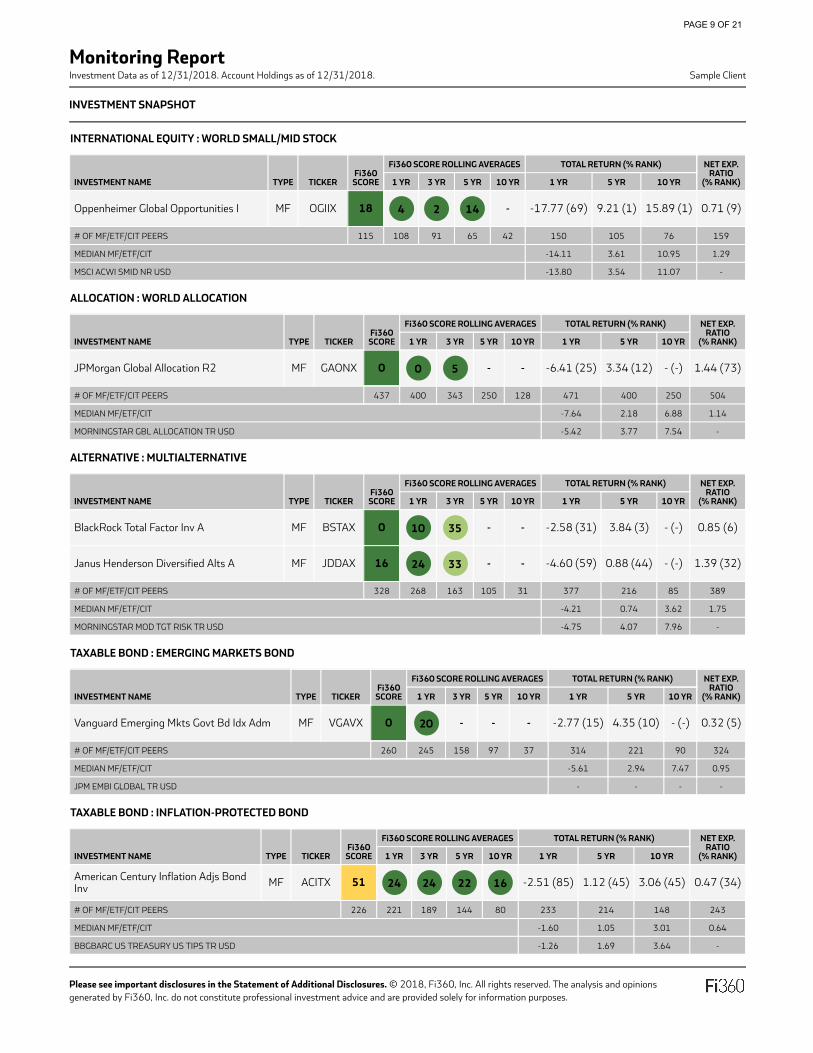
The Fi360 Fiduciary Score® is a peer percentile ranking of an investment against a set of quantitative due diligence criteria selected to reflectprudent fiduciary management. The Fi360 Fiduciary Score® Average is a one-, three-, five-, or ten-year rolling average of an investment’s Fi360Fiduciary Score®. All Scores are color coded based on the quartile they fall in (1st - Green; 2nd - Light Green; 3rd - Yellow; 4th - Red).
The ID column can be used to reference the investment on the following Scatterplot chart. Investments which do not have both Scores will not havean ID as they cannot be plotted on the chart. If multiple investments have the same Scores, they will be plotted together under 1 ID.
ID INVESTMENT NAME TICKER TYPE PEER GROUPSCORE (PEERS)
3YR ROLLING AVG (PEERS) $ ASSETS % OF TOTAL ASSETS
PPM Large Cap ValueInstitutional PZLIX MF Large Value - - 64,641 4.50
4 BlackRock Total Factor Inv A BSTAX MF Multialternative 0 (328)
35 (163) 46,750 3.25
1 Invesco QQQ Trust QQQ ETF Large Growth 0 (1371)
2 (1208) 40,047 2.79
2 JPMorgan Global Allocation R2 GAONX MF World Allocation 0 (437)
5 (343) 282,706 19.68
3 Vanguard 500 Index Investor VFINX MF Large Blend 0 (1316)
Monitoring ReportInvestment Data as of 12/31/2018. Account Holdings as of 12/31/2018.
Fi360 FIDUCIARY SCORE® SUMMARY
PAGE 6 OF 21
The chart plots each investment using the selected Fi360 Fiduciary Scores. Investments without both Scores will be excluded from the chart. Green,yellow and red lines are drawn to highlight the different Fi360 Fiduciary Score quartiles. Investments in the bottom left corner of the chart are mostpreferred.
If $ asset amounts are included, bubble sizes are based on the relative percentage invested in that investment. Bubble numbers refer to the ID’s onthe previous page(s). If multiple investments have the same Scores, they will be plotted together under 1 ID.
Monitoring ReportInvestment Data as of 12/31/2018. Account Holdings as of 12/31/2018.
INVESTMENT SNAPSHOT
PAGE 7 OF 21
The Fi360 Fiduciary Score® is a peer percentile ranking of an investment against a set of quantitative due diligence criteria selected to reflectprudent fiduciary management. The Fi360 Fiduciary Score® Average is a one-, three-, five-, or ten-year rolling average of an investment’s Fi360Fiduciary Score®. All Scores are color coded based on the quartile they fall in (1st - Green; 2nd - Light Green; 3rd - Yellow; 4th - Red).Mutual funds and Exchange Traded Funds (ETFs) are sold by prospectus. Please consider the investment objectives, risks, charges and expensescarefully before investing. The prospectus, and, if available, the summary prospectus, which contains this and other information, can be obtainedby calling your financial advisor. Read the prospectus and, if available, the summary prospectus carefully before you invest. The performanceinformation shown represents past performance and is not a guarantee of future results. Investment returns and principal value of an investment willfluctuate so that when shares are redeemed, they may be worth more or less than their original cost. Current performance may be higher or lowerthan the data shown. For the most recent month-end performance, visit www.fi360.com/directory.
Investment and insurance products: NOT FDIC-INSURED/ NO Bank Guarantee/ MAY Lose Value
U.S. EQUITY : LARGE BLEND
INVESTMENT NAME TYPE TICKERFi360
SCORE
Fi360 SCORE ROLLING AVERAGES TOTAL RETURN (% RANK) NET EXP. RATIO
Monitoring ReportInvestment Data as of 12/31/2018. Account Holdings as of 12/31/2018.
Fi360 FIDUCIARY SCORE® BREAKDOWN
PAGE 10 OF 21
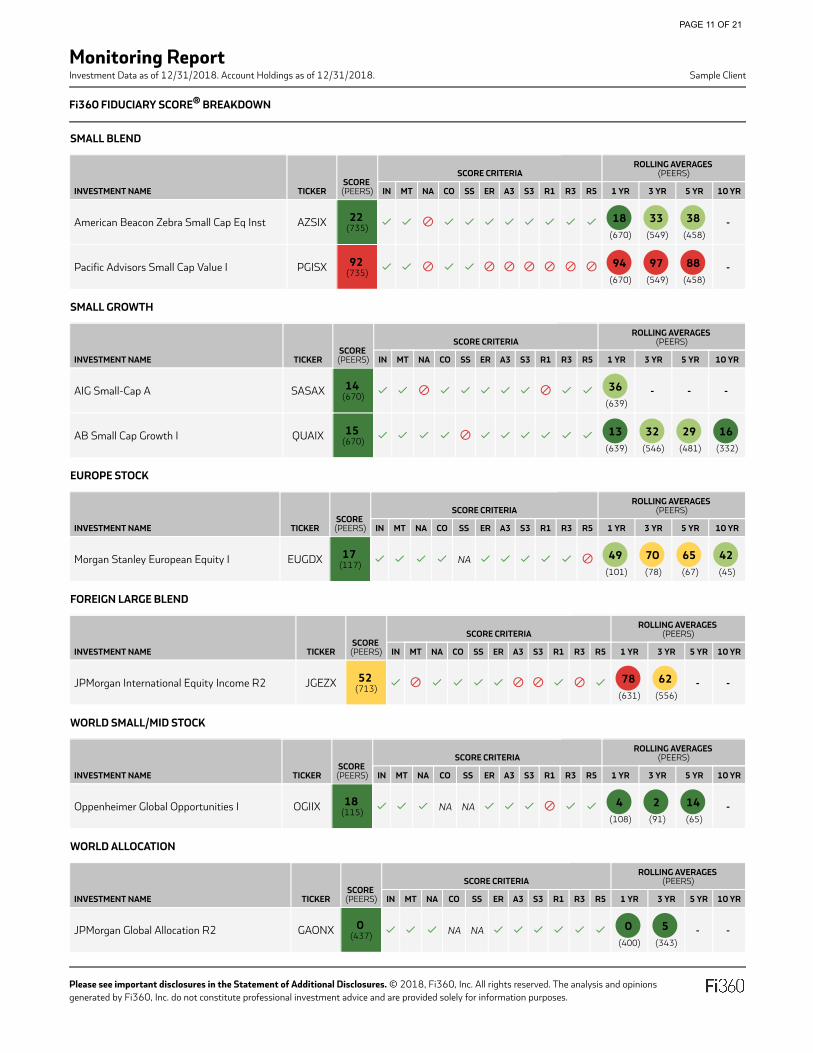
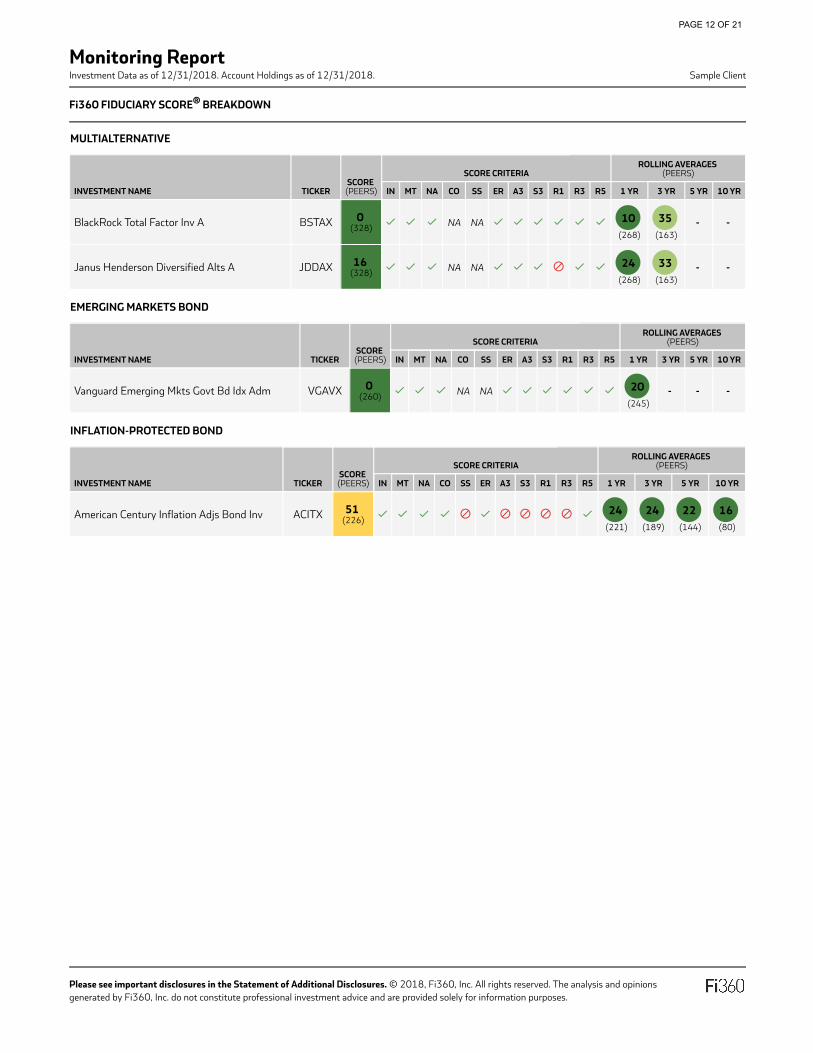
The Fi360 Fiduciary Score® is a peer percentile ranking of an investment against a set of quantitative due diligence criteria selected to reflectprudent fiduciary management. The Fi360 Fiduciary Score® Average is a one-, three-, five-, or ten-year rolling average of an investment’s Fi360Fiduciary Score®. All Scores are color coded based on the quartile they fall in (1st - Green; 2nd - Light Green; 3rd - Yellow; 4th - Red).
* For separately managed accounts, r-squared in the top 75% of it’s peer group is used as a replacement criterion for Exp Ratio.
LARGE BLEND
INVESTMENT NAME TICKERSCORE (PEERS)
SCORE CRITERIAROLLING AVERAGES
(PEERS)
IN MT NA CO SS ER A3 S3 R1 R3 R5 1 YR 3 YR 5 YR 10 YR
Vanguard 500 Index Investor VFINX 0 (1,316) 6
(1,239)
17
(1,108)
10
(969)
9
(671)
LARGE GROWTH
INVESTMENT NAME TICKERSCORE (PEERS)
SCORE CRITERIAROLLING AVERAGES
(PEERS)
IN MT NA CO SS ER A3 S3 R1 R3 R5 1 YR 3 YR 5 YR 10 YR
Invesco QQQ Trust QQQ 0 (1,371) 0
(1,313)
2
(1,208)
1
(1,010)
2
(666)
LARGE VALUE
INVESTMENT NAME TICKERSCORE (PEERS)
SCORE CRITERIAROLLING AVERAGES
(PEERS)
IN MT NA CO SS ER A3 S3 R1 R3 R5 1 YR 3 YR 5 YR 10 YR
IN. Inception Date. Must have at least a 3 year track historyMT. Manager Tenure. Must have at least a 2 year track history. (Most senior manager's tenure)NA. Net Assets. Must have >= 75 million under management. (Total across all share classes)CO. Composition. Must have >= 80% allocation to primary asset (Not applied to all peer groups)SS. Style. Must have current style box match the peer group. (Not applied to all peer groups)ER. Prospectus Net Exp Ratio. * Must place in the top 75% of its peer group.A3. Alpha - Broad Market (3 YR). Must place in the top 50% of its peer group.S3. Sharpe (3 YR). Must place in the top 50% of its peer group.R1. Return (1 YR). Must place in the top 50% of its peer group.R3. Return (3 YR). Must place in the top 50% of its peer group.R5. Return (5 YR). Must place in the top 50% of its peer group.
Summary Legend
Investment meets the criterion
Investment does not meet the criterion
- Investment data is not available
NA Investment is not screened on thecriterion
NS Investment doesn't have the history to bescored
Mutual funds and Exchange Traded Funds (ETFs) are sold by prospectus. Please consider the investment objectives, risks, charges and expensescarefully before investing. The prospectus and, if available, the summary prospectus, which contains this and other information, can be obtainedby calling your financial advisor. Read the prospectus and, if available, the summary prospectus carefully before you invest.
Investing in mutual funds involves risk. The principal value and investment return will fluctuate so that your shares, when redeemed, may beworth more or less than the original cost. All investing involves risk, including the possible loss of principal.
This Statement of Additional Disclosures includes important information regarding the information provided in the report. If an investor does notunderstand any term or data presented herein, he/she should consult with his/her financial advisor.
FI360 FIDUCIARY SCORE®
Fi360 Fiduciary Score®. The Score is a peer percentile ranking of an investment against a set of quantitative due diligence criteria selected to reflectprudent fiduciary management. The Rolling Averages are a one-, three-, five- or ten-year equal-weighted average of an investment’s Fi360 FiduciaryScores during that corresponding time period. The Historical Fi360 Fiduciary Scores at Quarter End trend chart (if included) displays the Fi360Fiduciary Score for each calendar quarter-end during that year.
If an investment does not meet an individual due diligence criterion, points are tallied. Investments that satisfy all of the due diligence criteria receivean Fi360 Fiduciary Score of 0. Every other investment is given a Score of 1-100 based on their point total, and representing their percentile rankingwithin their peer group. The Fi360 Fiduciary Score represents a suggested course of action and is not intended, nor should it be used, as the solesource of information for reaching an investment decision. Visit www.fi360.com/fi360-Fiduciary-Score for the complete methodology document.
Criteria. The following criteria are included as part of the Score calculation.
Weighted Fi360 Fiduciary Score. The Weighted Score is calculated by taking the Fi360 Fiduciary Score for each holding within the model (as shownin the Holdings table on the Factsheet) and weighting it by its respective target allocation. This is then summed to represent the Weighted Scoreacross the model’s holdings. If a holding does not have a Score, it is excluded from the calculation.
Monitoring ReportInvestment Data as of 12/31/2018. Account Holdings as of 12/31/2018.
STATEMENT OF ADDITIONAL DISCLOSURES
PAGE 14 OF 21
Total Return (No Load). Expressed in percentage terms, an investment’s total return is determined each month by taking the change in monthly netasset value, reinvesting all income and capital gains distributions during that month, and dividing by the starting NAV. Reinvestments are madeusing the actual reinvestment NAV, and daily payoffs are reinvested monthly. Total Return (No Load) is not adjusted for sales charges (such as front-end loads, deferred loads and redemption fees), but do reflect management, administrative, 12b-1 fees and other costs taken out of fund assets.Total returns for periods longer than one year are expressed in terms of compounded average annual returns (also known as geometric total returns).
Total Return (With Load). Expressed in percentage terms, an investment’s total return is determined each month by taking the change in monthlynet asset value, reinvesting all income and capital gains distributions during that month, and dividing by the starting NAV. Reinvestments are madeusing the actual reinvestment NAV, and daily payoffs are reinvested monthly. Total Return (With Load) is adjusted for front-end loads, deferred loadsand redemption fees, but not taxes. For funds with front-end loads, the full amount of the load is deducted. For deferred loads and redemption fees,the percentage charged often declines the longer the shares are held. Total returns for periods longer than one year are expressed in terms ofcompounded average annual returns (also known as geometric total returns).
Percentile Rank. The relative ranking of an investment within its peer group on a scale of 1-100 (1 being the best) for the data point and timeperiod being measured. Rankings are calculated against the corresponding Peer Group and Number of Peers as explained in the following paragraph.Performance ranks do not account for an investment’s sales charge (if applicable). Ranks will not be provided for periods less than one year.
Number of Peers. The number of investments in the same peer group which were used to calculate any percentile rank or Fi360 Fiduciary Score.Only investments which had the given data point being ranked are included in this number, so the number of peers can change for the sameinvestment by data point being ranked. For Mutual funds (MF) and Exchange Traded Funds (ETF), we combine both sets of investments together toform one peer group for ranking purposes. For Collective Investment Trusts (CIT), since many do not report timely, we utilize the pre-defined MF/ETFpeer group and calculate the ranks as an overlay on that peer group. For Group Retirement Plan Annuities (GRPA), we combine this universe with allmutual funds and ETFs to form one peer group for ranking purposes. For Separately managed accounts (SMA) and Variable annuity sub accounts(VA), we use their respective universe of investments only.
Benchmarks. A benchmark gives an investor a point of reference for evaluating a fund’s performance by comparing benchmark returns to the fund’sreturns. This report may utilize one or many of these benchmarks:
Broad Index. The index used in the calculation of metrics such as Alpha, Beta, and R-Squared. The Broad Index provides a common comparison pointfor funds with similar investing styles across different peer groups.
Peer Group Index. The index assigned to the fund’s peer group, which is a group of funds with similar investment style. Each peer group has its ownindex which can be used as a common comparison point between funds.
Best-fit Index. The market index that shows the highest correlation with a fund over the most-recent 36 months, as measured by the highest R-Squared. In addition, the Best-fit Index can be used to compare the betas and alphas of similar funds that show the same Best-fit Index. The Best-fitIndex may not be the fund’s benchmark, nor does it necessarily contain the types of securities that may be held by the fund.
Indices are unmanaged and cannot be invested in directly. Please reference the Index Descriptions section for more specific detail on each index thatis included in this report.
VOLATILITY METRICS
Sharpe Ratio. A risk-adjusted measure developed by Nobel Laureate William Sharpe. The higher the Sharpe ratio, the better the investment’shistorical risk-adjusted performance. The Sharpe ratio is calculated for the past three or five-year period by dividing the investment’s annualizedexcess return by the standard deviation of an investment’s annualized excess return. Since this ratio uses standard deviation as its risk measure, it ismost appropriately applied when analyzing an investment that is an investor’s sole holding. The Sharpe ratio can be used to compare two fundsdirectly on how much risk an investment had to bear to earn excess return over the risk-free rate.
MPT STATISTICS
Alpha. A measure of the difference between an investment’s actual returns and its expected performance, given its level of risk as measured by beta.Alpha is often seen as a measure of the value added or subtracted by a manager. A positive alpha figure indicates the investment has performed
Monitoring ReportInvestment Data as of 12/31/2018. Account Holdings as of 12/31/2018.
STATEMENT OF ADDITIONAL DISCLOSURES
PAGE 15 OF 21
better than its beta (or expected return) would predict. In contrast, a negative alpha indicates the investment underperformed, given the expectationsestablished by the investment’s beta.
EXPENSES
Prospectus Net Expense Ratio. This value is from the investment’s most recent prospectus. The percentage of investment assets used to pay foroperating expenses and management fees, including 12b-1 fees, administrative fees, and all other asset-based costs incurred by the fund, exceptbrokerage costs. Fund expenses are reflected in the fund’s Net Asset Value. Sales charges are not included in the expense ratio. The expense ratio forfund of funds is the aggregate expense ratio defined as the sum of the wrap or sponsor fees plus the estimated weighted average of the underlyingfund fees. A higher expense ratio will "drag" on the overall performance of a fund compared to peers with a lower expense ratio.
Net Expense Ratio (Rank). The percentile rank for the Net Expense Ratio within the investment’s peer group. 1 being the best and 100 the worst.
Prospectus Gross Expense Ratio. This value is from the investment’s most recent prospectus. The total gross expenses (net expenses with waiveradded back in) divided by the fund’s average net assets. If it is not equal to the net expense ratio, the gross expense ratio portrays the fund’sexpenses had the manager not waived a portion, or all, of its fees. Thus, to some degree, it is an indication of fee contracts. Some fee waivers have anexpiration date; other waivers are in place indefinitely.
12b-1 Fee. This value is usually taken from the fund’s prospectus but may have been edited by your financial advisor if the prospectus amount wasnot accurate for your given situation. This value is part of the Net Expense Ratio. It represents a maximum annual charge deducted from investmentassets to pay for distribution and marketing costs. This value can be rebated back to the client to offset other expenses.
Front Load. A one-time deduction from a purchase made into the fund. The amount is relative to the amount of the investment, so that largerinvestments incur smaller rates of charge. The sales charge serves as a commission for the broker who sold the fund. Potential fees and sales chargesare an important factor to consider before making an investment. The load compensates the broker or financial planner for the service of providingprofessional investment advice.
Deferred Load. A one-time charge paid at the time of the sale of the fund. The amount is relative to the amount of the investment, so that largerinvestments incur smaller rates of charge. The sales charge serves as a commission for the broker who sold the fund. Potential fees and sales chargesare an important factor to consider before making an investment. The load compensates the broker or financial planner for the service of providingprofessional investment advice.
INVESTMENT STRATEGY & STYLE
Peer Group. Fi360 utilizes the Morningstar Category for peer group assignment. In an effort to distinguish funds by what they own, as well as bytheir prospectus objectives and styles, Morningstar developed the Morningstar Categories. While the prospectus objective identifies a fund’sinvestment goals based on the wording in the fund prospectus, the Morningstar Category identifies funds based on their actual investment styles asmeasured by their underlying portfolio holdings (portfolio and other statistics over the past three years). Peer groups are for comparison only, and donot represent any investable products. Please reference the Peer Group Descriptions section for more specific detail on each peer group that isincluded in this report.
Monitoring ReportInvestment Data as of 12/31/2018. Account Holdings as of 12/31/2018.
STATEMENT OF ADDITIONAL DISCLOSURES: INDEX DESCRIPTIONS
PAGE 16 OF 21
Barclays.
This following indices are part of this family:
BBgBarc US Treasury US TIPS TR USD. The index measures the performance of rules-based, market value-weighted inflation-protectedsecurities issued by the U.S. Treasury. It is a subset of the Global Inflation-Linked Index (Series-L).
Morningstar.
This following indices are part of this family:
Morningstar Gbl Allocation TR USD. The index measures the performance of a multi-asset class portfolio of global equities, global bonds andcash. This portfolio is held in a static allocation that is appropriate for investors who seek average exposure to global equity market risk andreturns.
Morningstar Mod Tgt Risk TR USD. The Morningstar Target Risk Index family is designed to meet the needs of investors who would like tomaintain a target level of equity exposure through a portfolio diversified across equities, bonds and inflation-hedged instruments. TheMorningstar Moderate Target Risk Index seeks approximately 60% exposure to global equity markets.
MSCI ACWI Ex USA NR USD. The index measures the performance of the large and mid cap segments of the particular regions, excludingUSA equity securities, including developed and emerging market. It is free float-adjusted market-capitalization weighted.
MSCI Europe NR USD. The index measures the performance of the large and mid cap segments of developed Europe equity securities. It isfree float-adjusted market-capitalization weighted.
Russell. Russell Investment Group is the source and owner of the trademarks, service marks and copyrights related to the Russell Indexes. Russell®is a trademark of Russell Investment Group.
This following indices are part of this family:
Russell 1000 Growth TR USD. The index measures the performance of the large-cap growth segment of the US equity securities. It includesthe Russell 1000 index companies with higher price-to-book ratios and higher forecasted growth values. It is market-capitalization weighted.Russell Investment Group is the source and owner of the trademarks, service marks and copyrights related to the Russell Indexes. Russell® is atrademark of Russell Investment Group.
Russell 1000 TR USD. The index measures the performance of the large-cap segment of the US equity securities. It is a subset of the Russell3000 index and includes approximately 1000 of the largest securities based on a combination of their market cap and current indexmembership.
Russell 1000 Value TR USD. The index measures the performance of the large-cap value segment of the US equity securities. It includes theRussell 1000 index companies with lower price-to-book ratios and lower expected growth values. It is market-capitalization weighted. RussellInvestment Group is the source and owner of the trademarks, service marks and copyrights related to the Russell Indexes. Russell® is atrademark of Russell Investment Group.
Russell 2000 Growth TR USD. The index measures the performance of small-cap growth segment of the US equity universe. It includesthose Russell 2000 companies with higher price-to-value ratios and higher forecasted growth values. It is market-capitalization weighted.
Monitoring ReportInvestment Data as of 12/31/2018. Account Holdings as of 12/31/2018.
STATEMENT OF ADDITIONAL DISCLOSURES: INDEX DESCRIPTIONS
PAGE 17 OF 21
Russell Investment Group is the source and owner of the trademarks, service marks and copyrights related to the Russell Indexes. Russell® is atrademark of Russell Investment Group.
Russell 2000 TR USD. The index measures the performance of the small-cap segment of the US equity universe. It is a subset of the Russell3000 and includes approximately 2000 of the smallest securities based on a combination of their market cap and current index membership.Russell Investment Group is the source and owner of the trademarks, service marks and copyrights related to the Russell Indexes. Russell® is atrademark of Russell Investment Group.
Monitoring ReportInvestment Data as of 12/31/2018. Account Holdings as of 12/31/2018.
STATEMENT OF ADDITIONAL DISCLOSURES: PEER GROUP DESCRIPTIONS
PAGE 18 OF 21
Emerging Markets Bond (EB). Emerging-markets bond portfolios invest more than 65% of their assets in foreign bonds from developingcountries. The largest portion of the emerging-markets bond market comes from Latin America, followed by Eastern Europe. Africa, the MiddleEast, and Asia make up the rest.
Europe Stock (ES). Europe-stock portfolios invest at least 70% of total assets in equities and invest at least 75% of stock assets in Europe.Most of these portfolios emphasize the region's larger and more developed markets, including Britain, the Netherlands, Germany, France, andSwitzerland. Many also invest in the region’s smaller markets, including the emerging markets of eastern Europe.
Foreign Large Blend (FB). Foreign large-blend portfolios invest in a variety of big international stocks. Most of these portfolios divide theirassets among a dozen or more developed markets, including Japan, Britain, France, and Germany. These portfolios primarily invest in stocks thathave market caps in the top 70% of each economically integrated market (such as Europe or Asia ex-Japan). The blend style is assigned toportfolios where neither growth nor value characteristics predominate. These portfolios typically will have less than 20% of assets invested inU.S. stocks.
Inflation-Protected Bond (IP). Inflation-protected bond portfolios invest primarily in debt securities that adjust their principal values in linewith the rate of inflation. These bonds can be issued by any organization, but the U.S. Treasury is currently the largest issuer for these types ofsecurities.
Large Blend (LB). Large-blend portfolios are fairly representative of the overall US stock market in size, growth rates and price. Stocks in thetop 70% of the capitalization of the US equity market are defined as large cap. The blend style is assigned to portfolios where neither growth norvalue characteristics predominate. These portfolios tend to invest across the spectrum of US industries, and owing to their broad exposure, theportfolios' returns are often similar to those of the S&P 500 Index.
Large Growth (LG). Large-growth portfolios invest primarily in big U.S. companies that are projected to grow faster than other large-capstocks. Stocks in the top 70% of the capitalization of the U.S. equity market are defined as large cap. Growth is defined based on fast growth(high growth rates for earnings, sales, book value, and cash flow) and high valuations (high price ratios and low dividend yields). Most of theseportfolios focus on companies in rapidly expanding industries.
Large Value (LV). Large-value portfolios invest primarily in big U.S. companies that are less expensive or growing more slowly than other large-cap stocks. Stocks in the top 70% of the capitalization of the U.S. equity market are defined as large cap. Value is defined based on lowvaluations (low price ratios and high dividend yields) and slow growth (low growth rates for earnings, sales, book value, and cash flow).
Multialternative (GY). These funds offer investors exposure to several different alternative investment tactics. Funds in this category have amajority of their assets exposed to alternative strategies. An investor’s exposure to different tactics may change slightly over time in response tomarket movements. Funds in this category include both funds with static allocations to alternative strategies and funds tactically allocatingamong alternative strategies and asset classes. The gross short exposure is greater than 20%.
Small Blend (SB). Small-blend portfolios favor U.S. firms at the smaller end of the market-capitalization range. Some aim to own an array ofvalue and growth stocks while others employ a discipline that leads to holdings with valuations and growth rates close to the small-cap averages.Stocks in the bottom 10% of the capitalization of the U.S. equity market are defined as small cap. The blend style is assigned to portfolios whereneither growth nor value characteristics predominate.
Small Growth (SG). Small-growth portfolios focus on faster-growing companies whose shares are at the lower end of the market-capitalizationrange. These portfolios tend to favor companies in up-and-coming industries or young firms in their early growth stages. Because thesebusinesses are fastgrowing and often richly valued, their stocks tend to be volatile. Stocks in the bottom 10% of the capitalization of the U.S.equity market are defined as small cap. Growth is defined based on fast growth (high growth rates for earnings, sales, book value, and cash flow)and high valuations (high price ratios and low dividend yields).
World Allocation (IH). World-allocation portfolios seek to provide both capital appreciation and income by investing in three major areas:stocks, bonds, and cash. While these portfolios do explore the whole world, most of them focus on the U.S., Canada, Japan, and the largermarkets in Europe. It is rare for such portfolios to invest more than 10% of their assets in emerging markets. These portfolios typically have atleast 10% of assets in bonds, less than 70% of assets in stocks, and at least 40% of assets in non-U.S. stocks or bonds.
World Small/Mid Stock (SW). World small/mid stock portfolios invest in a variety of international stocks that are smaller. World-stockportfolios have few geographical limitations. It is common for these portfolios to invest the majority of their assets in developed markets, with
Monitoring ReportInvestment Data as of 12/31/2018. Account Holdings as of 12/31/2018.
STATEMENT OF ADDITIONAL DISCLOSURES: RISKS
PAGE 20 OF 21
Investing involves risk. Loss of principal is possible. An investment in a fund is not a bank deposit, and it is not insured or guaranteed by the FederalDeposit Insurance Corporation (FDIC) or any other government agency. Each fund carries its own specific risks which depend on the types ofinvestments in the fund. Investors should review the fund’s prospectus carefully to understand the risks before investing.
In general, some of the risks associated with the Morningstar Categories shown in this report are as follows:
Allocation. Different methods of asset allocation are associated with varying degrees of risks. Conservative portfolios contain low riskinvestments but may not earn any value over time. Moderate portfolios have a higher level of risk than conservative portfolios. Aggressiveportfolios mainly consist of equities, so their value tends to fluctuate widely.
Alternatives. Funds that make alternative investments or employ alternative strategies may seek returns that are designed to have little or nocorrelation to the securities markets. However, often those strategies perform similarly to the securities markets at the time or for extendedperiods.
Bonds. Bonds are subject to interest rate risk. As the prevailing level of bond interest rates rise, the value of bonds already held in a portfoliodecline. Portfolios that hold bonds are subject to declines and increases in value due to general changes in interest rates. Bonds are also subjectto prepayment risk, which is the chance that an issuer may exercise its right to prepay its security, if falling interest rates prompt the issuer to doso. Forced to reinvest the unanticipated proceeds at lower interest rates, the fund would experience a decline in income and lose the opportunityfor additional price appreciation.
Emerging Markets. Investments in emerging markets securities may be subject to greater market, credit, currency, liquidity, legal, political, andother risks compared with assets invested in developed foreign countries.
Foreign. Investments in foreign securities may be more volatile than investing solely in U.S. markets due to interest-rate, currency, exchangerate, economic, and political risks. The value of these securities can change more rapidly and extremely than can the value of U.S. securities.Foreign securities are subject to increased issuer risk because foreign issuers may not experience the same degree of regulation as U.S. issuersdo and are held to different reporting, accounting, and auditing standards. In addition, foreign securities are subject to increased costs becausethere are generally higher commission rates on transactions, transfer taxes, higher custodial costs, and the potential for foreign tax charges ondividend and interest payments. Many foreign markets are relatively small, and securities issued in less-developed countries face the risks ofnationalization, expropriation or confiscatory taxation, and adverse changes in investment or exchange control regulations, including suspensionof the ability to transfer currency from a country. Economic, political, social, or diplomatic developments can also negatively impactperformance.
Foreign Currencies. Foreign currencies are subject to the risks associated with such currencies and the changes in their values relative to the U.S.dollar. Such risks include volatility in the price relationship between the U.S. dollar and foreign currencies. The value of foreign currencies relativeto the U.S. dollar can be affected by many factors, including national debt levels, trade deficits, international trade and foreign policies, changesin trade and balance of payments, governmental fiscal and monetary policies, currency exchange rates and changes in supply and demand thataffect those rates, investment and trading activity of mutual funds, hedge funds and currency funds, exchange rate controls and governmentintervention in currency markets, inflation rates, interest and deposit rates, market expectations about future inflation rates and interest rates,and global and national economic, financial, political, regulatory, judicial, military and geographical events or developments. Prices of currenciesof less developed or emerging market nations tend to be more volatile than those of developed countries, given the greater political, regulatory,economic, financial, military and social instability and uncertainty in less developed or emerging market nations.
Foreign Regions. Investments in securities from a particular country or region may be subject to the risk of adverse social, political, regulatory, oreconomic events occurring in that country or region. Country- or region-specific risks also include the risk that adverse securities markets orexchange rates may impact the value of securities from those areas.
Inflation-Protected. Inflation-protected bonds, unlike other fixed-income securities, are not significantly impacted by inflation expectationsbecause their interest rates are adjusted for inflation. Generally, the value of inflation-protected securities will fall when real interest rates rise andrise when real interest rates fall.
Large Cap Equities. Concentrating assets in large-capitalization stocks may subject the portfolio to the risk that those stocks underperformother capitalizations or the market as a whole. Large-cap companies may be unable to respond as quickly as small- and mid-cap companies canto new competitive pressures and may lack the growth potential of those securities. Historically, large-cap companies do not recover as quicklyas smaller companies do from market declines.
Monitoring ReportInvestment Data as of 12/31/2018. Account Holdings as of 12/31/2018.
STATEMENT OF ADDITIONAL DISCLOSURES: RISKS
PAGE 21 OF 21
Long-Short. Due to the strategies used by long-short funds, which may include but are not limited to leverage, short selling, short-term trading,and investing in derivatives, these funds may have greater risk, volatility, and expenses than those focusing on traditional investment strategies.When a short position moves in an unfavorable way, the losses are theoretically unlimited. The broker may demand more collateral and amanager might have to close out a short position at an inopportune time to limit further losses.
Small/Mid Cap Equities. Portfolios that invest in stocks of small- to mid-cap companies involve additional risks. Smaller companies typicallyhave a higher risk of failure and are not as well established as larger blue-chip companies. Historically, smaller company stocks have experienceda greater degree of market volatility that the overall market average.
Taxable Bond. Investments in taxable bonds such as government bonds, long-term and short-term bonds, bank loans, corporate bonds,preferred stock, high-yield bonds, etc. are subject to numerous risks including those relating to reinvestment, inflation, market, selection, timing,and duration.


![INDEX [talakeel.com]talakeel.com/pdf/57080Company_Profile.pdf · family has been chosen after detail selection process, ... Modification to IKN cooler (Clinker cooler) ... cooler](https://static.documents.pub/doc/80x56/5aa19d787f8b9ac67a8c07af/index-has-been-chosen-after-detail-selection-process-modification-to-ikn.jpg)


