Page 1
ACTION PLAN FOR INDUSTRIAL CLUSTER IN CRITICALLY POLLUTED AREA
Monitoring, sampling, analysis of Stack, Ambient Air Quality, Surface Water,
Ground Water, Waste Water
ड�बीवल� Dombivli
Maharashtra Pollution Control Board
Kalptaru Point, Sion East, Mumbai - 400022
June, 2018
Page 2
Critically Polluted Areas: Monitoring, sampling, analysis of Stack, Ambient Air Quality, Surface Water, Ground Water, Waste Water
Dombivli 2
Index
Acknowledgement: ............................................................................................. 3
Abbreviations: ................................................................................................... 4
1. Introduction: ............................................................................................. 5
2. Scope of Work ............................................................................................ 6
2.1 Stack Emission Parameters ....................................................................... 6
2.2 Ambient Air Quality Parameters ................................................................ 7
2.3 Water/Waste Water Parameters ................................................................ 7
2.4 Methodology followed in Sampling and Analysis ........................................ 10
3. Result of Analysis: ................................................................................... 10
3.1 Stack Emission: .................................................................................... 11
3.2 Ambient Air Quality: .............................................................................. 15
3.3 Surface Water/ Waste Water Quality: ...................................................... 21
3.4 Ground Water Quality: ........................................................................... 32
4. Summary and Conclusion ......................................................................... 43
4.1 Stack Emission Monitoring: ..................................................................... 43
4.2 Ambient Air Quality Monitoring: .............................................................. 43
4.3 Surface water/ Waste Water Quality Monitoring: ....................................... 44
4.4 Ground Water Quality Monitoring: ........................................................... 44
5. CEPI Score ............................................................................................... 46
5.1 Comparison of CEPI scores: .................................................................... 48
6. Conclusion ............................................................................................... 51
7. Efforts taken for the reduction in pollution: ............................................. 52
8. Photographs ............................................................................................ 53
9. References ............................................................................................... 59
10. Annexure ................................................................................................. 60
Annexure I Health related data in impact on humans ......................................... 60
Annexure II: Stack Emission Sampling and Analysis Methodology ........................ 61
Annexure III: Ambient Air Sampling and Analysis Methodology ........................... 63
Annexure IV: Water/Wastewater Sampling and Analysis Methodology .................. 65
Annexure V: National Ambient Air Quality Standards, 2009 ................................. 69
Annexure VI: General Standards for Discharge of Environmental Pollutants, Part A:
Effluents (The Environment (Protection) Rules, 1986, Schedule VI) ...................... 70
Annexure VII: Drinking Water Specification-IS 10500:2012 ................................ 74
Annexure VIII: CPCB Water Quality Criteria: ..................................................... 78
Annexure IX: Water Quality Parameters Requirements and Classification .............. 79
Page 3
Critically Polluted Areas: Monitoring, sampling, analysis of Stack, Ambient Air Quality, Surface Water, Ground Water, Waste Water
Dombivli 3
Acknowledgement:
We gratefully acknowledge Dr. P. Anbalagan, Member Secretary, Maharashtra Pollution
Control Board, for entrusting this very important and prestigious project to us.
Our special thanks are to Regional and Sub Regional Officer of the concerned areas, for
guidance during the sampling. The contribution of Shri V. M Motghare (Joint director
APC) and Mr. Sameer Hundlekar (Field officer) is appreciated.
We would also like to extend our thanks to the concerned staff of Regional Hospitals,
who has provided us the health data, which is the most important component of this
revised concept of CEPI.
By undertaking this project and completing in schedule time, we consider ourselves very
lucky since we have helped the mankind by giving the data on pollution load and further
action by the Board, to bring down the pollution level.
We also thank our associates for working on this project for making the write up, making
graphs and feeding the data on computer.
This acknowledgement will be incomplete if we do not thank our laboratory analysts and
others who made this project a success by timely analysing the samples.
We also thank our sampling team members for conducting the sampling in this vast
area.
Page 4
Critically Polluted Areas: Monitoring, sampling, analysis of Stack, Ambient Air Quality, Surface Water, Ground Water, Waste Water
Dombivli 4
Abbreviations:
APHA American Public Health Association
BDL Below Detection Limit
BOD Biochemical Oxygen Demand
CEPI Comprehensive Environmental Pollution Index
CETP Common Effluent Treatment Plant
COD Chemical Oxygen Demand
CPA Critically Polluted Areas
SPA Severely Polluted Areas
DO Dissolved Oxygen
ETP Effluent Treatment Plant
MIBK Methyl Isobutyl Ketone
MPCB Maharashtra Pollution Control Board
NAAQS National Ambient Air Quality Standards
NOx Oxides of Nitrogen
ND Not Detected
PAH Poly Aromatic Hydrocarbons
PCB Poly Chlorinated Biphenyls
PCT Poly Chlorinated Terphenyls
PM10 Particulate Matter (size less than 10 µm)
PM2.5 Particulate Matter (size less than 2.5 µm)
SO2 Sulphur Dioxide
STAP Short Term Action Plan
WHO World Health Organization
Page 5
Critically Polluted Areas: Monitoring, sampling, analysis of Stack, Ambient Air Quality, Surface Water, Ground Water, Waste Water
Dombivli 5
1. Introduction:
India has experienced rapid industrial growth in last few years. Maharashtra is one of
the most industrialised states in the country. The state has identified industrial sectors
like auto, engineering, chemical, electronics and textile as focus sectors. Industrial
processes and activities consume materials and resources for manufacturing products
generating emissions, effluents and solid wastes. Rise in growth in industrial activities
is leading to manifold impacts to the environment. This environmental pollution is a
wide reaching problem and if not controlled to certain tolerable levels, it is likely to
influence the human health too. Long term exposure to the polluted air and water
causes chronic health problems. Hence, scientists are exploring the quantum of
pollution load as well as to device certain strategies and technologies so that our
sustainable development would not be jeopardized otherwise our long cherished
dream of establishing eco-socialism on this watery planet could not come true.
The extent of pollution varies with the size of the industry, the nature of the industry,
the type of products used and produced etc. In view of this, Central Pollution Control
Board (CPCB) has evolved the concept of Comprehensive Environmental Pollution
Index (CEPI) during 2009-10 as a tool for comprehensive environmental assessment
of prominent industrial clusters and formulation of remedial Action Plans for the
identified critically polluted areas. The index captures the various dimensions of
environment including air, water and land. Comprehensive Environmental Pollution
Index (CEPI), which is a rational number to characterize the environmental quality at
a given location following the algorithm of source, pathway and receptor have been
developed. Later-on proposals were received from the SPCBs, State Governments,
and Industrial Associations and concerned Stake-holders for revisiting the criteria of
assessment under CEPI concept. After careful examination and consideration of the
suggestions of concerned stake-holders, it was decided to prepare the revised concept
of CEPI by eliminating the subjective factors but retaining the factors which can be
measured precisely. Hence, revised concept came into existence, which is termed as
Revised CEPI Version 2016.
The present report is also based on the revised CEPI version 2016. The results of the
application of the Comprehensive Environmental Pollution Index (CEPI) to selected
industrial clusters or areas are presented in this report. The main objective of the
study is to identify polluted industrial clusters or areas in order to take concerted
action and to centrally monitor them at the national level to improve the current
status of their environmental components such as air and water quality data,
ecological damage, and visual environmental conditions. For the study, Central
Pollution Control Board (CPCB) has selected a total of 88 industrial areas or clusters in
consultation with the Ministry of Environment & Forests Government of India. Out of
these, 5 critically polluted industrial clusters namely Tarapur, Dombivali, Navi Mumbai,
Aurangabad and Chandrapur, are identified and 3 severely polluted industrial clusters
namely Pimpri-chinchwad, Nashik and Chembur from Maharashtra are added into this
list.
Dombivli MIDC is established in 1964 and is sub-divided in two Phases. Phase I is of
approximately 148 Ha. & Phase II approximately 97 Ha. Residential Area is developed in
between these two phases, having population approx. 2 lakh soles. Both Phases has a
mix of industries, mainly Textile, Chemical & Engineering. Except for 10 large & 9
Medium units, most of the chemical manufacturing units are SSI. Textile Industry
generates about 80% of the wastewater by volume, though low strength in terms of
concentration of pollutants. CETPs are installed & operative in both phases. Phase I
(DBESA) - 16 MLD for textile units and Phase II (DCETP) – 1.5 MLD for Chemical &
other units.
Page 6
Critically Polluted Areas: Monitoring, sampling, analysis of Stack, Ambient Air Quality, Surface Water, Ground Water, Waste Water
Dombivli 6
2. Scope of Work
The Scope of Work consisted of the following:
Monitoring, Sampling, Analysis for Stack, Ambient Air Quality, Surface Water, Waste
Water, and Ground Water Quality for identified five Critically Polluted areas (CPAs) in
Maharashtra i.e. Chandrapur, Dombivli, Aurangabad, Navi Mumbai, and Tarapur
and 3 Severely Polluted areas (SPAs) in Maharashtra i.e. Chembur, Pimpri-Chinchwad
and Nashik as per standard methods.
• At each of the 5 CPAs and 3 SPAs, 24 hourly ambient air quality monitoring to be
carried out.
• Representative samples for surface water quality, waste water quality and ground
water quality to be collected from prominent surface and ground water bodies located
in and around the clusters/areas.
• Submission of complete monitoring, sampling and analysis reports including the
summary of the parameters exceeding the prescribed standards/norms for all the 5
CPAs and 3 SPAs.
• Submission of 3 copies of final report with photographs at prominent locations and
the CD (soft copy) on completion of the project for every critically polluted and
severely polluted area separately.
Monitoring, Sampling, Analysis for Stack, Ambient Air Quality, Surface Water,
Waste Water and Ground Water Quality for Dombivli:
• The sampling was carried out in 6 days i.e. on 4th to & 9th June 2018 for MIDC Phase-
I and Phase II.
• In Dombivli MIDC Phase –I, a total of 6 Stack Monitoring Samples, 6 Ambient Air
Quality Monitoring Samples, 1 Waste Water Samples, 3 Ground Water Samples and 3
VOC Samples were collected and analyzed.
• In MIDC Phase –II, a total of 6 Stack Monitoring Samples, 6 Ambient Air Quality
Monitoring Samples, 5 Waste Water Samples, 3 Ground Water Samples and 1 VOC
Samples was collected and analyzed.
2.1 Stack Emission Parameters
The Stack Emissions were analyzed with the following parameters:
1. Acid Mist
2. Ammonia
3. Carbon Monoxide
4. Chlorine
5. Fluoride(gaseous)
6. Fluoride (particulate)
7. Hydrogen Chloride
Page 7
Critically Polluted Areas: Monitoring, sampling, analysis of Stack, Ambient Air Quality, Surface Water, Ground Water, Waste Water
Dombivli 7
8. Hydrogen Sulphide
9. Oxides of Nitrogen
10. Oxygen
11. Polyaromatic Hydrocarbons (Particulate)
12. Suspended Particulate Matter
13. Sulphur Dioxide
14. Benzene
15. Toluene
16. Xylene
17. Volatile Organic Compounds (VOCs)
2.2 Ambient Air Quality Parameters
The Ambient Air Quality was analyzed with the following parameters:
1. Sulphur Dioxide (SO2)
2. Nitrogen Dioxide (NO2)
3. Particulate Matter (PM10)
4. Particulate Matter (PM2.5)
5. Ozone (O3)
6. Lead (Pb)
7. Carbon Monoxide (CO)
8. Ammonia (NH3)
9. Benzene (C6H6)
10. Benzo (a) Pyrene (BaP) (Particulate Phase Only)
11. Arsenic (As)
12. Nickel (Ni)
2.3 Water/Waste Water Parameters
The Water/ Waste Water was analyzed with the following parameters:
a. Prominent Surface Water bodies such as outfalls of CETPs, ETPs, treated effluent
drainage, river, canal, ponds, lakes and other such water supply resources flowing
through the area or flowing adjoining the CPA.
Page 8
Critically Polluted Areas: Monitoring, sampling, analysis of Stack, Ambient Air Quality, Surface Water, Ground Water, Waste Water
Dombivli 8
b. Ground Water Quality data of prominent ground water resources such as observation
wells of Central Ground Water Board, drinking water wells, hand pumps, bore wells,
hand pumps, bore wells and other such water supply resources located in the
industrial cluster/area under consideration or in the peripheral areas.
Basic water quality parameters for surface water and ground water both are as
follows:
i. Simple Parameters:
1. Sanitary Survey
2. General Appearance
3. Colour
4. Smell
5. Transparency
6. Ecological(Presence of animals like fish, insects) (Applicable to only surface water)
ii. Regular Monitoring Parameters:
7. pH
8. Oil & Grease
9. Suspended Solids
10. Dissolved Oxygen (% saturation) (Not applicable for ground waters)
11. Chemical Oxygen Demand
12. Biochemical Oxygen Demand
13. Electrical Conductivity
14. Nitrite-Nitrogen
15. Nitrate-Nitrogen
16. (NO2 + NO3)-Nitrogen
17. Free Ammonia
18. Total Residual Chlorine
19. Cyanide
Page 9
Critically Polluted Areas: Monitoring, sampling, analysis of Stack, Ambient Air Quality, Surface Water, Ground Water, Waste Water
Dombivli 9
20. Fluoride
21. Sulphide
22. Dissolved Phosphate
23. Sodium Absorption Ratio (SAR)
24. Total Coliforms (MPN/100 ml)
25. Faecal Coliforms (MPN/100 ml)
iii. Special Parameters:
26. Total Phosphorous
27. Total Kjeldahl Nitrogen(TKN)
28. Total Ammonia (NH4 +NH3)-Nitrogen
29. Phenols
30. Surface Active Agents
31. Organo Chlorine Pesticides
32. Polynuclear aromatic hydrocarbons (PAH)
33. Polychlorinated Biphenyls (PCB)and Polychlorinated Terphenyls (PCT)
34. Zinc
35. Nickel
36. Copper
37. Hexavalent Chromium
38. Chromium (Total)
39. Arsenic (Total)
Page 10
Critically Polluted Areas: Monitoring, sampling, analysis of Stack, Ambient Air Quality, Surface Water, Ground Water, Waste Water
Dombivli 10
40. Lead
41. Cadmium
42. Mercury
43. Manganese
44. Iron
45. Vanadium
46. Selenium
47. Boron
iv. Bioassay (Zebra Fish) Test: For specified samples only.
2.4 Methodology followed in Sampling and Analysis
Industries, places and locations that have been chosen for the sampling are
representative of the city/area. Sampling has been done at the potential polluted areas
so as to arrive at the CEPI. This will further help the authorities to monitor the areas in
order to improve the current status of their environmental components such as air and
water quality data, ecological damage and visual environmental conditions. Methodology
for sampling, preservation and analysis have been done according to the references
incorporated. Methodology of various types of parameters is presented under following
annexure:
1. Stack Emission Sampling and Analysis Methodology – Annexure II
2. Ambient Air Sampling and Analysis Methodology - Annexure III
3. Water/Wastewater Sampling and Analysis Methodology - Annexure IV
3. Result of Analysis:
Results of Analysis are tabulated below for Stack Emission Monitoring, Ambient Air
Quality Monitoring, Waste Water Analysis and Water Analysis. These are followed by
their respective graphical representation.
*Kindly note:
• NA specifies the sample is not analysed for the specific parameter.
• BDL specifies that the result obtained is below deductable limit.
• ND specifies the sample is not detectable for the specific parameter
Please Note: Industrial clusters observed with below detection limit parameters are NOT included into the graphs
Page 11
Critically Polluted Areas: Monitoring, sampling, analysis of Stack, Ambient Air Quality, Surface Water, Ground Water, Waste Water
Dombivli 11
.3.1 Stack Emission:
Stack Emission Monitoring Results are compared against The Environment (Protection)
Rules, 1986 General Emission Standard - Part D.
Sr. Name of Industry Stack
Identity Phase
Table
No.
1. Shree Sainath Dyeing & Printing Pvt. Ltd. Phase I I
2. Tirupati Textile Mills Coal Fire Boiler Phase I I
3. Auchtel Products Ltd. F. O. Boiler Phase I I
4. Evonik Catalysts India Pvt. Ltd. Process Stack Phase I II
5. Gharda Chemical Ltd. Process Stack Phase I II
6. Shrijee Lifestyle Pvt. Ltd. Coal Fire Boiler Phase I II
7. Metropolitan Eximchem Ltd. Coal Fire Boiler Phase II III
8. Metropolitan Eximchem Ltd. SO2 Scrubber Phase II III
9. Ridham Synthetic Pvt. Ltd. Phase II III
10. Aarti Industries Ltd. Process Stack Phase II IV
11. Cosmo Chemical Pvt. Ltd. Coal Fire Boiler Phase II IV
12. Shri Mahabir Dyeing & Printing Mills Pvt. Ltd. Coal Fire Boiler Phase II IV
* The VOC result of stack emission is provided in Table No. V
Table No. I
Name of Industry Shree
Sainath
Dyeing &
Printing
Pvt. Ltd.
Tirupati
Textile
Mills
Auchtel
Products
Ltd.
Date of Sampling 06.06.18 06.06.18 07.06.18
Sr. Parameter Unit Results
1. Particulate Matter (as PM) mg/Nm3 28 16 20
Std. Limit mg/Nm3 50 150 150
2. Sulphur Dioxide (as SO2)
mg/Nm3 10.8 8.14 5.42
kg/day 0.92 2.32 0.821
Std. Limit mg/Nm3 200 100 100
Page 12
Critically Polluted Areas: Monitoring, sampling, analysis of Stack, Ambient Air Quality, Surface Water, Ground Water, Waste Water
Dombivli 12
Name of Industry Shree
Sainath
Dyeing &
Printing
Pvt. Ltd.
Tirupati
Textile
Mills
Auchtel
Products
Ltd.
Date of Sampling 06.06.18 06.06.18 07.06.18
Sr. Parameter Unit Results
3. Nitrogen Dioxide (NO2) mg/Nm3 19.1 21.8 22.2
Std. Limit mg/Nm3 50 50 50
4. Hydrogen Chloride (HCL) mg/Nm3 BDL BDL BDL
Std. Limit mg/Nm3 35 - -
Table No. II
Name of Industry Evonik
Catalysts
India Pvt.
Ltd.
Gharda
Chemical
Ltd.
Shrijee
Lifestyle
Pvt. Ltd.
Date of Sampling 07.06.18 09.06.18 09.06.18
Sr. Parameter Unit Results
1. Particulate Matter (as PM) mg/Nm3 BDL BDL 19
Std. Limit mg/Nm3 50 150 150
2. Sulphur Dioxide (as SO2)
mg/Nm3 BDL 13.6 8.28
kg/day BDL BDL 3.85
Std. Limit mg/Nm3 200 100 100
3. Nitrogen Dioxide (NO2) mg/Nm3 BDL BDL 18.9
Std. Limit mg/Nm3 50 50 50
4. Hydrogen Chloride (HCL) mg/Nm3 9.67 13.7 BDL
Std. Limit mg/Nm3 35 35 -
Page 13
Critically Polluted Areas: Monitoring, sampling, analysis of Stack, Ambient Air Quality, Surface Water, Ground Water, Waste Water
Dombivli 13
Table No. III
Name of Industry Metropolitan
Eximchem
Ltd.
Metropolitan
Eximchem
Ltd.
Ridham
Synthetic
Pvt. Ltd.
Date of Sampling 04.06.18 04.06.18 04.06.18
Sr. Parameter Unit Results
1. Particulate Matter (as PM) mg/Nm3 15 BDL 20
Std. Limit mg/Nm3 150 150 150
2. Sulphur Dioxide (as SO2)
mg/Nm3 8.14 BDL 8.14
kg/day 0.687 BDL 1.58
Std. Limit mg/Nm3 100 100 100
3. Nitrogen Dioxide (NO2) mg/Nm3 12.7 BDL 15.8
Std. Limit mg/Nm3 50 50 50
4. Hydrogen Chloride (HCL) mg/Nm3 BDL BDL BDL
Std. Limit mg/Nm3 - - -
Table No. IV
Name of Industry
Aarti
Industries
Ltd.
Cosmo
Chemical
Pvt. Ltd.
Shri Mahabir
Dyeing &
Printing
Mills Pvt.
Ltd.
Date of Sampling 04.06.18 04.06.18 04.06.18
Sr. Parameter Unit Results
1. Particulate Matter (as PM) mg/Nm3 BDL 18 22
Std. Limit mg/Nm3 150 150 150
2. Sulphur Dioxide (as SO2)
mg/Nm3 BDL 8.28 10.8
kg/day BDL 40.9 0.975
Std. Limit mg/Nm3 100 100 100
3. Nitrogen Dioxide (NO2) mg/Nm3 BDL 9.57 15.8
Std. Limit mg/Nm3 50 50 50
Page 14
Critically Polluted Areas: Monitoring, sampling, analysis of Stack, Ambient Air Quality, Surface Water, Ground Water, Waste Water
Dombivli 14
Name of Industry
Aarti
Industries
Ltd.
Cosmo
Chemical
Pvt. Ltd.
Shri Mahabir
Dyeing &
Printing
Mills Pvt.
Ltd.
Date of Sampling 04.06.18 04.06.18 04.06.18
Sr. Parameter Unit Results
4. Hydrogen Chloride (HCL) mg/Nm3 10 BDL BDL
Std. Limit mg/Nm3 - - -
Table No. V
Name of Industry Auchtel
Products
Ltd.
Evonik
Catalysts
India
Pvt. Ltd.
Gharda
Chemical
Ltd.
Aarti
Industries
Ltd.
Date of Sampling 07.06.18 07.06.18 09.06.18 09.06.18
Sr. Parameter Unit Results
1. VOC
I. Methyl Isobutyl
Ketone mg/Nm3 ND ND ND ND
II. Benzene mg/Nm3 ND ND ND ND
III. Toulene mg/Nm3 ND ND ND ND
IV. Xylene mg/Nm3 ND ND ND ND
V. Ethyl Benzene mg/Nm3 ND ND ND ND
VI. Ethyl Acetate mg/Nm3 ND ND ND ND
Page 15
Critically Polluted Areas: Monitoring, sampling, analysis of Stack, Ambient Air Quality, Surface Water, Ground Water, Waste Water
Dombivli 15
Graphs: Stack Monitoring for Dombivli MIDC:
3.2 Ambient Air Quality:
In order to arrive at conclusions, the Ambient Air Quality Monitoring Results are
compared against National Ambient Air Quality Standards, 2009 (Annexure V).
Sr. Location Location detail Phase Table
No.
1. BKT C-21, Behind vico laboratory Near Main Gate Phase I I
2. Kalyan Ambernath Manufacture
Association (KAMA Office) Near Main Gate Phase I I
3. Auchtel Products Ltd. Near Main Gate Phase I I
4. CETP MIDC Phase I Near Office Phase I II
5. Zenith industrial Rubber Product Pvt.
Ltd. Near Main Gate Phase I II
6. CETP MIDC Phase II Near Office Phase II II
7. Navjeevan (Parag) Synthetics Pvt Ltd. Near Main Gate Phase II III
8. Suvishrhu Speciality Chemicals Pvt. Ltd. Near Main Gate Phase II III
9. VNS Industries Pvt. Ltd. Near Main Gate Phase II III
05
1015202530
Shre
e Sa
inat
h Dy
eing
& P
rint
ing
Pvt.
Ltd.
Tiru
pati
Text
ile M
ills
Auch
tel P
rodu
cts
Ltd.
Evon
ik C
atal
ysts
Indi
a Pv
t. Lt
d.
Ghar
da C
hem
ical
Ltd.
Shri
jee
Life
style
Pvt
. Ltd
.
Met
ropo
litan
Exi
mch
em Lt
d.
Ridh
am S
ynth
etic
Pvt
. Ltd
.
Aart
i Ind
ustr
ies
Ltd.
Cosm
o Ch
emic
al P
vt. L
td.
Shri
Mah
abir
Dye
ing
& Pr
intin
g M
ills
Pvt.
Ltd.
Phase I Phase I Phase I Phase I Phase I Phase I Phase II Phase II Phase II Phase II Phase II
Conc
entr
atio
n m
g/Nm
3
Industry
Dombivli Stack
Particulate Matter (as PM) Sulphur Dioxide (as SO2)
Nitrogen Dioxide (NO2) Hydrogen Chloride (HCL)
Page 16
Critically Polluted Areas: Monitoring, sampling, analysis of Stack, Ambient Air Quality, Surface Water, Ground Water, Waste Water
Dombivli 16
Sr. Location Location detail Phase Table
No.
10. R. R. Hospital Next to Pendharkar
College Near Main Gate Phase II IV
11. MIDC Sump Near W226 Near Office Phase II IV
12. Dhanlaxmi Fabrics Ltd. Near Main Gate Phase II IV
Table No. I
Location
BKT C-21,
Behind
vico
laboratory
KAMA
Office
Auchtel
Products
Ltd.
Date of Sampling 07.06.18 07.06.18 07.06.18
Sr. Parameters Unit
Std.
Limit
(NAAQS
2009)
Results
1. Sulphur Dioxide (SO2) µg/m3 80 6.49 6.19 6.39
2. Nitrogen Dioxide (NO2) µg/m3 80 6.67 6.46 5.78
3. Particulate Matter (size
less than 10 µm) or PM10 µg/m3 100 185 191 79
4. Particulate Matter (size
less than 2.5 µm) or
PM2.5
µg/m3 60 46 48 19
5. Ozone (O3) µg/m3 180 BDL BDL BDL
6. Lead (Pb) µg/m3 1 BDL BDL BDL
7. Carbon Monoxide (CO) mg/m3 4 1.37 1.27 1.56
8. Ammonia (NH3) µg/m3 400 BDL BDL BDL
9. Benzene (C6H6) µg/m3 5 BDL BDL BDL
10.Benzo (a) Pyrene (BaP) –
particulate phase only ng/m3 1 BDL BDL BDL
11. Arsenic (As) ng/m3 6 BDL BDL BDL
12. Nickel (Ni) ng/m3 20 BDL BDL BDL
Page 17
Critically Polluted Areas: Monitoring, sampling, analysis of Stack, Ambient Air Quality, Surface Water, Ground Water, Waste Water
Dombivli 17
Table No. II
Location
CETP
MIDC
Phase I
Zenith
industrial
Rubber
Product
Pvt. Ltd.
CETP
MIDC
Phase II
Date of Sampling 08.06.18 09.06.18 04.06.18
Sr. Parameters Unit
Std.
Limit
(NAAQS
2009)
Results
1. Sulphur Dioxide (SO2) µg/m3 80 6.19 6.29 6.7
2. Nitrogen Dioxide (NO2) µg/m3 80 6.67 6 8.01
3. Particulate Matter (size
less than 10 µm) or PM10 µg/m3 100 61 112 190
4. Particulate Matter (size
less than 2.5 µm) or
PM2.5
µg/m3 60 15 28 42
5. Ozone (O3) µg/m3 180 BDL BDL BDL
6. Lead (Pb) µg/m3 1 BDL BDL BDL
7. Carbon Monoxide (CO) mg/m3 4 1.32 1.45 1.57
8. Ammonia (NH3) µg/m3 400 BDL BDL BDL
9. Benzene (C6H6) µg/m3 5 BDL BDL BDL
10.Benzo (a) Pyrene (BaP) –
particulate phase only ng/m3 1 BDL BDL BDL
11. Arsenic (As) ng/m3 6 BDL BDL BDL
12. Nickel (Ni) ng/m3 20 BDL BDL BDL
Page 18
Critically Polluted Areas: Monitoring, sampling, analysis of Stack, Ambient Air Quality, Surface Water, Ground Water, Waste Water
Dombivli 18
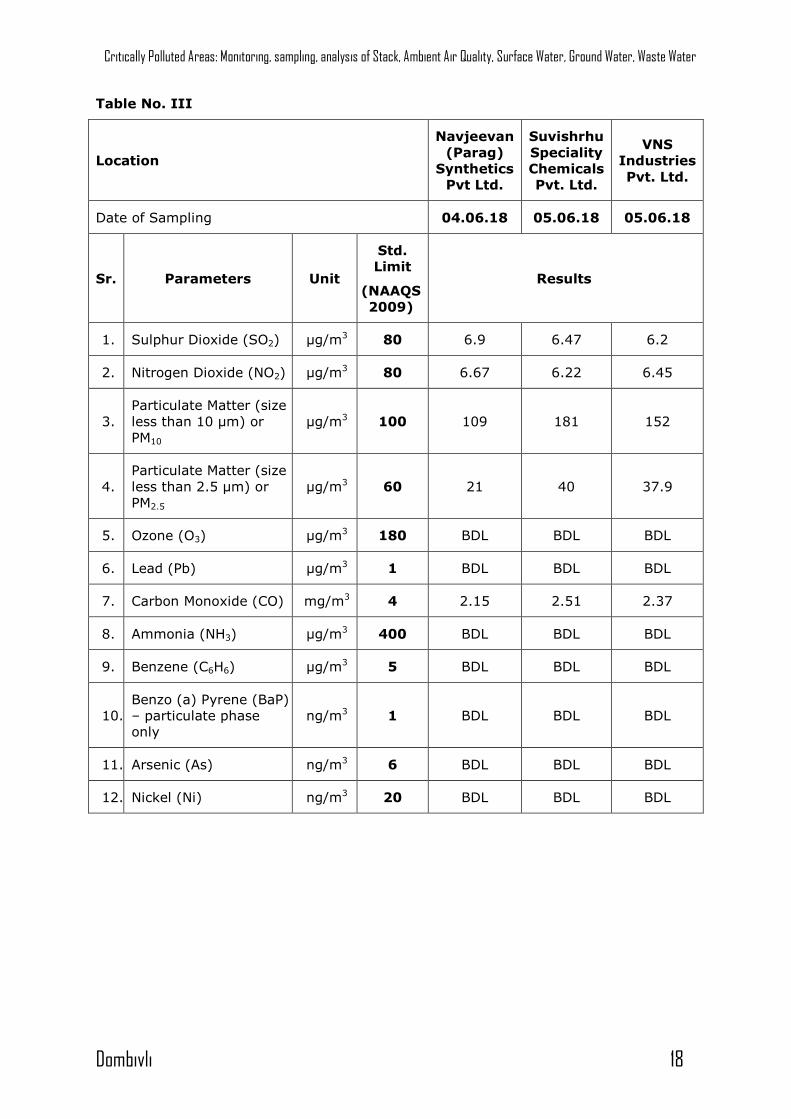
Table No. III
Location
Navjeevan
(Parag)
Synthetics
Pvt Ltd.
Suvishrhu
Speciality
Chemicals
Pvt. Ltd.
VNS
Industries
Pvt. Ltd.
Date of Sampling 04.06.18 05.06.18 05.06.18
Sr. Parameters Unit
Std.
Limit
(NAAQS
2009)
Results
1. Sulphur Dioxide (SO2) µg/m3 80 6.9 6.47 6.2
2. Nitrogen Dioxide (NO2) µg/m3 80 6.67 6.22 6.45
3. Particulate Matter (size
less than 10 µm) or
PM10
µg/m3 100 109 181 152
4. Particulate Matter (size
less than 2.5 µm) or
PM2.5
µg/m3 60 21 40 37.9
5. Ozone (O3) µg/m3 180 BDL BDL BDL
6. Lead (Pb) µg/m3 1 BDL BDL BDL
7. Carbon Monoxide (CO) mg/m3 4 2.15 2.51 2.37
8. Ammonia (NH3) µg/m3 400 BDL BDL BDL
9. Benzene (C6H6) µg/m3 5 BDL BDL BDL
10.
Benzo (a) Pyrene (BaP)
– particulate phase
only
ng/m3 1 BDL BDL BDL
11. Arsenic (As) ng/m3 6 BDL BDL BDL
12. Nickel (Ni) ng/m3 20 BDL BDL BDL
Page 19
Critically Polluted Areas: Monitoring, sampling, analysis of Stack, Ambient Air Quality, Surface Water, Ground Water, Waste Water
Dombivli 19
Table No. IV
Location R. R.
Hospital
MIDC
Sump
Near
W226
Dhanlaxmi
Fabrics
Ltd.
Date of Sampling 06.06.18 06.06.18 09.06.18
Sr. Parameters Unit
Std.
Limit
(NAAQS
2009)
Results
1. Sulphur Dioxide (SO2) µg/m3 80 6.29 6.25 6.29
2. Nitrogen Dioxide (NO2) µg/m3 80 6.23 6.68 6.23
3. Particulate Matter (size
less than 10 µm) or
PM10
µg/m3 100 82.2 92.2 113
4. Particulate Matter (size
less than 2.5 µm) or
PM2.5
µg/m3 60 20.5 23 24
5. Ozone (O3) µg/m3 180 BDL BDL BDL
6. Lead (Pb) µg/m3 1 BDL BDL BDL
7. Carbon Monoxide (CO) mg/m3 4 1.85 0.96 1.36
8. Ammonia (NH3) µg/m3 400 BDL BDL BDL
9. Benzene (C6H6) µg/m3 5 BDL BDL BDL
10.
Benzo (a) Pyrene (BaP)
– particulate phase
only
ng/m3 1 BDL BDL BDL
11. Arsenic (As) ng/m3 6 BDL BDL BDL
12. Nickel (Ni) ng/m3 20 BDL BDL BDL
Page 20
Critically Polluted Areas: Monitoring, sampling, analysis of Stack, Ambient Air Quality, Surface Water, Ground Water, Waste Water
Dombivli 20
Graphs: Ambient Air Quality Monitoring for Dombivli MIDC:
0
50
100
150
200
250
BKT
C-21
, Beh
ind
vico
labo
rato
ry
Kaly
an A
mbe
rnat
h M
anuf
actu
re
Asso
ciat
ion
(KAM
A Of
fice)
Auch
tel P
rodu
cts
Ltd.
CETP
MID
C Ph
ase
I
Zeni
th in
dust
rial
Rub
ber
Prod
uct
Pvt.
Ltd. CE
TP M
IDC
Phas
e II
Navj
eeva
n (P
arag
) Sy
nthe
tics
Pvt L
td.
Suvis
hrhu
Spe
cial
ity C
hem
ical
s Pv
t. Lt
d.
VNS
Indu
stri
es P
vt. L
td.
R. R
. Hos
pita
l Nex
t to
Pend
hark
ar C
olle
ge
MID
C Su
mp
Near
W22
6
Dhan
laxm
i Fab
rics
Ltd
.
Phase I Phase I Phase I Phase I Phase I Phase II Phase II Phase II Phase II Phase II Phase II Phase II
Co
ncen
trati
on
µg
/m
3
Location
Dombivli Ambient Air
Sulphur Dioxide (SO2) Nitrogen Dioxide (NO2)
Particulate Matter PM10 Particulate Matter PM2.5
00.5
11.5
22.5
3
BKT
C-21
, Beh
ind
vico
labo
rato
ry
Kaly
an A
mbe
rnat
h M
anuf
actu
re
Asso
ciat
ion
(KAM
A Of
fice)
Auch
tel P
rodu
cts
Ltd.
CETP
MID
C Ph
ase
I
Zeni
th in
dust
rial
Rub
ber
Prod
uct
Pvt.
Ltd. CE
TP M
IDC
Phas
e II
Navj
eeva
n (P
arag
) Sy
nthe
tics
Pvt L
td.
Suvis
hrhu
Spe
cial
ity C
hem
ical
s Pv
t. Lt
d.
VNS
Indu
stri
es P
vt. L
td.
R. R
. Hos
pita
l Nex
t to
Pend
hark
ar C
olle
ge
MID
C Su
mp
Near
W22
6
Dhan
laxm
i Fab
rics
Ltd
.
Phase I Phase I Phase I Phase I Phase I Phase II Phase II Phase II Phase II Phase II Phase II Phase II
Co
ncen
trati
on
m
g/
m3
Location
Dombivli Ambient Air
Carbon Monoxide (CO)
Page 21
Critically Polluted Areas: Monitoring, sampling, analysis of Stack, Ambient Air Quality, Surface Water, Ground Water, Waste Water
Dombivli 21
3.3 Surface Water/ Waste Water Quality:
Water Analysis Results are compared against CPCB document on criteria for
Comprehensive Environmental Assessment of Industrial Clusters-Water Quality
Parameters Requirement and Classification (Annexure IX), CPCB Water Quality Criteria
(Annexure VIII) and Drinking Water Specification, IS 10500:2012 (Annexure VII),
Wastewater Analysis Results are compared with General Standards for Discharge of
Environmental Pollutants Part A: Effluents, The Environment (Protection) Rules, 1986,
Schedule VI.
Sr. Location Source Phase Table
No.
1. CETP CETP Outlet Phase I I
2. MIDC phase 2, Dombivali Surface Water Phase II I
3. Khambal Pada Surface Water Phase II I
4. Metro Junction Surface Water Phase II II
5. Gandinagar Nala Surface Water Phase II II
6. CETP CETP Outlet Phase II II
Table No. I
Location CETP
Phase I
MIDC
phase 2
Khambal
Pada
Date of Sampling 08.06.18 08.06.18 08.06.18
Sr. Parameters Unit Std.
Limit Results
1. Colour Hazen 5 3 3
2. Smell - Disagreeable Disagreeable Disagreeable
3. pH - 5.5 -9.0 7.5 7.35 7.45
4. Oil & Grease mg/L 10.0 BDL BDL BDL
5. Suspended
Solids mg/L 100.0 22 22 12
6. Dissolved
Oxygen
(% Saturation)
% 47 0 6
7. Chemical
Oxygen
Demand
mg/L 250.0 200 120 40
Page 22
Critically Polluted Areas: Monitoring, sampling, analysis of Stack, Ambient Air Quality, Surface Water, Ground Water, Waste Water
Dombivli 22
Location CETP
Phase I
MIDC
phase 2
Khambal
Pada
Date of Sampling 08.06.18 08.06.18 08.06.18
Sr. Parameters Unit Std.
Limit Results
8.
Biochemical
Oxygen
Demand
(3 days,27o C)
mg/L 30.0 74 43 13
9. Electrical
Conductivity
(at 25o C )
µmho/
cm 6740 798 693
10. Nitrite Nitrogen
(as NO2) mg/L 0.02 0.09 0.03
11. Nitrate
Nitrogen
(as NO3)
mg/L 10.0 6.28 19 9.17
12. (NO2 + NO3)-
Nitrogen mg/L 5.0 6.3 19.09 9.2
13. Free Ammonia
(as NH3-N) mg/L 5.0 0.74 BDL BDL
14. Total Residual
Chlorine mg/L 1.0 BDL BDL BDL
15. Cyanide
(as CN) mg/L 0.2 BDL BDL BDL
16. Fluoride (as F) mg/L 2.0 0.27 0.14 BDL
17. Sulphide
(as S2-) mg/L 2.0 BDL BDL BDL
18. Dissolved
Phosphate
(as P)
mg/L 5.0 BDL BDL BDL
19. Sodium
Absorption
Ratio
mg/L 1.3 BDL BDL
20. Total Coliforms
MPN
index/
100
ml
100.0 140 47 32
Page 23
Critically Polluted Areas: Monitoring, sampling, analysis of Stack, Ambient Air Quality, Surface Water, Ground Water, Waste Water
Dombivli 23
Location CETP
Phase I
MIDC
phase 2
Khambal
Pada
Date of Sampling 08.06.18 08.06.18 08.06.18
Sr. Parameters Unit Std.
Limit Results
21. Faecal
Coliforms
MPN
index/
100
ml
1000.0 22 14 14
22. Total
Phosphorous
(as P)
mg/L 1.0 BDL BDL BDL
23. Total Kjeldahl
Nitrogen
(as TKN)
mg/L 100.0 100 16.8 10.6
24. Total Ammonia
(NH4+NH3)-
Nitrogen
mg/L 5.0 52 6.51 5.08
25. Phenols
(as C6H5OH) mg/L 3.0 BDL BDL BDL
26. Surface Active
Agents
(as MBAS)
mg/L 3.0 BDL BDL BDL
27. Organo
Chlorine
Pesticides
I. Alachlor µg/L 2.0 BDL BDL BDL
II. Atrazine µg/L 0.2 BDL BDL BDL
III. Aldrin µg/L 0.1 BDL BDL BDL
IV. Dieldrin µg/L 2.0 BDL BDL BDL
V. Alpha HCH µg/L 0.01 0.034 BDL BDL
VI. Beta HCH µg/L 2.0 BDL BDL BDL
VII. Delta HCH µg/L 3.0 BDL BDL BDL
VIII. Butachlor µg/L 0.2 BDL BDL BDL
IX. p,p DDT µg/L 0.05 BDL BDL BDL
X. o,p DDT µg/L 100.0 BDL BDL BDL
Page 24
Critically Polluted Areas: Monitoring, sampling, analysis of Stack, Ambient Air Quality, Surface Water, Ground Water, Waste Water
Dombivli 24
Location CETP
Phase I
MIDC
phase 2
Khambal
Pada
Date of Sampling 08.06.18 08.06.18 08.06.18
Sr. Parameters Unit Std.
Limit Results
XI. p,p DDE µg/L 250.0 BDL BDL BDL
XII. o,p DDE µg/L 30.0 BDL BDL BDL
XIII. p,p DDD µg/L BDL BDL BDL
XIV. o,p DDD µg/L BDL BDL BDL
XV. Alpha
Endosulfan µg/L 10.0 BDL BDL BDL
XVI. Beta
Endosulfan µg/L BDL BDL BDL
XVII. Endosulfan
Sulphate µg/L 5.0 BDL BDL BDL
XVIII. Y HCH
(Lindane) µg/L 1.0 BDL BDL BDL
28.
Polynuclear
aromatic
hydrocarbons
(as PAH)
mg/L 0.2 BDL BDL BDL
29. Polychlorinated
Biphenyls
(PCB)
mg/L 2.0 BDL BDL BDL
30. Zinc (as Zn) mg/L 5.0 0.08 BDL BDL
31. Nickel (as Ni) mg/L 3.0 BDL BDL BDL
32. Copper
(as Cu) mg/L 0.032 BDL BDL
33. Hexavalent
Chromium
(as Cr6+)
mg/L 0.1 BDL BDL BDL
34. Total
Chromium
(as Cr)
mg/L 2.0 0.07 0.062 BDL
35. Total Arsenic
(as As) mg/L 0.2 BDL BDL BDL
Page 25
Critically Polluted Areas: Monitoring, sampling, analysis of Stack, Ambient Air Quality, Surface Water, Ground Water, Waste Water
Dombivli 25
Location CETP
Phase I
MIDC
phase 2
Khambal
Pada
Date of Sampling 08.06.18 08.06.18 08.06.18
Sr. Parameters Unit Std.
Limit Results
36. Lead (as Pb) mg/L 0.1 BDL BDL BDL
37. Cadmium
(as Cd) mg/L 2.0 BDL BDL BDL
38. Mercury
(as Hg) mg/L 0.01 BDL BDL BDL
39. Manganese
(as Mn) mg/L 2.0 0.04 0.06 0.06
40. Iron (as Fe) mg/L 3.0 0.69 0.12 0.08
41. Vanadium
(as V) mg/L 0.2 BDL BDL BDL
42. Selenium
(as Se) mg/L 0.05 BDL BDL BDL
43. Boron (as B) mg/L 0.68 BDL BDL
44. Bioassay Test
on fish
%
surviv
al
90%
survival
after 96h
in
100%eff
luent
0 50 100
Page 26
Critically Polluted Areas: Monitoring, sampling, analysis of Stack, Ambient Air Quality, Surface Water, Ground Water, Waste Water
Dombivli 26
Table No. II
Location Metro
Junction
Gandinagar
Nala
CETP
Phase II
Date of Sampling 08.06.18 08.06.18 08.06.18
Sr. Parameters Unit Std.
Limit Results
1. Colour Hazen 2 1 5
2. Smell - Disagreeable Disagreeable Disagreeable
3. pH - 5.5 -9.0 7.36 7.27 7.84
4. Oil & Grease mg/L 10.0 BDL BDL BDL
5. Suspended
Solids mg/L 100.0 18 18 28
6. Dissolved
Oxygen
(% Saturation)
% 5 0 2
7. Chemical
Oxygen
Demand
mg/L 250.0 240 40 400
8.
Biochemical
Oxygen
Demand
(3 days,27o C)
mg/L 30.0 90 15 141
9. Electrical
Conductivity
(at 25o C )
µmho/
cm 702 663 3740
10. Nitrite Nitrogen
(as NO2) mg/L 0.11 0.06 0.11
11. Nitrate
Nitrogen
(as NO3)
mg/L 10.0 10.5 13.1 15.2
12. (NO2 + NO3)-
Nitrogen mg/L 5.0 10.61 13.16 15.31
13. Free Ammonia
(as NH3-N) mg/L 5.0 BDL BDL BDL
14. Total Residual
Chlorine mg/L 1.0 BDL BDL BDL
Page 27
Critically Polluted Areas: Monitoring, sampling, analysis of Stack, Ambient Air Quality, Surface Water, Ground Water, Waste Water
Dombivli 27
Location Metro
Junction
Gandinagar
Nala
CETP
Phase II
Date of Sampling 08.06.18 08.06.18 08.06.18
Sr. Parameters Unit Std.
Limit Results
15. Cyanide
(as CN) mg/L 0.2 BDL BDL BDL
16. Fluoride (as F) mg/L 2.0 0.1 1.16 0.64
17. Sulphide
(as S2-) mg/L 2.0 BDL BDL BDL
18. Dissolved
Phosphate
(as P)
mg/L 5.0 BDL BDL BDL
19. Sodium
Absorption
Ratio
mg/L BDL BDL 0.4
20. Total Coliforms
MPN
index/
100
ml
100.0 13 32 Absent
21. Faecal
Coliforms
MPN
index/
100
ml
1000.0 BDL 6.8 BDL
22. Total
Phosphorous
(as P)
mg/L 1.0 0.1 BDL BDL
23. Total Kjeldahl
Nitrogen
(as TKN)
mg/L 100.0 10.1 13.1 3.08
24. Total Ammonia
(NH4+NH3)-
Nitrogen
mg/L 5.0 4.14 4.64 0.37
25. Phenols
(as C6H5OH) mg/L 3.0 BDL BDL BDL
26. Surface Active
Agents
(as MBAS)
mg/L 3.0 BDL BDL BDL
Page 28
Critically Polluted Areas: Monitoring, sampling, analysis of Stack, Ambient Air Quality, Surface Water, Ground Water, Waste Water
Dombivli 28
Location Metro
Junction
Gandinagar
Nala
CETP
Phase II
Date of Sampling 08.06.18 08.06.18 08.06.18
Sr. Parameters Unit Std.
Limit Results
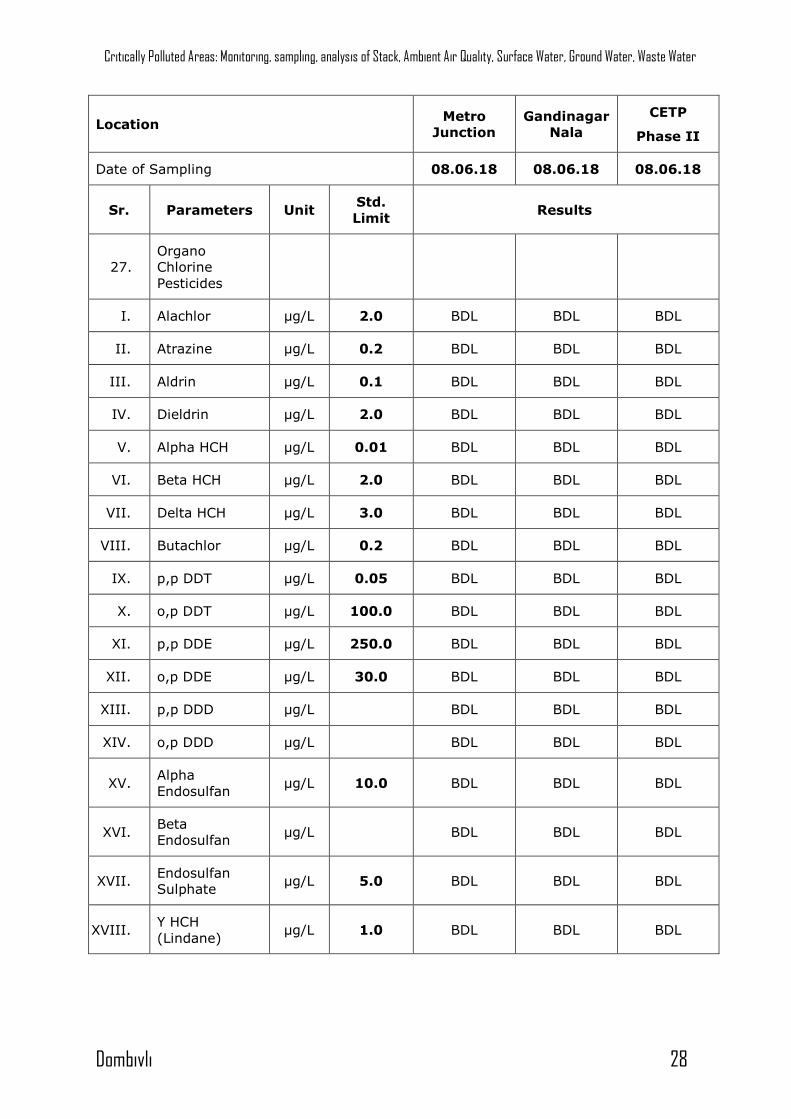
27. Organo
Chlorine
Pesticides
I. Alachlor µg/L 2.0 BDL BDL BDL
II. Atrazine µg/L 0.2 BDL BDL BDL
III. Aldrin µg/L 0.1 BDL BDL BDL
IV. Dieldrin µg/L 2.0 BDL BDL BDL
V. Alpha HCH µg/L 0.01 BDL BDL BDL
VI. Beta HCH µg/L 2.0 BDL BDL BDL
VII. Delta HCH µg/L 3.0 BDL BDL BDL
VIII. Butachlor µg/L 0.2 BDL BDL BDL
IX. p,p DDT µg/L 0.05 BDL BDL BDL
X. o,p DDT µg/L 100.0 BDL BDL BDL
XI. p,p DDE µg/L 250.0 BDL BDL BDL
XII. o,p DDE µg/L 30.0 BDL BDL BDL
XIII. p,p DDD µg/L BDL BDL BDL
XIV. o,p DDD µg/L BDL BDL BDL
XV. Alpha
Endosulfan µg/L 10.0 BDL BDL BDL
XVI. Beta
Endosulfan µg/L BDL BDL BDL
XVII. Endosulfan
Sulphate µg/L 5.0 BDL BDL BDL
XVIII. Y HCH
(Lindane) µg/L 1.0 BDL BDL BDL
Page 29
Critically Polluted Areas: Monitoring, sampling, analysis of Stack, Ambient Air Quality, Surface Water, Ground Water, Waste Water
Dombivli 29
Location Metro
Junction
Gandinagar
Nala
CETP
Phase II
Date of Sampling 08.06.18 08.06.18 08.06.18
Sr. Parameters Unit Std.
Limit Results
28.
Polynuclear
aromatic
hydrocarbons
(as PAH)
mg/L 0.2 BDL BDL BDL
29. Polychlorinated
Biphenyls
(PCB)
mg/L 2.0 BDL BDL BDL
30. Zinc (as Zn) mg/L 5.0 BDL BDL BDL
31. Nickel (as Ni) mg/L 3.0 BDL BDL BDL
32. Copper
(as Cu) mg/L BDL BDL BDL
33. Hexavalent
Chromium
(as Cr6+)
mg/L 0.1 BDL BDL BDL
34. Total
Chromium
(as Cr)
mg/L 2.0 0.181 0.236 0.238
35. Total Arsenic
(as As) mg/L 0.2 BDL BDL BDL
36. Lead (as Pb) mg/L 0.1 BDL BDL BDL
37. Cadmium
(as Cd) mg/L 2.0 BDL BDL BDL
38. Mercury
(as Hg) mg/L 0.01 BDL BDL BDL
39. Manganese
(as Mn) mg/L 2.0 0.055 0.04 0.042
40. Iron (as Fe) mg/L 3.0 0.155 0.127 0.146
41. Vanadium
(as V) mg/L 0.2 BDL BDL BDL
42. Selenium
(as Se) mg/L 0.05 BDL BDL BDL
43. Boron (as B) mg/L BDL BDL BDL
Page 30
Critically Polluted Areas: Monitoring, sampling, analysis of Stack, Ambient Air Quality, Surface Water, Ground Water, Waste Water
Dombivli 30
Location Metro
Junction
Gandinagar
Nala
CETP
Phase II
Date of Sampling 08.06.18 08.06.18 08.06.18
Sr. Parameters Unit Std.
Limit Results
44. Bioassay Test
on fish
%
surviv
al
90%
survival
after 96h
in
100%eff
luent
100 100 100
Graphs: Surface Water/Waste Water Quality Monitoring for Dombivli MIDC:
0
200
400
600
CETP MIDC phase 2, Dombivali
Khambal Pada Metro Junction Gandinagar Nala CETP
Phase I Phase II Phase II Phase II Phase II Phase II
Co
mcen
trati
on
mg
/l
Location
Dombivli Surface Water
Suspended Solids Biochemical Oxygen Demand (3 days,27oC) Chemical Oxygen Demand Nitrite Nitrogen (as NO2)Nitrate Nitrogen (as NO3) (NO2 + NO3)-NitrogenFree Ammonia (as NH3-N) Fluoride (as F)Sodium Absorption Ratio Total Kjeldahl Nitrogen (as N)Total Ammonia (NH4+NH3)-Nitrogen Manganese (as Mn)Iron (as Fe)
Page 31
Critically Polluted Areas: Monitoring, sampling, analysis of Stack, Ambient Air Quality, Surface Water, Ground Water, Waste Water
Dombivli 31
0
1000
2000
3000
4000
5000
6000
7000
8000
CETP MIDC phase 2, Dombivali
Khambal Pada Metro Junction Gandinagar Nala CETP
Phase I Phase II Phase II Phase II Phase II Phase II
Co
ncen
trati
on
µm
ho
/cm
Location
Dombivli Surface Water
Electrical Conductivity (at 25 oC )
0
20
40
60
80
100
120
140
160
CETP MIDC phase 2, Dombivali
Khambal Pada Metro Junction Gandinagar Nala CETP
Phase I Phase II Phase II Phase II Phase II Phase II
Co
ncen
trati
on
MP
N/
In
dex
Location
Dombivli Surface Water
Total Coliforms Faecal Coliforms
Page 32
Critically Polluted Areas: Monitoring, sampling, analysis of Stack, Ambient Air Quality, Surface Water, Ground Water, Waste Water
Dombivli 32
3.4 Ground Water Quality:
Sr. Location Source Phase Table
No.
1. Thakurli Talav (Chole Gaon) Lake Water (talav) Phase I I
2. Gavdevi Talav Well Water Phase I I
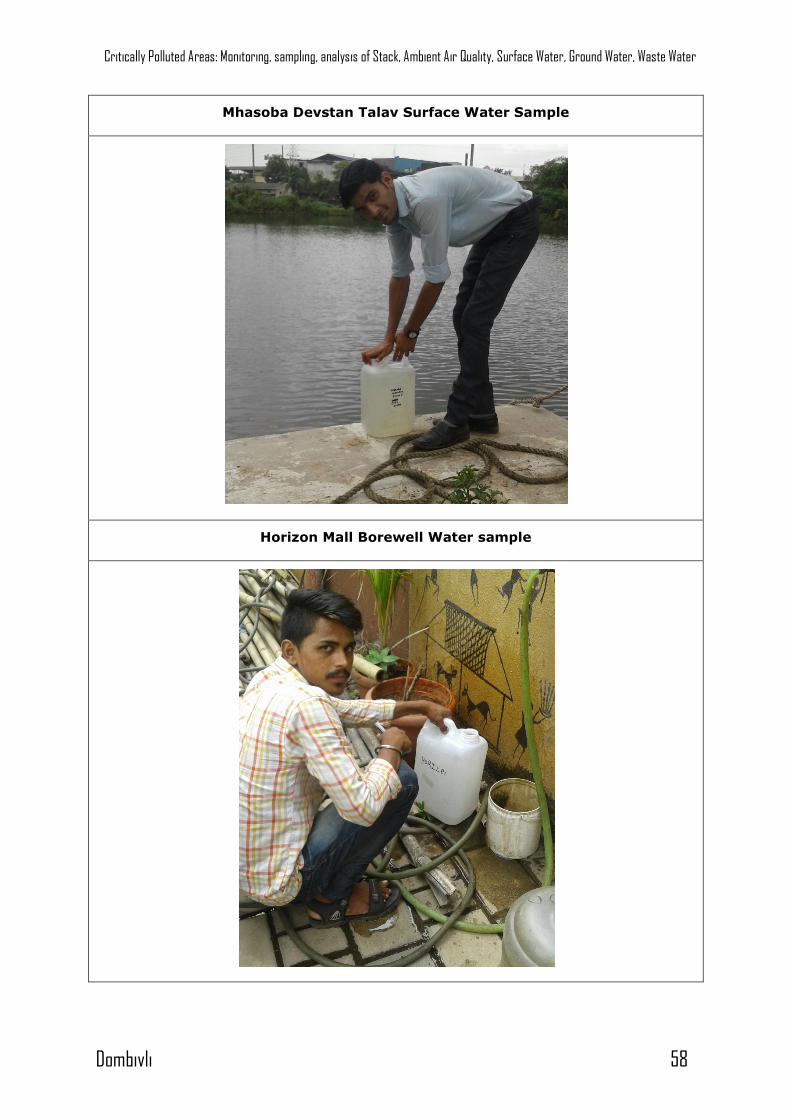
3. Mhasoba Devstan Talav Well Water Phase I I
4. Lodha Vihar Borewell water Phase II II
5. Horizon Mall Borewell water Phase II II
6. Pipleshwar Mandir Borewell water Phase II II
0
20
40
60
80
100
120
MIDC phase 2, Dombivali
Khambal Pada Metro Junction Gandinagar Nala CETP
Phase II Phase II Phase II Phase II Phase II
Co
ncen
trati
on
% s
urviv
al
Location
Dombivli Surface Water
Bioassay Test on fish
Page 33
Critically Polluted Areas: Monitoring, sampling, analysis of Stack, Ambient Air Quality, Surface Water, Ground Water, Waste Water
Dombivli 33
Table No. I
Location
Thakurli
Talav
(Chole
Gaon)
Gavdevi
Talav
Mhasoba
Devstan
Talav
Date of Sampling 08.06.18 08.06.18 08.06.18
Sr. Parameters Unit Std.
Limit Results
1. Colour Hazen 1 1 1
2. Smell - Agreea
ble
Disagreeab
le
Disagreeab
le Agreeable
3. pH - 6.5-8.5 7.5 7.4 8.1
4. Oil & Grease mg/L 100 BDL BDL BDL
5. Suspended
Solids mg/L 500 30 12 40
6. Dissolved
Oxygen
(%Saturation)
% 80 55 80
7. Chemical Oxygen
Demand mg/L
10
(WHO,
1993)
13 13 18
8. Biochemical
Oxygen Demand
(3 days,27oC)
mg/L
6
(WHO,
1993)
5 4 7
9. Electrical
Conductivity
( at 25oC )
µmho/c
m 750 859 2130 777
10. Nitrite Nitrogen
(as NO2) mg/L 7.5 7.4 8.1
11. Nitrate Nitrogen
(as NO3) mg/L 1.0 BDL BDL BDL
12. (NO2 + NO3)-
Nitrogen mg/L 45 30 12 40
13. Free Ammonia
(as NH3-N) mg/L 0.5 80 55 80
14. Total Residual
Chlorine mg/L 0.2 BDL BDL BDL
Page 34
Critically Polluted Areas: Monitoring, sampling, analysis of Stack, Ambient Air Quality, Surface Water, Ground Water, Waste Water
Dombivli 34
Location
Thakurli
Talav
(Chole
Gaon)
Gavdevi
Talav
Mhasoba
Devstan
Talav
Date of Sampling 08.06.18 08.06.18 08.06.18
Sr. Parameters Unit Std.
Limit Results
15. Cyanide (as CN) mg/L 1.5 BDL BDL BDL
16. Fluoride (as F) mg/L 1 0.5 0.33 1.16
17. Sulphide (as S2-) mg/L 0.05 BDL BDL BDL
18. Dissolved
Phosphate (as P) mg/L BDL BDL BDL
19. Sodium
Absorption Ratio mg/L BDL BDL BDL
20. Total Coliforms
MPN
index/
100 ml
ND 34 33 47
21. Faecal Coliforms
MPN
index/
100 ml
ND 6.8 12 17
22. Total
Phosphorous
(as P)
mg/L 0.5 BDL BDL BDL
23. Total Kjeldahl
Nitrogen mg/L 0.001 1.01 0.34 0.5
24. Total Ammonia
(NH4+NH3)-
Nitrogen
mg/L 0.5 0.61 BDL BDL
25. Phenols
(as C6H5OH) mg/L 0.001 BDL BDL BDL
26. Surface Active
Agents
(as MBAS)
mg/L 0.02 BDL BDL BDL
27. Organo Chlorine
Pesticides 0.05
I. Alachlor µg/L 20 BDL BDL BDL
II. Atrazine µg/L 2 BDL BDL BDL
Page 35
Critically Polluted Areas: Monitoring, sampling, analysis of Stack, Ambient Air Quality, Surface Water, Ground Water, Waste Water
Dombivli 35
Location
Thakurli
Talav
(Chole
Gaon)
Gavdevi
Talav
Mhasoba
Devstan
Talav
Date of Sampling 08.06.18 08.06.18 08.06.18
Sr. Parameters Unit Std.
Limit Results
III. Aldrin µg/L 0.03 BDL BDL BDL
IV. Dieldrin µg/L 0.03 BDL BDL BDL
V. Alpha HCH µg/L 0.01 BDL BDL BDL
VI. Beta HCH µg/L 0.04 BDL BDL BDL
VII. Delta HCH µg/L 125 BDL BDL BDL
VIII. Butachlor µg/L 0.04 BDL BDL BDL
IX. p,p DDT µg/L 1 BDL BDL BDL
X. o,p DDT µg/L 1 BDL BDL BDL
XI. p,p DDE µg/L 1 BDL BDL BDL
XII. o,p DDE µg/L 1 BDL BDL BDL
XIII. p,p DDD µg/L 1 BDL BDL BDL
XIV. o,p DDD µg/L 1 BDL BDL BDL
XV. Alpha Endosulfan µg/L 0.4 BDL BDL BDL
XVI. Beta Endosulfan µg/L 0.4 BDL BDL BDL
XVII. Endosulfan
Sulphate µg/L 0.4 BDL BDL BDL
XVIII. Y HCH (Lindane) µg/L 2.0 BDL BDL BDL
28.
Polynuclear
aromatic
hydrocarbons
(as PAH)
mg/L 0.0001 BDL BDL BDL
29. Polychlorinated
Biphenyls (PCB) mg/L 0.0005 BDL BDL BDL
30. Zinc (as Zn) mg/L 5.0 BDL BDL BDL
31. Nickel (as Ni) mg/L 0.02 BDL BDL BDL
Page 36
Critically Polluted Areas: Monitoring, sampling, analysis of Stack, Ambient Air Quality, Surface Water, Ground Water, Waste Water
Dombivli 36
Location
Thakurli
Talav
(Chole
Gaon)
Gavdevi
Talav
Mhasoba
Devstan
Talav
Date of Sampling 08.06.18 08.06.18 08.06.18
Sr. Parameters Unit Std.
Limit Results
32. Copper (as Cu) mg/L 0.05 BDL BDL BDL
33. Hexavalent
Chromium
(as Cr6+)
mg/L 1 BDL BDL BDL
34. Total Chromium
(as Cr) mg/L 0.05 BDL BDL BDL
35. Total Arsenic
(as As) mg/L 0.01 BDL BDL BDL
36. Lead (as Pb) mg/L 0.01 BDL BDL BDL
37. Cadmium
(as Cd) mg/L 0.003 BDL BDL BDL
38. Mercury (as Hg) mg/L 0.001 BDL BDL BDL
39. Manganese
(as Mn) mg/L 0.1 BDL BDL BDL
40. Iron (as Fe) mg/L 0.3 BDL BDL BDL
41. Vanadium (as V) mg/L BDL BDL BDL
42. Selenium (as Se) mg/L 0.01 BDL BDL BDL
43. Boron (as B) mg/L BDL BDL BDL
44. Bioassay Test on
fish
%
survival 100 100 100 100
Page 37
Critically Polluted Areas: Monitoring, sampling, analysis of Stack, Ambient Air Quality, Surface Water, Ground Water, Waste Water
Dombivli 37
Table No. II
Location Lodha
Vihar
Horizon
Mall
Pipleshwar
Mandir
Date of Sampling 08.06.18 08.06.18 08.06.18
Sr. Parameters Unit Std.
Limit Results
1. Colour Hazen 1 1 1
2. Smell - Agreea
ble
Disagreeab
le
Disagreea
ble
Disagreeabl
e
3. pH - 6.5-8.5 7.5 7.26 7.15
4. Oil & Grease mg/L 100 BDL BDL BDL
5. Suspended
Solids mg/L 500 12 24 42
6. Dissolved
Oxygen
(%Saturation)
% 57 30 16
7. Chemical Oxygen
Demand mg/L
10
(WHO,
1993)
5 BDL 11
8. Biochemical
Oxygen Demand
(3 days,27oC)
mg/L
6
(WHO,
1993)
2 BDL 4
9. Electrical
Conductivity
( at 25oC )
µmho/c
m 750 174.3 713 2720
10. Nitrite Nitrogen
(as NO2) mg/L BDL 0.13 BDL
11. Nitrate Nitrogen
(as NO3) mg/L 1.0 3.15 1.5 0.8
12. (NO2 + NO3)-
Nitrogen mg/L 45 3.15 1.63 0.8
13. Free Ammonia
(as NH3-N) mg/L 0.5 BDL BDL BDL
14. Total Residual
Chlorine mg/L 0.2 BDL BDL BDL
15. Cyanide (as CN) mg/L 1.5 BDL BDL BDL
Page 38
Critically Polluted Areas: Monitoring, sampling, analysis of Stack, Ambient Air Quality, Surface Water, Ground Water, Waste Water
Dombivli 38
Location Lodha
Vihar
Horizon
Mall
Pipleshwar
Mandir
Date of Sampling 08.06.18 08.06.18 08.06.18
Sr. Parameters Unit Std.
Limit Results
16. Fluoride (as F) mg/L 1 BDL 0.28 0.62
17. Sulphide (as S2-) mg/L 0.05 BDL BDL BDL
18. Dissolved
Phosphate (as P) mg/L BDL BDL BDL
19. Sodium
Absorption Ratio mg/L BDL BDL BDL
20. Total Coliforms
MPN
index/
100 ml
ND Absent Absent 220
21. Faecal Coliforms
MPN
index/
100 ml
ND BDL BDL 33
22. Total
Phosphorous
(as P)
mg/L 0.5 BDL BDL BDL
23. Total Kjeldahl
Nitrogen mg/L 0.001 0.39 0.34 0.39
24. Total Ammonia
(NH4+NH3)-
Nitrogen
mg/L 0.5 BDL 0.31 BDL
25. Phenols
(as C6H5OH) mg/L 0.001 BDL BDL BDL
26. Surface Active
Agents
(as MBAS)
mg/L 0.02 BDL BDL BDL
27. Organo Chlorine
Pesticides 0.05
I. Alachlor µg/L 20 BDL BDL BDL
II. Atrazine µg/L 2 BDL BDL BDL
III. Aldrin µg/L 0.03 BDL BDL BDL
IV. Dieldrin µg/L 0.03 BDL BDL BDL
Page 39
Critically Polluted Areas: Monitoring, sampling, analysis of Stack, Ambient Air Quality, Surface Water, Ground Water, Waste Water
Dombivli 39
Location Lodha
Vihar
Horizon
Mall
Pipleshwar
Mandir
Date of Sampling 08.06.18 08.06.18 08.06.18
Sr. Parameters Unit Std.
Limit Results
V. Alpha HCH µg/L 0.01 BDL BDL BDL
VI. Beta HCH µg/L 0.04 BDL BDL BDL
VII. Delta HCH µg/L 125 BDL BDL BDL
VIII. Butachlor µg/L 0.04 BDL BDL BDL
IX. p,p DDT µg/L 1 BDL BDL BDL
X. o,p DDT µg/L 1 BDL BDL BDL
XI. p,p DDE µg/L 1 BDL BDL BDL
XII. o,p DDE µg/L 1 BDL BDL BDL
XIII. p,p DDD µg/L 1 BDL BDL BDL
XIV. o,p DDD µg/L 1 BDL BDL BDL
XV. Alpha Endosulfan µg/L 0.4 BDL BDL BDL
XVI. Beta Endosulfan µg/L 0.4 BDL BDL BDL
XVII. Endosulfan
Sulphate µg/L 0.4 BDL BDL BDL
XVIII. Y HCH (Lindane) µg/L 2.0 BDL BDL BDL
28.
Polynuclear
aromatic
hydrocarbons
(as PAH)
mg/L 0.0001 BDL BDL BDL
29. Polychlorinated
Biphenyls (PCB) mg/L 0.0005 BDL BDL BDL
30. Zinc (as Zn) mg/L 5.0 BDL BDL BDL
31. Nickel (as Ni) mg/L 0.02 BDL BDL BDL
32. Copper (as Cu) mg/L 0.05 BDL BDL BDL
33. Hexavalent
Chromium
(as Cr6+)
mg/L 1 BDL BDL BDL
Page 40
Critically Polluted Areas: Monitoring, sampling, analysis of Stack, Ambient Air Quality, Surface Water, Ground Water, Waste Water
Dombivli 40
Location Lodha
Vihar
Horizon
Mall
Pipleshwar
Mandir
Date of Sampling 08.06.18 08.06.18 08.06.18
Sr. Parameters Unit Std.
Limit Results
34. Total Chromium
(as Cr) mg/L 0.05 BDL BDL BDL
35. Total Arsenic
(as As) mg/L 0.01 BDL BDL BDL
36. Lead (as Pb) mg/L 0.01 BDL BDL BDL
37. Cadmium
(as Cd) mg/L 0.003 BDL BDL BDL
38. Mercury (as Hg) mg/L 0.001 BDL BDL BDL
39. Manganese
(as Mn) mg/L 0.1 0.068 BDL 0.328
40. Iron (as Fe) mg/L 0.3 BDL BDL BDL
41. Vanadium (as V) mg/L BDL BDL BDL
42. Selenium (as Se) mg/L 0.01 BDL BDL BDL
43. Boron (as B) mg/L BDL BDL BDL
44. Bioassay Test on
fish
%
survival 100 100 100 100
Page 41
Critically Polluted Areas: Monitoring, sampling, analysis of Stack, Ambient Air Quality, Surface Water, Ground Water, Waste Water
Dombivli 41
Graphs: Ground Water Quality Monitoring for Dombivli MIDC:
0
20
40
60
Thakurli Talav (Chole Gaon)
Gavdevi Talav Mhasoba Devstan Talav
Lodha Vihar Horizon Mall Pipleshwar Mandir
Phase I Phase I Phase I Phase II Phase II Phase II
Co
ncen
trati
on
mg
/L
Location
Dombivli Ground Water
Suspended Solids Chemical Oxygen Demand
Biochemical Oxygen Demand (3 days,27oC) Nitrite Nitrogen (as NO2)
Nitrate Nitrogen (as NO3) (NO2 + NO3)-Nitrogen
Fluoride (as F) Total Kjeldahl Nitrogen
Total Ammonia (NH4+NH3)-Nitrogen Manganese (as Mn)
0
500
1000
1500
2000
2500
3000
Thakurli Talav (Chole Gaon)
Gavdevi Talav Mhasoba Devstan Talav
Lodha Vihar Horizon Mall Pipleshwar Mandir
Phase I Phase I Phase I Phase II Phase II Phase II
Co
ncen
trati
on
µm
ho
s/
cm
Location
Dombivli Ground Water
Electrical Conductivity ( at 25oC )
Page 42
Critically Polluted Areas: Monitoring, sampling, analysis of Stack, Ambient Air Quality, Surface Water, Ground Water, Waste Water
Dombivli 42
0
50
100
150
200
250
Thakurli Talav (Chole Gaon)
Gavdevi Talav Mhasoba Devstan Talav
Lodha Vihar Horizon Mall Pipleshwar Mandir
Phase I Phase I Phase I Phase II Phase II Phase II
Co
ncen
trati
on
MP
N in
dex/
10
0 m
l
Location
Dombivli Ground Water
Total Coliforms Faecal Coliforms
0
20
40
60
80
100
120
Thakurli Talav (Chole Gaon)
Gavdevi Talav Mhasoba Devstan Talav
Lodha Vihar Horizon Mall Pipleshwar Mandir
Phase I Phase I Phase I Phase II Phase II Phase II
Co
ncen
trati
on
% s
urviv
al
Location
Dombivli Ground Water
Bioassay Test on fish
Page 43
Critically Polluted Areas: Monitoring, sampling, analysis of Stack, Ambient Air Quality, Surface Water, Ground Water, Waste Water
Dombivli 43
4. Summary and Conclusion
Based on the study done, the results are summarised and concluded as follows:
4.1 Stack Emission Monitoring:
Six industries from Phase I and six industries from Phase II were selected for Stack
emission monitoring. Also VOC sample of three stack of Phase I and one stack of Phase
II was collected.
1. Particulate matter (PM): All the results obtained are within the standard emission
for the specified industry. The highest range of Particulate matter was observed at
Shree Sainath Dyeing & Printing Pvt. Ltd. with 28 mg/Nm3.
2. Sulphur dioxide (SO2): All industries result of SO2 also was within the limits and
the highest range was observed at Gharda Chemical Ltd. with 13.6 mg/Nm3.
3. Nitrogen dioxide (NO2): The highest level of NO2 was observed at Auchtel Products
Ltd. with 22.2 mg/Nm3 but all the results were observed well within the standard
emission of the specific industry.
4. Hydrogen Chloride (HCL): HCL of all samples collected was also observed well
within the standard emission of the specific industry.
5. VOC: VOC was collected from 4 stacks in the region but VOC was not detectable in
any of the samples.
4.2 Ambient Air Quality Monitoring:
Six ambient air samples was collected from Phase I and six samples was collected from
Phase II of Dombivli region. The parameters monitored were studied as per the NAAQ
standards. The variations of each parameter within the area under study are discussed
below:
1. Sulphur dioxide (SO2): All the locations are observed with very low concentrations
of SO2. The highest level of SO2 was observed at Navjeevan (Parag) Synthetics Pvt
Ltd. with 6.9 µg/m3 which is very much lower than the standard limit of NAAQS i.e.
80 µg/m3.
2. Nitrogen dioxide (NO2): Values of nitrogen dioxide are also observed below the
standard limit of 80 µg/m3 at all the 12 locations. The highest level of NO2 was
observed at CETP R/4/2, MIDC with a result of 8.01 µg/m3.
3. Particulate Matter (PM10): Out of 12 samples, 8 samples in Dombivli region
showed higher level of PM10 concentration than the standard limit of NAAQS. The
level of PM10 emission ranged from 61 µg/m3 at CETP MIDC Phase I to 191 µg/m3 at
KAMA Office.
4. Particulate Matter (PM2.5): All 12 samples in Dombivli region collected for PM2.5
concentration was observed well within the standard limit of NAAQS. The level of
PM2.5 emission ranged from 15 µg/m3 at CETP MIDC Phase I to 48 µg/m3 at KAMA
Office.
5. Ozone (O3): At all 12 locations the level of Ozone was observed below the
detectable limit.
Page 44
Critically Polluted Areas: Monitoring, sampling, analysis of Stack, Ambient Air Quality, Surface Water, Ground Water, Waste Water
Dombivli 44
6. Lead (Pb): At all 12 locations the level of Lead also was observed below the
detectable limit.
7. Carbon Monoxide (CO): Concentration of carbon monoxide has been found to well
within the limits in all 12 locations monitored.
8. Ammonia (NH3), Benzene (C6H6), Benzo(a)pyrene (BaP), Arsenic (As) and
Nickel (Ni) was below the detectable limit in all 12 locations monitored.
4.3 Surface water/ Waste Water Quality Monitoring:
To understand the quality of treated effluent and surface water, samples were collected
from 6 surface water and 2 ETP outlet of Phase I and Phase II Dombivli. Considering the
general parameters of all the industries mentioned following are the conclusions:
1. Colour: Colour units are found in the range of 1 to 5 Hazen unit in 7 water sample
collected.
2. Odour: odour of all the samples is found disagreeable at 7 water samples collected.
3. pH: it is observed in between 7.27 and 7.84 which is well within the range.
4. Suspended Solids: Suspended solids of all 7 water sample is well within the limits
and ranged in between 12 mg/L to 28 mg/l.
5. Chemical Oxygen Demand: Out of all samples collected, only one sample
exceeded the limit required as per standard. The highest COD was observed at CETP
outlet Phase II with 400 mg/L concentration.
6. Biochemical Oxygen Demand: 4 out of the 7 samples collected were exceeding
the limit required as per standard of BOD. The highest BOD was observed at CETP
outlet Phase II with 141 mg/L concentration.
7. Sulphide: All 7 locations had Sulphide concentration lesser than the detectable
range.
8. Total Ammoia: 3 water samples collected had high concentration of Ammonia
ranging in between 5.08 mg/L to 52 mg/L.
9. Total Kjeldahl Nitrogen: All water samples collected had below the detectable limit
of TKN.
10. Fish Bioassay: 100% Survival was attained in 4 water samples collected for
Bioassay test and in one water samples, no fishes survived at all.
11. Heavy metals: All the heavy metals are found below the standard limits in all the
samples.
4.4 Ground Water Quality Monitoring:
Three ground water samples were collected from Phase I and three was collected from
Phase II of Dombivli.
Page 45
Critically Polluted Areas: Monitoring, sampling, analysis of Stack, Ambient Air Quality, Surface Water, Ground Water, Waste Water
Dombivli 45
1) Colour (Hazen Units): Colour units are below the acceptable standard of all water
samples collected.
2) Odour: Odour of 5 samples is found disagreeable in 6 samples collected.
3) Chemical Oxygen Demand: The COD of all 6 samples exceeded and was found in
the range between 28 mg/L to 77 mg/L.
4) Biological Oxygen Demand: BOD of 4 samples has exceeded the standard limit
and was found in the range between 11 mg/L to 18 mg/L.
Following are the parameters which are compared with ISO 10500:2012 Drinking water
specifications.
1) Nitrite: Values of Nitrite are well within the limits in 4 samples collected and it was
below detectable limit in 2 samples collected.
2) Nitrate: Out of 6 samples collected, 5 samples results were beyond the standard
limit and are observed in the range of 1.5 mg/L to 4 mg/L.
3) Residual Free Chlorine: Values are below the acceptable standards.
4) Total Ammonia: Values are below the acceptable standards in 4 samples collected
and at Thakurli Talav Phase 1 and Horizon Mall borewell water the results was
beyond the standard limit with 0.61 mg/L and 0.31 mg/L respectively.
5) Fluoride: Masoba Mandir ground water sample had fluoride content of 1.16 mg/L
remaining all five samples are well within the limits.
6) Sulphide: All the readings of sulphide are observed below the detectable limit.
7) Sodium Absorption Ratio: All the readings of sulphide are observed below the
detectable limit.
8) Total Kjeldahl nitrogen: All 6 water sample collected exceeded the standard limit
of TKN and ranged in between 0.34 mg/L to 1.01 mg/L concentration.
9) Fish Bioassay: At all samples 100% survival was observed.
10) *Boron: Values are below the acceptable standards.
(*CPCB Water Quality criteria for Irrigation, Industrial Cooling & Controlled Waste
disposal).
11) Surface Active Agents: Values are below the acceptable standards.
12) Metals: All the metals except manganese at few locations are observed within
the acceptable limits of drinking water standards.
Page 46
Critically Polluted Areas: Monitoring, sampling, analysis of Stack, Ambient Air Quality, Surface Water, Ground Water, Waste Water
Dombivli 46
5. CEPI Score
Comprehensive Environmental Pollution Index (CEPI) is intended to act as early warning
tool which helps in categorization of industrial clusters/areas in terms of priority of
needing attention.
CPCB had evolved certain methodology to calculate CEPI, in which a score has been
fixed for different environmental components based on the level of pollution. The scoring
system involves an algorithm that takes into account the basic selection criteria. This
approach is based on the basic hazard assessment logic that can be summarized as
below.
Hazard = pollutant source, pathways, and receptor
CPCB has calculated CEPI for the identified critically polluted industrial clusters. It is
calculated separately for air, water, and land. The basic framework and scoring system
of the CEPI – based on three factors namely pollutant, pathway, and receptor – has been
described further under this section.
To overcome the subjectivity, revised concept is proposed by eliminating the subjective
factors as described in the previous section but retaining the factors which can be
measured precisely.
I. Revised concept is prepared by eliminating the debatable factors but retaining
the factors which can be measured precisely.
II. It is decided to develop the Comprehensive Environmental Pollution Index
(CEPI) retaining the existing algorithm of Source, Pathway and Receptor.
III. Health component was also retained in the revised concept in line with the
suggestions of Secretary, MoEFCC during the meeting held in MoEF.
Outlines of revised CEPI 2016 criteria
The outlines of the revised CEPI criteria are as follows:
1. It is proposed to develop the Comprehensive Environmental Pollution Index
(CEPI) based on Sources of pollution, real time observed values of the pollutants
in the ambient air, surface water and ground water in & around the industrial
cluster and health related statistics.
2. For assessment of the environmental quality of the area i.e. CEPI score, the
concept of SNLF i.e. a surrogate number which represents the level of exposure
(a function of percentage sample Exceedance & Exceedance Factor) shall be used.
3. Health component to be evaluated based on the health data available from major
hospitals in the area was also retained in the revised concept.
Page 47
Critically Polluted Areas: Monitoring, sampling, analysis of Stack, Ambient Air Quality, Surface Water, Ground Water, Waste Water
Dombivli 47
The evaluation criterion of the revised CEPI version 2016 is described in the flowchart
given below:
Here, health data collected for Receptor Score C is included in Annexure I
Based on Sub-Index Score (score of individual environmental component like air, water
etc.):
Score more than 63: A Critical Level of Pollution in the respective level of
environmental component
Score between 51-63: Severe to critical level of pollution with reference to
respective environmental component
Cut-off Score
Score 50: Severely Polluted Industrial Clusters/areas
Score 60: Critically Polluted Industrial Clusters/areas
Based on Aggregated CEPI Score (score includes sub-index score of all individual
environmental components together):
Aggregated CEPI score >70: Critically polluted areas
Aggregated CEPI score between 60-70: Severely polluted areas
Page 48
Critically Polluted Areas: Monitoring, sampling, analysis of Stack, Ambient Air Quality, Surface Water, Ground Water, Waste Water
Dombivli 48
Since the inception of the programme, MPCB has also formulated Action Plans to
mitigate the environmental pollution problems for each of the 8 Critically Polluted Areas
(CPAs) in Maharashtra. Based on available information, parameters selected and
monitored in continuation with this, CEPI has been calculated and Short-Term Action
Plan (STAP) as well as Long Term Action Plan (LTAP) was prepared in 2010.
Subsequently NAAQS 2009 came in force. List of parameters to be considered increased
and expanded including more critical and hazardous pollutants like benzene, BaP, Metals,
etc. existing in the environment. There was revision of standards (limiting values) as
well. In this present report of June 2018 prepared by MPCB, CEPI is calculated
considering all these revised standards’ limiting values, list of parameters and complete
scope of monitoring.
5.1 Comparison of CEPI scores:
Below given Table shows aggregated CEPI of present report in comparison with:
1. CEPI score by CPCB in 2009
2. CEPI score 2013
3. CEPI score MPCB 2016
4. CEPI score MPCB February 2017
5. CEPI score MPCB June 2017
Results show that present CEPI score (56.38) of Dombivli considering all revised
standards is lesser than the CEPI Score of February 2018 (64.98) report.
Detailed results of Air, Water and Land are given below:
Air
A1 A2 A B1 B2 B3 B C1 C2 C3 C D CEPI
CEPI score
June 2018
2.6 3.4 8.84 - - - 12.47 - - - 10 15 46.31
CEPI score February 2018
3.8 4.1 15.58 - - - 14.3 - - - 10 15 54.88
CEPI score June 2017
4.3 2.2 9.46 - - - 16.2 - - - 0 15 40.66
CEPI score February 2017
2 5 10 5 4 3 12 4 3 0 12 15 49
CEPI
score 2016
4 2 8 3 2.3 4 9.3 5 2 0 10 10 37.3
Page 49
Critically Polluted Areas: Monitoring, sampling, analysis of Stack, Ambient Air Quality, Surface Water, Ground Water, Waste Water
Dombivli 49
A1 A2 A B1 B2 B3 B C1 C2 C3 C D CEPI
CEPI score 2013
6 5 30 6 0 0 6 5 3 0 15 15 66
CPCB Report 2009
6 5 30 6 0 0 6 5 3 0 15 15 66
Water:
A1 A2 A B1 B2 B3 B C1 C2 C3 C D CEPI
CEPI score June 2018
2 2.9 5.8 - - - 14.8 - - - 10 10 40.6
CEPI score February 2018
2.6 5 13 - - - 15.63 - - - 10 10 48.63
CEPI score June 2017
2 3.6 7.2 - - - 12.89 - - - 5 10 35.09
CEPI score February 2017
2 5 10 8 3.3 0 11.3 5 5 5 30 10 61.3
CEPI score 2016
4 2 8 4 0 6 10 5 4 5 25 10 53
CEPI score 2013
6 5 30 8 0 3 11 5 5 5 30 10 81
CPCB Report 2009
3 5 15 8 0 3 11 5 4.5 5 27 10 63.5
Land:
A1 A2 A B1 B2 B3 B C1 C2 C3 C D CEPI
CEPI score June 2018
3.5 4.2 14.7 - - - 11.5 - - - 10 10 46.2
CEPI score February 2018
4.2 3.2 13.44 - - - 12.6 - - - 10 10 46.04
Page 50
Critically Polluted Areas: Monitoring, sampling, analysis of Stack, Ambient Air Quality, Surface Water, Ground Water, Waste Water
Dombivli 50
A1 A2 A B1 B2 B3 B C1 C2 C3 C D CEPI
CEPI score June 2017
3.6 4.7 16.69 - - - 11.47 - - - 5 10 43.39
CEPI score February 2017
2 5 10 7.5 1.3 0 8.8 5 4 5 25 10 53.8
CEPI score 2016
3 2 6 4 0 4.1 8.1 5 2 4 27 10 38.1
CEPI score 2013
4 5 20 7.75 1.5 3 12.25 5 4.75 5 28.75 10 71
CPCB Report 2009
3 5 15 8 1.5 3 12.5 5 3 5 20 10 57.5
Aggregated CEPI:
Air Index Water Index Land Index CEPI
CEPI score
June 2018 46.31 40.6 46.2 56.38
CEPI score
February 2018 54.88 48.63 46.04 64.98
CEPI score
June 2017 40.66 35.09 43.39 49.69
CEPI score
February 2017 49 61.3 53.8 65.82
CEPI score
2016 37.3 53 38.1 49.96
CEPI score
2013 66 81 71 89.90
CPCB Report
2009 66 63.5 57.5 78.41
Page 51
Critically Polluted Areas: Monitoring, sampling, analysis of Stack, Ambient Air Quality, Surface Water, Ground Water, Waste Water
Dombivli 51
6. Conclusion
Dombivli is an important industrial area of the state having an industrial zone lying on
the eastern side of the Mumbai highway. It is well known place for its rapid industrial
growth having major industries such as dye’s, paints, chemicals and heavy metal
factories. Some of the popular industries of Dombivli include Vicco Labs, Gharda
Chemicals, Deepak fertilizers, Lloyd Steel etc. The Present study has been done
according to the revised CEPI Version 2016. It has been an attempt to check the
characteristics and status of environment among the different industrial clusters of
Dombivli city.
For identification of the source of pollutants, we have analysed stack emission
monitoring of 12 stacks in the Dombivli region. All parameters monitored were well
within the standard limit and VOCs was not detectable in any samples monitored.
For the study of Air Environment, 12 ambient air samples were collected from different
locations in the region. The concentration of PM10 was high at 8 locations sampled. The
main reason for the increase in the concentration of Particulate matter is the increase in
traffic and industrial activities. Dust suppression techniques have been suggested to be
carried out by industries. All other parameters were well within the limit in all locations
monitored.
To understand the quality of treated effluent and surface water, samples were collected
from 6 surface water and 2 ETP outlet of Phase I and Phase II Dombivli. Parameters like
Chemical Oxygen Demand, Biological oxygen demand, and Ammonia was found to have
exceeded the limit of surface water characteristics. We have informed the respective
industry about the same and actions are taken for improving the quality of treated waste
water before disposal.
For carrying out a study on the Land Environment, six ground water samples are
collected. Chemical Oxygen Demand, Biological oxygen demand, Nitrate, Total Ammonia,
Fluoride and Total Kjeldahl Nitrogen was found in higher concentration in many of the
samples collected. The ground water collected is from Borewell and is not used for
drinking purpose.
The State Pollution Control Board and Regional Office of SPCB are continuously initiating
action against industries for reducing and controlling the pollution caused due the
industries. Many industries were issued with closure direction and show cause notice for
emission control. Regular compliance of industries is monitored by Board officials for
maintain the pollution reduced due to the implementation of action plan.
A1 A2 A B C D CEPI
Air Index 2.6 3.4 8.84 12.47 10 15 46.31
Water
Index 2 2.9 5.8 14.8 10 10 40.6
Land
Index 3.5 4.2 14.7 11.5 10 10 46.2
Aggregated CEPI 56.38
Page 52
Critically Polluted Areas: Monitoring, sampling, analysis of Stack, Ambient Air Quality, Surface Water, Ground Water, Waste Water
Dombivli 52
7. Efforts taken for the reduction in pollution:
The regional office of Maharashtra pollution control board has taken various initiatives in
reducing the CEPI Score of 89.90 of 2013 to 56.38 of 2018. Below mentioned are some
of the efforts:
• CETP has carried performance evaluation study. On the basis of analysis report
and visit, the Board has issued directions for the up gradation of CETP.
• Based on the performance evaluation of air pollution control measures in the
industrial units, Board had issued 32 closer direction & 26 show cause notice to
industry and regular compliance is monitored by Board officials.
• All industries are member of CHWTSDF & regular collection and transportation is
done by CHWTSDF, Taloja. Also regular monitoring carried out by MPCB.
• For awareness of Environment pollution reduction, seminar on zero discharge
from textile industry, seminar on Emission Trading Scheme etc. was carried out
by Regional offices of MPCB.
• Installation of CAAQM stations and online display of AQQM data work is in
process.
Page 53
Critically Polluted Areas: Monitoring, sampling, analysis of Stack, Ambient Air Quality, Surface Water, Ground Water, Waste Water
Dombivli 53
8. Photographs
Shri Mahabir Dyeing & Printing Mills Pvt. Ltd. Stack Emission Monitoring
Page 54
Critically Polluted Areas: Monitoring, sampling, analysis of Stack, Ambient Air Quality, Surface Water, Ground Water, Waste Water
Dombivli 54
BKT C-21 Ambient Air Monitoring
CETP MIDC Phase I Ambient Air Monitoring
Page 55
Critically Polluted Areas: Monitoring, sampling, analysis of Stack, Ambient Air Quality, Surface Water, Ground Water, Waste Water
Dombivli 55
CETP MIDC Phase II Ambient Air Monitoring
Kalyan Ambernath Manufacture Association Ambient Air Monitoring
Page 56
Critically Polluted Areas: Monitoring, sampling, analysis of Stack, Ambient Air Quality, Surface Water, Ground Water, Waste Water
Dombivli 56
MIDC Sump Near W226 Ambient Air Monitoring
Navjeevan (Parag) Synthetics Pvt. Ltd. Ambient Air Monitoring
Page 57
Critically Polluted Areas: Monitoring, sampling, analysis of Stack, Ambient Air Quality, Surface Water, Ground Water, Waste Water
Dombivli 57
R. R. Hospital Ambient Air Monitoring
VNS Industries Pvt. Ltd. Ambient Air Monitoring
Page 58
Critically Polluted Areas: Monitoring, sampling, analysis of Stack, Ambient Air Quality, Surface Water, Ground Water, Waste Water
Dombivli 58
Mhasoba Devstan Talav Surface Water Sample
Horizon Mall Borewell Water sample
Page 59
Critically Polluted Areas: Monitoring, sampling, analysis of Stack, Ambient Air Quality, Surface Water, Ground Water, Waste Water
Dombivli 59
9. References
1) Criteria for Comprehensive Environmental Assessment of Industrial Clusters,
December 2009, CPCB, EIAS/4/2009-10
2) Comprehensive Environmental Assessment of Industrial Clusters, December
2009, CPCB, EIAS/5/2009-10
3) Action Plan for Industrial Cluster: Chandrapur, November 2010, MPCB
4) Action Plan for Industrial Cluster: Dombivli, November 2010, MPCB
5) Action Plan for Industrial Cluster: Aurangabad, November 2010, MPCB
6) Action Plan for Industrial Cluster: Navi Mumbai, November 2010, MPCB
7) Action Plan for Industrial Cluster: Navi Mumbai, November 2010, MPCB
8) Standard Methods for the Examination of Water and Waste Water, American
Public Health Association, 22nd Edition, 2012.
9) IS 3025 (various parts)
10) www.mpcb.gov.in
11) www.cpcb.gov.in
Page 60
Critically Polluted Areas: Monitoring, sampling, analysis of Stack, Ambient Air Quality, Surface Water, Ground Water, Waste Water
Dombivli 60
10. Annexure
Annexure I Health related data in impact on humans
C: Receptor
Component C
(Impact on Human Health)
10
Main - 10
% increase in cases Marks
<5% 0
5-10% 5
>10% 10
• % increase is evaluated based on the total no. of cases recorded during two
consecutive years.
• For Air Environment, total no. of cases related to Asthma, Bronchitis, Cancer,
Acute respiratory infections etc. are to be considered.
• For surface water/ ground water Environment, cases related to Gastroenteritis,
Diarrhoea, renal (kidney) malfunction, cancer etc are to be considered.
• For the above evaluation, the previous 5 years records of 3-5 major hospitals of
the area shall be considered.
Attached below health data collected for the region
Page 61
Diseases caused by Air pollution Diseases caused by Water pollution
Name of Hospital Year Asthma Bronchitis Pulmonary
cancer Mesothelioma (lung cancer)
Acute respiratory infections
Gastroenteritis Typhoid Diarrhea
Liver damage and even cancer (due to
presence of
chlorinated solvents in
the polluted
water)
Kidney damage
(because of
various
harmful
chemicals present in
the polluted
water)
Mamata Hospital
2016 3 1 0 0 9 31 1 0 11 6
2017 6 0 0 0 3 9 0 1 4 4
2018 2 0 0 0 5 3 1 2 0 1
Page 62
Diseases caused by Air pollution
Name of Hospital Year Asthma Bronchitis Pulmonary
cancer
Hambarde Hospital
2016 20 7 0
2017 6 2 0
2018 5 3 0
Diseases caused by Air pollution Diseases caused by Water pollution
Pulmonary cancer
Mesothelioma (lung cancer)
Acute respiratory infections
Gastroenteritis Typhoid Diarrhea
0 2 4.5 3
0 0 32 1
0 0 17 0
Diseases caused by Water pollution
Diarrhea
Liver damage and even cancer (due to
presence of
chlorinated
solvents in
the polluted
water)
Kidney damage
(because of
various
harmful chemicals
present in
the polluted
water)
2 0 0
1 0 0
2 0 0
Page 63
Diseases caused by Air pollution Diseases caused by Water pollution
Name of Hospital Year Asthma Bronchitis Pulmonary
cancer Mesothelioma (lung cancer)
Acute respiratory infections
Gastroenteritis Typhoid Diarrhea
Liver damage and even cancer (due to
presence of
chlorinated solvents in
the polluted
water)
Kidney damage
(because of
various
harmful
chemicals present in
the polluted
water)
Municipal Hospital
2016 5 27 0 0 3 65 109 240 0
2017 6 10 0 0 3 50 24 90 0 0
2018 3 7 0 0 0 22 11 4 0 0
Page 64
Critically Polluted Areas: Monitoring, sampling, analysis of Stack, Ambient Air Quality, Surface Water, Ground Water, Waste Water
Dombivli 61
Annexure II: Stack Emission Sampling and Analysis Methodology
Sr. Parameters Method References Techniques Detection
Limit
1.
Acid Mist
(as Sulphuric
Acid)
US EPA Method no.m-8 Barium thorine
titration Method 0.6 mg/Nm3
2. Ammonia
IS 11255 (Part
6):1999, Reaffirmed
2003
Titration/Nessler
Reagent /
Spectrophotometric
Method
1 mg/Nm3
3. Carbon Monoxide USEPA Method 10B GC-FID Method 0.2 mg/Nm3
4. Chlorine US EPA Method 26 for
sampling Titrimetric 0.001 mg/Nm3
5. Fluoride
(Gaseous) US EPA Method 13 A
SPADNS Zirconium
Lake
Spectrophotometric
Method
0.025 mg/Nm3
6. Fluoride
(Particulate) US EPA Method 13 A
SPADNS Zirconium
Lake
Spectrophotometric
Method
0.005 mg/Nm3
7. Hydrogen
Chloride
US EPA Method 26 for
sampling Titrimetric 0.25 mg/Nm3
8. Hydrogen
Sulphide
IS 11255
(Part 4):1985 Titrimetric 1 mg/Nm3
9. Oxides of
Nitrogen
IS 11255 (Part 7):
2005
PDSA Colorimetric
Method 10 mg/Nm3
10. Oxygen IS 13270 : 1992 ORSAT Apparatus 1 %
11.
Poly Aromatic
Hydrocarbons
(Particulate)
IS 5182 (Part 12) :
2004, Reaffirmed 2009
CPCB Guidelines, May
2011, Page No.39
GC-FID Method 0.25 mg/Nm3
12.
Suspended
Particulate
Matter
IS 11255
(Part 1):1985,
Reaffirmed 2003
Gravimetric Method 10 mg/Nm3
13. Sulphur Dioxide IS 11255 (Part 2):
1985, Reaffirmed 2003
Titrimetric IPA
thorine Method
5.0mg/Nm3
0.02kg/day
Page 65
Critically Polluted Areas: Monitoring, sampling, analysis of Stack, Ambient Air Quality, Surface Water, Ground Water, Waste Water
Dombivli 62
Sr. Parameters Method References Techniques Detection
Limit
14. BTX (Benzene,
Toluene, Xylene) NIOSH (NMAM) 1501
Adsorption and
Desorption followed
by GC-FID analysis
0.001 mg/Nm3
15.
VOC (Volatile
Organic
Compounds)
NIOSH (NMAM) 1501
for sampling
Adsorption and
Desorption followed
by GC-FID or
GC/MS analysis
-
i
Methyl Isobutyl
Ketone - - 0.001 mg/Nm3
ii Benzene - - 0.001 mg/Nm3
iii Toluene - - 0.001 mg/Nm3
iv Xylene - - 0.001 mg/Nm3
v Ethyl Benzene - - 0.001 mg/Nm3
vi Ethyl Acetate - - 0.001 mg/Nm3
Page 66
Critically Polluted Areas: Monitoring, sampling, analysis of Stack, Ambient Air Quality, Surface Water, Ground Water, Waste Water
Dombivli 63
Annexure III: Ambient Air Sampling and Analysis Methodology
Sr. Parameters Method References Techniques Detection
Limit
1. Sulphur Dioxide
(SO2)
CPCB Guidelines for the
Measurement of Ambient
Air Pollutants, Volume I,
May 2011, Page No.1
Improved West &
Gaeke Method 4 µg/m3
2. Nitrogen Dioxide
(NO2)
CPCB Guidelines for the
Measurement of Ambient
Air Pollutants, Volume I,
May 2011, Page No.7
Modified Jacob &
Hochheiser
Method
3 µg/m3
3.
Particulate Matter
(size less than 10
µm) or PM10
CPCB Guidelines for the
Measurement of Ambient
Air Pollutants, Volume I,
May 2011, Page No.11
Gravimetric
Method 2 µg/m3
4.
Particulate Matter
(size less than 2.5
µm) or PM2.5
CPCB Guidelines for the
Measurement of Ambient
Air Pollutants, Volume I,
May 2011, Page No. 15
Gravimetric
Method 0.4 µg/m3
5. Ozone (O3) APHA, Method No. 820,
Page no. 836 Chemical Method 19.6 µg/m3
6. Lead (Pb)
CPCB Guidelines for the
Measurement of Ambient
Air Pollutants, Volume I,
May 2011, Page No. 47
AAS Method 0.02 µg/m3
7. Carbon Monoxide
(CO)
CPCB Guidelines for the
Measurement of Ambient
Air Pollutants, Volume II,
May 2011, Page No. 16
Non Dispersive
Infra Red (NDIR)
spectroscopy
0.05 mg/m3
8. Ammonia (NH3)
CPCB Guidelines for the
Measurement of Ambient
Air Pollutants, Volume I,
May 2011, Page No. 35
Indophenol Blue
Method 4.0µg/m3
9. Benzene (C6H6) IS 5182 (Part 11):2006
Adsorption and
Desorption
followed by GC-
FID analysis
1.0 µg/m3
10.
Benzo (a) Pyrene
(BaP) – particulate
phase only,
CPCB Guidelines for the
Measurement of Ambient
Air Pollutants, Volume I,
May 2011, Page No. 39
Solvent
extraction
followed by GC-
FID analysis
0.2 ng/m3
Page 67
Critically Polluted Areas: Monitoring, sampling, analysis of Stack, Ambient Air Quality, Surface Water, Ground Water, Waste Water
Dombivli 64
Sr. Parameters Method References Techniques Detection
Limit
11. Arsenic (As)
CPCB Guidelines for the
Measurement of Ambient
Air Pollutants, Volume I,
May 2011, Page No. 47
AAS Method 0.3ng/m3
12. Nickel (Ni)
CPCB Guidelines for the
Measurement of Ambient
Air Pollutants, Volume I,
May 2011, Page No. 47
AAS Method 3.0ng/m3
Page 68
Critically Polluted Areas: Monitoring, sampling, analysis of Stack, Ambient Air Quality, Surface Water, Ground Water, Waste Water
Dombivli 65
Annexure IV: Water/Wastewater Sampling and Analysis Methodology
Sr. Parameters Methods
References Techniques
Detection
Limit
1.
Sampling
Procedure for
Chemical
Parameters
IS 3025 (Part 1):
1987, Reaffirmed
1998, Amds.1&
APHA, 22nd Ed.,
2012, 1060 B, 1-39
- -
2.
Sampling
Procedure for
Microbiological
Parameters
APHA, 22nd Ed.,
2012,1060 B, 1-39,
9040, 9-17, and
9060B, 9-35
- -
3. Temperature APHA, 22nd Ed.,
2012, 2550-B, 2-69 By Thermometer -
4. Colour APHA, 22nd Ed.,
2012, 2120-B, 2-26
Visible Comparison
Method
1 Hazen
Unit
5. Odour
IS 3025 (Part 5):
1983, Reaffirmed
2006
Qualitative Method -
6. pH
APHA, 22nd Ed.,
2012, 4500-H+- B,
4-92
By pH Meter 1
7. Oil & Grease APHA, 22nd Ed.,
2012, 5520-B, 5-40
Liquid -liquid Partition-
Gravimetric Method 1.0 mg/L
8. Suspended Solids
IS 3025 (Part 17):
1984, Reaffirmed
2006, Amds.1
Filtration /Gravimetric
Method 5.0 mg/L
9. Dissolved Oxygen
IS 3025 (Part 38):
1989, Reaffirmed
2009
Iodometric Method-Azide
modification 0.05 mg/L
10. Chemical Oxygen
Demand
APHA, 22nd Ed.,
2012, 5220-B, 5-17 Open Reflux Method 5.0 mg/L
11. Biochemical
Oxygen Demand
IS 3025 ( Part 44):
1993, Reaffirmed
2009, Amds.1
Iodometric Method 5.0 mg/L
12. Electrical
Conductivity
APHA, 22nd Ed.,
2012, 2510- B, 2-54 By Conductivity Meter
0.1
µmho/cm
13. Nitrite-Nitrogen
APHA, 22nd Ed.,
2012, 4500-NO2-B,
4-120
Colorimetric Method 0.006 mg/L
Page 69
Critically Polluted Areas: Monitoring, sampling, analysis of Stack, Ambient Air Quality, Surface Water, Ground Water, Waste Water
Dombivli 66
Sr. Parameters Methods
References Techniques
Detection
Limit
14. Nitrate-Nitrogen
APHA,22nd Ed.,
2012, 4500-NO3, B-
4-122
UV Spectrophotometer
Screening Method 0.2 mg/L
15. (NO2 + NO3)-
Nitrogen
APHA, 22nd Ed., 2012,
4500-NO2-B, 4-120
APHA, 22nd Ed., 2012,
4500-NO3, B-4-122
Colorimetric Method
V Spectrophotometer
Screening Method
0.2 mg/L
16. Free Ammonia
APHA, 22nd Ed.,
2012 , 4500 NH3, F,
4 -115
Colorimetric Method 0.006 mg/L
17. Total Residual
Chlorine
IS 3025 (Part 26)
:1986 , Reaffirmed
2009, Ed. 2.1 (2004-
02)
Iodometric Method 0.1 mg/L
18. Cyanide (CN)
APHA, 22nd Ed.,
2012 ,4500-CN, C &
E, 4-41 & 4-43
Colorimetric Method 0.001 mg/L
19. Fluoride (F)
APHA, 22nd Ed.,
2012, 4500-F-, D, 4-
87
SPADNS Method
0.05 mg/L
20. Sulphide (S2-)
APHA, 22nd Ed.,
2012, 4500 –S2 , C-
4-175, F-4-178
IodometricMethod 0.08 mg/L
21. Dissolved
Phosphate (P)
APHA,22nd Ed.,
2012 , 4500 P,E, 4-
155
Ascorbic Acid Method 0.03 mg/L
22. Sodium
Absorption Ratio
IS11624 :1986,
Reaffirmed 2006 By Calculation 0.3
23. Total Phosphorous
(P)
APHA,22nd Ed.,
2012 , 4500 P,E, 4-
155
Ascorbic Acid Method 0.03 mg/L
24. Total Kjeldahl
Nitrogen
APHA, 22nd Ed., 2012,
4500 NH3, B & C, 4 -
110, 4-112
Titrimetric Method 0.1 mg/L
25. Total Ammonia
(NH4 +NH3)-
Nitrogen
APHA,22d Ed., 2012
, 4500 NH3, F, 4 -
115
Colorimetric Method 0.001 mg/L
26. Phenols (C6H5OH)
APHA,22nd Ed.,
2012 , 5530- B & C,
5-44 & 5-47
Chloroform Extraction
Method 0.001 mg/L
Page 70
Critically Polluted Areas: Monitoring, sampling, analysis of Stack, Ambient Air Quality, Surface Water, Ground Water, Waste Water
Dombivli 67
Sr. Parameters Methods
References Techniques
Detection
Limit
27. Surface Active
Agents
APHA,22nd Ed.,
2012, 5540-B & C,5-
50
Methylene Blue
Extraction Method 0.1 mg/L
28. Organo Chlorine
Pesticides
APHA, 22nd Ed.,
2012,6410B,6-74 GC MS-MS Method 0.01 µg/L
29.
Polynuclear
aromatic
hydrocarbons
(PAH)
APHA, 22nd Ed.,
2012,6410B,6-74 GC MS-MS Method 0.01 µg/L
30. Polychlorinated
Biphenyls (PCB)
APHA, 22nd Ed.,
2012,6410B,6-74 GC MS-MS Method 0.01 µg/L
31. Zinc (Zn) IS 3025(Part 2):
2004 ICP Method 0.1 mg/L
32. Nickel (Ni) IS 3025(Part 2):
2004 ICP Method 0.05 mg/L
33. Copper (Cu) IS 3025(Part 2):
2004 ICP Method 0.03 mg/L
34. Hexavalent
Chromium (Cr6+)
APHA, 22ndEd.,
2012,3500-Cr,B,3-
69
Colorimetric Method 0.02 mg/L
35. Total Chromium
(Cr)
IS 3025(Part 2):
2004 ICP Method 0.02 mg/L
36. Total Arsenic (As) IS 3025(Part 2):
2004 ICP Method 0.005 mg/L
37. Lead (Pb) IS 3025(Part 2):
2004 ICP Method 0.008 mg/L
38. Cadmium (Cd) IS 3025(Part 2):
2004 ICP Method 0.002 mg/L
39. Mercury (Hg) IS 3025(Part 2):
2004 ICP Method
0.0008
mg/L
40. Manganese (Mn) IS 3025(Part 2):
2004 ICP Method 0.02 mg/L
41. Iron (Fe) IS 3025(Part 2):
2004 ICP Method 0.06 mg/L
42. Vanadium (V) IS 3025(Part 2):
2004 ICP Method 0.05 mg/L
Page 71
Critically Polluted Areas: Monitoring, sampling, analysis of Stack, Ambient Air Quality, Surface Water, Ground Water, Waste Water
Dombivli 68
Sr. Parameters Methods
References Techniques
Detection
Limit
43. Selenium (Se) IS 3025(Part 2):
2004 ICP Method 0.005 mg/L
44. Boron (B) IS 3025(Part 2):
2004 ICP Method 0.1 mg/L
45. Total Coliforms APHA, 22nd Ed.,
2012,9221-B, 9-66
Multiple tube
fermentation technique
(MPN/100ml)
1.1
MPN/100ml
46. Faecal Coliforms APHA, 22nd Ed.,
2012,9221-E, 9-74
Multiple tube
fermentation technique
(MPN/100ml)
1.1
MPN/100ml
47. Bioassay (Zebra
Fish) Test
IS 6582, 1971,
Reaffirmed 1987 Static Technique -
Page 72
Critically Polluted Areas: Monitoring, sampling, analysis of Stack, Ambient Air Quality, Surface Water, Ground Water, Waste Water
Dombivli 69
Annexure V: National Ambient Air Quality Standards, 2009
Page 73
Critically Polluted Areas: Monitoring, sampling, analysis of Stack, Ambient Air Quality, Surface Water, Ground Water, Waste Water
Dombivli 70
Annexure VI: General Standards for Discharge of Environmental Pollutants,
Part A: Effluents (The Environment (Protection) Rules, 1986, Schedule VI)
Sr. Parameter
Standards
Inland
surface
Water
Public
Sewers
Land for
Irrigation
Marine
Coastal
Areas
1. Colour and Odour See Note 1 -- See Note I See Note 1
2. Suspended solids,
mg/L, Max.
100 600 200 a. For
process
waste
water -
100
b. For
cooling
water
effluent-
10 percent
above
total
suspended
mailer of
influent
cooling
water.
3. Particle size of
suspended solids
Shall pass
850
micron IS
Sieve
a. Floatable
solids,
Max 3 mm
b. Settleable
solids Max
850
microns
4. Dissolved solids
(Inorganic),
mg/L, Max.
2100 2100 2100 --
5. pH value 5.5 -9.0 5.5 -9.0 5.5 -9.0 5.5-9.0
Page 74
Critically Polluted Areas: Monitoring, sampling, analysis of Stack, Ambient Air Quality, Surface Water, Ground Water, Waste Water
Dombivli 71
Sr. Parameter
Standards
Inland
surface
Water
Public
Sewers
Land for
Irrigation
Marine
Coastal
Areas
6.
Temperature °C,
Max
Shall not
exceed 40 in
any section
of the
stream
within 15
mts.
Downstream
from the
effluent
outlet
45 at the
point of
discharge
-- 45 at the
point of
discharge
7. Oil and Grease,
mg/L, Max
10 20 10 20
8., Total Residual
chlorine, mg/L,
Max
1.0 -- -- 1.0
9. Ammonical
Nitrogen (as N),
mg/L, Max
50 50 -- 50
10. Total Kjeldahl
Nitrogen (as N),
mg/L, Max.
100 -- -- 100
11. Free Ammonia
(as NH3), mg/L,
Max
5.0 -- -- 5.0
12. Biochemical
oxygen demand
(5 days, at 20° c)
mg/L, Max
30 350 100 100
13. Chemical oxygen
demand, mg/L,
Max
250 -- -- 250
14. Arsenic (as As),
mg/l, Max
0.2 0.2 0.2 0.2
15. Mercury (as Hg).
Mg/L, Max
0.01 0.01 -- 0.01
16. Lead (as Pb),
mg/L, Max
0.1 1.0 - 1.0
Page 75
Critically Polluted Areas: Monitoring, sampling, analysis of Stack, Ambient Air Quality, Surface Water, Ground Water, Waste Water
Dombivli 72
Sr. Parameter
Standards
Inland
surface
Water
Public
Sewers
Land for
Irrigation
Marine
Coastal
Areas
17. Cadmium (as Cd),
mg/L,
2.0 1.0 -- 2.0
18. Hexavalent
Chromium
(as Cr+6) mg/L,
Max
.1 2.0 -- 1.0
19. Total Chromium
(as Cr), mg/L,
Max
2.0 2.0 -- 2.0
20. Copper (as Cu),
mg/L, Max.
3.0 3.0 -- 3.0
21. Zinc (as Zn),
mg/L, Max.
5.0 15 0-- 15
22 Selenium (as Se),
mg/l, Max.
0.05 0.05 -- 0.05
23 Nickel (as Ni),
mg/l, Max.
3.0 3.0 -- 5.0
24 Boron (as B),
mg/l, Max.
2.0 2.0 2.0 --
25. Percent Sodium,
Max.
-- 60 60 --
26. Residual Sodium
carbonate, mg/l,
Max.
-- -- 5.0 --
27. Cyanide (as Cn),
mg/L, Max.
0.2 2.0 0.2 0.2
28. Chloride (as Cl),
mg/L, Max.
1000 1000 600 --
29. Fluoride (as F),
mg/IL, Max.
2.0 15 -- 15
30. Dissolved
Phosphate (as P),
mg/L, Max.
5.0 -- -- --
Page 76
Critically Polluted Areas: Monitoring, sampling, analysis of Stack, Ambient Air Quality, Surface Water, Ground Water, Waste Water
Dombivli 73
Sr. Parameter
Standards
Inland
surface
Water
Public
Sewers
Land for
Irrigation
Marine
Coastal
Areas
31. Sulphate
(as SO4), mg/L,
Max.
1000 1000 1000 --
32. Sulphide (as S),
mg/L, Max.
2.0 -- -- 5.0
33. Pesticides Absent Absent Absent Absent
34. Phenolic
compounds
(as C6H5OH),
mg/L, Max.
1.0 5.0 -- 5.0
35. Radioactive
materials:
a. Alpha emitters
MC/ml., Max.
10-7 10-7 10-8 10-7
b. Beta emitters
µc/ml., Max
10-6 10-6 10-7 10-6
Page 77
Critically Polluted Areas: Monitoring, sampling, analysis of Stack, Ambient Air Quality, Surface Water, Ground Water, Waste Water
Dombivli 74
Annexure VII: Drinking Water Specification-IS 10500:2012
Sr. Characteristic Unit
Requirement
(Acceptable
Limit)
Permissible
Limit in the
Absence of
Alternate
Source
Table 1 Organoleptic and Physical
Parameters
1. Colour Hazen
units
Max 5 Max 15
2. Odour - Agreeable Agreeable
3. pH value - 6.5-8.5 No relaxation
4. Taste - Agreeable Agreeable
5. Turbidity NTU Max 1 Max 5
6. Total dissolved solids mg/L Max 500 Max 2000
Table 2 General parameters
concerning substances
undesirable in excessive
amounts
7. Aluminium (as Al) mg/L Max 0.03 Max 0.2
8. Ammonia
(as total ammonia- N)
mg/L Max 0.5 No relaxation
9. Anionic detergents (as MBAS) mg/L Max 0.2 Max 1.0
10. Barium (as Ba) mg/L Max 0.7 No relaxation
11. Boron (as B) mg/L Max 0.5 Max 1.0
12. Calcium (as Ca) mg/L Max 75 Max 200
13. Chloramines (as C12) mg/L Max 4.0 No relaxation
14. Chlorides (as Cl) mg/L Max 250 Max 1000
15. Copper (as Cu) mg/L Max 0.05 Max 1.5
16. Fluoride (as F) mg/L Max 1.0 Max 1.5
17. Free residual chlorine mg/L Min 0.2 Min 1
Page 78
Critically Polluted Areas: Monitoring, sampling, analysis of Stack, Ambient Air Quality, Surface Water, Ground Water, Waste Water
Dombivli 75
Sr. Characteristic Unit
Requirement
(Acceptable
Limit)
Permissible
Limit in the
Absence of
Alternate
Source
18. Iron (as Fe) mg/L Max 0.3 No relaxation
19. Magnesium (as Mg) mg/L Max 30 Max100
20. Manganese (as Mn) mg/L Max 0.1 Max 0.3
21. Mineral Oil mg/L Max 0.5 No relaxation
22. Nitrate (as NO3) mg/L Max 45 No relaxation
23. Phenolic compounds
(as C6H5OH)
mg/L Max 0.001 Max 0.002
24. Selenium (as Se) mg/L Max 0.01 No relaxation
25. Silver (as Ag) mg/L Max 0.1 No relaxation
26. Sulphate (as SO4) mg/L Max 200 Max 400
27. Sulphide (as H2S) mg/L Max 0.05 No relaxation
28. Total Alkalinity as calcium
carbonate
mg/L Max 200 Max600
29. Total hardness (as CaCO3) mg/L Max 200 Max 600
30. Zinc (as Zn) mg/L Max 5 Max15
Table 3 Parameters Concerning
Toxic Substances
31. Cadmium (as Cd) mg/L Max 0.003 No relaxation
32. Cyanide (as CN) mg/L Max 0.05 No relaxation
33. Lead (as Pb) mg/L Max 0.01 No relaxation
34. Mercury (as Hg) mg/L Max 0.001 No relaxation
35. Molybdenum (as Mo) mg/L Max 0.07 No relaxation
36. Nickel (as Ni) mg/L Max 0.02 No relaxation
37. Pesticides mg/L See Table 5 No relaxation
38. Polychlorinatedbiphenyls mg/L Max 0.0005 No relaxation
Page 79
Critically Polluted Areas: Monitoring, sampling, analysis of Stack, Ambient Air Quality, Surface Water, Ground Water, Waste Water
Dombivli 76
Sr. Characteristic Unit
Requirement
(Acceptable
Limit)
Permissible
Limit in the
Absence of
Alternate
Source
39. Poly nuclear aromatic
Hydrocarbons (as PAH)
mg/L Max 0.0001 No relaxation
40. Total Arsenic(as As) mg/L Max 0.01 Max0.05
41. Total Chromium (as Cr) mg/L Max 0.05 No relaxation
42. Trihalomethanes
a) Bromoform mg/L Max 0.1 No relaxation
b) DibromochloroMethane mg/L Max 0.1 No relaxation
c) Bromodichloromethane mg/L Max 0.06 No relaxation
d) Chloroform mg/L Max 0.2 No relaxation
Table 4 Parameters Concerning
Radioactive Substances
43. Radioactive Materials
a) Alpha emitters Bq/L Max 0.1 No relaxation
b) Beta emitters Bq/L Max 1.0 No relaxation
Table 5 Pesticide Residues Limits
and Test Method
i) Alachor µg/L 20 No relaxation
ii) Atrazine µg/L 2 No relaxation
iii) Aldrin/ Dieldrin µg/L 0.03 No relaxation
iv) Alpha HCH µg/L 0.01 No relaxation
v) Beta HCH µg/L 0.04 No relaxation
vi) Butachlor µg/L 125 No relaxation
vii) Chlorpyriphos µg/L 30 No relaxation
viii) Delta HCH µg/L 0.04 No relaxation
ix) 2,4- Dichlorophenoxyacetic
acid
µg/L 30 No relaxation
Page 80
Critically Polluted Areas: Monitoring, sampling, analysis of Stack, Ambient Air Quality, Surface Water, Ground Water, Waste Water
Dombivli 77
Sr. Characteristic Unit
Requirement
(Acceptable
Limit)
Permissible
Limit in the
Absence of
Alternate
Source
x) DDT (o,p&p,p — Isomers of
DDT, DDE and DDD)
µg/L 1 No relaxation
xi) Endosulfan (α,β & sulphate) µg/L 0.4 No relaxation
xii) Ethion µg/L 3 No relaxation
xiii) Gamma - HCH (Lindane) µg/L 2 No relaxation
xiv) Isoproturon µg/L 9 No relaxation
xv) Malathion µg/L 190 No relaxation
xvi) Methyl parathion µg/L 0.3 No relaxation
xvii) Monocrotophos µg/L 1 No relaxation
xviii) Phorate µg/L 2 No relaxation
Table 6 Bacteriological Quality of
Drinking Water
44. E.coli or thermotolerant
coliform bacteria
/100 Not detectable -
45. Total coliform bacteria /100 mL Not detectable -
Virological Requirements
46. MS2 phage /1 L Absent -
Biological Requirements
47. Cryptosporidium /10 L Absent -
48. Giardia /10 L Absent -
49. Microscopic organisms such
as algae, zooplanktons,
flagellates, parasites and
toxin producing organisms
Free from
microscopic
organisms
-
Page 81
Critically Polluted Areas: Monitoring, sampling, analysis of Stack, Ambient Air Quality, Surface Water, Ground Water, Waste Water
Dombivli 78
Annexure VIII: CPCB Water Quality Criteria:
Designated best use Quality
Class
Primary Water Quality Criteria
Drinking water source without
conventional treatment but
with chlorination
A � Total coliform organisms (MPN*/100
ml) shall be 50 or less
� pH between 6.5 and 8.5
� Dissolved Oxygen 6 mg/L or more,
and
� Biochemical Oxygen Demand 2 mg/L
or less
Outdoor bathing (organized) B � Total coliform organisms (MPN/100
ml) shall be 500 or less
� pH between 6.5 and 8.5
� Dissolved Oxygen 5 mg/L or more,
and
� Biochemical Oxygen Demand 3 mg/L
or less
Drinking water source with
conventional treatment
C � Total coliform organisms
(MPN/100ml) shall be 5000 or less
� pH between 6 and 9
� Dissolved Oxygen 4 mg/L or more,
and
� Biochemical Oxygen Demand 3 mg/L
or less
Propagation of wildlife and
fisheries
D � pH between 6.5 and 8.5
� Dissolved Oxygen 4 mg/L or more,
and
� Free ammonia (as N) 1.2 mg/L or
less
Irrigation, industrial cooling,
and controlled disposal
E � pH between 6.0 and 8.5
� Electrical conductivity less than 2250
micro mhos/cm,
� Sodium Absorption Ratio less than
26,
� and Boron less than 2 mg/l.
Below E � Not Meeting A, B, C, D & E Criteria
Page 82
Critically Polluted Areas: Monitoring, sampling, analysis of Stack, Ambient Air Quality, Surface Water, Ground Water, Waste Water
Dombivli 79
Annexure IX: Water Quality Parameters Requirements and Classification
Water quality parameters are classified into three categories, given in Table (i), (ii) and
(iii) (Source: CPCB, 2002, “Water Quality Criteria and Goals”, Monitoring of Indian
National aquatic Resources Series: MINARS/17/2001-2002).
Table: Basic Water Quality Requirement and Classification (Surface Water + Ground
Water)
i) Simple Parameters:
Sr. Parameters Requirement for Waters of Class
A-Excellent B-Desirable C-Acceptable
(i) Sanitary
Survey
Very Clean
neighborhood and
catchment
Reasonably clean
neighborhood
Generally clean
neighborhood
(ii) General
Appearance No floating matter No floating matter No floating matter
(iii) Colour Absolutely Colourless
Almost colourless,
very light shade if
any
No colour of
anthropogenic
origin
(iv) Smell Odourless Almost odourless No unpleasant
odour
(v) Transparency >1.0 depth >0.5 to 0.1m
depth
>0.2 to 0.5 m
depth
(vi)
Ecological*
(Presence of
Animals)
Fish & Insects Fish & Insects Fish & Insects
* Applicable to only surface water
ii) Regular Monitoring Parameters:
Sr. Parameters Requirement for Waters of Class
A Excellent B-Desirable C-Acceptable
(i) pH 7.0 to 8.5 6.5 to 9.0 6.5 to 9.0
(ii) DO (% Saturation) 90-110 80-120 60-140
(iii) BOD, mg/l Below 2 Below 5 Below 8
(iv) EC, µmhos/cm <1000 <2250 <4000
(v) (NO2+NO3)-
Nitrogen, mg/l <5 <10 <15
(vi) Suspended solid,
mg/l <25 <50 <100
Page 83
Critically Polluted Areas: Monitoring, sampling, analysis of Stack, Ambient Air Quality, Surface Water, Ground Water, Waste Water
Dombivli 80
Sr. Parameters Requirement for Waters of Class
A Excellent B-Desirable C-Acceptable
(vii) Fecal Coliform,
MPN/ 100 ml <20 per 100 ml <200 per 100 ml
<2000 per 100
ml
(viii) Bio-assay
(Zebra Fish)
No death in 5
days No death in 3 days
No death in 2
days
Note:
1. Dissolved Oxygen (DO) not applicable for ground waters.
2. Dissolved Oxygen in eutrophicated waters should include measurement for
diurnal variation.
3. Suspended solid limit is applicable only during non-monsoon period.
4. Faecal Coliform values should meet for 90% times.
5. Static Bio-Assay method may be adopted.
iii) Specific Parameters: (Only in case of need/apprehensions)
Sr. Parameters Requirement for Waters of Class
A- Excellent B-Desirable C-Acceptable
(i) Total Phosphorous <0.1 mg/l < 0.2 mg/l < 0.3 mg/l
(ii) T.K.N < 1.0 mg/l <2.0 mg/l <3.0 mg/l
(iii)
Total Ammonia
(NH4 + NH3)-
Nitrogen
< 0.5 mg/l < 1.0 mg/l < 1.5 mg/l
(iv) Phenols < 2µg/l < 5µg/l <10 µg/l
(v) Surface Active
Agents <20 µg/l <100µg/l < 200µg/l
(vi) Organo Chlorine
Pesticides < 0.05µg/l < 0.1µg/l < 0.2µg/l
(vii) PAH < 0.05µg/l <0.1 µg/l <0.2 µg/l
(viii) PCB and PCT < 0.01µg/l < 0.01µg/l < 0.02µg/l
(ix) Zinc < 100µg/l < 200µg/l <300 µg/l
(x) Nickel < 50µg/l < 100µg/l < 200µg/l
(xi) Copper < 20µg/l < 50µg/l <100µg/l
Page 84
Critically Polluted Areas: Monitoring, sampling, analysis of Stack, Ambient Air Quality, Surface Water, Ground Water, Waste Water
Dombivli 81
Sr. Parameters Requirement for Waters of Class
A- Excellent B-Desirable C-Acceptable
(xii) Chromium (Total) < 20µg/l < 50µg/l < 100µg/l
(xiii) Arsenic (Total) < 20µg/l <50 µg/l <100 µg/l
(xiv) Lead < 20µg/l < 50µg/l < 100µg/l
(xv) Cadmium < 1.0µg/l <2.5 µg/l < 5.0µg/l
(xvi) Mercury < 0.2µg/l < 0.5µg/l < 1.0µg/l