CHAPTER 7-1 Cisco Internet Streamer CDS 2.5 Software Configuration Guide OL-20686-06 7 Monitoring the Internet Streamer CDS The CDSM provides tools that can be used for system monitoring and system diagnostics. The topics covered in this chapter include: • System Monitoring, page 7-1 • Device Monitoring, page 7-11 • Reports, page 7-23 • Delivery Service Monitoring, page 7-28 • Viewing Statistics, page 7-38 • Transaction Logs, page 7-47 System Monitoring System monitoring consists of the following: • System Status • System Home Page • System Audit Logs • System Port Numbers System Status The CDSM displays the system status in the System Status bar that is located above the navigation tabs in every window. The System Status bar presents the overall device, content health of the system, and license alerts. You can use this feature to monitor devices, content replication, and license alerts in your CDS network. The System Status bar helps you immediately identify any problems on the network, allowing you to act and respond to problems quickly. The system status reporting mechanism uses four alarm lights to identify problems that need to be resolved. Each light represents a different alarm level, as follows: • Green—No alarms (the system is in excellent health) • Yellow—Minor alarms • Orange—Major alarms • Red—Critical alarms
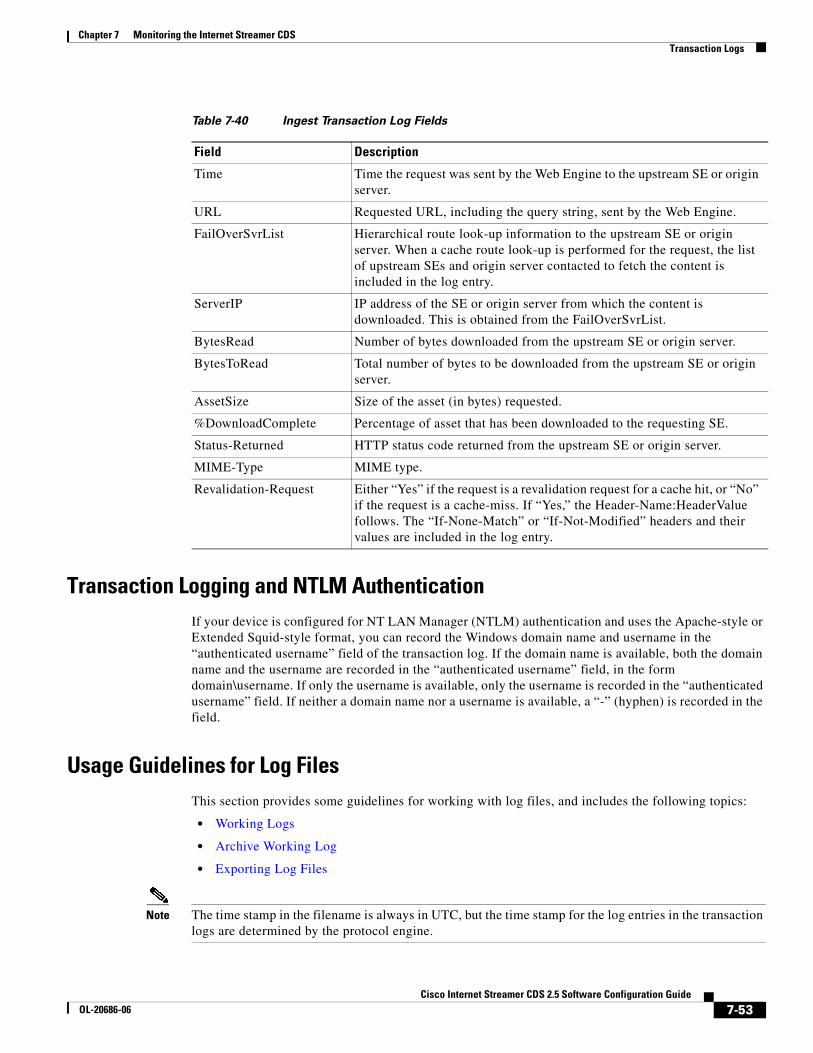
Transcript
C H A P T E R
7-1Cisco Internet Streamer CDS 2.5 Software Configuration Guide
OL-20686-06
7Monitoring the Internet Streamer CDS
The CDSM provides tools that can be used for system monitoring and system diagnostics. The topics covered in this chapter include:
• System Monitoring, page 7-1
• Device Monitoring, page 7-11
• Reports, page 7-23
• Delivery Service Monitoring, page 7-28
• Viewing Statistics, page 7-38
• Transaction Logs, page 7-47
System MonitoringSystem monitoring consists of the following:
• System Status
• System Home Page
• System Audit Logs
• System Port Numbers
System StatusThe CDSM displays the system status in the System Status bar that is located above the navigation tabs in every window. The System Status bar presents the overall device, content health of the system, and license alerts. You can use this feature to monitor devices, content replication, and license alerts in your CDS network. The System Status bar helps you immediately identify any problems on the network, allowing you to act and respond to problems quickly.
The system status reporting mechanism uses four alarm lights to identify problems that need to be resolved. Each light represents a different alarm level, as follows:
• Green—No alarms (the system is in excellent health)
• Yellow—Minor alarms
• Orange—Major alarms
• Red—Critical alarms
7-2Cisco Internet Streamer CDS 2.5 Software Configuration Guide
OL-20686-06
Chapter 7 Monitoring the Internet Streamer CDSSystem Monitoring
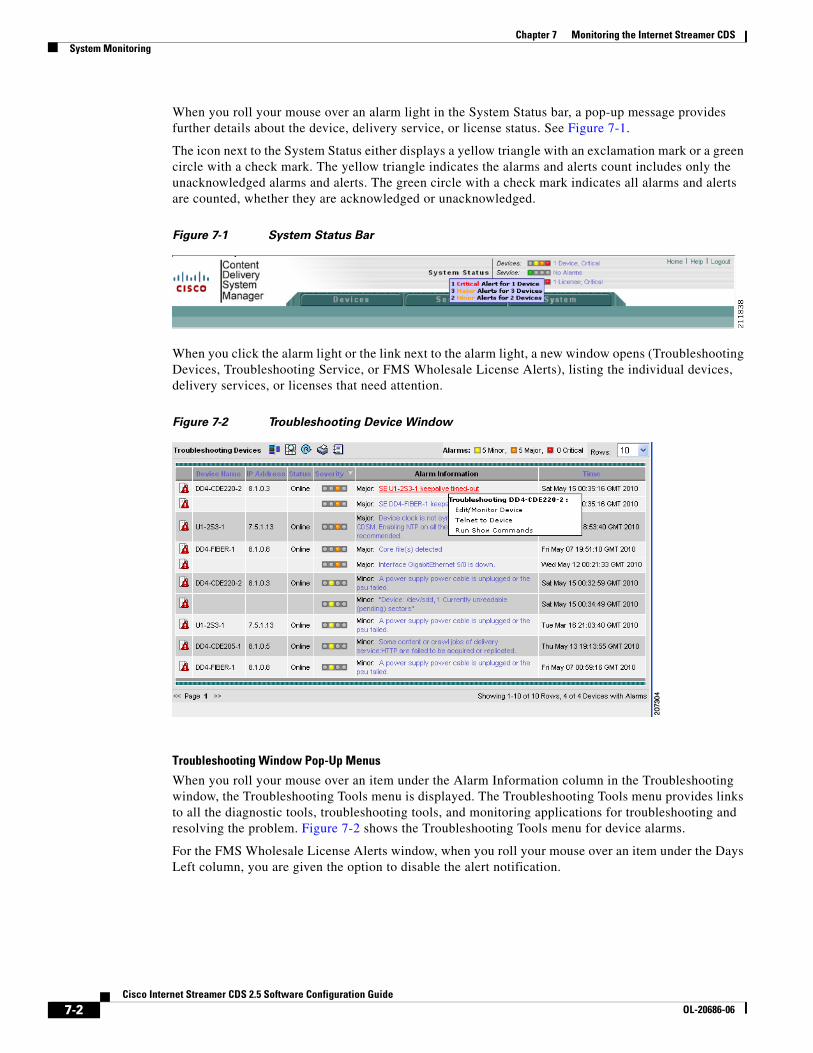
When you roll your mouse over an alarm light in the System Status bar, a pop-up message provides further details about the device, delivery service, or license status. See Figure 7-1.
The icon next to the System Status either displays a yellow triangle with an exclamation mark or a green circle with a check mark. The yellow triangle indicates the alarms and alerts count includes only the unacknowledged alarms and alerts. The green circle with a check mark indicates all alarms and alerts are counted, whether they are acknowledged or unacknowledged.
Figure 7-1 System Status Bar
When you click the alarm light or the link next to the alarm light, a new window opens (Troubleshooting Devices, Troubleshooting Service, or FMS Wholesale License Alerts), listing the individual devices, delivery services, or licenses that need attention.
Figure 7-2 Troubleshooting Device Window
Troubleshooting Window Pop-Up Menus
When you roll your mouse over an item under the Alarm Information column in the Troubleshooting window, the Troubleshooting Tools menu is displayed. The Troubleshooting Tools menu provides links to all the diagnostic tools, troubleshooting tools, and monitoring applications for troubleshooting and resolving the problem. Figure 7-2 shows the Troubleshooting Tools menu for device alarms.
For the FMS Wholesale License Alerts window, when you roll your mouse over an item under the Days Left column, you are given the option to disable the alert notification.
7-3Cisco Internet Streamer CDS 2.5 Software Configuration Guide
OL-20686-06
Chapter 7 Monitoring the Internet Streamer CDSSystem Monitoring
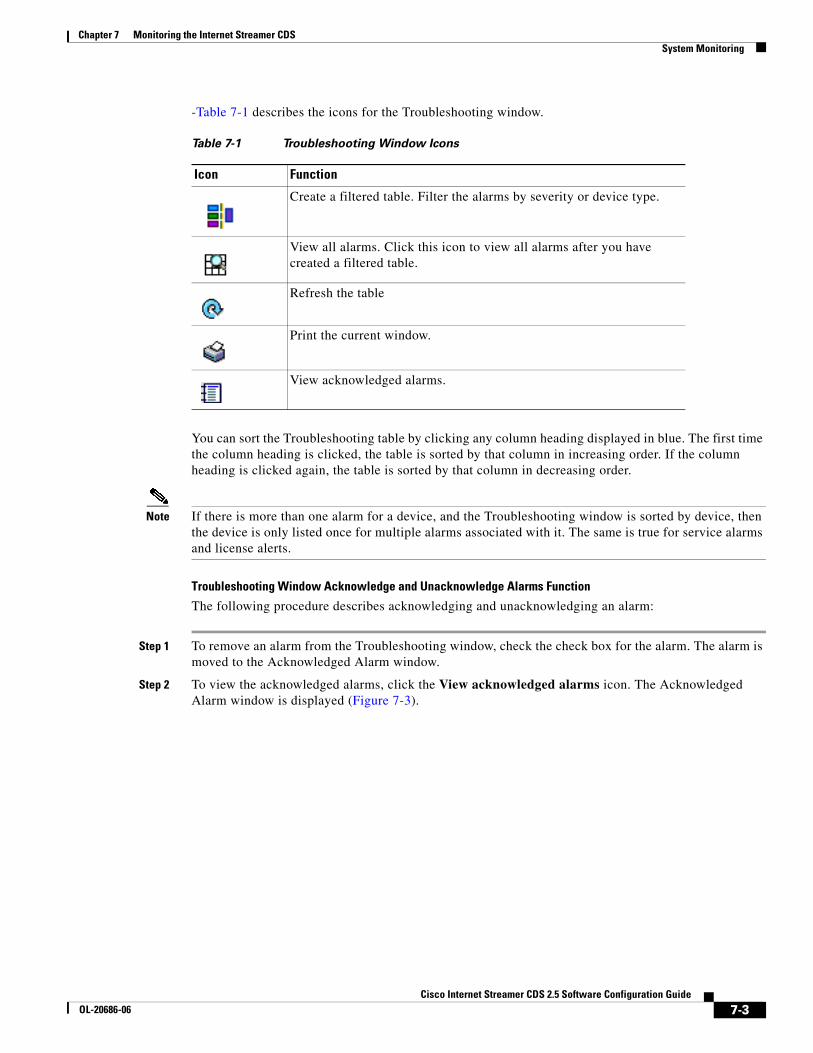
-Table 7-1 describes the icons for the Troubleshooting window.
You can sort the Troubleshooting table by clicking any column heading displayed in blue. The first time the column heading is clicked, the table is sorted by that column in increasing order. If the column heading is clicked again, the table is sorted by that column in decreasing order.
Note If there is more than one alarm for a device, and the Troubleshooting window is sorted by device, then the device is only listed once for multiple alarms associated with it. The same is true for service alarms and license alerts.
Troubleshooting Window Acknowledge and Unacknowledge Alarms Function
The following procedure describes acknowledging and unacknowledging an alarm:
Step 1 To remove an alarm from the Troubleshooting window, check the check box for the alarm. The alarm is moved to the Acknowledged Alarm window.
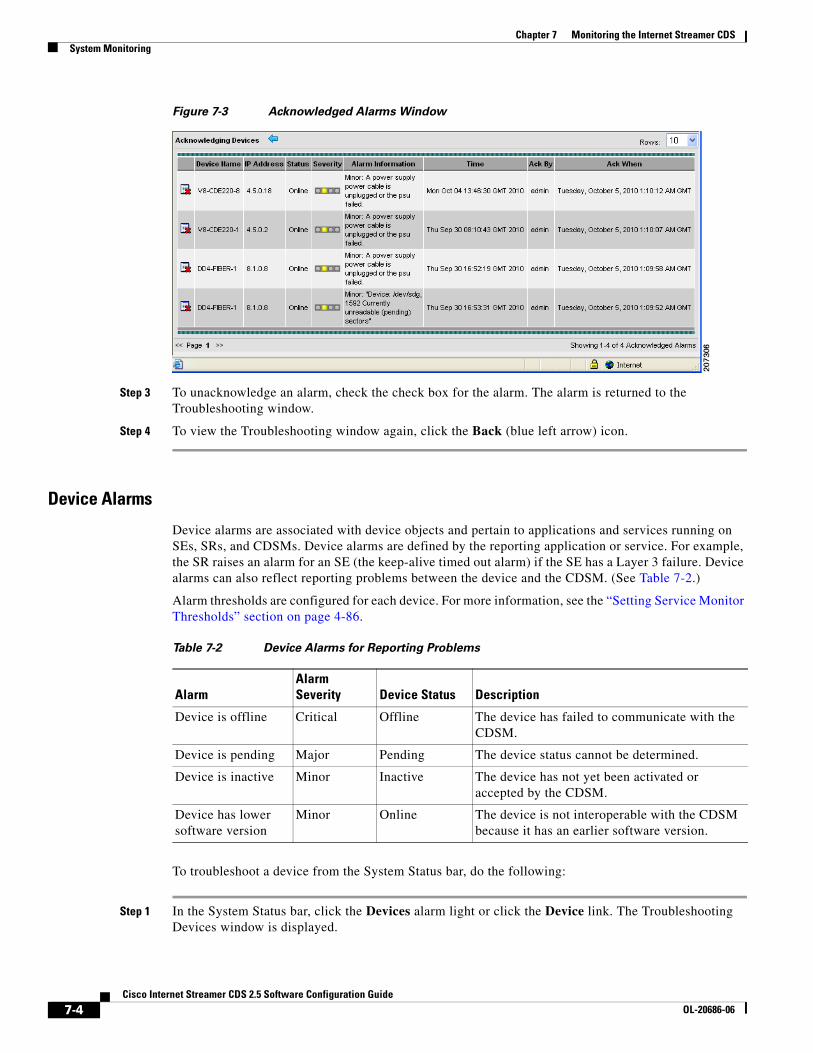
Step 2 To view the acknowledged alarms, click the View acknowledged alarms icon. The Acknowledged Alarm window is displayed (Figure 7-3).
Table 7-1 Troubleshooting Window Icons
Icon Function
Create a filtered table. Filter the alarms by severity or device type.
View all alarms. Click this icon to view all alarms after you have created a filtered table.
Refresh the table
Print the current window.
View acknowledged alarms.
7-4Cisco Internet Streamer CDS 2.5 Software Configuration Guide
OL-20686-06
Chapter 7 Monitoring the Internet Streamer CDSSystem Monitoring
Figure 7-3 Acknowledged Alarms Window
Step 3 To unacknowledge an alarm, check the check box for the alarm. The alarm is returned to the Troubleshooting window.
Step 4 To view the Troubleshooting window again, click the Back (blue left arrow) icon.
Device Alarms
Device alarms are associated with device objects and pertain to applications and services running on SEs, SRs, and CDSMs. Device alarms are defined by the reporting application or service. For example, the SR raises an alarm for an SE (the keep-alive timed out alarm) if the SE has a Layer 3 failure. Device alarms can also reflect reporting problems between the device and the CDSM. (See Table 7-2.)
Alarm thresholds are configured for each device. For more information, see the “Setting Service Monitor Thresholds” section on page 4-86.
To troubleshoot a device from the System Status bar, do the following:
Step 1 In the System Status bar, click the Devices alarm light or click the Device link. The Troubleshooting Devices window is displayed.
Table 7-2 Device Alarms for Reporting Problems
Alarm Alarm Severity Device Status Description
Device is offline Critical Offline The device has failed to communicate with the CDSM.
Device is pending Major Pending The device status cannot be determined.
Device is inactive Minor Inactive The device has not yet been activated or accepted by the CDSM.
Device has lower software version
Minor Online The device is not interoperable with the CDSM because it has an earlier software version.
7-5Cisco Internet Streamer CDS 2.5 Software Configuration Guide
OL-20686-06
Chapter 7 Monitoring the Internet Streamer CDSSystem Monitoring
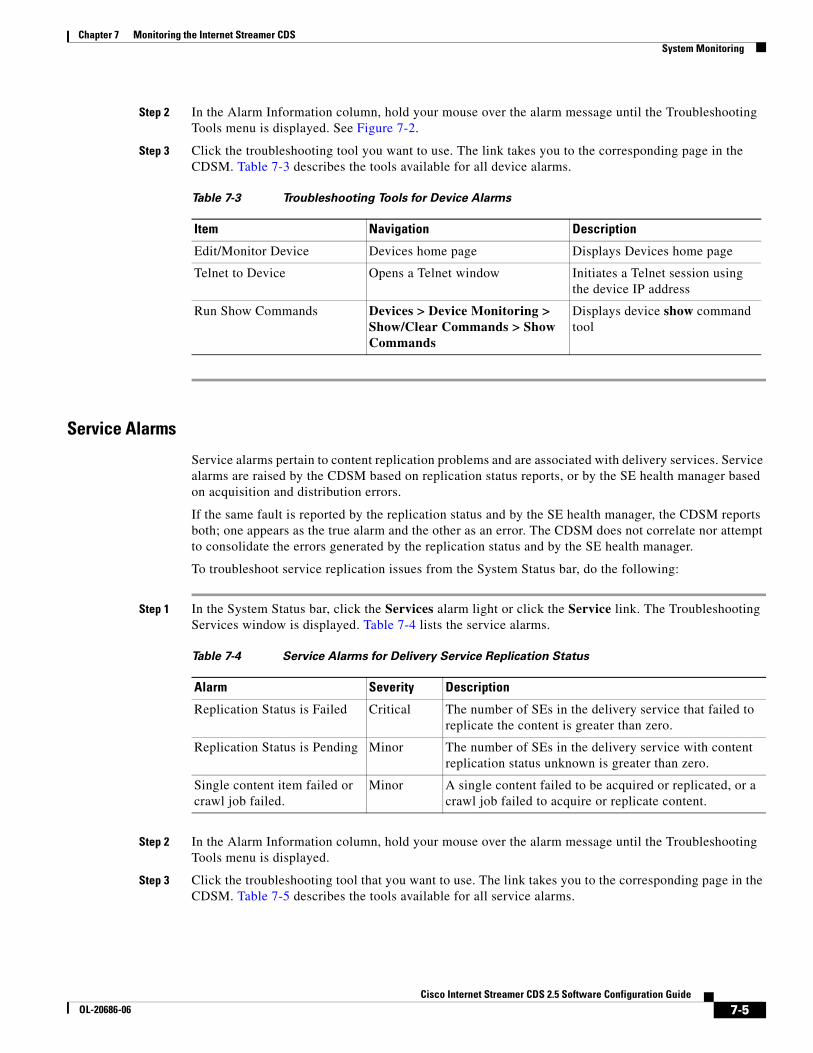
Step 2 In the Alarm Information column, hold your mouse over the alarm message until the Troubleshooting Tools menu is displayed. See Figure 7-2.
Step 3 Click the troubleshooting tool you want to use. The link takes you to the corresponding page in the CDSM. Table 7-3 describes the tools available for all device alarms.
Service Alarms
Service alarms pertain to content replication problems and are associated with delivery services. Service alarms are raised by the CDSM based on replication status reports, or by the SE health manager based on acquisition and distribution errors.
If the same fault is reported by the replication status and by the SE health manager, the CDSM reports both; one appears as the true alarm and the other as an error. The CDSM does not correlate nor attempt to consolidate the errors generated by the replication status and by the SE health manager.
To troubleshoot service replication issues from the System Status bar, do the following:
Step 1 In the System Status bar, click the Services alarm light or click the Service link. The Troubleshooting Services window is displayed. Table 7-4 lists the service alarms.
Step 2 In the Alarm Information column, hold your mouse over the alarm message until the Troubleshooting Tools menu is displayed.
Step 3 Click the troubleshooting tool that you want to use. The link takes you to the corresponding page in the CDSM. Table 7-5 describes the tools available for all service alarms.
Table 7-3 Troubleshooting Tools for Device Alarms
Item Navigation Description
Edit/Monitor Device Devices home page Displays Devices home page
Telnet to Device Opens a Telnet window Initiates a Telnet session using the device IP address
Run Show Commands Devices > Device Monitoring > Show/Clear Commands > Show Commands
Displays device show command tool
Table 7-4 Service Alarms for Delivery Service Replication Status
Alarm Severity Description
Replication Status is Failed Critical The number of SEs in the delivery service that failed to replicate the content is greater than zero.
Replication Status is Pending Minor The number of SEs in the delivery service with content replication status unknown is greater than zero.
Single content item failed or crawl job failed.
Minor A single content failed to be acquired or replicated, or a crawl job failed to acquire or replicate content.
7-6Cisco Internet Streamer CDS 2.5 Software Configuration Guide
OL-20686-06
Chapter 7 Monitoring the Internet Streamer CDSSystem Monitoring
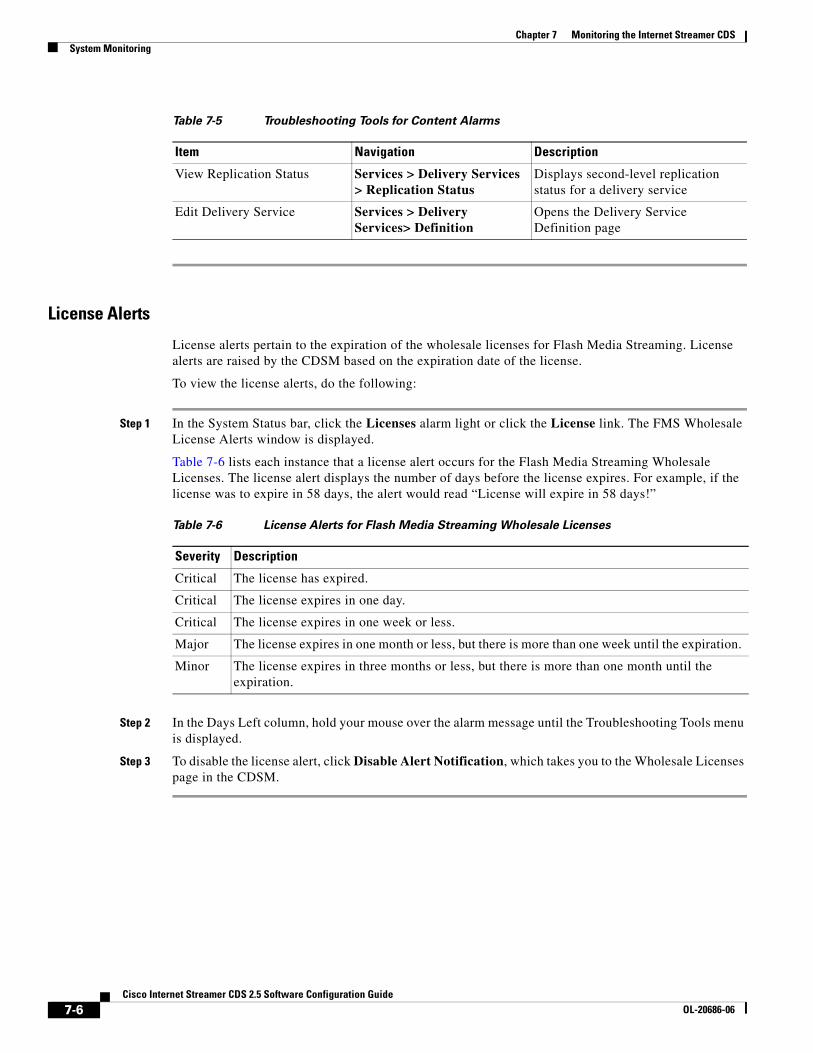
License Alerts
License alerts pertain to the expiration of the wholesale licenses for Flash Media Streaming. License alerts are raised by the CDSM based on the expiration date of the license.
To view the license alerts, do the following:
Step 1 In the System Status bar, click the Licenses alarm light or click the License link. The FMS Wholesale License Alerts window is displayed.
Table 7-6 lists each instance that a license alert occurs for the Flash Media Streaming Wholesale Licenses. The license alert displays the number of days before the license expires. For example, if the license was to expire in 58 days, the alert would read “License will expire in 58 days!”
Step 2 In the Days Left column, hold your mouse over the alarm message until the Troubleshooting Tools menu is displayed.
Step 3 To disable the license alert, click Disable Alert Notification, which takes you to the Wholesale Licenses page in the CDSM.
Table 7-5 Troubleshooting Tools for Content Alarms
Item Navigation Description
View Replication Status Services > Delivery Services > Replication Status
Displays second-level replication status for a delivery service
Edit Delivery Service Services > Delivery Services> Definition
Opens the Delivery Service Definition page
Table 7-6 License Alerts for Flash Media Streaming Wholesale Licenses
Severity Description
Critical The license has expired.
Critical The license expires in one day.
Critical The license expires in one week or less.
Major The license expires in one month or less, but there is more than one week until the expiration.
Minor The license expires in three months or less, but there is more than one month until the expiration.
7-7Cisco Internet Streamer CDS 2.5 Software Configuration Guide
OL-20686-06
Chapter 7 Monitoring the Internet Streamer CDSSystem Monitoring
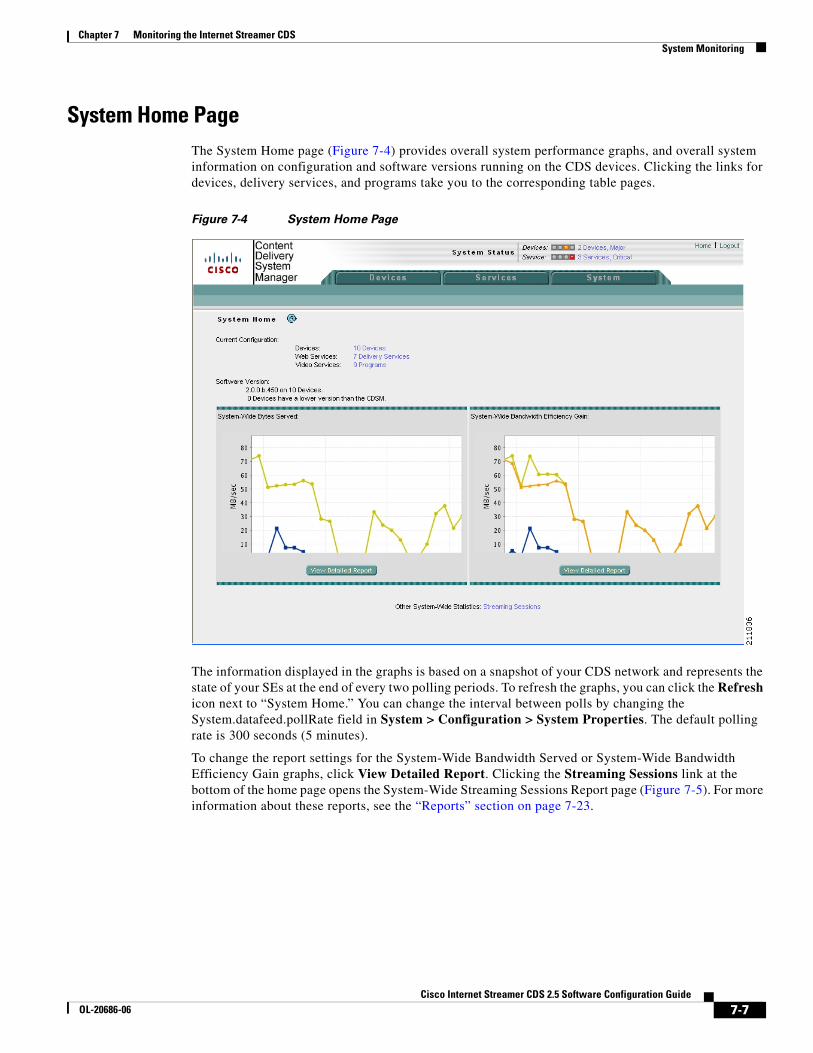
System Home PageThe System Home page (Figure 7-4) provides overall system performance graphs, and overall system information on configuration and software versions running on the CDS devices. Clicking the links for devices, delivery services, and programs take you to the corresponding table pages.
Figure 7-4 System Home Page
The information displayed in the graphs is based on a snapshot of your CDS network and represents the state of your SEs at the end of every two polling periods. To refresh the graphs, you can click the Refresh icon next to “System Home.” You can change the interval between polls by changing the System.datafeed.pollRate field in System > Configuration > System Properties. The default polling rate is 300 seconds (5 minutes).
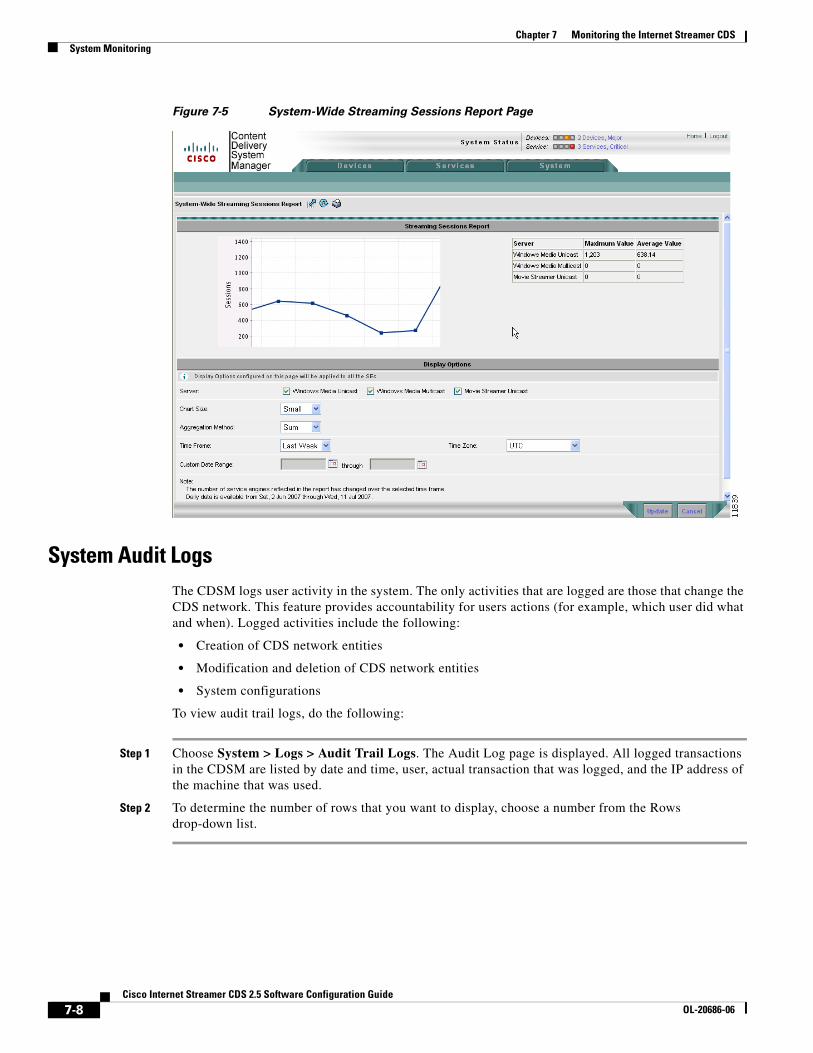
To change the report settings for the System-Wide Bandwidth Served or System-Wide Bandwidth Efficiency Gain graphs, click View Detailed Report. Clicking the Streaming Sessions link at the bottom of the home page opens the System-Wide Streaming Sessions Report page (Figure 7-5). For more information about these reports, see the “Reports” section on page 7-23.
7-8Cisco Internet Streamer CDS 2.5 Software Configuration Guide
OL-20686-06
Chapter 7 Monitoring the Internet Streamer CDSSystem Monitoring
System Audit LogsThe CDSM logs user activity in the system. The only activities that are logged are those that change the CDS network. This feature provides accountability for users actions (for example, which user did what and when). Logged activities include the following:
• Creation of CDS network entities
• Modification and deletion of CDS network entities
• System configurations
To view audit trail logs, do the following:
Step 1 Choose System > Logs > Audit Trail Logs. The Audit Log page is displayed. All logged transactions in the CDSM are listed by date and time, user, actual transaction that was logged, and the IP address of the machine that was used.
Step 2 To determine the number of rows that you want to display, choose a number from the Rows drop-down list.
7-9Cisco Internet Streamer CDS 2.5 Software Configuration Guide
OL-20686-06
Chapter 7 Monitoring the Internet Streamer CDSSystem Monitoring
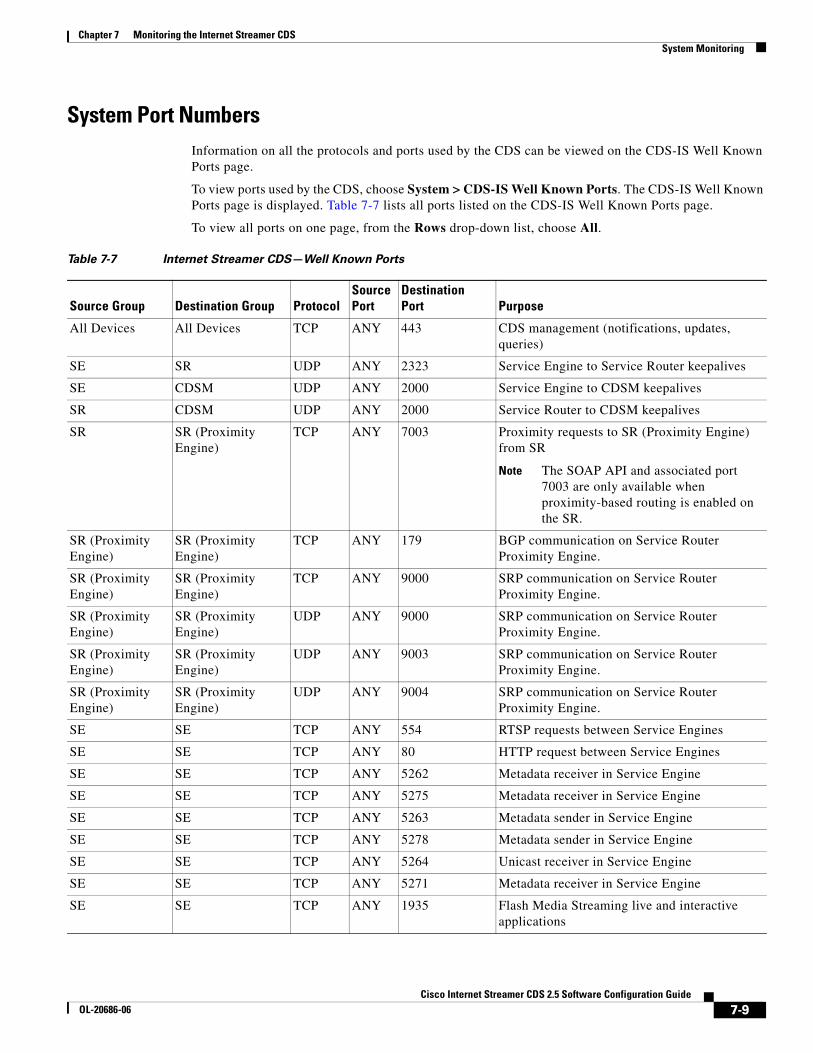
System Port NumbersInformation on all the protocols and ports used by the CDS can be viewed on the CDS-IS Well Known Ports page.
To view ports used by the CDS, choose System > CDS-IS Well Known Ports. The CDS-IS Well Known Ports page is displayed. Table 7-7 lists all ports listed on the CDS-IS Well Known Ports page.
To view all ports on one page, from the Rows drop-down list, choose All.
Table 7-7 Internet Streamer CDS—Well Known Ports
Source Group Destination Group ProtocolSource Port
Destination Port Purpose
All Devices All Devices TCP ANY 443 CDS management (notifications, updates, queries)
SE SR UDP ANY 2323 Service Engine to Service Router keepalives
SE CDSM UDP ANY 2000 Service Engine to CDSM keepalives
SR CDSM UDP ANY 2000 Service Router to CDSM keepalives
SR SR (Proximity Engine)
TCP ANY 7003 Proximity requests to SR (Proximity Engine) from SR
Note The SOAP API and associated port 7003 are only available when proximity-based routing is enabled on the SR.
SR (Proximity Engine)
SR (Proximity Engine)
TCP ANY 179 BGP communication on Service Router Proximity Engine.
SR (Proximity Engine)
SR (Proximity Engine)
TCP ANY 9000 SRP communication on Service Router Proximity Engine.
SR (Proximity Engine)
SR (Proximity Engine)
UDP ANY 9000 SRP communication on Service Router Proximity Engine.
SR (Proximity Engine)
SR (Proximity Engine)
UDP ANY 9003 SRP communication on Service Router Proximity Engine.
SR (Proximity Engine)
SR (Proximity Engine)
UDP ANY 9004 SRP communication on Service Router Proximity Engine.
SE SE TCP ANY 554 RTSP requests between Service Engines
SE SE TCP ANY 80 HTTP request between Service Engines
SE SE TCP ANY 5262 Metadata receiver in Service Engine
SE SE TCP ANY 5275 Metadata receiver in Service Engine
SE SE TCP ANY 5263 Metadata sender in Service Engine
SE SE TCP ANY 5278 Metadata sender in Service Engine
SE SE TCP ANY 5264 Unicast receiver in Service Engine
SE SE TCP ANY 5271 Metadata receiver in Service Engine
SE SE TCP ANY 1935 Flash Media Streaming live and interactive applications
7-10Cisco Internet Streamer CDS 2.5 Software Configuration Guide
OL-20686-06
Chapter 7 Monitoring the Internet Streamer CDSSystem Monitoring
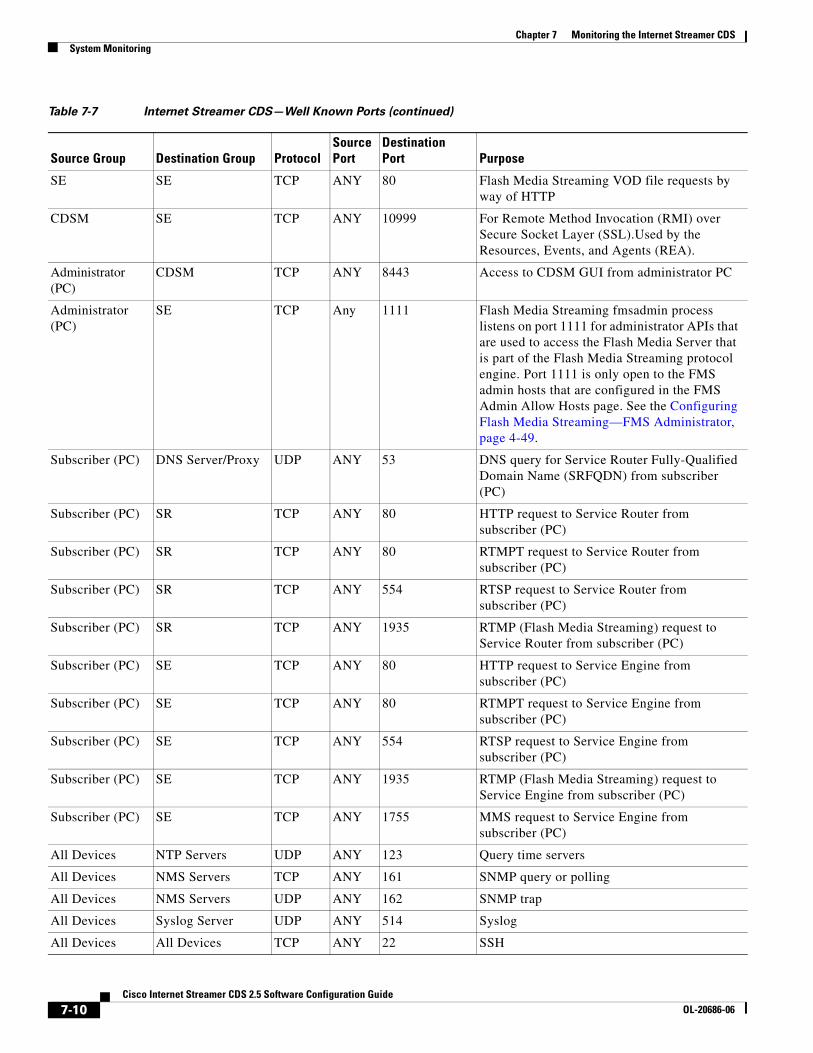
SE SE TCP ANY 80 Flash Media Streaming VOD file requests by way of HTTP
CDSM SE TCP ANY 10999 For Remote Method Invocation (RMI) over Secure Socket Layer (SSL).Used by the Resources, Events, and Agents (REA).
Administrator (PC)
CDSM TCP ANY 8443 Access to CDSM GUI from administrator PC
Administrator (PC)
SE TCP Any 1111 Flash Media Streaming fmsadmin process listens on port 1111 for administrator APIs that are used to access the Flash Media Server that is part of the Flash Media Streaming protocol engine. Port 1111 is only open to the FMS admin hosts that are configured in the FMS Admin Allow Hosts page. See the Configuring Flash Media Streaming—FMS Administrator, page 4-49.
Subscriber (PC) DNS Server/Proxy UDP ANY 53 DNS query for Service Router Fully-Qualified Domain Name (SRFQDN) from subscriber (PC)
Subscriber (PC) SR TCP ANY 80 HTTP request to Service Router from subscriber (PC)
Subscriber (PC) SR TCP ANY 80 RTMPT request to Service Router from subscriber (PC)
Subscriber (PC) SR TCP ANY 554 RTSP request to Service Router from subscriber (PC)
Subscriber (PC) SR TCP ANY 1935 RTMP (Flash Media Streaming) request to Service Router from subscriber (PC)
Subscriber (PC) SE TCP ANY 80 HTTP request to Service Engine from subscriber (PC)
Subscriber (PC) SE TCP ANY 80 RTMPT request to Service Engine from subscriber (PC)
Subscriber (PC) SE TCP ANY 554 RTSP request to Service Engine from subscriber (PC)
Subscriber (PC) SE TCP ANY 1935 RTMP (Flash Media Streaming) request to Service Engine from subscriber (PC)
Subscriber (PC) SE TCP ANY 1755 MMS request to Service Engine from subscriber (PC)
All Devices NTP Servers UDP ANY 123 Query time servers
All Devices NMS Servers TCP ANY 161 SNMP query or polling
All Devices NMS Servers UDP ANY 162 SNMP trap
All Devices Syslog Server UDP ANY 514 Syslog
All Devices All Devices TCP ANY 22 SSH
Table 7-7 Internet Streamer CDS—Well Known Ports (continued)
Source Group Destination Group ProtocolSource Port
Destination Port Purpose
7-11Cisco Internet Streamer CDS 2.5 Software Configuration Guide
OL-20686-06
Chapter 7 Monitoring the Internet Streamer CDSDevice Monitoring
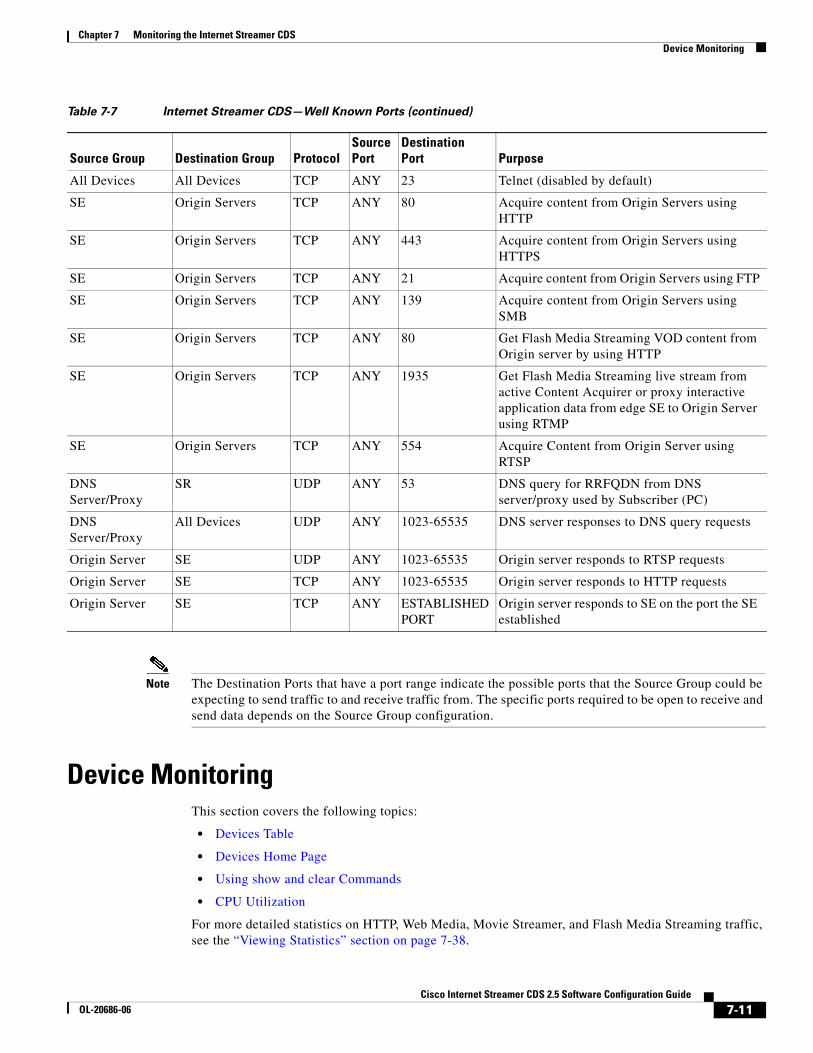
Note The Destination Ports that have a port range indicate the possible ports that the Source Group could be expecting to send traffic to and receive traffic from. The specific ports required to be open to receive and send data depends on the Source Group configuration.
Device MonitoringThis section covers the following topics:
• Devices Table
• Devices Home Page
• Using show and clear Commands
• CPU Utilization
For more detailed statistics on HTTP, Web Media, Movie Streamer, and Flash Media Streaming traffic, see the “Viewing Statistics” section on page 7-38.
All Devices All Devices TCP ANY 23 Telnet (disabled by default)
SE Origin Servers TCP ANY 80 Acquire content from Origin Servers using HTTP
SE Origin Servers TCP ANY 443 Acquire content from Origin Servers using HTTPS
SE Origin Servers TCP ANY 21 Acquire content from Origin Servers using FTP
SE Origin Servers TCP ANY 139 Acquire content from Origin Servers using SMB
SE Origin Servers TCP ANY 80 Get Flash Media Streaming VOD content from Origin server by using HTTP
SE Origin Servers TCP ANY 1935 Get Flash Media Streaming live stream from active Content Acquirer or proxy interactive application data from edge SE to Origin Server using RTMP
SE Origin Servers TCP ANY 554 Acquire Content from Origin Server using RTSP
DNS Server/Proxy
SR UDP ANY 53 DNS query for RRFQDN from DNS server/proxy used by Subscriber (PC)
DNS Server/Proxy
All Devices UDP ANY 1023-65535 DNS server responses to DNS query requests
Origin Server SE UDP ANY 1023-65535 Origin server responds to RTSP requests
Origin Server SE TCP ANY 1023-65535 Origin server responds to HTTP requests
Origin Server SE TCP ANY ESTABLISHED PORT
Origin server responds to SE on the port the SE established
Table 7-7 Internet Streamer CDS—Well Known Ports (continued)
Source Group Destination Group ProtocolSource Port
Destination Port Purpose
7-12Cisco Internet Streamer CDS 2.5 Software Configuration Guide
OL-20686-06
Chapter 7 Monitoring the Internet Streamer CDSDevice Monitoring
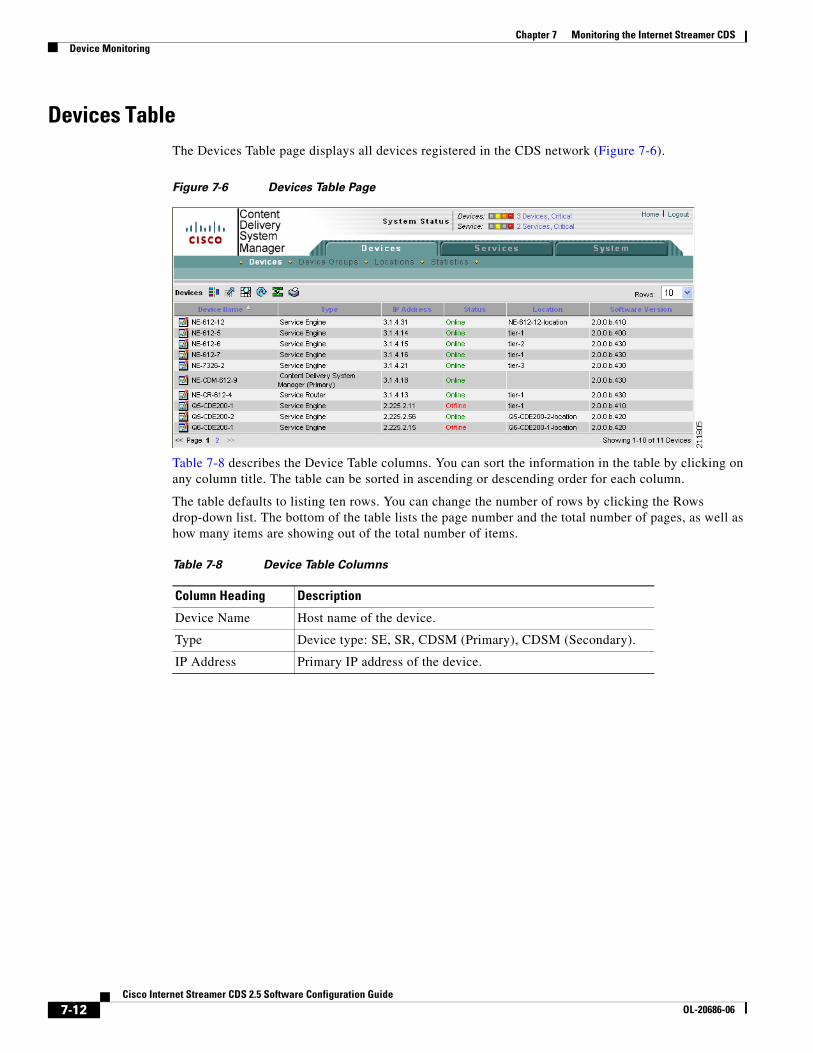
Devices TableThe Devices Table page displays all devices registered in the CDS network (Figure 7-6).
Figure 7-6 Devices Table Page
Table 7-8 describes the Device Table columns. You can sort the information in the table by clicking on any column title. The table can be sorted in ascending or descending order for each column.
The table defaults to listing ten rows. You can change the number of rows by clicking the Rows drop-down list. The bottom of the table lists the page number and the total number of pages, as well as how many items are showing out of the total number of items.
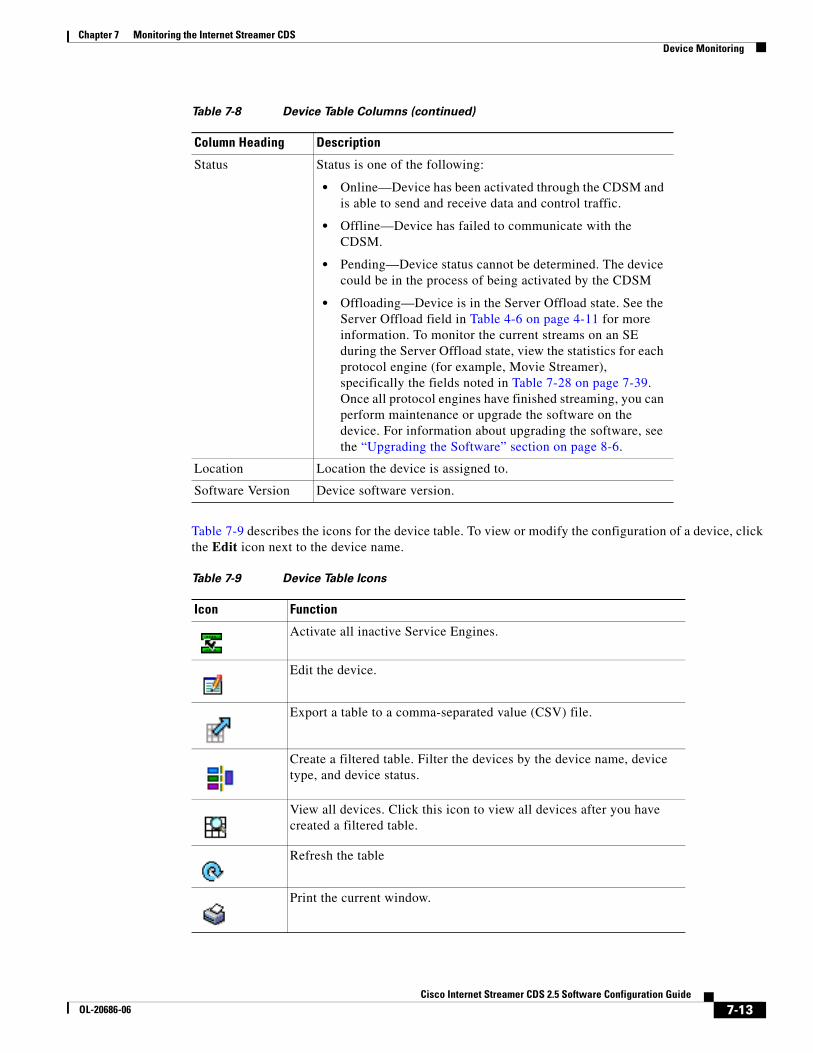
Table 7-8 Device Table Columns
Column Heading Description
Device Name Host name of the device.
Type Device type: SE, SR, CDSM (Primary), CDSM (Secondary).
IP Address Primary IP address of the device.
7-13Cisco Internet Streamer CDS 2.5 Software Configuration Guide
OL-20686-06
Chapter 7 Monitoring the Internet Streamer CDSDevice Monitoring
Table 7-9 describes the icons for the device table. To view or modify the configuration of a device, click the Edit icon next to the device name.
Status Status is one of the following:
• Online—Device has been activated through the CDSM and is able to send and receive data and control traffic.
• Offline—Device has failed to communicate with the CDSM.
• Pending—Device status cannot be determined. The device could be in the process of being activated by the CDSM
• Offloading—Device is in the Server Offload state. See the Server Offload field in Table 4-6 on page 4-11 for more information. To monitor the current streams on an SE during the Server Offload state, view the statistics for each protocol engine (for example, Movie Streamer), specifically the fields noted in Table 7-28 on page 7-39. Once all protocol engines have finished streaming, you can perform maintenance or upgrade the software on the device. For information about upgrading the software, see the “Upgrading the Software” section on page 8-6.
Location Location the device is assigned to.
Software Version Device software version.
Table 7-8 Device Table Columns (continued)
Column Heading Description
Table 7-9 Device Table Icons
Icon Function
Activate all inactive Service Engines.
Edit the device.
Export a table to a comma-separated value (CSV) file.
Create a filtered table. Filter the devices by the device name, device type, and device status.
View all devices. Click this icon to view all devices after you have created a filtered table.
Refresh the table
Print the current window.
7-14Cisco Internet Streamer CDS 2.5 Software Configuration Guide
OL-20686-06
Chapter 7 Monitoring the Internet Streamer CDSDevice Monitoring
For more information, see the “Devices, Services, and Other Tables” section on page 3-7.
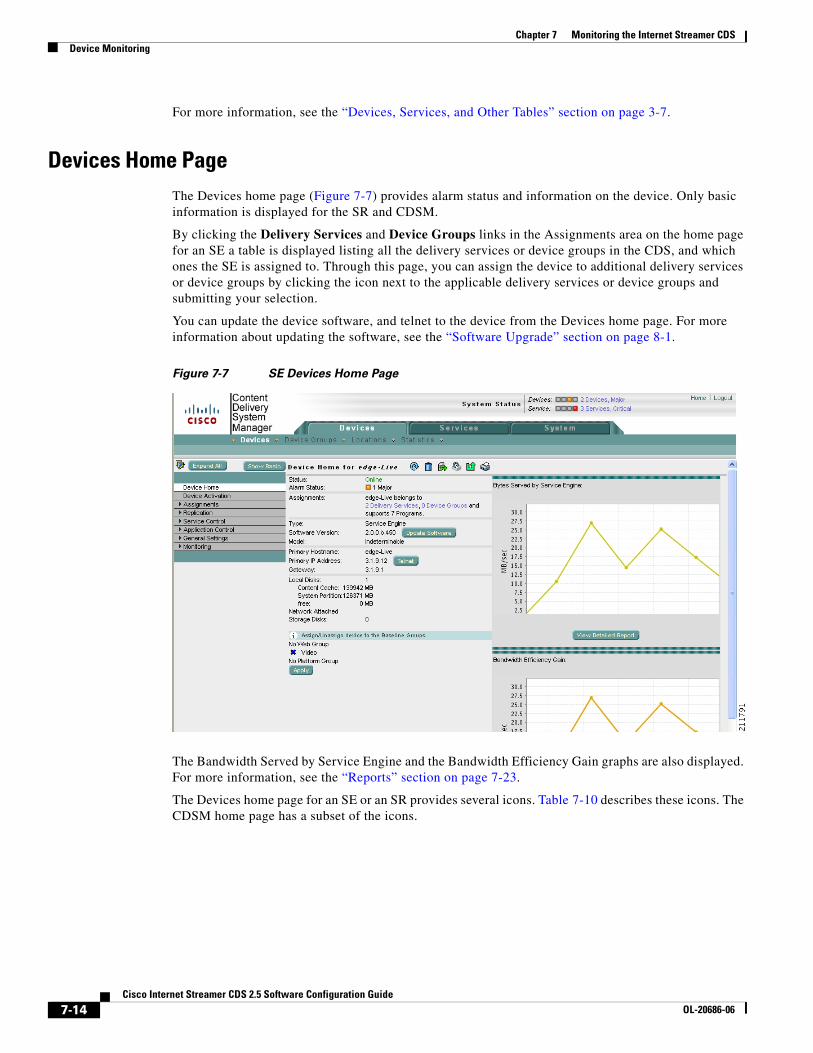
Devices Home PageThe Devices home page (Figure 7-7) provides alarm status and information on the device. Only basic information is displayed for the SR and CDSM.
By clicking the Delivery Services and Device Groups links in the Assignments area on the home page for an SE a table is displayed listing all the delivery services or device groups in the CDS, and which ones the SE is assigned to. Through this page, you can assign the device to additional delivery services or device groups by clicking the icon next to the applicable delivery services or device groups and submitting your selection.
You can update the device software, and telnet to the device from the Devices home page. For more information about updating the software, see the “Software Upgrade” section on page 8-1.
Figure 7-7 SE Devices Home Page
The Bandwidth Served by Service Engine and the Bandwidth Efficiency Gain graphs are also displayed. For more information, see the “Reports” section on page 7-23.
The Devices home page for an SE or an SR provides several icons. Table 7-10 describes these icons. The CDSM home page has a subset of the icons.
7-15Cisco Internet Streamer CDS 2.5 Software Configuration Guide
OL-20686-06
Chapter 7 Monitoring the Internet Streamer CDSDevice Monitoring
For more information about the Devices home page, see the “Devices Home Page” section on page 3-8.
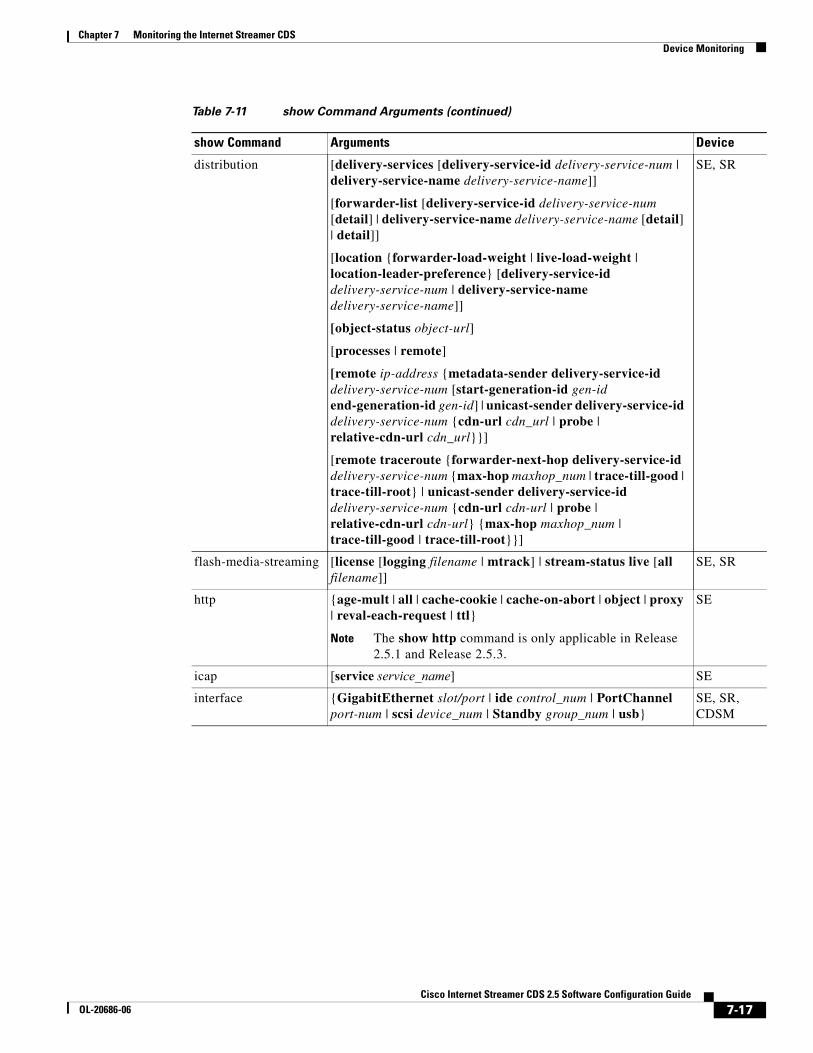
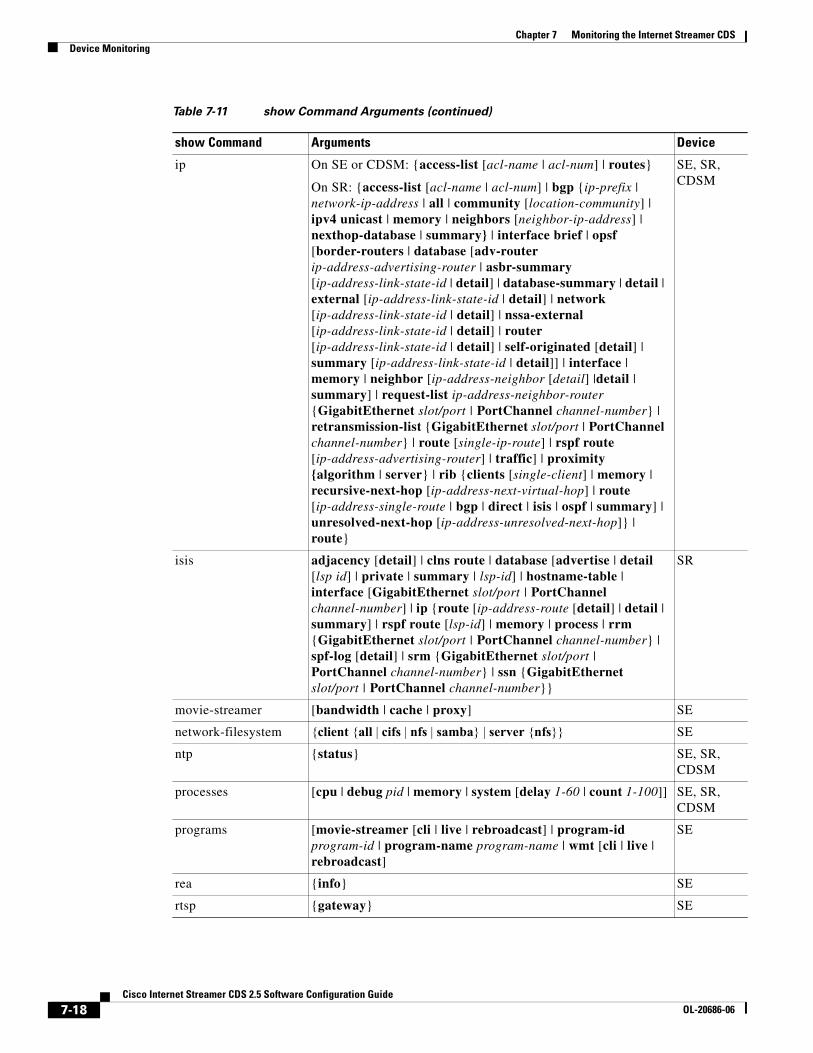
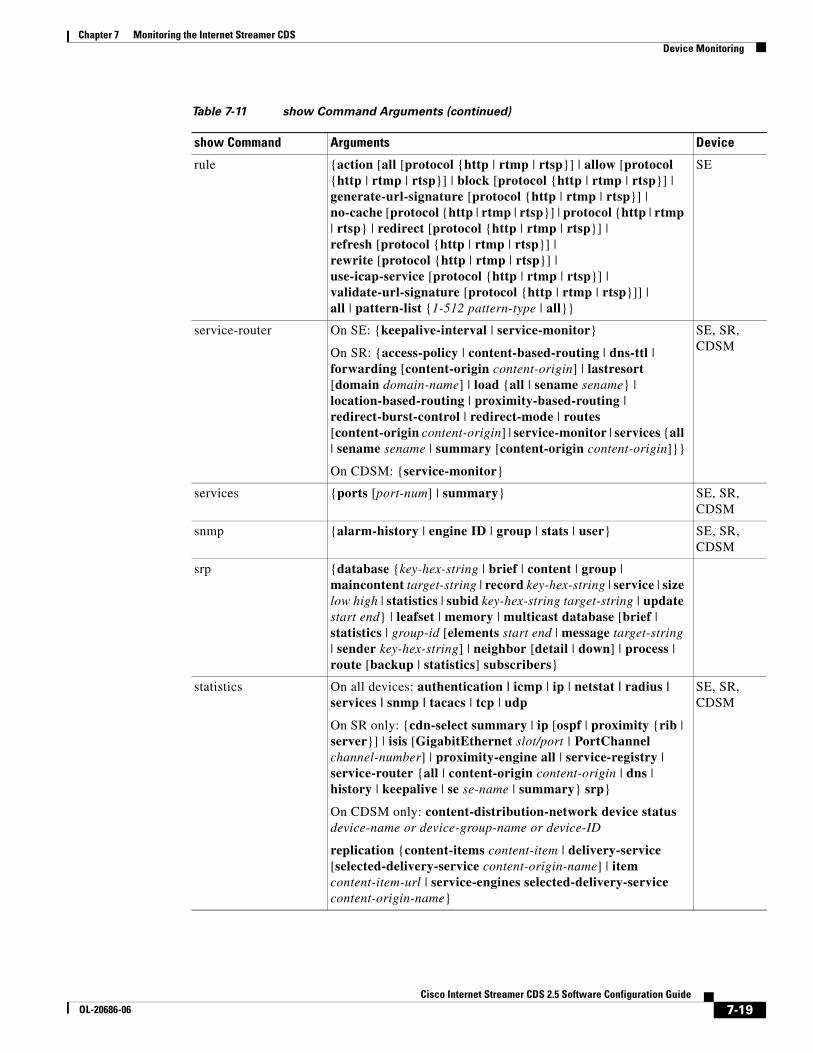
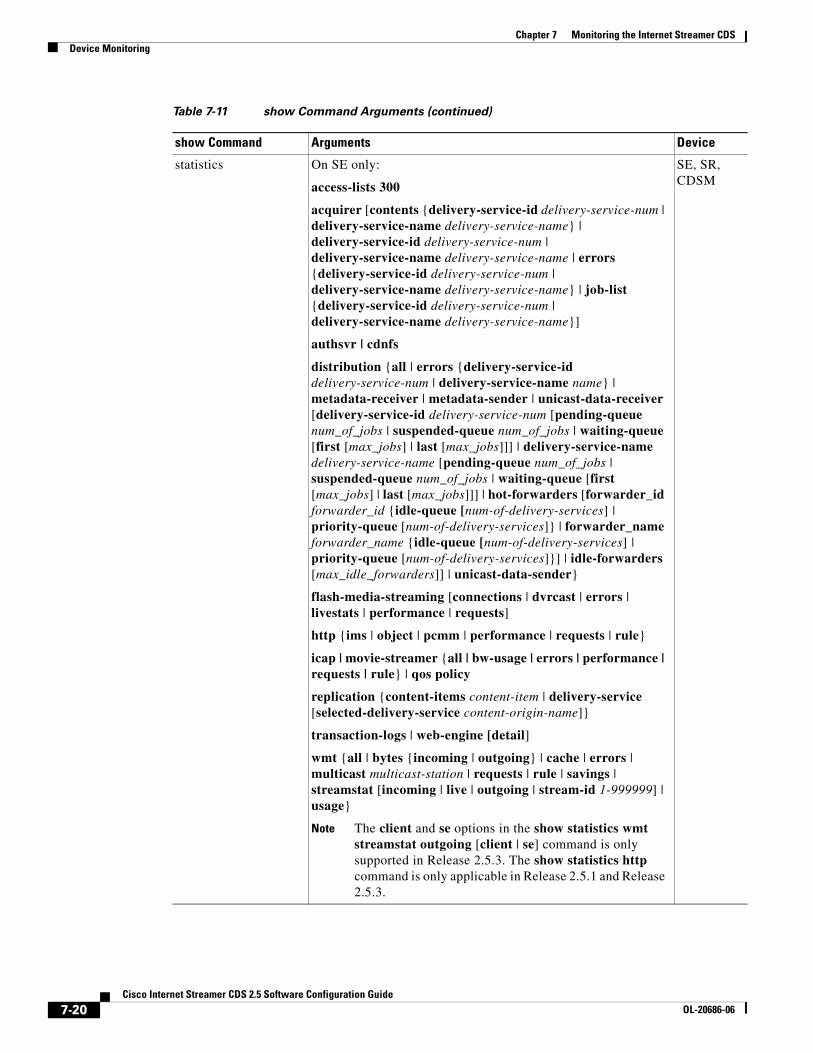
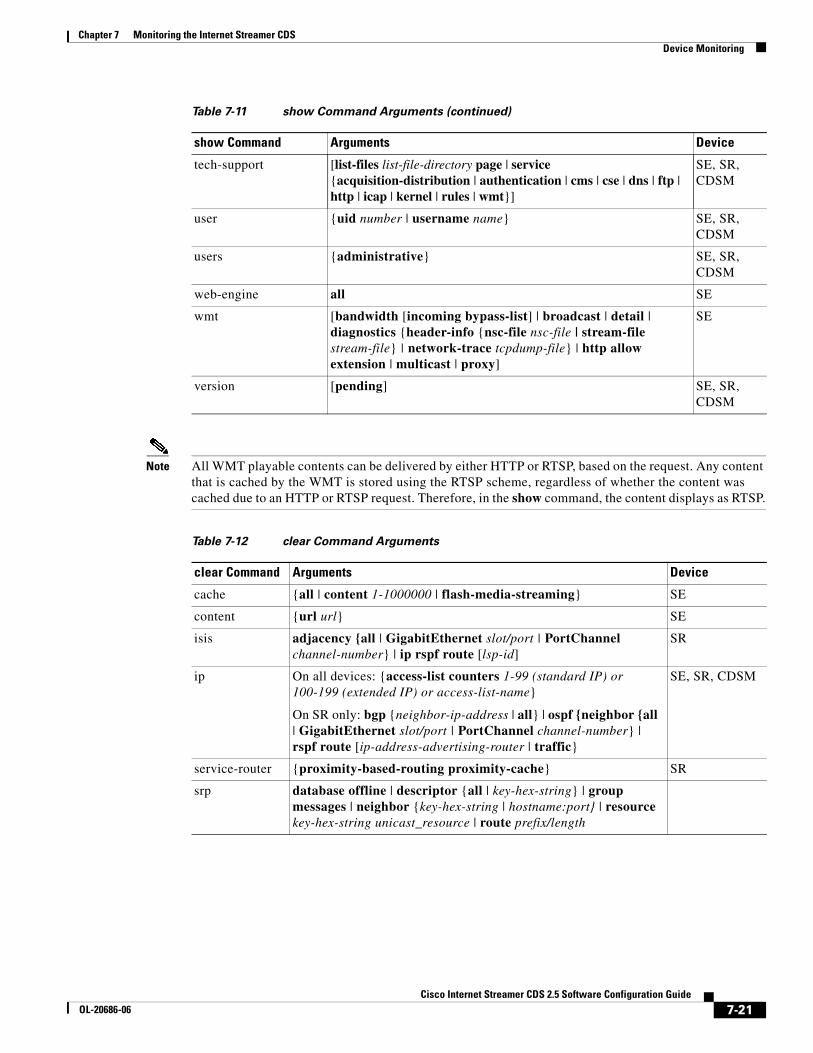
Using show and clear CommandsThe show and clear commands offer more detailed monitoring of the device. Table 7-11 lists only the show command parameters where arguments are required or are optional. Table 7-12 lists only the clear command parameters where arguments are required. A full list of the show and clear commands is available from the drop-down list on the respective page.
Using the CDSM show or clear Command Tool
To use the CDSM show or clear command tool, do the following:
Step 1 Choose Devices > Devices > Monitoring > Show/Clear Commands and then click either Show Commands or Clear Commands.
Step 2 From the drop-down list, choose a command.
Step 3 Enter arguments for the command, if any.
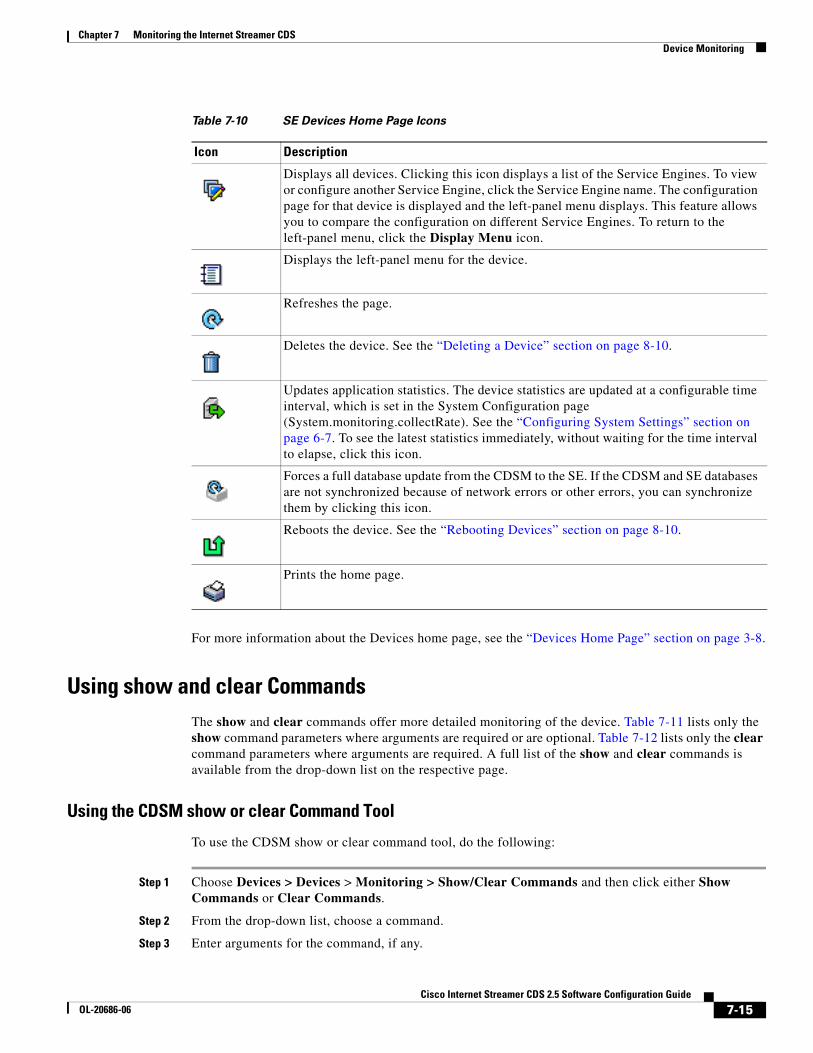
Table 7-10 SE Devices Home Page Icons
Icon Description
Displays all devices. Clicking this icon displays a list of the Service Engines. To view or configure another Service Engine, click the Service Engine name. The configuration page for that device is displayed and the left-panel menu displays. This feature allows you to compare the configuration on different Service Engines. To return to the left-panel menu, click the Display Menu icon.
Displays the left-panel menu for the device.
Refreshes the page.
Deletes the device. See the “Deleting a Device” section on page 8-10.
Updates application statistics. The device statistics are updated at a configurable time interval, which is set in the System Configuration page (System.monitoring.collectRate). See the “Configuring System Settings” section on page 6-7. To see the latest statistics immediately, without waiting for the time interval to elapse, click this icon.
Forces a full database update from the CDSM to the SE. If the CDSM and SE databases are not synchronized because of network errors or other errors, you can synchronize them by clicking this icon.
Reboots the device. See the “Rebooting Devices” section on page 8-10.
Prints the home page.
7-16Cisco Internet Streamer CDS 2.5 Software Configuration Guide
OL-20686-06
Chapter 7 Monitoring the Internet Streamer CDSDevice Monitoring
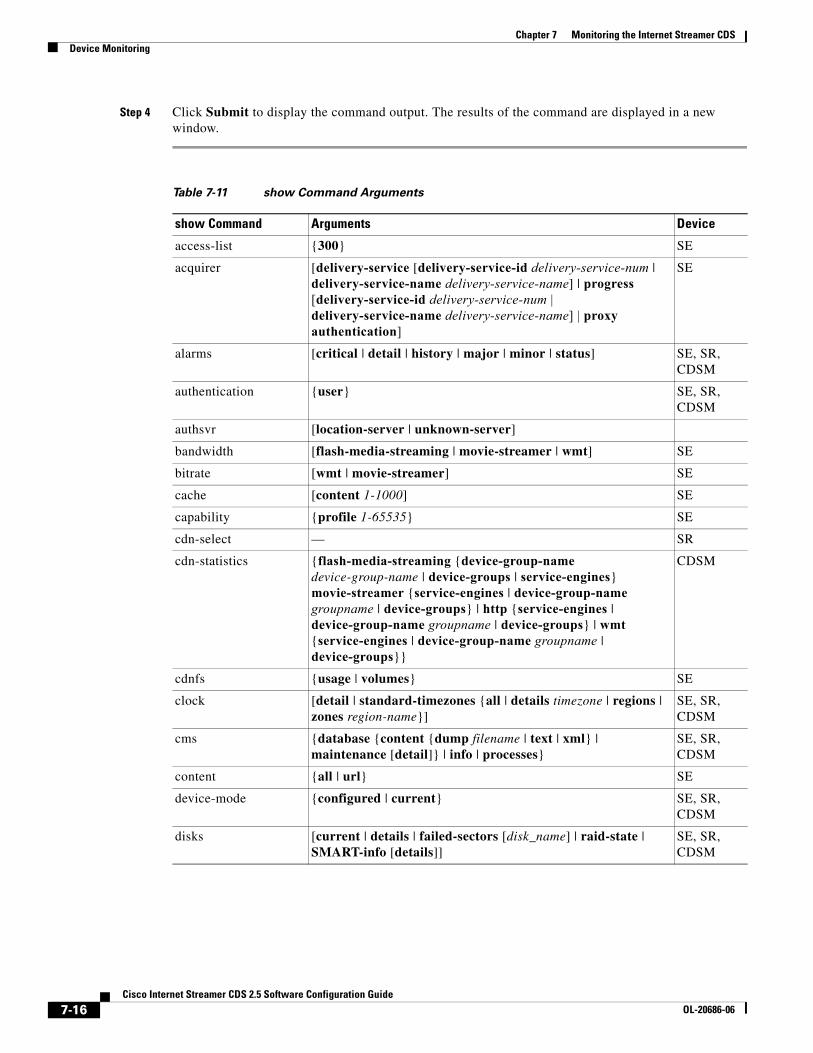
Step 4 Click Submit to display the command output. The results of the command are displayed in a new window.
Note The client and se options in the show statistics wmt streamstat outgoing [client | se] command is only supported in Release 2.5.3. The show statistics http command is only applicable in Release 2.5.1 and Release 2.5.3.
SE, SR, CDSM
Table 7-11 show Command Arguments (continued)
show Command Arguments Device
7-21Cisco Internet Streamer CDS 2.5 Software Configuration Guide
OL-20686-06
Chapter 7 Monitoring the Internet Streamer CDSDevice Monitoring
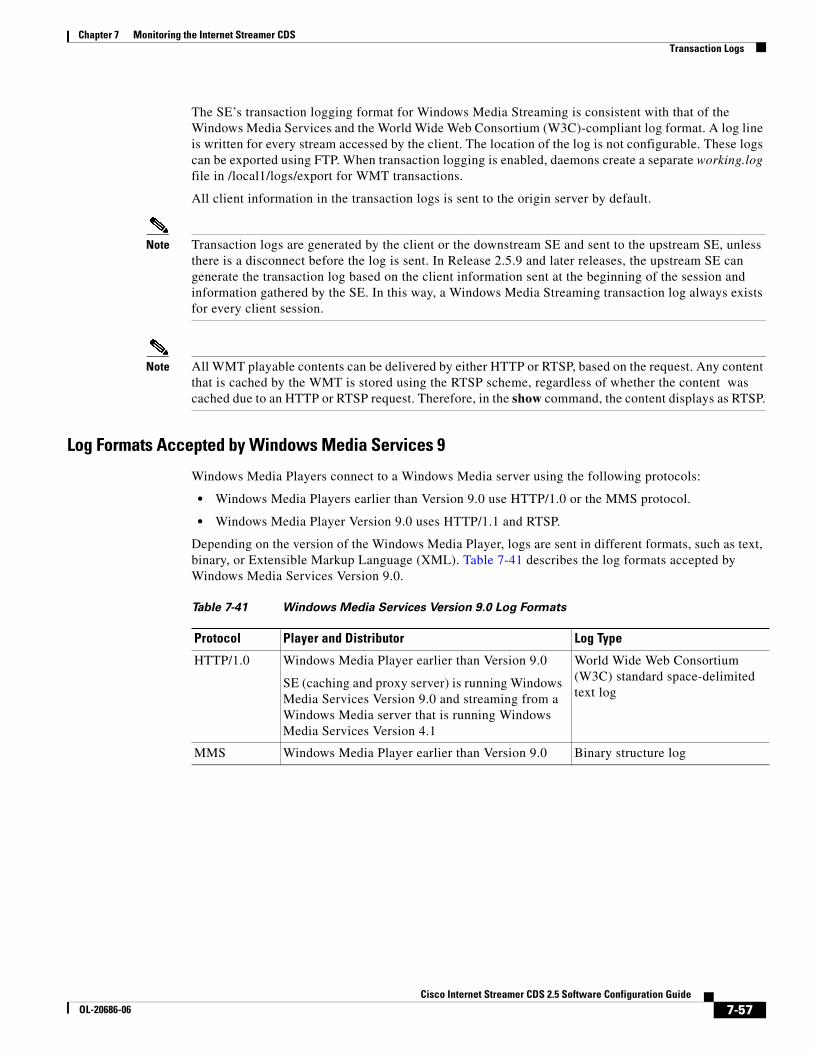
Note All WMT playable contents can be delivered by either HTTP or RTSP, based on the request. Any content that is cached by the WMT is stored using the RTSP scheme, regardless of whether the content was cached due to an HTTP or RTSP request. Therefore, in the show command, the content displays as RTSP.
7-22Cisco Internet Streamer CDS 2.5 Software Configuration Guide
OL-20686-06
Chapter 7 Monitoring the Internet Streamer CDSDevice Monitoring
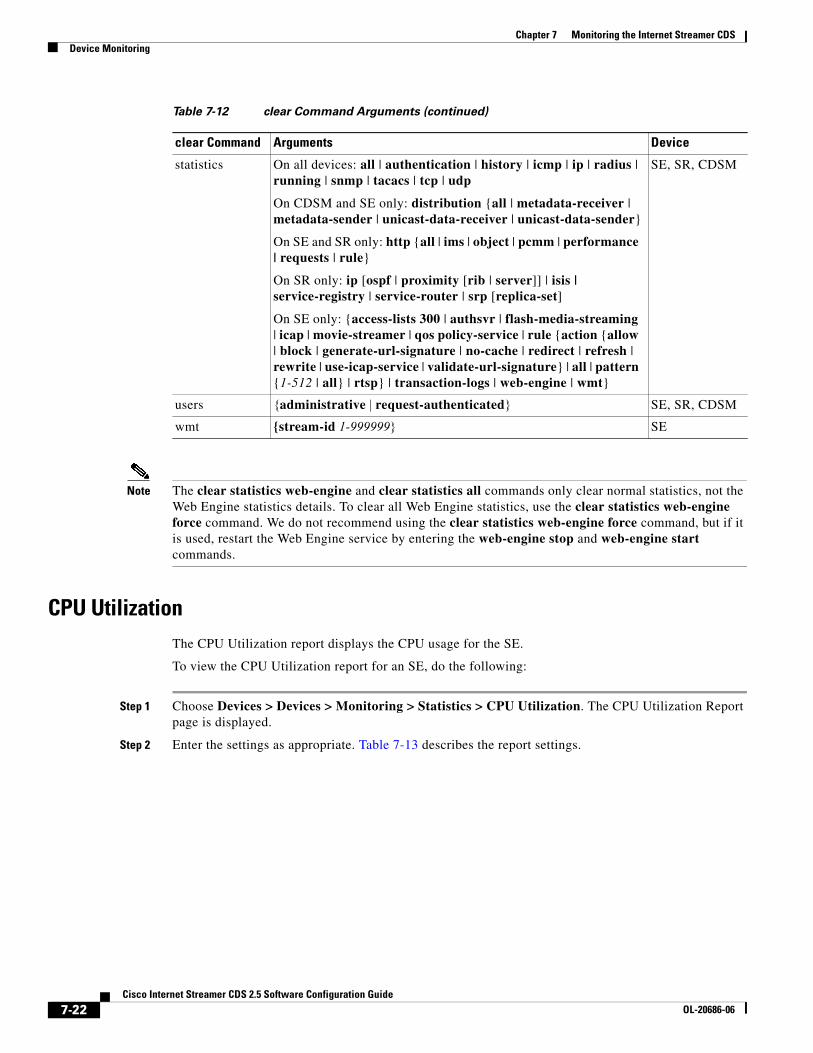
Note The clear statistics web-engine and clear statistics all commands only clear normal statistics, not the Web Engine statistics details. To clear all Web Engine statistics, use the clear statistics web-engine force command. We do not recommend using the clear statistics web-engine force command, but if it is used, restart the Web Engine service by entering the web-engine stop and web-engine start commands.
CPU UtilizationThe CPU Utilization report displays the CPU usage for the SE.
To view the CPU Utilization report for an SE, do the following:
Step 1 Choose Devices > Devices > Monitoring > Statistics > CPU Utilization. The CPU Utilization Report page is displayed.
Step 2 Enter the settings as appropriate. Table 7-13 describes the report settings.
statistics On all devices: all | authentication | history | icmp | ip | radius | running | snmp | tacacs | tcp | udp
On CDSM and SE only: distribution {all | metadata-receiver | metadata-sender | unicast-data-receiver | unicast-data-sender}
On SE and SR only: http {all | ims | object | pcmm | performance | requests | rule}
On SR only: ip [ospf | proximity [rib | server]] | isis | service-registry | service-router | srp [replica-set]
users {administrative | request-authenticated} SE, SR, CDSM
wmt {stream-id 1-999999} SE
Table 7-12 clear Command Arguments (continued)
clear Command Arguments Device
7-23Cisco Internet Streamer CDS 2.5 Software Configuration Guide
OL-20686-06
Chapter 7 Monitoring the Internet Streamer CDSReports
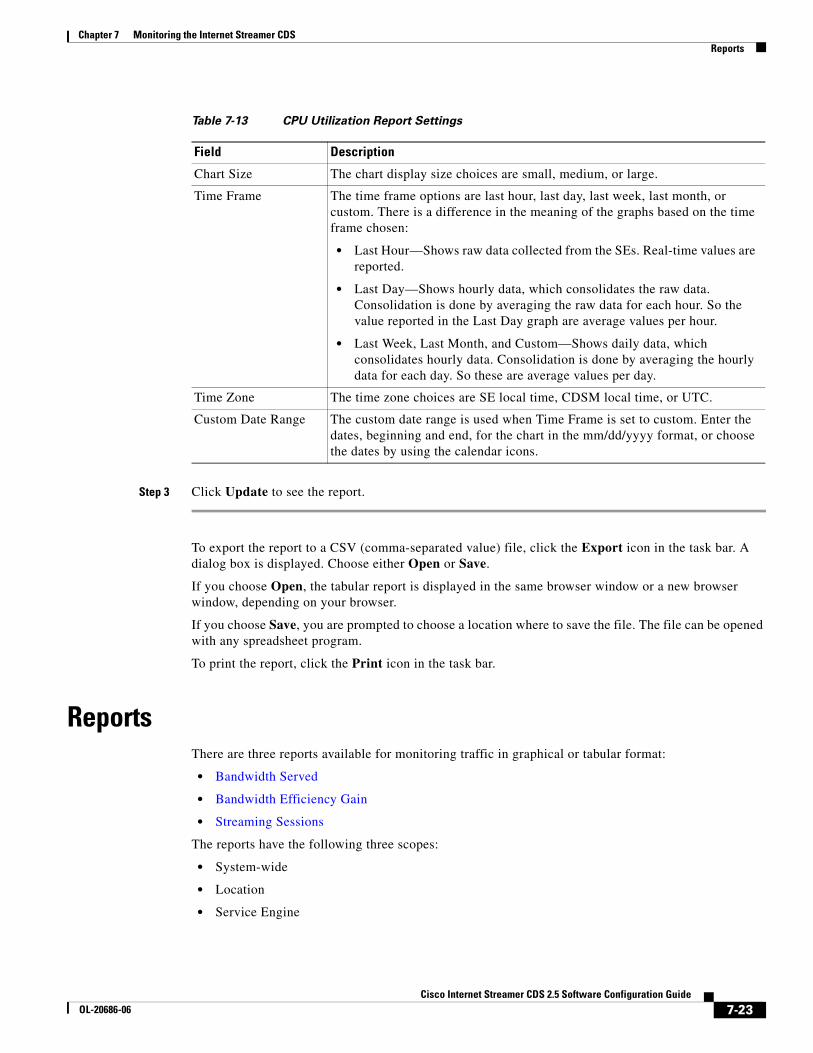
Step 3 Click Update to see the report.
To export the report to a CSV (comma-separated value) file, click the Export icon in the task bar. A dialog box is displayed. Choose either Open or Save.
If you choose Open, the tabular report is displayed in the same browser window or a new browser window, depending on your browser.
If you choose Save, you are prompted to choose a location where to save the file. The file can be opened with any spreadsheet program.
To print the report, click the Print icon in the task bar.
ReportsThere are three reports available for monitoring traffic in graphical or tabular format:
• Bandwidth Served
• Bandwidth Efficiency Gain
• Streaming Sessions
The reports have the following three scopes:
• System-wide
• Location
• Service Engine
Table 7-13 CPU Utilization Report Settings
Field Description
Chart Size The chart display size choices are small, medium, or large.
Time Frame The time frame options are last hour, last day, last week, last month, or custom. There is a difference in the meaning of the graphs based on the time frame chosen:
• Last Hour—Shows raw data collected from the SEs. Real-time values are reported.
• Last Day—Shows hourly data, which consolidates the raw data. Consolidation is done by averaging the raw data for each hour. So the value reported in the Last Day graph are average values per hour.
• Last Week, Last Month, and Custom—Shows daily data, which consolidates hourly data. Consolidation is done by averaging the hourly data for each day. So these are average values per day.
Time Zone The time zone choices are SE local time, CDSM local time, or UTC.
Custom Date Range The custom date range is used when Time Frame is set to custom. Enter the dates, beginning and end, for the chart in the mm/dd/yyyy format, or choose the dates by using the calendar icons.
7-24Cisco Internet Streamer CDS 2.5 Software Configuration Guide
OL-20686-06
Chapter 7 Monitoring the Internet Streamer CDSReports
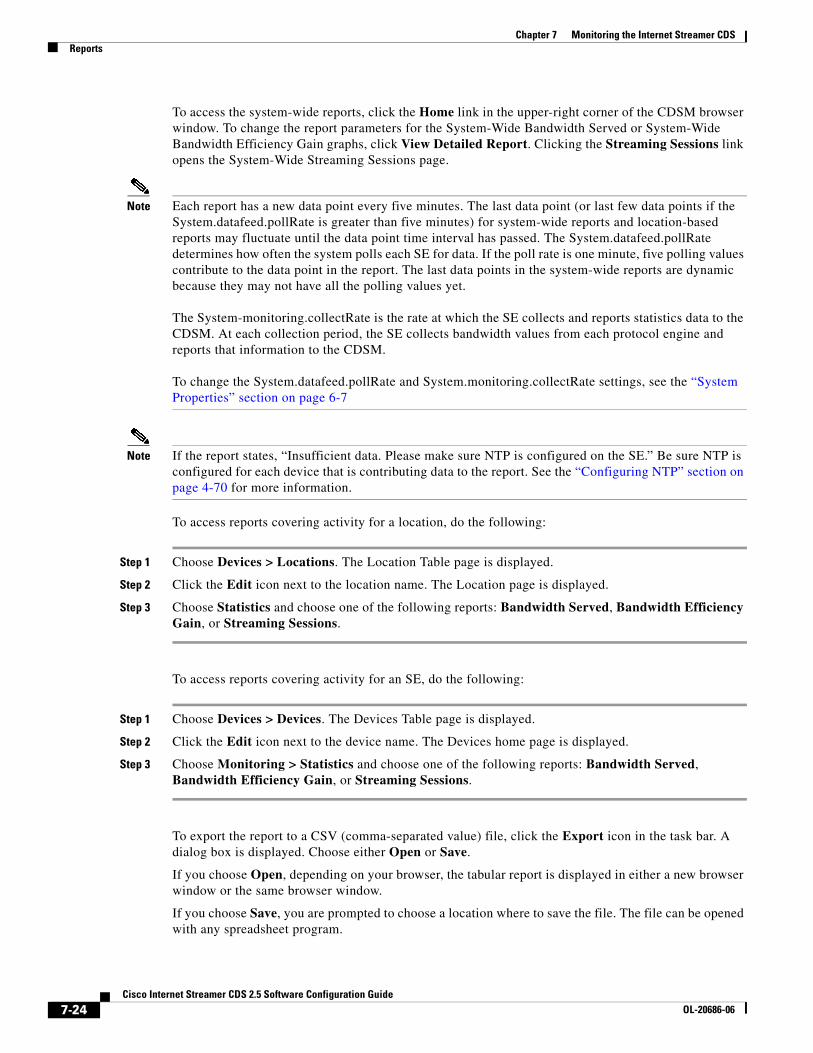
To access the system-wide reports, click the Home link in the upper-right corner of the CDSM browser window. To change the report parameters for the System-Wide Bandwidth Served or System-Wide Bandwidth Efficiency Gain graphs, click View Detailed Report. Clicking the Streaming Sessions link opens the System-Wide Streaming Sessions page.
Note Each report has a new data point every five minutes. The last data point (or last few data points if the System.datafeed.pollRate is greater than five minutes) for system-wide reports and location-based reports may fluctuate until the data point time interval has passed. The System.datafeed.pollRate determines how often the system polls each SE for data. If the poll rate is one minute, five polling values contribute to the data point in the report. The last data points in the system-wide reports are dynamic because they may not have all the polling values yet.
The System-monitoring.collectRate is the rate at which the SE collects and reports statistics data to the CDSM. At each collection period, the SE collects bandwidth values from each protocol engine and reports that information to the CDSM.
To change the System.datafeed.pollRate and System.monitoring.collectRate settings, see the “System Properties” section on page 6-7
Note If the report states, “Insufficient data. Please make sure NTP is configured on the SE.” Be sure NTP is configured for each device that is contributing data to the report. See the “Configuring NTP” section on page 4-70 for more information.
To access reports covering activity for a location, do the following:
Step 1 Choose Devices > Locations. The Location Table page is displayed.
Step 2 Click the Edit icon next to the location name. The Location page is displayed.
Step 3 Choose Statistics and choose one of the following reports: Bandwidth Served, Bandwidth Efficiency Gain, or Streaming Sessions.
To access reports covering activity for an SE, do the following:
Step 1 Choose Devices > Devices. The Devices Table page is displayed.
Step 2 Click the Edit icon next to the device name. The Devices home page is displayed.
Step 3 Choose Monitoring > Statistics and choose one of the following reports: Bandwidth Served, Bandwidth Efficiency Gain, or Streaming Sessions.
To export the report to a CSV (comma-separated value) file, click the Export icon in the task bar. A dialog box is displayed. Choose either Open or Save.
If you choose Open, depending on your browser, the tabular report is displayed in either a new browser window or the same browser window.
If you choose Save, you are prompted to choose a location where to save the file. The file can be opened with any spreadsheet program.
7-25Cisco Internet Streamer CDS 2.5 Software Configuration Guide
OL-20686-06
Chapter 7 Monitoring the Internet Streamer CDSReports
To print the report, click the Print icon in the task bar.
The reports are described in the following sections.
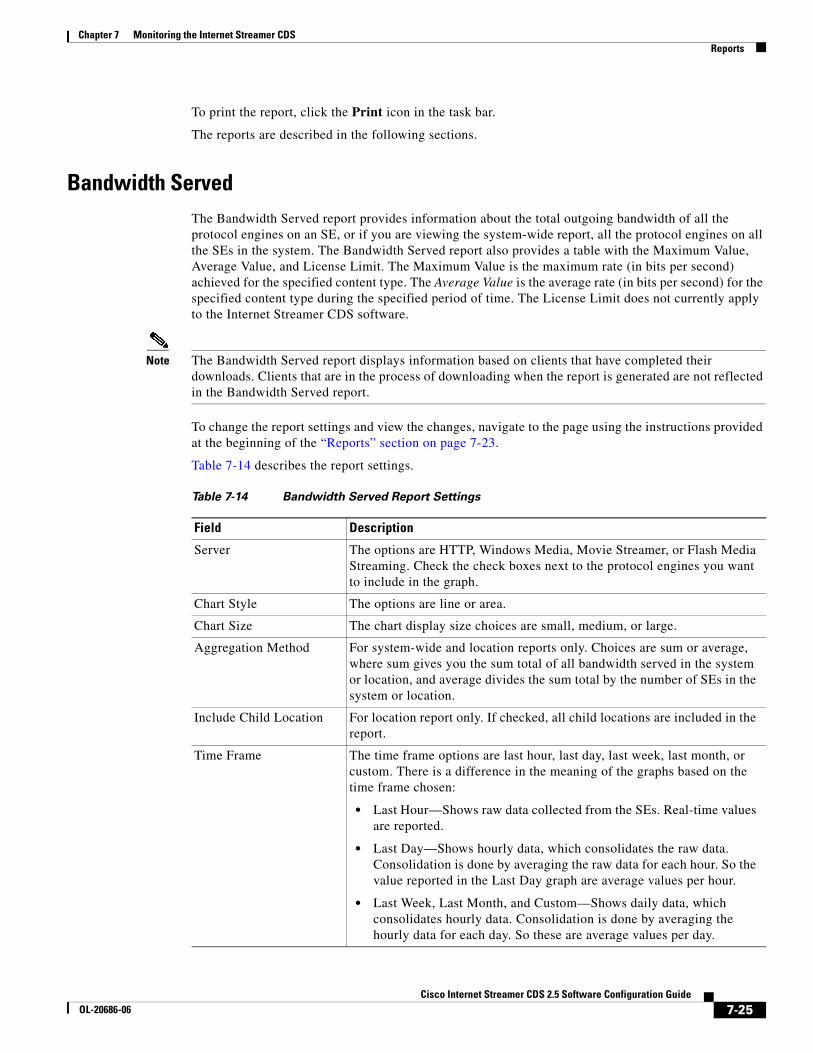
Bandwidth ServedThe Bandwidth Served report provides information about the total outgoing bandwidth of all the protocol engines on an SE, or if you are viewing the system-wide report, all the protocol engines on all the SEs in the system. The Bandwidth Served report also provides a table with the Maximum Value, Average Value, and License Limit. The Maximum Value is the maximum rate (in bits per second) achieved for the specified content type. The Average Value is the average rate (in bits per second) for the specified content type during the specified period of time. The License Limit does not currently apply to the Internet Streamer CDS software.
Note The Bandwidth Served report displays information based on clients that have completed their downloads. Clients that are in the process of downloading when the report is generated are not reflected in the Bandwidth Served report.
To change the report settings and view the changes, navigate to the page using the instructions provided at the beginning of the “Reports” section on page 7-23.
Table 7-14 describes the report settings.
Table 7-14 Bandwidth Served Report Settings
Field Description
Server The options are HTTP, Windows Media, Movie Streamer, or Flash Media Streaming. Check the check boxes next to the protocol engines you want to include in the graph.
Chart Style The options are line or area.
Chart Size The chart display size choices are small, medium, or large.
Aggregation Method For system-wide and location reports only. Choices are sum or average, where sum gives you the sum total of all bandwidth served in the system or location, and average divides the sum total by the number of SEs in the system or location.
Include Child Location For location report only. If checked, all child locations are included in the report.
Time Frame The time frame options are last hour, last day, last week, last month, or custom. There is a difference in the meaning of the graphs based on the time frame chosen:
• Last Hour—Shows raw data collected from the SEs. Real-time values are reported.
• Last Day—Shows hourly data, which consolidates the raw data. Consolidation is done by averaging the raw data for each hour. So the value reported in the Last Day graph are average values per hour.
• Last Week, Last Month, and Custom—Shows daily data, which consolidates hourly data. Consolidation is done by averaging the hourly data for each day. So these are average values per day.
7-26Cisco Internet Streamer CDS 2.5 Software Configuration Guide
OL-20686-06
Chapter 7 Monitoring the Internet Streamer CDSReports
Tip Set the Chart Style to medium to see the legend and timeline across the bottom.
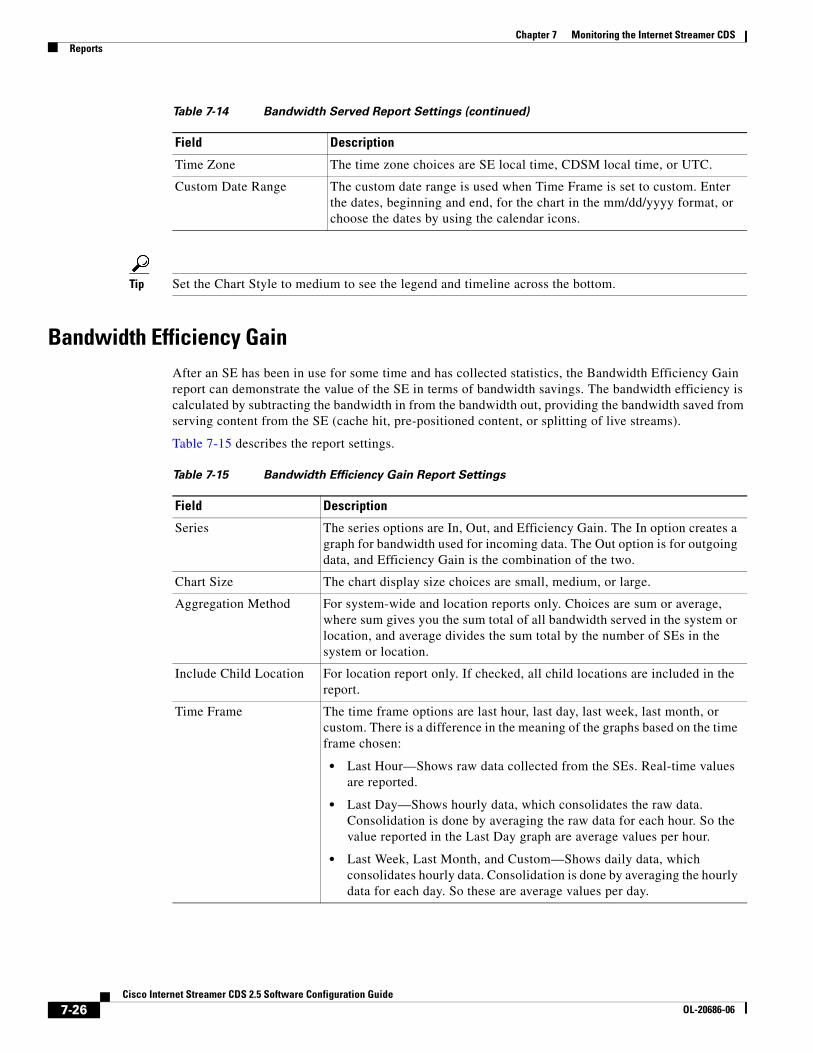
Bandwidth Efficiency GainAfter an SE has been in use for some time and has collected statistics, the Bandwidth Efficiency Gain report can demonstrate the value of the SE in terms of bandwidth savings. The bandwidth efficiency is calculated by subtracting the bandwidth in from the bandwidth out, providing the bandwidth saved from serving content from the SE (cache hit, pre-positioned content, or splitting of live streams).
Table 7-15 describes the report settings.
Time Zone The time zone choices are SE local time, CDSM local time, or UTC.
Custom Date Range The custom date range is used when Time Frame is set to custom. Enter the dates, beginning and end, for the chart in the mm/dd/yyyy format, or choose the dates by using the calendar icons.
Table 7-14 Bandwidth Served Report Settings (continued)
Field Description
Table 7-15 Bandwidth Efficiency Gain Report Settings
Field Description
Series The series options are In, Out, and Efficiency Gain. The In option creates a graph for bandwidth used for incoming data. The Out option is for outgoing data, and Efficiency Gain is the combination of the two.
Chart Size The chart display size choices are small, medium, or large.
Aggregation Method For system-wide and location reports only. Choices are sum or average, where sum gives you the sum total of all bandwidth served in the system or location, and average divides the sum total by the number of SEs in the system or location.
Include Child Location For location report only. If checked, all child locations are included in the report.
Time Frame The time frame options are last hour, last day, last week, last month, or custom. There is a difference in the meaning of the graphs based on the time frame chosen:
• Last Hour—Shows raw data collected from the SEs. Real-time values are reported.
• Last Day—Shows hourly data, which consolidates the raw data. Consolidation is done by averaging the raw data for each hour. So the value reported in the Last Day graph are average values per hour.
• Last Week, Last Month, and Custom—Shows daily data, which consolidates hourly data. Consolidation is done by averaging the hourly data for each day. So these are average values per day.
7-27Cisco Internet Streamer CDS 2.5 Software Configuration Guide
OL-20686-06
Chapter 7 Monitoring the Internet Streamer CDSReports
Tip Set the Chart Size to medium to see the legend and timeline across the bottom.
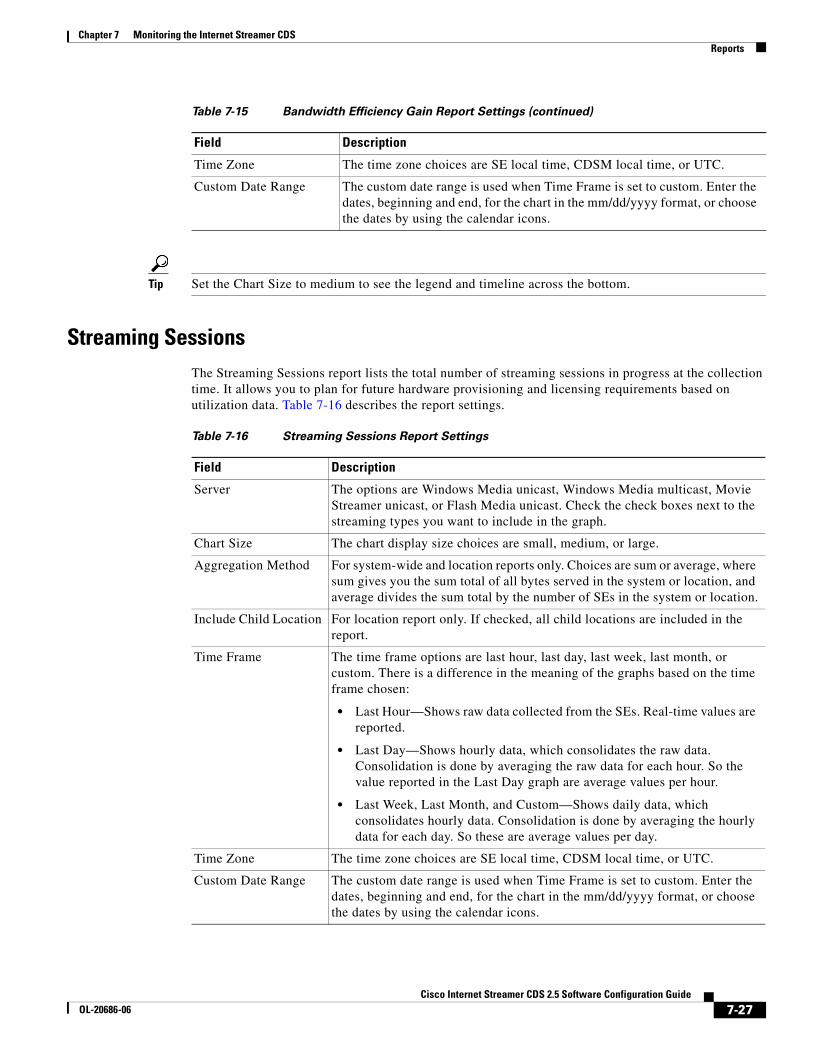
Streaming SessionsThe Streaming Sessions report lists the total number of streaming sessions in progress at the collection time. It allows you to plan for future hardware provisioning and licensing requirements based on utilization data. Table 7-16 describes the report settings.
Time Zone The time zone choices are SE local time, CDSM local time, or UTC.
Custom Date Range The custom date range is used when Time Frame is set to custom. Enter the dates, beginning and end, for the chart in the mm/dd/yyyy format, or choose the dates by using the calendar icons.
Table 7-15 Bandwidth Efficiency Gain Report Settings (continued)
Field Description
Table 7-16 Streaming Sessions Report Settings
Field Description
Server The options are Windows Media unicast, Windows Media multicast, Movie Streamer unicast, or Flash Media unicast. Check the check boxes next to the streaming types you want to include in the graph.
Chart Size The chart display size choices are small, medium, or large.
Aggregation Method For system-wide and location reports only. Choices are sum or average, where sum gives you the sum total of all bytes served in the system or location, and average divides the sum total by the number of SEs in the system or location.
Include Child Location For location report only. If checked, all child locations are included in the report.
Time Frame The time frame options are last hour, last day, last week, last month, or custom. There is a difference in the meaning of the graphs based on the time frame chosen:
• Last Hour—Shows raw data collected from the SEs. Real-time values are reported.
• Last Day—Shows hourly data, which consolidates the raw data. Consolidation is done by averaging the raw data for each hour. So the value reported in the Last Day graph are average values per hour.
• Last Week, Last Month, and Custom—Shows daily data, which consolidates hourly data. Consolidation is done by averaging the hourly data for each day. So these are average values per day.
Time Zone The time zone choices are SE local time, CDSM local time, or UTC.
Custom Date Range The custom date range is used when Time Frame is set to custom. Enter the dates, beginning and end, for the chart in the mm/dd/yyyy format, or choose the dates by using the calendar icons.
7-28Cisco Internet Streamer CDS 2.5 Software Configuration Guide
OL-20686-06
Chapter 7 Monitoring the Internet Streamer CDSDelivery Service Monitoring
Note Streaming Sessions statistics report for Movie Streamer is only available for unicast. When a client is joining a multicast group for multicast streaming, CDS Movie Streamer only knows that a client is downloading the SDP file, but no information is exchanged between the client and Movie Streamer on the streaming data session; therefore there are no session statistics for multicast Movie Streamer sessions.
Tip Set the Chart Size to medium to see the legend and timeline across the bottom.
Delivery Service MonitoringThis section covers the following topics:
• Delivery Services Table
• Replication Status for a Delivery Service
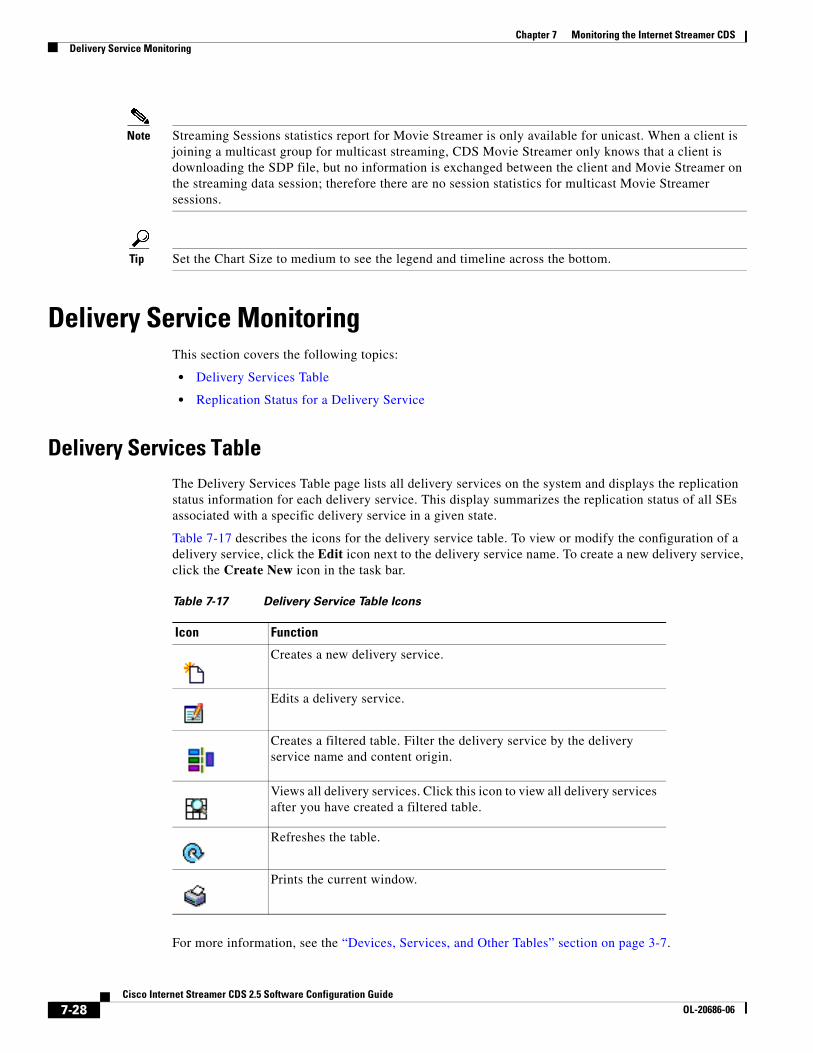
Delivery Services TableThe Delivery Services Table page lists all delivery services on the system and displays the replication status information for each delivery service. This display summarizes the replication status of all SEs associated with a specific delivery service in a given state.
Table 7-17 describes the icons for the delivery service table. To view or modify the configuration of a delivery service, click the Edit icon next to the delivery service name. To create a new delivery service, click the Create New icon in the task bar.
For more information, see the “Devices, Services, and Other Tables” section on page 3-7.
Table 7-17 Delivery Service Table Icons
Icon Function
Creates a new delivery service.
Edits a delivery service.
Creates a filtered table. Filter the delivery service by the delivery service name and content origin.
Views all delivery services. Click this icon to view all delivery services after you have created a filtered table.
Refreshes the table.
Prints the current window.
7-29Cisco Internet Streamer CDS 2.5 Software Configuration Guide
OL-20686-06
Chapter 7 Monitoring the Internet Streamer CDSDelivery Service Monitoring
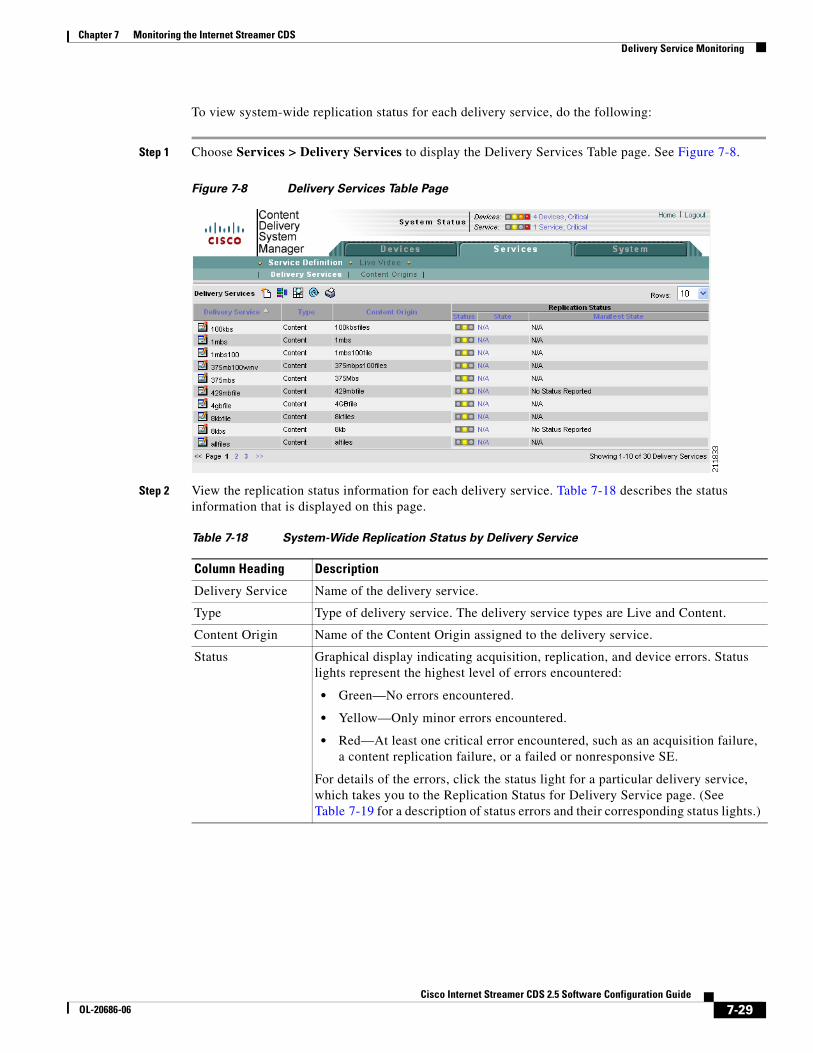
To view system-wide replication status for each delivery service, do the following:
Step 1 Choose Services > Delivery Services to display the Delivery Services Table page. See Figure 7-8.
Figure 7-8 Delivery Services Table Page
Step 2 View the replication status information for each delivery service. Table 7-18 describes the status information that is displayed on this page.
Table 7-18 System-Wide Replication Status by Delivery Service
Column Heading Description
Delivery Service Name of the delivery service.
Type Type of delivery service. The delivery service types are Live and Content.
Content Origin Name of the Content Origin assigned to the delivery service.
Status Graphical display indicating acquisition, replication, and device errors. Status lights represent the highest level of errors encountered:
• Green—No errors encountered.
• Yellow—Only minor errors encountered.
• Red—At least one critical error encountered, such as an acquisition failure, a content replication failure, or a failed or nonresponsive SE.
For details of the errors, click the status light for a particular delivery service, which takes you to the Replication Status for Delivery Service page. (See Table 7-19 for a description of status errors and their corresponding status lights.)
7-30Cisco Internet Streamer CDS 2.5 Software Configuration Guide
OL-20686-06
Chapter 7 Monitoring the Internet Streamer CDSDelivery Service Monitoring
Table 7-19 describes the status errors and their corresponding status lights.
State State of the delivery service. States are reported for the Content Acquirer and for receiver SEs. (See Table 7-20 for a definition of the different delivery service states.)
The state is also a link to the Replication Status for Delivery Service page that provides a more detailed view of the replication status for the delivery service. (See Figure 7-9.)
Manifest State State of the Manifest file. States reported are as follows:
• Fetching—The Manifest file is being fetched.
• Fail Fetching—The Manifest file has failed to be fetched.
• Parsing—The Manifest file is being parsed.
• Fail Parsing—The Manifest file has failed to be parsed.
• Completed—The Manifest file was successfully fetched and parsed.
• No Status Reported—Content Acquirer is in a Pending or Disabled state.
Table 7-18 System-Wide Replication Status by Delivery Service (continued)
Column Heading Description
Table 7-19 Delivery Service Status Errors
Status Light Error Description
Yellow Manifest retrieval error The Content Acquirer cannot retrieve the Manifest file for one or two consecutive attempts.
Red Manifest retrieval error The Content Acquirer cannot retrieve the Manifest file for three consecutive attempts.
Red Manifest syntax error The Content Acquirer fails to parse the Manifest file.
Red Crawl job processing error The Content Acquirer encounters problems while crawling for content.
Red Acquisition or content replication error
The SE fails to obtain the content.
Red Disk quota exceeded error The SE cannot store or process the content because there is no more disk space available.
Yellow Replication status update error
Content replication failed for one or two consecutive attempts.
Red Replication status update error
Content replication failed for three or more consecutive attempts.
Red SE unreachable error The SE is offline or the SE has not responded to replication status requests for three consecutive polling periods.
Red Root SE failover The Content Acquirer has failed over to a temporary Content Acquirer. Receiver SEs have not identified a valid Content Acquirer.
Red Receiver SE device or delivery service error
Receiver SE is not reporting replication status or any other content replication problem.
7-31Cisco Internet Streamer CDS 2.5 Software Configuration Guide
OL-20686-06
Chapter 7 Monitoring the Internet Streamer CDSDelivery Service Monitoring
Table 7-20 defines the different delivery service states.
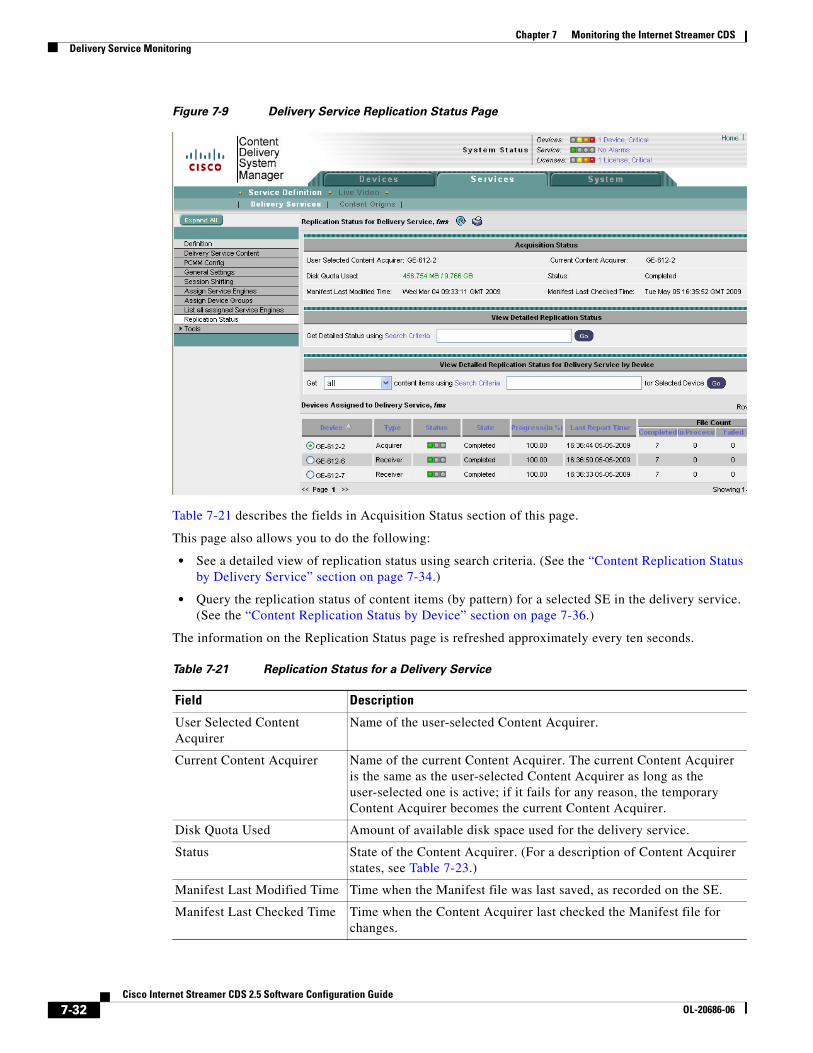
Replication Status for a Delivery ServiceTo view the replication status for a delivery service, you can either click the alarm light or Replication Status link in the Delivery Services Table page, or click the Replication Status option from the Delivery Service left-panel menu. Figure 7-9 shows the Replication Status page for a delivery service. The Replication Status page is refreshed automatically every 15 seconds.
Table 7-20 Delivery Service States in Replication Status
State Description
Completed All receiver SEs are in the Completed state, and the Content Acquirer is in the Completed, Re-checking Content, Retrieving Manifest, or Processing Manifest state. (See Table 7-23 on page 7-33 for a description of SE states.)
When the Content Acquirer in the Re-checking Content state determines that new content needs to be acquired, the delivery service state changes to In Process.
In Process In Process can mean:
• Content Acquirer is in the Retrieving Manifest, Processing Manifest, Acquiring Content, or Re-checking Content state.
• Any receiver SE is in the Pending Update from Content Acquirer, Replicating, or Recovering from Failure state.
• Content Acquirer has failed and receiver SEs are still reporting status.
Failed Failed can mean:
• Acquisition or content replication error has occurred. (See Table 7-19 on page 7-30.)
• SE has gone offline or has not reported status in three consecutive polling periods.
• Delivery service has more than one Content Acquirer
• Delivery service has no Content Acquirer, but has receiver SEs reporting replication status.
7-32Cisco Internet Streamer CDS 2.5 Software Configuration Guide
OL-20686-06
Chapter 7 Monitoring the Internet Streamer CDSDelivery Service Monitoring
Figure 7-9 Delivery Service Replication Status Page
Table 7-21 describes the fields in Acquisition Status section of this page.
This page also allows you to do the following:
• See a detailed view of replication status using search criteria. (See the “Content Replication Status by Delivery Service” section on page 7-34.)
• Query the replication status of content items (by pattern) for a selected SE in the delivery service. (See the “Content Replication Status by Device” section on page 7-36.)
The information on the Replication Status page is refreshed approximately every ten seconds.
Table 7-21 Replication Status for a Delivery Service
Field Description
User Selected Content Acquirer
Name of the user-selected Content Acquirer.
Current Content Acquirer Name of the current Content Acquirer. The current Content Acquirer is the same as the user-selected Content Acquirer as long as the user-selected one is active; if it fails for any reason, the temporary Content Acquirer becomes the current Content Acquirer.
Disk Quota Used Amount of available disk space used for the delivery service.
Status State of the Content Acquirer. (For a description of Content Acquirer states, see Table 7-23.)
Manifest Last Modified Time Time when the Manifest file was last saved, as recorded on the SE.
Manifest Last Checked Time Time when the Content Acquirer last checked the Manifest file for changes.
7-33Cisco Internet Streamer CDS 2.5 Software Configuration Guide
OL-20686-06
Chapter 7 Monitoring the Internet Streamer CDSDelivery Service Monitoring
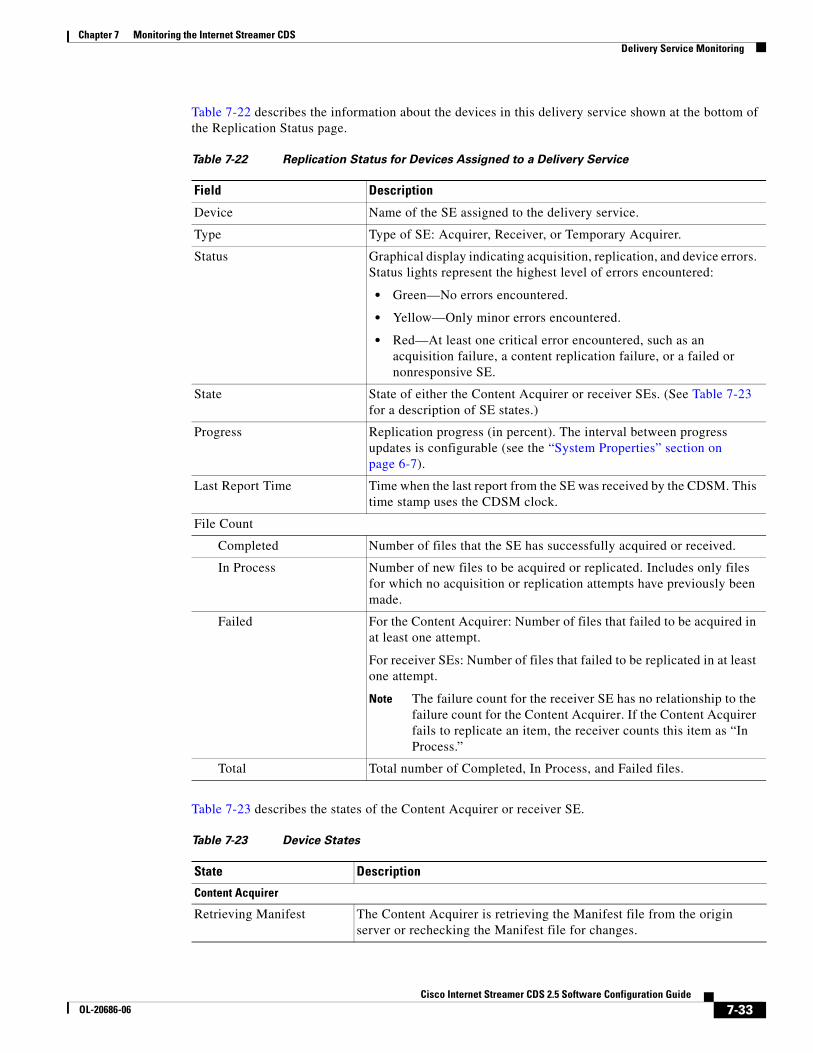
Table 7-22 describes the information about the devices in this delivery service shown at the bottom of the Replication Status page.
Table 7-23 describes the states of the Content Acquirer or receiver SE.
Table 7-22 Replication Status for Devices Assigned to a Delivery Service
Field Description
Device Name of the SE assigned to the delivery service.
Type Type of SE: Acquirer, Receiver, or Temporary Acquirer.
Status Graphical display indicating acquisition, replication, and device errors. Status lights represent the highest level of errors encountered:
• Green—No errors encountered.
• Yellow—Only minor errors encountered.
• Red—At least one critical error encountered, such as an acquisition failure, a content replication failure, or a failed or nonresponsive SE.
State State of either the Content Acquirer or receiver SEs. (See Table 7-23 for a description of SE states.)
Progress Replication progress (in percent). The interval between progress updates is configurable (see the “System Properties” section on page 6-7).
Last Report Time Time when the last report from the SE was received by the CDSM. This time stamp uses the CDSM clock.
File Count
Completed Number of files that the SE has successfully acquired or received.
In Process Number of new files to be acquired or replicated. Includes only files for which no acquisition or replication attempts have previously been made.
Failed For the Content Acquirer: Number of files that failed to be acquired in at least one attempt.
For receiver SEs: Number of files that failed to be replicated in at least one attempt.
Note The failure count for the receiver SE has no relationship to the failure count for the Content Acquirer. If the Content Acquirer fails to replicate an item, the receiver counts this item as “In Process.”
Total Total number of Completed, In Process, and Failed files.
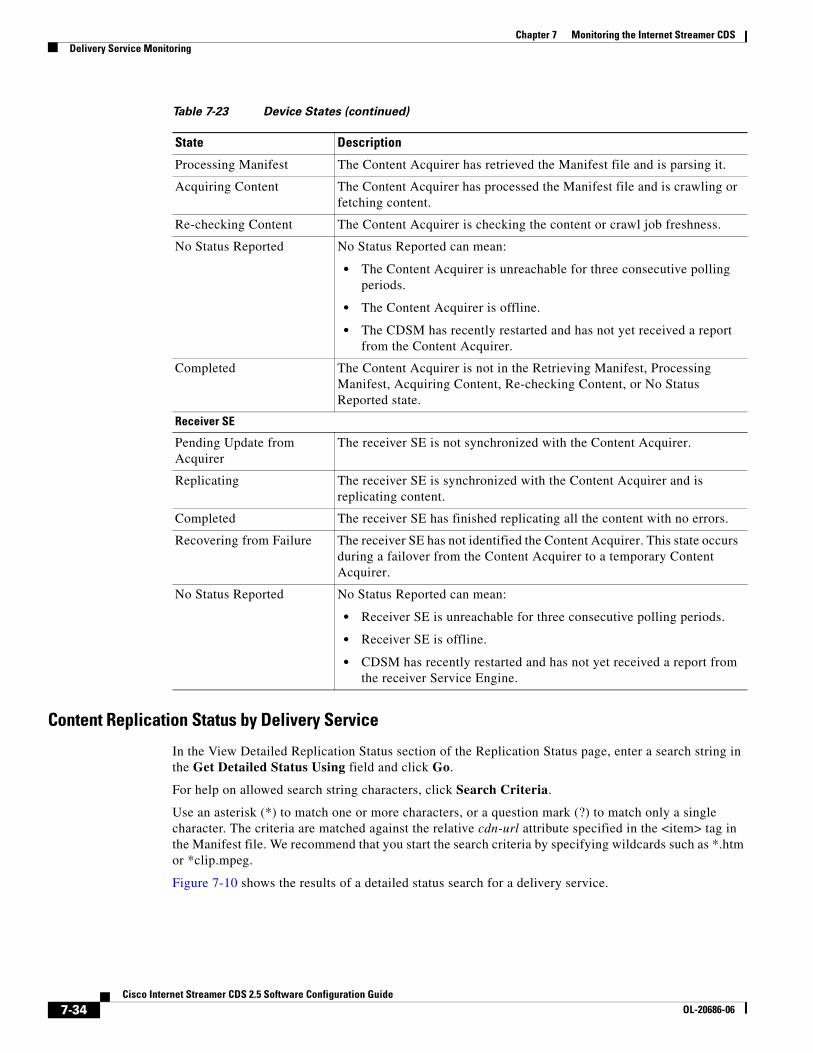
Table 7-23 Device States
State Description
Content Acquirer
Retrieving Manifest The Content Acquirer is retrieving the Manifest file from the origin server or rechecking the Manifest file for changes.
7-34Cisco Internet Streamer CDS 2.5 Software Configuration Guide
OL-20686-06
Chapter 7 Monitoring the Internet Streamer CDSDelivery Service Monitoring
Content Replication Status by Delivery Service
In the View Detailed Replication Status section of the Replication Status page, enter a search string in the Get Detailed Status Using field and click Go.
For help on allowed search string characters, click Search Criteria.
Use an asterisk (*) to match one or more characters, or a question mark (?) to match only a single character. The criteria are matched against the relative cdn-url attribute specified in the <item> tag in the Manifest file. We recommend that you start the search criteria by specifying wildcards such as *.htm or *clip.mpeg.
Figure 7-10 shows the results of a detailed status search for a delivery service.
Processing Manifest The Content Acquirer has retrieved the Manifest file and is parsing it.
Acquiring Content The Content Acquirer has processed the Manifest file and is crawling or fetching content.
Re-checking Content The Content Acquirer is checking the content or crawl job freshness.
No Status Reported No Status Reported can mean:
• The Content Acquirer is unreachable for three consecutive polling periods.
• The Content Acquirer is offline.
• The CDSM has recently restarted and has not yet received a report from the Content Acquirer.
Completed The Content Acquirer is not in the Retrieving Manifest, Processing Manifest, Acquiring Content, Re-checking Content, or No Status Reported state.
Receiver SE
Pending Update from Acquirer
The receiver SE is not synchronized with the Content Acquirer.
Replicating The receiver SE is synchronized with the Content Acquirer and is replicating content.
Completed The receiver SE has finished replicating all the content with no errors.
Recovering from Failure The receiver SE has not identified the Content Acquirer. This state occurs during a failover from the Content Acquirer to a temporary Content Acquirer.
No Status Reported No Status Reported can mean:
• Receiver SE is unreachable for three consecutive polling periods.
• Receiver SE is offline.
• CDSM has recently restarted and has not yet received a report from the receiver Service Engine.
Table 7-23 Device States (continued)
State Description
7-35Cisco Internet Streamer CDS 2.5 Software Configuration Guide
OL-20686-06
Chapter 7 Monitoring the Internet Streamer CDSDelivery Service Monitoring
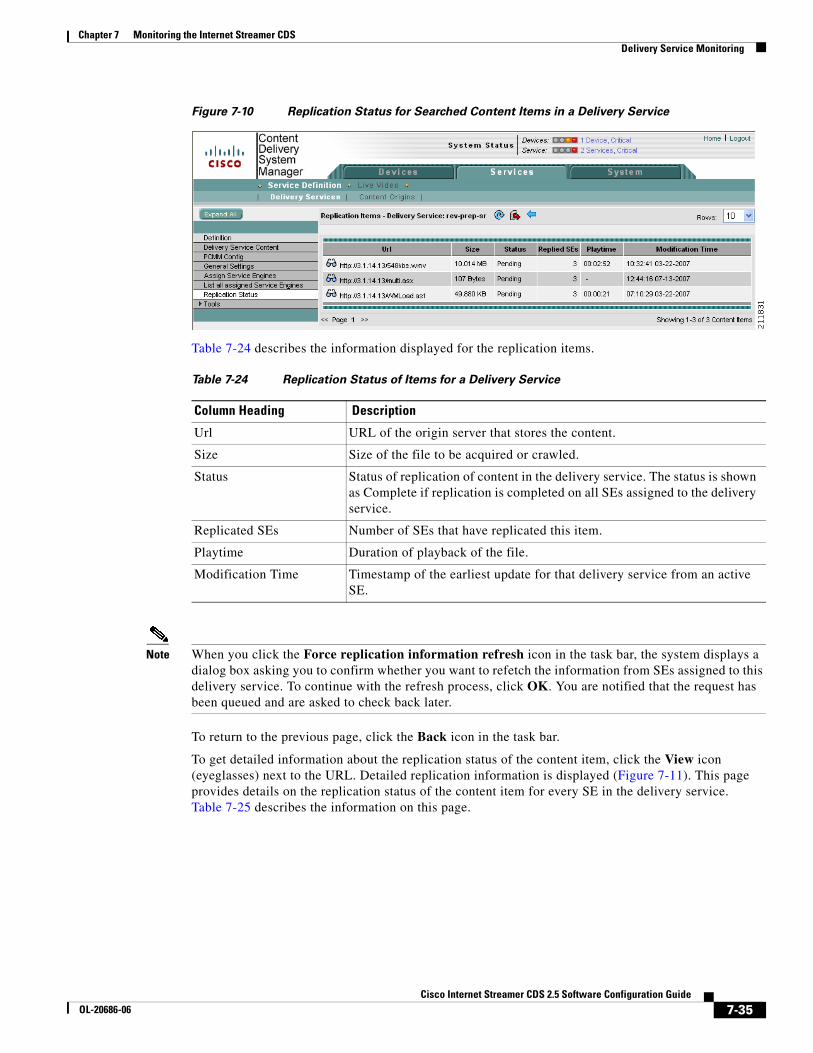
Figure 7-10 Replication Status for Searched Content Items in a Delivery Service
Table 7-24 describes the information displayed for the replication items.
Note When you click the Force replication information refresh icon in the task bar, the system displays a dialog box asking you to confirm whether you want to refetch the information from SEs assigned to this delivery service. To continue with the refresh process, click OK. You are notified that the request has been queued and are asked to check back later.
To return to the previous page, click the Back icon in the task bar.
To get detailed information about the replication status of the content item, click the View icon (eyeglasses) next to the URL. Detailed replication information is displayed (Figure 7-11). This page provides details on the replication status of the content item for every SE in the delivery service. Table 7-25 describes the information on this page.
Table 7-24 Replication Status of Items for a Delivery Service
Column Heading Description
Url URL of the origin server that stores the content.
Size Size of the file to be acquired or crawled.
Status Status of replication of content in the delivery service. The status is shown as Complete if replication is completed on all SEs assigned to the delivery service.
Replicated SEs Number of SEs that have replicated this item.
Playtime Duration of playback of the file.
Modification Time Timestamp of the earliest update for that delivery service from an active SE.
7-36Cisco Internet Streamer CDS 2.5 Software Configuration Guide
OL-20686-06
Chapter 7 Monitoring the Internet Streamer CDSDelivery Service Monitoring
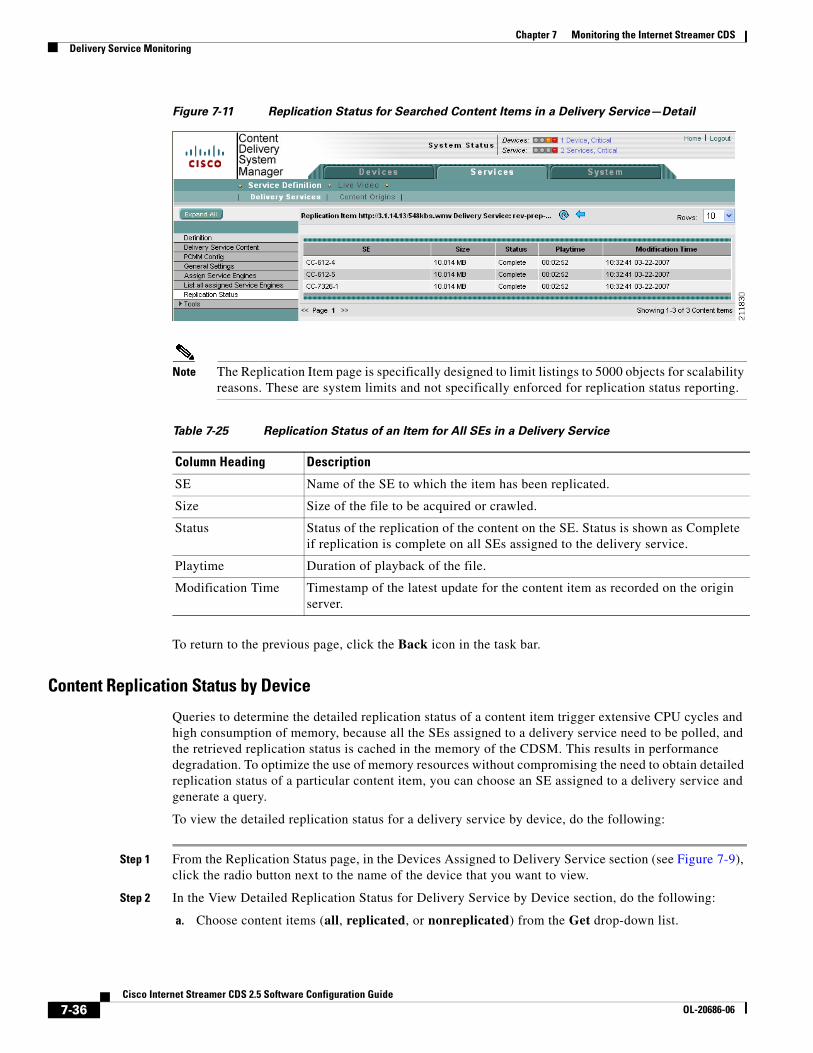
Figure 7-11 Replication Status for Searched Content Items in a Delivery Service—Detail
Note The Replication Item page is specifically designed to limit listings to 5000 objects for scalability reasons. These are system limits and not specifically enforced for replication status reporting.
To return to the previous page, click the Back icon in the task bar.
Content Replication Status by Device
Queries to determine the detailed replication status of a content item trigger extensive CPU cycles and high consumption of memory, because all the SEs assigned to a delivery service need to be polled, and the retrieved replication status is cached in the memory of the CDSM. This results in performance degradation. To optimize the use of memory resources without compromising the need to obtain detailed replication status of a particular content item, you can choose an SE assigned to a delivery service and generate a query.
To view the detailed replication status for a delivery service by device, do the following:
Step 1 From the Replication Status page, in the Devices Assigned to Delivery Service section (see Figure 7-9), click the radio button next to the name of the device that you want to view.
Step 2 In the View Detailed Replication Status for Delivery Service by Device section, do the following:
a. Choose content items (all, replicated, or nonreplicated) from the Get drop-down list.
Table 7-25 Replication Status of an Item for All SEs in a Delivery Service
Column Heading Description
SE Name of the SE to which the item has been replicated.
Size Size of the file to be acquired or crawled.
Status Status of the replication of the content on the SE. Status is shown as Complete if replication is complete on all SEs assigned to the delivery service.
Playtime Duration of playback of the file.
Modification Time Timestamp of the latest update for the content item as recorded on the origin server.
7-37Cisco Internet Streamer CDS 2.5 Software Configuration Guide
OL-20686-06
Chapter 7 Monitoring the Internet Streamer CDSDelivery Service Monitoring
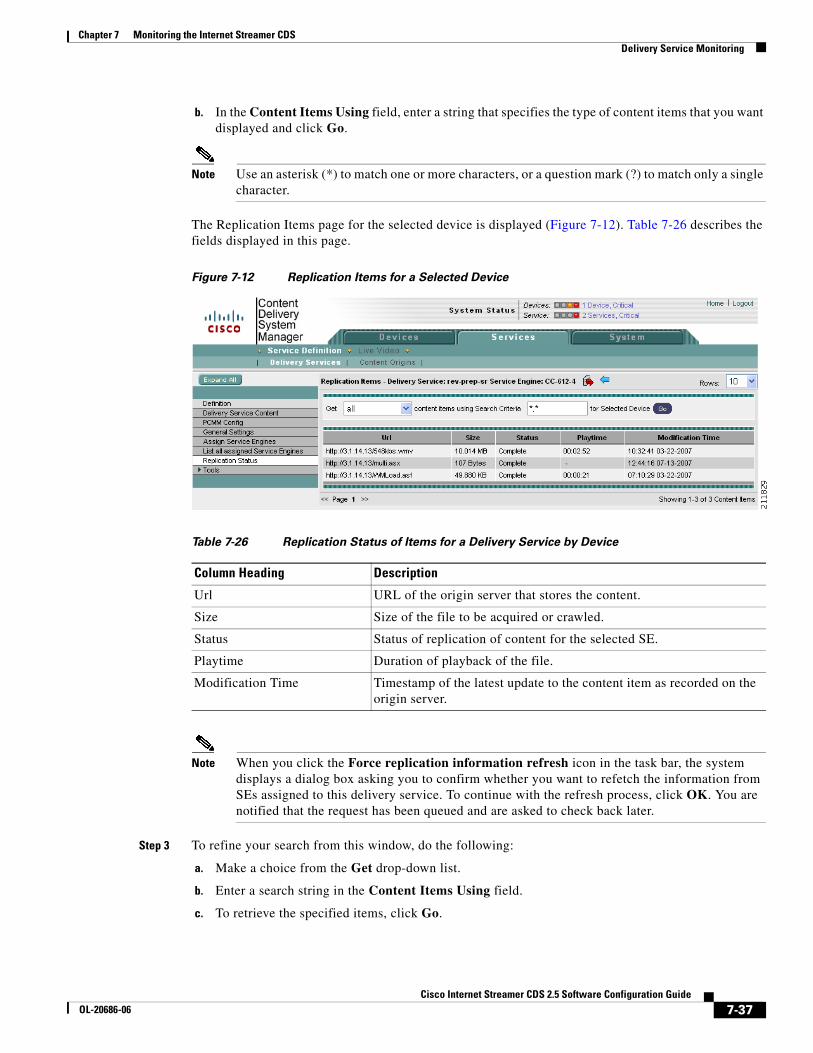
b. In the Content Items Using field, enter a string that specifies the type of content items that you want displayed and click Go.
Note Use an asterisk (*) to match one or more characters, or a question mark (?) to match only a single character.
The Replication Items page for the selected device is displayed (Figure 7-12). Table 7-26 describes the fields displayed in this page.
Figure 7-12 Replication Items for a Selected Device
Note When you click the Force replication information refresh icon in the task bar, the system displays a dialog box asking you to confirm whether you want to refetch the information from SEs assigned to this delivery service. To continue with the refresh process, click OK. You are notified that the request has been queued and are asked to check back later.
Step 3 To refine your search from this window, do the following:
a. Make a choice from the Get drop-down list.
b. Enter a search string in the Content Items Using field.
c. To retrieve the specified items, click Go.
Table 7-26 Replication Status of Items for a Delivery Service by Device
Column Heading Description
Url URL of the origin server that stores the content.
Size Size of the file to be acquired or crawled.
Status Status of replication of content for the selected SE.
Playtime Duration of playback of the file.
Modification Time Timestamp of the latest update to the content item as recorded on the origin server.
7-38Cisco Internet Streamer CDS 2.5 Software Configuration Guide
OL-20686-06
Chapter 7 Monitoring the Internet Streamer CDSViewing Statistics
Step 4 To return to the Replication Status page, click the Back icon in the task bar.
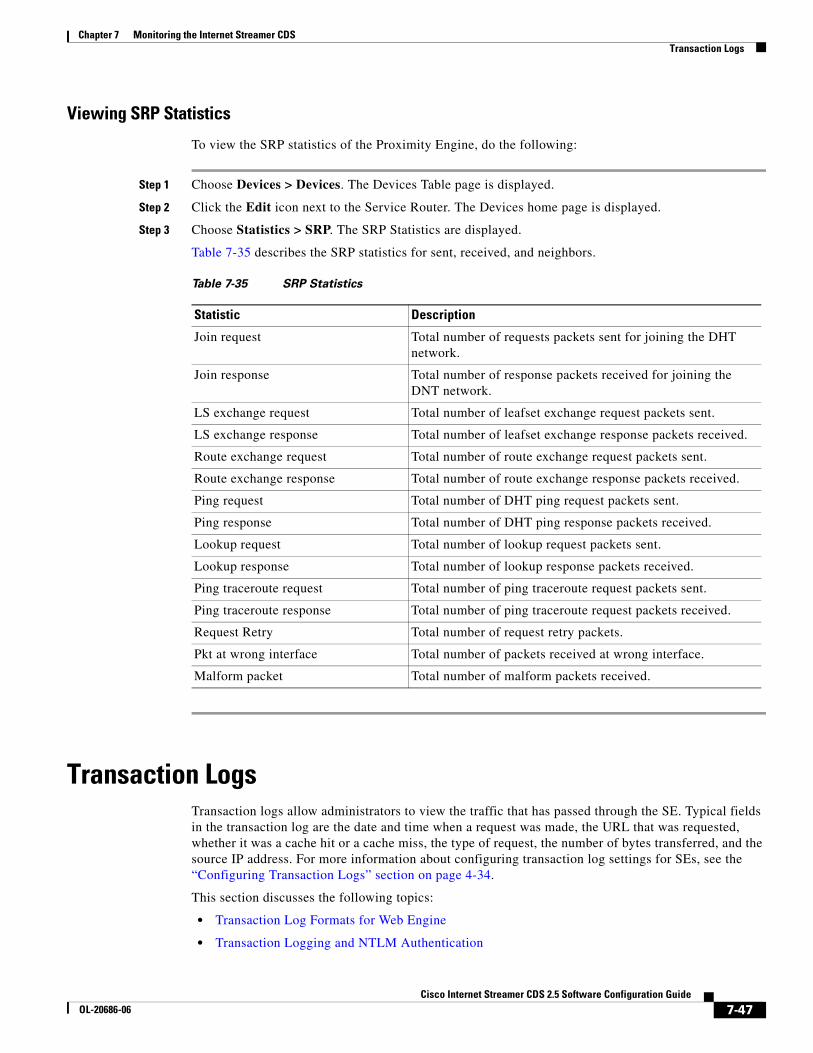
Viewing StatisticsThe Statistics pages track system-wide delivery, replication, and routing traffic in the CDS. You can view statistics on delivery traffic (Movie Streamer, Windows Media, HTTP, and Flash Media) listed by SE or device group. The Routing Statistics page lists client requests and redirects. The Replication Statistics page lists the replication status for all SEs in the CDS, and provides a drill-down to all delivery services for a chosen SE, and all content items associated with that delivery service. The Proximity Engine statistics provides overall statistical information on the Proximity Engine, and specific statistical information on IS-IS, OSPF, and SRP.
This section contains the following procedures:
• Viewing Service Engines and Device Group Statistics
• Viewing Routing Statistics
• Viewing Replication States
• Viewing Proximity Engine Statistics
Viewing Service Engines and Device Group StatisticsTo view the statistics for all SEs or all device groups, do the following:
Step 1 Choose Devices > Statistics. The Statistics page is displayed.
Step 2 Choose Service Engines or Device Groups, and then choose one of the following content delivery types:
• Movie Streamer
• HTTP
• Windows Media
• Flash Media
Table 7-27 describes the icons provided on the Statistics pages.
Table 7-27 Statistics Icons
Icon Function
Update application statistics. The statistics are updated at a configurable time interval, which is set in the System Configuration page (System.monitoring.collectRate). See the “Configuring System Settings” section on page 6-7. To see the latest statistics immediately, without waiting for the time interval to elapse, click this icon.
Export a table to a comma-separated value (CSV) file.
7-39Cisco Internet Streamer CDS 2.5 Software Configuration Guide
OL-20686-06
Chapter 7 Monitoring the Internet Streamer CDSViewing Statistics
Table 7-28 describes each statistic for each content delivery type.
Refresh the table
Print the current window.
Table 7-27 Statistics Icons (continued)
Icon Function
Table 7-28 Service Engine and Device Group Statistics
Statistic Description
Movie Streamer
Bandwidth In Current bandwidth used for input by the Movie Streamer in bits per second.
Bandwidth Out Current bandwidth used for output by the Movie Streamer in bits per second.
Bandwidth In Total bandwidth, in bits per second, received by the Movie Streamer since it was started.
Bandwidth Out Total bandwidth, in bits per second, transmitted by the Movie Streamer since it was started.
Packets In Total packets received by the Movie Streamer since it was started.
Packets Out Total packets transmitted by the Movie Streamer since it was started.
RTSP Connections Number of clients currently connected over RTSP.
RTP Connections Number of clients connected since startup.
Updated Timestamp indicating when the statistics were updated.
HTTP
Requests/Sec Number of requests per second.
Bytes/Sec Number of bytes per second.
Request Latency Average number of seconds per HTTP request.
Hit Rate Average number (as a percentage) of content items successfully served per minute from the cache of the SE or from all the SEs in the device group.
Updated Timestamp indicating when the statistics were updated.
Windows Media
Concurrent Requests
Total number of simultaneous requests the Windows Media Streaming Engine has served.
Bandwidth Current bandwidth, in bits per second, that is used for output.
Cache Hit Rate Average number (as a percentage) of content items successfully served per minute from the cache of the SE or from all the SEs in the device group
Updated Timestamp indicating when the statistics were updated.
Flash Media
Byte/Sec Total number of bytes per second served.
All Connections Number of clients currently connected.
7-40Cisco Internet Streamer CDS 2.5 Software Configuration Guide
OL-20686-06
Chapter 7 Monitoring the Internet Streamer CDSViewing Statistics
Viewing Routing StatisticsTo view the routing statistics for SRs, do the following:
See Table 7-27 for descriptions of the icons provided on the Routing Statistics pages. Table 7-29 describes each routing statistic.
Cache Hit Rate Average number (as a percentage) of content items successfully served per minute from the cache of the SE or from all the SEs in the delivery service.
Updated Timestamp indicating when the statistics were updated.
Table 7-28 Service Engine and Device Group Statistics (continued)
Statistic Description
Table 7-29 Service Router Statistics
Statistic Description
Routing Requests
Total Requests Total number of content requests received from clients.
HTTP Requests Number of ASX and traditional HTTP web requests received.
RTSP Requests Number of RTSP requests received.
RTMP Requests Number of RTMP requests received.
Updated Timestamp indicating when the statistics were updated.
Routing Redirects
Total Requests Total number of content requests received from clients.
Reqs Redirected Total number of redirected client requests.
Reqs Not Redirected Total number of client requests not redirected.
Updated Timestamp indicating when the statistics were updated.
7-41Cisco Internet Streamer CDS 2.5 Software Configuration Guide
OL-20686-06
Chapter 7 Monitoring the Internet Streamer CDSViewing Statistics
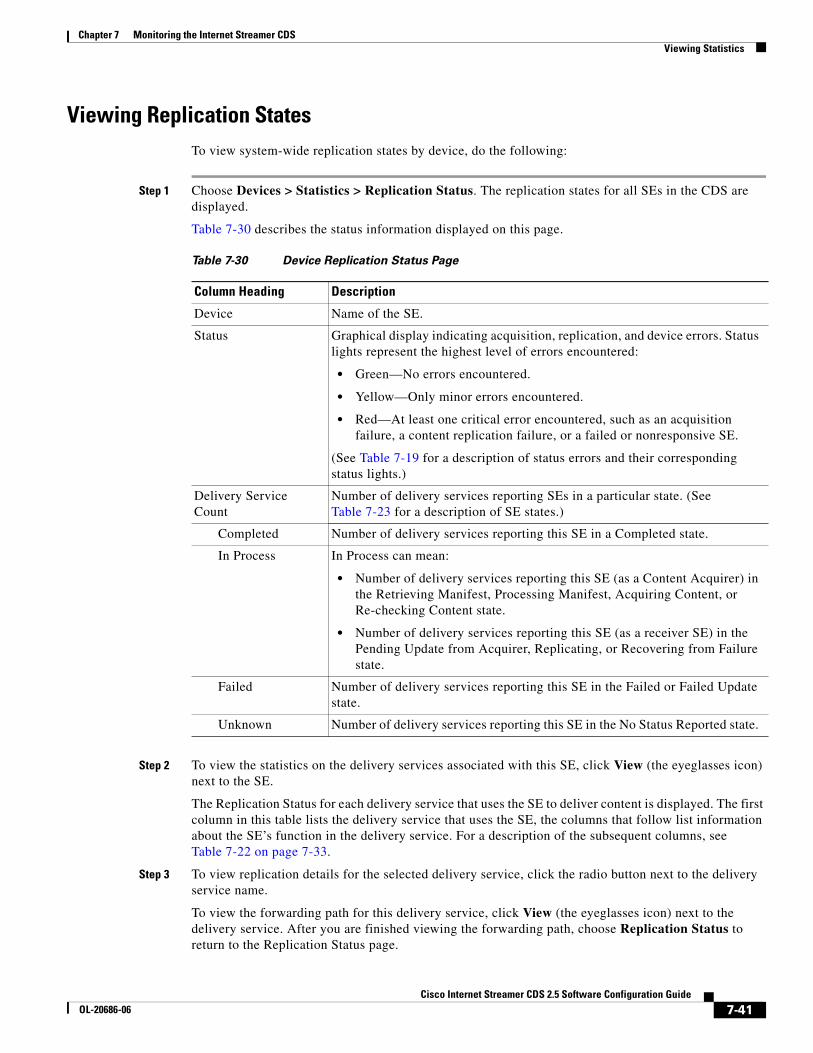
Viewing Replication StatesTo view system-wide replication states by device, do the following:
Step 1 Choose Devices > Statistics > Replication Status. The replication states for all SEs in the CDS are displayed.
Table 7-30 describes the status information displayed on this page.
Step 2 To view the statistics on the delivery services associated with this SE, click View (the eyeglasses icon) next to the SE.
The Replication Status for each delivery service that uses the SE to deliver content is displayed. The first column in this table lists the delivery service that uses the SE, the columns that follow list information about the SE’s function in the delivery service. For a description of the subsequent columns, see Table 7-22 on page 7-33.
Step 3 To view replication details for the selected delivery service, click the radio button next to the delivery service name.
To view the forwarding path for this delivery service, click View (the eyeglasses icon) next to the delivery service. After you are finished viewing the forwarding path, choose Replication Status to return to the Replication Status page.
Table 7-30 Device Replication Status Page
Column Heading Description
Device Name of the SE.
Status Graphical display indicating acquisition, replication, and device errors. Status lights represent the highest level of errors encountered:
• Green—No errors encountered.
• Yellow—Only minor errors encountered.
• Red—At least one critical error encountered, such as an acquisition failure, a content replication failure, or a failed or nonresponsive SE.
(See Table 7-19 for a description of status errors and their corresponding status lights.)
Delivery Service Count
Number of delivery services reporting SEs in a particular state. (See Table 7-23 for a description of SE states.)
Completed Number of delivery services reporting this SE in a Completed state.
In Process In Process can mean:
• Number of delivery services reporting this SE (as a Content Acquirer) in the Retrieving Manifest, Processing Manifest, Acquiring Content, or Re-checking Content state.
• Number of delivery services reporting this SE (as a receiver SE) in the Pending Update from Acquirer, Replicating, or Recovering from Failure state.
Failed Number of delivery services reporting this SE in the Failed or Failed Update state.
Unknown Number of delivery services reporting this SE in the No Status Reported state.
7-42Cisco Internet Streamer CDS 2.5 Software Configuration Guide
OL-20686-06
Chapter 7 Monitoring the Internet Streamer CDSViewing Statistics
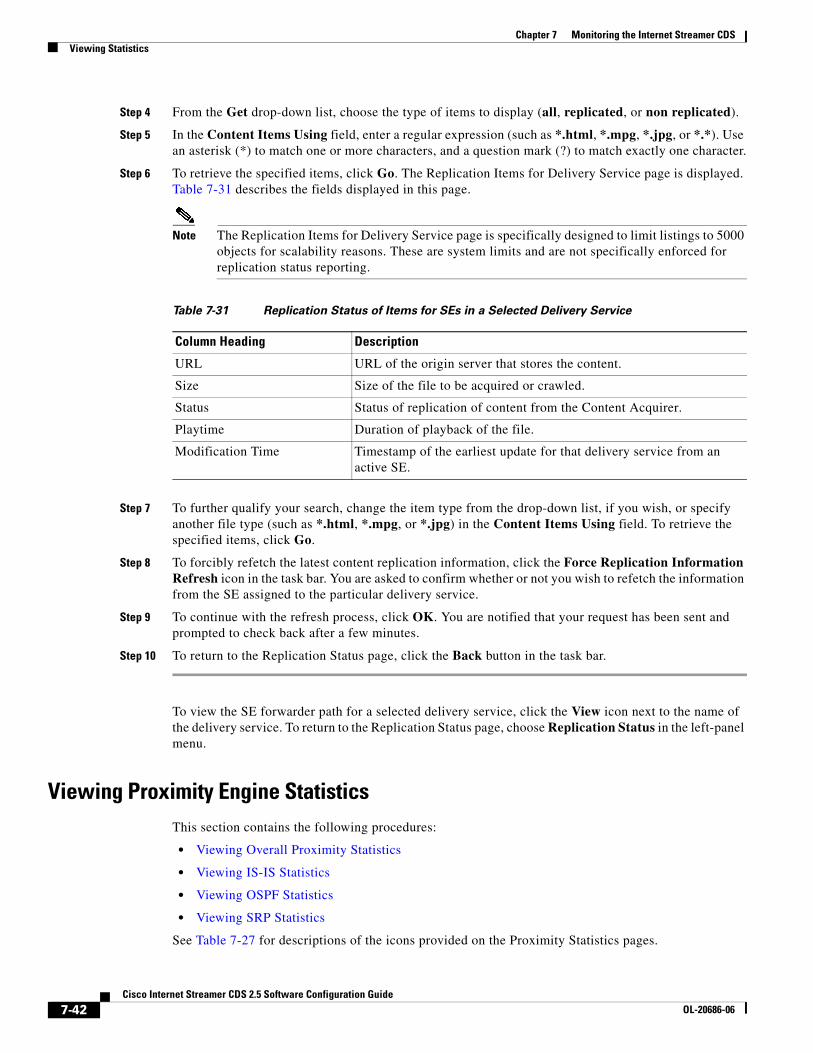
Step 4 From the Get drop-down list, choose the type of items to display (all, replicated, or non replicated).
Step 5 In the Content Items Using field, enter a regular expression (such as *.html, *.mpg, *.jpg, or *.*). Use an asterisk (*) to match one or more characters, and a question mark (?) to match exactly one character.
Step 6 To retrieve the specified items, click Go. The Replication Items for Delivery Service page is displayed. Table 7-31 describes the fields displayed in this page.
Note The Replication Items for Delivery Service page is specifically designed to limit listings to 5000 objects for scalability reasons. These are system limits and are not specifically enforced for replication status reporting.
Step 7 To further qualify your search, change the item type from the drop-down list, if you wish, or specify another file type (such as *.html, *.mpg, or *.jpg) in the Content Items Using field. To retrieve the specified items, click Go.
Step 8 To forcibly refetch the latest content replication information, click the Force Replication Information Refresh icon in the task bar. You are asked to confirm whether or not you wish to refetch the information from the SE assigned to the particular delivery service.
Step 9 To continue with the refresh process, click OK. You are notified that your request has been sent and prompted to check back after a few minutes.
Step 10 To return to the Replication Status page, click the Back button in the task bar.
To view the SE forwarder path for a selected delivery service, click the View icon next to the name of the delivery service. To return to the Replication Status page, choose Replication Status in the left-panel menu.
Viewing Proximity Engine StatisticsThis section contains the following procedures:
• Viewing Overall Proximity Statistics
• Viewing IS-IS Statistics
• Viewing OSPF Statistics
• Viewing SRP Statistics
See Table 7-27 for descriptions of the icons provided on the Proximity Statistics pages.
Table 7-31 Replication Status of Items for SEs in a Selected Delivery Service
Column Heading Description
URL URL of the origin server that stores the content.
Size Size of the file to be acquired or crawled.
Status Status of replication of content from the Content Acquirer.
Playtime Duration of playback of the file.
Modification Time Timestamp of the earliest update for that delivery service from an active SE.
7-43Cisco Internet Streamer CDS 2.5 Software Configuration Guide
OL-20686-06
Chapter 7 Monitoring the Internet Streamer CDSViewing Statistics
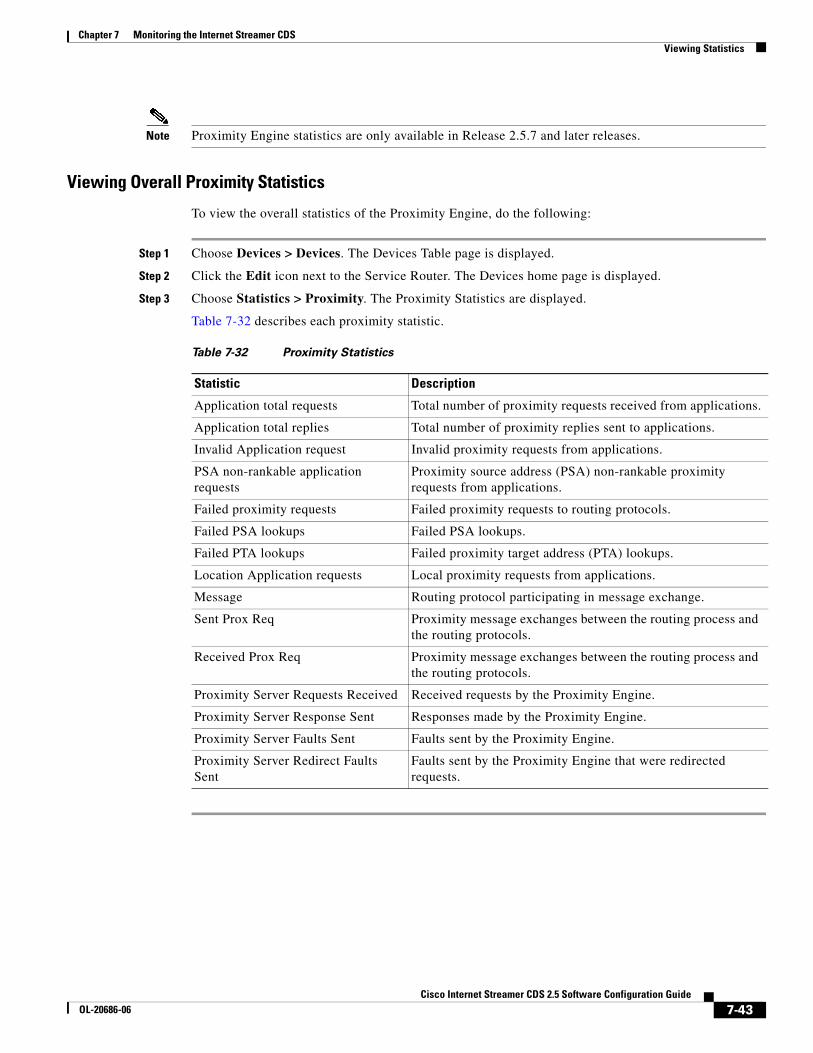
Note Proximity Engine statistics are only available in Release 2.5.7 and later releases.
Viewing Overall Proximity Statistics
To view the overall statistics of the Proximity Engine, do the following:
Step 1 Choose Devices > Devices. The Devices Table page is displayed.
Step 2 Click the Edit icon next to the Service Router. The Devices home page is displayed.
Step 3 Choose Statistics > Proximity. The Proximity Statistics are displayed.
Table 7-32 describes each proximity statistic.
Table 7-32 Proximity Statistics
Statistic Description
Application total requests Total number of proximity requests received from applications.
Application total replies Total number of proximity replies sent to applications.
Invalid Application request Invalid proximity requests from applications.
PSA non-rankable application requests
Proximity source address (PSA) non-rankable proximity requests from applications.
Failed proximity requests Failed proximity requests to routing protocols.
Location Application requests Local proximity requests from applications.
Message Routing protocol participating in message exchange.
Sent Prox Req Proximity message exchanges between the routing process and the routing protocols.
Received Prox Req Proximity message exchanges between the routing process and the routing protocols.
Proximity Server Requests Received Received requests by the Proximity Engine.
Proximity Server Response Sent Responses made by the Proximity Engine.
Proximity Server Faults Sent Faults sent by the Proximity Engine.
Proximity Server Redirect Faults Sent
Faults sent by the Proximity Engine that were redirected requests.
7-44Cisco Internet Streamer CDS 2.5 Software Configuration Guide
OL-20686-06
Chapter 7 Monitoring the Internet Streamer CDSViewing Statistics
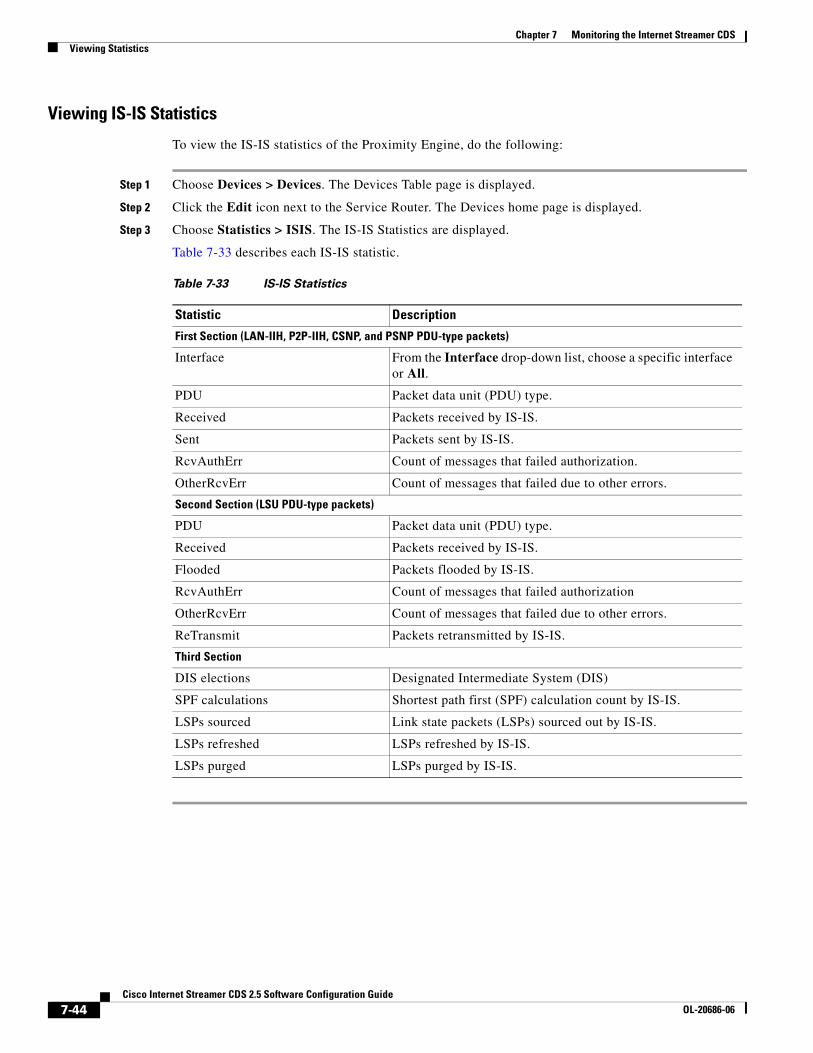
Viewing IS-IS Statistics
To view the IS-IS statistics of the Proximity Engine, do the following:
Step 1 Choose Devices > Devices. The Devices Table page is displayed.
Step 2 Click the Edit icon next to the Service Router. The Devices home page is displayed.
Step 3 Choose Statistics > ISIS. The IS-IS Statistics are displayed.
Table 7-33 describes each IS-IS statistic.
Table 7-33 IS-IS Statistics
Statistic Description
First Section (LAN-IIH, P2P-IIH, CSNP, and PSNP PDU-type packets)
Interface From the Interface drop-down list, choose a specific interface or All.
PDU Packet data unit (PDU) type.
Received Packets received by IS-IS.
Sent Packets sent by IS-IS.
RcvAuthErr Count of messages that failed authorization.
OtherRcvErr Count of messages that failed due to other errors.
Second Section (LSU PDU-type packets)
PDU Packet data unit (PDU) type.
Received Packets received by IS-IS.
Flooded Packets flooded by IS-IS.
RcvAuthErr Count of messages that failed authorization
OtherRcvErr Count of messages that failed due to other errors.
ReTransmit Packets retransmitted by IS-IS.
Third Section
DIS elections Designated Intermediate System (DIS)
SPF calculations Shortest path first (SPF) calculation count by IS-IS.
LSPs sourced Link state packets (LSPs) sourced out by IS-IS.
LSPs refreshed LSPs refreshed by IS-IS.
LSPs purged LSPs purged by IS-IS.
7-45Cisco Internet Streamer CDS 2.5 Software Configuration Guide
OL-20686-06
Chapter 7 Monitoring the Internet Streamer CDSViewing Statistics
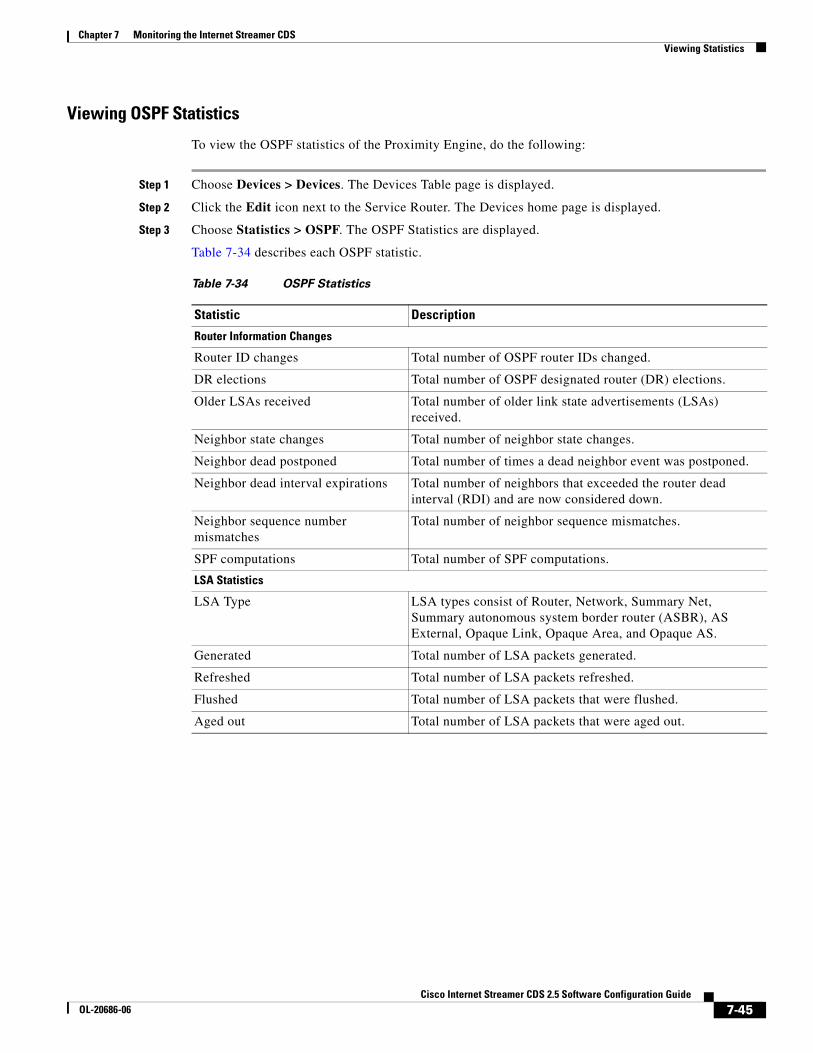
Viewing OSPF Statistics
To view the OSPF statistics of the Proximity Engine, do the following:
Step 1 Choose Devices > Devices. The Devices Table page is displayed.
Step 2 Click the Edit icon next to the Service Router. The Devices home page is displayed.
Step 3 Choose Statistics > OSPF. The OSPF Statistics are displayed.
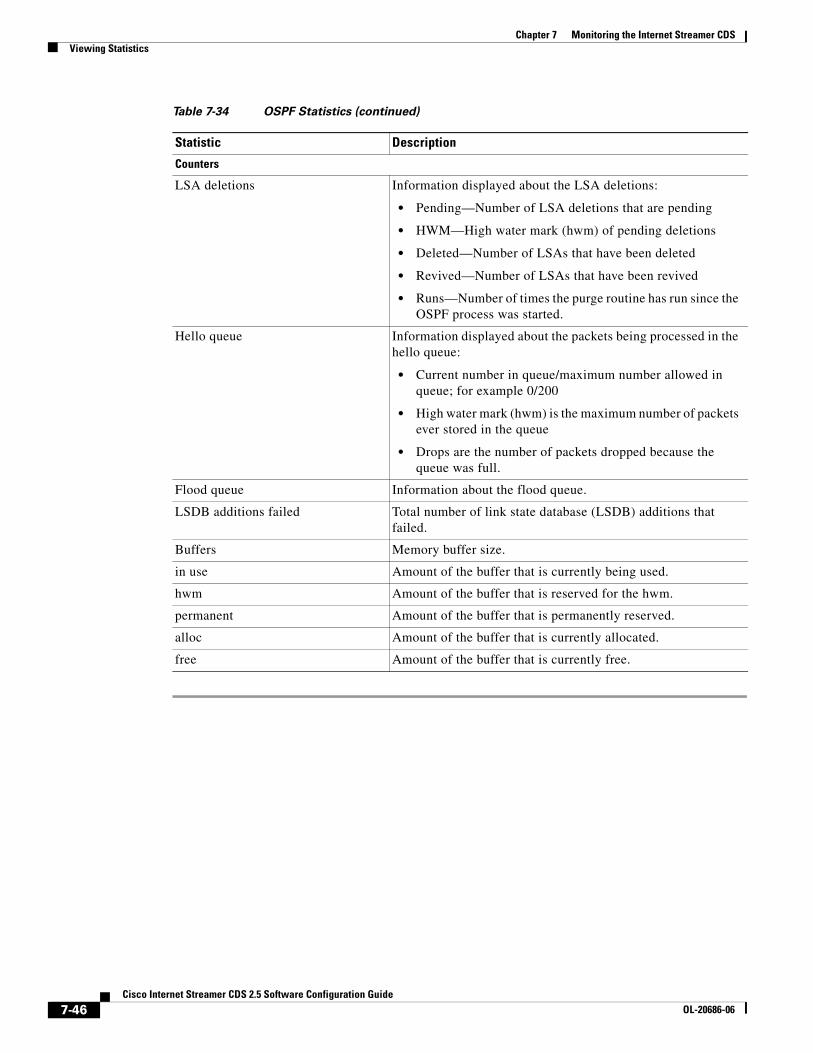
Table 7-34 describes each OSPF statistic.
Table 7-34 OSPF Statistics
Statistic Description
Router Information Changes
Router ID changes Total number of OSPF router IDs changed.
DR elections Total number of OSPF designated router (DR) elections.
Older LSAs received Total number of older link state advertisements (LSAs) received.
Neighbor state changes Total number of neighbor state changes.
Neighbor dead postponed Total number of times a dead neighbor event was postponed.
Neighbor dead interval expirations Total number of neighbors that exceeded the router dead interval (RDI) and are now considered down.
Neighbor sequence number mismatches
Total number of neighbor sequence mismatches.
SPF computations Total number of SPF computations.
LSA Statistics
LSA Type LSA types consist of Router, Network, Summary Net, Summary autonomous system border router (ASBR), AS External, Opaque Link, Opaque Area, and Opaque AS.
Generated Total number of LSA packets generated.
Refreshed Total number of LSA packets refreshed.
Flushed Total number of LSA packets that were flushed.
Aged out Total number of LSA packets that were aged out.
7-46Cisco Internet Streamer CDS 2.5 Software Configuration Guide
OL-20686-06
Chapter 7 Monitoring the Internet Streamer CDSViewing Statistics
Counters
LSA deletions Information displayed about the LSA deletions:
• Pending—Number of LSA deletions that are pending
• HWM—High water mark (hwm) of pending deletions
• Deleted—Number of LSAs that have been deleted
• Revived—Number of LSAs that have been revived
• Runs—Number of times the purge routine has run since the OSPF process was started.
Hello queue Information displayed about the packets being processed in the hello queue:
• Current number in queue/maximum number allowed in queue; for example 0/200
• High water mark (hwm) is the maximum number of packets ever stored in the queue
• Drops are the number of packets dropped because the queue was full.
Flood queue Information about the flood queue.
LSDB additions failed Total number of link state database (LSDB) additions that failed.
Buffers Memory buffer size.
in use Amount of the buffer that is currently being used.
hwm Amount of the buffer that is reserved for the hwm.
permanent Amount of the buffer that is permanently reserved.
alloc Amount of the buffer that is currently allocated.
free Amount of the buffer that is currently free.
Table 7-34 OSPF Statistics (continued)
Statistic Description
7-47Cisco Internet Streamer CDS 2.5 Software Configuration Guide
OL-20686-06
Chapter 7 Monitoring the Internet Streamer CDSTransaction Logs
Viewing SRP Statistics
To view the SRP statistics of the Proximity Engine, do the following:
Step 1 Choose Devices > Devices. The Devices Table page is displayed.
Step 2 Click the Edit icon next to the Service Router. The Devices home page is displayed.
Step 3 Choose Statistics > SRP. The SRP Statistics are displayed.
Table 7-35 describes the SRP statistics for sent, received, and neighbors.
Transaction LogsTransaction logs allow administrators to view the traffic that has passed through the SE. Typical fields in the transaction log are the date and time when a request was made, the URL that was requested, whether it was a cache hit or a cache miss, the type of request, the number of bytes transferred, and the source IP address. For more information about configuring transaction log settings for SEs, see the “Configuring Transaction Logs” section on page 4-34.
This section discusses the following topics:
• Transaction Log Formats for Web Engine
• Transaction Logging and NTLM Authentication
Table 7-35 SRP Statistics
Statistic Description
Join request Total number of requests packets sent for joining the DHT network.
Join response Total number of response packets received for joining the DNT network.
LS exchange request Total number of leafset exchange request packets sent.
LS exchange response Total number of leafset exchange response packets received.
Route exchange request Total number of route exchange request packets sent.
Route exchange response Total number of route exchange response packets received.
Ping request Total number of DHT ping request packets sent.
Ping response Total number of DHT ping response packets received.
Lookup request Total number of lookup request packets sent.
Lookup response Total number of lookup response packets received.
Ping traceroute request Total number of ping traceroute request packets sent.
Ping traceroute response Total number of ping traceroute request packets received.
Request Retry Total number of request retry packets.
Pkt at wrong interface Total number of packets received at wrong interface.
Malform packet Total number of malform packets received.
7-48Cisco Internet Streamer CDS 2.5 Software Configuration Guide
OL-20686-06
Chapter 7 Monitoring the Internet Streamer CDSTransaction Logs
• Usage Guidelines for Log Files
• Windows Media Transaction Logging
• Movie Streamer Transaction Log Fields
• Flash Media Streaming Transaction Log Fields
• Service Router Transaction Log Fields
Note In Release 2.5.3 and later releases, each transaction log includes a summary line as the last line in the transaction log, which includes a summary of all the requests that appear in the transaction log.
Transaction Log Formats for Web EngineThe transaction logs for Web Engine consist of the following:
• Client Transaction Logs
• Ingest Transaction Logs
Note Ingest transaction logs is a Release 2.5.9 feature.
Client Transaction Logs
The section discusses the following different logging formats for Web Engine:
• Extended Squid
• Apache
• Custom Format
Note Changing the time zone on an SE does not affect the log entry nor the log filename. Both the log entries and the log filename always use UTC.
Note In Release 2.5.9 and later releases, the timestamp for Web Engine transaction log entry no longer has a space between the date and the time. An example follows:
[19/Oct/2010:11:20:09.133-0705] 4821 172.22.71.155 TCP_MISS/404 235 GET http://172.22.71.155/hello application/octet-stream
Extended Squid
The Extended Squid format logs the same fields logged by the Squid-1.1 access log file format. The Extended Squid transaction logs are located in the logs/webengine_extsquid/ directory.
For details on the Squid-1.1 native log file format, see the Squid documentation “Frequently Asked Questions,” “Squid Log” section, access.log heading at:
An Extended Squid-style log format example looks like this:
[21/May/2009:00:29:12 +0530] 952195 171.71.50.197 TCP_REFRESH_MISS/200 11120239 GET http://7.9.0.3/1mbs_ai/1mbs1-100.wmv video/x-ms-wmv
Table 7-36 describes the fields for the Extended-Squid transaction log.
Table 7-37 describes the Squid codes currently supported in Release 2.5.9. The TCP_ codes refer to the cache status of the object when the request was handled by the Web Engine. In addition to the cache statistics listed in Table 7-37, the client or server error statistics could get incremented as well depending on the response code.
Table 7-36 Extended-Squid Transaction Log Fields
Field Description
Current-Time Time (milliseconds), in common log time format, the request was received.
Time-to-Serve Time, in microseconds, taken to complete the request.
This field could be zero if the transaction complete time is greater than the transaction start time, which could occur if NTP is not synchronized.
Client-IP IP address of the requesting client.
Request-Desc/Status-Returned Combination of Squid result codes and the response code returned to the client.
Bytes-Xferred Bytes sent to the client, including the headers.
Method Request method.
URL Requested URL, including the query string.
MIME-Type MIME type.
Table 7-37 Squid Code Descriptions
Squid Result Code Description
Valid Response (Status) Code Mapping to Cache Statistics
TCP_MISS Requested object was not in cache.
0–5xx Cache missCache bypassPartial hit
TCP_MEM_HIT Valid copy of the requested object was in memory.
Currently supports only 2xx response code
Cache hit and memory hit
(show statistics web-engine detail)
TCP_HIT Valid copy of the requested object was in cache.
0, 2xx, 3xx, 406, 412, 416, 500
Cache hit
7-50Cisco Internet Streamer CDS 2.5 Software Configuration Guide
OL-20686-06
Chapter 7 Monitoring the Internet Streamer CDSTransaction Logs
Apache
The Apache format is the Common Log File (CLF) format defined by the World Wide Web Consortium (W3C) working group. This format is compatible with many industry-standard log tools. The Apache-style transaction log files are located in the /webengine_apache/ directory.
The Apache-style log file format is as follows:
client-IP-address URI bytes-sent object-size bytes-received method status time-received time-to-serve
An Apache-style log file format example looks like this:
171.71.50.197 http://spcdn-se612-5.se.sanity.spcdn.net/gmedia-0.4gb.wmv 363704065 137 363710748 GET 200 [06/Nov/2007:00:25:32 +0530] 325033158
Table 7-38 describes the fields for the Apache-style transaction log.
TCP_REFRESH_MISS
Requested object was cached but is stale. The query returned the new content.
0–-5xx Cache miss
TCP_REFRESH_HIT
Requested object was cached, but expired. The query for the object resulted in a “304 not modified” message.
0, 2xx, 406, 412, 416, 500
Cache hit
TCP_IMS_HIT Client issued an IMS request for an object, which was in cache and was not stale.
0, 2xx, 3xx, 500 Cache hit
TCP_DENIED Access was denied for this request.
403 —
Table 7-37 Squid Code Descriptions (continued)
Squid Result Code Description
Valid Response (Status) Code Mapping to Cache Statistics
Table 7-38 Apache-Style Transaction Log Fields
Field Description
client-IP-address IP address of the requesting client
URI Requested URL, including the query string.
bytes-sent Bytes sent to client, including the headers.
object-size Bytes sent to client, excluding the HTTP headers.
bytes-received Bytes received from client.
method Request method.
status HTTP response code for the request.
time-received Time, in common log time format, the request was received.
time-to-serve Time, in microseconds, taken to complete the request.
7-51Cisco Internet Streamer CDS 2.5 Software Configuration Guide
OL-20686-06
Chapter 7 Monitoring the Internet Streamer CDSTransaction Logs
Custom Format
The transaction-logs format custom command allows you to use a log format string to log additional fields that are not included in the predefined Extended Squid format or Apache CLF format. The log format string is a string that can contain the tokens listed in Table 7-39 and that mimics the Apache log format string.
The log format string can contain literal characters that are copied into the log file. Double backslashes (\\) can be used to represent a literal backslash, and a backslash followed by a single quote (\’) can be used to represent a literal single quote. A literal double quote cannot be represented as part of the log format string. The control characters \t and \n can be used to represent a tab and a new line character, respectively. The custom transaction logs are located in the /webengine_clf/ directory.
The following command can be entered to generate the well-known Apache Combined Log Format:
transaction-logs format custom "%t%r %>s %b"
The following transaction log entry example is configured by using the preceding custom format string:
%D Time consumed to serve the request in microseconds
%h Remote host (IP address of the requesting client is logged).
%H Request protocol.
%I Bytes received from the client.
%m Request method.
%M1 MIME type of the requested asset.
%O Bytes sent to client, including the headers.
%q Query string (which is preceded by a question mark (?) if a query string exists; otherwise, it is an empty string).
%r First line of the request. The space in the first line of the request is replaced with a vertical bar (|) delimiter (for example, Get|/index.html|HTTP/1.1)
%>s Status. The translog code always returns the HTTP response code for the request.
%t Time in common log time format (or standard English format).
%T Time consumed to serve the request in seconds (a floating point number with 3 decimal places).
%u URL path requested, including query strings.
7-52Cisco Internet Streamer CDS 2.5 Software Configuration Guide
OL-20686-06
Chapter 7 Monitoring the Internet Streamer CDSTransaction Logs
Ingest Transaction Logs
Ingest transaction logs are used to log details of every upstream request sent by the Web Engine to the upstream SEs and origin servers. Ingest transaction logs only stores request details of cache-miss content and cache-hit content with a revalidation request; details of prefetched content are not stored in the ingest transaction logs.
Note Ingest transaction logs are a Release 2.5.9 feature.
To enable the Web Engine ingest transaction logs, enter the web-engine http-ingest-logging enable command.
The Web Engine ingest transaction logs are located in the /local/local1/logs/webengine_ingestlog_clf directory.
Table 7-40 describes the fields for the ingest transaction log.
%U URL path requested, not including query strings.
%V Value of the host request header field reported if the host appeared in the request. If the host did not appear in the host request header, the IP address of the server specified in the URL is reported.
%X Connection status when the response is completed. The %X field has the following possible values:
• X—Connection aborted before the response completed.
• + —Connection may be kept alive after the response is sent.
• - —Connection is closed after the response is sent.
%Z1 Print the request received time stamp in milliseconds; otherwise, the request received time stamp is in seconds.
%{Header-Field}i1 Any request header. Replace the <Header Field> with the actual header field you want to log; for example, %{Cache-Control}i.
Note All client request headers are only logged on the edge SE.
1. This custom format is available in Release 2.5.9.
Table 7-39 Custom Log Format String Values (continued)
Format Token Value
7-53Cisco Internet Streamer CDS 2.5 Software Configuration Guide
OL-20686-06
Chapter 7 Monitoring the Internet Streamer CDSTransaction Logs
Transaction Logging and NTLM AuthenticationIf your device is configured for NT LAN Manager (NTLM) authentication and uses the Apache-style or Extended Squid-style format, you can record the Windows domain name and username in the “authenticated username” field of the transaction log. If the domain name is available, both the domain name and the username are recorded in the “authenticated username” field, in the form domain\username. If only the username is available, only the username is recorded in the “authenticated username” field. If neither a domain name nor a username is available, a “-” (hyphen) is recorded in the field.
Usage Guidelines for Log FilesThis section provides some guidelines for working with log files, and includes the following topics:
• Working Logs
• Archive Working Log
• Exporting Log Files
Note The time stamp in the filename is always in UTC, but the time stamp for the log entries in the transaction logs are determined by the protocol engine.
Table 7-40 Ingest Transaction Log Fields
Field Description
Time Time the request was sent by the Web Engine to the upstream SE or origin server.
URL Requested URL, including the query string, sent by the Web Engine.
FailOverSvrList Hierarchical route look-up information to the upstream SE or origin server. When a cache route look-up is performed for the request, the list of upstream SEs and origin server contacted to fetch the content is included in the log entry.
ServerIP IP address of the SE or origin server from which the content is downloaded. This is obtained from the FailOverSvrList.
BytesRead Number of bytes downloaded from the upstream SE or origin server.
BytesToRead Total number of bytes to be downloaded from the upstream SE or origin server.
AssetSize Size of the asset (in bytes) requested.
%DownloadComplete Percentage of asset that has been downloaded to the requesting SE.
Status-Returned HTTP status code returned from the upstream SE or origin server.
MIME-Type MIME type.
Revalidation-Request Either “Yes” if the request is a revalidation request for a cache hit, or “No” if the request is a cache-miss. If “Yes,” the Header-Name:HeaderValue follows. The “If-None-Match” or “If-Not-Modified” headers and their values are included in the log entry.
7-54Cisco Internet Streamer CDS 2.5 Software Configuration Guide
OL-20686-06
Chapter 7 Monitoring the Internet Streamer CDSTransaction Logs
Working Logs
Transaction logs are located in the /local/loca1/logs directory. Each component has one or more directories, depending on its configuration.
There is a working log file in each directory, which is a symbol link, linking to the current working log file.
The log files are logged to a working log on the local disk as follows:
• WMT logs are logged to a working log on the local disk in /local1/logs/export/working.log
• Movie Streamer logs are logged to a working log on the local disk in /local1/logs/movie-streamer/working.log
• Flash Media Streaming logs are logged to a working log on the local disk in /local1/logs/fms_access/working.log and /local1/logs/fms_authorization/working.log
• Service Router logs are logged to a working log on the local disk in the /local1/logs/service_router/working.log
• Web Engine client transaction logs are located in the /local1/logs/webengine_apache, the /local1/logs/webengine_clf, and the /local1/logs/webengine_extsquid directories
• Web Engine ingest transaction logs are located in the /local/local1/logs/webengine_ingestlog_clf directory
Note Web Engine ingest transaction logs is a Release 2.5.9 feature.
Note For Movie Streamer, client requests that join the multicast group do not appear in the transaction log because multicast clients do not contact the server.
Archive Working Log
You can specify the interval at which the working log should be cleared, when the interval occurs the data is moved to an archive log. The archive log files are located on the local disk in the /local1/logs/ directory.
The archiving of working logs can be configured to occur at a specified time interval and when the working log file reaches a specified size. If one of the criteria is met and at least one new message has been written to the working log, a log rotation occurs. If one of the criteria is met and no new messages have been written to the working log, a log rotation does not occur. You can specify the maximum number of old logs kept on disk.
Because multiple archive files are saved, the filename includes the timestamp when the file was created. The time stamp in the filename is always in UTC, but the time stamp for the log entries in the transaction logs are determined by the protocol engine. Because the files can be exported to an FTP/SFTP server, the filename also contains the IP address of the SE.
Note The File Generation Number that is appended to the filename is a Release 2.5.3 and later release enhancement.
The archive filenames use this format: modulename_IPADDRESS_YYYYMMDD_HHMMSS_file-generation-number.
7-55Cisco Internet Streamer CDS 2.5 Software Configuration Guide
OL-20686-06
Chapter 7 Monitoring the Internet Streamer CDSTransaction Logs
For example, fms_access_10.74.61.130_20070913_080051_065624_00001 is the filename for the archive of the fms_access log.
Note The IP address used in the archived filename is not necessarily the primary interface of the SE. The transaction log function decides on which IP address to use in creating the archive name.
Exporting Log Files
To facilitate the post-processing of cache log files, you can export transaction logs to an external host. This feature allows log files to be automatically exported by FTP to an external host at configurable intervals. The username and password used for FTP are configurable, as is the directory to which the log files are uploaded.
The log files automatically have a filename that uses the <type>_<ipaddr>_yyyymmdd_hhmmss_<file_generation_number> format, where:
• <type> represents the type of log file, with selog for cache logs such as HTTP, HTTPS, and FTP, and mms_export for Windows Media Technologies (WMT) logs.
• <ipaddr> represents the SE IP address.
• yyyymmdd_hhmmss represents the date and time when the log was archived for export.
• <file_generation_number> represents the File Generation Number, which has a range from 00001 to 99999. This is a Release 2.5.3 and later release enhancement.
Exporting Transaction Logs to External FTP Servers
To export transaction logs to an FTP server, you must first enable exporting of transaction logs and then configure the FTP or secure FTP (SFTP) server parameters. This feature can support up to four FTP servers. The following information is required for each target FTP server:
• Server IP address or the hostname
The SE translates the hostname with a DNS lookup and then stores the IP address in the configuration.
• FTP user login and user password
• Path of the directory where transferred files are written
Use a fully qualified path or a relative path for the user login. The user must have write permission to the directory.
You can also compress archived log files into gzip format before exporting them to external FTP servers. The compressed filename has a .gz extension. This compression feature uses less disk space than that required for noncompressed archived files on both the SE and the FTP export server and also requires less bandwidth during export because of the smaller size of the files to be exported.
For more information about exporting and archiving transaction logs, see the “Configuring Transaction Logs” section on page 4-34 for SEs, and the “Configuring Transaction Logs for the Service Router” section on page 4-120 for SRs.
To immediately have the transaction logs archived and exported following the next transaction, use the following commands:
SE# transaction-log force archiveSE# transaction-log force export
7-56Cisco Internet Streamer CDS 2.5 Software Configuration Guide
OL-20686-06
Chapter 7 Monitoring the Internet Streamer CDSTransaction Logs
The transaction-log force archive command causes the transaction log to be archived to the SE hard disk following the next transaction. The transaction-log force export command causes the transaction log to be exported to the configured FTP server. The transaction-log force commands do not change the configured or default schedule for an archive or export of the transaction logs. The archive or export interval is restarted after the forced operation. If a scheduled archive or export job is in progress when the transaction-log force command is entered, the command has no effect.
Restarting Export After Receiving a Permanent Error from the External FTP Server
When an FTP server returns a permanent error to the SE, the archive transaction logs are no longer exported to that server. You must re-enter the SE transaction log export parameters for the misconfigured server to clear the error condition.
A permanent error (Permanent Negative Completion Reply, RFC 959) occurs when the FTP command to the server cannot be accepted, and the action does not take place. Permanent errors can be caused by invalid user logins, invalid user passwords, and attempts to access directories with insufficient permissions or directories that do not exist.
Exporting Transaction Logs to External SFTP Servers
You can also export transaction logs to a Secure File Transfer Protocol (SFTP) server. You must first enable the feature and configure the SFTP server parameters. The following information is required for each target SFTP server:
• SFTP server IP address or the hostname
The SE translates the hostname with a DNS lookup and then stores the IP address in the configuration.
• SFTP user login and user password
• Path of the directory where transferred files are written
Use a fully qualified path or a relative path for the user login. The user must have write permission to the directory.
To enable this feature, enter the sshd allow-non-admin-users command on the SE. If this feature is enabled, the output of the show running-config EXEC command shows that this feature is enabled on the SE.
Windows Media Transaction LoggingThe following logging formats are supported for Windows Media transaction logging:
• Standard Windows Media Services Version 4.1
• Extended Windows Media Services Version 4.1
• Standard Windows Media Services Version 9.0
• Extended Windows Media Services Version 9.0
The extended versions of the logging formats contain additional fields that are SE specific (For example, the SE-action field specifies a cache hit or miss, and the SE-bytes field specifies the number of bytes that were sent from the SE.)
7-57Cisco Internet Streamer CDS 2.5 Software Configuration Guide
OL-20686-06
Chapter 7 Monitoring the Internet Streamer CDSTransaction Logs
The SE’s transaction logging format for Windows Media Streaming is consistent with that of the Windows Media Services and the World Wide Web Consortium (W3C)-compliant log format. A log line is written for every stream accessed by the client. The location of the log is not configurable. These logs can be exported using FTP. When transaction logging is enabled, daemons create a separate working.log file in /local1/logs/export for WMT transactions.
All client information in the transaction logs is sent to the origin server by default.
Note Transaction logs are generated by the client or the downstream SE and sent to the upstream SE, unless there is a disconnect before the log is sent. In Release 2.5.9 and later releases, the upstream SE can generate the transaction log based on the client information sent at the beginning of the session and information gathered by the SE. In this way, a Windows Media Streaming transaction log always exists for every client session.
Note All WMT playable contents can be delivered by either HTTP or RTSP, based on the request. Any content that is cached by the WMT is stored using the RTSP scheme, regardless of whether the content was cached due to an HTTP or RTSP request. Therefore, in the show command, the content displays as RTSP.
Log Formats Accepted by Windows Media Services 9
Windows Media Players connect to a Windows Media server using the following protocols:
• Windows Media Players earlier than Version 9.0 use HTTP/1.0 or the MMS protocol.
• Windows Media Player Version 9.0 uses HTTP/1.1 and RTSP.
Depending on the version of the Windows Media Player, logs are sent in different formats, such as text, binary, or Extensible Markup Language (XML). Table 7-41 describes the log formats accepted by Windows Media Services Version 9.0.
Table 7-41 Windows Media Services Version 9.0 Log Formats
Protocol Player and Distributor Log Type
HTTP/1.0 Windows Media Player earlier than Version 9.0
SE (caching and proxy server) is running Windows Media Services Version 9.0 and streaming from a Windows Media server that is running Windows Media Services Version 4.1
World Wide Web Consortium (W3C) standard space-delimited text log
MMS Windows Media Player earlier than Version 9.0 Binary structure log
7-58Cisco Internet Streamer CDS 2.5 Software Configuration Guide
OL-20686-06
Chapter 7 Monitoring the Internet Streamer CDSTransaction Logs
Note Extensible Markup Language (XML) logging for MMS-over-HTTP and MMS-over-RTSP (RTSP over Windows Media Services Version 9.0) is supported. The posted XML log file from the Windows Media Player to the SE (Windows Media server) can be parsed and saved to the normal Windows Media transaction logs that are stored on the SE.
Windows Media Streaming Transaction Log Fields
Note When a client closes a connection, a Logplaystats message is sent. When Fast Cache is enabled, the client communicates by sending a sendevent. which means there is a sendevent every time the client pauses and plays the content. When Fast Cache is enabled and a client closes the connection there are two transaction log entries, sendevent and Logplaystats.
Note Changing the time zone on an SE does not affect the log entry nor the log filename. Both the log entries and the log filename always use UTC.
Table 7-42 describes the fields for the Windows Media Streaming transaction log.
HTTP/1.1 Windows Media Player Version 9.0
Distribution server is running Windows Media Services Version 9.0
SE (caching and proxy server) is running Windows Media Services Version 9.0
XML structure log
RTSP Windows Media Player Version 9.0
Distribution server is running Windows Media Services Version 9.0
SE (caching and proxy server) is running Windows Media Services Version 9.0
XML structure log
Table 7-41 Windows Media Services Version 9.0 Log Formats (continued)
Protocol Player and Distributor Log Type
Table 7-42 Windows Media Streaming Transaction Log Fields
Field Description Sample ValueClient Data Reported
c-ip The source Internet Protocol (IP) address of the connected socket. This may be the IP address of a proxy server or firewall.
157.56.219.146 UnicastMulticast
date Date, in international date format, when a client is connected. 2001-04-19 UnicastMulticast
time Time when the client is connected. The time format is either in Coordinated Universal Time (UTC) or local time, depending on how the logging plug-in is configured.
15:30:30 UnicastMulticast
7-59Cisco Internet Streamer CDS 2.5 Software Configuration Guide
OL-20686-06
Chapter 7 Monitoring the Internet Streamer CDSTransaction Logs
c-dns This field is always blank. — UnicastMulticast
cs-uri-stem The path (requested URL without the protocol type, host, port number, and question mark) to the content that was requested. See the cs-url field for the full URL. Note that this represents a change from Windows Media Services version 4.1, in which this field contained the full URL.
/test/sample.wmvor/broadcast
UnicastMulticast
c-starttime Timestamp (in seconds, no fractions) indicating the point in the stream when the client started to render content. For live broadcasts, this field is set to 0.
39 UnicastMulticast
x-duration Length of time (in seconds) of the data received by the client. For player log entries, the value does not include buffered data. For distribution server log entries, the value includes all time spent receiving data, including any buffering.
31 UnicastMulticast
c-rate The rate at which data is sent from the server to the client. The c-rate field has the following possible values:
• 0.5—Half of the real-time rate
• 1—Real-time rate
• 2—Twice as fast as real-time rate
• 5—Fast forward
• –5—Fast rewind
If you are using Fast Streaming, these values could be considerably higher or lower depending on the content and the available bandwidth.
1 UnicastMulticast
c-status Codes that describe the client status. The c-status field has the following possible codes:
• 200—Connection was successful
• 210—Client reconnected (after first disconnecting)
• 400—Requested URL was invalid
• 401—Client was denied access
• 404—Requested content was not found
• 408—Client failed to submit a log because the client disconnected
• 420—Client was disconnected and attempted to reconnect but failed. If the client attempts to reconnect, a new session is started. This code reflects the client’s statistics when the client was originally disconnected. For each log entry with this code, there should be a 408 code that has the same session ID.
• 500—Windows Media server encountered an internal error and stopped streaming
200 UnicastMulticast
Table 7-42 Windows Media Streaming Transaction Log Fields (continued)
Field Description Sample ValueClient Data Reported
7-60Cisco Internet Streamer CDS 2.5 Software Configuration Guide
OL-20686-06
Chapter 7 Monitoring the Internet Streamer CDSTransaction Logs
c-playerid Globally unique identifier (GUID) of the client. For player log entries, if the player is configured to not send unique player identification information to content providers, the value is: {3300AD50-2C39-46c0-AE0A-xxxxxxxxxxxx}, where x is the session ID of the client. For distribution server log entries, this value is always a series of zeroes.
{c579d042-cecc-11d1-bb31-00a0c9603954}
UnicastMulticast
c-playerversion For player log entries, this field represents the version number of the player. For distribution server log entries, this field represents the version number of the distribution server.
6.2.5.415 UnicastMulticast
c-playerlanguage Language and country or region code of the player. en-US UnicastMulticast
cs(User-Agent) Browser type used if the player was embedded in a browser. If the player was not embedded, this field refers to the user agent of the client that generated the log.
Mozilla/4.0_(compatible;_MSIE_4.01;_Windows_98)
Unicast
cs(Referer) URL to the web page in which the player was embedded (if it was embedded). If this is unknown, the field is blank.
http://www.example.microsoft.com
Unicast
c-hostexe For player log entries, this is the host program (.exe) that was started (for example, a web page in a browser, a Microsoft Visual Basic applet, or a stand-alone player). For distribution server log entries, this is the name of the distribution server’s service program (.exe) that was started.
iexplore.exevb.exemplayer2.exeWMServer.exe
UnicastMulticast
c-hostexever Host program (.exe) version number. 4.70.1215 UnicastMulticast
c-osversion Version number of the client operating system. 4.0.0.1381 UnicastMulticast
c-cpu Client CPU type. Pentium UnicastMulticast
filelength Length of the digital media file (in seconds). This value is zero for a stream delivered from a broadcast publishing point.
60 Unicast
filesize Size of the digital media file (in bytes). This value is zero for a stream delivered from a broadcast publishing point.
86000 Unicast
avgbandwidth Average bandwidth (in bits per second) used by the client when connected to the server. The value is calculated across the entire duration of the connection.
24300 UnicastMulticast
protocol Actual protocol used to access the content (may differ from the protocol requested by the client). A value of “Cache” indicates that a client played the content from its disk-based cache. A value of “asfm” indicates that the content was delivered using multicast transmission.
MMST UnicastMulticast
transport Transport protocol used to stream the content. Multicast content is always streamed using UDP.
UDP
TCP
UnicastMulticast
Table 7-42 Windows Media Streaming Transaction Log Fields (continued)
Field Description Sample ValueClient Data Reported
7-61Cisco Internet Streamer CDS 2.5 Software Configuration Guide
OL-20686-06
Chapter 7 Monitoring the Internet Streamer CDSTransaction Logs
audiocodec For player log entries, this is the audio codecs used to encode the audio streams the client accessed. If multiple codecs were used, the values are delimited by a semicolon. This field contains a hyphen (-) in distribution server log entries.
Microsoft_Audio_Codec
UnicastMulticast
videocodec For player log entries, this is the video codecs used to encode the video streams the client accessed. If multiple codecs were used, the values are delimited by a semicolon. This field contains a hyphen (-) in distribution server log entries.
Microsoft_MPEG-4_Video_Codec_V2
UnicastMulticast
channelURL URL to the multicast information file. This field contains a hyphen (-) in a client receiving content as a unicast stream unless the unicast stream is a result of a unicast rollover from a multicast stream.
http://www.example.microsoft.com/channel.nsc
UnicastMulticast
sc-bytes Total number of bytes the server sent to the client. The value does not include any overhead that is added by the network stack. However, protocols such as MMS, RTSP, and HTTP may introduce some overhead. Therefore, the same content streamed by using different protocols may result in different values.
This field contains a hyphen (-) in propagated cache or proxy logs and in multicast log files.
30000 Unicast
c-bytes Number of bytes received by the client from the server. The value does not include any overhead that is added by the network stack. However, protocols such as MMS, RTSP, and HTTP may introduce some overhead. Therefore, the same content streamed by using different protocols may result in different values. If the c-bytes and sc-bytes fields are not identical, packet loss occurred.
28583 UnicastMulticast
s-pkts-sent Number of content packets sent by the server to a connected client. The value does not include TCP or UDP packets. This field contains a hyphen (-) in propagated cache or proxy logs and in multicast log files.
55 Unicast
c-pkts-received Number of packets from the server (s-pkts-sent) that are received correctly by the client on the first try. Packets that are not received correctly on the first try can be recovered if they are resent through UDP. Packets that are not recovered through UDP resend are considered lost in the network. You can recover these packets if error correction is enabled. The value does not include TCP or UDP packets.
50 UnicastMulticast
c-pkts-lost-client Packets lost that were not recovered at the client layer through error correction or at the network layer through UDP resends during transmission from server to client. These packets are sent by the Windows Media server but never played by the client. The value does not include TCP or UDP packets.
5 UnicastMulticast
c-pkts-lost-net Number of packets lost on the network layer. You can still recover these packets if error correction is enabled. The value does not include TCP or UDP packets.
2 UnicastMulticast
Table 7-42 Windows Media Streaming Transaction Log Fields (continued)
Field Description Sample ValueClient Data Reported
7-62Cisco Internet Streamer CDS 2.5 Software Configuration Guide
OL-20686-06
Chapter 7 Monitoring the Internet Streamer CDSTransaction Logs
c-pkts-lost-cont-net Maximum number of continuously lost packets on the network layer during transmission from server to client. If the value is high, the network conditions were bad with long periods of time during which the client received no packets. The value does not include TCP or UDP packets.
2 UnicastMulticast
c-resendreqs Number of client requests to receive new packets. This field contains a zero unless the client is using UDP resend.
5 UnicastMulticast
c-pkts-recovered-ECC Packets lost in the network (c-pkts-lost-net) that were repaired and recovered at the client layer because error correction was enabled. Error correction is the only means of packet recovery for multicast streams. Packets repaired and recovered at the client layer are equal to the difference between the c-pkts-lost-net and c-pkts-lost-client fields. The value does not include TCP or UDP packets.
3 UnicastMulticast
c-pkts-recovered-resent Number of packets recovered because they were resent through UDP. The value does not include TCP or UDP packets. This field contains a zero unless the client is using UDP resend.
5 UnicastMulticast
c-buffercount Number of times the client buffered while playing the stream. 4 UnicastMulticast
c-totalbuffertime Time (in seconds) the client used to buffer the stream. If the client buffers more than once before a log entry is generated, c-totalbuffertime is the total amount of time the client spent buffering.
6 UnicastMulticast
c-quality The lowest amount of stream quality reported by the player during the playback of the stream.
96 UnicastMulticast
s-ip IP address of the server that received the log file. For multicast log files, this value is the IP address of the web server on which Wmsiislog.dll is installed.
224.24.41.189 UnicastMulticast
s-dns Domain Name System (DNS) name of the server that received the log file. This field contains a hyphen (-) in multicast log files.
media.server.company.com
Unicast
s-totalclients Number of clients connected to the server (but not necessarily streaming) at the time the event was logged. This field contains a hyphen (-) in propagated cache or proxy logs and in multicast log files.
20 Unicast
s-cpu-util Average load on the server processor (0 to 100 percent). If multiple processors exist, this value is the average for all processors. This field contains a hyphen (-) in propagated cache or proxy logs and in multicast log files.
40 Unicast
cs-username The user name the client provided during authentication. This field contains a value only if authorization and authentication plug-ins are enabled. If an anonymous authentication method is used, this field contains a hyphen (-).
JSmith Unicast
Table 7-42 Windows Media Streaming Transaction Log Fields (continued)
Field Description Sample ValueClient Data Reported
7-63Cisco Internet Streamer CDS 2.5 Software Configuration Guide
OL-20686-06
Chapter 7 Monitoring the Internet Streamer CDSTransaction Logs
s-sessionid A session identifier the server uses to track a stream session. This is important for tracking multiple log entries to the same session. Note that if Windows Media Player version 6.4 received content over HTTP, the s-sessionid value changes for each log entry, even if the entries are for the same session.
123456 Unicast
s-contentpath The actual content that streamed. A plug-in may resolve a requested path to another path. If the client was redirected, this field represents the location to which the client was redirected.
file://C:\WMPub\WMRoot\Encoder_ad.wmv
or
http://www.example.microsoft.com/speech.wma
Unicast
cs-url The actual URL requested by the client.
For multicast clients, this value is the multicast IP address and port. However, Windows Media Player 9 Series and the Windows Media Player 9 Series ActiveX control multicast clients submit the multicast IP address and port, followed by the IP address of the network interface from which the server broadcasts the multicast.
mms://microsoft.com/mycontent.wmv
asfm://206.73.118.254:26502
For Windows Media Player 9 Series clients:
asfm://multicast IP address:port/Server IP address
UnicastMulticast
cs-media-name If the client was receiving content from a playlist, this is the media element the client was receiving. The value is derived from the mediaName attribute of the playlist media element. If the mediaName attribute is not present, the value in this field is derived from the file name value. This field is blank if the client was not receiving content from a playlist.
Alternatively, this entry can be specified in the announcement file to classify logs according to user or content.
/ads/MyAd2.asf Unicast
c-max-bandwidth The maximum bandwidth rate (in bits per second) of the client. This value can be used to determine whether clients have the capacity for higher bandwidth content. The value recorded for this field can have the following types of values:
• Valid number of bps reported from the client, such as 38400.
• Undetermined amount, logged as 0.
• Very large amount that cannot be accurately measured but is greater than 1000000 and less than 1000000000 bps, logged as a hyphen (-).
• Hyphen (-), when a file is being played from the local cache and no bandwidth is used.
384000 UnicastMulticast
Table 7-42 Windows Media Streaming Transaction Log Fields (continued)
Field Description Sample ValueClient Data Reported
7-64Cisco Internet Streamer CDS 2.5 Software Configuration Guide
OL-20686-06
Chapter 7 Monitoring the Internet Streamer CDSTransaction Logs
Movie Streamer Transaction Log Fields
Note Changing the time zone on an SE does not affect the log entry nor the log filename. Both the log entries and the log filename always use UTC.
Table 7-43 describes the fields for the Movie Streamer transaction log.
cs-media-role A user-defined value that identifies the role of a media element in a playlist. Typically, this field is used to enable advertisement logging. If the media element does not have a role attribute, or if the client was not receiving content from a playlist, this field is blank. Alternatively, this entry can be specified in the announcement file to classify logs according to user or content.
Ad Unicast
s-proxied Indicates whether the client connected through a cache or proxy server. A value of 0 indicates no cache or proxy server was involved. A value of 1 indicates a cache or proxy server was involved.
1 Unicast
Table 7-42 Windows Media Streaming Transaction Log Fields (continued)
Field Description Sample ValueClient Data Reported
Table 7-43 Movie Streamer Transaction Log Fields
Field Description
c-ip Client IP address.
date Current log entry creation date.
time Current log entry creation time.
c-dns Always returns a dash (-).
cs-uri-stem Client-requested URL.
c-starttime The play start time related to session start time in seconds.
x-duration Current session duration in seconds.
c-rate Play rate (trick mode). Currently, this field has a fixed value of 1.
c-status RTSP status code.
c-playerid Client IP address (used for identification).
c-playerversion The version of the client media player.
c-playerlanguage The language of client media player.
cs(User-Agent) The user-agent description of the client media player.
c-os The operating system description of the client media player.
c-osversion The operating system version of the client media player.
c-cpu This field contains a hyphen (-) at all times.
filelength Content duration in seconds.
filesize Content file size in bytes.
7-65Cisco Internet Streamer CDS 2.5 Software Configuration Guide
OL-20686-06
Chapter 7 Monitoring the Internet Streamer CDSTransaction Logs
Flash Media Streaming Transaction Log FieldsThe Flash Media Streaming transaction logs consist of the access log. Table 7-44 describes the fields for the Flash Media Streaming access log.
Note When the data for a field contains a space or delimiter, the data is enclosed in double quotation marks. The double quotation marks surrounding the data are not part of the data, but are present for better parsing of the data. This applies to the tz, x-ctx, x-adaptor, x-vhost, s-uri, c-referrer, c-user-agent, cs-bytes, sc-bytes, and x-sname fields.
The following formats apply to the fields in Table 7-44:
Date—YYYY-MM-DD
Time—hh:mm:ss
Time zone—Contains a string such as “UTC,” “Pacific Daylight Time,” or “Pacific Standard Time”
avgbandwidth Content bitrate in bits per second (bps).
protocol Media data transport protocol (RTP or RTSP).
transport Media data transport type (UDP or TCP).
audiocodec Audio codec information.
videocodec Video codec information.
sc-bytes Bytes sent from the server to the client.
cs-bytes Bytes sent from the client to the server.
c-bytes Bytes received by the client.
s-pkts-sent Packets sent by the server.
c-pkts-received Packets received by the client.
c-pkts-lost-client Client packets lost.
c-buffercount Client buffer count. Currently, this field has a fixed value of 1.
c-totalbuffertime Client buffer delay time in seconds.
c-quality Client QoS level in current session.
s-ip Server IP address.
s-dns Server DNS.
s-totalclients Current number of clients connecting to server.
s-cpu-util Current CPU usage. Currently, this field has a fixed value of 0.
cs-uri-query The query URI sent from the client.
c-username The username sent from the client
sc(Realm) The server’s realm.
Table 7-43 Movie Streamer Transaction Log Fields (continued)
Field Description
7-66Cisco Internet Streamer CDS 2.5 Software Configuration Guide
OL-20686-06
Chapter 7 Monitoring the Internet Streamer CDSTransaction Logs
Note Changing the time zone on an SE does not affect the log entry nor the log filename. Both the log entries and the log filename always use UTC.
Table 7-44 Flash Media Streaming Access Log Fields
Field Description
x-event Type of event. See Table 7-46 for a list of the event types.
x-category Event category. See Table 7-46 for a list of the event categories.
date Date of the event.
time Time the event occurred.
tz Time zone information.
x-ctx Event-dependent context information.
s-ip IP address or addresses of the server.
x-pid Server process ID.
x-cpu-load CPU load.
x-mem-load Memory usage (as reported by the getServerStats() method).
x-adaptor Adaptor name.
x-vhost Virtual host name.
x-app Application names.
x-appinst Application instance names.
x-duration Duration of a stream or session event.
7-67Cisco Internet Streamer CDS 2.5 Software Configuration Guide
OL-20686-06
Chapter 7 Monitoring the Internet Streamer CDSTransaction Logs
x-status The status code. The status code is a ten-character string that represents the severity, category, and message ID.
Note For information on the event status codes for the access log, see the “Event Status Codes in Flash Media Streaming Access Logs” section on page 7-70.
The first three characters represent severity and have the following values:
• (w)—Warning
• (e)—Error
• (i)—Information
• (d)—Debug
• (s)—Trace from server-side script
• (_)—Unknown
The next three characters represent the category and have the following values:
• 257—TCService
• 258—TCServer
• 259—Presence
• 260—Storage
• 261—Stream
• 262—SMTP
• 263—Adaptor
• 264—JavaScript
• 265—TCApplication
• 266—TCConnector
• 267—Admin
• 268—SharedObject
• 269—Configuration
• 270—VirtualHost
• 271—SSL
The last four characters represent the message ID. The message ID records information about operation of the Flash Media Server. For more information, see the Adobe Flash Media Server 3.5 Configuration and Administration Guide.
c-ip Client IP address.
c-proto Connection protocol (RTMP or RTMPT).
s-uri URI of the Flash Media Server application.
cs-uri-stem The stem portion of the s-uri field.
cs-uri-query The query portion of the s-uri field.
Table 7-44 Flash Media Streaming Access Log Fields (continued)
Field Description
7-68Cisco Internet Streamer CDS 2.5 Software Configuration Guide
OL-20686-06
Chapter 7 Monitoring the Internet Streamer CDSTransaction Logs
c-referrer URI of the referrer.
c-user-agent User agent.
c-client-id Client ID.
cs-bytes This field shows the number of bytes transferred from the client to the server.
This information can be used to bill customers per session. To calculate the bandwidth usage per session, subtract the cs-bytes value in the “connect” event from the cs-bytes value in the “disconnect” event.
sc-bytes This field shows the number of bytes transferred from the server to the client.
This information can be used to bill customers per session. To calculate the bandwidth usage per session, subtract the sc-bytes value in the “connect” event from the sc-bytes value in the “disconnect” event
c-connect-type Type of connection received by the server:
• Normal—Connection from a client, such as Flash Player
• Group—Connection between an edge server and an origin server
• Virtual—Client connection that goes through an edge server, using the group connection between the servers for transmission
x-sname Stream name.
x-sname-query Query portion of the stream URI specified in play or publish.
x-suri-query Same as x-sname-query.
x-suri-stem This is a composite field made up of cs-uri-stem + x-sname + x-file-ext.
x-suri This is a composite field made up of cs-uri-stem + x-sname + x-file-ext + x-sname-query.
x-file-name Full path of the file representing the x-sname stream.
x-file-ext Stream type (FLV or MP3).
x-file-size Stream size in bytes.
x-file-length Stream length in seconds.
x-spos Stream position.
cs-stream-bytes This field shows the number of bytes transferred from the client to the server per stream.
To calculate the bandwidth usage per stream, subtract the cs-stream-bytes value in the “publish” event from the cs-stream-bytes value in the “unpublish” event.
sc-stream-bytes This field shows the number of bytes transferred from the server to the client per stream. To calculate the bandwidth usage per stream, subtract the sc-stream-bytes value in the “play” event from the sc-stream-bytes value in the “stop” event.
The value of sc-stream-bytes can be greater than x-file-size when streaming files that are not encoded in FLV format, such as MP3 files.
Note The value of sc-stream-bytes is not necessarily the same as the value of the QoS ByteCount property.
Table 7-44 Flash Media Streaming Access Log Fields (continued)
Field Description
7-69Cisco Internet Streamer CDS 2.5 Software Configuration Guide
OL-20686-06
Chapter 7 Monitoring the Internet Streamer CDSTransaction Logs
x-service-name Name of the service providing the connection (only applicable to certain connection types).
x-sc-qos-bytes Number of bytes sent to the client for quality of service.
x-comment Comments.
x-sid The ID of a stream. This ID is unique for the client session but not across sessions.
x-trans-sname The name of the stream that the server transitions from (the original stream).
x-trans-sname-query The query stream portion of the stream name for the stream that the server transitions from.
x-trans-file-ext The file extension portion of the stream name for the stream that the server transitions from.
x-plugin Name of the plug-in. This field is only available in authorization (auth-) events.
x-page-url The URL of the web page in which the client SWF file is embedded.
x-smax-rec-size The maximum file size of a recorded stream.
x-smax-rec-duration The maximum duration of a recorded stream.
x-trans-mode The transition mode sent by the client in the NetStream.play2() call.x-offset When a stream is reconnected, the offset value indicates where to resume
streaming.
c-spos The client stream position when a “client-pause” or “client-seek” event is logged.
x-eid An event ID received by Authorization plug-in. This event is visible only in the auth.log file. This field is empty in the access.log file.
x-codec-type Codec type of the frame retrieved in the Authorization plug-in’s E_CODEC event. This event is visible only in the auth.log file. This field is empty in the access.log file.
x-codec Codec value of the “x-codec-type” retrieved in the Authorization plug-in’s E_CODEC_CHANGE event. This event is visible only in the auth.log file. This field is empty in the access.log file.
Table 7-44 Flash Media Streaming Access Log Fields (continued)
Field Description
7-70Cisco Internet Streamer CDS 2.5 Software Configuration Guide
OL-20686-06
Chapter 7 Monitoring the Internet Streamer CDSTransaction Logs
Event Status Codes in Flash Media Streaming Access Logs
The event status codes are based on HTTP response codes. Table 7-45 describes the status codes for the Flash Media Streaming access log.
Table 7-45 Flash Media Streaming Event Status Codes
Field SymbolStatus Code Description
connect pending status_continue 100 Waiting for the application to authenticate.
disconnect status_admin_command 102 Client disconnected due to admin command.
disconnect status_shutdown 103 Client disconnected due to server shutdown (or application unloaded).
connect, publish, unpublish, play, record, record stop, stop
status_OK 200 Successful.
play, stop status_transition 210 A transition between streams has occurred.
connect status_unavailable 302 Application currently unavailable.
connect, publish, play
status_bad_request 400 Bad request; invalid parameter or client connected to server using an unknown protocol.
connect, play, publish
status_unauthorized 401 Connection rejected by application script or access denied by application.
connect status_forbidden 403 Connection rejected by Authorization plug-in or connection rejected due to invalid URI.
connect, play object_not_found 404 Application or stream not found.
play client_disconnect 408 Stream stopped because client disconnected.
connect, publish status_conflict 409 Resource limit exceeded or stream is already being published. Can also mean that a change has been made by the Authorization plug-in.
disconnect js_close_previous_client 601 Network connection was closed or reused.
disconnect js_exception 602 An unknown exception is thrown from the JS engine.
disconnect js_chunkstream_error 603 Bad application data.
disconnect js_debug_forbidden 604 Application does not allow debug connections.
play js_gc_object 605 ~fcstreamjshook() clean up.
Table 7-45 Flash Media Streaming Event Status Codes (continued)
Field SymbolStatus Code Description
7-72Cisco Internet Streamer CDS 2.5 Software Configuration Guide
OL-20686-06
Chapter 7 Monitoring the Internet Streamer CDSTransaction Logs
Events in Flash Media Streaming Access Logs
Table 7-46 describes the event types in the Flash Media Streaming access log and the associated category for each event.
Table 7-46 Flash Media Streaming Access Logs—Events
Event Category Description
connect-pending session Client connects to the server, waiting for the client to be authenticated.
connect session Client connects to the server.
connect-continue session A checkpoint event that provides updates of a corresponding connect event at intervals. Use the c-client-id field to find the corresponding connect event.
disconnect session Client disconnects.
publish stream Client publishes a live stream.
unpublish stream Client unpublishes a live stream.
publish-continue stream A checkpoint event that provides updates of a corresponding publish event at intervals. Use the x-sid field (stream id) and the c-client-id field to find the corresponding publish event.
play stream Client plays a stream.
play-continue stream A checkpoint event that provides updates of a corresponding play event at intervals. Use the x-sid field (stream id) with the c-client-id field to find the corresponding play event.
pause stream Client pauses stream.
unpause stream Client resumes playing stream.
client-pause stream Client smart pauses a stream. The stream is paused but the server still sends data to the client so the player has enough data to play when the client unpauses.
client-unpause stream Client smart unpauses a stream.
seek stream Client seeks in a stream.
stop stream Client stops playing or publishing a stream.
record stream Client begins recording a stream.
recordstop stream Client stops recording a stream.
start-transmit stream The server received a “startTransmit” command. This command asks the server to transmit more data because the buffer is running low.
stop-transmit stream The server received a “stopTransmit” command. This command asks the server to suspend transmission until the client sends a “startTransmit” event because there is enough data in the buffer.
server-start server Server has started.
server-stop server Server has stopped.
vhost-start vhost A virtual host has started.
vhost-stop vhost A virtual host has stopped.
7-73Cisco Internet Streamer CDS 2.5 Software Configuration Guide
OL-20686-06
Chapter 7 Monitoring the Internet Streamer CDSTransaction Logs
Service Router Transaction Log Fields
Note Changing the time zone on an SE does not affect the log entry nor the log filename. Both the log entries and the log filename always use UTC.
Table 7-47 describes the fields for the Service Router transaction log.
app-start application An application instance has started.
app-stop application An application instance has stopped.
auth-connect authorization Client connects to server. This event occurs if an Authorization plug-in is present to handle the event.
auth-play authorization Client plays a stream. This event occurs if an Authorization plug-in is present to handle the event.
auth-publish authorization Client publishes a live stream. This event occurs if an Authorization plug-in is present to handle the event.
auth-seek authorization Client jumps to a new location within a recorded stream. This event occurs if an Authorization plug-in is present to handle the event.
filenametransform authorization A virtual stream path has been mapped to a physical location. This event occurs if an Authorization plug-in is present to handle the event.
auth-record authorization Client begins recording a stream. This event occurs if an Authorization plug-in is present to handle the event.
codechange authorization The publisher codec changes during a live event. Logs data to the x-codec-type and x-codec fields. This event occurs if an Authorization plug-in is present to handle the event.
Table 7-46 Flash Media Streaming Access Logs—Events (continued)
Event Category Description
Table 7-47 Service Router Transaction Log Fields
Field Description
c-ip Source Internet Protocol (IP) address of the connected socket. This may be the IP address of a proxy server or firewall.
user-agent Browser type used if the player was embedded in a browser. If the player was not embedded, this field refers to the user agent of the client that generated the log.
date Date, in international date format, when a client is connected.
time Time when the client is connected. The time format is either in Coordinated Universal Time (UTC) or local time, depending on how the logging plug-in is configured.
url URL requested by the client.
protocol Protocol used to access the content.
7-74Cisco Internet Streamer CDS 2.5 Software Configuration Guide
OL-20686-06
Chapter 7 Monitoring the Internet Streamer CDSTransaction Logs
Note For cross-domain requests, the crossdomain.xml or clientaccesspolicy.xml file served by the SR is logged as 200 OK, and the request redirect is logged as a 302. For more information about cross-domain, see the “Cross-Domain Policy” section on page 1-38.
server-picked Service Engine selected by the Service Router.
status Status code.
routing-method Routing method chosen. The routing-method field has the following possible values:
• Last-Resort
• Network
• Proximity
• Zero-Network
• Geo-Location
Note This field was added in Release 2.5.9.
Table 7-47 Service Router Transaction Log Fields (continued)