Page 1
i
Monitoring transition dairy cow behaviour for the detection of subclinical
ketosis
by
Emily Isabel Kaufman
A Thesis
Presented to
The University of Guelph
In partial fulfillment of requirements
for the degree of
Master of Science
in
Animal and Poultry Science
Guelph, Ontario, Canada
©Emily Isabel Kaufman, August, 2015
Page 2
ii
ABSTRACT
MONITORING TRANSITION DAIRY COW BEHAVIOUR FOR THE DETECTION OF
SUBCLINICAL KETOSIS
Emily Isabel Kaufman Advisor:
University of Guelph, 2015 Dr. Trevor DeVries
An observational study of 4 free-stall farms was conducted to investigate the associations
of cow behaviour and cow-level factors with subclinical ketosis (SCK) in transition dairy cows.
Rumination time, lying behaviour, SCK, and other peripartum disorders were monitored from 2
wk before until 4 wk after calving for 339 cows. Lower rumination times and higher lying times
in multiparous cows during the wk after calving (wk+1) were associated with increased odds of
SCK with another health problem. Factors associated with lower odds of SCK in multiparous
cows included: lower stall stocking density during wk+1, shorter dry period, lower milk yield
during the previous lactation, and smaller BCS loss over transition. These results suggest
monitoring behaviour may be useful in identifying multiparous cows with SCK and another
health problem in wk+1; monitoring rumination behaviour, specifically, may aid in the early
identification of multiparous cows at higher risk for developing SCK post-calving.
Page 3
iii
ACKNOWLEDGEMENTS
Firstly, I would like to thank my advisor, Dr. Trevor DeVries for his endless
encouragement and guidance throughout the entire course of this project. His patience during all
the technical glitches provided much reassurance, allowing us to develop a solution to whatever
problem presented itself. His unwavering support and expertise throughout the writing process
allowed me to truly grow as a researcher, and I will be forever grateful. I would also like to thank
the members of my advisory committee for all of their advice, infinite support and constructive
criticism throughout the duration of my masters. I would like to thank Dr. Brian McBride for
providing unparalleled enthusiasm for this research and encouraging my critical thinking, and I
must also thank Dr. Stephen LeBlanc, for his wealth of knowledge and invaluable advice on
study design and writing.
I also want to give a big thank you to Dr. Ken Leslie for taking me on as a research
assistant and reconfirming my interest in dairy research and passion for the dairy industry. I
appreciate all of his support, encouragement, and enthusiasm to always pursue my goals.
I would like to extend a heartfelt thank you to all of the dairy producers who participated
in this study. Without each of these wonderful people, who graciously allowed us access to their
farms for months on end, this research would not have been possible. Their interest and support
of dairy research made the early mornings something to look forward to every week.
I am extremely grateful to Robin Crossley, Lisa Gordon, Caylie Corvinelli, and Hannah
Gillespie of the University of Guelph, Kemptville Campus for putting in so many long hours,
and making farm visits not only easier, but so much more fun! Thank you to Meagan King for all
the laughs at conferences and kind words of encouragement. I would also like to thank my good
friend and lab mate Morgan Overvest, for putting up with me 24/7 and always providing great
advice, both cow and non-cow related.
I would like to sincerely thank my family for their unwavering support throughout all of
my academic pursuits. To my mom and dad, Chuck and Pam, and siblings, Chris and Anne,
thank you all for your interest, love and constant encouragement when I needed it most. Lastly,
to Justine and Kyle, my "second family", for always being there, keeping me sane and laughing
all the way though undergraduate and graduate school.
Page 4
iv
TABLE OF CONTENTS
Abstract ..................................................................................................................................... ii
Acknowledgements ................................................................................................................... iii
Table of Contents ....................................................................................................................... iv
List of Tables ............................................................................................................................. vi
List of Figures ............................................................................................................................ ix
Chapter 1: Introduction ............................................................................................................... 1
1.1 Subclinical Ketosis ................................................................................................... 2
1.2 Behaviour Monitoring ............................................................................................... 8
1.2.1 Rumination and Feeding Behaviour ................................................................ 8
1.2.2 Lying Activity ............................................................................................... 11
1.2.3 Technologies for Behaviour Monitoring ........................................................ 13
1.3 Objectives and Hypotheses ..................................................................................... 16
Chapter 2: Monitoring rumination in transition dairy cows for the early detection of
subclinical ketosis .................................................................................................................... 17
2.1 Introduction ............................................................................................................. 17
2.2 Materials and Methods ............................................................................................ 18
2.2.1 Herd Selection ................................................................................................ 18
2.2.2 Cow Enrollment ............................................................................................. 19
2.2.3 Rumination Behaviour ................................................................................... 20
2.2.4 Subclinical Ketosis Diagnosis ....................................................................... 20
2.2.5 Determining Health Status ............................................................................. 21
2.2.6 Ration Composition ........................................................................................ 21
Page 5
v
2.2.7 Statistical Analysis ......................................................................................... 22
2.3 Results ..................................................................................................................... 24
2.4 Discussion ............................................................................................................... 26
2.5 Conclusions ............................................................................................................. 32
2.6 Acknowledgements ................................................................................................. 32
Chapter 3: The association between lying behaviour and subclinical ketosis in transition
dairy cows ................................................................................................................................ 47
3.1 Introduction ............................................................................................................ 47
3.2 Materials and Methods ............................................................................................ 48
3.2.1 Animals and Disease Diagnosis ..................................................................... 48
3.2.2 Lying Behaviour ............................................................................................. 49
3.2.3 Statistical Analysis ......................................................................................... 49
3.3 Results and Discussion ............................................................................................ 52
3.4 Conclusions ............................................................................................................ 56
3.5 Acknowledgements ................................................................................................. 56
Chapter 4: General Discussion ................................................................................................. 65
4.1 Important Findings .................................................................................................. 65
4.2 Future Research ...................................................................................................... 67
4.3 Implications ............................................................................................................. 69
Chapter 5: References ............................................................................................................... 71
Page 6
vi
LIST OF TABLES
Table 2.1 Descriptive summary of farm-level variables for lactating cows in an observational
study of the associations of rumination time from 2 wk before to 4 wk after calving and
subclinical ketosis. .................................................................................................................... 34
Table 2.2 Descriptive summary of farm-level variables for far-off and close-up dry cows in
an observational study of the associations of rumination time from 2 weeks before to 4 weeks
after calving and subclinical ketosis. ........................................................................................ 35
Table 2.3 Feed analysis summary for close-up dry cow and fresh cow feed rations at each
participating dairy farm in an observational study of the associations of rumination time and
subclinical ketosis over the transition period. ........................................................................... 37
Table 2.4 Descriptive summary (± SD) of focal cows sampled in each herd during an
observational study of the associations of rumination time and subclinical ketosis over the
transition period ........................................................................................................................ 38
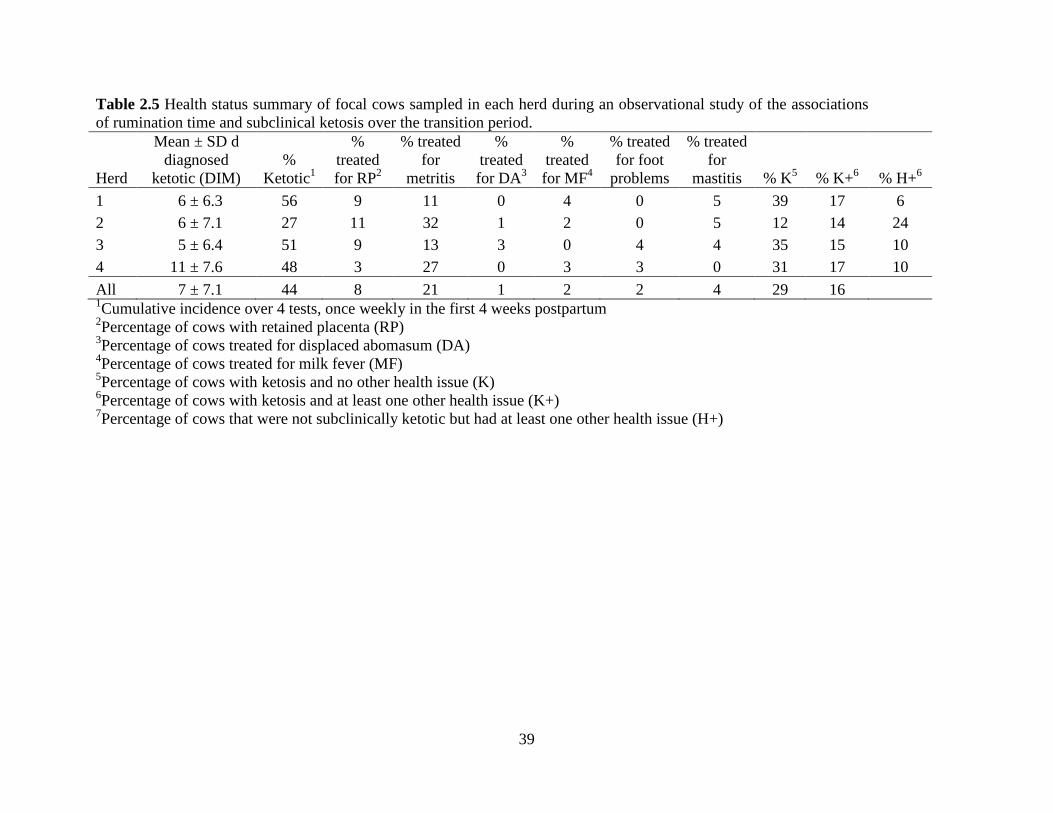
Table 2.5 Health status summary of focal cows sampled in each herd during an observational
study of the associations of rumination time and subclinical ketosis over the transition
period. ....................................................................................................................................... 39
Table 2.6 Least squares means (± SE) for daily rumination time (min/d) for healthy cows
without subclinical ketosis or other recorded illnesses (H), subclinically ketotic cows with no
other health problems (K), and subclinically ketotic cows with other health problems (K+)
during each week of the study period. ..................................................................................... 40
Table 2.7 Unconditional estimates for factors associated with the incidence of subclinical
ketosis with no other health issues (K; n = 76) relative to healthy animals (H; n = 87), in
multiparous cows ...................................................................................................................... 41
Page 7
vii
Table 2.8 Final logistic regression model for factors associated with the incidence of
subclinical ketosis with no other health issues (K; n = 76) relative to healthy animals (H; n =
87), in multiparous cows. .......................................................................................................... 42
Table 2.9 Unconditional estimates for factors associated with the incidence of subclinical
ketosis with other health problems (K+; n = 39) relative to healthy animals (H; n = 87), in
multiparous cows. ..................................................................................................................... 43
Table 2.10 Final logistic regression model for factors associated with the incidence of
subclinical ketosis with other health problems (K; n = 39) relative to healthy animals (H; n =
87), in multiparous cows. .......................................................................................................... 44
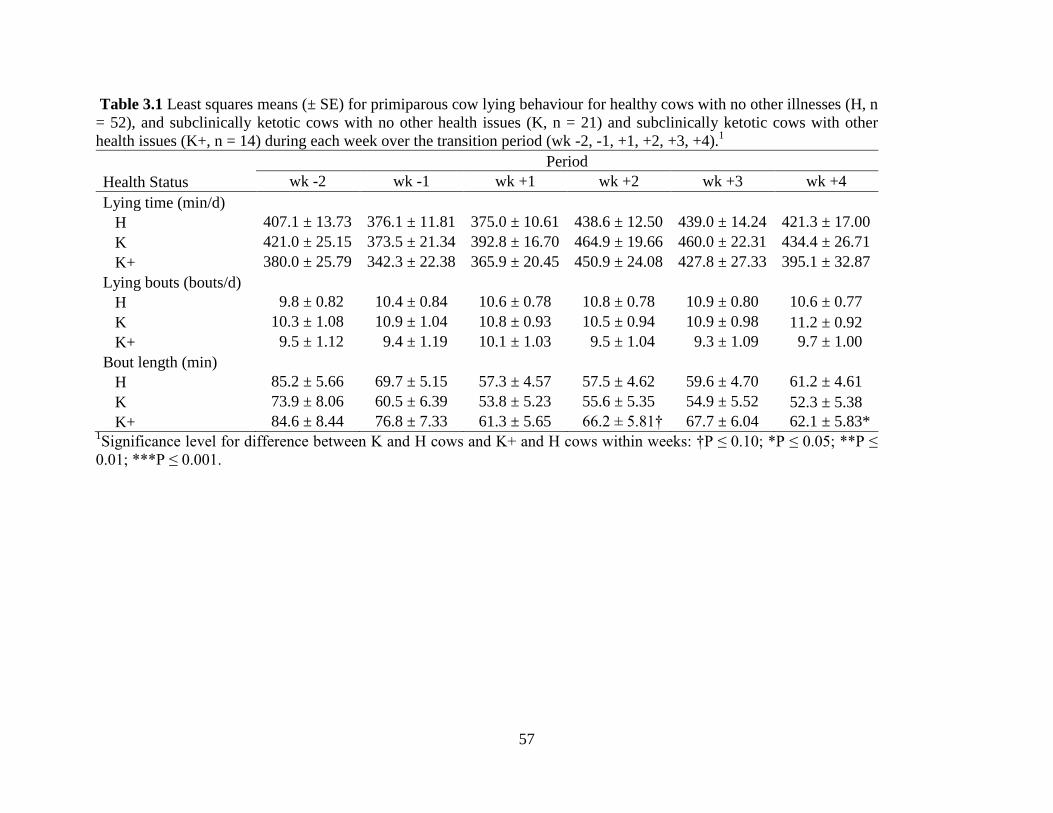
Table 3.1 Least squares means (± SE) for primiparous cow lying behaviour for healthy cows
with no other illnesses (H, n = 52), and subclinically ketotic cows with no other health issues
(K, n = 21) and subclinically ketotic cows with other health issues (K+, n = 14) during each
week over the transition period (wk -2, -1, +1, +2, +3, +4)...................................................... 57
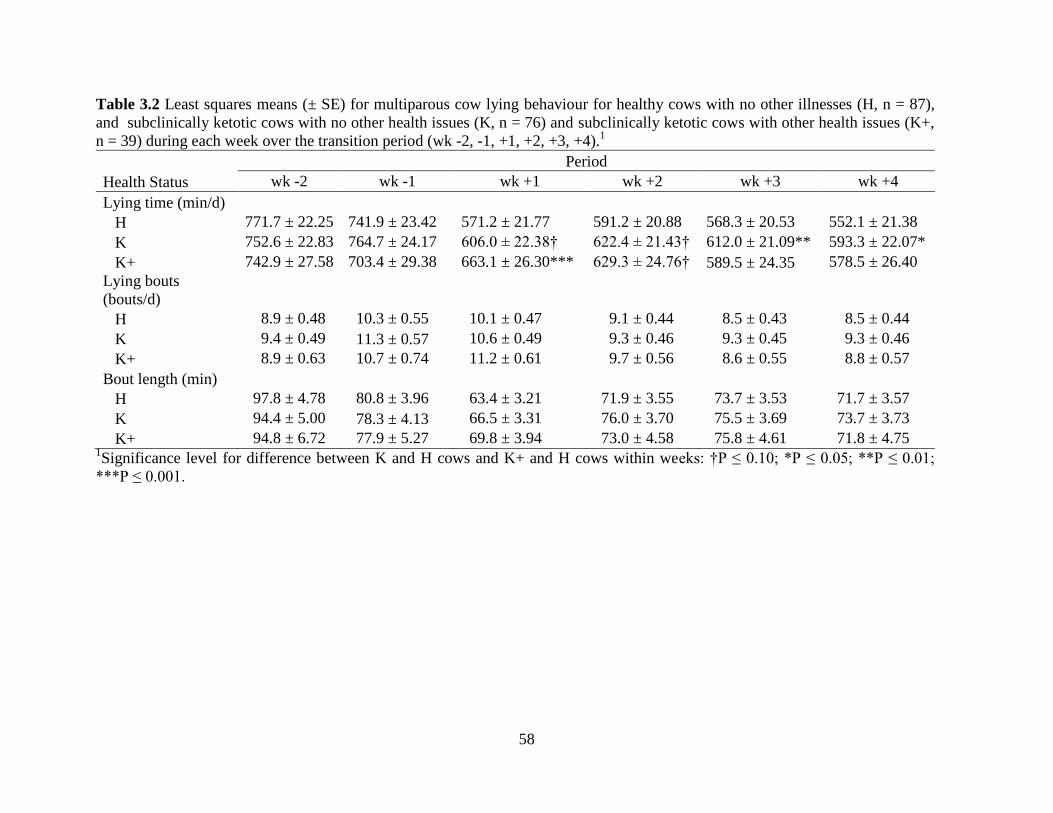
Table 3.2 Least squares means (± SE) for multiparous cow lying behaviour for healthy cows
with no other illnesses (H, n = 87), and subclinically ketotic cows with no other health issues
(K, n = 76) and subclinically ketotic cows with other health issues (K+, n = 39) during each
week over the transition period (wk -2, -1, +1, +2, +3, +4)...................................................... 58
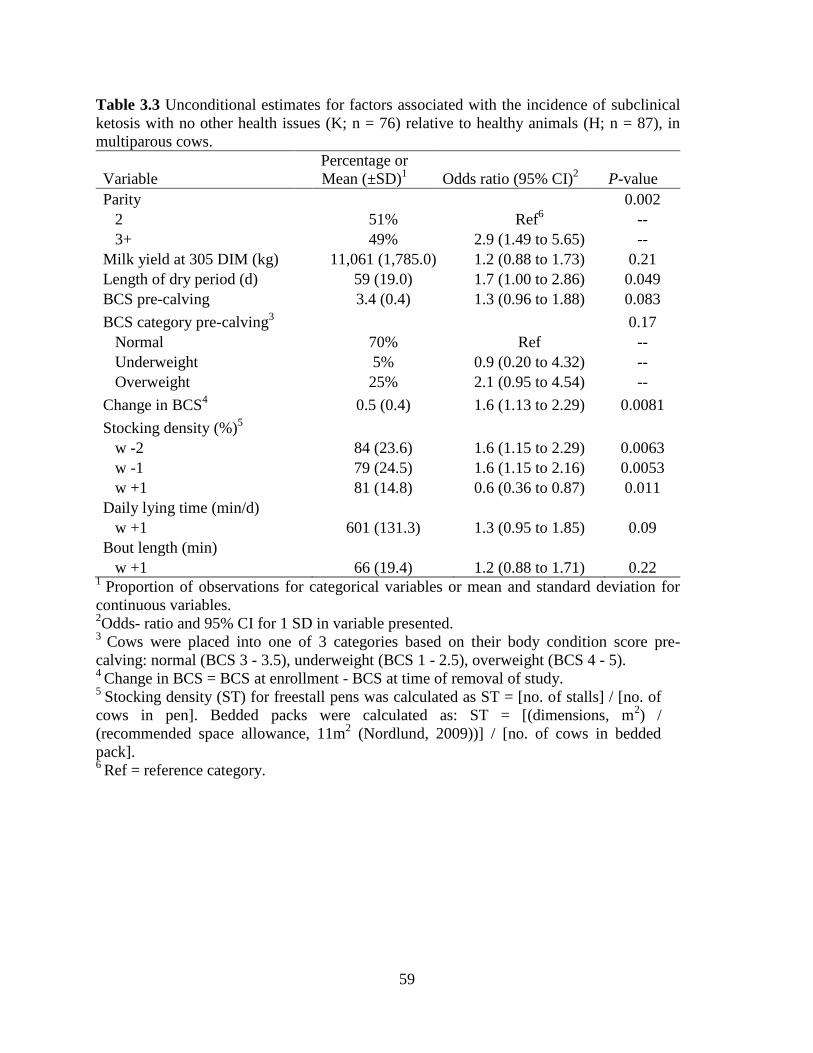
Table 3.3 Unconditional estimates for factors associated with the incidence of subclinical
ketosis with no other health issues (K; n = 76) relative to healthy animals (H; n = 87), in
multiparous cows. ..................................................................................................................... 59
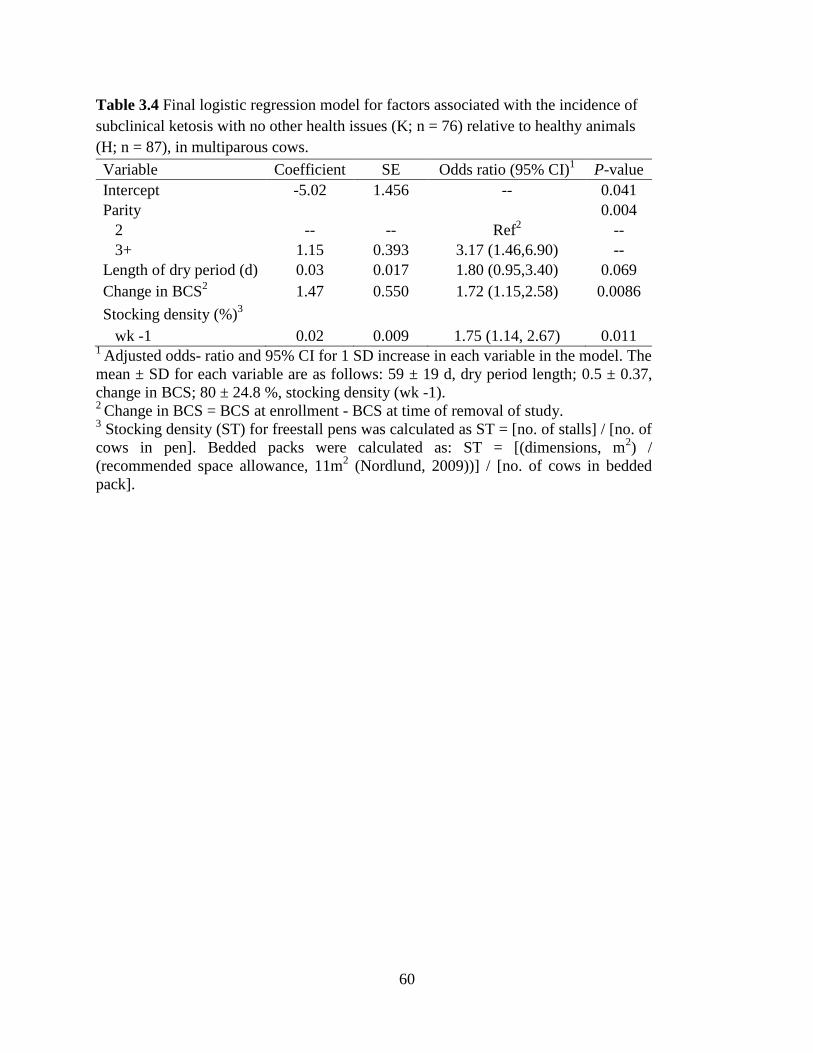
Table 3.4 Final logistic regression model for factors associated with the incidence of
subclinical ketosis with no other health issues (K; n = 76) relative to healthy animals (H; n =
87), in multiparous cows. .......................................................................................................... 60
Page 8
viii
Table 3.5 Unconditional estimates for factors associated with the incidence of subclinical
ketosis with other health problems (K+; n = 39) relative to healthy animals (H; n = 87), in
multiparous cows. ..................................................................................................................... 61
Table 3.6 Final logistic regression model for factors associated with the incidence of
subclinical ketosis with other health problems (K+; n = 39) relative to healthy animals (H; n =
87), in multiparous cows. .......................................................................................................... 62
Page 9
ix
LIST OF FIGURES
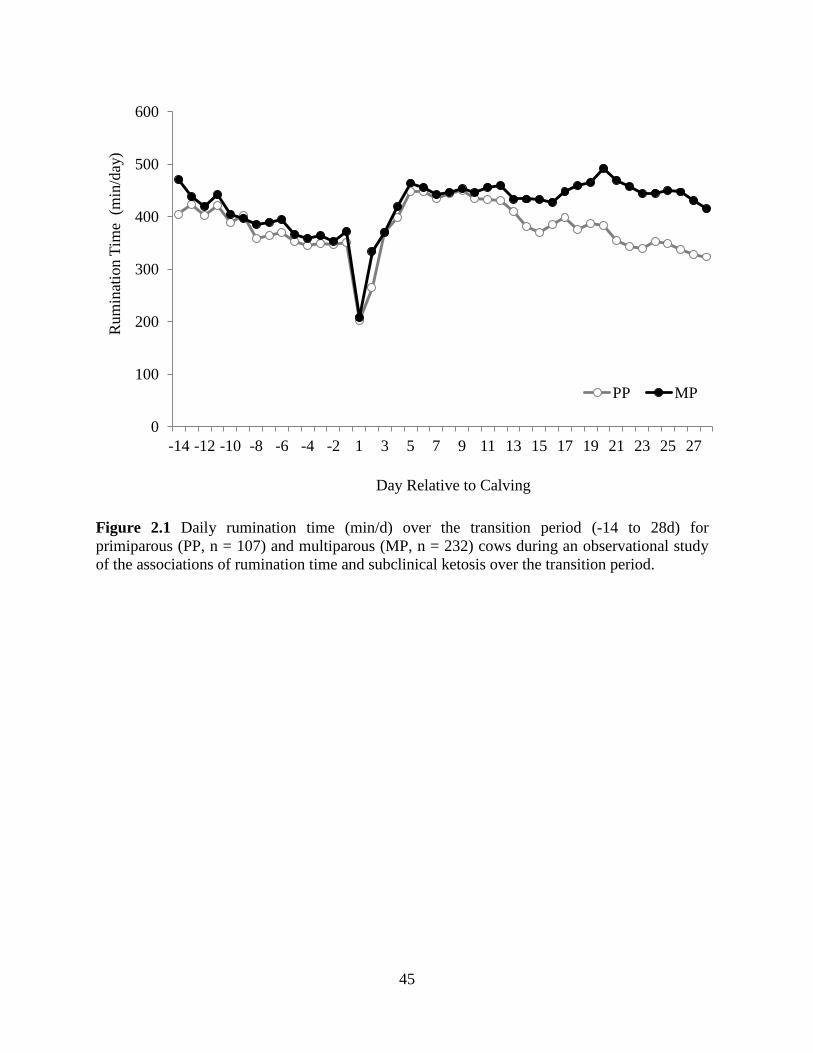
Figure 2.1 Daily rumination time (min/d) over the transition period (-14 to 28d) for
primiparous (PP, n = 107) and multiparous (MP, n = 232) cows during an observational study
of the associations of rumination time and subclinical ketosis over the transition period. ...... 45
Figure 2.2 Daily rumination time (min/d) over the transition period (-14 to 28 d) for healthy
multiparous (MP) cows with no other recorded illnesses (H; n = 87), ketotic MP cows with no
other health problems (K; n = 76) and ketotic MP cows with other health problems
(K+; n = 39). ............................................................................................................................. 46
Figure 3.1 Daily a) lying time (min/d), b) bout frequency (no. of bouts/d), and c) average
bout length (min) over the transition period (-14 to 28d) for multiparous (MP; n = 232) and
primiparous (PP; n = 107) cows. .............................................................................................. 63
Figure 3.2 Average daily lying time (min/d) over the transition period (-14 to 28 d) for
healthy multiparous (MP) cows with no other illnesses (H; n = 87), ketotic MP cows with no
other health issues (K; n = 76) and ketotic MP cows with other health issues (K+; n = 39). ... 64
Page 10
1
CHAPTER 1: INTRODUCTION
The transition period has been defined as 3 wk before calving until 3 wk after calving
(Drackley, 1999). This is a period of high energy demand where cows are going through many
physiological and hormonal changes. Not only must cows support their calf during the final
stages of development, but their bodies are getting ready to initiate lactation. While these cows
are pressured with increased energy requirements, they have a depressed DMI in the days
leading up to calving (Grant and Albright, 1995; Herdt, 2000). If these cows are not consuming
enough feed to sustain energy demands they will reach a state of negative energy balance (NEB).
As milk production peaks earlier in lactation than DMI, essentially all cows experience NEB at
the beginning of their lactation (Herdt, 2000). As milk production increases and cows continue in
a state of NEB they will begin to rely on fat stores to support their energy needs. Cows with
subclinical ketosis (SCK) mobilize body reserves releasing ketone bodies in the blood (Baumen
and Currie, 1980; Goldhawk et al., 2009; LeBlanc, 2010). This metabolic disorder is very
prevalent in high-producing dairy herds, affecting an average of 43% of cows during the first 2
wk of lactation (McArt et al., 2012).
Many researchers have identified the risk factors for SCK, and there is much information
on management approaches to help mitigate illness during the peripartum period (Duffield, 2000;
Ingvartsen, 2006). To reduce the risk of SCK cows must be provided with the proper nutrition
during the close-up period (Overton and Waldron, 2004), competition at the feed bunk should be
reduced by providing adequate feed bunk space, management should aim to reduce the amount
of over conditioning during the prepartum period (Ingvartsen, 2006), and producers should
implement monitoring programs to identify subclinically sick cows.
Page 11
2
There are many methods available to diagnose SCK including milk and urine tests, as
well as blood tests. Some of these methods are more subjective than others, testing must be done
on a regular basis during the first few weeks after calving, and testing may become quite costly
for producers. Even with these methods available, it is very difficult to diagnose ketosis in the
very early stages. In recent years, there is a growing amount of information of monitoring animal
behaviour for the detecting illnesses (Weary et al., 2009). This review will outline management
factors associated with SCK, while addressing current methods for detecting SCK and upcoming
uses of automated behavioural monitoring systems, specifically for rumination and lying
behaviour, for the detection of subclinical illness.
1.1 SUBCLINICAL KETOSIS
Dairy cows have a multitude of complex pathways to successfully adapt to milk
production (Bauman and Currie, 1980). To meet the high energy demand of lactation in early
lactation, while DMI intake is low, cows rely on body reserves (Ingvartsen, 2006). Fat reserves
are mobilized throughout the body releasing non-esterified fatty acids (NEFA) that are converted
to ketone bodies, i.e. acetone, acetate and beta-hydroxy butyrate (BHBA) in the liver. Production
of ketone bodies supplies an alternative fuel source for tissues allowing glucose to be conserved
for milk production (Ingvartsen, 2006). However, an accumulation of ketone bodies in the blood
can lead to decreased appetite, which can make overcoming the illness even more difficult. Cows
showing clinical signs of ketosis may have decreased appetite, increased lying time, and weight
loss (Andersson, 1988); however, cows with SCK may not show any of these symptoms and
only have high levels of circulating BHBA. This metabolic condition may decrease milk
production (Duffield, 2009; McArt et al., 2012), reduce probability of pregnancy at first artificial
Page 12
3
insemination (Walsh et al., 2007; Ospina et al., 2010) and increase the risk of other illnesses
including fatty liver, displaced abomasum, and metritis (LeBlanc, 2005; Suthar et al., 2013)
which has a large impact on dairy cow welfare.
There are many studies that have assessed cow-level and farm-level factors associated
with SCK. Cow-level factors, such as breed (Andersson and Emanuelson, 1985; Bendixen et al.,
1987), parity (Suthar et al., 2013; Berge and Vertenten, 2014; Vanholder et al., 2015), and milk
production (Baumen and Currie, 1980; Gröhn et al, 1989; Fleischer et al., 2001) may aid in
understanding ketosis; however, these factors can not readily be changed on farm. Many farm-
level factors associated with ketosis are management-related and may be modified to reduce the
risk of ketosis in dairy herds. These include characteristics of the close-up diet (Overton and
Waldron, 2004; VanSaun et al., 2014), as well as body condition score (BCS) of dry cows
(Gillund et al., 2001; McArt et al., 2013; Vanholder et al., 2015), dry period length (Rastani et
al., 2005; Santschi et al., 2011; Vanholder et al., 2015), and close-up pen characteristics (i.e.
housing design, stocking density, and feed bunk space).
The NRC (2001) recommends that close-up dry cows be given an energy rich (1.54 to
1.62 Mcal/kg of NEL) ration that provides the necessary nutrients required to advance metabolic
and physiological adaptations necessary for the onset of lactation. Gustafsson et al. (1995) found
that herds that fed fewer meals throughout the day, and those that had higher levels of
concentrate, were at an increased risk of SCK. Cows fed higher levels of concentrate may have
experienced periods of acidosis and decreased overall feed intake (Richert et al., 2013). More
recent work has suggested that controlling energy consumption in late gestation may improve
DMI in early lactation (Douglas et al., 2006; Janovick et al., 2011; Vickers et al., 2013). Vickers
et al. (2013) found close-up cows fed an 87% forage diet had a lower incidence of ketosis in the
Page 13
4
first 10 d post-calving compared to close-up cows fed a 77% forage diet. Janovick and Drackley
(2010) compared 3 close-up diets fed for 28 d before calving: the first provided 150% of NRC
(2001) energy requirements (OVR), the second 80% (RES), and the third 100% (CON). The
CON diet restricted energy intake by adding chopped wheat straw to the ration. Cows fed
chopped wheat straw had little reduction in DMI. Cows on the CON and RES diets showed little
NEB, however NEB was 55% greater 3 wk after parturition in MP cows on the OVR diet. Cows
on the OVR diet not only had greater reductions in DMI, but also gained more weight prepartum
and had greater weight loss postpartum.
Body condition score, and changes in BCS through the transition period, also have an
impact on risk of SCK. Vanholder et al. (2015) found that cows in both the moderate (3.5 ≤ BCS
≤ 3.75) and fat BCS category (BCS ≥ 4) had an increased risk of SCK compared to cows with
BCS ≤ 3. Cows with greater BCS pre-calving experience a greater decrease in DMI prior to
calving (Hayirli et al., 2002), which is a major contributing factor for developing SCK
postpartum (Goldhawk et al., 2009). Gillund et al. (2001) actually found the loss of weight over
the transition period to be of greater importance rather than pre-calving BCS itself. Cows in a
state of NEB will deplete fat stores to compensate for the high energy demands of lactation
(Goldhawk et al., 2009). Researchers have found that a shorter dry period, 34 d or less versus the
traditional 60 d, may improved NEB due to greater DMI (Rastani et al., 2005) and slightly lower
milk production (Rastani et al., 2005; Watters et al., 2008). Rastani et al. (2005) also found all
cows had a similar BCS pre-calving; however, cows on the traditional dry period length had a
greater loss in BCS over the transition period compared to those with the shorter dry period.
Vanholder et al. (2015) found that cows with shorter dry periods actually had lower odds of
SCK. It is possible that longer dry periods are associated with greater late lactation pregnancies
Page 14
5
that result in higher BCS at dry off, which then is carried through the dry period. It is also
possible that higher BCS associated with longer dry periods may be the result of
overconsumption of nutrients during that time period, particularly if cows spend excess time
feeding on the close-up ration.
The ration during the dry period and length of time these animals are dry are not the only
factors affecting ketosis in early lactation. Access to feed and stocking density are also major
factors that affect ketosis (Munksgaard et al., 2005; Proudfoot et al., 2009). Cows prefer to eat
collectively as a group; however, they also readily form a dominance hierarchy which may
influence their behavioural patterns. In close-up bedded packs, it is recommended that there is
11m2 of space per cow (Nordlund, 2008) and in free stall barns the number of cows should not
exceed the number of stalls provided (Fregonesi et al., 2007). A minimum of 0.76 m of feed
bunk space per cow is also recommended for close-up dry cows (Nordlund et al., 2006).
Overcrowding can limit the ability of cows to access their desired resources, whether that be
lying areas, feed, or water, at the times they would prefer (Munksgaard et al., 2005). When stalls
are limited per cow, cows may be compelled to lay down right after milking (Fregonesi et al.,
2007), rather than consume feed at the feed bunk, potentially limiting DMI. In a study conducted
by Proudfoot et al. (2009), feeding behaviour of transition cows housed in a competitive group
(2:1 cows per feed bin) were compared to cows in a non-competitive group (1:1 cows per feed
bin). Researchers found that MP cows in the competitive environment showed a decrease in DMI
1 wk before calving. Other studies with lactating cows have shown that decreasing stocking
density at the feed bunk increases feeding time, especially in subordinate cows (DeVries et al.,
2004; Huzzey et al., 2006). Thus, to encourage DMI in late gestation, and limit the risk of SCK,
it is important that producers ensure enough feeding space for dry cows.
Page 15
6
Many of the factors discussed here have been associated with SCK, but more work needs
to be done to understand their interactions. Multiple factors combine to alter the risk of SCK and
these factors will vary both between farms and studies (McArt et al., 2013). Further research
should focus on understanding how these factors come together to affect nutrient consumption,
energy balance, physiological changes in dairy cows at transition and subsequent risk of SCK.
Many methods are available to identify cows with SCK. The gold standard diagnostic test
is measuring BHBA in blood serum or plasma (Duffield et al., 2009). Depending on the
outcome, thresholds of blood BHBA between 1.0 and 1.4 mmol/L have been used to define SCK
(Duffield et al., 1998; Iwersen et al., 2009; Rollin et al., 2010). When evaluating diagnostic tests,
they are compared to the gold standard and their accuracy is measured by sensitivity (the
proportion of diseased animals that test positive) and specificity (the proportion of non-diseased
animals that test negative). Measuring blood serum BHBA may be done by sending serum
samples to a diagnostic laboratory, which is time consuming and requires spinning down a larger
sample of blood. However, there are a number of cow-side tests available for detection of SCK
(Geishauser et al., 2000; Carrier et al., 2004; Iwersen et al., 2009). Iwerson et al. (2009)
validated the use of a handheld combined glucose and BHBA meter (Precision Xtra Abbott
Diabetes Care, Saint Laurent, QC, Canada) in cows. The handheld meter requires only a drop of
blood and will measure the concentration of blood BHBA on farm in 10s. The Precision Xtra
meter had 88% and 96% sensitivity and specificity for determining ketosis at the 1.2mmol/L cut-
off (Iwerson et al., 2009), making it a very accurate and reliable test. Another method for
evaluating ketosis on-farm is the use of test strips that indentify the presence of ketone bodies in
either urine or milk (Geishauser et al., 2000; Carrier et al., 2004). These test strips contain
nitroprusside which reacts with ketone bodies causing a color change in the test strip - a greater
Page 16
7
concentration of ketone bodies creates a darker purple color. The strips have a reference color
chart to indicate a range of the level of ketone bodies for each shade. Strips testing BHBA in
urine had a sensitivity of 97% and 60% specificity (Osborne et al., 2002). Multiple studies have
analyzed the reliability of test strips measuring BHBA in milk. When comparing a cut-off of
1.0mmol/L of BHBA in milk to the cut-off of 1.2mmol/L in blood serum, this test had sensitivity
and specificity reported as: 72% and 89% (Geishauser et al., 1998) and 96% and 63% (Enjalbert
et al., 2001), respectively. Milk and urine tests are economical tools useful for identifying ketosis
in cows, even though they do yield more false positive readings than the Precision Xtra meter.
These tests are also much more subjective as they only provide a semi quantitative diagnosis,
unlike the Precision Xtra meter which displays the concentration of BHBA in the blood so a cow
may easily be identified as above or below the threshold.
Even with the availability of numerous cowside tests for SCK, this metabolic disease
remains highly prevalent in dairy herds. McArt et al. (2012) reported an average cumulative SCK
incidence of 43% among cows tested thrice weekly from 3 to 16 DIM, with the peak incidence at
5 DIM. Duffield (2000) monitored ketosis in 25 Canadian herds and found the peak incidence of
ketosis to be 30% in the first week of lactation; when the time frame was extended to 9 wk,
cumulative incidence increased to 43%, with farm-level incidence ranging from 8-80%. The tests
described above are mainly used during the first 2 wk after calving, which is the most optimal
time to test for ketosis as many studies have found this disorder is most prevalent at this time
(Duffield, 2000; Leblanc, 2010; McArt et al., 2012). A more recent study by Tatone et al. (2015)
measured BHBA 3 to 9 d before the expected calving date with the Precision Xtra meter. These
researchers found cows with BHBA ≥ 0.6 mmol/L during the prepartum period were 2.2 times
likely to develop ketosis in the wk after calving compared to cows with a BHBA reading < 0.6
Page 17
8
mmol/L. This is, thus, the first cowside test that has also been validated for use in the pre-calving
period and may aid in detecting cows at risk for SCK and improve the timeliness of treating
these cows.
1.2 BEHAVIOUR MONITORING
Monitoring animal behaviour may be another useful tool in identifying cows at risk for
subclinical illness (Weary et al., 2009). For example, one study found that transition cows with
decreased DMI spent less time feeding pre-calving and were at an increased risk of developing
metritis post-calving (Huzzey et al., 2007). It has also been estimated that for every 1 kg
decrease in DMI, or 10 min decrease in feeding time, during the wk prior to calving, the odds of
developing SCK postpartum increased by 2.2 and 1.9 times, respectively (Goldhawk et al.,
2009). Cows with dystocia were more likely to switch between standing up and lying down in
the 24 h leading up to calving (Proudfoot et al., 2009b). Further, in a study by Calamari et al.
(2014) it was suggested that a slower increase in rumination time post-calving may be associated
with systemic inflammation. There is much recent work in evaluating feeding, rumination, and
lying behaviour throughout the transition period and there is growing evidence that monitoring
these behaviours may aid in identifying subclinical illness (Edwards and Tozer, 2004; Huzzey et
al., 2007; Jawor et al., 2012; Soriani et al., 2012; Calamari et al., 2014).
1.2.1 Rumination and Feeding Behaviour
As a ruminant species, dairy cows rely on the process of rumination to fully digest their
food. Microbes present in the rumen break down cellulose, allowing cows to digest grasses and
plant matter. Larger food particles in the rumen are regurgitated, re-masticated, and re-
swallowed to increase the surface area for microbes to attach and breakdown the food particles
Page 18
9
(Welch, 1982). During the breakdown process, microbes release volatile fatty acids into the
rumen which may be absorbed through rumen epithelium and used for energy. The large
production of volatile fatty acids in the rumen may cause the pH of the rumen to drop.
Rumination stimulates saliva production which aides in buffering the rumen (Erdman, 1988).
Total mixed rations with greater amounts of concentrate are digested much faster than diets high
in long fibrous particles, which may cause a depression in the pH of the rumen. Thus, it is
important to supply large particle, neutral detergent fiber in the ration to stimulate rumination
(Kononoff et al., 2003; Beauchemin and Yang, 2005), and in turn, saliva production to maintain
stable rumen conditions for microbes.
Daily rumination time is highly variable within individual cows (Pederson, 2010;
Sorinaini et al., 2012), but also between herds (Reith and Hoy, 2012). This variation may be due
to differences in the ration fed. Work by Dado and Allen (1995) showed that rumination time in
early lactation dairy cows increased from 380 to 500 min/d when NDF content of the ration was
increased from 25 to 35%. Variation in rumination time between cows may be due to sorting, as
well as intake levels. Cows consuming greater quantities of long ration particles may have longer
rumination times compared to cows that sort out a higher percentage of long particles higher in
NDF (Maulfair et al., 2010). Rumination time is more consistently associated with dietary NDF
intake (Welch and Smith, 1970; Beauchemin et al., 1994), whereas its association with DMI
varies in the literature (Hasegawa et al., 1997; Schirmann et al.; 2012). While some studies have
suggested rumination time may be indicative of DMI (Hasegawa et al., 1997), Clement et al.
(2014) recently found that rumination time was a significant, but small contributor in a DMI
prediction model. This may possibly be due to the variability of rumination time within weeks
and cows, making it difficult to predict DMI from rumination time. Schirmann et al. (2012)
Page 19
10
found a negative correlation between periods of DMI and rumination time in dry cows
throughout the day. These researchers hypothesized this was due to the fact that cows cannot
feed and ruminate at the same time. They did find, however, that cows spend more time
ruminating about 4 h after periods of high feed intake (Schirmann et al., 2012). This indicates
that within-cow variations in rumination data may be used to indicate changes in feeding
behaviour and intake, but may not be consistent in estimating DMI.
The average daily rumination time for close-up cows has been reported in multiple
studies: 400 to 450 min/d during the pre-calving period (Adin et al., 2009); 463 min/d for PP
cows and 522 min/d for MP cows from 10 to 2 d prior to calving (Soriani et al., 2012); and 477
min/d during 2 to 5 wk before calving (Aikman et al., 2008). Rumination time reaches its nadir at
the time of calving (Schirmann et al., 2007; Soriani et al., 2012; Calamari et al., 2014).
Schirmann et al. (2007) found that feeding time began to decrease 8 h before calving and
rumination time was quick to follow, 4 h before the onset of calving. Feeding time and
rumination time both began to increase at about 4 to 6 h post-calving. Rumination time increases
after calving and begins to plateau to an average of 452 min/d at around 15 DIM (Calamari et al.,
2014). The literature suggests lactating cows ruminate between 340 and 540 min/d (Kononoff
and Heinrichs, 2003; Beauchemin and Yang, 2005; Yang and Beauchemin, 2006). Soriani et al.
(2012) reported daily rumination times from 15 to 40 DIM were at the higher end of the range
compared to previous studies: 504 min/d for PP cows and 562 min/d for MP cows. Other studies
have also found that PP cows ruminate less each day compared to MP cows (Beauchemin and
Rode, 1994; Maekawa et al., 2002). Beauchemin and Rode (1994) also observed that PP and MP
cows regurgitated a similar number of boluses, however, MP spent more time chewing each
bolus. Cows that are regrouped show a decrease in rumination time the day after regrouping
Page 20
11
(Schirmann et al., 2011). Soriani et al. (2012) suggested that PP cows suffer more from the
stress of environmental changes at the initiation of lactation, and thus show a slower increase in
rumination time after calving compared to MP cows.
Cows with decreased DMI in the pre-calving period have much higher odds for
experiencing SCK post-calving (Goldhawk et al., 2009). Cows with SCK within the first few
days postpartum have been observed to have lower rumination times than healthy cows (Soriani
et al. 2012), and rumination time has been shown to have a negative association with blood
BHBA concentration in lactating dairy cows (Soriani et al., 2013). Rumination behaviour may be
a promising indicator of metabolic conditions (Soriani et al., 2012), particularly during the post-
partum period as it is likely affected by changes in feeding behaviour and DMI (Okine and
Mathison, 1991). Although a few studies have observed how rumination behaviour changes over
the transition period and have identified multiple factors that affect rumination and SCK, there is
little information on how rumination time and cow- and farm -level factors interact in their
associations with subclinical illness.
1.2.2 Lying Activity
Lying time is also associated with a number of cow- and herd-level factors. Factors at the
farm level that influence lying time include housing system (Haley et al., 2000; Sepúlveda-Varas
et al., 2014), stall dimensions (Haley et al., 2001; Tucker et al., 2004), bedding (Tucker et al.
2003; Fregonesi et al., 2007; Norring et al., 2008), stocking density (Fregonesi et al., 2007), and
season (Arazi et al., 2010; Steensels et al., 2012). Cows that were restricted from both lying
down and feeding spent more time lying down than feeding when given access to both resources
(Munksgaard et al., 2005). This research demonstrates the high priority for lying behaviour for
Page 21
12
dairy cows. If cows are deprived from lying down for more than 2 h, they will later spend more
time lying and reduce feeding time to try to compensate for lost time. Even after 40 h of
unrestricted access to lying down, cows restricted from lying down longer than 2 h could not
recuperate normal levels of lying time (Cooper et al,. 2007). Normal lying behaviour has been
associated with cow comfort (Cook et al., 2005), wellbeing (Haley et al., 2001; Fisher et al.,
2003) and production (Fregonesi and Leaver, 2001; Bewley et al., 2010).
Lying time is highly variable within cows, as well as within farms (Ito et al., 2009). At
the cow level, higher lying times are seen in cows with increased parity (Steensels et al., 2012;
Sepúlveda-Varas et al., 2014), greater DIM (Nielson et al., 2000; Bewley et al., 2010) and lower
production level (Bewley, et al. 2010; DeVries et al, 2011; Deming et al., 2013).
There are a number of studies that have specifically tried to understand the changes in
lying time throughout transition. Huzzey et al. (2005) found that cows spent around 702 min/d
lying down in the 10 d leading up to calving. Multiple studies have found that lying time, similar
to rumination time, reaches its nadir during calving and then begins to rapidly increase 4 to 5 d
post-calving (Arazi et al., 2010; Steensels et al., 2012). Blackie et al. (2006) also found that cows
take a greater number of steps/h during the wk after calving, possibly due to increased
inflammation or pain associated with calving (Proudfoot et al., 2009a). Cows are regularly
regrouped after calving, and a change in pens may reduce lying time and number of lying bouts
during the day after regrouping (von Keyserlingk et al., 2008). Less dominant cows may spend
more time standing at the feed bunk waiting to eat and are less apt to displace cows in stalls to lie
down. Researchers have found lying time stabilized after calving at: 636 min/d (Huzzey et al.,
2005); 590 to 650 min/d (Calderon and Cook, 2011); 491 to 578 min/d (Steensels et al., 2012).
Cows were found to spend more time standing post-calving mainly because they are dedicating
Page 22
13
more of their time to milking, as well as feeding, to support milk production (Goff and Horst,
1997; Huzzey et al., 2005; Gomez and Cook, 2010).
Although cows in NEB should spend more time feeding to compensate for their high
energy demands, cows with SCK may lie down for longer periods of time to conserve energy
(Hart, 1988) needed for milk production. Goldhawk et al. (2009) found that cows with SCK post-
calving spent less time at the feeder and visited the feeder less during the wk before calving. Itle
et al. (2015) found cows with clinical ketosis post-calving stood longer throughout the day in the
week before calving than healthy cows, but saw no difference in standing time post-calving.
Those researchers suggested that the cows that were later ketotic may have been more
subordinate and, therefore, spent more time standing waiting to feed rather than competing for a
spot at the feed bunk. A study that looked at standing behaviour of hypocalcaemic cows found
these cows lay down less during the 24 h before calving, but lay down longer in the wk after
calving (Jawor et al., 2012). Sepúlveda-Varas et al. (2014) looked at the post-calving differences
in lying time between cows with no health issues and compared them to cows with one, and
cows with greater than one, clinical postpartum disease. Primiparous cows with multiple
illnesses showed greater change in lying time than those with only one illness. Thus, lying
behaviour may be a promising indicator of metabolic conditions, particularly during the
peripartum period.
1.2.3 Technologies for Behaviour Monitoring
With a growing number of technologies available to producers, monitoring individual
animal behaviour on-farm is becoming much easier. In 2007, SCR Engineers Ltd. introduced an
automating rumination monitoring system (Hi-Tag, SCR Engineers Ltd., Netanya, Israel). The
Page 23
14
data logger contains a small microphone located on a collar that detects the time each bolus is
regurgitated and swallowed by the animal. These actions are recorded 24 h/d. Identification units
are necessary to upload collected rumination data from each data logger to the control unit at
least once every 23 h. Newer systems use an ID unit with radio technology to continuously
upload recordings from data loggers. All uploaded information is sent to the control box where
data from each cow can be read off the screen or sent to the producer via an internet connection.
Schirmann et al. (2009) validated this system, indicating it could be an accurate tool for
monitoring rumination behaviour in dairy cows in both commercial and research settings. In a
commercial setting, the system may be set up to continuously record rumination and activity data
for any cow equipped with a collar. Over time the system recognizes patterns in the data to
determine each individual cow's normal rumination cycle. When the data deviates from the cow's
normal pattern, the control box sends a message to the producer, notifying them to check that
cow.
More recently another system has become available that monitors ear temperature,
rumination and feeding behaviour, as well as activity using an ear tag monitor (CowManager
SensOor ear tag, Agis Automatisering BV, Harmelen, The Netherlands). In this system, a
microchip that attaches to the ear tag contains an accelerometer that detects changes in ear
movement. Each minute the tag records 1 of 4 behaviours the cow may be expressing:
"ruminating", "feeding", "resting" or "active". Each of these behaviours are expressed as a
percentage of behaviour per hour as well as per day and are uploaded to a computer via routers.
This system has been validated as another useful tool to monitor rumination and resting
behaviours and found it may be quite promising in monitoring feeding behaviour (Bikker et al.,
2014; Wolfger et al., 2015). Rumination and feeding times are compared to the previous day's
Page 24
15
values, and cows that experience a drop in these behaviours are flagged by the system as
possibly sick.
There are two main ways to assess activity in dairy cows. Pedometers, which have been
in use since the 1970's, measure the number of steps taken throughout the day, whereas
accelerometers measures the acceleration the device receives in proportion to free fall (MacKay
et al., 2012). Accelerometers do not count steps, but are able to quantify movement depending on
where the device is placed on the cow (Rutten et al., 2013). Many of these systems use
algorithms to identify spikes in movement that are characteristic of estrus behaviour and can
identify cows in heat. Many of these types of technologies have been validated and are used on
commercial farms, including the Afi Pedometer Plus leg tag (Afimilk, S.A.E. AFIKIM, Kibbutz
Afikim, Israel; Mattachini et al., 2013), Rumiwatch Pedometer (GmbH, Switzerland; Zehner et
al., 2012), and the IceQube activity monitor (IceRobotics, Scotland; McGowan et al., 2007).
Some accelerometers, normally placed on the hind leg, can measure total daily lying and
standing time. There are also a wide range of accelerometers used mainly in research settings
such as the HOBO Data Logger (HOBO Pendant G Acceleration Data Logger, Onset Computer
Corporation, Pocasset, MA; Legerwood et al., 2010), the Tinytag Plus (Tinytag Plus, Re-Ed volt,
Gemini Dataloggers (UK) Ltd., Chichester, UK; O’Driscoll et al., 2008), the IceTag Activity
Monitor (IceRobotics, Scotland); McGowan et al., 2007). All of these devices that have the
ability to measure lying time may be used to flag cows with low activity, or cows that spend
more time lying down that may possibly be sick.
These technologies may be very useful if they can accurately describe behaviours on a
continuous basis (Berckmans, 2004). If they are able to do this, dairy producers may be able to
spend less time observing the behaviour of all cows in the herd, which may be very difficult on
Page 25
16
large scale farms, and instead spend more time with individual cows that have deviated from
their normal behaviour.
1.3 OBJECTIVES AND HYPOTHESES
The overall objective of this thesis was to investigate rumination and lying behaviour of
dairy cows, using automated technologies, over the transition period and explore the relationship
among behaviour, management factors, and subclinical illness in high-producing, transition dairy
cows. A cross-sectional study of commercial free-stall farms was conducted to describe animal
behaviour and risk factors for subclinical illness at the cow-level, as well as to associate these
factors with the incidence of SCK. Our first objective (Chapter 2) was to characterize changes in
rumination behaviour across the transition period and determine if rumination behaviour may be
used to identify cows at risk for SCK. We hypothesized that dairy cows with reduced rumination
activity, both pre- and post-calving, would be at higher risk of experiencing SCK during early
lactation.
The second objective (Chapter 3) focused on understanding changes in lying behaviours
throughout transition and determined if daily lying time, frequency of lying bouts, and bout
duration may be used to identify cows at risk for SCK. We hypothesized that dairy cows with
increased lying activity, both pre- and post-calving, would be at higher risk of experiencing SCK
during early lactation.
Page 26
17
CHAPTER 2: Monitoring rumination in transition dairy cows for early detection of
subclinical ketosis
2.1 INTRODUCTION
The transition period commences 3 wk prior to calving and lasts until 3 wk after calving
(Drackley, 1999). It is both a critical and vulnerable time period for the dairy cow. Essentially
all dairy cows experience a negative energy balance (NEB) in early lactation (Sovani et al.,
2000), due to decreased DMI around calving and slower acceleration of DMI than of milk
production (Grant and Albright, 1995; Schirmann et al., 2013). An excessive or prolonged drop
in DMI around calving may result in non-adaptive NEB which may lead to subclinical ketosis
(SCK) (Grummer, 1995), also referred to as hyperketonemia (McArt et al., 2012).
McArt et al. (2012) reported an average cumulative SCK incidence of 43% among cows
tested thrice weekly from 3 to 16 DIM, with the peak incidence at 5 DIM. This condition can
result in low milk production (McArt et al., 2012), reduced reproductive performance (Walsh et
al., 2007), and increased risk of other illnesses including fatty liver, displaced abomasum, and
metritis (Suthar et al., 2013). Technological improvements have improved detection of SCK.
Cows in NEB begin to mobilize fat stores in an attempt to meet the high energy demand during
early lactation, which releases ketone bodies (i.e. BHBA) into the blood (Baumen and Currie,
1980; Goldhawk et al., 2009; LeBlanc, 2010). An electronic cow-side test for the quantification
of blood BHBA concentration (Precision Xtra Abbott Diabetes Care, Saint Laurent, QC,
Canada), has been validated in dairy cows (Iwersen et al., 2009; Voyvoda and Erdogan, 2010).
The current challenge for producers is identifying SCK at an early stage. There is
growing evidence that measurements of cow behaviour can be used to identify cows at risk for
illness (Weary et al., 2009). Huzzey et al. (2007) found that transition cows with decreased feed
Page 27
18
intake spent less time feeding pre-calving and were at an increased risk of developing metritis. It
has also been estimated that for every 1 kg decrease in DMI and 10 min decrease in feeding time
during the week prior to calving, the odds of developing SCK increased by 2.2 and 1.9 times,
respectively (Goldhawk et al., 2009). Another study by Calamari et al. (2014) suggested that a
slower increase in rumination time post-calving may be associated with systemic inflammation.
Cows with subclinical ketosis within the first few days postpartum have been observed to have
lower rumination times than healthy cows (Soriani et al. 2012) and rumination time has been
shown to have a negative association with blood BHBA concentration in lactating dairy cows
(Soriani et al., 2013). Rumination behaviour may be a promising indicator of metabolic
conditions (Soriani et al., 2012), particularly during the post-partum period as it is likely affected
by changes in feeding behaviour and DMI (Okine and Mathison, 1991).
The objective of this study was to characterize changes in rumination behaviour across
the transition period and determine if rumination behaviour might be used to identify cows at
risk for SCK. We hypothesized that dairy cows with reduced rumination activity, both pre- and
post-calving, would be at higher risk of experiencing SCK during early lactation.
2.2 MATERIALS AND METHODS
2.2.1 Herd Selection
This prospective observational study was conducted on 4 commercial dairy farms located
in Eastern Ontario, Canada between March and October 2014. Herds were selected as a
convenience sample according to proximity to the University of Guelph, Kemptville Campus
(Kemptville, Ontario, Canada). Participating dairies milked between 125 and 400 Holstein cows
(Table 2.1). All cows were housed in a free stall facility, fed a TMR 1x/d, and milked in a
Page 28
19
parlour 3x/d. Animal use, data collection, and study design were approved by the University of
Guelph's Animal Care Committee and Research Ethics Board.
Researchers surveyed each participating producer during the first farm visit and recorded
general farm information (herd size), as well as dry and fresh cow management practices (dry off
protocol, ionophore usage, frequency of feed delivery and feed push up). At each weekly visit,
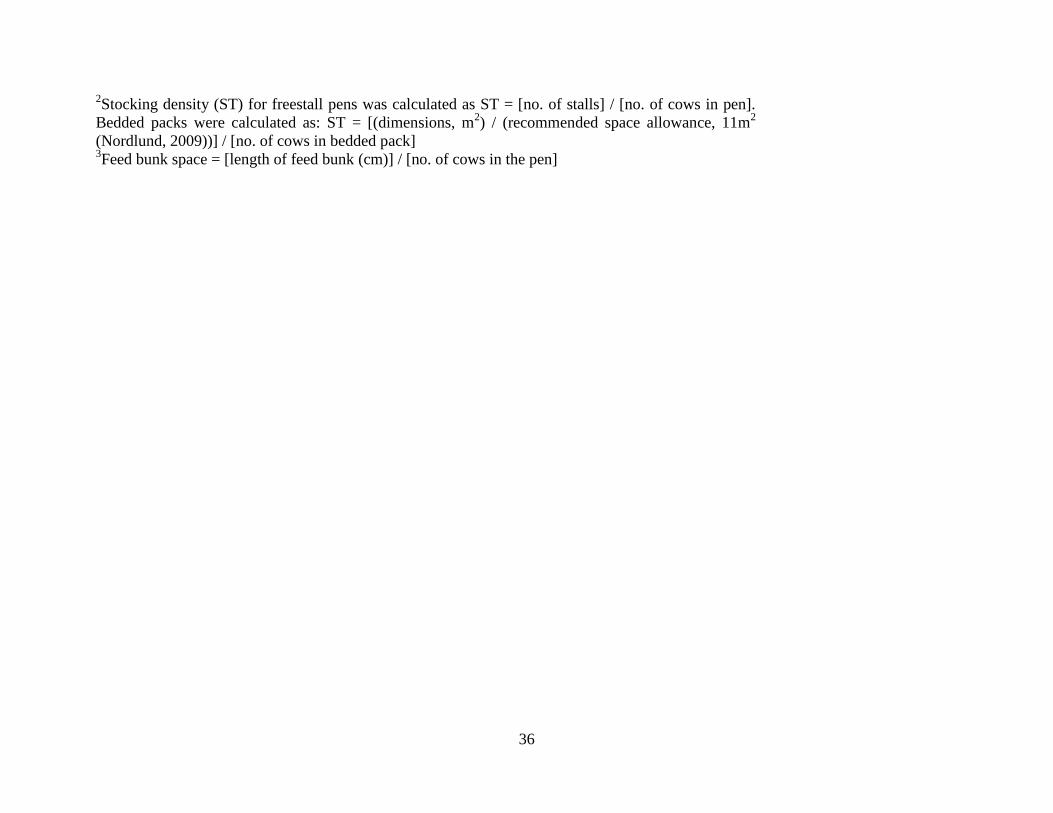
the total number of cows in each pen were counted and recorded. At the end of the 7-mo research
period, researchers measured stall and feed bunk dimensions for all dry and fresh cow pens to
calculate stocking density and feed bunk space available during each week of the transition
period. Management practices for lactating and dry cows are summarized in Tables 2.1 and 2.2,
respectively.
2.2.2 Cow Enrollment
Researchers obtained a list of expected calving dates from each participating farm at the
first farm visit. Each week, cows were systematically enrolled in the study based on the
availability of rumination collars and parity (1:2 ratio of primiparous to multiparous cows). Cows
were enrolled 2 to 3 wk before their expected calving date and at this time, individual animal
information (cow identification number, parity, dry-off date, expected calving date) was
recorded. We aimed to study each cow from 2 wk before calving until 4 wk after calving. In
total, 346 cows were monitored from an average of -16 ± 5.4 d (mean ± SD; min = -34 d, max =
-2 d) until +28 d relative to calving. This study aimed to screen a minimum of 300 cows; with an
expected SCK incidence rate of 40%, this would yield 120 cows with SCK. Given 95%
confidence and 80% power, this sample size was expected to allow for detection of a 50±10
min/d difference in rumination time between health categories.
Page 29
20
2.2.3 Rumination Behaviour
An automated rumination monitoring system (Hi-Tag, SCR Engineers Ltd., Netanya,
Israel) was installed at each participating dairy farm. Schirmann et al. (2009) validated the use of
this automated monitoring system for recording daily rumination time in dairy cows. In this
validation study, rumination time during a 2-hr interval was highly correlated (r = 0.93, R2 =
0.87, n = 51) with rumination time recorded using direct human observation over the same time
interval. In our study each cow was fitted with a SCR rumination collar at enrollment, which
monitored rumination 24 h/d over the 6-wk study period. The collars contained a small
microphone that recorded each time a bolus was regurgitated, re-masticated, and swallowed to
determine total time spent ruminating during each 2-h interval throughout the day. This
information was transferred to the control unit via radio frequency or when collars were scanned
by identification units located in high traffic areas (e.g. parlour exits or above water troughs).
Data were backed-up from the control unit and downloaded to the database on a weekly basis.
The 12, 2-h intervals each day were summed to determine total time spent ruminating per day
per cow.
2.2.4 Subclinical Ketosis Diagnosis
Each enrolled cow was assessed for SCK 1x/wk over the 6-wk study period for each cow.
Cows were restrained within 2 to 6 h after feeding in a stall or headlock to obtain a small blood
sample from the coccygeal vein using a vacuum-sealed blood collection tube (Blood Collection
Tube Vacutainer Glass 10ml - Red, Becton Dickinson Canada Inc, Mississauga, Ontario,
Canada) and 21G needle (Needle Vacutainer Multiple Sample 21G x 1 in, Becton Dickinson
Canada Inc, Mississauga, Ontario, Canada). The concentration of BHBA in this whole blood
sample was tested immediately using an electronic hand-held device (Precision Xtra meter,
Page 30
21
Abbott Diabetes Care, Saint Laurent, QC, Canada), as validated by Iwerson et al. (2009). The
BHBA concentration of the blood was recorded on farm; cows with BHBA ≥ 1.2mmol/L at one
or more of the 4 postpartum samples were classified as having SCK (Geishauser et al., 1998;
McArt et al., 2012).
2.2.5 Determining Health Status
Body condition score (1 to 5, following Wildman et al., 1982) and locomotion score (1 to
5, following Flower and Weary, 2007) were assessed at enrollment, 2 to 3 wk before the
expected calving date, and at the end of the study period, 4 wk after calving. Cows were scored
by one of two individuals at the time of enrollment and removal; inter-observer reliability was
determined between individuals to ensure validity of results (locomotion score, Kappa= 0.83;
BCS, Kappa= 0.84).
Producers were asked to monitor and record the incidence of retained placenta, metritis,
milk fever, displaced abomasum, and clinical mastitis. Occurrences of these conditions that
occurred during the 6-wk study period for each cow were recorded. Cows were categorized into
1 of 4 groups: healthy (H) cows had no SCK or any other recorded health problem; healthy plus
(H+) cows that did not have SCK but were treated for at least one other health problem; Cow
with SCK (K) but with no other health problems during the observation period; or ketotic plus
(K+) cows that had SCK and one or more other health problems during the observation period.
2.2.6 Ration Composition
Feed samples of the close-up dry cow ration and fresh cow ration were collected twice
each month, 1 d before the weekly farm visit. At each sampling, individual samples were taken
from 10 different areas of the feed bunk and combined into one sample of each diet per farm per
Page 31
22
sample day to ensure a representative sample. All samples were frozen at -20°C until nutrient
analysis.
Samples for DM were weighed then dried at 55°C for 48 hours. After drying, each
sample was weighed again to calculate the % DM of each close-up dry cow and fresh cow ration.
After drying, samples were ground to fit through a 1 mm screen. Samples of each diet at each
farm were pooled together into 3 samples (May-June, June-July, August-October). Pooled
samples were sent to Cumberland Valley Analytical Services Inc. (Maugansville, USA) for
analysis of DM (135°C; AOAC International, 2000: method 930.15), ash (535°C; AOAC
International, 2000: method 942.05), ADF (AOAC International, 2000: method 973.18), NDF
with heat-stable α-amylase and sodium sulfate (Van Soest et al, 1991), and CP (N x 6.25; AOAC
International, 2000: method 990.03; Leco FP-528 Nitrogen Analyzer, Lecom St. Joseph, USA).
Non-fiber carbohydrate content was also calculated as 100 – (% CP + % NDF + % fat + % ash)
(NRC, 2001). Feed rations for each participating farm are summarized in Table 2.3.
2.2.7 Statistical Analyses
Cows that had aborted (n=2), were sold (n=2), or diagnosed with SCK before calving
(n=3) were not included in the statistical analysis. Cows that were sold (n=22) or died (n=1)
during the post-calving period with behavioural and health measurements recorded until the day
they left the herd, were included in the analysis. The final dataset included 339 cows, (107
primiparous and 232 multiparous) categorized as H (n=139), H+ (n=50), K (n=97) and K+
(n=53).
For all further analyses described, comparisons were made between H and K cows and H
and K+ cows, respectively. Statistical analyses were performed with SAS (version 9.4; SAS
Institute, 2013) using cow within farm (n = 289) as the experimental unit. Daily rumination
Page 32
23
times (min/d) were summarized by cow and week such that these data aligned with the once
weekly testing of SCK. These data were analyzed in a general linear mixed model (PROC
MIXED in SAS), treating week as a repeated measure. The model for rumination activity
included the random effects of farm and cow within farm (subject of repeated statement) and the
fixed effects of health status, parity, and week, the interactions of health status by parity and
health status by week, as well as the three-way interaction of health status, parity, and week. The
covariance structure was heterogeneous compound symmetry, selected by best fit according to
Schwarz’s Bayesian information criterion. A three-way interaction was found between health
status, parity, and week (P < 0.01); thus, data from first lactation (primiparous, PP) and
multiparous (MP) cows were analyzed separately. These separate models included the fixed
effects of health status, week and the interaction between health status by week, with farm and
cow within farm included as random effects. Differences in rumination time between health
categories and weeks were compared using the least-squares means procedure with the PDIFF
option. Significance was declared at P < 0.05, and tendencies were reported if 0.05 < P < 0.10.
In the analysis of the impact of health status on rumination time, as described above,
differences were only found between health categories for MP cows. Thus multivariable logistic
regression was only performed on data from MP cows and not on PP cows. This analysis was
performed using the GLIMMIX procedure (distribution = binomial and link = logit) in SAS
(version 9.4; SAS Institute, 2013) to model to effects of rumination time and other cow-level
factors on the presence or absence of SCK. This was done using two models: one model
compared H and K cows, while the other compared H and K+ cows. Parity and pre-calving BCS
were both treated as categorical variables. Multiparous cows were characterized as second
lactation (2; n = 99) or third lactation and greater (3+; n = 103). BCS pre-calving was
Page 33
24
categorized into three groups: underweight, BCS < 3; normal, BCS = 3 to 3.5; overweight, BCS
> 3.5. Parity, pre-calving BCS category, change in BCS over the transition period, length of dry
period, milk yield from the previous lactation, as well as rumination time and stall stocking
density during the weeks prior to the mean day of diagnosis (wk -2, -1, and +1 relative to
calving), were all assessed for an association with presence or absence of K and K+ using
univariable logistic regression models. Variables with P ≤ 0.25 were then used to construct a
multivariable logistic regression model. The CORR procedure in SAS was used to check for
correlations between the explanatory variables included in the multivariable model. If 2 variables
were highly correlated (r > 0.8), the variable with the lowest P-value and most biological
relevance was retained for the multivariable model. Manual backward elimination of variables
with P > 0.10 was used to create the final models and from the resultant models, plausible 2-way
interactions were examined and retained if P ≤ 0.10. Only those variables retained in the final
multivariable model are presented.
2.3 RESULTS
A descriptive summary of cow-level variables, characterized by herd, is found in Table
2.4. Of the 339 cows, 139 (41%) did not have SCK or any other health problems. Table 2.5
describes the prevalence of ketosis. In total there were 150 cows with ketosis (44%) and of these,
53 were also treated for at least one other health problem (16% of all cows). The incidence risks
for diseases other than SCK are described in Table 2.5, with metritis being most common treated
illness, followed by retained placenta, mastitis, milk fever, foot problems, and displaced
abomasum.
Page 34
25
Among cows in their first lactation, from 2 wk prior to calving until 4 wk after calving,
there were no differences (P= 0.5) in rumination time among H, K and K+ cows (Table 2.6).
Rumination time in PP cows varied by week (P< 0.001). Primiparous cows ruminated less in wk
-1 compared to wk -2 (P=0.001), and rumination time increased from wk +1 to wk +2 (P<0.001)
and wk +3 to wk +4 (P=0.04) as seen in Figure 2.1.
For MP cows, an interaction was found between health status and week (P= 0.01; Table
2.6). Figure 2.2 illustrates how daily rumination time differed among H, K and K+ cows over the
observation period. There was an effect of time (P < 0.001) across all health statuses: daily
rumination time decreased in wk -1 compared to wk -2 but increased each week from wk -1 to
+2. Multiparous K cows tended to ruminate less than multiparous H cows during wk -1 and
during wk +1 (Table 2.6). The largest differences in rumination time between multiparous H and
K+ cows were seen during wk -1, +1 and +2.
Table 2.7 shows the unconditional associations of the independent variables from the
univariable analyses for H versus K cows prior to building the multivariable model. Increased
odds of SCK with no other recorded health problems (K) were associated with higher parity (3+
compared to second lactation cows), greater milk yield during the previous lactation, longer dry
period, cows being in the overweight category pre-calving, greater stall stocking density during
wk -2, -1, and +1, and greater loss in BCS over the transition period. Decreased odds of SCK
with no other health problems, relative to H, were associated with a greater stall stocking density
during wk +1, and greater rumination time during wk -1. Four of these variables were retained
in the final multivariable model (Table 2.8). Greater rumination time during the wk before
calving was associated with decreased odds of K, whereas greater milk yield in the previous
Page 35
26
lactation, greater loss of BCS over the transition period, and greater stall stocking density in the
week prior to calving were associated increased odds of K relative to H.
Unconditional associations of the independent variables for H versus K+ cows are shown
in Table 2.9. There were increased odds of developing SCK combined with another health
problem with higher parity (3+ compared to second lactation cows), greater milk yield during the
previous lactation, longer dry period, higher BCS pre-calving, cows being in the overweight or
underweight category pre-calving, greater change in BCS over the transition period, and
increased stall stocking density during wk -2 and -1. There were decreased odds of SCK with
another health problem (K+) with a greater daily rumination time during wk -1 and +1. Four of
these variables were retained in the final multivariable model (Table 2.10). Greater rumination
time during the wk after calving was associated with decreased risk of K+, whereas being in the
3rd
parity or higher, having a longer dry period, and experiencing greater stall stocking density in
the wk prior to calving were associated with increased risk of K+ relative to H.
2.4 DISCUSSION
In this study we characterized the changes in rumination behaviour across the transition
period. Both PP and MP cows experienced a reduction in daily rumination time from wk -2 to -1
pre-partum, which may be associated with the common reduction in DMI leading up to calving.
Similarly, the daily rumination time of PP and MP cows began to increase from wk +1 to +2,
again potentially reflective of changes in DMI. Dry matter intake typically decreases as the cow
approaches calving and begins to increase rapidly after calving (Grant and Albright, 1995).
While an association of rumination time and DMI is not consistently reported in the literature,
there are examples of these being positively associated. Cows have been found to spend more
Page 36
27
time ruminating about 4 h after periods of high feed intake (Schirmann et al., 2012), however,
there was no correlation between periods of DMI and rumination time in that study, possibly due
to large variations of these variables both between and within cows. Clement et al. (2014)
recently found that rumination time was a significant but small contributor in a DMI prediction
model. These researchers suggested that the variability of rumination time within weeks and
cows makes it difficult to predict DMI from rumination time.
Rumination time is more consistently associated with dietary NDF intake (Welch and
Smith, 1970; Beauchemin et al., 1994) and particle size (Kononoff et al., 2003; Beauchemin and
Yang, 2005). Rumination time increases as particle size increases (Beauchemin et al., 1994),
unfortunately, we were unable to measure particle size in this study, which may have provided
greater insight into differences in rumination times observed. Even though the close-up dry cow
diets were greater in NDF than the fresh cow diets in the study herds, the expected changes in
DMI across this time period would result in much greater intake of total NDF in the post-partum
period. Thus, it is possible that the changes in rumination time were reflective of the changes in
DMI across this time period. More research on the association of DMI and rumination of during
the transition period is needed, particularly accounting for changes in physical and chemical
composition of diets from pre- to post-calving.
In this study, PP cows ruminated 61 min/d less than MP cows during the post-calving
period. Maekawa et al. (2002) found PP cows ruminated 52 min/d less than MP cows; this
difference was attributed to the greater DMI of MP cows, which also had greater BW and higher
milk yields than PP cows. Beauchemin and Rode (1994) also observed lactating MP cows to
have a longer daily rumination time; PP and MP cows regurgitated a similar number of boluses,
however, MP spent more time chewing each bolus. Soriani et al. (2012) suggested that PP cows
Page 37
28
suffer more from the stress of environmental changes at the initiation of lactation, and thus show
a slower increase in rumination time after calving compared to MP cows. Other researchers have
measured rumination time over the transition period and found no difference between PP and MP
cows (Soriani et al., 2013; Calamari et al., 2014), but no discussion of this lack of difference was
presented in those studies.
Daily rumination time for H, MP cows during the dry period (408 min/d) is within the
range of 400 to 450 min/d, reported by Adin et al. (2009) for close-up cows fed the same diet.
Soriani et al. (2012) found that daily rumination time averaged 522 min/d during d -10 to -2 pre-
calving, which was higher than what was observed in this study for H cows during the same time
period. This difference in rumination time is probably due to the greater amount of NDF in their
dry cow diet, which was 56% of DM (Soriani et al., 2012), compared to an average of 37% of
DM in this study.
The NDF content in the fresh cow diets ranged from 28 to 32% of DM across the 4
commercial dairy farms in this study. Work by Dado and Allen (1995) showed that rumination
time in early lactation dairy cows increased from 380 to 500 min/d when NDF content of the
ration was increased from 25 to 35%. Daily rumination time averaged 418 min/d and 481 min/d
for healthy PP and MP cows respectively, which is comparable to that reported Dado and Allen
(1995). These averages are also within the range of 340 to 540 min/d for lactating cows found in
the literature (Kononoff and Heinrichs, 2003; Beauchemin and Yang, 2005; Yang and
Beauchemin, 2006).
The cumulative incidence of SCK across 25 Ontario farms ranged from 8 to 80% during
the first 9 wk postpartum, with a mean of 43% of cows that experienced SCK (Duffield, 2000).
McArt et al. (2012) also found a 43% cumulative incidence of ketosis with thrice weekly testing
Page 38
29
between 3 and 16 DIM, with the peak incidence of ketosis occurring at 5 DIM. These estimates
are in line with the 44% cumulative incidence of SCK within the first 4 wk postpartum observed
in the present study. It is apparent that SCK is common in commercial dairy herds, but the causes
of SCK are not always apparent as there are numerous factors, including parity, breed, BCS,
milk yield, dry cow nutrition and management factors, which have been associated with risk of
both SCK and clinical ketosis (Andersson, 1988; Duffield, 2000). Increasing parity is a known
risk factor for SCK (Suthar et al., 2013; Berge and Vertenten, 2014; Vanholder et al., 2015),
which was also found in the present study; the odds of SCK in K+ cows were 8 times higher in
3+ lactation cows compared to H cows in their 2nd
lactation. Cows with higher milk production
have higher nutrient demands, putting them at a higher risk of developing SCK (Bauman and
Currie, 1980; Gröhn et al., 1989; Fleischer et al., 2001), which is why cows in the present study
with greater 305 d milk yield in the previous lactation were at increased odds for having SCK
with no other health issues. Vanholder et al. (2015) found cows in both the moderate (3.5 ≤ BCS
≤ 3.75) and fat BCS categories (BCS ≥ 4) had an increased risk of SCK compared to cows in the
thin category (BCS ≤ 3). Cows with greater BCS pre-calving have a greater decrease in DMI
prior to calving (Hayirli et al., 2002), which is a major contributing factor for developing SCK
postpartum (Goldhawk et al., 2009). Cows in a state of NEB will deplete fat stores to
compensate for the high energy demands of lactation (Goldhawk et al., 2009). Therefore, it is not
surprising that in our study, a greater loss of BCS over the transition period was associated with
increased risk of SCK in cows with no other health problems.
In the present study, each extra 5 d dry above the mean (59 d), increased the odds of
developing SCK combined with another postpartum health disorder 1.3 fold. Vanholder et al.
(2015) similarly observed this positive association between the length of the dry period and
Page 39
30
SCK. It is possible that cows with a longer dry period become over conditioned. Cows
consuming the close-up ration longer than the recommended 3 wk have been shown to have
increased BCS and risk of metritis post-partum (Mashek and Beede, 2001). It could also be
hypothesized that these cows with long dry periods became pregnant later in lactation and were
already over conditioned prior to dry off.
Increasing stall stocking density by 5% during the wk prior to calving was found to
increase the risk of ketosis by 10% in both K and K+ cows. Overcrowding can limit the ability of
cows to access their desired resources, whether that be lying areas, feed, or water, at the times
they would prefer. This has the potential to decrease lying time (Munksgaard et al., 2005) and
may also impel cows to lay down sooner post-milking (Fregonesi et al., 2007), rather than
consume feed at the feed bunk, potentially limiting DMI. Proudfoot et al. (2009b) demonstrated
that when subjected to a competitive feeding environment, MP cows showed a decrease in DMI
1 wk before calving. It should be noted that both stall stocking density and feed bunk stocking
density were highly variable among study farms. However, in general, more space was provided
on these farms than typically seen on commercial dairy farms for transition cows
(vonKeyserlingk et al., 2012). In any case, these results suggest that dry cow management should
aim to reduce competition for resources by reducing stocking density in close-up dry cow pens.
There is much evidence in the literature supporting the notion that severe NEB in the
transition period increases the risk for postpartum diseases such as RP, MF, metritis, mastitis,
DA and SCK (Dohoo et al., 1983; Duffield et al., 2009; LeBlanc, 2010). LeBlanc (2010)
estimated that 30 to 50% of cows experience some form of health problem around the time of
calving. Similar to that, in the current study, 35% of cows diagnosed with SCK had at least one
other recorded health problem during the first 4 wk postpartum.
Page 40
31
Lower rumination times were observed in K+ cows during wk -1, +1, and +2 compared
to H cows. Soriani et al. (2012) categorized cows into 3 groups based on rumination time before
calving: longer rumination time, middle rumination time and shorter rumination time. Cows in
the shorter group showed a higher incidence of clinical disease (including mastitis, lameness,
ketosis and DA) and these cows had a decreased rumination time after calving, similar to what
was seen in K+ cows in the current study. This also agrees with the observations made by
Calamari et al. (2014) who found that 90% of cows in the low rumination group post-calving had
a clinical health problem, compared to 45% cows categorized in the high rumination group.
The odds of developing SCK and another clinical disease were 1.2 times greater for every
20 min/d decrease in rumination time during the week after calving. Although there was also a
difference in rumination during the wk prior to calving, the depression in rumination time was
much greater in the wk after calving, possibly due to the combined effect of multiple transition
disorders occurring post-calving, some of which may have preceded the diagnosis of SCK. In
this study, SCK was only diagnosed once weekly, which was a limitation of the study. If cows
were ketotic on the day of diagnosis it in unknown if that was the first day of SCK or if the cow
had been ketotic for multiple days. This limited our ability to fully understand how rumination
changes directly before and after the onset of SCK. Future studies monitoring this association
should monitor SCK more frequently to understand the detailed changes in rumination around
the onset of illness.
When comparing K to H cows, it was found that for every 20 min/d decrease in
rumination time during the week prior to calving, the odds of becoming K post-calving increased
1.1-fold. Low DMI and reduced feeding time have been considered important risk factors for
subclinical ketosis. Studies by Gonzalez et al. (2008) and Goldhawk et al. (2009) observed a 10
Page 41
32
kg/d reduction in fresh feed intake and 3 kg reduction in daily DMI, respectively, during the
week before being diagnosed ketotic. Shorter rumination times in the current study may be
indicative of low DMI in the prepartum period (Clement et al., 2014); however, there are many
cow-level and management related factors that vary between farms and have a great impact of
rumination time.
2.5 CONCLUSIONS
Multiparous cows ruminate longer over the course of a day compared to PP cows during
the transition period. Primiparous cows showed no difference in rumination time between health
statuses, however K and K+ cows were found to ruminate less than H multiparous cows. Higher
rumination times during the week prior to calving and the week after calving were associated
with decreased odds of K and K+, respectively, in MP cows. Other factors that were found to
decrease the odds of SCK in MP cows included lower stall stocking density (less than 80%)
during the week before calving, lower parity, shorter dry period, lower milk yield during the
previous lactation, and smaller loss of BCS over the transition period. Rumination monitoring
across the transition period may contribute to the identification of MP cows either at risk for
developing SCK or those that have SCK in combination with another health problem. To identify
MP cows at risk for developing ketosis post-calving, it is important for farms to begin
monitoring rumination during the dry period to establish a baseline for each cow.
2.6 ACKNOWLEDGEMENTS
We would like to thank all participating farms for allowing us to collect data on their
herds. We are grateful to Robin Crossley, Lisa Gordon, Morgan Overvest, Caylie Corvinelli, and
Page 42
33
Hannah Gillespie of the University of Guelph, Kemptville Campus (Kemptville, ON, Canada)
for all their technical help during data collection. Financial support for this research was received
from the Natural Sciences and Engineering Research Council (Ottawa, ON, Canada), as well as
from the Ontario Ministry of Agriculture Food University of Guelph Research Partnership
(Guelph, ON, Canada). We thank Dr. Karen Beauchemin of Agriculture and Agri-Food Canada
(Lethbridge, AB, Canada) for providing rumination monitoring equipment, as well as Eastgen
(Guelph, ON, Canada), particularly Mark Carson, for contributions towards the rumination
monitoring equipment and technical support.
Page 43
34
Table 2.1 Descriptive summary of farm-level variables for lactating cows in an observational study of the
associations of rumination time from 2 wk before to 4 wk after calving and subclinical ketosis.
Variable Herd 1 Herd 2 Herd 3 Herd 4
Number of milking cows 400 145 250 125
Fresh Cows
Fresh period (DIM) 1 to 11-14 1 to14-21 1 to 28 1 to 21-28
Stall base Mats and waterbeds Bedded pack Rubber mats Deep bedding
Bedding type1
Shavings Straw Compost Sand
Stocking density (%)2
62 134 73 99
Stall length (cm) 165 -- 178 178
Stall width (cm) 118 -- 116 132
Feed bunk design Post/rail Headgates Post/rail Headgates
Feed bunk space (cm/cow)3
84 45 99 44
Use of ionophore in TMR no no yes No
Lactating Cows2
Lactating period (DIM) 11-14 to 28 14-21 to 28 --4
21 to 28
Stall base Mats and waterbeds Deep bedding -- Deep bedding
Bedding type1
Shavings Sand -- Sand
Stocking density (%)2
97 94 --
100
Stall length (cm) 161 160 -- 174
Stall width (cm) 121 127 -- 117
Feed bunk design Post/rail Headgates -- Headgates
Feed bunk space (cm/cow)3
43 25 --
39
Use of ionophore in TMR no no no No 1Surface of stall base in freestall pens
2Stocking density (ST) for freestall pens was calculated as ST = [no. of stalls] / [no. of cows in pen]. Bedded
packs were calculated as: ST = [(dimensions, m2) / (recommended space allowance, 11m
2 (Nordlund, 2009))] /
[no. of cows in bedded pack] 3Feed bunk space = [length of feed bunk (cm)] / [no. of cows in the pen]
4Sample cows did not occupy this pen during the sample period, they remained in the fresh pen up to 4 wk post-
calving
Page 44
35
Table 2.2 Descriptive summary of farm-level variables for far-off and close-up dry cows in an
observational study of the associations of rumination time from 2 weeks before to 4 weeks after
calving and subclinical ketosis.
Variable Herd 1 Herd 2 Herd 3 Herd 4
Far- off Dry Cows
Far-off period (d before expected calving date) 60 to 21-7 60 to 14 60 to 21 60 to 21-14
Stall base1
Rubber mats Deep bedding Rubber mats Deep bedding
Bedding type Shavings Sand Compost Sand
Stocking density (%)2
109 58 106 91
Stall length (cm) 164 156 177 178
Stall width (cm) 119 130 119 125
Feed bunk design Post/rail Headgates Post/rail Headgates
Feed bunk space (cm/cow)3
47 42 83 54
Fresh feed delivery (no./d) 1 1 1 1
Feed push-up frequency (no./d) 6 6 5 5
Use of ionophore in TMR no no yes no
Close-up Dry Cows
Close-up period (d before expected calving date) 21-7 to calving 14 to calving 21 to calving 21-14 to calving
Stall base1
Bedded pack Bedded pack Rubber mats Bedded pack
Bedding type Straw Straw Compost Straw
Stocking density (%)2
138 58 75 115
Stall length (cm) -- -- 177 --
Stall width (cm) -- -- 119 --
Feed bunk design Headgates Headgates Post/rail Headgates
Feed bunk space (cm/cow)3
29 96 171 130
Fresh feed delivery (no./d) 1 1 1 1
Feed push-up frequency (no./d) 0 6 5 5
Use of ionophore in TMR no no yes no
Use of choline in TMR no yes no yes
Use of rumensin bolus pre-calving no yes yes yes 1Surface of stall base in freestall pens
Page 45
36
2Stocking density (ST) for freestall pens was calculated as ST = [no. of stalls] / [no. of cows in pen].
Bedded packs were calculated as: ST = [(dimensions, m2) / (recommended space allowance, 11m
2
(Nordlund, 2009))] / [no. of cows in bedded pack] 3Feed bunk space = [length of feed bunk (cm)] / [no. of cows in the pen]
Page 46
37
Table 2.3 Feed analysis summary for close-up dry cow and fresh
cow feed rations at each participating dairy farm3 in an
observational study of the associations of rumination time and
subclinical ketosis over the transition period.
Ration Component Herd 1 Herd 2 Herd 3 Herd 4
Close-up Dry Cow Ration
DM (%) 46.6 46.6 43.1 45.7
NDF (% of DM) 38.4 37.5 33.3 41.1
ADF (% of DM) 26.2 23.9 23.0 25.9
NFC (% of DM) 30.0 32.1 34.5 31.8
CP (% of DM) 15.4 14.6 15.8 12.5
ME (Mcal/kg)1 2.4 2.4 2.5 2.4
NEL(Mcal/kg)2 1.5 1.4 1.5 1.4
Fresh Cow Ration
DM (%) 47.8 45.9 48.6 44.7
NDF (% of DM) 32.2 27.8 27.6 29.2
ADF (% of DM) 21.8 19.2 18.6 19.7
NFC (% of DM) 36.7 38.1 39.4 40.3
CP (% of DM) 15.0 17.9 16.6 14.7
ME (Mcal/kg)1 2.6 2.7 2.7 2.7
NEL (Mcal/kg)2 1.6 1.6 1.6 1.6
1Metabolizable energy (ME)
2Net energy for lactation (NEL)
3All numbers presented in the table were determined using NRC
(2001) guidelines
Page 47
38
Table 2.4 Descriptive summary (± SD) of focal cows sampled in each herd during an observational study of the associations
of rumination time and subclinical ketosis over the transition period.
Herd
Number
of cows
Mean
Parity
Mean 305-d milk
production (kg)
Mean length of
dry period (d)
Mean pre-
calving BCS1
Mean post-
calving BCS2
Change in
BCS3
% Lame
pre-
calving4
% Lame
post-
calving5
1 79 2.5 ± 1.35 10,710 ± 1,458.1 59 ± 27.7 3.6 ± 0.46 2.9 ± 0.49 -0.6 ± 0.33 7 14
2 98 2.2 ± 1.45 11,205 ± 2,229.5 61 ± 4.9 3.4 ± 0.39 2.9 ± 0.40 -0.5 ± 0.36 2 4
3 91 2.2 ± 1.11 11,294 ± 1,610.5 60 ± 18.7 3.6 ± 0.46 3.0 ± 0.41 -0.6 ± 0.39 6 9
4 71 2.1 ± 1.01 11,016 ± 1,704.5 58 ± 16.2 3.4 ± 0.36 2.9 ± 0.41 -0.5 ± 0.34 1 4
All 339 2.3 ± 1.26 11,066 ± 1,781.1 59 ± 18.7 3.5 ± 0.43 3.0 ± 0.43 -0.5 ± 0.37 4 8 1Pre-calving BCS was recorded at the time of enrollment in the study, 2 to 3 wk prior to the expected calving date
2Post-calving BCS was recorded at the time of removal from the study, 4 wk after the calving date
3 Change in BCS = BCS at enrollment - BCS at time of removal of study
4 Pre-calving lameness score was recorded at the time of enrollment in the study, 2 to 3 wk prior to the expected calving date;
% Lame pre-calving = [(no. of cows with a lameness score ≥ 3 pre-calving)/(total number of cows scored pre-calving)]*100 5Post-calving lameness score was recorded at the end of the study, 4 wk after the calving date; % Lame post-calving = [(no. of
cows with a lameness score ≥ 3 post-calving)/(total number of cows scored post-calving)]*100
Page 48
39
Table 2.5 Health status summary of focal cows sampled in each herd during an observational study of the associations
of rumination time and subclinical ketosis over the transition period.
Herd
Mean ± SD d
diagnosed
ketotic (DIM)
%
Ketotic1
%
treated
for RP2
% treated
for
metritis
%
treated
for DA3
%
treated
for MF4
% treated
for foot
problems
% treated
for
mastitis % K5
% K+6
% H+6
1 6 ± 6.3 56 9 11 0 4 0 5 39 17 6
2 6 ± 7.1 27 11 32 1 2 0 5 12 14 24
3 5 ± 6.4 51 9 13 3 0 4 4 35 15 10
4 11 ± 7.6 48 3 27 0 3 3 0 31 17 10
All 7 ± 7.1 44 8 21 1 2 2 4 29 16 1Cumulative incidence over 4 tests, once weekly in the first 4 weeks postpartum
2Percentage of cows with retained placenta (RP)
3Percentage of cows treated for displaced abomasum (DA)
4Percentage of cows treated for milk fever (MF)
5Percentage of cows with ketosis and no other health issue (K)
6Percentage of cows with ketosis and at least one other health issue (K+)
7Percentage of cows that were not subclinically ketotic but had at least one other health issue (H+)
Page 49
40
Table 2.6 Least squares means (± SE) for daily rumination time (min/d) for healthy cows without subclinical ketosis or other
recorded illnesses (H), subclinically ketotic cows with no other health problems (K), and subclinically ketotic cows with other
health problems (K+) during each week of the study period.1
Period (relative to calving)
Health Status n wk -2 wk -1 wk +1 wk +2 wk +3 wk +4
Primiparous
H 52 407.1 ± 13.73 376.1 ± 11.81 375.0 ± 10.61 438.6 ± 12.50 439.0 ± 14.24 421.3 ± 17.00
K 21 421.0 ± 25.15 373.5 ± 21.34 392.8 ± 16.70 464.9 ± 19.66 460.0 ± 22.31 434.4 ± 26.71
K+ 14 380.0 ± 25.79 342.3 ± 22.38 365.9 ± 20.45 450.9 ± 24.08 427.8 ± 27.33 395.1 ± 32.87
Multiparous
H 87 420.0 ± 12.07 401.6 ± 11.99 429.6 ± 11.54 509.1 ± 13.02 503.8 ± 14.11 488.7 ± 14.83
K 76 406.4 ± 12.65 374.4 ± 12.90† 407.9 ± 12.08† 483.5 ± 13.71 477.3 ± 15.05 453.2 ± 15.84†
K+ 39 405.4 ± 16.62 353.5 ± 16.04** 356.4 ± 15.19*** 444.2 ± 17.67** 463.2 ± 19.98† 468.1 ± 21.71 1Significance level for difference between K and H cows and K+ and H cows within weeks: †P ≤ 0.10; *P ≤ 0.05; **P ≤ 0.01;
***P ≤ 0.001.
Page 50
41
Table 2.7 Unconditional estimates for factors associated with the incidence of
subclinical ketosis with no recorded clinical disease (K; n = 76) relative to healthy
animals (H; n = 87), in multiparous cows.
Variable
Percentage or
Mean (±SD)1
Odds ratio (95% CI)2 P-value
Parity -- -- 0.002
2 51% Ref7 --
3+ 49% 2.9 (1.49 to 5.65) --
305 d milk yield (kg) 11,060 (1,785.0) 1.2 (0.88 to 1.73) 0.21
Length of dry period (d) 59 (19.0) 1.7 (1.00 to 2.86) 0.049
BCS pre-calving 3.4 (0.44) 1.3 (0.96 to 1.88) 0.083
BCS category pre-calving3 -- -- 0.17
Normal 70% 0.9 (0.20 to 4.32) --
Underweight 5% Ref --
Overweight 25% 2.1 (0.95 to 4.54) --
Change in BCS4 0.5 (0.37) 1.6 (1.13 to 2.29) 0.0081
Stocking density (%)5
w -2 84 (23.6) 1.6 (1.15 to 2.29) 0.0063
w -1 79 (24.5) 1.6 (1.15 to 2.16) 0.0053
w +1 81 (14.8) 0.6 (0.36 to 0.87) 0.011
Rumination time (min/d)
w -1 382 (85.6) 0.7 (0.46,0.97) 0.036 1
Proportion of animals for categorical variables or mean and standard deviation for
continuous variables. 2Odds ratio and 95% CI for 1 SD increase in the variable presented
3 Cows were placed into 1 of 3 categories based on their body condition score pre-
calving: normal (BCS 3 - 3.5), underweight (BCS 1 - 2.5), overweight (BCS 4 - 5) 4
Change in BCS = BCS at enrollment - BCS at time of removal of study 5
Stocking density (ST) for freestall pens was calculated as ST = [no. of stalls] / [no. of
cows in pen]. Bedded packs were calculated as: ST = [(dimensions, m2) /
(recommended space allowance, 11m2 (Nordlund, 2009))] / [no. of cows in bedded
pack] 6
Feed bunk space = length of feed bunk (cm) / no. of cows in the pen 7
Ref = reference category
Page 51
42
Table 2.8 Final logistic regression model for factors associated with the incidence of
subclinical ketosis with no other health issues (K; n = 76) relative to healthy animals (H;
n = 87), in multiparous cows.
Variable Coefficient SE Odds ratio (95% CI)1
P-value
Intercept -3.27 2.042 -- 0.21
305 d milk yield (kg) 0.00024 0.000133 1.5 (0.96 to 2.47) 0.073
Change in BCS2 1.68 0.622 1.9 (1.18 to 2.94) 0.0083
Stocking density (%)3
w -1 0.02 0.009 1.7 (1.10 to 2.58) 0.018
Rumination time (min/d)
w -1 -0.01 0.003 0.6 (0.38 to 0.97) 0.037 1Adjusted odds- ratio and 95% CI for 1 SD increase in each variable in the model. The
mean ± SD for each variable are as follows: 11,060 ± 1,785.0 kg, 305 d milk yield; 0.5
± 0.37, change in BCS; 80 ± 24.8 %, stocking density (wk -1); 382 ± 85.6 min/d,
rumination time (wk -1). 2 Change in BCS = BCS at enrollment - BCS at time of removal of study.
3 Stocking density (ST) for freestall pens was calculated as ST = [no. of stalls] / [no. of
cows in pen]. Bedded packs were calculated as: ST = [(dimensions, m2) /
(recommended space allowance, 11m2 (Nordlund, 2009))] / [no. of cows in bedded
pack].
Page 52
43
Table 2.9 Unconditional estimates for factors associated with the incidence of
subclinical ketosis with other health problems (K+; n = 39) relative to healthy animals
(H; n = 87), in multiparous cows.
Variable
Percentage or
Mean (±SD)1
Odds ratio (95% CI)2 P-value
Parity -- -- <0.001
2 51% Ref6 --
3+ 49% 5.5 (2.35 to 12.92) --
305 d milk yield (kg) 11,061 (1,785.0) 1.5 (1.02 to 2.18) 0.039
Length of dry period (d) 59 (19.0) 1.9 (1.05 to 3.27) 0.034
BCS pre-calving 3.4 (0.44) 1.3 (0.90 to 1.94) 0.15
BCS category pre-calving3 -- -- 0.14
Normal 70% Ref --
Underweight 5% 1.1 (0.20 to 6.25) --
Overweight 25% 2.4 (1.00 to 5.87) --
Change in BCS4 0.5 (0.37) 1.5 (0.97 to 2.24) 0.068
Stocking density (%)5
w -2 84 (23.6) 1.4 (0.97 to 2.13) 0.071
w -1 79 (24.5) 1.9 (1.22 to 2.92) 0.0048
Rumination time (min/d)
w -1 382 (85.6) 0.6 (0.40 to 0.92) 0.019
w +1 407 (87.4) 0.4 (0.25 to 0.63) <0.001 1
Proportion of observations for categorical variables or mean and standard deviation for
continuous variables.
2Odds- ratio and 95% CI for 1 SD in variable presented
3 Cows were placed into 1 of 3 categories based on their body condition score pre-
calving: normal (BCS 3 - 3.5), underweight (BCS 1 - 2.5), overweight (BCS 4 - 5) 4Change in BCS = BCS at enrollment - BCS at time of removal of study
5 Stocking density (ST) for freestall pens was calculated as ST = [no. of stalls] / [no. of
cows in pen]. Bedded packs were calculated as: ST = [(dimensions, m2) /
(recommended space allowance, 11m2 (Nordlund, 2009))] / [no. of cows in bedded
pack]. 6
Ref = reference category
Page 53
44
Table 2.10 Final logistic regression model for factors associated with the incidence of
subclinical ketosis with other health problems (K+; n = 39) relative to healthy animals
(H; n = 87), in multiparous cows.
Variable Coefficient SE Odds ratio (95% CI)1
P-value
Intercept -3.67 2.750 -- 0.27
Parity
<0.001
2 Ref3 -- -- --
3+ 2.09 0.580 8.1 (2.55 to 25.43) --
Length of dry period (d) 0.06 0.032 2.9 (0.87 to 9.56) 0.083
Stocking density (%)2
w -1 0.02 0.012 1.8 (1.01 to 3.27) 0.046
Rumination time (min/d)
w +1 -0.01 0.003 0.5 (0.27 to 0.80) 0.0063 1Adjusted odds- ratio and 95% CI for 1 SD increase in each variable in the model. The
mean ± SD for each variable are as follows: 59 ± 19.0 d, length of dry period; 80 ±
24.8%, stocking density (wk -1); 382 ± 85.6 min/d, rumination time (wk -1). 2
Stocking density (ST) for freestall pens was calculated as ST = [no. of stalls] / [no. of
cows in pen]. Bedded packs were calculated as: ST = [(dimensions, m2) /
(recommended space allowance, 11m2 (Nordlund, 2009))] / [no. of cows in bedded
pack]. 3
Ref = reference category.
Page 54
45
Figure 2.1 Daily rumination time (min/d) over the transition period (-14 to 28d) for
primiparous (PP, n = 107) and multiparous (MP, n = 232) cows during an observational study
of the associations of rumination time and subclinical ketosis over the transition period.
0
100
200
300
400
500
600
-14 -12 -10 -8 -6 -4 -2 1 3 5 7 9 11 13 15 17 19 21 23 25 27
Rum
inat
ion T
ime
(m
in/d
ay)
Day Relative to Calving
PP MP
Page 55
46
Figure 2.2 Daily rumination time (min/d) over the transition period (-14 to 28d) for healthy
multiparous (MP) cows with no other recorded illnesses (H; n = 87), ketotic MP cows with no
other health problems (K; n = 76) and ketotic MP cows with other health problems (K+; n =
39).
0
100
200
300
400
500
600
-14 -12 -10 -8 -6 -4 -2 1 3 5 7 9 11 13 15 17 19 21 23 25 27
Rum
inat
ion T
ime
(min
/day
)
Day Relative to Calving
H K K+
Page 56
47
CHAPTER 3: The association between lying behaviour and subclinical ketosis in transition
dairy cows
3.1 INTRODUCTION
High-producing dairy cows experience negative energy balance (NEB) during the
transition period (Ingvartsen, 2006) due to a decrease in DMI intake in the days leading up to
calving (Grant and Albright, 1995; Schirmann et al., 2013) accompanied by high energy
requirements for lactation. These cows undergo many physiological changes to cope with the
high energy demands of lactogenesis. An excessive drop in DMI around calving combined with
prolonged NEB may lead to sub-clinical ketosis (SCK) (Grummer, 1995).
Technological improvements have enhanced on-farm detection of SCK. Cows in NEB
begin to mobilize fat stores in an attempt to meet their high energy needs during early lactation,
which releases ketone bodies (i.e. BHBA) into the blood (Baumen and Currie, 1980; Goldhawk
et al., 2009; LeBlanc, 2010). An electronic cow-side test for the quantification of blood BHBA
concentration (Precision Xtra Abbott Diabetes Care, Saint Laurent, QC, Canada), has been
validated in dairy cows (Iwersen et al., 2009; Voyvoda and Erdogan, 2010).
Even with various methods for detecting ketosis available, it is still challenging to for
producers to identify SCK at an early stage. There is growing evidence that measurements of
activity and feeding behaviour may be used to pre-emptively identify cows at risk for subclinical
illness (Weary et al., 2009). In addition to feeding behaviour (Goldhawk et al., 2009), rumination
behaviour (Chapter 2), and walking activity (Edwards and Tozer, 2004), there is potential for
SCK to be identified through changes in lying behaviour. Lying behaviour may be a promising
indicator of metabolic conditions, particularly during the peripartum period. Itle et al (2015)
recently found cows with SCK post calving spent more time standing in the week before calving.
Page 57
48
It may be possible that SCK cows in this study were subordinate cows that spent more time
standing, waiting to access the feed bunk. Cows with SCK are in a state of excessive NEB, as
ketone bodies in the blood rise with low glucose availability, cow may spend more time lying
down to decrease energy expenditure. Increased lying time in sick cows agrees with the concept
that sick animals become less active in attempt to conserve energy needed to facilitate recovery
(Hart, 1988; Dantzer and Kelley, 2007).
The objective of this study was to characterize changes in lying behaviours across the
transition period and determine if daily lying time, frequency of lying bouts and bout duration
may be used to identify cows at risk for SCK. We hypothesized that early lactation dairy cows
with increased lying activity, both pre- and post-calving, would be at higher risk of experiencing
SCK in early lactation.
3.2 MATERIALS AND METHODS
This research is part of a larger study aimed at evaluating the usefulness of rumination
monitoring for the early detection of SCK. As such, detailed descriptions of the methodology are
presented in Chapter 2.
3.2.1 Animals and Disease Diagnosis
A total of 339 dairy cows (107 primiparous and 232 multiparous) on 4 commercial dairy
farms were monitored for lying behaviour and SCK from 14 d prior to calving until 28 d after
calving. A blood sample was taken from the coccygeal vein of each cow for measurement of
BHBA 1x/wk. Cows with BHBA ≥1.2mmol/L at one or more weekly sample postpartum were
considered to have SCK. Cases of retained placenta, metritis, milk fever, or mastitis during the
study period were also recorded. Cows were categorized into 1 of 4 groups: healthy (H) cows
Page 58
49
had no SCK or any other recorded clinical disease (n=139); healthy plus (H+) cows were not
diagnosed with SCK but were treated for at least one other health problem (n=50); SCK (K)
cows with no other health problems during transition (n=97); or ketotic plus (K+) cows that had
SCK and one or more other clinical diseases (n=53). Animal use, data collection, and study
design were approved by the University of Guelph's Animal Care Committee and Research
Ethics Board, respectively.
3.2.2 Lying Behaviour
All enrolled cows were affixed weekly with a data logger (Onset HOBO Pendant G data
loggers; Onset Computer Corporation, Bourne, MA) to record standing and lying behaviour for 7
d, as validated by Ledgerwood et al. (2010). Individual data loggers were placed on the medial
side of a hind leg, and secured with bandaging wrap (Vetrap Bandaging Tape, 3M, London,
Ontario, Canada). To ensure accurate and consistent collection of data, each data logger was
positioned identically on each cow as described by Ledgerwood et al. (2010). During each
weekly farm visit, another data logger was attached to the cow's opposite hind leg and the data
logger that had been recording data for the past week was removed. Data were downloaded
weekly to the database; recordings were used to calculate daily measurements of lying time
(min/d), frequency of lying bouts (no. of bouts/d), and average lying bout length (min; UBC
AWP, 2013).
3.2.3 Statistical Analysis
Cows that had aborted (n=2), were culled (n=2), or diagnosed ketotic (n=3) before
calving were not included in the statistical analysis. Cows that were sold (n=22) or died (n=1)
during the post-calving period, with behavioural and health measurements recorded until the day
they left the herd, were included in the analysis. Descriptive statistics were performed on a total
Page 59
50
of 339 cows, (107 primiparous and 232 multiparous) categorized as H (n=139), H+ (n=50), K
(n=97) and K+ (n=53). The linear and logistic models compared the measures of lying behaviour
between K cows and H cows and K+ cows and H cows; H+ cows were not included in this
analysis (n=50).
Statistical analyses were performed with SAS (version 9.4; SAS Institute, 2013) using
cow (n = 289) as the experimental unit. Daily lying times (min/d), average frequency of lying
bouts per day (bouts/d) and average lying bout lengths (min) were each summarized by cow and
week such that these data aligned with the once weekly testing of SCK. These data were
analyzed in a general linear mixed model (PROC MIXED in SAS), treating week as a repeated
measure. Separate models were used to analyze lying time, bout frequency, and bout length.
Each model included the random effect of farm and cow within farm (subject of repeated
statement) and the fixed effects of health status, parity, and week, the interactions of health status
by parity and health status by week, as well as the three-way interaction of health status, parity,
and week. The covariance structure was heterogeneous compound symmetry, selected by best fit
according to Schwarz’s Bayesian information criterion. A three-way interaction was found
between health status, parity, and week (P < 0.001) when analyzing daily lying time and average
number of lying bouts; thus, first lactation and multiparous (MP) cows were analyzed separately.
These separate models included the fixed effects of health status, week and the interaction
between health status by week, with farm included as a random effect. Differences in lying
behaviour between health categories and weeks were compared using the least-squares means
procedure with the PDIFF function. Significance was declared at P < 0.05, and tendencies were
reported if 0.05 < P < 0.10.
Page 60
51
In the analysis of the impact on health status on lying behaviours, as described above,
differences were only found between health categories for MP cows. Thus, multivariable logistic
regression was only performed on data from MP cows and not on PP cows. The analysis was
performed using the GLIMMIX procedure (distribution = binomial and link = logit) in SAS
(version 9.4; SAS Institute, 2013) to model to effects of lying behaviour and other cow-level
factors on the presence or absence of SCK. This was done using two different models: one model
compared K to H cows while the other compared K+ to H cows. Parity and pre-calving BCS
were both treated as categorical variables. Multiparous cows were characterized as second
lactation (2; n= 99) or third lactation and greater (3+; n= 103). Body condition pre-calving was
categorized into three groups: underweight, BCS < 3; normal, BCS = 3 to 3.5; overweight, BCS
> 3.5. Parity, pre-calving BCS category, change in BCS over the transition period, length of dry
period, milk yield from the previous lactation, as well as lying time, number of lying bouts per
day, average bout length, and stall stocking density during the weeks prior to the mean day of
diagnosis (wk -2, -1, and +1), were all assessed for an association with presence or absence of K
and K+ using univariable logistic regression models. Variables with P ≤ 0.25 were then used to
construct a multivariable logistic regression model. The CORR procedure in SAS was used to
check for correlations between the explanatory variables included in the multivariable model. If
2 variables were highly correlated (r > 0.8), the variable with the lowest P-value and most
biological relevance was retained for the multivariable model. Manual backward elimination of
nonsignificant and non-trending (P > 0.10) variables was used to create the final models and
from the resultant models, plausible 2-way interactions were examined and retained if P ≤ 0.10.
Only those variables retained in the final multivariable models are presented.
Page 61
52
3.3 RESULTS AND DISCUSSION
From 2 wk prior to calving until 4 wk after calving, H, K and K+ cows in their first
lactation showed no difference (P = 0.4) in daily lying time, however there was an effect of week
(P < 0.001; Table 1). The lying time of PP cows decreased each week from wk -2 to +1. PP
cows also had lower daily lying times compared to MP cows (Figure 1a). PP cows were lying on
average 385.5 ± 11.17 min/d (mean ± SD) during the pre-calving period and 424.0 ± 15.52 min/d
during the post-calving periods (Table 3.1) compared to 394.5 ± 6.32 min/d and 456.4 ± 12.67
min/d for MP cows, respectively (Table 3.2). Steensels et al. (2012) reported that that MP cows,
milked 3x/d, lay down between 491 and 578 min/d in the first 28 d after calving. The difference
between parities observed in the present study agrees with that reported by Sepúlveda-Varas et
al. (2014), who found that PP cows spent less time lying down than MP cows on pasture during
the transition period. Steensels et al. (2012) hypothesized that higher lying times in later parities
may be due to increased BW with age.
Lying time also decreased for all MP cows moving from wk -1 to +1 (P < 0.001; Table
3.2; Figure 3.1a). Calderon and Cook (2011) saw lying time decrease for both PP and MP cows
from d -16 until calving, and post-calving lying time re-stabilize at roughly 590 - 650 min/d.
Another study monitoring change in standing behaviour from -10 d to +10 d observed lying time
to be 702 min/d pre-calving and 636 min/d post-calving, similar to the trend in the current study
(Huzzey et al., 2005). We hypothesize that cows spend more time standing post-calving because
they are dedicating more of their time to milking, as well as feeding, to support milk production
(Huzzey et al., 2005; Gomez and Cook, 2010).
The PP cow model for frequency of lying bouts showed no effects of health status (P =
0.3), week (P = 0.7), or interaction between these variables (P = 0.9; Table 3.1). Table 3.2
Page 62
53
shows the frequency of lying bouts for MP cows; health status did not show an effect (P = 0.3),
but week did have an effect on frequency of lying bouts (P < 0.001). MP cows had fewer lying
bouts in wk -2 compared to wk -1, but frequency of lying bouts increased each wk moving from
wk +1 to +3 (P < 0.01). The difference between parities in the number of lying bouts over the
transition period (Figure 3.1b; PP: 10.4 ± 0.53 bouts/d vs. MP: 9.6 ± 0.46 bouts/d) is similar to
that reported by a study on cows that had access to pasture (PP: 9.7 ± 0.54 vs. MP: 8.4 ± 0.26
bouts/d; Sepúlveda-Varas et al., 2014). Other studies in the literature performed in freestall
facilities reported similar frequencies of lying bouts for transition cows: approx. 10.5 bouts/d
(Calderon and Cook, 2011); 11.1 ± 0.4 (Steensels et al., 2012).
Lying bout length differed between parities (P < 0.001) and changed by week (P <
0.001), but was not impacted by health status (P=0.28; Tables 3.1 and 3.2). All cows showed a
decrease in average lying bout length each week from wk -2 to +1, but moving into wk +2, bout
length increased. Over the transition period, PP cows had shorter lying bout durations compared
to MP cows (Figure 3.1c). Sepúlveda-Varas et al. (2014) also found PP cows to have shorter
lying bouts, however, bout duration for PP and MP cows did not change over the transition
period in their study.
Figure 3.2 shows the difference in daily lying time between H, K and K+ multiparous
cows over the transition period. An interaction of health status and week was detected (P <
0.001) when comparing the daily lying time of MP cows, as seen in Table 3.2. Differences in
lying time were seen for MP cows in wk +3 and +4, where K cows spent more time lying down
than H cows. K cows tended to lie down longer throughout the day during wk -1 and +1. As the
major difference in lying time was seen during wk 3 and 4 and the average day of SCK diagnosis
was 7 DIM, we hypothesize that because these cows were sick, they spent more time lying down
Page 63
54
(Hart, 1988; Dantzer and Kelley, 2007). Interestingly, another study found that cows that were
clinically ketotic postpartum stood longer per day during the week before calving (Itle et al.,
2015), which was quite different from the tendency of K cows to lying down longer in the
current study. Those researchers suggested that the cows that later developed ketosis may have
been more subordinate and, therefore, spent more time standing waiting to feed rather than
competing for a spot at the feed bunk.
Differences in lying time were seen also for MP cows in wk +1 when K+ cows spent
more time lying down than H cows, and during wk +2 when K+ cows tended to spend more time
lying down than H cows (Table 3.2; Figure 3.2). Sepúlveda-Varas et al. (2014) looked at the
post-calving differences in lying time between cows with no health issues or lameness and
compared them to cows with one, and cows with greater than one, clinical postpartum disease
(excluding lameness). Cows with multiple illnesses showed greater changes in lying time than
those with only one illness, which is also observed in the current study. However, it was PP cows
with more than one illness that had greater lying times during the first few days post-calving and
no difference in lying time was seen between these groups in MP cows (Sepúlveda-Varas et al.,
2014).
Table 3.3 shows the unconditional associations of the independent variables for H versus
K multiparous cows. The final multivariable model, summarized in Table 3.4, found higher
lactation (3+), longer dry period, greater loss in BCS over the transition period, and greater stall
stocking density in wk -1 to be associated with increased odds of SCK, as was found in Chapter
2. Neither daily lying time nor lying bout length were retained in the final model comparing H
and K cows. As there was only a tendency for K cows to lie down longer during the wk after
Page 64
55
calving (Table 2), this difference in lying time was not large enough to be associated with
increased odds of SCK.
Unconditional associations of the independent variables for H versus K+ multiparous
cows are shown in Table 3.5. Table 3.6 describes the 4 variables retained in the multivariable
model for H versus K+ status. Cows with a higher parity, longer dry period, greater stall stocking
density in wk -1 and longer daily lying time during wk +1 were associated with having increased
odds of SCK with at least one other clinical disease.
Researchers have observed various associations between lying behaviour and postpartum
illnesses. Proudfoot et al. (2009a) found cows with dystocia to have a greater number of lying
bouts compared to cows without calving difficulty in the 48 h before calving which persisted
until 48 h post-calving. A study that looked at standing behaviour of hypocalcaemic cows found
these cows lay down less during the 24 h before calving, but they lay down longer in the wk after
calving (Jawor et al., 2012). Itle et al. (2015) found clinically ketotic cows stood longer
throughout the week before calving than healthy cows, but saw no difference in standing time
post-calving. The current study found a 30 min increase in lying time per day during the wk after
calving was associated with 1.2 times higher odds of being K+. The mean day of diagnosis for
SCK in the current study was 7 DIM. Cows with SCK are in a state of NEB and may very well
lie down for longer periods of time to conserve energy (Hart, 1988) needed for milk production.
It may also be that cows that spend more time lying down are spending less time at the feed bunk
and, therefore, consuming less feed. Goldhawk et al. (2009) found cows with SCK spent less
time at the feeder and visited the feeder fewer times during the wk before calving. We cannot
determine if SCK and other illnesses are directly causing the increase in lying behaviour or vice
Page 65
56
versa, however, future research that aims to understand the motivation behind lying behaviour in
sick cows may be beneficial in indentifying subclinical illness pre-emptively.
3.4 CONCLUSIONS
Multiparous cows had a greater daily lying time, less lying bouts and, longer lying bout
durations compared to PP cows during the transition period. Primiparous cows showed no
difference in daily lying time or frequency or duration of lying bouts between health statuses,
however K and K+ cows were found to lie down longer than H multiparous cow during the post-
calving period. Increased odds of SCK occurring with another postpartum health issue (K+) was
associated with longer daily lying time during the week after calving. Overall, these results
suggest that monitoring lying behaviour across the transition period may not be useful for the
early identification of SCK, but may contribute to the identification of MP cows that have SCK
in combination with another health issue.
3.5 ACKNOWLEDGEMENTS
We would like to thank all participating farms for allowing us to collect data on their
herds. We are grateful to Robin Crossley, Lisa Gordon, Morgan Overvest, Caylie Corvinelli, and
Hannah Gillespie of the University of Guelph, Kemptville Campus (Kemptville, ON, Canada)
for all their technical help during data collection. Financial support for this research was received
from the Natural Sciences and Engineering Research Council (Ottawa, ON, Canada), as well as,
from the OMAF and MRA University of Guelph Research Partnership (Guelph, ON, Canada).
Page 66
57
Table 3.1 Least squares means (± SE) for primiparous cow lying behaviour for healthy cows with no other illnesses (H, n
= 52), and subclinically ketotic cows with no other health issues (K, n = 21) and subclinically ketotic cows with other
health issues (K+, n = 14) during each week over the transition period (wk -2, -1, +1, +2, +3, +4).1
Period
Health Status wk -2 wk -1 wk +1 wk +2 wk +3 wk +4
Lying time (min/d)
H 407.1 ± 13.73 376.1 ± 11.81 375.0 ± 10.61 438.6 ± 12.50 439.0 ± 14.24 421.3 ± 17.00
K 421.0 ± 25.15 373.5 ± 21.34 392.8 ± 16.70 464.9 ± 19.66 460.0 ± 22.31 434.4 ± 26.71
K+ 380.0 ± 25.79 342.3 ± 22.38 365.9 ± 20.45 450.9 ± 24.08 427.8 ± 27.33 395.1 ± 32.87
Lying bouts (bouts/d)
H 9.8 ± 0.82 10.4 ± 0.84 10.6 ± 0.78 10.8 ± 0.78 10.9 ± 0.80 10.6 ± 0.77
K 10.3 ± 1.08 10.9 ± 1.04 10.8 ± 0.93 10.5 ± 0.94 10.9 ± 0.98 11.2 ± 0.92
K+ 9.5 ± 1.12 9.4 ± 1.19 10.1 ± 1.03 9.5 ± 1.04 9.3 ± 1.09 9.7 ± 1.00
Bout length (min)
H 85.2 ± 5.66 69.7 ± 5.15 57.3 ± 4.57 57.5 ± 4.62 59.6 ± 4.70 61.2 ± 4.61
K 73.9 ± 8.06 60.5 ± 6.39 53.8 ± 5.23 55.6 ± 5.35 54.9 ± 5.52 52.3 ± 5.38
K+ 84.6 ± 8.44 76.8 ± 7.33 61.3 ± 5.65 66.2 ± 5.81† 67.7 ± 6.04 62.1 ± 5.83* 1Significance level for difference between K and H cows and K+ and H cows within weeks: †P ≤ 0.10; *P ≤ 0.05; **P ≤
0.01; ***P ≤ 0.001.
Page 67
58
Table 3.2 Least squares means (± SE) for multiparous cow lying behaviour for healthy cows with no other illnesses (H, n = 87),
and subclinically ketotic cows with no other health issues (K, n = 76) and subclinically ketotic cows with other health issues (K+,
n = 39) during each week over the transition period (wk -2, -1, +1, +2, +3, +4).1
Period
Health Status wk -2 wk -1 wk +1 wk +2 wk +3 wk +4
Lying time (min/d)
H 771.7 ± 22.25 741.9 ± 23.42 571.2 ± 21.77 591.2 ± 20.88 568.3 ± 20.53 552.1 ± 21.38
K 752.6 ± 22.83 764.7 ± 24.17 606.0 ± 22.38† 622.4 ± 21.43† 612.0 ± 21.09** 593.3 ± 22.07*
K+ 742.9 ± 27.58 703.4 ± 29.38 663.1 ± 26.30*** 629.3 ± 24.76† 589.5 ± 24.35 578.5 ± 26.40
Lying bouts
(bouts/d)
H 8.9 ± 0.48 10.3 ± 0.55 10.1 ± 0.47 9.1 ± 0.44 8.5 ± 0.43 8.5 ± 0.44
K 9.4 ± 0.49 11.3 ± 0.57 10.6 ± 0.49 9.3 ± 0.46 9.3 ± 0.45 9.3 ± 0.46
K+ 8.9 ± 0.63 10.7 ± 0.74 11.2 ± 0.61 9.7 ± 0.56 8.6 ± 0.55 8.8 ± 0.57
Bout length (min)
H 97.8 ± 4.78 80.8 ± 3.96 63.4 ± 3.21 71.9 ± 3.55 73.7 ± 3.53 71.7 ± 3.57
K 94.4 ± 5.00 78.3 ± 4.13 66.5 ± 3.31 76.0 ± 3.70 75.5 ± 3.69 73.7 ± 3.73
K+ 94.8 ± 6.72 77.9 ± 5.27 69.8 ± 3.94 73.0 ± 4.58 75.8 ± 4.61 71.8 ± 4.75 1Significance level for difference between K and H cows and K+ and H cows within weeks: †P ≤ 0.10; *P ≤ 0.05; **P ≤ 0.01;
***P ≤ 0.001.
Page 68
59
Table 3.3 Unconditional estimates for factors associated with the incidence of subclinical
ketosis with no other health issues (K; n = 76) relative to healthy animals (H; n = 87), in
multiparous cows.
Variable
Percentage or
Mean (±SD)1
Odds ratio (95% CI)2 P-value
Parity
0.002
2 51% Ref6 --
3+ 49% 2.9 (1.49 to 5.65) --
Milk yield at 305 DIM (kg) 11,061 (1,785.0) 1.2 (0.88 to 1.73) 0.21
Length of dry period (d) 59 (19.0) 1.7 (1.00 to 2.86) 0.049
BCS pre-calving 3.4 (0.4) 1.3 (0.96 to 1.88) 0.083
BCS category pre-calving3
0.17
Normal 70% Ref --
Underweight 5% 0.9 (0.20 to 4.32) --
Overweight 25% 2.1 (0.95 to 4.54) --
Change in BCS4 0.5 (0.4) 1.6 (1.13 to 2.29) 0.0081
Stocking density (%)5
w -2 84 (23.6) 1.6 (1.15 to 2.29) 0.0063
w -1 79 (24.5) 1.6 (1.15 to 2.16) 0.0053
w +1 81 (14.8) 0.6 (0.36 to 0.87) 0.011
Daily lying time (min/d)
w +1 601 (131.3) 1.3 (0.95 to 1.85) 0.09
Bout length (min)
w +1 66 (19.4) 1.2 (0.88 to 1.71) 0.22 1
Proportion of observations for categorical variables or mean and standard deviation for
continuous variables. 2Odds- ratio and 95% CI for 1 SD in variable presented.
3 Cows were placed into one of 3 categories based on their body condition score pre-
calving: normal (BCS 3 - 3.5), underweight (BCS 1 - 2.5), overweight (BCS 4 - 5). 4
Change in BCS = BCS at enrollment - BCS at time of removal of study. 5
Stocking density (ST) for freestall pens was calculated as ST = [no. of stalls] / [no. of
cows in pen]. Bedded packs were calculated as: ST = [(dimensions, m2) /
(recommended space allowance, 11m2 (Nordlund, 2009))] / [no. of cows in bedded
pack]. 6
Ref = reference category.
Page 69
60
Table 3.4 Final logistic regression model for factors associated with the incidence of
subclinical ketosis with no other health issues (K; n = 76) relative to healthy animals
(H; n = 87), in multiparous cows.
Variable Coefficient SE Odds ratio (95% CI)1
P-value
Intercept -5.02 1.456 -- 0.041
Parity
0.004
2 -- -- Ref2
--
3+ 1.15 0.393 3.17 (1.46,6.90) --
Length of dry period (d) 0.03 0.017 1.80 (0.95,3.40) 0.069
Change in BCS2 1.47 0.550 1.72 (1.15,2.58) 0.0086
Stocking density (%)3
wk -1 0.02 0.009 1.75 (1.14, 2.67) 0.011
1 Adjusted odds- ratio and 95% CI for 1 SD increase in each variable in the model. The
mean ± SD for each variable are as follows: 59 ± 19 d, dry period length; 0.5 ± 0.37,
change in BCS; 80 ± 24.8 %, stocking density (wk -1). 2
Change in BCS = BCS at enrollment - BCS at time of removal of study. 3 Stocking density (ST) for freestall pens was calculated as ST = [no. of stalls] / [no. of
cows in pen]. Bedded packs were calculated as: ST = [(dimensions, m2) /
(recommended space allowance, 11m2 (Nordlund, 2009))] / [no. of cows in bedded
pack].
Page 70
61
Table 3.5 Unconditional estimates for factors associated with the incidence of subclinical ketosis
with other health problems (K+; n = 39) relative to healthy animals (H; n = 87), in multiparous
cows.
Variable
Percentage or
Mean (±SD)1
Odds ratio (95% CI)2 P-value
Parity
<0.001
2 51% Ref6 --
3+ 49% 5.5 (2.35 to 12.92) --
Milk yield at 305 DIM (kg) 11,061 (1,785.0) 1.5 (1.02 to 2.18) 0.039
Length of dry period (d) 59 (19.0) 1.9 (1.05 to 3.27) 0.034
BCS pre-calving 3.4 (0.44) 1.3 (0.90 to 1.94) 0.15
BCS category pre-calving3
0.14
Normal 70% Ref --
Underweight 5% 1.1 (0.20 to 6.25) --
Overweight 25% 2.4 (1.00 to 5.87) --
Change in BCS4 0.5 (0.37) 1.5 (0.97 to 2.24) 0.068
Stocking density (%)5
w -2 84 (23.6) 1.4 (0.97 to 2.13) 0.071
w -1 79 (24.5) 1.9 (1.22 to 2.92) 0.0048
Daily lying time (min/d)
wk -1 741 (151.4) 0.8 (0.53 to 1.11) 0.16
wk +1 601 (131.3) 2.3 (1.42 to 3.63) 0.0007
Number of lying bouts (bouts/d)
wk +1 11 (3.3) 1.4 (0.96 to 2.23) 0.077
Bout length (min)
wk +1 66 (19.4) 1.4 (0.93 to 2.01) 0.11 1
Proportion of observations for categorical variables or mean and standard deviation for
continuous variables.
2Odds- ratio and 95% CI for 1 SD in variable presented.
3 Cows were placed into one of 3 categories based on their body condition score pre-calving:
normal (BCS 3 - 3.5), underweight (BCS 1 - 2.5), overweight (BCS 4 - 5). 4Change in BCS = BCS at enrollment - BCS at time of removal of study.
5 Stocking density (ST) for freestall pens was calculated as ST = [no. of stalls] / [no. of cows in
pen]. Bedded packs were calculated as: ST = [(dimensions, m2) / (recommended space
allowance, 11m2 (Nordlund, 2009))] / [no. of cows in bedded pack].
6 Ref = reference category.
Page 71
62
Table 3.6 Final logistic regression model for factors associated with the incidence of
subclinical ketosis with other health problems (K+; n = 39) relative to healthy animals
(H; n = 87), in multiparous cows.
Variable Coefficient SE Odds ratio (95% CI)1
P-value
Intercept -9.06049 2.6301 -- 0.035
Parity
0.0037
2 -- -- Ref3 --
3+ 1.72 0.580 5.6 (1.78 to 1.80) --
Length of dry period (d) 0.049 0.0291 2.5 (0.84 to 7.59) 0.097
Stocking density (%)2
wk -1 0.026 0.0130 1.9 (1.00 to 3.60) 0.049
Daily lying time (min/d)
wk +1 0.0046 0.00235 1.8 (1.00 to 3.39) 0.051 1Adjusted odds- ratio and 95% CI for 1 SD increase in each variable in the model. The
mean ± SD for each variable are as follows: 59 ± 19.0 d, length of dry period; 80 ±
24.8%, stocking density (wk -1); 382 ± 85.6 min/d, rumination time (wk -1). 2
Stocking density (ST) for freestall pens was calculated as ST = [no. of stalls] / [no. of
cows in pen]. Bedded packs were calculated as: ST = [(dimensions, m2) /
(recommended space allowance, 11m2 (Nordlund, 2009))] / [no. of cows in bedded
pack].
3Ref = reference category.
Page 72
63
a)
b)
c)
Figure 3.1 Daily a) lying time (min/d), b) bout frequency (no. of bouts/d), and c) average bout
length (min) over the transition period (-14 to 28d) for multiparous (MP; n = 232) and
primiparous (PP; n = 107) cows.
0
100
200
300
400
500
600
700
800
900
-14 -12 -10 -8 -6 -4 -2 1 3 5 7 9 11 13 15 17 19 21 23 25 27
Dai
ly L
yin
g T
ime
(min
/d)
PP MP
0
2
4
6
8
10
12
14
16
18
-14 -12 -10 -8 -6 -4 -2 1 3 5 7 9 11 13 15 17 19 21 23 25 27
Bout
Fre
quen
cy (
bouts
/d)
0
20
40
60
80
100
120
-14 -12 -10 -8 -6 -4 -2 1 3 5 7 9 11 13 15 17 19 21 23 25 27
Bout
Len
gth
(m
in)
Day Relative to Calving
Page 73
64
Figure 3.2 Average daily lying time (min/d) over the transition period (-14 to 28d) for healthy
multiparous (MP) cows with no other illnesses (H; n = 87), subclinically ketotic MP cows with
no other health issues (K; n = 76) and subclinically ketotic MP cows with other health issues
(K+; n = 39).
0
100
200
300
400
500
600
700
800
900
-14 -12 -10 -8 -6 -4 -2 1 3 5 7 9 11 13 15 17 19 21 23 25 27
Dai
ly L
yin
g T
ime
(min
/d)
Day Relative to Calving
H
K
K+
Page 74
65
CHAPTER 4: GENERAL DISCUSSION
4.1 IMPORTANT FINDINGS
Transition is a very vulnerable period for the high-producing dairy cow, as up to 50% of
cows develop at least one metabolic and/or infectious disease cows during this time (LeBlanc,
2010). There is growing evidence in the literature that changes in time devoted to certain
behaviours, including feeding and general activity, are associated with increased risk of certain
peripartum illnesses (Huzzey et al. 2007; Goldhawk et al., 2009; Proudfoot et al. 2009a; Soriani
et al., 2012). In Chapter 2, we sought to understand how rumination changes over the transition
period for both healthy cows and those with SCK and to identify if monitoring this behaviour
would be useful in the early detection of SCK. We hypothesized that early lactation dairy cows
with reduced rumination activity, both pre- and post-calving, would be at higher risk of
experiencing SCK. Our findings mostly supported this theory in MP cows. Multiparous cows
actually spent more time ruminating during the day than PP cows throughout the transition
period. For both healthy PP and MP cows, rumination time decreased in the week leading up to
calving and began to rapidly increase to an even longer duration in the week after calving. These
changes in time spent ruminating are likely associated with changes in DMI over that same time
period. Primiparous cows showed no difference in rumination time between health statuses.
However in MP cows, K cows ruminated less than H cows during the week before and after
calving and K+ cows had even lower rumination times during these weeks.
With this information we determined the associations of herd- and cow-level factors,
including rumination behaviour in the week preceding and following calving, with SCK (Chapter
2). Lower milk yield during the previous lactation, smaller loss of BCS over the transition
Page 75
66
period, decreased stall stocking density, and increased rumination during the week prior to
calving were all associated with decreased odds of SCK in MP cows. There were decreased odds
of SCK occurring with another postpartum health issue (K+) in cows with lower parity, shorter
dry period, lower stocking density in the week prior to calving and greater rumination time in the
week following calving. Although rumination time was also lower for K+ cows during the week
prior to calving, this factor was not retained in the final model, as it was correlated with
rumination time in wk +1. Thus, in addition to controlling for BCS loss, not overcrowding and
ensuring sufficient dry period length, these results suggest that rumination monitoring systems
may contribute to identifying MP cows at high risk for SCK, so preventative measures may be
taken prior to development of the illness.
Pedometers and activity monitors are commonly used for estrus detection in many dairy
herds, but recent research suggests they may be useful in detecting changes in lying behaviour
around calving that are associated with subclinical illness (Edwards and Tozer, 2004; Jawor et al.
2012). Due to the association between lying time and rumination time (Philips and Leaver, 1986;
Cooper et al., 2007), we decided to analyze these two behaviours separately over transition.
Chapter 3 characterized changes in lying behaviours, specifically daily lying time, frequency of
lying bouts and bout duration, across the transition period and determined if these factors were
useful in identifying cows at risk for SCK. We hypothesized that dairy cows with increased lying
activity, both before and after calving, would be at higher risk of experiencing SCK in early
lactation.
In our study, PP cows had a shorter daily lying time, more lying bouts and, short bout
durations compared to MP cows over the transition period (Chapter 3). Daily lying time and
frequency of bouts were not different between PP cows of different health statuses. Frequency of
Page 76
67
lying bouts and bout duration were similar between the health categories of MP cows over the
study period. No difference in daily lying time was found during the pre-calving period when
comparing healthy MP cows to K or K+, however, K cows tended to and K+ cows did lie down
longer than H multiparous cow during the week after calving. The increased odds of SCK
occurring with another postpartum health issue (K+) was associated longer daily lying time
during the week after calving (Chapter 3), in addition to those factors identified in our model of
rumination and odds of SCK (Chapter 2). Thus, monitoring lying behaviour may contribute to
the identification of MP cows that have SCK in combination with another health problem, but
may not be as useful for the early detection of this subclinical illness.
When comparing rumination time of K to H cows in Chapter 2, it was found that for
every 30 min/d decrease in rumination time during the week prior to calving, the odds of
becoming K post-calving increased by 20%. The odds of developing SCK and another health
problem was 1.31 times greater for every 30 min/d decrease in rumination time during the week
after calving. In Chapter 3 we found that a 30 min increase in lying time throughout the day
during the wk after calving was associated with a 1.15 times higher odds of being K+. Thus,
these results suggest that for monitoring behaviour during the week prior to and after calving,
rumination time may be a better predictor than lying time for identifying cows at risk for, or
experiencing, SCK.
4.2 FUTURE RESEARCH
Animal behaviours are highly variable, not only within herds, but also within cows. It
would be ideal if studies aiming to measure animal behaviours, such as lying time or rumination,
employ a greater sample size to account for these large variations. A better understanding of
Page 77
68
trends in the behaviour of healthy cows over the transition period and even throughout lactation
will aid in developing a better understanding of fluctuations over time. If we can determine a
baseline for behaviours it will be easier to pinpoint where abnormal changes in behaviour occur
that could identify cows at a higher risk for illness.
It is important to note that this research suggests automated behavioural monitoring
systems may be useful in identifying high risk cows, but it is still necessary for these cows to be
tested for illness prior to any sort of treatment. Testing for SCK only 1x/wk was definitely a
limitation in this study. Repeated BHBA sampling during the pre- and post-partum period may
have enhanced our understanding of the relationship between BHBA and both rumination and
lying behaviour. Future studies that also measure particle size and sorting of the ration could
grasp an even better understanding of the factors that not only affect illness, but also affect
rumination over the transition period. With daily measurements of BHBA and individual dairy
cow behaviour, future research may be able to determine how behaviour changes specifically at
the onset of illness. More in depth studies like this may be able to determine the cause of this
change in behaviour (rumination, lying etc.) in association with SCK. By measuring multiple
behaviours over transition (including feeding behaviours) we may be able to differentiate
whether rumination and lying time changes are simply related to DMI and, therefore, associated
with ketosis, or if changes in these behaviours are related to sickness and may be considered a
sickness behaviour.
This study was carried out on commercial dairy farms where we were unable to record
DMI, particle size, sorting, social behaviour, competition at the feed bunk or timing regrouping
of cows, which other studies (vonKeyserlingk et al. 2008; Goldhawk et al. 2009; Proudfoot et al,
2009; Schirmann et al. 2011) have associated with subclinical illness. Ideally, future studies will
Page 78
69
monitor multiple animal behaviours to create larger, more in depth multivariable models. With a
better understanding of the numerous risk factors for ketosis, that include, but are not limited to,
milk production, DMI, dry period length, ration composition, rumination, lying time, pre-calving
BCS, stocking density, feed access, and grouping strategies, we can determine which of these
variables are easiest to monitor on specific farms and develop tools that producers and
veterinarian may use to target animals with subclinical illness.
4.3 IMPLICATIONS
From both an economic and welfare perspective, it is always within the dairy producer’s
best interest to ensure optimal health of their dairy cows over the transition period. Prevention is
the best possible strategy in reducing incidence, and resultant prevalence, of illnesses and disease
in herds. There are various management approaches to optimize DMI and encourage cow
behaviour to reduce the risk of SCK, but this metabolic disorder continues to affect a large
number of cows in the industry.
This research has provided a greater understanding of how rumination activity and lying
behaviour change over transition for both PP and MP cows. Although we did not find any
differences in the behaviour of PP cows with and without SCK, we did observe a difference in
MP cows. Rumination time tended to be lower for cows with only SCK and was even lower for
cows with SCK and at least one other health problem during the week preceding and the week
following calving. Lying time was also longer in cows with SCK and another health problem
during the week after calving.
Automated behavioural monitoring systems are used on many farms, especially for estrus
detection, but this research supports a potential secondary use for the systems in reporting cows
Page 79
70
at an increased risk for having a subclinical illness. Of course, to use these systems to their full
potential producers must begin monitoring rumination and lying behaviour during the dry period
to establish a baseline for behaviours. Any changes in behaviour for each cow would be
compared to that animal's normal levels of rumination or lying behaviour. Even with the use of
automated systems, testing for ketosis is still necessary to confirm a SCK diagnosis. In the case
of monitoring rumination, it may be possible to identify cows in the pre-calving period that are at
an increased risk of developing SCK post-calving. With this information producers may be able
to intervene, to ensure cows flagged as high risk are consuming sufficient nutrients to support
their needs.
Page 80
71
CHAPTER 5: REFERENCES
Andersson L. 1988. Subclinical ketosis in dairy cows. Vet. Clin. North Am. Food Anim. Pract.
4:233-251.
Andersson, L., and U. Emanuelson. 1985. An epidemiological study of hyperketonaemia in
Swedish dairy cows; Determinants and the relation to fertility. Prev. Vet. Med. 3:449–462.
doi:10.1016/0167-5877(85)90006-6.
Adin, G., R. Solomon, M. Nikbachat, A. Zenou, E. Yosef, A. Brosh, A. Shabtay, S.J. Mabjeesh,
I. Halachmi, and J. Miron. 2009. Effect of feeding cows in early lactation with diets
differing in roughage-neutral detergent fiber content on intake behavior, rumination, and
milk production. J. Dairy Sci. 92:3364–3373. doi:10.3168/jds.2009-2078.
Aikman, P.C., C.K. Reynolds, and D.E. Beever. 2008. Diet digestibility, rate of passage, and
eating and rumination behavior of Jersey and Holstein cows. J. Dairy Sci. 91:1103–1114.
doi:10.3168/jds.2007-0724.
Arazi, A., E. Ishay, E. Aizinbud, E. Kujina, E. Galvanoska, O. Leray, and C. Mosconi. 2010. The
use of a new sensor (Behaviour tag) for improving heat detection, health and welfare
monitoring in different rearing conditions. In Farm animal breeding, identification,
production recording and management. Proceedings of the 37th ICAR Biennial Session,
Riga, Latvia, 31 May-4 June, 2010. International Committee for Animal Recording
(ICAR). 113–127.
Bauman, D.E. and W.B. Currie. 1980. Partitioning of nutrients during pregnancy and lactation: A
review of mechanisms involving homeostasis and homeorhesis. J. Dairy Sci. 63:1514–1529.
doi:10.3168/jds.S0022-0302(80)83111-0.
Page 81
72
Beauchemin, K.A., B.I. Farr, L.M. Rode, and G.B. Schaalje. 1994. Effects of alfalfa silage chop
length and supplementary long hay on chewing and milk production of dairy cows. J. Dairy
Sci. 77:1326–1339. doi:10.3168/jds.S0022-0302(94)77072-7.
Beauchemin, K.A. and L.M. Rode. 1994. Compressed baled alfalfa hay for primiparous and
multiparous dairy cows. J. Dairy Sci. 77:1003–1012. doi:10.3168/jds.S0022-
0302(94)77036-3.
Beauchemin, K.A. and W.Z. Yang. 2005. Effects of physically effective fiber on intake, chewing
activity, and ruminal acidosis for dairy cows fed diets based on corn silage. J. Dairy Sci.
88:2117–2129. doi:10.3168/jds.S0022-0302(05)72888-5.
Bendixen, P.H., B. Vilson, I. Ekesbo, and D.B. Åstrand. 1987. Disease frequencies in dairy cows
in Sweden. IV. ketosis. Prev. Vet. Med. 5:99–109. doi:10.1016/0167-5877(87)90015-8.
Berckmans, D. 2004. Automatic on-line monitoring of animals by precision livestock farming.
Proceeding from the biannual meeting of the International Society for Animal Hygiène -
Saint-Malo. 27-30.
Berge, A.C. and G. Vertenten. 2014. A field study to determine the prevalence, dairy herd
management systems, and fresh cow clinical conditions associated with ketosis in western
European dairy herds. J. Dairy Sci. 97:2145–2154. doi:10.3168/jds.2013-7163.
Bewley, J.M., R.E. Boyce, J. Hockin, L. Munksgaard, S.D. Eicher, M.E. Einstein, and M.M.
Schutz. 2010. Influence of milk yield, stage of lactation, and body condition on dairy cattle
lying behavior measured using an automated activity monitoring sensor. J. Dairy Res.
77:1–6. doi:10.1017/S0022029909990227.
Page 82
73
Bikker, J.P., H. van Laar, P. Rump, J. Doorenbos, K. van Meurs, G.M. Griffioen, and J. Dijkstra.
2014. Technical note: Evaluation of an ear-attached movement sensor to record cow
feeding behavior and activity. J. Dairy Sci. 97:2974–2979. doi:10.3168/jds.2013-7560.
Blackie, N., J. R. Scaife, and E. C. L. Bleach. 2006. Lying behavior and activity of early
lactation Holstein dairy cattle measured using an activity monitor. Cattle Practice. 14:139-
142.
Calamari, L., N. Soriani, G. Panella, F. Petrera, A. Minuti, and E. Trevisi. 2014. Rumination
time around calving: An early signal to detect cows at greater risk of disease. J. Dairy Sci.
97:3635–3647. doi:10.3168/jds.2013-7709.
Calderon, D.F. and N.B. Cook. 2011. The effect of lameness on the resting behavior and
metabolic status of dairy cattle during the transition period in a freestall-housed dairy herd.
J. Dairy Sci. 94:2883–2894. doi:10.3168/jds.2010-3855.
Carrier, J., S. Stewart, S. Godden, J. Fetrow, and P. Rapnicki. 2004. Evaluation and use of three
cowside tests for detection of subclinical ketosis in early postpartum cows. J. Dairy Sci.
87:3725–3735. doi:10.3168/jds.S0022-0302(04)73511-0.
Clément, P., R. Guatteo, L. Delaby, B. Rouillé, A. Chanvallon, J.M. Philipot, and N. Bareille.
2014. Short communication: Added value of rumination time for the prediction of dry
matter intake in lactating dairy cows. J. Dairy Sci. 97:6531–6535. doi:10.3168/jds.2013-
7860.
Cook, N.B., T.B. Bennett, and K. V Nordlund. 2005. Monitoring indices of cow comfort in free-
stall-housed dairy herds. J. Dairy Sci. 88:3876–3885. doi:10.3168/jds.S0022-
0302(05)73073-3.
Page 83
74
Cooper, M.D., D.R. Arney, and C.J.C. Phillips. 2007. Two- or four-hour lying deprivation on the
behavior of lactating dairy cows. J. Dairy Sci. 90:1149–1158. doi:10.3168/jds.S0022-
0302(07)71601-6.
Dado, R.G. and M.S. Allen. 1994. Variation in and relationships among feeding, chewing, and
drinking variables for lactating dairy cows. J. Dairy Sci. 77:132–144.
doi:10.3168/jds.S0022-0302(94)76936-8.
Dado, R.G. and M.S. Allen. 1995. Intake limitations, feeding behavior, and rumen function of
cows challenged with rumen fill from dietary fiber or inert bulk. J. Dairy Sci. 78:118–133.
doi:10.3168/jds.S0022-0302(95)76622-X.
Dantzer, R. and K.W. Kelley. 2007. Twenty years of research on cytokine-induced sickness
behavior. Brain. Behav. Immun. 21:153–160. doi:10.1016/j.bbi.2006.09.006.
Deming, J.A., R. Bergeron, K.E. Leslie, and T.J. DeVries. 2013. Associations of housing,
management, milking activity, and standing and lying behavior of dairy cows milked in
automatic systems. J. Dairy Sci. 96:344–351. doi:10.3168/jds.2012-5985.
DeVries, T.J., von Keyserlingk, M.A.G., and D.M. Weary. 2004. Effect of feeding space on the
intercow-distance, aggression, and feeding behavior of free-stall housed lactating dairy
cows. J. Dairy Sci., 87:1432–1438.
Devries, T.J., J.A. Deming, J. Rodenburg, G. Seguin, K.E. Leslie, and H.W. Barkema. 2011.
Association of standing and lying behavior patterns and incidence of intramammary
infection in dairy cows milked with an automatic milking system. J. Dairy Sci. 94:3845–
3855. doi:10.3168/jds.2010-4032.
Dohoo, I.R., S.W. Martin, A.H. Meek, and W.C.D. Sandals. 1983. Disease, production and
culling in Holstein Fresian Cows. Prev. Vet. Med., 1: 321-334.
Page 84
75
Douglas, G.N., T.R. Overton, H.G. Bateman, H.M. Dann, and J.K. Drackley. 2006. Prepartal
plane of nutrition, regardless of dietary energy source, affects periparturient metabolism
and dry matter intake in Holstein cows. J. Dairy Sci. 89:2141–2157.
doi:10.3168/jds.S0022-0302(06)72285-8.
Drackley, J.K. 1999. Biology of dairy cows during the transition period: The final frontier? J.
Dairy Sci. 82:2259-2273.
Duffield, T. 2000. Subclinical ketosis in lactating dairy cattle. Vet. Clin. North Am. Food Anim.
Pract. 16:231–253.
Duffield, T.F., K.D. Lissemore, B.W. McBride, and K.E. Leslie. 2009. Impact of
hyperketonemia in early lactation dairy cows on health and production. J. Dairy Sci.
92:571–580.
Duffield, T.F., D. Sandals, K.E. Leslie, K. Lissemore, B.W. McBride, J.H. Lumsden, P. Dick,
and R. Bagg. 1998. Effect of prepartum administration of monensin in a controlled-release
capsule on postpartum energy indicators in lactating dairy cows. J. Dairy Sci. 81:2354–
2361. doi:10.3168/jds.S0022-0302(98)70126-2.
Edwards, J.L. and P.R. Tozer. 2004. Using activity and milk yield as predictors of fresh cow
disorders. J. Dairy Sci. 87:524–531. doi:10.3168/jds.S0022-0302(04)73192-6.
Enjalbert, F., M.C. Nicot, C. Bayourthe, and R. Moncoulon. 2001. Ketone bodies in milk and
blood of dairy cows: relationship between concentrations and utilization for detection of
subclinical ketosis. J. Dairy Sci. 84:583–589. doi:10.3168/jds.S0022-0302(01)74511-0.
Erdman, R.A. 1988. Dietary buffering requirements of the lactating dairy cow: A review. J.
Dairy Sci. 71:3246- 3266. doi: 10.3168/jds.S0022-0302(88)79930-0.
Page 85
76
Fisher, A., M. Stewart, G. Verkerk, C. Morrow, and L. Matthews. 2003. The effects of surface
type on lying behavior and stress responses of dairy cows during periodic weather-induced
removal from pasture. Appl. Anim. Behav. Sci. 81:1–11. doi:10.1016/S0168-
1591(02)00240-X.
Fleischer, P., M. Metzner, M. Beyerbach, M. Hoedemaker, and W. Klee. 2001. The relationship
between milk yield and the incidence of some diseases in dairy cows. J. Dairy Sci.
84:2025–2035. doi:10.3168/jds.S0022-0302(01)74646-74652.
Flower, F.C. and D.M. Weary. 2006. Effect of hoof pathologies on subjective assessments of
dairy cow gait. J. Dairy Sci. 89:139–146. doi:10.3168/jds.S0022-0302(06)72077-X.
Fregonesi, J.A. and J.D. Leaver. 2001. Behaviour, performance and health indicators of welfare
for dairy cows housed in strawyard or cubicle systems. Livest. Prod. Sci. 68:205–216.
doi:10.1016/S0301-6226(00)00234-7.
Fregonesi, J.A., C. B. Tucker, and D. M. Weary. 2007. Overstocking reduces lying time in dairy
cows. J. Dairy Sci. 90:3349 – 3354. doi: 10.3168/jds.2006-794
Geishauser, T., K. Leslie, D. Kelton, and T. Duffield. 1998. Evaluation of five cowside tests for
use with milk to detect subclinical ketosis in dairy cows. J. Dairy Sci. 81:438–443.
doi:10.3168/jds.S0022-0302(98)75595-X.
Geishauser, T., Leslie, K., Tenhag, J., Bashiri, A., 2000. Evaluation of eight cow-side ketone
tests in milk for detection of subclinical ketosis in dairy cows. J. Dairy Sci. 83, 296-299.
doi:10.3168/jds.S0022-0302(00)74877-6
Gillund, P., O. Reksen, Y.T. Gröhn, and K. Karlberg. 2001. Body condition related to ketosis
and reproductive performance in Norwegian dairy cows. J. Dairy Sci. 84:1390–1396.
doi:10.3168/jds.S0022-0302(01)70170-1.
Page 86
77
Goldhawk, C., N. Chapinal, D.M. Veira, D.M. Weary, and M.A.G. von Keyserlingk. 2009.
Prepartum feeding behavior is an early indicator of subclinical ketosis. J. Dairy Sci.
92:4971–7. doi:10.3168/jds.2009-2242.
Goff, J.P., and R.L. Horst. 1997. Physiological changes at parturition and their relationship to
metabolic disorders. J. Dairy Sci. 80:1260–1268. doi:10.3168/jds.S0022-0302(97)76055-7.
Gomez, A., and N.B. Cook. 2010. Time budgets of lactating dairy cattle in commercial freestall
herds. J. Dairy Sci. 93:5772–5781. doi:10.3168/jds.2010-3436.
González, L.A., B.J. Tolkamp, M.P. Coffey, A. Ferret, and I. Kyriazakis. 2008. Changes in
feeding behavior as possible indicators for the automatic monitoring of health disorders in
dairy cows. J. Dairy Sci. 91:1017–1028. doi:10.3168/jds.2007-0530.
Grant, R.J., and J.L. Albright. 1995. Feeding behavior and management factors during the
transition period in dairy cattle. J.Anim. Sci. 73:2791–2803.
Gröhn, Y.T., H.N. Erb, C.E. McCulloch, and H.S. Saloniemi. 1989. Epidemiology of metabolic
disorders in dairy cattle: association among host characteristics, disease, and production. J.
Dairy Sci. 72:1876–1885. doi:10.3168/jds.S0022-0302(89)79306-1.
Gröhn, Y.T., S.W. Eicker, and J.A. Hertl. 1995. The association between previous 305-day milk
yield and disease in New York State dairy cows. J. Dairy Sci. 78:1693–702.
doi:10.3168/jds.S0022-0302(95)76794-7.
Grummer, R.R. 1995. Impact of changes in organic nutrient metabolism on feeding the transition
dairy cow. J. Anim. Sci. 73:2820–2833. doi:/1995.7392820x.
Haley, D., A. de Passillé, and J. Rushen. 2001. Assessing cow comfort: effects of two floor types
and two tie stall designs on the behavior of lactating dairy cows. Appl. Anim. Behav. Sci.
71:105–117. doi:10.1016/S0168-1591(00)00175-1.
Page 87
78
Haley, D.B., J. Rushen, and A.M. de Passillé. 2000. Behavioural indicators of cow comfort:
activity and resting behavior of dairy cows in two types of housing. Can. J. Anim. Sci.
80:257–263. doi:10.4141/A99-084.
Hart, B.L. 1988. Biological basis of the behavior of sick animals. Neurosci. Biobehav. Rev. 12:
123–137. doi:10.1016/S0149-7634(88)80004-6.
Hasegawa, N., A. Nishiwaki, K. Sugawara, and I. Ito. 1997. The effects of social exchange
between two groups of lactating primiparous heifers on milk production, dominance order,
behavior and adreno-cortical response. Appl. Anim. Behav. Sci. 51:15–27.
doi:10.1016/S0168-1591(96)01082-9.
Hayirli, A., R.R. Grummer, E.V. Nordheim, and P.M. Crump. 2002. Animal and dietary factors
affecting feed intake during the prefresh transition period in Holsteins. J. Dairy Sci.
85:3430–3443.doi: 10.3168/jds.S0022-0302(02)74431-7.
Herdt, T. H. 2000. Ruminant adaptation to negative energy balance. Influences on the etiology of
ketosis and fatty liver. Vet. Clin. North Am. Food Anim. Pract. 16(2):215-230.
Huzzey, J.M., M.A.G. von Keyserlingk, and D.M. Weary. 2005. Changes in feeding, drinking,
and standing behavior of dairy cows during the transition period. J. Dairy Sci. 88:2454–
2461. doi:10.3168/jds.S0022-0302(05)72923-4.
Huzzey, J.M., DeVries, T.J., Valois, P., and M.A.G. von Keyserlingk. 2006. Stocking density
and feed barrier design affect the feeding and social behavior of dairy cattle. J. Dairy Sci.,
89, 126–133.doi: 10.3168/jds.S0022-0302(06)72075-6
Huzzey, J.M., D.M. Veira, D.M. Weary, and M.A.G. von Keyserlingk. 2007. Prepartum
behavior and dry matter intake identify dairy cows at risk for metritis. J. Dairy Sci.
90:3220–3233. doi:10.3168/jds.2006-807.
Page 88
79
Ingvartsen, K.L. 2006. Feeding and management related diseases in the transition cow. Anim.
Feed Sci. Technol. 126:175–213. doi:10.1016/j.anifeedsci.2005.08.003.
Itle, A.J., J.M. Huzzey, D.M. Weary, and M.A.G. von Keyserlingk. 2015. Clinical ketosis and
standing behavior in transition cows. J. Dairy Sci. 98:128–34. doi:10.3168/jds.2014-7932.
Ito, K., D.M. Weary, and M.A.G. von Keyserlingk. 2009. Lying behavior: assessing within- and
between-herd variation in free-stall-housed dairy cows. J. Dairy Sci. 92:4412–4420.
doi:10.3168/jds.2009-2235.
Iwersen, M., U. Falkenberg, R. Voigtsberger, D. Forderung, and W. Heuwieser. 2009.
Evaluation of an electronic cowside test to detect subclinical ketosis in dairy cows. J. Dairy
Sci. 92: 2618–2624. doi:10.3168/jds.2008-1795
Janovick, N.A., and J.K. Drackley. 2010. Prepartum dietary management of energy intake affects
postpartum intake and lactation performance by primiparous and multiparous Holstein
cows. J. Dairy Sci. 93:3086–3102. doi:10.3168/jds.2009-2656.
Janovick, N.A., Y.R. Boisclair, and J.K. Drackley. 2011. Prepartum dietary energy intake affects
metabolism and health during the periparturient period in primiparous and multiparous
Holstein cows. J. Dairy Sci. 94:1385–1400. doi:10.3168/jds.2010-3303.
Jawor, P.E., J.M. Huzzey, S.J. LeBlanc, and M.A.G. von Keyserlingk. 2012. Associations of
subclinical hypocalcemia at calving with milk yield, and feeding, drinking, and standing
behaviors around parturition in Holstein cows. J. Dairy Sci. 95:1240–1248.
doi:10.3168/jds.2011-4586.
Kononoff, P.J., A.J. Heinrichs, and H.A. Lehman. 2003. The effect of corn silage particle size on
eating behavior, chewing activities, and rumen fermentation in lactating dairy cows. J.
Dairy Sci. 86:3343–3353. doi:10.3168/jds.S0022-0302(03)73937-X.
Page 89
80
LeBlanc, S. 2010. Monitoring metabolic health of dairy cattle in the transition period. J. Reprod.
Dev. 56:S29–S35. doi:10.1262/jrd.1056S29.
Ledgerwood, D.N., C. Winckler, and C.B. Tucker. 2010. Evaluation of data loggers, sampling
intervals, and editing techniques for measuring the lying behavior of dairy cattle. J. Dairy
Sci. 93:5129–5139. doi:10.3168/jds.2009-2945.
MacKay, J.R.D., J.M. Deag, and M.J. Haskell. 2012. Establishing the extent of behavioural
reactions in dairy cattle to a leg mounted activity monitor. Appl. Anim. Behav. Sci.
139:35–41. doi:10.1016/j.applanim.2012.03.008.
Maekawa, M., K.A. Beauchemin, and D.A. Christensen. 2002. Chewing activity, saliva
production, and ruminal pH of primiparous and multiparous lactating dairy cows. J. Dairy
Sci. 85:1176–1182. doi:10.3168/jds.S0022-0302(02)74180-5.
Mattachini, G., A. Antler, E. Riva, A. Arbel, and G. Provolo. 2013. Automated measurement of
lying behavior for monitoring the comfort and welfare of lactating dairy cows. Livest. Sci.
158:145–150. doi:10.1016/j.livsci.2013.10.014.
Maulfair, D.D., G.I. Zanton, M. Fustini, and A.J. Heinrichs. 2010. Effect of feed sorting on
chewing behavior, production, and rumen fermentation in lactating dairy cows. J. Dairy
Sci. 93:4791–4803. doi:10.3168/jds.2010-3278.
Mashek, D.G. and D.K. Beede. 2001. Peripartum responses of dairy cows fed energy-dense diets
for 3 or 6 weeks prepartum. J. Dairy Sci. 84:115–1125. doi:10.3168/jds.S0022-
0302(01)74459-1.
McArt, J.A.A., D. V Nydam, and G.R. Oetzel. 2012. Epidemiology of subclinical ketosis in early
lactation dairy cattle. J. Dairy Sci. 95:5056–5066. doi:10.3168/jds.2012-5443.
Page 90
81
McGowan, J. E., C. R. Burke, and J. G. Jago. 2007. Validation of a technology for objectively
measuring behavior in dairy cows and its application for oestrous detection. NZ Soc.
Anim. Prod. 67:136–142.
Munksgaard, L., M.B. Jensen, L.J. Pedersen, S.W. Hansen, and L. Matthews. 2005. Quantifying
behavioral priorities-effects of time constraints on behavior of dairy cows, Bos taurus.
Appl. Anim. Behav. Sci. 92:3–14. doi:10.1016/j.applanim.2004.11.005.
National Research Council. 2001. Nutrient requirements of dairy cattle. 7th Rev. Ed. Natl. Acad.
Sci., Washington, DC.
Nielsen, B.L., R.F. Veerkamp, and A.B. Lawrence. 2000. Effects of genotype, feed type and
lactational stage on the time budget of dairy cows. 50:272–278.
doi:10.1080/090647000750069467
Nordlund, K. V. 2009. Fresh Cow Programs: The key factors to prevent poor transitioning cows.
Proceedings in the 46th Florida Dairy Production Conference, Gainesville. 1–4.
Norring, M., E. Manninen, A.M. de Passillé, J. Rushen, L. Munksgaard, and H. Saloniemi. 2008.
Effects of sand and straw bedding on the lying behavior, cleanliness, and hoof and hock
injuries of dairy cows. J. Dairy Sci. 91:570–576. doi:10.3168/jds.2007-0452.
O’Driscoll, K., L. Boyle, and A. Hanlon. 2008. A brief note on the validation of a system for
recording lying behavior in dairy cows. Appl. Anim. Behav. Sci. 111:195–200.
doi:10.1016/j.applanim.2007.05.014.
Okine, E. K., and G. W. Mathison. 1991. Effects of feed intake on particle distribution, passage
of digesta, and extent of digestion in the gastrointestinal tract of cattle. J. Anim. Sci.
69:3435–3445.
Page 91
82
Osborne, T.M., K.E. Leslie, T. Duffield, C.S. Petersson, J. Ten Hag, Y. Okada. 2002. Evaluation
of Keto-Test in urine and milk for the detection of subclinical ketosis in periparturient
Holstein dairy cattle. Pages 188–189 in Proc. 35th Annu. Conv. Am. Assoc. Bov. Pract.,
Madison, WI. Am. Assoc. Bov. Pract., Stillwater, OK.
Ospina, P.A., D. V Nydam, T. Stokol, and T.R. Overton. 2010. Association between the
proportion of sampled transition cows with increased nonesterified fatty acids and beta-
hydroxybutyrate and disease incidence, pregnancy rate, and milk production at the herd
level. J. Dairy Sci. 93:3595–35601. doi:10.3168/jds.2010-3074.
Overton, T.R., and M.R. Waldron. 2004. Nutritional Management of Transition Dairy Cows:
Strategies to Optimize Metabolic Health. J. Dairy Sci. 87:E105–E119.
doi:10.3168/jds.S0022-0302(04)70066-1.
Pedersen, A. 2010. Rumination measurements and ketosis in early lactation. Dansk
Veterinaertidsskr. 93:14, 28–32.
Phillips, C.J.C., and J.D. Leaver. 1986. The effect of forage supplementation on the behavior of
grazing dairy cows. Appl. Anim. Behav. Sci. 16:233–247. doi:10.1016/0168-
1591(86)90116-4.
Proudfoot, K.L., J.M. Huzzey, and M.A.G. von Keyserlingk. 2009a. The effect of dystocia on
the dry matter intake and behavior of Holstein cows. J. Dairy Sci. 92:4937–4944.
doi:10.3168/jds.2009-2135.
Proudfoot, K.L., D.M. Veira, D.M. Weary, and M.A.G. von Keyserlingk. 2009b. Competition at
the feed bunk changes the feeding, standing, and social behavior of transition dairy cows.
J. Dairy Sci. 92:3116–3123. doi:10.3168/jds.2008-1718.
Page 92
83
Rastani, R.R., R.R. Grummer, S.J. Bertics, A. Gümen, M.C. Wiltbank, D.G. Mashek, and M.C.
Schwab. 2005. Reducing dry period length to simplify feeding transition cows: milk
production, energy balance, and metabolic profiles. J. Dairy Sci. 88:1004–1014.
doi:10.3168/jds.S0022-0302(05)72768-5.
Reith, S., and S. Hoy. 2012. Relationship between daily rumination time and estrus of dairy
cows. J. Dairy Sci. 95:6416–6420. doi:10.3168/jds.2012-5316.
Rutten, C. J., A. G. Velthuis, W. Steeneveld, and H. Hogeveen. 2013. Invited review: Sensors to
support health management on dairy farms. J. Dairy Sci. 96(4):1928- 1952.
doi:10.3168/jds.2012-6107.
Santschi, D.E., D.M. Lefebvre, R.I. Cue, C.L. Girard, and D. Pellerin. 2011. Incidence of
metabolic disorders and reproductive performance following a short (35-d) or conventional
(60-d) dry period management in commercial Holstein herds. J. Dairy Sci. 94:3322–3330.
doi:10.3168/jds.2010-3595.
Schirmann, K., M.A.G. von Keyserlingk, D.M. Weary, D.M. Veira, and W. Heuwieser. 2009.
Technical note: Validation of a system for monitoring rumination in dairy cows. J. Dairy
Sci. 92:6052–6055. doi:10.3168/jds.2009-2361.
Schirmann, K., N. Chapinal, D.M. Weary, W. Heuwieser, and M.A.G. von Keyserlingk. 2011.
Short-term effects of regrouping on behavior of prepartum dairy cows. J. Dairy Sci.
94:2312–2319. doi:10.3168/jds.2010-3639.
Schirmann, K., N. Chapinal, D.M. Weary, W. Heuwieser, and M.A.G. von Keyserlingk. 2012.
Rumination and its relationship to feeding and lying behavior in Holstein dairy cows. J.
Dairy Sci. 95:3212–7. doi:10.3168/jds.2011-4741.
Page 93
84
Schirmann, K., N. Chapinal, D.M. Weary, L. Vickers, and M.A.G. von Keyserlingk. 2013. Short
communication: Rumination and feeding behavior before and after calving in dairy cows.
J. Dairy Sci. 96:7088–7092. doi:10.3168/jds.2013-7023.
Sepúlveda-Varas, P., D.M. Weary, and M.A.G. von Keyserlingk. 2014. Lying behavior and
postpartum health status in grazing dairy cows. J. Dairy Sci. 97:6334–6343.
doi:10.3168/jds.2014-8357.
Soriani, N., E. Trevisi, and L. Calamari. 2012. Relationships between rumination time, metabolic
conditions, and health status in dairy cows during the transition period. J. Anim. Sci.
90:4544–4554. doi:10.2527/jas.2012-5064.
Soriani, N., G. Panella, and L. Calamari. 2013. Rumination time during the summer season and
its relationships with metabolic conditions and milk production. J. Dairy Sci. 96:5082–
5094. doi:10.3168/jds.2013-6620.
Sovani, S., C. Heuer, W. M. VanStraalen, and J.P.T.M. Noordhuizen. 2000. Disease in high
producing dairy cows following post parturient negative energy balance. Soc. Vet. Epid.
Prev. Med. Prod. 33–50.
Steensels, M., C. Bahr, D. Berckmans, I. Halachmi, A. Antler, and E. Maltz. 2012. Lying
patterns of high producing healthy dairy cows after calving in commercial herds as affected
by age, environmental conditions and production. Appl. Anim. Behav. Sci. 136:88–95.
doi:10.1016/j.applanim.2011.12.008.
Suthar, V.S., J. Canelas-Raposo, A. Deniz, and W. Heuwieser. 2013. Prevalence of subclinical
ketosis and relationships with postpartum diseases in European dairy cows. J. Dairy Sci.
96:2925–2938. doi:10.3168/jds.2012-6035.
Page 94
85
Tatone, E.H., J.L. Gordon, S.J. LeBlanc, and T.F. Duffield. 2015a. Evaluation of a handheld
device for measurement of β-hydroxybutyrate concentration to identify prepartum dairy
cattle at risk of developing postpartum hyperketonemia. J. Am. Vet. Med. Assoc.
246:1112–1117. doi:10.2460/javma.246.10.1112.
Tucker, C.B., D.M. Weary, and D. Fraser. 2003. Effects of three types of free-stall surfaces on
preferences and stall usage by dairy cows. J. Dairy Sci. 86:521–529.
doi:10.3168/jds.S0022-0302(03)73630-3.
Tucker, C.B., D.M. Weary, and D. Fraser. 2004. Free-stall dimensions: effects on preference and
stall usage. J. Dairy Sci. 87:1208–1216. doi:10.3168/jds.S0022-0302(04)73271-3.
UBC AWP. 2013. UBC Animal Welfare Program: SOP - HOBO Data Loggers. pp. 1 - 23.
University of British Columbia, Vancouver, Canada
Vanholder, T., J. Papen, R. Bemers, G. Vertenten, and A.C.B. Berge. 2015. Risk factors for
subclinical and clinical ketosis and association with production parameters in dairy cows in
the Netherlands. J. Dairy Sci. 98:880–888. doi:10.3168/jds.2014-8362.
Van Saun, R.J., and C.J. Sniffen. 2014. Transition cow nutrition and feeding management for
disease prevention. Vet. Clin. North Am. Food Anim. Pract. 30:689–719.
doi:10.1016/j.cvfa.2014.07.009.
Vickers, L. A., D.M. Weary, D.M. Veira, and M. a G. von Keyserlingk. 2013. Feeding a higher
forage diet prepartum decreases incidences of subclinical ketosis in transition dairy cows.
J. Anim. Sci. 91:886–894. doi:10.2527/jas.2011-4349.
von Keyserlingk, M.A.G., A. Barrientos, K. Ito, E. Galo, and D.M. Weary. 2012. Benchmarking
cow comfort on North American freestall dairies: lameness, leg injuries, lying time, facility
Page 95
86
design, and management for high-producing Holstein dairy cows. J. Dairy Sci. 95:7399–
7408. doi:10.3168/jds.2012-5807.
von Keyserlingk, M.A.G., D. Olenick, and D.M. Weary. 2008. Acute behavioral effects of
regrouping dairy cows. J. Dairy Sci. 91:1011–1016. doi:10.3168/jds.2007-0532.
Voyvoda, H. and H. Erdogan. 2010. Use of a hand-held meter for detecting subclinical ketosis in
dairy cows. Res. Vet. Sci. 89:344–351. doi:10.1016/j.rvsc.2010.04.007.
Walsh, R.B., Walton, J.S., Kelton, D.F., LeBlanc, S.J., Leslie, K.E., and T.F. Duffield. 2007. The
effect of subclinical ketosis in early lactation on reproductive performance of postpartum
dairy cows. J. Dairy Sci., 90, 2788–2796.doi: 10.3168/jds.2006-560
Weary, D.M., J.M. Huzzey, and M.A.G. von Keyserlingk. 2009. Board-invited review: Using
behavior to predict and identify ill health in animals. J. Anim. Sci. 87:770–777.
doi:10.2527/jas.2008-1297.
Welch, J.G. 1982. Rumination, Particle Size and Passage from the Rumen. J. Anim. Sci. 54:885-
894. doi: 10.2134/jas1982.544885x.
Welch, J.G., and A.M. Smith. 1970. Forage Quality and Rumination Time in Cattle. J. Dairy Sci.
53:797–800. doi:10.3168/jds.S0022-0302(70)86293-2.
Wildman, E.E., G.M. Jones, P.E. Wagner, R.L. Boman, H.F. Troutt, and T.N. Lesch. 1982. A
dairy cow body condition scoring system and its relationship to selected production
characteristics. J. Dairy Sci. 65:495–501. doi:10.3168/jds.S0022-0302(82)82223-6.
Wolfger, B., E. Timsit, E.A. Pajor, N. Cook, H.W. Barkema, and K. Orsel. 2015. Technical note:
Accuracy of an ear tag-attached accelerometer to monitor rumination and feeding behavior
in feedlot cattle. J. Anim. Sci. 93:3164–3168. doi:10.2527/jas.2014-8802.
Page 96
87
Yang, W.Z. and K.A. Beauchemin. 2006. Effects of physically effective fiber on chewing
activity and ruminal pH of dairy cows fed diets based on barley silage. J. Dairy Sci.
89:217–228. doi:10.3168/jds.S0022-0302(06)72086-0.
Zehner, N., J.J. Niederhauser, F. Nydegger, A. Grothmann, M. Keller, M. Hoch, A.
Haeussermann, and M. Schick. 2012. Validation of a new health monitoring system
(RumiWatch) for combined automatic measurement of rumination, feed intake, water
intake and locomotion in dairy cows. Proceedings from the Information Technology,
Automation and Precision Farming. International Conference of Agricultural Engineering -
CIGR-AgEng 2012: Agriculture and Engineering for a Healthier Life, Valencia, Spain, 8-
12 July 2012. CIGR-EurAgEng. pp.C–0438.