The purpose of this paper is to suggest of image-processing technique. This photographic images of tracks and on therefore to measure the state of the rlines under upgrading by means of mapplications or in high-efficiency surve
One of the most frequent and daa lot of factors, some occasionmismanagement of the superstructumanagement authorities. Among according to the determining facgenerally due to too broad a gauge
(CRB), University of Perugia, Strada S. Lucia Canetoneering, University of Palermo, Viale delle Scienze, 90ing, University of Enna “Kore”, Cittadella Universita
a new procedure for reconstructing the transvemethodological approach is based on the “inspecific algorithms which allow to obtain the
rail-head extrados wear. The analyses and the mono- and stereoscopic methods which are apeys in situ.
evier Ltd.ponsibility of SIIV2012 Scientific Committee urement, mono and stereoscopic image analysis
angerous accidents in the railway field is thal and statistically insignificant, others ure which may be below the minimum sathese accidents, there is the derailmen
ctors as follows: i) wheel-flange-climb de; iii) jump-up derailment caused by a vio
9993614.
of Road Infrastructures
the Transverse Profile of
rio Ticalic
ola s.n.,06125 Perugia, Italy 0144 Palermo, Italyaria, 94100 Enna, Italy
erse profile of rails in operation by means nformation” contained in high-resolution e exact geometric profile of the rails and results concern rails taken from railway
ppropriate to be employed in laboratory
he derailment which can be caused by much more frequent and due to
afety standards established by the rail t accident which can be classified derailment; ii) slide-up derailment,
612 Marco Guerrieri et al. / Procedia - Social and Behavioral Sciences 53 ( 2012 ) 611 – 621
the rail. The most frequent, and thewhen the forward motion of the axusually occurs under conditions of roll onto the top of the rail head. Tcontact, or it may result in the whewith Q, the wheel load with P, theratio Q/P (see Fig. 1) which avoids
Nadal’s equation allows to lead in presence of heavy axial loads Pwhich occurs in opposite conditioinferred that, all conditions being erail wear (see Fig. 1). Apart from defects (see Fig. 2) on the rail, thus
The rail wear and other imperfedevice) or diagnostic trains which potentialities offered by real-time wear have been pointed out [4, 5, 6
The following paragraphs descrfrom railway lines under upgradinmono- and stereoscopic techniques
α
erefore the most interesting, is the wheel-flxle is combined with an excessive ratio oreduced vertical force and increased latera
The climb condition may be temporary, witeel fully climbing over the rail [1]. If we ree flange angle with α and the friction coethe derailment can be obtained from Nada
to two limit situations: the former concernP and low values of the lateral force Q; thons (moderate axial load and high lateral qual, the ratio Q/P decreases when the flanthe rail head wear, there could be a great potentially endangering safety conditions.
ections can be both monitored through lowperform track laser scans while monitorinimage processing techniques to determine
6, 7, 8]. ribe the results got from laboratory analyseng, and aimed to determine the transverse.
Fig.1. Q/P Ratio (according to Nadal equation)
FLANG
LIM
ITIN
G Q
/P
lange-climb derailment, which occurs of Q/P wheel/rail contact forces. This al force that cause the wheel flange to th wheel and rail returning to normal
espectively denote the transverse load efficient with f, the limit value of the al’s well-known equation [2]:
(1)
ning a high safety level which occurs he latter regarding a low safety level force value). From relation (1) it is
nge angle increases as an effect of the t number of other damage, cracks or .
w-efficiency equipment (e.g. miniprof ng rail travels [3]. More recently the e the vertical, horizontal and 45° rail
es performed on worn-out rails taken e profile of the railhead by means of
GE ANGLE (αααα)
613 Marco Guerrieri et al. / Procedia - Social and Behavioral Sciences 53 ( 2012 ) 611 – 621
Fig. 2. Rail wear and damage (examples)
2. Image Processing for Railways Track Profile Measurement (monoscopy)
The primary goal of image processing is to make the information content of a given image explicit with regard to the reference application type. All the segmentation methods are defined to process an image through specific algorithms which divide that image into distinct and uniform regions according to a set feature [9]. This operation is the first step to distinguish the region enclosing the object of interest (ROI, region of interest) from the other parts or the background. Such an image partition process must be able to preserve the valuable information along the object contours which in this paper is the starting point for detecting the distances between the rail transverse profiles in different operational conditions, more specifically worn-out and new rails. After analyzing the image of the rail (e.g. UIC 60), the segmentation procedure detects the image contour or “edge” through Canny’s algorithm [10]. Only afterwards this procedure solves the problem to compare the two rail profiles (worn-out and new) and to measure the vertical, horizontal and 45° deviations. The image edge detection phase is necessary in that digital images are definitely realized by high-resolution equipment but some image pixels could be affected by noise (very rough light scatterings located at the rail image contour), thus making the rail edge detection less accurate. More specifically, it is essential to detect the exact position of the image edge even in those parts where it cannot be distinguished, perceptually and/or numerically, from the clear background. Canny’s algorithm examines the behavior of the gradient operator applied to a noisy contour. The algorithm establishes that the pixel located at position (i,j) on the generic chromatic plane p† of the image A(i,j,p) is a Canny contour pixel if the intensity value of the pixel examined – A(i,j,p) – appears to be superior to given threshold values as established by Canny [10], based upon hysteresis thresholding and non-maximum suppression algorithms. It has also been observed that on the same image, an edge detection applied separately to the three chromatic planes (RGB) produces, as expected, better results in giving contour details, therefore we preferred to operate separately on the three chromatic image planes and collect the application results in one piece of Boolean information. The rail edge points obtained by Canny algorithm, denoted with {C}, are illustrated in the binary image of Fig. 4, which is an enlargement of a part of the original image (cf. Fig. 3) For each contour point {C} some clearer pixels which do not belong to rail microwrinkles can be detected near its edge. For every chromatic plane of the analyzed image, a median filter is applied by following this relation:
M=A*B (2)
where template B, in this specific case, has a definite dimension [3x3] and a coefficient equal to (1/9).
(3)
†“p” is plane index: p=1 Red plane, p=2 Green plane, p=3 Blue plane
614 Marco Guerrieri et al. / Procedia - Social and Behavioral Sciences 53 ( 2012 ) 611 – 621
Relation (2) represents the pixel mean of the neighboring eight values. The implemented procedure iteratively applies the previous filter so as to spread the numerical values of all the pixels which certainly belong to a colorimetrically homogeneous region, located at either the background or rail. Therefore the idea is very simple: the image at time t (iteration step) derives from the initial image convolved with the median filter (2), or:
(4)
where (i,j) are the pixel position indices within the original matrix A and “×” represents the convolution operator. Moreover, since the expanded mean filter (4) tends to remove the information on the edge details, this effect should be mitigated by applying another operator which, instead, emphasizes the rail edge.
In light of the above, downstream from the previous convolution (4), an edge extraction operator called rangeoperator was applied [11, 12]. For each deviation (i,j) from template B, the value of the central pixel can therefore be formalized as follows:
- (5)
To this end the range values of every [3x3] boundary of all the pixels belonging to the original image A have been sought and highlighted. The following equation (6) formalizes the previous difference operation. Therefore, given a generic iteration step t, the suggested algorithm is able to lower the pixel intensities which mark the rail edge of the plane section.
(6)
It can easily be noticed that, with regard to any direction taken along the rail edge, while relation (4) tends to make numerically uniform the pixel value on the point edge under consideration, relation (5) on the same boundary lowers the values in the darkest regions and therefore colorimetrically near the rail.
Then we detected some uncertainty areas along the point edges where the profile in the eight directions marked a rough variation or, in any case, a skip over a precise threshold level, localized by three constants [Ti, To, Ts]. Such constants are automatically determined by the algorithm in relation to the maximum, minimum and mean deviation values of the two profiles. In these areas, for each iterative step t the pixel values fill in the matrixes {Si} and {Gi}, well distinct from the matrixes {S} and {G} which instead are almost certainly background and rail. Therefore, at the iterative step t we have:
(7) ) (8)
(9) (10)
The suggested algorithm is able to define the matrix CF(i,j) of the final edge, which is formalized by the following relation:
(11)
where F is the function which formalizes the belonging of the pixel to the rail boundary or to the background. Its superimposition on the original image is illustrated in Figure 7.
615 Marco Guerrieri et al. / Procedia - Social and Behavioral Sciences 53 ( 2012 ) 611 – 621
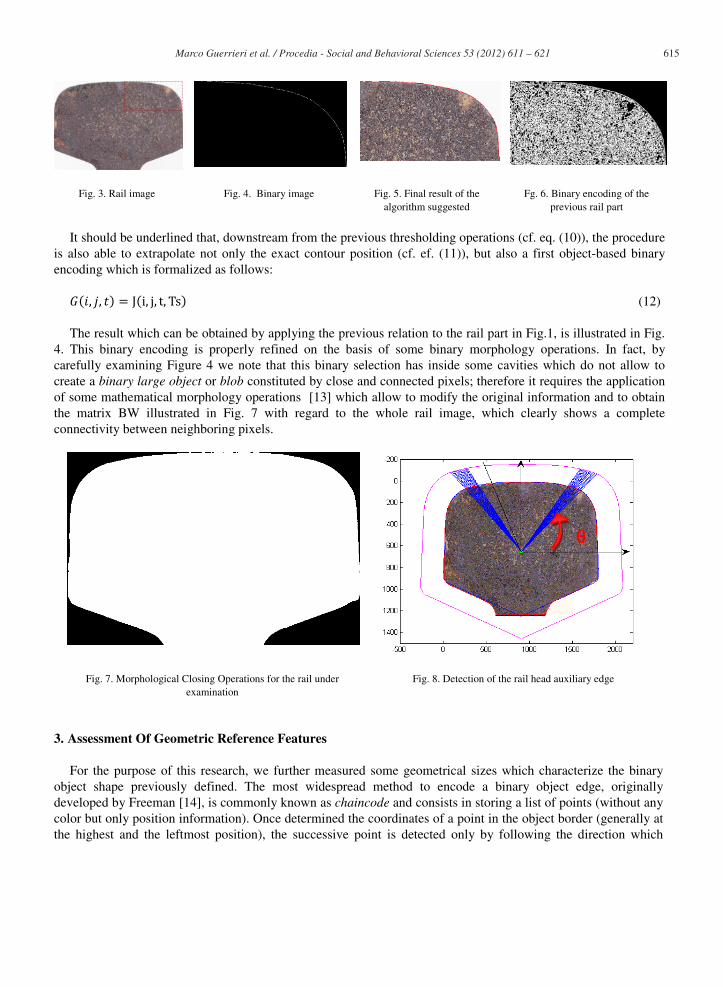
Fig. 3. Rail image Fig. 4. Binary image Fig. 5. Final result of the algorithm suggested
Fg. 6. Binary encoding of the previous rail part
It should be underlined that, downstream from the previous thresholding operations (cf. eq. (10)), the procedure is also able to extrapolate not only the exact contour position (cf. ef. (11)), but also a first object-based binary encoding which is formalized as follows:
(12)
The result which can be obtained by applying the previous relation to the rail part in Fig.1, is illustrated in Fig. 4. This binary encoding is properly refined on the basis of some binary morphology operations. In fact, by carefully examining Figure 4 we note that this binary selection has inside some cavities which do not allow to create a binary large object or blob constituted by close and connected pixels; therefore it requires the application of some mathematical morphology operations [13] which allow to modify the original information and to obtain the matrix BW illustrated in Fig. 7 with regard to the whole rail image, which clearly shows a complete connectivity between neighboring pixels.
Fig. 7. Morphological Closing Operations for the rail under examination
Fig. 8. Detection of the rail head auxiliary edge
3. Assessment Of Geometric Reference Features
For the purpose of this research, we further measured some geometrical sizes which characterize the binary object shape previously defined. The most widespread method to encode a binary object edge, originally developed by Freeman [14], is commonly known as chaincode and consists in storing a list of points (without any color but only position information). Once determined the coordinates of a point in the object border (generally at the highest and the leftmost position), the successive point is detected only by following the direction which
θθθθ
616 Marco Guerrieri et al. / Procedia - Social and Behavioral Sciences 53 ( 2012 ) 611 – 621
connects pixel barycentres [15]. Therefore, once detected the blob (binary large object) and its contour coordinates, it is simple to calculate the centroid (M) representing the center of mass (center of gravity). We then could determine the centroid position (xoj, yoj) of the worn-out rail and its contour coordinates, by means of Freeman’s algorithm developed on the result formalized by relations (11) and (12) after carrying out, as said above, the proper morphological closing operations (cf. Fig. 7). These coordinates are properly recorded in the vector WR (worn-out rail) of dimension [n x 2], where n is the Cartesian axis number of the edge. The algorithm then adds the profile coordinates of the unworn rail (in this case UIC 60 rail have been taken into consideration) and carries them to the same image scale previously determined.
These coordinates are properly recorded in a vector IR (intact rail) of dimension [kx2] where k represents the number of the discrete axes denoting the contour of the intact rail. In order to get the deviation between the profiles of the worn-out and unworn rails, an auxiliary profile has been developed by reducing the previous IR by a constant term equal to 1.3 (Rg), thus obtaining a perfectly homothetic boundary to the profile with the coordinates in the vector IR (cf. Fig. 8). The distances between the two profiles have been determined by the intercepts of the straight lines from the centroid of the profile IR, with regard to this last boundary Rg, whose domain is obviously perfectly parallel to the previous one. The procedure allows to get the deviation between the two compared profiles (worn-out and unworn) with regard to a 360° rotation of the straight line coming out of the rail centroid and, therefore, produces output information on the wear condition of the whole rail profile [5, 6]. Figures 9 and 10 show the final result yielded by the application of the algorithm suggested. The following diagrams illustrates the trend of the deformation of a UIC 60 rail profile properly examined in laboratory, with regard to the part of the rail head located at an angle “θ“ between 20° and 160°. Obviously, it is also possible to work out the values of vertical, horizontal and 45° wear, as required, for instance in Italy, by the Italian Railway Network [16].
617 Marco Guerrieri et al. / Procedia - Social and Behavioral Sciences 53 ( 2012 ) 611 – 621
4. Image processing for railways track profile measurement (stereoscopy)
Stereoscopy is based on the analysis of images taken by two cameras located at a certain distance from each other [17, 18, 19, 20]: so, the same scene produces two slightly different images, in which the same objects can show light relevant deviations, as schematized in Figure 11 (the cameras are separated by a horizontal base, the so-called baseline).
In order to simplify the elaborations, it is certainly advisable to endow both the cameras with lens having the same focal length, and sensors having equally sized pixels.
Moreover, since the image employed in this application does not contain objects in motion, it is not required to synchronize the capture of the pair of cameras, which is vice versa necessary in stereo real-time applications where objects in motion should be tracked in the scene.
A crucial parameter is the baseline, i.e. the distance between the cameras, which can be fixed or variable. This value influences the field of application; for instance, larger baselines allow a better distance resolution. As a matter of fact, since the distance resolution is equal to the minimum distance which can be distinguished by the stereo system, the stereo algorithm is nothing but a triangulation procedure; so this resolution is worsened by the distance between the cameras. Therefore, a better resolution allows to highlight position differences more clearly when the objects are far from the cameras.
The images acquired by the stereo vision system have slightly different viewpoints; the depth can be obtained by using the different position of the objects in the two images.
If we consider a point P as belonging to the scene, we clearly see it in two different positions I1 and I2 on the two right and left images. If u1 and u2 denote the distances between these positions and the optical axes of the cameras, then the difference u1 − u2 represents the disparity (see Fig. 12 and 13).
Fig. 11. Rail image taken from the two cameras (red and blue images)
If we make each pixel of the left image correspond to one of the image on the right, we obtain the disparity image [21, 22] including the depth information extracted. Since the cameras cover different areas of the scene, the disparity image will include only the information in the area which gathers the data derived from both the cameras.
Therefore, apart from the areas uncovered by either image, the disparity could not be determined in other parts of the scene. In general, therefore, the disparity image determined in real contexts does not include data on all the points which can be seen by the two cameras.
For this application the object, whose third dimension should be investigated, needs to be reproduced, so that the superimposition area is larger where the depth is to be extracted.
618 Marco Guerrieri et al. / Procedia - Social and Behavioral Sciences 53 ( 2012 ) 611 – 621
Fig. 12. The projections I1 and I2 of a point P on the two images
Fig. 13. Rail “disparity” image Fig. 14. References to the 3D space and images
4.1. The Correspondences
In producing the disparity image [21, 22] the first problem to solve is the correspondence, that is the search for the projection of the same physical point in the two images (matching-point technique). This problem is dealt with global or local methods. By means of local methods one image is analyzed to find the correspondence with a small region coming from the other image. This analysis is carried out by employing such features as angles or rectilinear line segments (in feature-based methods), or by means of correlation operators (in area-basedmethods). Global methods complete local methods with such general information as the continuity of the surfaces or the presence of particular textures on the scene. Each method for correspondence search has peculiarities which make it more effective in certain contexts. Feature-based methods, for instance, are more suitable for interiors of buildings, where the space has lots of rectilinear surfaces, while area-based techniques are applicable to a broader range of situations. The fast evaluation of disparities is a hard task. The major problems which can lead to the incorrect relationship between two non-corresponding points are caused by: • occlusions: cameras are located in different positions, therefore it is possible for some objects to be partially
visible or to be seen only in either image; • distortion: owing to the perspective projection, the same object can be differently projected onto the two
images; • different parameters of the two cameras: if either camera is out of focus at the same distance as the other, or
if it has a different opening of the diaphragm, the corresponding points have different characteristics in the two images;
• specular reflections; • sensor noise.
In the present paper we have implemented an algorithm which takes into account both the continuity and colorimetrically uniform texture of the rail surface and searches, by mutual correlation, for the correspondences between the left and right images through a window of constant dimensions equal to 11 rows and 11 columns.
4.2. The Calibration
In an ideal space the cameras of a stereo head answer the pinhole model, have exactly the same focal length and parallel optical axes. In the real world, unfortunately, lenses introduce some distortions, can have different focal lengths and misaligned optical axes. Calibration [18, 19, 23] aims at establishing two sets of intrinsic and
619 Marco Guerrieri et al. / Procedia - Social and Behavioral Sciences 53 ( 2012 ) 611 – 621
extrinsic parameters, which are able to compensate for the imperfection of the stereo head. Intrinsic parameters adjust lens distortions and the difference in focal length, while the extrinsic ones determine the spatial offset of the two cameras, including the distance between them and the deviation from the parallelism of optical axes. By means of these parameters it is possible to convert the acquired images into ideal images, just as those seen by pinhole cameras with parallel optical axes.
4.3. Projection And Reprojection
If calibration parameters are known, it is possible to carry out a more detailed analysis of the operations which allow to move from a three-dimensional scene to right and left images and from a disparity image to a 3D reconstruction [24]. The projection matrix P converts 3D coordinates into ideal image coordinates. The reference systems are chosen so as to make the calculations simpler; they are illustrated in Figure 15 (in general, reference systems for 3D space and images are selected so as to have the X-axis parallel to the u-axis and the Y-axis parallel to the v axis. (The Z-axis is perpendicular to the images). There is a projection matrix for the left camera and one for the right one. If they are known, it is possible to project a point of coordinates [X Y Z]T, represented in homogeneous coordinates [X Y Z 1]T, into coordinates [u v]T of the image through the following matrix multiplication:
(13)
(14)
In matrix P there are the values obtained by calibration procedures, especially the focal length (Fx e Fy, in pixel), the coordinates of the optical centre (Cx e Cy, in pixel), the translation with regard to the left camera (Tx, in mm, is equal to 0 for the left image matrix); the coordinates of the point in the ideal image are [u/w v/w]T. Vice versa, the reprojection matrix Q allows to obtain the spatial coordinates of a point, provided that the disparity is known:
(15)
(16)
The values in matrix Q reflect those present in matrix P for the left image, except Cx', which is extracted by the right image matrix. The coordinates of the reprojected point are therefore equal to [X/W Y/W Z/W]T. The
620 Marco Guerrieri et al. / Procedia - Social and Behavioral Sciences 53 ( 2012 ) 611 – 621
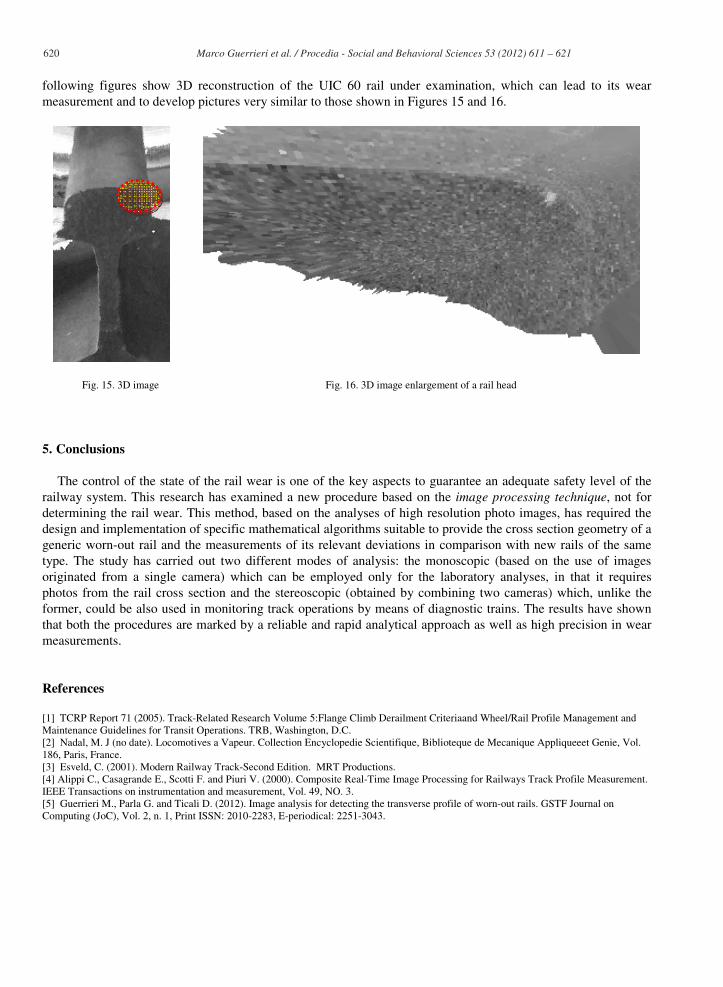
following figures show 3D reconstruction of the UIC 60 rail under examination, which can lead to its wear measurement and to develop pictures very similar to those shown in Figures 15 and 16.
Fig. 15. 3D image Fig. 16. 3D image enlargement of a rail head
5. Conclusions
The control of the state of the rail wear is one of the key aspects to guarantee an adequate safety level of the railway system. This research has examined a new procedure based on the image processing technique, not for determining the rail wear. This method, based on the analyses of high resolution photo images, has required the design and implementation of specific mathematical algorithms suitable to provide the cross section geometry of a generic worn-out rail and the measurements of its relevant deviations in comparison with new rails of the same type. The study has carried out two different modes of analysis: the monoscopic (based on the use of images originated from a single camera) which can be employed only for the laboratory analyses, in that it requires photos from the rail cross section and the stereoscopic (obtained by combining two cameras) which, unlike the former, could be also used in monitoring track operations by means of diagnostic trains. The results have shown that both the procedures are marked by a reliable and rapid analytical approach as well as high precision in wear measurements.
References
[1] TCRP Report 71 (2005). Track-Related Research Volume 5:Flange Climb Derailment Criteriaand Wheel/Rail Profile Management and Maintenance Guidelines for Transit Operations. TRB, Washington, D.C. [2] Nadal, M. J (no date). Locomotives a Vapeur. Collection Encyclopedie Scientifique, Biblioteque de Mecanique Appliqueeet Genie, Vol. 186, Paris, France. [3] Esveld, C. (2001). Modern Railway Track-Second Edition. MRT Productions. [4] Alippi C., Casagrande E., Scotti F. and Piuri V. (2000). Composite Real-Time Image Processing for Railways Track Profile Measurement. IEEE Transactions on instrumentation and measurement, Vol. 49, NO. 3. [5] Guerrieri M., Parla G. and Ticali D. (2012). Image analysis for detecting the transverse profile of worn-out rails. GSTF Journal on Computing (JoC), Vol. 2, n. 1, Print ISSN: 2010-2283, E-periodical: 2251-3043.
621 Marco Guerrieri et al. / Procedia - Social and Behavioral Sciences 53 ( 2012 ) 611 – 621
[6] Guerrieri M., Parla G. and Ticali D. (2012). A theoretical and experimental approach to reconstructing the transverse profile of worn-out rails. Ingegneria Ferroviaria , January 2012, (pp. 23-37), ISSN: 0020-0956. [7] Guerrieri M., Ticali D. (2012). Sustainable mobility in park areas: the potential offered by guided transport systems. International Conference on Sustainable Design and Construction, March 23-25, 2011, Kansas City, Missouri, ASCE (2012). Volume: ICSDC 2011, Integrating Sustainability Practices in the Construction Industry, pp. 661-668, ISBN 9780784412046, ASCE Conf. Proc. doi:10.1061/41204(426)81. [8] Guerrieri M., Ticali D. (2012). Design standards for converting disused railway lines into greenways. International Conference on Sustainable Design and Construction, March 23-25, 2011, Kansas City, Missouri ASCE (2012). Volume: ICSDC 2011, Integrating Sustainability Practices in the Construction Industry, (pp. 654-660), ISBN 9780784412046, ASCE Conf. Proc. doi:10.1061/41204(426)80. [9] Bruno L., Parla G., Celauro, C. (2012). Image analysis for detecting aggregate gradation in asphalt mixture from planar images. Construction and Building Materials, 28 (1) , pp. 21-30. [10] Canny J. (1986). A computational approach to edge detection. PAMI(8), No. 6, (pp. 679-698). [11] Gonzales R.C., Woods R. E. (2002). Digital Image Processing 2nd ed. Prentice Hall, Upper Saddle River, New Jersey. [12] Gonzales R.C., Woods R.E, Eddins S.L. (2004). Digital image processing using Matlab. Prentice Hall, Upper Saddle River (New Jersey) [13] Serra J. (1982). Image analysis and mathematical morphology. London, Academic Press. [14] Freeman, H., (1961). Computer Processing of Line Drawing Images. Computing Surveys. 6(1):57-97. [15] TrouillotX., JourlinM. and J.C. Pinoli (2008). Geometric parameters computation with freeman code. Submitted to Image anal stereol, 6 pages. [16] RFI (2002). Procedura operativa subdirezionale DMAIMSD P0 IFS 002 0 del 16.01.02, Rilievi della geometria del binario e relative disposizioni manutentive, Rete Ferroviaria Italiana. [17] Hartley R., Zisserman A. (2003). Multiple View Geometry in Computer Vision 2nd edition. Cambridge University Press, 2003. [18] Hartley R., Zisserman A. (2000). Multiple View geometry in Computer Vision. Cambridge University Press, 2000. [19] Faugeras O. (1993). Three-Dimentional Computer Vision. MIT Press, Cambridge, MA (pp. 33-68). [20] Zhang Z. (1998). Determining the epipolar geometry and its uncertainty: A review. International Journal of Computer Vision, 27(2), (pp. 161-195). [21] Kanade T., Okutomi M. (1994). A stereo matching algorithm with an adaptive window: Theory and experiments. IEEE Transactions on Pattern Analysis and Machine Intelligence, 16(9), (pp- 920-932). [22] Marr D., Poggio T. (1976). Cooperative computation of stereo disparity. Science,194, (pp 283-287). [23] Tsai R. Y. (1987). A Versatile Camera Calibration Technique for 3D Machine Vision. IEEE J. Robotics&Automation, RA-3, No. 4, (pp. 323-344). [24] Hartley R. I., Sturn P. (1995). Triangulation. ARPA Image Understanding Workshop, Prague, Czech Republic.