116
U.S. International Trade Commission Publication 4499 November 2014 Washington, DC 20436 Monosodium Glutamate From China and Indonesia Investigation Nos. 731-TA-1229-1230 (Final)
U.S. International Trade CommissionPublication 4499 November 2014
Washington, DC 20436
Monosodium Glutamate From China and Indonesia
Investigation Nos. 731-TA-1229-1230 (Final)
U.S. International Trade Commission
COMMISSIONERS
Meredith M. Broadbent, Chairman Dean A. Pinkert, Vice Chairman
Irving A. Williamson David S. Johanson
F. Scott Kieff Rhonda K. Schmidtlein
Karen Laney
Staff assigned
Address all communications to Secretary to the Commission
United States International Trade Commission Washington, DC 20436
Acting Director of Operations
Amy Sherman, Investigator Brian Allen, Industry Analyst Michele Breaux, Economist
Mary Klir, Accountant Russell Duncan, Statistician Patrick Gallagher, Attorney
Elizabeth Haines, Supervisory Investigator
U.S. International Trade CommissionWashington, DC 20436
www.usitc.gov
Publication 4499 November 2014
Monosodium Glutamate From China and Indonesia
Investigation Nos. 731-TA-1229-1230 (Final)

CONTENTS Page
i
Determinations ............................................................................................................................... 1
Views of the Commission ............................................................................................................... 3
Part I: Introduction ................................................................................................................ I‐1
Background ................................................................................................................................ I‐1
Statutory criteria and organization of the report ..................................................................... I‐2
Statutory criteria ................................................................................................................... I‐2
Organization of report ........................................................................................................... I‐3
Market summary ....................................................................................................................... I‐3
Summary data and data sources ............................................................................................... I‐4
Previous and related investigations .......................................................................................... I‐4
Nature and extent of sales at LTFV ........................................................................................... I‐4
Sales at LTFV .......................................................................................................................... I‐4
The subject merchandise .......................................................................................................... I‐5
Commerce’s scope ................................................................................................................ I‐5
Tariff treatment ..................................................................................................................... I‐6
The product ............................................................................................................................... I‐7
Description and applications ................................................................................................. I‐7
Manufacturing processes ...................................................................................................... I‐8
Domestic like product issues ..................................................................................................... I‐9
Part II: Conditions of competition in the U.S. market ............................................................ II‐1
U.S. market characteristics ....................................................................................................... II‐1
U.S. purchasers ......................................................................................................................... II‐1
Channels of distribution ........................................................................................................... II‐1
Geographic distribution ........................................................................................................... II‐2
Supply and demand considerations ......................................................................................... II‐3
U.S. supply ............................................................................................................................ II‐3
U.S. demand ......................................................................................................................... II‐6
CONTENTS Page
ii
Part II: Conditions of competition in the U.S. market‐‐Continued
Substitutability issues ............................................................................................................... II‐8
Lead times ............................................................................................................................ II‐8
Knowledge of country sources ............................................................................................. II‐8
Factors affecting purchasing decisions................................................................................. II‐9
Comparisons of domestic products, subject imports, and nonsubject imports ................ II‐11
Comparison of U.S.‐produced and imported MSG ............................................................ II‐11
Elasticity estimates ................................................................................................................. II‐14
U.S. supply elasticity ........................................................................................................... II‐14
U.S. demand elasticity ........................................................................................................ II‐15
Substitution elasticity ......................................................................................................... II‐15
Part III: U.S. producers’ production, shipments, and employment ....................................... III‐1
U.S. producer ........................................................................................................................... III‐1
U.S. production, capacity, and capacity utilization ................................................................. III‐2
AJINA’s U.S. shipments and exports ........................................................................................ III‐3
AJINA’s inventories .................................................................................................................. III‐3
U.S. producers’ imports ........................................................................................................... III‐3
U.S. employment, wages, and productivity ............................................................................ III‐4
Part IV: U.S. imports, apparent U.S. consumption, and market shares ................................ IV‐1
U.S. importers.......................................................................................................................... IV‐1
U.S. imports ............................................................................................................................. IV‐2
Critical circumstances .............................................................................................................. IV‐6
Negligibility .............................................................................................................................. IV‐8
Cumulation considerations ..................................................................................................... IV‐8
Geographical markets ......................................................................................................... IV‐8
Presence in the market ....................................................................................................... IV‐9
Apparent U.S. consumption and market shares ................................................................... IV‐10
Ratio of imports to U.S. production ...................................................................................... IV‐12
CONTENTS Page
iii
Part V: Pricing data ............................................................................................................... V‐1
Factors affecting prices ............................................................................................................ V‐1
Raw material costs ............................................................................................................... V‐1
Transportation costs to the U.S. market .............................................................................. V‐2
Pricing practices ....................................................................................................................... V‐2
Pricing methods .................................................................................................................... V‐2
Sales terms and discounts .................................................................................................... V‐4
Price leadership .................................................................................................................... V‐5
Price data .................................................................................................................................. V‐5
Price trends ........................................................................................................................... V‐6
Price comparisons ................................................................................................................ V‐7
Lost sales and lost revenue ...................................................................................................... V‐7
Financial experience of the U.S. producer ............................................................... VI‐1 Part VI:
Introduction ............................................................................................................................. VI‐1
Operations on MSG ................................................................................................................. VI‐1
Variance analysis ................................................................................................................. VI‐3
Capital expenditures, research and development expenses, and total assets ................... VI‐3
Capital and investment ........................................................................................................ VI‐4
Part VII: Threat considerations and information on nonsubject countries .......................... VII‐1
The industry in China .............................................................................................................. VII‐2
The industry in Indonesia ....................................................................................................... VII‐3
U.S. inventories of imported merchandise ............................................................................ VII‐5
Antidumping or countervailing duty orders in third‐country markets .................................. VII‐5
Information on nonsubject countries .................................................................................... VII‐6
CONTENTS Page
iv
Appendixes
A. Federal Register notices ................................................................................................. A‐1
B. List of hearing witnesses ................................................................................................ B‐1
C. Summary data ................................................................................................................ C‐1
D. Nonsubject country price data ....................................................................................... D‐1
E. Reported financial data for Akzo Nobel ......................................................................... E‐1
Note.—Information that would reveal confidential operations of individual concerns may not
be published and therefore has been deleted. Such deletions are indicated by asterisks.
1
UNITED STATES INTERNATIONAL TRADE COMMISSION
Investigation Nos. 731‐TA‐1229‐1230 (Final)
MONOSODIUM GLUTAMATE FROM CHINA AND INDONESIA DETERMINATION
On the basis of the record1 developed in the subject investigations, the United States International Trade Commission (“Commission”) determines,2 pursuant to section 735(b) of the Tariff Act of 1930 (19 U.S.C. ' 1673d(b)) (“the Act”), that an industry in the United States is materially injured by reason of imports from China and Indonesia of monosodium glutamate, provided for in subheading 2922.42.10 of the Harmonized Tariff Schedule of the United States, that have been found by the Department of Commerce (“Commerce”) to be sold in the United States at less than fair value (LTFV).3
BACKGROUND
The Commission instituted these investigations effective September 16, 2013, following receipt of a petition filed with the Commission and Commerce by Ajinomoto North America Inc. (“AJINA”), Itasca, Illinois. The final phase of the investigations was scheduled by the Commission following notification of preliminary determinations by Commerce that imports of monosodium glutamate from China and Indonesia were being sold at LTFV within the meaning of section 733(b) of the Act (19 U.S.C. ' 1673b(b)). Notice of the scheduling of the final phase of the Commission=s investigations and of a public hearing to be held in connection therewith was given by posting copies of the notice in the Office of the Secretary, U.S. International Trade Commission, Washington, DC, and by publishing the notice in the Federal Register of June 18, 2014 (79 FR 34782). The hearing was held in Washington, DC, on September 23, 2014, and all persons who requested the opportunity were permitted to appear in person or by counsel.
1 The record is defined in sec. 207.2(f) of the Commission=s Rules of Practice and Procedure (19 CFR '
207.2(f)). 2 Commissioner F. Scott Kieff did not participate in these investigations. 3 The Commission also finds that imports subject to Commerce's affirmative critical circumstances
determination are not likely to undermine seriously the remedial effect of the antidumping duty order on China.

3
Views of the Commission
Based on the record in the final phase of these investigations, we find that an industry in the United States is materially injured by reason of subject imports of monosodium glutamate (“MSG”) from China and Indonesia found by the U.S. Department of Commerce (“Commerce”) to be sold in the United States at less than fair value. We also find that critical circumstances do not exist with respect to imports of monosodium glutamate from China that are covered by Commerce’s final affirmative critical circumstances determination.
Background I.
The petition in these investigations was filed on September 16, 2013, by Ajinomoto North America, Inc. (“AJINA”), a domestic producer of MSG. AJINA appeared at the hearing and submitted prehearing and posthearing briefs.
One respondent interested party participated actively in the final phase of these investigations. PT. Cheil Jedang Indonesia, an Indonesian producer of subject merchandise, and its related importer, CJ America, Inc. (jointly, “CJ”), appeared at the hearing and submitted prehearing and posthearing briefs.
U.S. industry data are based on the questionnaire response of domestic producer AJINA, which accounted for 100 percent of U.S. production of MSG during the January 2011‐June 2014 period of investigation (“POI”).1 U.S. import data are based on official Commerce import statistics and questionnaire responses from 11 U.S. importers of MSG over the POI. They accounted for *** percent of imports from China, virtually all imports from Indonesia, and *** percent of imports from nonsubject sources for the POI.2 The Commission received three responses to its questionnaires from foreign producers/exporters in Indonesia accounting for *** percent of subject MSG production.3 The Commission sent foreign producer/exporter questionnaires to 15 firms in China; one responded, but did not provide complete data.4
Domestic Like Product II.
A. In General
In determining whether an industry in the United States is materially injured or threatened with material injury by reason of imports of subject merchandise, the Commission first defines the “domestic like product” and the “industry.”5 Section 771(4)(A) of the Tariff Act of 1930, as amended (“the Tariff Act”), defines the relevant domestic industry as the “producers as a whole of a domestic like product, or those producers whose collective output
1 Confidential Report (“CR”) at I‐1, I‐5; Public Report (“PR”) at I‐1, I‐4. 2 CR at I‐5 and IV‐1, PR at I‐4 and IV‐1. 3 CR at VII‐6 to VII‐7, PR at VII‐4. 4 CR at VII‐4, PR at VII‐3. 5 19 U.S.C. § 1677(4)(A).
4
of a domestic like product constitutes a major proportion of the total domestic production of the product.”6 In turn, the Tariff Act defines “domestic like product” as “a product which is like, or in the absence of like, most similar in characteristics and uses with, the article subject to an investigation.”7
The decision regarding the appropriate domestic like product in an investigation is a factual determination, and the Commission has applied the statutory standard of “like” or “most similar in characteristics and uses” on a case‐by‐case basis.8 No single factor is dispositive, and the Commission may consider other factors it deems relevant based on the facts of a particular investigation.9 The Commission looks for clear dividing lines among possible like products and disregards minor variations.10 Although the Commission must accept Commerce’s determination as to the scope of the imported merchandise that is subsidized or sold at less than fair value,11 the Commission determines what domestic product is like the imported articles Commerce has identified.12
B. Product Description
Commerce defined the scope of the imported merchandise under investigation as:
6 19 U.S.C. § 1677(4)(A). 7 19 U.S.C. § 1677(10). 8 See, e.g., Cleo Inc. v. United States, 501 F.3d 1291, 1299 (Fed. Cir. 2007); NEC Corp. v. Department of
Commerce, 36 F. Supp. 2d 380, 383 (Ct. Int’l Trade 1998); Nippon Steel Corp. v. United States, 19 CIT 450, 455 (1995); Torrington Co. v. United States, 747 F. Supp. 744, 749 n.3 (Ct. Int’l Trade 1990), aff’d, 938 F.2d 1278 (Fed. Cir. 1991) (“every like product determination ‘must be made on the particular record at issue’ and the ‘unique facts of each case’”). The Commission generally considers a number of factors, including the following: (1) physical characteristics and uses; (2) interchangeability; (3) channels of distribution; (4) customer and producer perceptions of the products; (5) common manufacturing facilities, production processes, and production employees; and, where appropriate, (6) price. See Nippon, 19 CIT at 455 n.4; Timken Co. v. United States, 913 F. Supp. 580, 584 (Ct. Int’l Trade 1996).
9 See, e.g., S. Rep. No. 96‐249 at 90‐91 (1979). 10 Nippon, 19 CIT at 455; Torrington, 747 F. Supp. at 748‐49; see also S. Rep. No. 96‐249 at 90‐91
(Congress has indicated that the like product standard should not be interpreted in “such a narrow fashion as to permit minor differences in physical characteristics or uses to lead to the conclusion that the product and article are not ‘like’ each other, nor should the definition of ‘like product’ be interpreted in such a fashion as to prevent consideration of an industry adversely affected by the imports under consideration.”).
11 See, e.g., USEC, Inc. v. United States, 34 Fed. Appx. 725, 730 (Fed. Cir. 2002) (“The ITC may not modify the class or kind of imported merchandise examined by Commerce.”); Algoma Steel Corp. v. United States, 688 F. Supp. 639, 644 (Ct. Int’l Trade 1988), aff’d, 865 F.3d 240 (Fed. Cir.), cert. denied, 492 U.S. 919 (1989).
12 Hosiden Corp. v. Advanced Display Mfrs., 85 F.3d 1561, 1568 (Fed. Cir. 1996) (the Commission may find a single like product corresponding to several different classes or kinds defined by Commerce); Cleo, 501 F.3d at 1298 n.1 (“Commerce’s {scope} finding does not control the Commission’s {like product} determination.”); Torrington, 747 F. Supp. at 748‐52 (affirming the Commission’s determination defining six like products in investigations in which Commerce found five classes or kinds).
5
MSG, whether or not blended or in solution with other products. Specifically, MSG that has been blended or is in solution with other product(s) is included in this scope when the resulting mix contains 15% or more of MSG by dry weight. Products with which MSG may be blended include, but are not limited to, salts, sugars, starches, maltodextrins, and various seasonings. Further, MSG is included in these investigations regardless of physical form (including, but not limited to, substrates, solutions, dry powders of any particle size, or unfinished forms such as MSG slurry), end‐use application, or packaging. MSG in monohydrate form has a molecular formula of C5H8NO4Na•H2O, a Chemical Abstract Service (CAS) registry number of 6106‐04‐3, and a Unique Ingredient Identifier (UNII) number of W81N5U6R6U. MSG in anhydrous form has a molecular formula of C55H8NO4Na, a CAS registry number of 142‐47‐2, and a UNII number of C3C196L9FG.13
MSG is a white crystalline substance (a salt of glutamic acid) used worldwide, by itself or in blends, primarily as a flavor enhancer in savory foods, such as meat and fish, soups and broths, certain juices and beverages, frozen and ready‐made foods, and sauces and dressings. It is used in smaller volumes in nonfood products, such as detergents, cosmetics, and pharmaceuticals.14
C. Domestic Like Product Analysis
In the preliminary determinations, the Commission defined a single domestic like product, consisting of MSG within Commerce’s scope definition. The Commission found that all MSG within the scope definition shared the same physical characteristics, chemical formula, and uses.15 MSG is a highly stable, odorless sodium salt of the amino acid glutamic acid that corresponds to the molecular formula C5H8NO4Na in anhydrous form or C5H10NNaO5 in monohydrate form. Although MSG may be produced in various crystal sizes or to specific standards, these variances do not change or alter MSG’s chemical structure or basic physical
13 Monosodium Glutamate From the People’s Republic of China: Final Determination of Sales at Less
Than Fair Value and the Final Affirmative Determination of Critical Circumstances, 78 Fed. Reg. (September 29, 2014). Commerce explained that the merchandise covered by the scope of these investigations is currently classified in the Harmonized Tariff Schedule (“HTS”) of the United States at subheading 2922.42.10.00, but may also enter under HTS subheadings 2922.42.50.00, 2103.90.72.00, 2103.90.74.00, 2103.90.78.00, 2103.90.80.00, and 2103.90.90.91. It provided the tariff classifications, CAS registry number, and the UNII number for convenience and customs purposes and clarified that the written description of the scope is dispositive.
14 CR at I‐8 to I‐10, PR at I‐7 to I‐8. 15 Monosodium Glutamate From China and Indonesia, Inv. Nos. 701‐TA‐503‐504 and 731‐TA‐1229‐
1230 (Preliminary), USITC Pub. 4437 at 6 (Nov. 2013).
6
characteristics.16 The Commission found that manufacturers use three basic steps to manufacture MSG: fermentation, isolation, and purification. Different forms or sizes of MSG may be produced in the same production facilities, using the same employees and processes, except that a different sieve is used to separate the various crystal sizes, sometimes even from the same production batch. The Commission found that MSG is distributed to end users and distributors, primarily in bags, boxes, and fiber drums.17 The Commission found that MSG of different crystal sizes are otherwise identical, although end users may prefer a particular crystal size for a specific application. Producers and customers perceived MSG to be a commodity because all domestically produced MSG had the same structure and imparted the same general qualities, regardless of its intended use. With respect to price, the Commission determined that purchasers generally do not differentiate MSG according to form, packaging size, or market segment.18
The Commission concluded that domestically produced MSG meeting the specifications of the scope definition shares similarities with respect to all of the six factors the Commission considers in its like product analysis. It consequently defined a single domestic like product, consisting of all MSG, as described in Commerce’s scope definition.19
The record in the final phase of these investigations does not contain any new information concerning the domestic like product factors, and no party has directly argued that the Commission should adopt a definition of the domestic like product that is different from that in the preliminary determinations.20 Therefore, for the same reasons set forth in the preliminary determinations, we define a single domestic like product consisting of all MSG, coextensive with the scope of the investigations.
16 USITC Pub. 4437 at 6. 17 USITC Pub. 4437 at 7. 18 USITC Pub. 4437 at 8. 19 USITC Pub. 4437 at 8. 20 Akzo Nobel Functional Chemicals LLC (“Akzo Nobel”) argued that it is a U.S. producer of the
domestic like product because it manufactures a product (***) that it asserts is encompassed within the scope definition (i.e., a mix containing 15 percent or more of MSG by dry weight). CR at I‐4 n.4 and I‐13, PR at I‐3 n.4 and I‐10; see also Akzo Nobel U.S. Producer Response at 36. Consequently, Akzo Nobel submitted a partial U.S. producer questionnaire response. AJINA argues that *** is not within the scope and Akzo Nobel is not a domestic producer of MSG because ***. AJINA Postconference Brief at 3.
The product manufactured by Akzo Nobel, ***, does not appear to be merchandise described by the scope because it has a different chemical formula from the MSG described in the scope. Moreover, the MSG used by Akzo Nobel in its manufacturing process is not “mixed” or “blended,” but is consumed in producing a different chemical compound, namely the ***. See CR at I‐14 to I‐16, PR at I‐10 to I‐11. Therefore, we find that Akzo Nobel is not a producer of the domestic like product and is not a member of the domestic industry. No party requested that the domestic like product be defined more broadly than the scope.
7
Domestic Industry III.
The domestic industry is defined as the domestic “producers as a whole of a domestic like product, or those producers whose collective output of a domestic like product constitutes a major proportion of the total domestic production of the product.”21 In defining the domestic industry, the Commission’s general practice has been to include in the industry producers of all domestic production of the like product, whether toll‐produced, captively consumed, or sold in the domestic merchant market.
In the preliminary determinations, the Commission defined the U.S industry to encompass the sole U.S. producer of MSG, namely AJINA.22 There are no related party issues in these investigations.23 In light of our definition of the domestic like product, we define the domestic industry as the sole U.S. producer of MSG, AJINA.
Cumulation24 IV.
For purposes of evaluating the volume and price effects for a determination of material injury by reason of subject imports, section 771(7)(G)(i) of the Tariff Act requires the
21 19 U.S.C. § 1677(4)(A). 22 Monosodium Glutamate From China and Indonesia, Inv. Nos. 701‐TA‐503‐504 and 731‐TA‐1229‐
1230 (Preliminary) USITC Pub. 4437 (Nov. 2013), at 9‐10. Petitioner AJINA argues that the Commission should continue to define the domestic industry as encompassing the sole U.S. producer of MSG, AJINA. AJINA Prehearing Brief at 16 and Posthearing Brief at 3; CR at I‐4, PR at I‐3. Respondent CJ did not comment on the definition of the domestic industry.
23 In the preliminary determinations, the Commission found that AJINA was indirectly related to one subject producer in China and three subject producers in Indonesia, but found that AJINA was not a related party. The Commission found that none of AJINA’s affiliates in China or Indonesia exported MSG to the United States and that AJINA did not import into the United States any MSG from China or Indonesia during the POI. Thus, absent any indication that the third party affiliate controlling AJINA also controlled “an exporter of the subject merchandise” or that AJINA itself imported subject merchandise, the Commission found that AJINA was not a related party. USITC Pub. 4437 at 9. The record is the same in the final phase with respect to the nature of these relationships, so the same finding is warranted. CR at III‐2 and n.3, PR at III‐1 and n.3; see also Petition, Vol. I at 3 n.4.
24 Pursuant to Section 771(24) of the Tariff Act, imports from a subject country of merchandise corresponding to a domestic like product that account for less than 3 percent of all such merchandise imported into the United States during the most recent 12 months for which data are available preceding the filing of the petition shall be deemed negligible. 19 U.S.C. §§ 1671b(a), 1673b(a), 1677(24)(A)(i), 1677(24)(B); see also 15 C.F.R. § 2013.1 (developing countries for purposes of 19 U.S.C. § 1677(36)). Negligibility is not an issue in these investigations. Based on questionnaire response data and official import statistics, subject imports from China and Indonesia each exceeded the requisite statutory negligibility threshold for the most recent 12‐month period preceding the filing of the petition. From September 2012 to August 2013, U.S. imports from China accounted for 73.6 percent of total U.S. imports of MSG, by quantity, and U.S. imports from Indonesia accounted for 15.9 percent of total U.S. imports. CR at IV‐9, PR at IV‐8.
8
Commission to cumulate subject imports from all countries as to which petitions were filed and/or investigations self‐initiated by Commerce on the same day, if such imports compete with each other and with the domestic like product in the U.S. market. In assessing whether subject imports compete with each other and with the domestic like product, the Commission generally has considered four factors:
(1) the degree of fungibility between subject imports from different countries and between subject imports and the domestic like product, including consideration of specific customer requirements and other quality related questions;
(2) the presence of sales or offers to sell in the same geographic markets of subject imports from different countries and the domestic like product;
(3) the existence of common or similar channels of distribution for subject imports from different countries and the domestic like product; and
(4) whether the subject imports are simultaneously present in the market.25
While no single factor is necessarily determinative, and the list of factors is not
exclusive, these factors are intended to provide the Commission with a framework for determining whether the subject imports compete with each other and with the domestic like product.26 Only a “reasonable overlap” of competition is required.27
The threshold requirement for cumulation is satisfied because the petitioner filed the antidumping petitions with respect to imports from China and Indonesia on the same day, September 16, 2013.28 As discussed below, we find there to be a reasonable overlap of competition between subject imports from China and Indonesia, and between subject imports from each subject country and the domestic like product.29
25 See Certain Cast‐Iron Pipe Fittings from Brazil, the Republic of Korea, and Taiwan, Inv. Nos. 731‐TA‐
278‐280 (Final), USITC Pub. 1845 (May 1986), aff’d, Fundicao Tupy, S.A. v. United States, 678 F. Supp. 898 (Ct. Int’l Trade), aff’d, 859 F.2d 915 (Fed. Cir. 1988).
26 See, e.g., Wieland Werke, AG v. United States, 718 F. Supp. 50 (Ct. Int’l Trade 1989). 27 The Statement of Administrative Action (SAA) to the Uruguay Round Agreements Act (URAA),
expressly states that “the new section will not affect current Commission practice under which the statutory requirement is satisfied if there is a reasonable overlap of competition.” H.R. Rep. No. 103‐316, Vol. I at 848 (1994) (citing Fundicao Tupy, S.A. v. United States, 678 F. Supp. at 902; see Goss Graphic Sys., Inc. v. United States, 33 F. Supp. 2d 1082, 1087 (Ct. Int’l Trade 1998) (“cumulation does not require two products to be highly fungible”); Wieland Werke, AG, 718 F. Supp. at 52 (“Completely overlapping markets are not required.”).
28 CR/PR at I‐1. None of the statutory exceptions to cumulation applies. 29 Petitioner AJINA argues that the Commission should cumulate subject imports from China and
Indonesia. AJINA Prehearing Brief at 19‐22. Respondent CJ has not contested cumulation for purposes (Continued...)
9
Fungibility. The record indicates that MSG is generally fungible. MSG from China, Indonesia, and the United States is produced to the same standards, including the Food Chemicals Codes (“FCC”) when sold as a food additive and the U.S. Pharmacopeia (“USP”) specifications when sold for pharmaceutical uses.30 The Commission collected pricing data on products of varying crystal sizes and packaging and these data show that the domestic industry and subject producers from China and Indonesia sold overlapping products in the U.S. market.31
All responding importers, the U.S. producer, and the majority of purchasers reported that subject imports from China and Indonesia are at least sometimes interchangeable with each other and with the domestic like product.32 Pluralities or majorities of purchasers reported that subject imports from China and Indonesia were “comparable” with respect to the domestic like product and to each other with respect to each of 14 non‐price purchasing factors.33 Thus, the record indicates that MSG products produced domestically and imported from China and Indonesia are generally fungible with one another.
Channels of Distribution. MSG, whether domestically produced or imported from China or Indonesia, is sold to end users and through distributors.34 During each full year of the POI, at least *** percent of shipments of the domestic like product, subject imports from China, and subject imports from Indonesia were sold to distributors and, during 2012 and 2013, at least *** percent of shipments of the domestic like product, subject imports from China, and subject imports from Indonesia were sold to end users. Thus, the record shows some overlap in channels of distribution among the three sources.
Geographic Overlap. The record indicates the domestic like product and subject imports were sold in the same geographic market. Both U.S. producers and importers of product from each of the subject countries reported selling MSG to all regions in the contiguous United States.35
Simultaneous Presence in Market. MSG produced in the United States and in China was sold in the United States during each quarter between January 2011 and June 2014; MSG produced in Indonesia was sold in the United States during each quarter between the fourth quarter of 2011 (when if first entered the U.S. market) and the fourth quarter of 2013.36 Therefore, MSG from all three sources was simultaneously present in the U.S. market for much of the POI.
(…Continued) of the Commission’s analysis of material injury by reason of subject imports. Indeed, CJ conceded this issue at the Commission’s hearing. See Hearing Transcript at 168 (Cunningham).
30 CR at II‐1, II‐18 to II‐20, PR at II‐1, II‐11 to II‐12. 31 CR/PR at Tables V‐3 to V‐5. 32 CR at II‐19, PR at II‐11, and CR/PR at Table II‐8. 33 CR/PR at Table II‐7. 34 CR at II‐2 to II‐3, PR at II‐1 to II‐2, and CR/PR at Table II‐1. U.S. imports of MSG from China were
sold mainly to distributors in 2013, but were sold more to end users in 2011 and 2012. U.S. imports of MSG from Indonesia were sold mostly to end users in 2012 and 2013, but were sold *** to distributors in 2011. Id.
35 CR/PR at II‐2, and CR/PR at Table II‐2; CR at IV‐10, PR at IV‐8 to IV‐9. 36 CR/PR at Table IV‐5.
10
Conclusion. The record indicates that there is a reasonable overlap of competition between and among the subject imports from China and Indonesia, and the domestic like product. We accordingly cumulate subject imports from China and Indonesia for our analysis of material injury by reason of subject imports.
Material Injury by Reason of Subject Imports V.
A. Legal Standards
In the final phase of antidumping and countervailing duty investigations, the Commission determines whether an industry in the United States is materially injured or threatened with material injury by reason of the imports under investigation.37 In making this determination, the Commission must consider the volume of subject imports, their effect on prices for the domestic like product, and their impact on domestic producers of the domestic like product, but only in the context of U.S. production operations.38 The statute defines “material injury” as “harm which is not inconsequential, immaterial, or unimportant.”39 In assessing whether the domestic industry is materially injured by reason of subject imports, we consider all relevant economic factors that bear on the state of the industry in the United States.40 No single factor is dispositive, and all relevant factors are considered “within the context of the business cycle and conditions of competition that are distinctive to the affected industry.”41
Although the statute requires the Commission to determine whether the domestic industry is “materially injured or threatened with material injury by reason of” unfairly traded imports,42 it does not define the phrase “by reason of,” indicating that this aspect of the injury analysis is left to the Commission’s reasonable exercise of its discretion.43 In identifying a causal link, if any, between subject imports and material injury to the domestic industry, the Commission examines the facts of record that relate to the significance of the volume and price effects of the subject imports and any impact of those imports on the condition of the domestic industry. This evaluation under the “by reason of” standard must ensure that subject imports
37 19 U.S.C. §§ 1671d(b), 1673d(b). 38 19 U.S.C. § 1677(7)(B). The Commission “may consider such other economic factors as are relevant
to the determination” but shall “identify each {such} factor ... and explain in full its relevance to the determination.” 19 U.S.C. § 1677(7)(B).
39 19 U.S.C. § 1677(7)(A). 40 19 U.S.C. § 1677(7)(C)(iii). 41 19 U.S.C. § 1677(7)(C)(iii). 42 19 U.S.C. §§ 1671d(a), 1673d(a). 43 Angus Chemical Co. v. United States, 140 F.3d 1478, 1484‐85 (Fed. Cir. 1998) (“{T}he statute does
not ‘compel the commissioners’ to employ {a particular methodology}.”), aff’g, 944 F. Supp. 943, 951 (Ct. Int’l Trade 1996).
11
are more than a minimal or tangential cause of injury and that there is a sufficient causal, not merely a temporal, nexus between subject imports and material injury.44
In many investigations, there are other economic factors at work, some or all of which may also be having adverse effects on the domestic industry. Such economic factors might include nonsubject imports; changes in technology, demand, or consumer tastes; competition among domestic producers; or management decisions by domestic producers. The legislative history explains that the Commission must examine factors other than subject imports to ensure that it is not attributing injury from other factors to the subject imports, thereby inflating an otherwise tangential cause of injury into one that satisfies the statutory material injury threshold.45 In performing its examination, however, the Commission need not isolate the injury caused by other factors from injury caused by unfairly traded imports.46 Nor does the
44 The Federal Circuit, in addressing the causation standard of the statute, observed that “{a}s long as
its effects are not merely incidental, tangential, or trivial, the foreign product sold at less than fair value meets the causation requirement.” Nippon Steel Corp. v. USITC, 345 F.3d 1379, 1384 (Fed. Cir. 2003). This was further ratified in Mittal Steel Point Lisas Ltd. v. United States, 542 F.3d 867, 873 (Fed. Cir. 2008), where the Federal Circuit, quoting Gerald Metals, Inc. v. United States, 132 F.3d 716, 722 (Fed. Cir. 1997), stated that “this court requires evidence in the record ‘to show that the harm occurred “by reason of” the LTFV imports, not by reason of a minimal or tangential contribution to material harm caused by LTFV goods.’” See also Nippon Steel Corp. v. United States, 458 F.3d 1345, 1357 (Fed. Cir. 2006); Taiwan Semiconductor Industry Ass’n v. USITC, 266 F.3d 1339, 1345 (Fed. Cir. 2001).
45 SAA at 851‐52 (“{T}he Commission must examine other factors to ensure that it is not attributing injury from other sources to the subject imports.”); S. Rep. 96‐249 at 75 (1979) (the Commission “will consider information which indicates that harm is caused by factors other than less‐than‐fair‐value imports.”); H.R. Rep. 96‐317 at 47 (1979) (“in examining the overall injury being experienced by a domestic industry, the ITC will take into account evidence presented to it which demonstrates that the harm attributed by the petitioner to the subsidized or dumped imports is attributable to such other factors;” those factors include “the volume and prices of nonsubsidized imports or imports sold at fair value, contraction in demand or changes in patterns of consumption, trade restrictive practices of and competition between the foreign and domestic producers, developments in technology and the export performance and productivity of the domestic industry”); accord Mittal Steel, 542 F.3d at 877.
46 SAA at 851‐52 (“{T}he Commission need not isolate the injury caused by other factors from injury caused by unfair imports.”); Taiwan Semiconductor Industry Ass’n, 266 F.3d at 1345 (“{T}he Commission need not isolate the injury caused by other factors from injury caused by unfair imports ... . Rather, the Commission must examine other factors to ensure that it is not attributing injury from other sources to the subject imports.” (emphasis in original)); Asociacion de Productores de Salmon y Trucha de Chile AG v. United States, 180 F. Supp. 2d 1360, 1375 (Ct. Int’l Trade 2002) (“{t}he Commission is not required to isolate the effects of subject imports from other factors contributing to injury” or make “bright‐line distinctions” between the effects of subject imports and other causes.); see also Softwood Lumber from Canada, Inv. Nos. 701‐TA‐414 and 731‐TA‐928 (Remand), USITC Pub. 3658 at 100‐01 (Dec. 2003) (Commission recognized that “{i}f an alleged other factor is found not to have or threaten to have injurious effects to the domestic industry, i.e., it is not an ‘other causal factor,’ then there is nothing to further examine regarding attribution to injury”), citing Gerald Metals, 132 F.3d at 722 (the statute “does not suggest that an importer of LTFV goods can escape countervailing duties by finding some tangential or minor cause unrelated to the LTFV goods that contributed to the harmful effects on domestic market prices.”).
12
“by reason of” standard require that unfairly traded imports be the “principal” cause of injury or contemplate that injury from unfairly traded imports be weighed against other factors, such as nonsubject imports, which may be contributing to overall injury to an industry.47 It is clear that the existence of injury caused by other factors does not compel a negative determination.48
Assessment of whether material injury to the domestic industry is “by reason of” subject imports “does not require the Commission to address the causation issue in any particular way” as long as “the injury to the domestic industry can reasonably be attributed to the subject imports” and the Commission “ensure{s} that it is not attributing injury from other sources to the subject imports.”49 50 Indeed, the Federal Circuit has examined and affirmed various Commission methodologies and has disavowed “rigid adherence to a specific formula.”51
The Federal Circuit’s decisions in Gerald Metals, Bratsk, and Mittal Steel all involved cases where the relevant “other factor” was the presence in the market of significant volumes of price‐competitive nonsubject imports. The Commission interpreted the Federal Circuit’s guidance in Bratsk as requiring it to apply a particular additional methodology following its finding of material injury in cases involving commodity products and a significant market presence of price‐competitive nonsubject imports.52 The additional “replacement/benefit” test
47 S. Rep. 96‐249 at 74‐75; H.R. Rep. 96‐317 at 47. 48 See Nippon Steel Corp., 345 F.3d at 1381 (“an affirmative material‐injury determination under the
statute requires no more than a substantial‐factor showing. That is, the ‘dumping’ need not be the sole or principal cause of injury.”).
49 Mittal Steel, 542 F.3d at 877‐78; see also id. at 873 (“While the Commission may not enter an affirmative determination unless it finds that a domestic industry is materially injured ‘by reason of’ subject imports, the Commission is not required to follow a single methodology for making that determination ... {and has} broad discretion with respect to its choice of methodology.”) citing United States Steel Group v. United States, 96 F.3d 1352, 1362 (Fed. Cir. 1996) and S. Rep. 96‐249 at 75.
50 Vice Chairman Pinkert does not join this paragraph or the following three paragraphs. He points out that the Federal Circuit, in Bratsk, 444 F.3d 1369, and Mittal Steel, held that the Commission is required, in certain circumstances when considering present material injury, to undertake a particular kind of analysis of non‐subject imports, albeit without reliance upon presumptions or rigid formulas. Mittal Steel explains as follows:
What Bratsk held is that “where commodity products are at issue and fairly traded, price competitive, non‐subject imports are in the market,” the Commission would not fulfill its obligation to consider an important aspect of the problem if it failed to consider whether non‐subject or non‐LTFV imports would have replaced LTFV subject imports during the period of investigation without a continuing benefit to the domestic industry. 444 F.3d at 1369. Under those circumstances, Bratsk requires the Commission to consider whether replacement of the LTFV subject imports might have occurred during the period of investigation, and it requires the Commission to provide an explanation of its conclusion with respect to that factor.
542 F.3d at 878. 51 Nucor Corp. v. United States, 414 F.3d 1331, 1336, 1341 (Fed. Cir. 2005); see also Mittal Steel, 542
F.3d at 879 (“Bratsk did not read into the antidumping statute a Procrustean formula for determining whether a domestic injury was ‘by reason’ of subject imports.”).
52 Mittal Steel, 542 F.3d at 875‐79.
13
looked at whether nonsubject imports might have replaced subject imports without any benefit to the U.S. industry. The Commission applied that specific additional test in subsequent cases, including the Carbon and Certain Alloy Steel Wire Rod from Trinidad and Tobago determination that underlies the Mittal Steel litigation.
Mittal Steel clarifies that the Commission’s interpretation of Bratsk was too rigid and makes clear that the Federal Circuit does not require the Commission to apply an additional test nor any one specific methodology; instead, the court requires the Commission to have “evidence in the record” to “show that the harm occurred ‘by reason of’ the LTFV imports,” and requires that the Commission not attribute injury from nonsubject imports or other factors to subject imports.53 Accordingly, we do not consider ourselves required to apply the replacement/benefit test that was included in Commission opinions subsequent to Bratsk.
The progression of Gerald Metals, Bratsk, and Mittal Steel clarifies that, in cases involving commodity products where price‐competitive nonsubject imports are a significant factor in the U.S. market, the Court will require the Commission to give full consideration, with adequate explanation, to non‐attribution issues when it performs its causation analysis.54
The question of whether the material injury threshold for subject imports is satisfied notwithstanding any injury from other factors is factual, subject to review under the substantial evidence standard.55 Congress has delegated this factual finding to the Commission because of the agency’s institutional expertise in resolving injury issues.56
B. Conditions of Competition and the Business Cycle
The following conditions of competition inform our analysis of whether there is material injury by reason of subject imports.
53 Mittal Steel, 542 F.3d at 873 (quoting from Gerald Metals, 132 F.3d at 722), 875‐79 & n.2
(recognizing the Commission’s alternative interpretation of Bratsk as a reminder to conduct a non‐attribution analysis).
54 To that end, after the Federal Circuit issued its decision in Bratsk, the Commission began to present published information or send out information requests in final phase investigations to producers in nonsubject countries that accounted for substantial shares of U.S. imports of subject merchandise (if, in fact, there were large nonsubject import suppliers). In order to provide a more complete record for the Commission’s causation analysis, these requests typically seek information on capacity, production, and shipments of the product under investigation in the major source countries that export to the United States. The Commission plans to continue utilizing published or requested information in final phase investigations in which there are substantial levels of nonsubject imports.
55 We provide in our respective discussions of volume, price effects, and impact a full analysis of other factors alleged to have caused any material injury experienced by the domestic industry.
56 Mittal Steel, 542 F.3d at 873; Nippon Steel Corp., 458 F.3d at 1350, citing U.S. Steel Group, 96 F.3d at 1357; S. Rep. 96‐249 at 75 (“The determination of the ITC with respect to causation is ... complex and difficult, and is a matter for the judgment of the ITC.”).
14
1. Demand Considerations
Demand for MSG is derived from demand for downstream products including processed foods, such as canned soups, ready‐made food, sauces, spice mixes, and dressings, and to a lesser extent detergents, cosmetics, and pharmaceuticals.57 The U.S. market is composed of four major segments: direct purchases by large‐scale food processors (accounting for approximately *** percent of the market); sales through distributors to the Chinese food service market; sales to distributors for retail stores; and sales through other distributors.58
Questionnaire responses from U.S. market participants were mixed on how U.S. demand had changed since 2011.59 Apparent U.S. consumption of MSG increased over the POI from *** pounds in 2011 to *** pounds in 2012 and then to *** pounds in 2013.60
2. Supply Considerations
The domestic industry was the largest source of supply to the U.S. market.61 The
domestic industry’s market share decreased from *** percent in 2011 to *** percent in 2012, then increased to *** percent in 2013, a figure below that of 2011.62 The domestic industry’s production capacity was flat over the period and remained below apparent U.S. consumption throughout the POI.63
Cumulated subject imports were the next largest supplier to the U.S. market during the POI. Their market share increased from *** percent in 2011 to *** percent in 2012 and *** percent in 2013.64
The market share of nonsubject imports was relatively small. It increased from *** percent in 2011 to *** percent in 2012 and decreased to *** percent in 2013.65 Brazil was the largest supplier of nonsubject imports during the period.66
57 CR at II‐10, PR at II‐6. 58 CR/PR at II‐2. 59 CR at II‐11 to II‐12, PR at II‐7; and CR/PR at Table II‐3. The U.S. producer and a majority of
importers reported that demand had increased since 2011, but purchasers were almost evenly divided in reporting whether demand had increased, decreased, not changed, or fluctuated since 2011. Id.
60 CR/PR at Table IV‐6. Apparent U.S. consumption of MSG was *** pounds in January‐June (“interim”) 2013 and *** pounds in interim 2014. Id.
61 CR/PR at III‐1 and CR/PR at Table III‐1. 62 CR/PR at Table IV‐6. The domestic industry’s market share was *** percent in interim 2013 and
*** percent in interim 2014. Id. 63 The domestic industry’s production capacity was *** pounds throughout the POI and was ***
pounds in interim 2013 and interim 2014. CR/PR at Table III‐1. 64 CR/PR at Table IV‐6. The market share of cumulated subject imports was *** percent in interim
2013 and *** percent in interim 2014. Id. 65 CR/PR at Table IV‐6. The market share of nonsubject imports was *** percent in interim 2013 and
was *** percent in interim 2014. Id.
15
3. Substitutability
All domestically produced MSG meets both FCC and USP standards, and subject imports also generally meet these specifications, although there is some MSG produced in China that reportedly does not meet these standards. There are no grades or flavors of MSG, although there is a range of different crystal sizes.67
The U.S. producer and a majority of purchasers reported that subject imports are always or frequently interchangeable with each other and with the domestic like product.68 All reporting importers reported that that subject imports are at least sometimes interchangeable with each other and with the domestic like product.69
When asked whether differences other than price are ever significant to purchasers choosing between the domestic like product and subject imports, the domestic producer reported that non‐price differences were never significant and the majority of importers and purchasers reported that non‐price differences were never or sometimes significant.70 The parties to these investigations agree that MSG is a fungible and interchangeable product that sells on the basis of price.71
Based on the record, we find that MSG from different sources is highly substitutable and price is an important factor in purchasing decisions.72
4. Other Conditions
The primary raw material used by the domestic industry in the production of MSG is
glucose derived from corn and other dextrose sources.73 The monthly average price for corn during the POI peaked in August 2012 and was at its lowest in January 2014.74 The cost of glucose peaked in *** and *** by *** percent overall during the period of investigation.75 Additional raw materials used to manufacture MSG include ***.76
(…Continued)
66 CR at II‐9, PR at II‐6. Nonsubject imports from Brazil accounted for 77.2 percent of nonsubject imports in 2013. Id. The majority of nonsubject imports during the POI were AJINA’s imports from its affiliates, ***. CR at II‐9 to II‐10, PR at II‐6; see also AJINA Prehearing Brief at 29.
67 CR/PR at II‐1. 68 CR/PR at Table II‐8. 69 CR/PR at Table II‐8. 70 CR/PR at Table II‐10. 71 AJINA Posthearing Brief at 4; CJ Posthearing Brief at 6. 72 See CR at II‐13 to II‐22, PR at II‐8 to II‐14. 73 CR at I‐10, V‐1; PR at I‐8, V‐1. 74 CR/PR at V‐1 and Table V‐1. 75 CR at V‐2, PR at V‐1; AJINA Producer Questionnaire, Addendum C. During the POI, the domestic
industry ***. This agreement included ***. CR at VI‐4 and n.4, PR at VI‐2 and n.4; Emails from ***, dated October 7, 2014 and October 14, 2014.
76 CR at V‐2, PR at V‐1; AJINA Producer Questionnaire, Response to Question IV‐17 and Addendum C.
16
The U.S. producer generally sold MSG through yearly or short term contracts and importers generally sold MSG through yearly contracts or on a spot basis.77
C. Volume of Subject Imports
Section 771(7)(C)(i) of the Tariff Act provides that the “Commission shall consider whether the volume of imports of the merchandise, or any increase in that volume, either in absolute terms or relative to production or consumption in the United States, is significant.”78
The volume of cumulated subject imports rose each year from 2011 to 2013, but was lower in interim 2014 than in interim 2013. Subject import volume increased from *** pounds in 2011 to *** pounds in 2012 and then to *** pounds in 2013. The *** pounds of subject imports in interim 2013 was greater than the *** pounds in interim 2014.79
We find that the reduced volume of cumulated subject imports in interim 2014 when compared with interim 2013 was due, at least in part, to the filing of the petition on September 16, 2013. We therefore give reduced weight in our analysis to the volume of subject imports during 2014.80
The volume of subject imports increased by *** percent between 2011 and 2013, which exceeded the *** percent increase in apparent U.S. consumption over the same period. Thus, the market share of the cumulated subject imports increased, rising from *** percent of apparent U.S. consumption in 2011 to *** percent in 2012 and then to *** percent in 2013.81 Subject imports increased their market share at the expense of both the domestic industry and nonsubject imports, which lost *** percentage points and *** percentage points, respectively, between 2011 and 2013.82
We find that the volume of cumulated subject imports and the increase in that volume is significant both in absolute terms and relative to consumption in the United States.
77 CR/PR at Table V‐2. AJINA sold *** percent of U.S. shipments through yearly contracts, ***
percent through short term contracts, and *** percent through spot sales. Importers of subject MSG from China reported *** percent of U.S. shipments through yearly contracts, *** percent through short term contracts, and *** percent through spot sales. Importers of subject MSG from Indonesia reported *** percent of U.S. shipments through yearly contracts and *** percent through spot sales. Importers of subject MSG from Indonesian reported *** though short term contracts. AJINA and U.S. importers reported *** through long term contracts. CR at V‐4, PR at V‐3.
78 19 U.S.C. § 1677(7)(C)(i). 79 CR/PR at Table IV‐6. 80 See 19 U.S.C. § 1677(7)(I); CJ Prehearing Brief at 26 (noting the “chilling effect” of the petitions on
subject imports). 81 CR/PR at Table IV‐6. Subject import market share was *** percent in interim 2013 and ***
percent in interim 2014. 82 CR/PR at Table C‐1.
17
D. Price Effects of the Subject Imports
Section 771(7)(C)(ii) of the Tariff Act provides that in evaluating the price effects of the subject imports, the Commission shall consider whether
(I) there has been significant price underselling by the imported merchandise as compared with the price of domestic like products of the United States, and
(II) the effect of imports of such merchandise otherwise depresses prices to a significant degree or prevents price increases, which otherwise would have occurred, to a significant degree.83
As we found above, the record in these investigations shows that the subject imports and the domestic like product are generally manufactured to industry‐standard specifications and are highly substitutable, and that price is an important consideration in purchasing decisions.
The Commission collected pricing data for four products.84 The U.S. producer and six importers provided useable pricing data for sales of the requested products, although not all firms reported pricing for all products for all quarters.85 The pricing data show that cumulated subject imports undersold the domestic like product in 40 of 82 quarterly price comparisons, and oversold it in the remaining 42 comparisons.86 The margins of underselling ranged from *** percent to *** percent, and the average margin of underselling was *** percent. Moreover, the incidence and margins of underselling increased from 2011 to 2013.87
We also examined the pricing data on a volume basis. These data show that the total subject import volume for quarters of underselling was *** pounds, while the total subject import volume for quarters of overselling was *** pounds.88 Thus, underselling clearly
83 19 U.S.C. § 1677(7)(C)(ii). 84 CR at V‐7 to V‐8, PR at V‐5. Pricing Product 1 is MSG Extra Fine 50 LB – Paper Bag; All crystal
passed through ASTM #60 or above, no second screen used. Pricing Product 2 is MSG Fine 50 LB – Paper Bag; First screen passed through of crystal smaller than ASTM #60, second screen of ASTM #120 up to or including ASTM #70. Pricing Product 3 is MSG Regular 50 LB – Paper Bag; First screen passed through of crystal smaller than ASTM #20 up to or on ASTM #50, second screen of ASTM #40 up to or including ASTM #100. Pricing Product 4 is MSG Regular 100 LB DRM – Fiber Drum; First screen passed through of crystal smaller then ASTM #20 up to or on ASTM #50, second screen of ASTM #40 up to or including ASTM #100. Id.
85 CR at V‐7, PR at V‐5. Pricing data reported for these firms accounted for *** percent of U.S. producer’s shipments of MSG, *** percent of U.S. shipments of subject imports from China, and *** percent of U.S. shipments of subject imports from Indonesia over the POI. CR at V‐7 to V‐8, PR at V‐5.
86 CR/PR at V‐18, Table V‐8. 87 CR/PR at Table V‐8. 88 Calculated from CR/PR at Tables V‐3 to V‐6; see also EDIS Doc. 544788.
18
predominated on a volume basis.89 In light of data that show underselling was prevalent on a volume basis and that there was at least mixed underselling on the basis of quarterly comparisons, we find that cumulated subject imports undersold the domestic like product to a significant degree.
We also find that the effect of the subject imports was to prevent price increases by the domestic industry which otherwise would have occurred to a significant degree. As discussed above, apparent U.S. consumption increased by *** percent between 2011 and 2013.90 During that time, higher raw material costs drove a net increase in the domestic industry’s per unit cost of goods sold (“COGS”), which increased by *** percent from 2011 to 2013.91 Despite these rising costs and higher demand, the average unit value (“AUV”) of the domestic industry’s net sales was $*** in both 2011 and 2013, reflecting the industry’s inability to sustain price increases over the POI.92 As a result, the domestic industry’s ratio of COGS to net sales increased *** from 2011 to 2013.93 We find that the increasing volume of low‐priced subject imports, that were highly substitutable for the domestic like product, caused the cost‐price squeeze that the domestic industry experienced.94
89 See, e.g., CR/PR at Table V‐4. 90 CR/PR at Table C‐1. 91 The domestic industry’s per unit COGS was $*** in 2011, $*** in 2012, $*** in 2013, and were
$*** in interim 2013 and $*** in interim 2014. The domestic industry’s per unit raw material costs were $*** in 2011, $*** in 2012, $*** in 2013, and were $*** in interim 2013 and $*** in interim 2014. CR/PR at Table VI‐1.
92 CR/PR at Table VI‐1. The domestic industry’s AUV of net sales increased from $*** in 2011 to $*** in 2012; however, this increase in the industry’s AUV of *** percent was insufficient to cover rising per unit COGS, which increased by *** percent between 2011 and 2012. While per unit COGS declined *** percent between 2012 and 2013, the domestic industry’s AUV of net sales declined even further, falling *** percent to $*** in 2013, the same level as in 2011. Id.
93 The domestic industry’s COGS to net sales ratio was *** percent in 2011, *** percent in 2012, *** percent in 2013, and was *** percent in interim 2013 and *** percent in interim 2014. CR/PR at Table VI‐1.
94 We have considered whether the domestic industry’s inability to raise prices was due to purchasers’ perceptions that demand for MSG was declining. See CJ Posthearing Brief at 40. Some purchasers perceived that demand was declining in certain segments of the U.S. market, possibly due to health concerns about MSG, and CJ argue that these purchasers, therefore, were unwilling to accept price increases. See CR at II‐10 to II‐12, PR at II‐6 to II‐7 (one importer reported a decrease in U.S. demand since 2011 citing MSG’s negative health‐related reputation as a reason for the decrease); CJ Posthearing Brief at 40. We note that seven purchasers reported that demand had declined over the POI, while 14 reported that demand had increased or had not changed, so the purchasers who perceived that demand was declining were not in the majority. See CR/PR at Table II‐3. Moreover, apparent U.S. consumption actually increased over the POI, so any individual purchasers or segments of the market that experienced declines in demand were outweighed by other purchasers or market segments that experienced an increase in demand. See CR/PR at Table C‐1. Consequently, we are not persuaded by CJ’s argument that purchasers’ perceptions regarding declining demand explain the domestic industry’s inability to raise prices commensurate with increasing costs.
19
The record also shows that the domestic industry’s prices declined as the volume of low‐priced subject imports increased, particularly between 2012 and 2013. Between the last quarter of 2012 and the last quarter of 2013, the domestic industry’s prices for each of the pricing products declined between *** and *** percent.95 For pricing products 2 and 3, the largest volume products for both the domestic industry and subject imports, the domestic industry’s prices declined by *** percent and *** percent, respectively.96 This occurred as apparent U.S. consumption increased by *** percent and the domestic industry’s unit COGS declined by *** percent.97
In addition, there were a number of confirmed instances in which the domestic industry lost sales and revenue due to competition from subject imports. The domestic industry made *** lost sales allegations totaling $*** and *** pounds of MSG and *** lost revenue allegations totaling $*** and involving *** pounds of MSG.98 The Commission confirmed *** lost sale allegations totaling $*** and *** pounds, and *** lost revenue allegations totaling $*** and involving *** pounds.99 Moreover, three of 13 responding purchasers reported that they had shifted purchases of MSG from the domestic industry to subject imports since 2010; two of these purchasers reported that they had shifted to subject imports because of price and one reported that it was seeking a secondary source of supply. Moreover, five of 10 responding purchasers also reported that the domestic industry reduced its prices in order to compete with subject imports.100
For the foregoing reasons, we find that the cumulated subject imports had significant effects on prices of the domestic like product.101
95 See CR/PR at Tables V‐3 to V‐6. 96 See CR/PR at Tables V‐4 to V‐5. 97 See CR/PR at Table C‐1. 98 CR at V‐18 to V‐19, PR at V‐7. 99 Calculated from CR/PR at Tables V‐9 and V‐10. 100 CR at V‐19, PR at V‐7. 101 Vice Chairman Pinkert does not join the Commission’s finding of significant price suppression,
noting that the underselling observations on the record of the investigation are concentrated toward the end of the POI, when unit COGS was declining. See CR/PR at Tables IV‐2, and V‐3 to V‐5. He finds, however, significant price depression toward the end of the POI for the reasons stated in the text.
20
E. Impact of the Subject Imports102
Section 771(7)(C)(iii) of the Tariff Act provides that examining the impact of subject imports, the Commission “shall evaluate all relevant economic factors which have a bearing on the state of the industry.”103 These factors include output, sales, inventories, capacity utilization, market share, employment, wages, productivity, profits, cash flow, return on investment, ability to raise capital, research and development, and factors affecting domestic prices. No single factor is dispositive and all relevant factors are considered “within the context of the business cycle and conditions of competition that are distinctive to the affected industry.”
The domestic industry’s condition declined during the POI, despite increasing apparent U.S. consumption. Production capacity remained constant.104 Production and capacity utilization fell in 2012; while they returned to 2011 levels in 2013, much of the increased production in 2013 went into expanding inventories.105
102 The statute instructs the Commission to consider the “magnitude of the dumping margin” in an
antidumping investigation as part of its consideration of the impact of subject imports. 19 U.S.C. § 1677(7)(C)(iii)(V). In its final determination with respect to subject imports from China, Commerce found antidumping duty margins of 8.30 percent for Tongliao Meihua Biological SCI‐TECH Company, Ltd./Meihua Holdings Group Company Ltd., Bazhou Branch; Fujian Province Jianyang Wuyi MSG Company, Ltd.; Neimenggu Fufeng Biotechnologies Company, Ltd.; and Baoji Fufeng Biotechnologies Company, Ltd.; and 8.32 percent for the PRC‐wise Entity. Monosodium Glutamate from the People’s Republic of China: Final Determination of Sales at Less Than Fair Value and the Final Affirmative Determination of Critical Circumstances, 79 Fed. Reg. 58326, 58327 (September 29, 2014). In its final determination with respect to subject imports from Indonesia, Commerce found an antidumping duty margin of 6.19 percent for PT Cheil Jedang Indonesia and for All Others. Monosodium Glutamate from the Republic of Indonesia: Final Determination of Sales at Less Than Fair Value, 79 Fed. Reg. 58329 (September 29, 2014).
103 19 U.S.C. § 1677(7)(C)(iii); see also SAA at 851 and 885 (“In material injury determinations, the Commission considers, in addition to imports, other factors that may be contributing to overall injury. While these factors, in some cases, may account for the injury to the domestic industry, they also may demonstrate that an industry is facing difficulties from a variety of sources and is vulnerable to dumped or subsidized imports.”).
104 The domestic industry’s production capacity was constant at *** pounds throughout the POI and was *** pounds in interim 2013 and interim 2014. CR/PR at Table III‐1.
105 Production was *** million pounds in 2011, *** pounds in 2012, and *** pounds in 2013, and was *** pounds in interim 2013 and *** pounds in interim 2014. Capacity utilization was *** percent in 2011, *** percent in 2012, and *** percent in 2013 and was *** percent in interim 2013 and *** percent in interim 2014. CR/PR at Table III‐1.
The domestic industry’s end‐of‐period inventories were *** pounds in 2011, *** pounds in 2012, *** pounds in 2013, and were *** pounds in interim 2013 and *** pounds in interim 2014. CR/PR at Table III‐3. The domestic industry reported that a portion of its inventories were ***. See CR/PR at Table III‐3 n.1. AJINA explained that ***. AJINA Posthearing Brief, Exhibit 1 at 28. The domestic industry’s end‐of‐period inventories adjusted for lost product also increased, from *** pounds in 2011 to *** pounds in 2012 and then to *** pounds in 2013; they were *** pounds in interim 2013 and *** pounds in interim 2014. CR/PR at Table III‐3.
21
The domestic industry’s net sales, by quantity, decreased from *** pounds in 2011 to *** pounds in 2012, and then rose to *** pounds in 2013.106 U.S. shipments decreased from *** pounds in 2011 to *** pounds in 2012, and then rose to *** pounds in 2013. Both net sales and U.S. shipments, therefore, were lower in 2013 than they were in 2011.107 As previously indicated, the domestic industry’s market share declined from 2011 to 2013. Its share of apparent U.S. consumption decreased from *** percent in 2011 to *** percent in 2012, and then rose to *** percent in 2013.108 Average hourly wages and productivity declined from 2011 to 2013. 109 By contrast, the number of production and related workers, total hours worked, and wages paid increased.110 The domestic industry’s financial performance deteriorated steadily from 2011 to 2013, with the industry recording an operating *** in 2013. Operating income declined from $*** in 2011 to $*** in 2012 and was a $*** in 2013.111 The domestic industry’s operating income margin declined from *** percent in 2011 to *** percent in 2012, and then to *** percent in 2013.112
The increasing volume of subject imports from 2011 to 2013 that were frequently selling at prices below those for the domestic like product served to reduce the domestic industry’s revenue. This was due both to decreases in output, as the domestic industry lost market share to the subject imports and sold less product in 2013 than it did in 2011, and to price suppression, as the industry’s changes in prices failed to keep pace with changes in costs. Both the decreases in net sales and the adverse price effects caused by subject imports resulted in
106 CR/PR at Table VI‐1. The domestic industry’s net sales, by quantity, were *** pounds in interim
2013 and *** pounds in interim 2014. Id. The domestic producer’s net sales, by value, were $*** in 2011, $*** in 2012, $*** in 2013, and were $*** in interim 2013 and $*** in interim 2014. CR/PR at Table C‐1.
107 CR/PR at Table III‐2. U.S. shipments were *** pounds in interim 2013 and *** pounds in interim 2014. Id.
108 CR/PR at Table IV‐6. The domestic industry’s market share was *** percent in interim 2013 and *** percent in interim 2014. Id. We observe that the increase in the domestic industry’s market share in interim 2014 compared to interim 2013 occurred as the subject imports exited the U.S. market while these investigations were pending.
109 Hourly wages were $*** in 2011, $*** in 2012, $*** in 2013, and $*** in interim 2013 and $*** in interim 2014. Productivity in pounds per hour was *** in 2011, *** in 2012, *** in 2013, and *** in interim 2013 and *** in interim 2014. CR/PR at Table III‐5.
110 Production and related workers were *** in 2011, *** in 2012, *** in 2013, and *** in interim 2013 and *** in interim 2014. Hours worked were *** in 2011, *** in 2012, *** in 2013, and *** in interim 2013 and *** in interim 2014. Wages paid were $*** in 2011, $*** in 2012, $*** in 2013, and $*** in interim 2013 and $*** in interim 2014. CR/PR at Table III‐5.
111 CR/PR at Table C‐1. Operating income was a $*** in interim 2013 and $*** in interim 2014. Id. 112 CR/PR at Table C‐1. The domestic industry’s operating income margin was *** percent in interim
2013 and *** percent in interim 2014. Id. The domestic industry’s capital expenditures declined significantly over the POI, from $*** in 2011 to $*** in 2012 and $*** in 2013. They were $*** in interim 2013 and $*** in interim 2014. CR/PR at Table VI‐4. The domestic industry’s research and development expenditures increased from $*** in 2011 to $*** in 2012, and then decreased to $*** in 2013. They were $*** in interim 2013 and $*** in interim 2014. Id.
22
the domestic industry’s deteriorating operating performance from 2011 to 2013. The role of subject imports in the industry’s poor operating performance from 2011 to 2013 is corroborated by the domestic industry’s much improved performance during the first half of 2014. During this period, when cumulated subject import volume was greatly reduced due to the pendency of the investigations and despite a decrease in apparent U.S. consumption of *** percent, the domestic industry’s financial performance, market share, and COGS to net sales ratio all improved.113
We accordingly find that the significant volume of subject imports and their adverse price effects led to declining operating performance for the domestic industry, and had a significant adverse impact on the domestic industry.
We have considered whether there are other factors that may have had an adverse impact on the domestic industry to ensure that we are not attributing injury from such other factors to the subject imports. We have first examined trends in raw material costs.114 The domestic industry’s per unit raw material costs decreased in 2013, but its average net sales value declined to a greater degree and the industry’s operating performance deteriorated sharply in that year.115 Raw material costs declined further in interim 2014 and the domestic industry’s financial performance improved, but these improvements coincided with increases in its net sales (both in quantity and value), U.S. shipments, and market share, as well as a reduction in its inventories, all of which resulted from the substantial withdrawal of subject imports from the U.S. market due to the filing of the petitions.116 Thus, the domestic industry’s improved performance was not solely due to declining raw material costs.
We have also examined the increase in the domestic industry’s selling general and administrative (“SG&A”) expenses in 2013.117 The domestic industry’s increase in SG&A expenses from 2012 to 2013 primarily reflect a *** in the first half of 2013, as well as ***. These types of expenses are typical operating expenses and are thus properly considered in any analysis of the domestic industry’s financial condition. Moreover, even if the *** expense were removed from the data, the domestic industry’s operating margin for 2013 would still be *** percent for 2013 and *** percent for the interim 2013 period.118 If SG&A expenses as a ratio to
113 CR/PR at Table C‐1. 114 Respondent CJ claims that improvements in the domestic industry’s operating performance in
interim 2014 are due to changes in the domestic industry’s raw material costs, rather than the decline in subject imports. It maintains that, although the domestic industry’s profitability decreased during the POI, the domestic industry’s major raw material costs and other expenses were simultaneously increasing dramatically. CJ argues that raw material costs then *** significantly in interim 2014, primarily as a result of the extraordinary decline in the price of corn, with a commensurate improvement in the domestic industry’s financial condition. CJ Prehearing Brief at 19‐20.
115 CR/PR at Table VI‐1. 116 See CR/PR at Table C‐1. 117 Respondent CJ contends that the 2013 increase in SG&A expenses accounts for almost all of the
operating loss reported by the domestic industry in that year. CJ notes that the domestic industry’s ***. Thus, CJ argues that the domestic industry’s decline in profitability for 2013 was primarily the ***. CJ Prehearing Brief at 19‐20; Posthearing Brief at 11‐13.
118 CR at VI‐6 n.6, PR at VI‐2 n.6.
23
net sales remained constant from 2012 to 2013, the operating income margin for full year 2013 would be *** percent.119 Therefore, even if these expenses had not increased, the domestic industry’s operating performance would have still declined significantly from prior years in the POI.
We have further examined domestic supply shortages in 2012.120 The domestic industry experienced a production decline in 2012 resulting from technology modifications at AJINA’s sole production plant. AJINA imported nonsubject MSG from its *** affiliate in that year to fill in for declining domestic production and to ensure an adequate supply.121 However, the domestic industry’s production and financial performance declines persisted in 2013, even after the production disruption in 2012 was resolved, because increased domestic industry production in 2013 resulted primarily in increased inventories rather than increased sales.122 Domestic industry supply shortages in 2012, therefore, cannot explain the domestic industry’s difficulties in 2013, nor can they explain the domestic industry’s improved performance or the declines in its inventories in interim 2014 after subject imports substantially reduced their presence in the U.S. market.
In addition, we have considered the role of nonsubject imports. Nonsubject imports’ market share was lower relative to subject imports throughout the POI. It was *** percent in 2011, *** percent in 2012, and *** percent in 2013.123 As previously noted, the largest supplier of nonsubject imports during the POI was Brazil, which accounted for 77.2 percent of nonsubject imports in 2013.124 The record shows that the majority of nonsubject imports during the POI were AJINA’s own imports from its affiliate companies, ***.125 Moreover, pricing data reported for nonsubject imports from Brazil indicate that prices for these nonsubject imports were higher in the majority of pricing comparisons with both the domestic like product and subject imports.126 Therefore, we find that the nonsubject imports are not responsible for the adverse price effects that we have attributed to the subject imports.
For the foregoing reasons, we find that the cumulated subject imports had a significant adverse impact on the domestic industry.
119 CR at VI‐6 n.6, PR at VI‐2 n.6. 120 CJ also argues that the domestic industry was unable to supply apparent U.S consumption during
the POI through its domestic production and, thus, a substantial portion of U.S. demand could only be supplied by imports. CJ Posthearing Brief at 1, 3‐5.
121 See CR/PR at Table III‐4; AJINA Posthearing Brief, Exhibit 1 at 3. 122 CR/PR at Tables III‐3 and III‐4. 123 CR/PR at Table IV‐6. Nonsubject imports’ market share was *** percent in interim 2013 and ***
percent in interim 2014. Id. 124 CR at II‐9; PR at II‐6. 125 CR at II‐9 to II‐10, PR at II‐6. 126 CR/PR at Table C‐1. Subject imports from Brazil (Pricing Products 2, 3, and 4) were priced higher in
18 of 30 comparisons with the domestic like product, higher than subject imports from China in 15 of 20 comparisons, and higher than subject imports from Indonesia in 15 of 16 comparisons. CR/PR at Table D‐4; see also CR/PR at Tables D‐1 to D‐3.
24
Critical Circumstances VI.
A. Legal Standards and Party Arguments
In its final antidumping duty determination concerning MSG from China, Commerce found that critical circumstances exist with respect to all subject producers and exporters.127 Because we have determined that the domestic industry is materially injured by reason of subject imports from China, we must further determine “whether the imports subject to the affirmative {Commerce critical circumstances} determination ... are likely to undermine seriously the remedial effect of the antidumping {and/or countervailing duty} order{s} to be issued.”128 The SAA indicates that the Commission is to determine "whether, by massively increasing imports prior to the effective date of relief, the importers have seriously undermined the remedial effect of the order" and specifically "whether the surge in imports prior to the suspension of liquidation, rather than the failure to provide retroactive relief, is likely to seriously undermine the remedial effect of the order."129 The legislative history for the critical circumstances provision indicates that the provision was designed "to deter exporters whose merchandise is subject to an investigation from circumventing the intent of the law by increasing their exports to the United States during the period between initiation of an investigation and a preliminary determination by {Commerce}."130 An affirmative critical circumstances determination by the Commission, in conjunction with an affirmative determination of material injury by reason of subject imports, would normally result in the retroactive imposition of duties for those imports subject to the affirmative Commerce critical circumstances determination for a period 90 days prior to the suspension of liquidation.
The statute provides that, in making this determination, the Commission shall consider, among other factors it considers relevant,
(I) the timing and the volume of the imports,
(II) a rapid increase in inventories of the imports, and
(III) any other circumstances indicating that the remedial effect of the {order} will be seriously undermined.131
In considering the timing and volume of subject imports, the Commission's practice is to consider import quantities prior to the filing of the petition with those subsequent to the filing
127 Monosodium Glutamate from the People’s Republic of China: Final Determination of Sales at Less
Than Fair Value and the Final Affirmative Determination of Critical Circumstances, 79 Fed. Reg. 58326, 58326‐27 (September 29, 2014).
128 19 U.S.C. §§ 1671d(b)(4)(A)(ii), 1673d(b)(4)(A)(ii). 129 SAA at 877. 130 ICC Industries, Inc. v United States, 812 F.2d 694, 700 (Fed. Cir. 1987), quoting H.R. Rep. No. 96‐
317 at 63 (1979), aff’g 632 F. Supp. 36 (Ct. Int’l Trade 1986). See 19 U.S.C. §§ 1671b(e)(2), 1673b(e)(2).
131 19 U.S.C. §§ 1671d(b)(4)(A)(ii), 1673d(b)(4)(A)(ii).
25
of the petition using monthly statistics on the record regarding those firms for which Commerce has made an affirmative critical circumstances determination.132
B. Analysis
On September 29, 2014, Commerce issued its final affirmative antidumping duty determination concerning imports of MSG from China and found that critical circumstances exist with respect to all subject imports from China.133
Unless the subject imports subject to an affirmative critical circumstances determination reflect seasonal market conditions or the Commission decides that circumstances otherwise warrant, the Commission generally compares six months of data gathered from the periods immediately preceding and following the filing of the petition, with the earlier period including the month in which the petition was filed.134 In this investigation, there is no compelling reason to depart from our normal practice of comparing data for six‐month periods before and after the filing of the petition. Given the timing of the filing of the petition (in the middle of the month, on September 16, 2013), we include the month in which the petition was filed in the initial six‐month comparison period.
Based on a comparison of subject imports over the six‐month periods before and after the filing of the petition, we do not find a surge in subject imports warranting an affirmative critical circumstances determination. Subject imports from China increased from 26.1 million pounds to 33.9 million pounds between the two periods, an increase of 29.8 percent.135 The increase in subject imports covered by Commerce’s affirmative critical circumstances determination is insufficient to undermine seriously the remedial effect of the antidumping duty order.
132 See Lined Paper School Supplies from China, India, and Indonesia, Inv. Nos. 701‐TA‐442‐43, 731‐
TA‐1095‐97, USITC Pub. 3884 at 46‐48 (Sept. 2006); Carbazole Violet Pigment from China and India, Inv. Nos. 701‐TA‐437 and 731‐TA‐1060‐61 (Final), USITC Pub. 3744 at 26 (Dec. 2004); Certain Frozen Fish Fillets from Vietnam, Inv. No. 731‐TA‐1012 (Final), USITC Pub. 3617 at 20‐22 (Aug. 2003).
133 Monosodium Glutamate from the People’s Republic of China: Final Determination of Sales at Less Than Fair Value and the Final Affirmative Determination of Critical Circumstances, 79 Fed. Reg. 58326, 58328 (September 29, 2014). Commerce stated that it had not received any comments and, therefore, had made no changes to the critical circumstances finding announced in its preliminary determination. Id., citing Monosodium Glutamate from the People’s Republic of China: Preliminary Determination of Sales at Less Than Fair Value, Preliminary Affirmative Determination of Critical Circumstances, and Postponement of Final Determination, 79 Fed. Reg. 26408 (May 8, 2014) (“Preliminary Determination”).
134 Crystalline Silicon Photovoltaic Cells and Modules from China, Inv. Nos. 701‐TA‐481, 731‐TA‐1190 (Final), USITC Pub. 4360 at 42 (Nov. 2012) (data compared for six‐month periods; when petitioner filed on the 19th of the month, that month was included in the initial period); Steel Wire Garment Hangers from Vietnam, Inv. Nos. 701‐TA‐483, 731‐TA‐1198, USITC Pub. 4371 at 6 (Jan. 2013) (data composed of six‐month periods; when petitioner filed on the 29th of the month, that month was included in the initial period). But cf. Orange Juice from Brazil, Inv. No. 731‐TA‐1089 (Final), USITC Pub. 3838 at 29 n.203 (March 2005) (using seven month period because the petition was filed late in the month). Graphite Electrodes from China, Inv. No. 731‐TA‐1143 (Final), USITC Pub. 4062 at 24 (Feb. 2009).
135 CR/PR at IV‐7; and CR/PR at Table IV‐4.
26
The inventory data also do not support an affirmative critical circumstances determination. U.S. importers’ end of period inventories of subject merchandise from China subject to the affirmative Commerce critical circumstances determination declined from *** pounds in January 2013 to *** pounds in June 2013, and to *** pounds in January 2014.136 Thus, there is no evidence that U.S. importers were stockpiling MSG from China after the September 2013 filing of the petition and the data confirm that the volume of post‐petition subject imports are not likely to undermine seriously the remedial effect of the antidumping duty order.
Taken as a whole, the data on record do not show that the subject imports that entered the U.S. market after the filing of the petition and before Commerce’s suspension of liquidation are likely to undermine seriously undermine the remedial effect of the antidumping duty order. Accordingly, we do not find evidence that the retroactive application of suspension of liquidation and the imposition of duties for a 90‐day‐period are warranted. We therefore determine that critical circumstances do not exist with respect to subject imports from China of MSG covered by the affirmative critical circumstances determination in Commerce’s final antidumping duty investigation.
Conclusion VII.
For the reasons stated above, we determine that an industry in the United States is materially injured by reason of subject imports of MSG from China and Indonesia that are sold in the United States at less than fair value. We also determine that critical circumstances do not exist with respect to subject imports from China that are covered by the affirmative critical circumstances determination in Commerce’s final antidumping duty investigation.
136 CR at IV‐8, PR at IV‐7.
I‐1
PART I: INTRODUCTION
BACKGROUND
These investigations result from a petition filed with the U.S. Department of Commerce (“Commerce”) and the U.S. International Trade Commission (“USITC” or “Commission”) by Ajinomoto North America Inc. (“AJINA”), Itasca, Illinois, on September 16, 2013, alleging that an industry in the United States is materially injured and threatened with material injury by reason of subsidized and less‐than‐fair‐value (“LTFV”) imports of monosodium glutamate (“MSG”) 1 from China and Indonesia. On March 7, 2014, AJINA withdrew its petition with respect to the countervailing duty (“CVD”) investigations on imports of MSG from Indonesia and China. Consequently, Commerce terminated the CVD investigations effective April 7, 2014. The following tabulation provides information relating to the background of these investigations.2 3
Effective date Action September 16, 2013 Petitions filed with Commerce and the Commission;
institution of the Commission's investigations (78 FR 57881, September 20, 2013)
October 31, 2013 Commerce’s notice of initiation (78 FR 65278) November 18, 2013 Commission’s preliminary determinations (78 FR 76321,
December 17, 2013) April 7, 2014 Commerce’s termination of countervailing duty
investigations (79 FR 19056) May 8, 2014 Commerce’s preliminary antidumping duty determinations
(79 FR 26406, 26408); scheduling of final phase of Commission investigations (79 FR 34782, June 18, 2014)
September 29, 2014 Commerce’s final determinations (79 FR 58326, 58329) September 23, 2014 Commission’s hearing October 23, 2014 Commission’s vote November 10, 2014 Commission’s views
1 See the section entitled “The Subject Merchandise” in Part I of this report for a complete description of the merchandise subject to these investigations.
2 Pertinent Federal Register notices are referenced in appendix A, and may be found at the Commission’s website (www.usitc.gov).
3 A list of witnesses appearing at the Commission’s hearing is presented in appendix B.
I‐2
STATUTORY CRITERIA AND ORGANIZATION OF THE REPORT
Statutory criteria
Section 771(7)(B) of the Tariff Act of 1930 (the “Act”) (19 U.S.C. § 1677(7)(B)) provides that in making its determinations of injury to an industry in the United States, the Commission‐‐
shall consider (I) the volume of imports of the subject merchandise, (II) the effect of imports of that merchandise on prices in the United States for domestic like products, and (III) the impact of imports of such merchandise on domestic producers of domestic like products, but only in the context of production operations within the United States; and. . . may consider such other economic factors as are relevant to the determination regarding whether there is material injury by reason of imports.
Section 771(7)(C) of the Act (19 U.S.C. § 1677(7)(C)) further provides that‐‐
In evaluating the volume of imports of merchandise, the Commission shall consider whether the volume of imports of the merchandise, or any increase in that volume, either in absolute terms or relative to production or consumption in the United States is significant. . . . In evaluating the effect of imports of such merchandise on prices, the Commission shall consider whether. . .(I) there has been significant price underselling by the imported merchandise as compared with the price of domestic like products of the United States, and (II) the effect of imports of such merchandise otherwise depresses prices to a significant degree or prevents price increases, which otherwise would have occurred, to a significant degree. . . . In examining the impact required to be considered under subparagraph (B)(i)(III), the Commission shall evaluate (within the context of the business cycle and conditions of competition that are distinctive to the affected industry) all relevant economic factors which have a bearing on the state of the industry in the United States, including, but not limited to . . . (I) actual and potential decline in output, sales, market share, profits, productivity, return on investments, and utilization of capacity, (II) factors affecting domestic prices, (III) actual and potential negative effects on cash flow, inventories, employment, wages, growth, ability to raise capital, and investment, (IV) actual and potential negative effects on the existing development and production efforts of the domestic industry, including efforts to develop a derivative or more advanced version of the
I‐3
domestic like product, and (V) in {an antidumping investigation}, the magnitude of the margin of dumping.
Organization of report
Part I of this report presents information on the subject merchandise, dumping margins, and domestic like product. Part II of this report presents information on conditions of competition and other relevant economic factors. Part III presents information on the condition of the U.S. industry, including data on capacity, production, shipments, inventories, and employment. Parts IV and V present the volume of subject imports and pricing of domestic and imported products, respectively. Part VI presents information on the financial experience of U.S. producers. Part VII presents the statutory requirements and information obtained for use in the Commission’s consideration of the question of threat of material injury as well as information regarding nonsubject countries.
MARKET SUMMARY
MSG is a food additive and mainly used as a flavor enhancer in soups, broths, fish, meats, breading, seasonings, spice blends, vegetable juices, beverages, ready‐made foods, frozen meals, sauces, and dressings. AJINA is the sole U.S. producer of MSG,4 while leading producers of MSG outside the United States include Fufeng Group and Meihua Group of China and P.T. Cheil Jedang Indonesia (“CJ Indonesia”) of Indonesia. The leading U.S. importers of MSG from China are ***, while the leading importer of MSG from Indonesia is ***. *** is the leading importer of product from nonsubject countries (primarily ***). U.S. purchasers of MSG are primarily firms that use it as a flavor enhancer for food; the largest responding purchasers of MSG were *** in 2013.
Apparent U.S. consumption of MSG totaled approximately *** pounds ($***) in 2013. AJINA’s U.S. shipments of MSG totaled *** pounds ($***) in 2013, and accounted for *** percent of apparent U.S. consumption by quantity and *** percent by value. U.S. imports from subject sources totaled 68.7 million pounds ($46.3 million) in 2013 and accounted for *** percent of apparent U.S. consumption by quantity and *** percent by value. U.S. imports from
4 In addition, the U.S. firm Akzo Nobel Functional Chemicals LLC (“Akzo Nobel”) states that it is a U.S. producer of subject merchandise because it manufactures a product (***) that is within the scope (a mix containing 15 percent or more of MSG by dry weight). Akzo Nobel’s U.S. Producer Response, p. 36. Consequently, Akzo Nobel submitted a partial U.S. producer questionnaire response. As discussed below, however, the product manufactured by Akzo Nobel (***) does not appear to be scope merchandise because *** has a different chemical formula from the MSG described in the scope and the MSG used by Akzo Nobel in its manufacturing process is not “mixed” or “blended, but is consumed in producing a different chemical compound, namely the ***. See I‐13 to I‐16 & n.32.
I‐4
nonsubject sources totaled 5.7 million pounds ($4.9 million) in 2013 and accounted for *** percent of apparent U.S. consumption by quantity and *** percent by value.
SUMMARY DATA AND DATA SOURCES
A summary of data collected in these investigations is presented in appendix C, table C‐1. U.S. industry data are based on the questionnaire response of AJINA that accounted for all U.S. production of MSG during the period of investigation. U.S. imports are based on official import data and on questionnaire responses from 11 U.S. importers that are believed to have accounted for *** percent of imports from China, all imports from Indonesia, and *** percent of imports from nonsubject sources between January 2011 and June 2014.
PREVIOUS AND RELATED INVESTIGATIONS
The Commission conducted one previous antidumping investigation in 1976 concerning MSG from Korea under the Antidumping Act of 1921. In Inquiry No. AA1921‐Inq.‐5, it found that an industry in the United States was being or was likely to be injured, or was prevented from being established, by reason of imports of MSG from Korea possibly sold at less than fair value.5 The Treasury Department made a determination of sales at not less than fair value6 and the investigation was subsequently terminated.
NATURE AND EXTENT OF SALES AT LTFV
Sales at LTFV
On September 29, 2014, Commerce published a notice in the Federal Register of its affirmative final determinations of sales at LTFV with respect to imports of MSG from China 7 and Indonesia.8 Tables I‐1 and I‐2 present Commerce’s final dumping margins with respect to imports of MSG from China and Indonesia, respectively.
5 Monosodium Glutamate from Korea, Negative Determination of “No Reasonable Indication of Injury” in Inquiry No. AA1921‐Inq.‐5 Under the Antidumping Act, 1921, as Amended, USITC Publication 778, June 1976.
6 Monosodium Glutamate From the Republic of Korea, Antidumping Determination of Sales at Not Less Than Fair Value, 42 FR 10081, February 18, 1977.
7 Monosodium Glutamate From the People’s Republic of China: Final Determination of Sales at Less Than Fair Value and the Final Affirmative Determination of Critical Circumstances, 79 FR 58326, September 29, 2014.
8 Monosodium Glutamate From the Republic of Indonesia: Final Determination of Sales at Less Than Fair Value, 79 FR 58329, September 29, 2014.
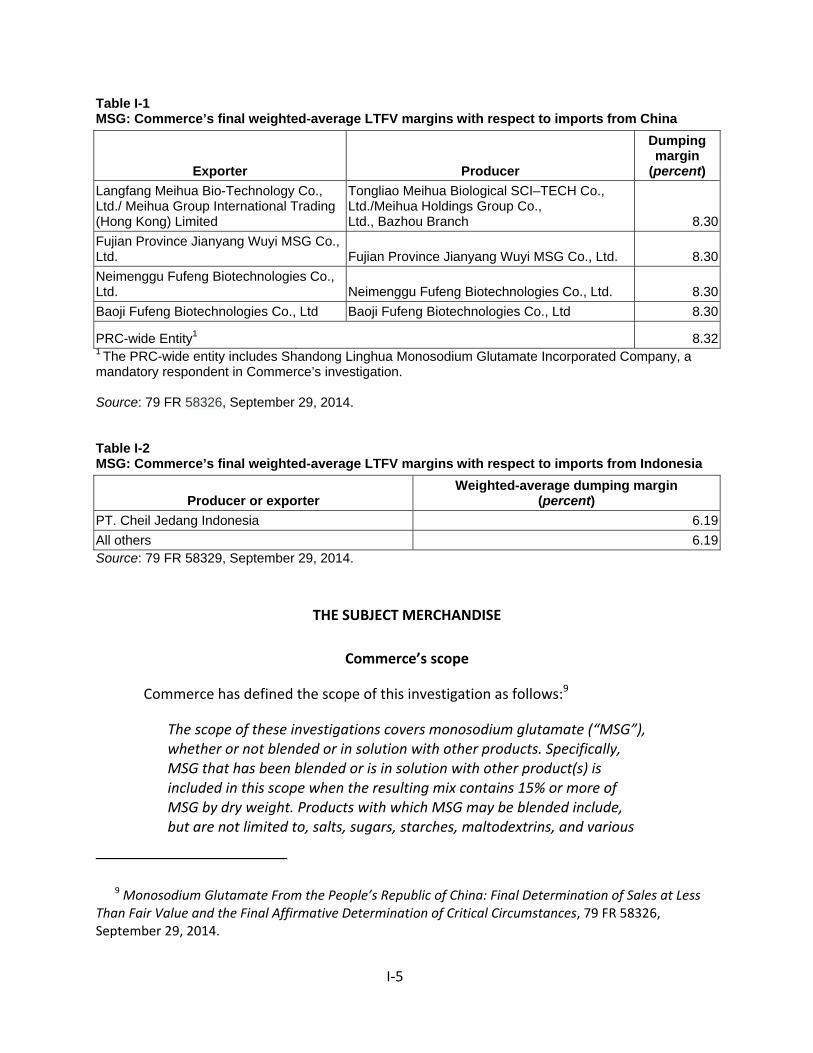
I‐5
Table I-1 MSG: Commerce’s final weighted-average LTFV margins with respect to imports from China
Exporter Producer
Dumping margin
(percent) Langfang Meihua Bio-Technology Co., Ltd./ Meihua Group International Trading (Hong Kong) Limited
Tongliao Meihua Biological SCI–TECH Co., Ltd./Meihua Holdings Group Co., Ltd., Bazhou Branch 8.30
Fujian Province Jianyang Wuyi MSG Co., Ltd. Fujian Province Jianyang Wuyi MSG Co., Ltd. 8.30Neimenggu Fufeng Biotechnologies Co., Ltd. Neimenggu Fufeng Biotechnologies Co., Ltd. 8.30Baoji Fufeng Biotechnologies Co., Ltd Baoji Fufeng Biotechnologies Co., Ltd 8.30
PRC-wide Entity1 8.321 The PRC-wide entity includes Shandong Linghua Monosodium Glutamate Incorporated Company, a mandatory respondent in Commerce’s investigation. Source: 79 FR 58326, September 29, 2014. Table I-2 MSG: Commerce’s final weighted-average LTFV margins with respect to imports from Indonesia
Producer or exporter Weighted-average dumping margin
(percent) PT. Cheil Jedang Indonesia 6.19All others 6.19Source: 79 FR 58329, September 29, 2014.
THE SUBJECT MERCHANDISE
Commerce’s scope
Commerce has defined the scope of this investigation as follows:9
The scope of these investigations covers monosodium glutamate (“MSG”), whether or not blended or in solution with other products. Specifically, MSG that has been blended or is in solution with other product(s) is included in this scope when the resulting mix contains 15% or more of MSG by dry weight. Products with which MSG may be blended include, but are not limited to, salts, sugars, starches, maltodextrins, and various
9 Monosodium Glutamate From the People’s Republic of China: Final Determination of Sales at Less Than Fair Value and the Final Affirmative Determination of Critical Circumstances, 79 FR 58326, September 29, 2014.
I‐6
seasonings. Further, MSG is included in these investigations regardless of physical form (including, but not limited to, substrates, solutions, dry powders of any particle size, or unfinished forms such as MSG slurry), end‐use application, or packaging. MSG in monohydrate form has a molecular formula of C5H8NO4Na•H2O, a Chemical Abstract Service (CAS) registry number of 6106‐04‐3, and a Unique Ingredient Identifier (UNII) number of W81N5U6R6U. MSG in anhydrous form has a molecular formula of C5H8NO4Na, a CAS registry number of 142‐47‐2, and a UNII number of C3C196L9FG. Merchandise covered by the scope of these investigations is currently classified in the Harmonized Tariff Schedule (“HTS”) of the United States at subheading 2922.42.10.00. Merchandise subject to the investigations may also enter under HTS subheadings 2922.42.50.00, 2103.90.72.00, 2103.90.74.00, 2103.90.78.00, 2103.90.80.00, and 2103.90.90.91.The tariff classifications, CAS registry number, and UNII number are provided for convenience and customs purposes; however, the written description of the scope is dispositive.
Tariff treatment
Based upon the scope set forth by the Department of Commerce, information available to the Commission indicates that MSG imported as a separate chemically identified compound is classifiable in subheading 2922.42.10 of the HTS. The column‐1 general rate of duty is 6.5 percent ad valorem. The provisions from chapter 21 cited by Commerce apply to edible preparations, mixed condiments, or mixed seasonings that may contain MSG; it is possible that some trade‐marked MSG products sold for food use might be imported there.10 The general rates of duty for those provisions vary widely, and some of these products are subject to tariff‐rate quotas upon entry.
10 The petitioner is not aware of any subject MSG being imported under the provisions from chapter 21 of the HTS. They state that “the reason that those additional HTS items are added is based on the company's experience in the European Union where an order is in place and there have been a number of circumvention efforts using other HTS codes to get around paying the duties in Europe.” Conference transcript, p. 38 (McPhie).
I‐7
THE PRODUCT
Description and applications
MSG is a white crystalline substance11 used by itself or in blends worldwide primarily as a flavor enhancer in savory foods, such as meat and fish, soups and broths, certain juices and beverages, frozen and ready‐made foods, and sauces and dressings.12 It is used in comparatively smaller volumes in nonfood products, such as detergents, cosmetics, and pharmaceuticals.13
MSG is a salt of glutamic acid,14 which is an amino acid that is synthesized by the human body and naturally present in protein‐containing foods such as meat, vegetables, poultry, and milk (figure I‐1).15 First produced commercially in 1909 by Ajinomoto Corporation of Japan (the parent company of the petitioner), MSG is the largest‐volume amino acid salt produced in the world.16
11 MSG is sold in varying crystal sizes and is highly stable, odorless, and soluble in water. Commercially available MSG has a Chemical Abstract Service (CAS) registry number of 6106‐04‐03 and a Unique Ingredient Identifier (UNII) number of W81N5U6R6U. Petition Vol. 1, p. 5.
The petition includes proposed product scope language, which was used by Commerce as the product scope in these investigations, which contains an error. The molecular formula in the product scope language (C5H8NNaO4) corresponds to the anhydrous form of MSG, whereas the CAS and UNII numbers correspond to the monohydrated form of MSG, having a molecular formula of C5H10NNaO5 (or C5H8NNaO4 H2O). See exhibit I‐6.A in the petition, ***. On July 9, 2014, Commerce requested interested parties to submit comments regarding the molecular formula for MSG subject to these investigations, as well as any revised scope language. On July 21, 2014 the petitioner provided proposed revisions to the scope language in response to Commerce’s request. Commerce subsequently adopted the petitioner’s revised scope language in its final determinations, which correctly identifies the molecular formulas and CAS and UNII numbers for both the monohydrate and anhydrous forms of MSG.
12 Petition Vol. 1, p. 6. 13 Petition Vol. 1, p. 6 and Exhibit I‐6.B. “{N}eglible” volumes of MSG are used in animal feeds
worldwide. ***. 14 ***. 15 ***. The human body breaks down proteins into their constituent amino acids, including glutamic
acid. As protein is present in many foods, so is glutamic acid. The human body does not synthesize MSG. 16 ***.
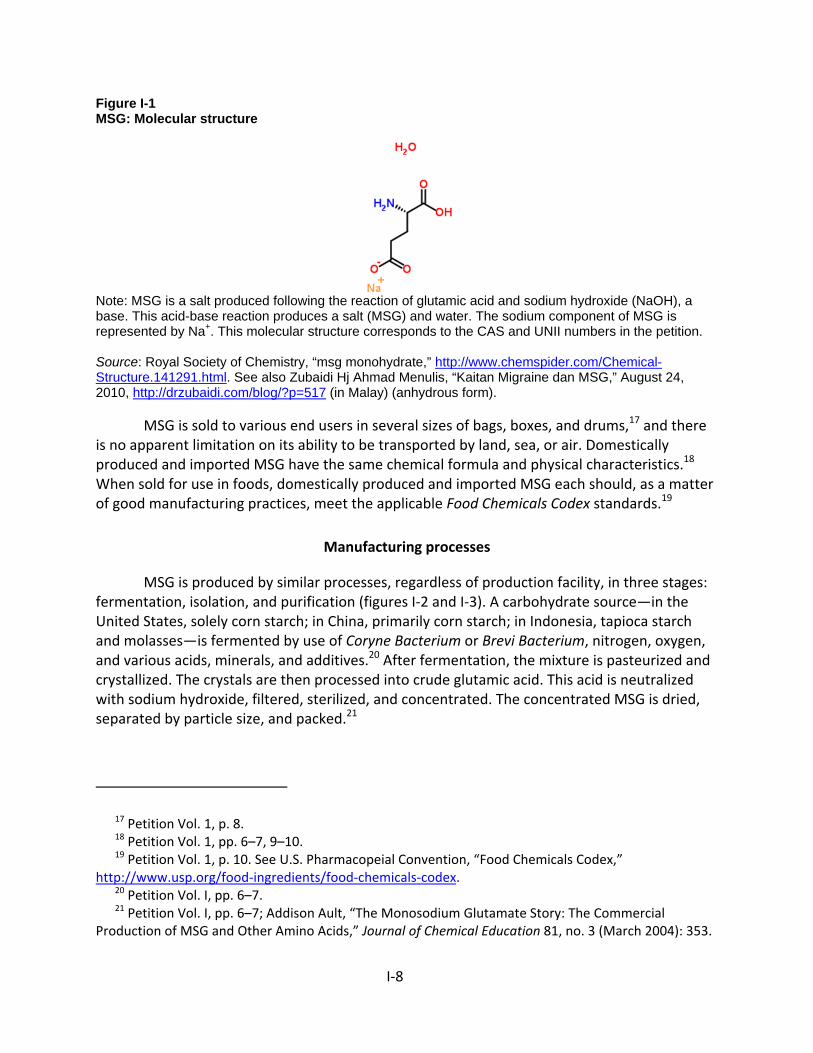
I‐8
Figure I-1 MSG: Molecular structure
Note: MSG is a salt produced following the reaction of glutamic acid and sodium hydroxide (NaOH), a base. This acid-base reaction produces a salt (MSG) and water. The sodium component of MSG is represented by Na+. This molecular structure corresponds to the CAS and UNII numbers in the petition. Source: Royal Society of Chemistry, “msg monohydrate,” http://www.chemspider.com/Chemical-Structure.141291.html. See also Zubaidi Hj Ahmad Menulis, “Kaitan Migraine dan MSG,” August 24, 2010, http://drzubaidi.com/blog/?p=517 (in Malay) (anhydrous form).
MSG is sold to various end users in several sizes of bags, boxes, and drums,17 and there is no apparent limitation on its ability to be transported by land, sea, or air. Domestically produced and imported MSG have the same chemical formula and physical characteristics.18 When sold for use in foods, domestically produced and imported MSG each should, as a matter of good manufacturing practices, meet the applicable Food Chemicals Codex standards.19
Manufacturing processes
MSG is produced by similar processes, regardless of production facility, in three stages: fermentation, isolation, and purification (figures I‐2 and I‐3). A carbohydrate source—in the United States, solely corn starch; in China, primarily corn starch; in Indonesia, tapioca starch and molasses—is fermented by use of Coryne Bacterium or Brevi Bacterium, nitrogen, oxygen, and various acids, minerals, and additives.20 After fermentation, the mixture is pasteurized and crystallized. The crystals are then processed into crude glutamic acid. This acid is neutralized with sodium hydroxide, filtered, sterilized, and concentrated. The concentrated MSG is dried, separated by particle size, and packed.21
17 Petition Vol. 1, p. 8. 18 Petition Vol. 1, pp. 6–7, 9–10. 19 Petition Vol. 1, p. 10. See U.S. Pharmacopeial Convention, “Food Chemicals Codex,”
http://www.usp.org/food‐ingredients/food‐chemicals‐codex. 20 Petition Vol. I, pp. 6–7. 21 Petition Vol. I, pp. 6–7; Addison Ault, “The Monosodium Glutamate Story: The Commercial
Production of MSG and Other Amino Acids,” Journal of Chemical Education 81, no. 3 (March 2004): 353.
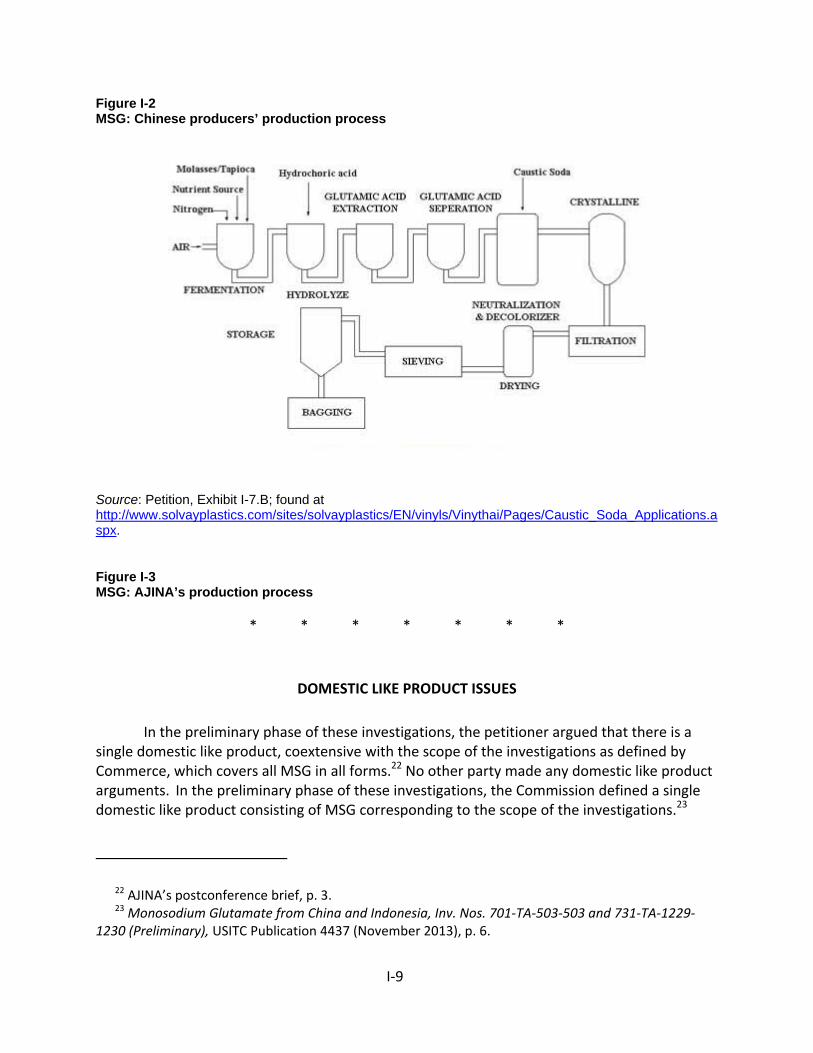
I‐9
Figure I-2 MSG: Chinese producers’ production process
Source: Petition, Exhibit I-7.B; found at http://www.solvayplastics.com/sites/solvayplastics/EN/vinyls/Vinythai/Pages/Caustic_Soda_Applications.aspx.
Figure I-3 MSG: AJINA’s production process
* * * * * * *
DOMESTIC LIKE PRODUCT ISSUES
In the preliminary phase of these investigations, the petitioner argued that there is a single domestic like product, coextensive with the scope of the investigations as defined by Commerce, which covers all MSG in all forms.22 No other party made any domestic like product arguments. In the preliminary phase of these investigations, the Commission defined a single domestic like product consisting of MSG corresponding to the scope of the investigations.23
22 AJINA’s postconference brief, p. 3. 23 Monosodium Glutamate from China and Indonesia, Inv. Nos. 701‐TA‐503‐503 and 731‐TA‐1229‐
1230 (Preliminary), USITC Publication 4437 (November 2013), p. 6.
I‐10
In these final investigations, the petitioner again argues that the Commission should define a single domestic like product consisting of MSG corresponding to the scope of the investigations.24 Akzo Nobel submitted a U.S. producer questionnaire in these final investigations, asserting that its product, ***.25 AJINA argues that the domestic like product should not include ***.26 In addition, AJINA claims that *** ***.27 Respondents CJ America and CJ Indonesia have no position on whether Akzo Nobel is a producer of MSG.28
As shown in table I‐3, MSG as defined in the scope and *** have different molecular formulas and CAS and UNII numbers and are imported under different HTS provisions.
Table I-3 MSG and ***: Molecular formulas, CAS and UNII numbers, and HTS provisions
Molecular formula CAS number UNII number HTS provisions MSG C5H8NO4Na•H2O
(monohydrate); C5H8NO4Na (anhydrous)
6106-04-3 (monohydrate); 142-47-2 (anhydrous)
W81N5U6R6U (monohydrate); C3C196L9FG (anhydrous)
2922.42.10.00 (mixtures containing MSG may also enter under 2922.42.50.00, 2103.90.72.00, 2103.90.74.00, 2103.90.78.00, 2103.90.80.00, and 2103.90.90.91)
*** *** *** *** *** Note: The molecular formula for *** is also listed as ***. The tariff description for provision *** is ***. Sources: ***; ***; ***.
As shown in figures I‐1 and I‐4, MSG and *** have different molecular structures. Figure I-4 ***: Molecular structure
* * * * * * *
24 Petitioner’s prehearing brief, p. 4. 25 Akzo Nobel Functional Chemical’s producers’ questionnaire, p. 36. 26 AJINA further states that ***. 27 Petitioner’s prehearing brief, pp. 4‐16. See Akzo Nobel Functional Chemical’s producers’
questionnaire, p. 36 and attachment. ***. 28 Hearing transcript, p. 148 (Cunningham).
I‐11
MSG and *** have different primary uses. MSG is sold and used principally as a flavor enhancer in food. ***.29
MSG and *** are each produced ***.30 Similarly, ***.31 ***.32 Therefore, when considering standard chemistry definitions, *** is more appropriately classified as a compound with an MSG input than as a mixture of MSG and appears to be outside the scope of these investigations.
29 Akzo Nobel Functional Chemical’s producers’ questionnaire, p. 36 and attachment. 30 Petition Vol. I, p. 7. 31 Figure I‐3; Petitioner’s prehearing brief, Exhibit 5. 32 In its producers’ questionnaire response, Akzo Nobel states that ***. Akzo Nobel Functional
Chemical’s producers’ questionnaire, p. 36. The Dictionary of Scientific and Technical Terms defines a mixture as a substance in which the “components are not in a fixed proportion to each other.” Daniel N. Lapedes, ed., McGraw‐Hill Dictionary of Scientific and Technical Terms, (New York: McGraw‐Hill Book Co., 1974), p. 955. The Handbook of Chemistry and Physics defines a mixture as consisting “of two or more substances intermingled with no constant percentage composition, and with each component retaining its essential original properties.” Robert C. Weast, ed., Handbook of Chemistry and Physics, 57th ed. (Cleveland: CRC Press, 1976), p. F‐112. For example, ***.
The Dictionary of Scientific and Technical Terms defines a compound as a “substance whose molecules consist of unlike atoms and whose constituents cannot be separated by physical means.” Daniel N. Lapedes, ed., McGraw‐Hill Dictionary of Scientific and Technical Terms, (New York: McGraw‐Hill Book Co., 1974), p. 306. The Handbook of Chemistry and Physics defines compound as a substance “containing more than one constituent element and having properties, on the whole, different from those which their constituents had as elementary substances.” Robert C. Weast, ed., Handbook of Chemistry and Physics, 57th ed. (Cleveland: CRC Press, 1976), p. F‐97. ***.

II‐1
PART II: CONDITIONS OF COMPETITION IN THE U.S. MARKET
U.S. MARKET CHARACTERISTICS
The primary use of MSG is as a food additive, but it is also used in consumer products (such as in detergents) and industrial applications. According to Petitioner, “MSG used as a food additive must adhere to specifications set forth by the Food Chemicals Codex (FCC)(8th ed.) Similarly, MSG used in pharmaceutical products must satisfy the U.S. Pharmacopeia (“USP”) standards. All U.S.‐produced MSG meets both FCC and USP standards. Chinese and Indonesian origin MSG also generally meets these specifications, although some MSG of lower purity is known to exist in China.”1 MSG is sold as a commodity with no differences in grades or flavors between domestic and foreign MSG. According to Petitioner, the “vast majority of MSG produced in the U.S. and in China and Indonesia meet the requirements for food safety,” there are no “grades” or “flavors” of MSG, and the range of different crystal sizes is not price‐differentiated.”2 In the petition, AJINA stated, “MSG is sold into four market segments ‐ large scale food processors, the Chinese food service trade, other distributors, and retail.”3
U.S. PURCHASERS
The Commission received 31 questionnaire responses from firms that bought MSG during January 2011‐ June 2014. These firms purchased 96.1 million pounds of MSG in 2013. The largest responding purchasers of MSG in 2013 were ***. Nineteen responding purchasers reported being food processors and nine responding purchasers reported being distributors. Two purchasers *** reported using MSG to make household and industrial cleaning and personal care products. *** reported using MSG in ***.4 5
CHANNELS OF DISTRIBUTION
AJINA and U.S. importers sold MSG to end users and through distributors, though shares varied and shifted across suppliers and across years. AJINA sold largely to end users in 2011 and 2012, but recently, AJINA’s sales have been more evenly divided between distributors and end users (table II‐1). AJINA stated that there “are four general categories of customers: (i) direct sales to large scale food processors, accounting for approximately *** percent of the market; (ii) sales to Chinese food service trade through distributors; (iii) sales through other distributors;
1 Petitioner, postconference brief, p. 5 and Petitioner, prehearing brief, p. 20. 2 Petitioner, postconference brief, p. 6 and 14. 3 Petition, p. 19. 4 *** purchaser questionnaire, question IV‐9. 5 Purchaser *** did not respond to Purchaser questionnaire, question III‐1.
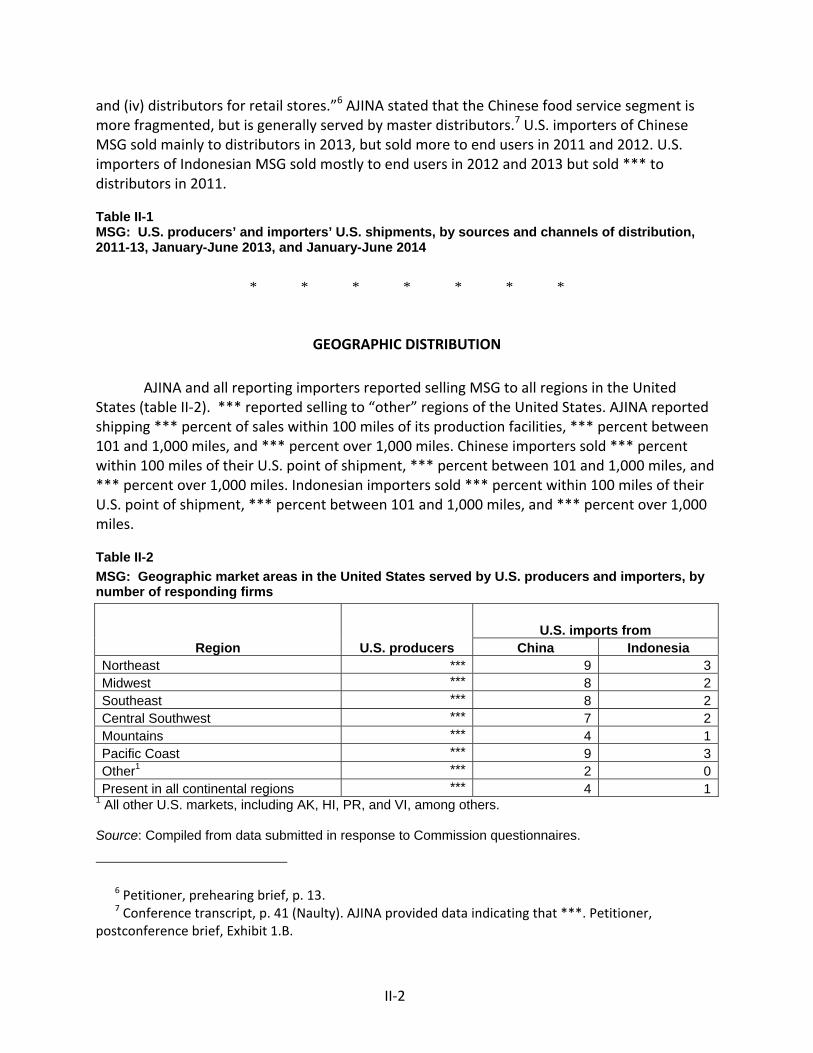
II‐2
and (iv) distributors for retail stores.”6 AJINA stated that the Chinese food service segment is more fragmented, but is generally served by master distributors.7 U.S. importers of Chinese MSG sold mainly to distributors in 2013, but sold more to end users in 2011 and 2012. U.S. importers of Indonesian MSG sold mostly to end users in 2012 and 2013 but sold *** to distributors in 2011.
Table II-1 MSG: U.S. producers’ and importers’ U.S. shipments, by sources and channels of distribution, 2011-13, January-June 2013, and January-June 2014
* * * * * * *
GEOGRAPHIC DISTRIBUTION
AJINA and all reporting importers reported selling MSG to all regions in the United States (table II‐2). *** reported selling to “other” regions of the United States. AJINA reported shipping *** percent of sales within 100 miles of its production facilities, *** percent between 101 and 1,000 miles, and *** percent over 1,000 miles. Chinese importers sold *** percent within 100 miles of their U.S. point of shipment, *** percent between 101 and 1,000 miles, and *** percent over 1,000 miles. Indonesian importers sold *** percent within 100 miles of their U.S. point of shipment, *** percent between 101 and 1,000 miles, and *** percent over 1,000 miles.
Table II-2 MSG: Geographic market areas in the United States served by U.S. producers and importers, by number of responding firms
Region U.S. producers U.S. imports from
China Indonesia Northeast *** 9 3Midwest *** 8 2Southeast *** 8 2Central Southwest *** 7 2Mountains *** 4 1Pacific Coast *** 9 3Other1 *** 2 0Present in all continental regions *** 4 1
1 All other U.S. markets, including AK, HI, PR, and VI, among others. Source: Compiled from data submitted in response to Commission questionnaires.
6 Petitioner, prehearing brief, p. 13. 7 Conference transcript, p. 41 (Naulty). AJINA provided data indicating that ***. Petitioner,
postconference brief, Exhibit 1.B.
II‐3
SUPPLY AND DEMAND CONSIDERATIONS
U.S. supply
Domestic Production
Based on available information, the U.S. producer of MSG, AJINA, has the ability to respond to changes in demand with small‐to‐moderate changes in the quantity of shipments of U.S.‐produced MSG to the U.S. market. The main contributing factors to the small‐to‐moderate degree of responsiveness of supply is the ability to switch shipments between alternate markets and some ability to use inventories to increase shipments; supply responsiveness is constrained by limited excess capacity.
Industry capacity
Domestic capacity utilization fluctuated during the period of investigation. Capacity utilization dropped from *** percent in 2011 to *** percent in 2012 and increased to *** percent in 2013. AJINA’s fluctuating capacity utilization rate was a result of the decrease in ***. Consequently, AJINA’s *** remained constant during the period of investigation. This relatively high level of capacity utilization suggests that the U.S. producer may have limited ability to increase production of MSG in response to an increase in relative prices.8
Alternative markets
AJINA’s exports, as a percentage of total shipments, decreased slightly over the period of investigation. AJINA’s export shipments, as a percentage of total shipments, increased from *** percent in 2011 to *** percent in 2012 before decreasing to *** percent in 2013. This level of exports indicates that AJINA may have some ability to shift shipments between the U.S. market and other markets in response to price changes. *** and *** were the top export destinations.
Inventory levels
AJINA’s end‐of‐period inventories, as a percentage of total shipments, increased during the period of investigation from *** percent to *** percent.9 These inventory levels suggest that AJINA may have some ability to respond to changes in demand with changes in the quantity shipped from inventories.
8 Petitioner stated that “Petitioner’s Iowa plant operates 24/7 all year round with limited ability to adjust production levels to meet changing cost and demand conditions apart from down time for maintenance.” Conference transcript, p. 27 (Malashevich).
9 These inventories contain product that was ***.
II‐4
Production alternatives
AJINA *** producing any other products on the same equipment it uses to produce MSG.
Supply constraints
AJINA reported *** as a supply constraint.
Subject imports from China10
The Commission received one questionnaire response from the Chinese producer ***. Based on available information, producers of MSG from China have the ability to respond to changes in demand with small‐to‐moderate changes in the quantity of shipments of MSG to the U.S. market. The main contributing factors to the degree of responsiveness of supply are ***. Dampening Chinese producers’ responsiveness is the decrease in the ***.
Industry capacity
*** reported its capacity to produce MSG as *** for the period of investigation. *** reported being able to produce *** million pounds of MSG in 2012 and 2013 and *** million pounds for both interim periods.11 According to the Petitioner, “from 2010 to 2012, total Chinese MSG unused production capacity grew by *** percent. The gap between Chinese MSG production capacity and actual production increased from about *** pounds in 2010 to about *** pounds in 2012.”12 In addition, imports of MSG from China increased by 3.7 percent, from in 56.6 million pounds in 2011 to 58.7 million pounds in 2013.13
Alternative markets
*** did not report data for home market and export shipments.
Inventory levels
*** did not report inventory data for the period of investigation. For importers of MSG from China, inventories as a share of U.S. shipments decreased from *** percent in 2011 to *** percent in 2013.
10 *** did not provide its export data. The Commission received 8 responses from importers of Chinese MSG covering *** percent of total MSG imports from China in 2013.
11 *** did not report capacity for 2011. 12 Petitioner, postconference brief, pp. 28‐29 and Petitioner, prehearing brief, p. 28. 13 During the preliminary stage, imports of MSG from China increased by 106.8 percent, from 27.6
million pounds in 2010 to 57.1 million pounds in 2012.
II‐5
Production alternatives
*** stated that it could switch production from MSG to ***.
Supply constraints
*** reported that ***.
Subject imports from Indonesia14
The Commission received three questionnaires from Indonesian producers. Based on available information, producers of MSG from Indonesia have the ability to respond to changes in demand with moderate changes in the quantity of shipments of MSG to the U.S. market. The main contributing factors to this degree of responsiveness are high levels of exports to alternate markets and increasing levels of inventories. Dampening Indonesian producers’ responsiveness is the high level of capacity utilization.
Industry capacity
Indonesian capacity utilization increased from *** percent in 2011 to *** percent in 2013. This relatively high level of capacity utilization suggests that Indonesian producers may have limited ability to increase production in response to an increase in relative prices.
Alternative markets
Indonesian producers reported exporting to the United States throughout the period of investigation. Indonesian exports to the United States, as a percentage of total shipments, increased from *** percent in 2011 to *** percent in 2013. Indonesian producers’ total export shipments, as a percentage of total shipments, increased from *** percent in 2011 to *** percent in 2013 indicating that Indonesian producers may have the ability to shift shipments between their home market and other markets in response to price changes.
Inventory levels
Indonesian producers’ end‐of‐period inventories, as a percentage of total shipments, fluctuated during the period of investigation. Indonesian producers’ end‐of‐period inventories, as a percentage of total shipments, increased from *** percent in 2011 to *** percent in 2012 and decreased to *** percent in 2013. These inventory levels suggest that Indonesian producers may have some ability to respond to changes in demand with changes in the quantity shipped from inventories.
14 The Commission received three Indonesian foreign producer questionnaires covering *** percent of U.S. imports from Indonesia in 2013. The Commission received three responses from U.S. importers of Indonesian MSG covering *** percent of total MSG imports from Indonesia in 2013.
II‐6
Production alternatives
*** responding Indonesian producers stated that they could switch production from MSG to other products.
Supply constraints
Two responding Indonesian producers reported that ***.
Nonsubject imports
The largest source of nonsubject imports during 2011‐13 was Brazil, which accounted for 77.2 percent of nonsubject imports in 2013. Petitioners note that “The majority of non‐subject imports can be accounted for by AJINA’s own imports from its affiliates, ***, ***, {and that} when the volume of non‐subject imports is adjusted to exclude the imports from AJINA’s affiliates (the pricing of which AJINA controls) the remaining nonsubject imports are commercially insignificant in relation to the very large and increasing volumes from China and Indonesia.”15
New suppliers
Three of 23 purchasers indicated that new suppliers entered the U.S. market since 2011. Three purchasers cited ***. *** also reported *** as a new supplier.
U.S. demand
Based on available information, the overall demand for MSG is likely to experience small changes in response to changes in price. The main contributing factors to the small changes in U.S. demand for MSG are the lack of substitute products and the small cost share of MSG in most of its end‐use products. In terms of demand, AJINA reported that it looks to food trends and activities in the food market and taste to assess U.S. demand trends.16
End uses
U.S. demand for MSG depends on the demand for U.S.‐produced downstream products. Reported end uses for MSG include processed foods, such as canned soups, ready‐made food, sauces, spice mixes, and dressings and to a lesser extent detergents, cosmetics, and pharmaceuticals. Seven of 19 responding purchasers reported an increase in demand for their end uses since 2011. Three purchasers, ***, reported a decrease in demand for MSG due to
15 Petitioner, postconference brief, Exhibit 1, p. 4 and Petitioner, prehearing brief, p. 29. 16 Conference transcript, p. 51 (Naulty).
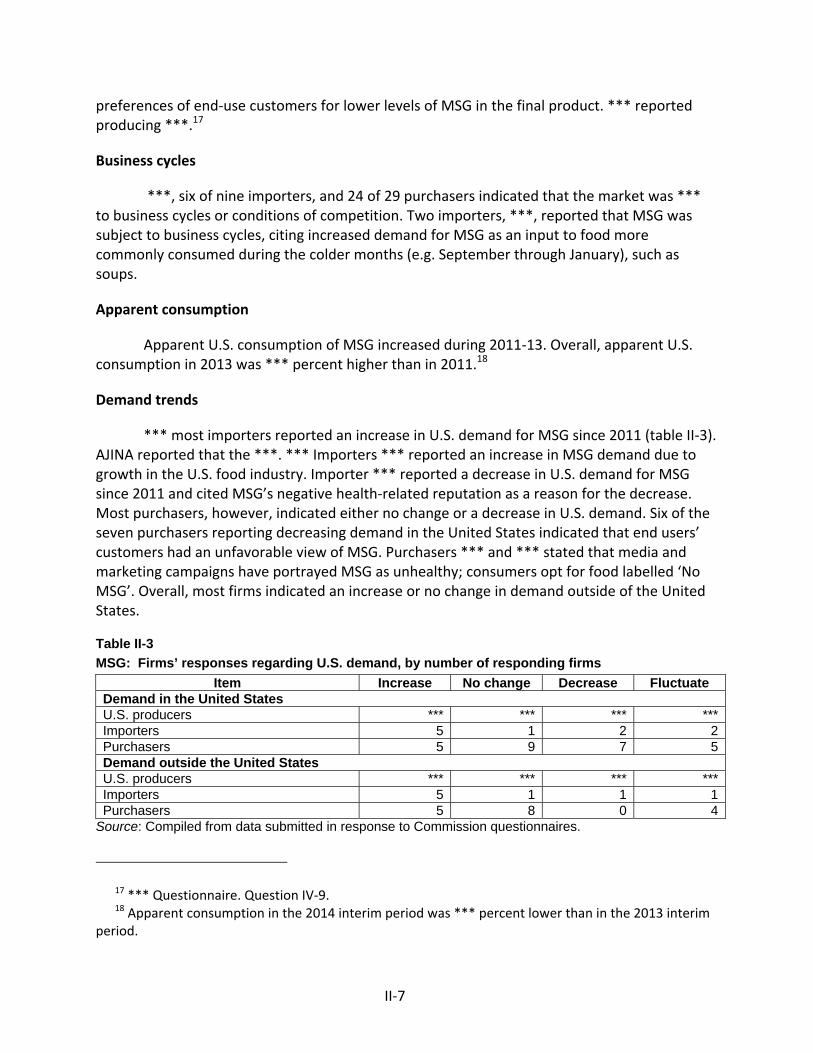
II‐7
preferences of end‐use customers for lower levels of MSG in the final product. *** reported producing ***.17
Business cycles
***, six of nine importers, and 24 of 29 purchasers indicated that the market was *** to business cycles or conditions of competition. Two importers, ***, reported that MSG was subject to business cycles, citing increased demand for MSG as an input to food more commonly consumed during the colder months (e.g. September through January), such as soups.
Apparent consumption
Apparent U.S. consumption of MSG increased during 2011‐13. Overall, apparent U.S. consumption in 2013 was *** percent higher than in 2011.18
Demand trends
*** most importers reported an increase in U.S. demand for MSG since 2011 (table II‐3). AJINA reported that the ***. *** Importers *** reported an increase in MSG demand due to growth in the U.S. food industry. Importer *** reported a decrease in U.S. demand for MSG since 2011 and cited MSG’s negative health‐related reputation as a reason for the decrease. Most purchasers, however, indicated either no change or a decrease in U.S. demand. Six of the seven purchasers reporting decreasing demand in the United States indicated that end users’ customers had an unfavorable view of MSG. Purchasers *** and *** stated that media and marketing campaigns have portrayed MSG as unhealthy; consumers opt for food labelled ‘No MSG’. Overall, most firms indicated an increase or no change in demand outside of the United States.
Table II-3 MSG: Firms’ responses regarding U.S. demand, by number of responding firms
Item Increase No change Decrease Fluctuate Demand in the United States U.S. producers *** *** *** ***Importers 5 1 2 2Purchasers 5 9 7 5Demand outside the United States U.S. producers *** *** *** ***Importers 5 1 1 1Purchasers 5 8 0 4
Source: Compiled from data submitted in response to Commission questionnaires.
17 *** Questionnaire. Question IV‐9. 18 Apparent consumption in the 2014 interim period was *** percent lower than in the 2013 interim
period.
II‐8
Substitute Products
One importer and five purchasers reported substitutes for MSG. In food preparation, yeast and soy sauce powder can be substituted for MSG. *** reported using MSG in the production of the chemical compound ***. *** reported no substitutes for MSG in ***, but *** can be substituted with other chemicals for the household cleaners and *** end uses.
Cost share
MSG is primarily used as a food additive. MSG accounts for a small share of the cost of the food processing end‐use products in which it is used. Reported cost shares for some end‐uses, such as canned soup, were between *** percent. When MSG was used for other food end uses, such as spice mixes, MSG’s cost share *** of the end use product. Cost share may be relatively larger for non‐food processing applications. For ***, *** reported using MSG to create ***. MSG accounts for *** percent of ***.
SUBSTITUTABILITY ISSUES
The degree of substitution between domestic and imported MSG depends upon such factors as relative prices, quality (e.g., grade standards, reliability of supply, defect rates, etc.), and conditions of sale (e.g., price discounts/rebates, lead times between order and delivery dates, payment terms, product services, etc.). Based on available data, staff believes that there is high degree of substitutability between domestically produced MSG and MSG imported from subject sources.
Lead times
AJINA and most importers reported selling MSG from inventories. AJINA reported that *** percent of its commercial shipments were from inventories, with lead times averaging *** days. The remaining *** percent were produced‐to‐order, with lead times averaging *** days. Importers of MSG from China and Indonesia reported that *** percent of their commercial shipments were from U.S. inventories, with lead times averaging 3 to 7 days. Importers of MSG from China and Indonesia reported selling *** percent produced‐to‐order, with lead times averaging *** days. The remaining sales came from foreign inventories, with lead times averaging *** days.
Knowledge of country sources
Twenty‐three purchasers indicated they had marketing/pricing knowledge of domestic MSG, 22 of MSG from China, 14 of MSG from Indonesia, and 5 of MSG from Brazil.
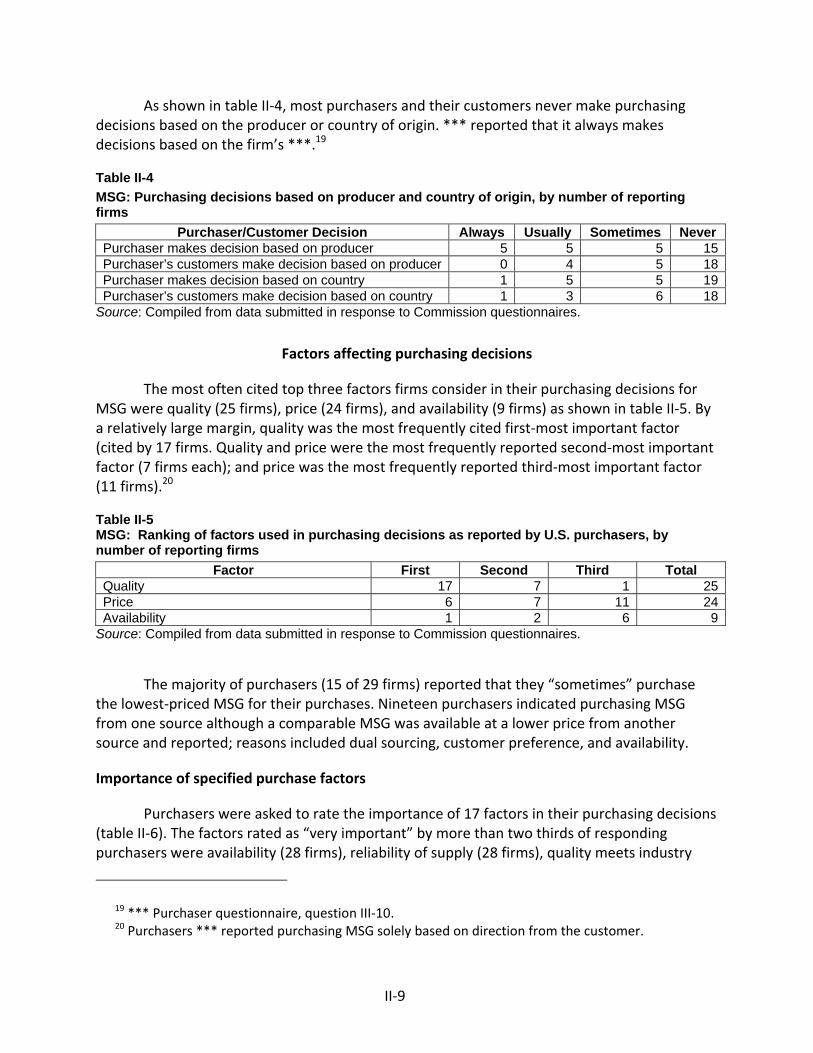
II‐9
As shown in table II‐4, most purchasers and their customers never make purchasing decisions based on the producer or country of origin. *** reported that it always makes decisions based on the firm’s ***.19
Table II-4 MSG: Purchasing decisions based on producer and country of origin, by number of reporting firms
Purchaser/Customer Decision Always Usually Sometimes Never Purchaser makes decision based on producer 5 5 5 15Purchaser’s customers make decision based on producer 0 4 5 18Purchaser makes decision based on country 1 5 5 19Purchaser’s customers make decision based on country 1 3 6 18
Source: Compiled from data submitted in response to Commission questionnaires.
Factors affecting purchasing decisions
The most often cited top three factors firms consider in their purchasing decisions for MSG were quality (25 firms), price (24 firms), and availability (9 firms) as shown in table II‐5. By a relatively large margin, quality was the most frequently cited first‐most important factor (cited by 17 firms. Quality and price were the most frequently reported second‐most important factor (7 firms each); and price was the most frequently reported third‐most important factor (11 firms).20
Table II-5 MSG: Ranking of factors used in purchasing decisions as reported by U.S. purchasers, by number of reporting firms
Factor First Second Third Total Quality 17 7 1 25Price 6 7 11 24Availability 1 2 6 9
Source: Compiled from data submitted in response to Commission questionnaires.
The majority of purchasers (15 of 29 firms) reported that they “sometimes” purchase the lowest‐priced MSG for their purchases. Nineteen purchasers indicated purchasing MSG from one source although a comparable MSG was available at a lower price from another source and reported; reasons included dual sourcing, customer preference, and availability.
Importance of specified purchase factors
Purchasers were asked to rate the importance of 17 factors in their purchasing decisions (table II‐6). The factors rated as “very important” by more than two thirds of responding purchasers were availability (28 firms), reliability of supply (28 firms), quality meets industry
19 *** Purchaser questionnaire, question III‐10. 20 Purchasers *** reported purchasing MSG solely based on direction from the customer.
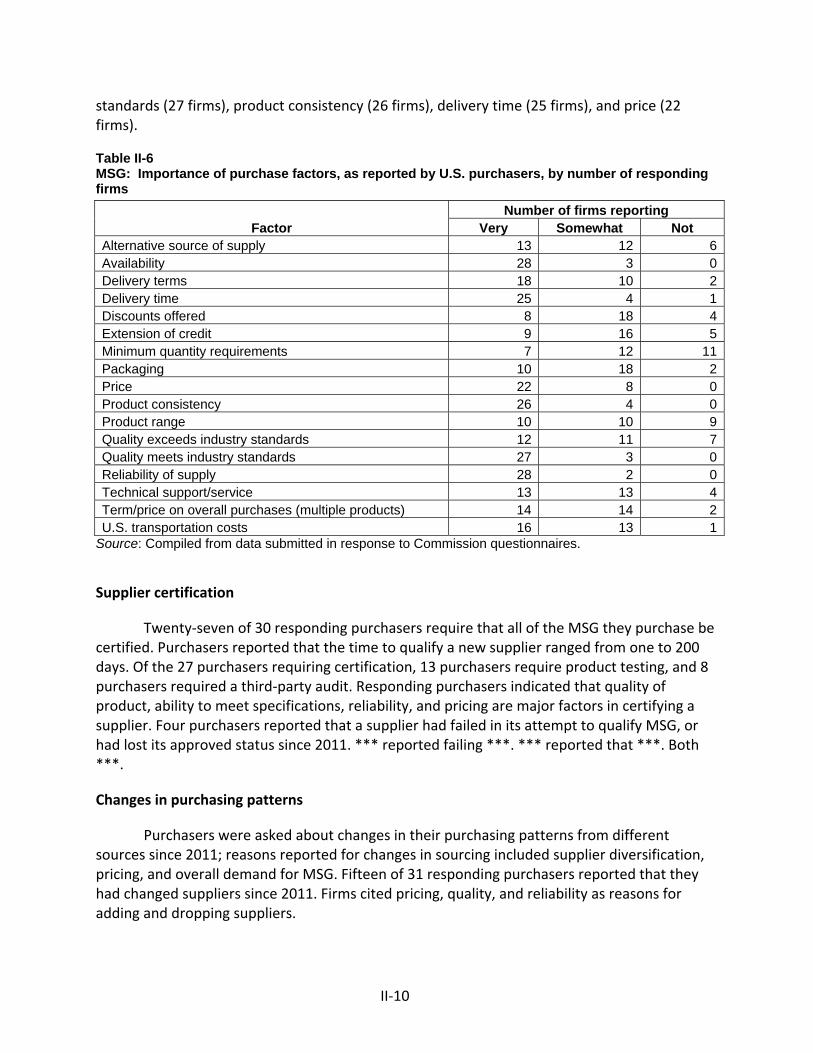
II‐10
standards (27 firms), product consistency (26 firms), delivery time (25 firms), and price (22 firms).
Table II-6 MSG: Importance of purchase factors, as reported by U.S. purchasers, by number of responding firms
Factor Number of firms reporting
Very Somewhat Not Alternative source of supply 13 12 6Availability 28 3 0Delivery terms 18 10 2Delivery time 25 4 1Discounts offered 8 18 4Extension of credit 9 16 5Minimum quantity requirements 7 12 11Packaging 10 18 2Price 22 8 0Product consistency 26 4 0Product range 10 10 9Quality exceeds industry standards 12 11 7Quality meets industry standards 27 3 0Reliability of supply 28 2 0Technical support/service 13 13 4Term/price on overall purchases (multiple products) 14 14 2U.S. transportation costs 16 13 1
Source: Compiled from data submitted in response to Commission questionnaires.
Supplier certification
Twenty‐seven of 30 responding purchasers require that all of the MSG they purchase be certified. Purchasers reported that the time to qualify a new supplier ranged from one to 200 days. Of the 27 purchasers requiring certification, 13 purchasers require product testing, and 8 purchasers required a third‐party audit. Responding purchasers indicated that quality of product, ability to meet specifications, reliability, and pricing are major factors in certifying a supplier. Four purchasers reported that a supplier had failed in its attempt to qualify MSG, or had lost its approved status since 2011. *** reported failing ***. *** reported that ***. Both ***.
Changes in purchasing patterns
Purchasers were asked about changes in their purchasing patterns from different sources since 2011; reasons reported for changes in sourcing included supplier diversification, pricing, and overall demand for MSG. Fifteen of 31 responding purchasers reported that they had changed suppliers since 2011. Firms cited pricing, quality, and reliability as reasons for adding and dropping suppliers.
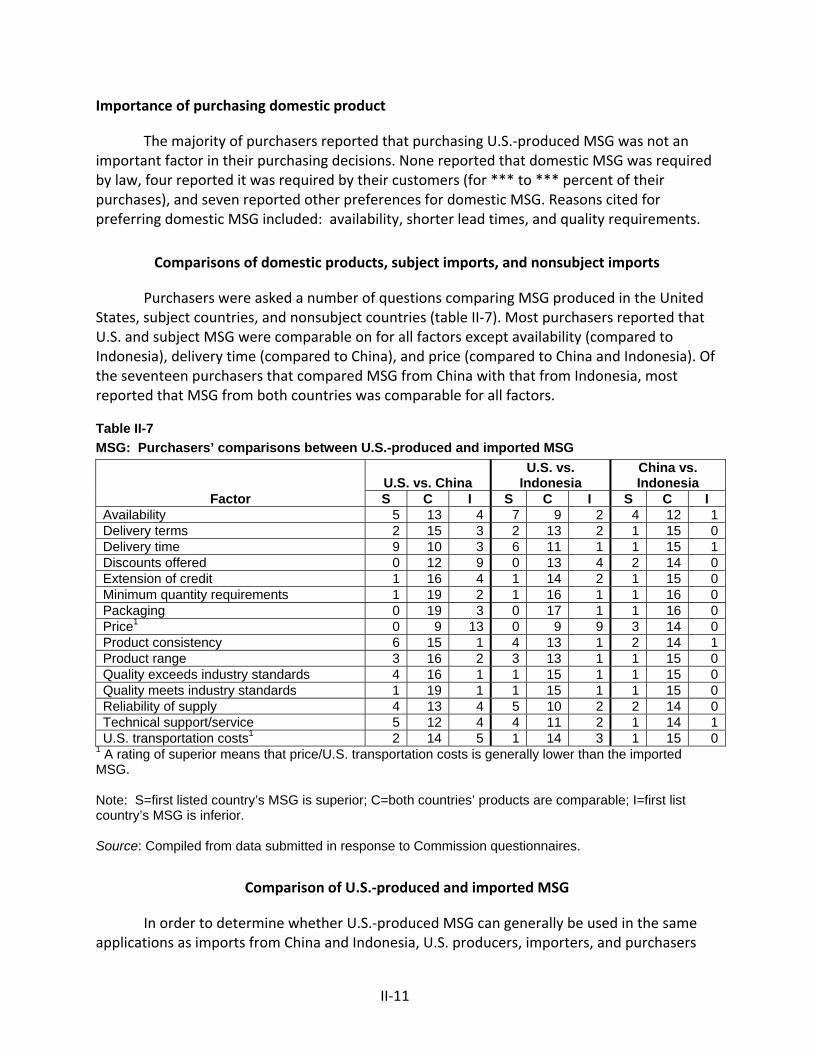
II‐11
Importance of purchasing domestic product
The majority of purchasers reported that purchasing U.S.‐produced MSG was not an important factor in their purchasing decisions. None reported that domestic MSG was required by law, four reported it was required by their customers (for *** to *** percent of their purchases), and seven reported other preferences for domestic MSG. Reasons cited for preferring domestic MSG included: availability, shorter lead times, and quality requirements.
Comparisons of domestic products, subject imports, and nonsubject imports
Purchasers were asked a number of questions comparing MSG produced in the United States, subject countries, and nonsubject countries (table II‐7). Most purchasers reported that U.S. and subject MSG were comparable on for all factors except availability (compared to Indonesia), delivery time (compared to China), and price (compared to China and Indonesia). Of the seventeen purchasers that compared MSG from China with that from Indonesia, most reported that MSG from both countries was comparable for all factors.
Table II-7 MSG: Purchasers’ comparisons between U.S.-produced and imported MSG
Factor U.S. vs. China
U.S. vs. Indonesia
China vs. Indonesia
S C I S C I S C I Availability 5 13 4 7 9 2 4 12 1Delivery terms 2 15 3 2 13 2 1 15 0Delivery time 9 10 3 6 11 1 1 15 1Discounts offered 0 12 9 0 13 4 2 14 0Extension of credit 1 16 4 1 14 2 1 15 0Minimum quantity requirements 1 19 2 1 16 1 1 16 0Packaging 0 19 3 0 17 1 1 16 0Price1 0 9 13 0 9 9 3 14 0Product consistency 6 15 1 4 13 1 2 14 1Product range 3 16 2 3 13 1 1 15 0Quality exceeds industry standards 4 16 1 1 15 1 1 15 0Quality meets industry standards 1 19 1 1 15 1 1 15 0Reliability of supply 4 13 4 5 10 2 2 14 0Technical support/service 5 12 4 4 11 2 1 14 1U.S. transportation costs1 2 14 5 1 14 3 1 15 0
1 A rating of superior means that price/U.S. transportation costs is generally lower than the imported MSG. Note: S=first listed country’s MSG is superior; C=both countries’ products are comparable; I=first list country’s MSG is inferior. Source: Compiled from data submitted in response to Commission questionnaires.
Comparison of U.S.‐produced and imported MSG
In order to determine whether U.S.‐produced MSG can generally be used in the same applications as imports from China and Indonesia, U.S. producers, importers, and purchasers
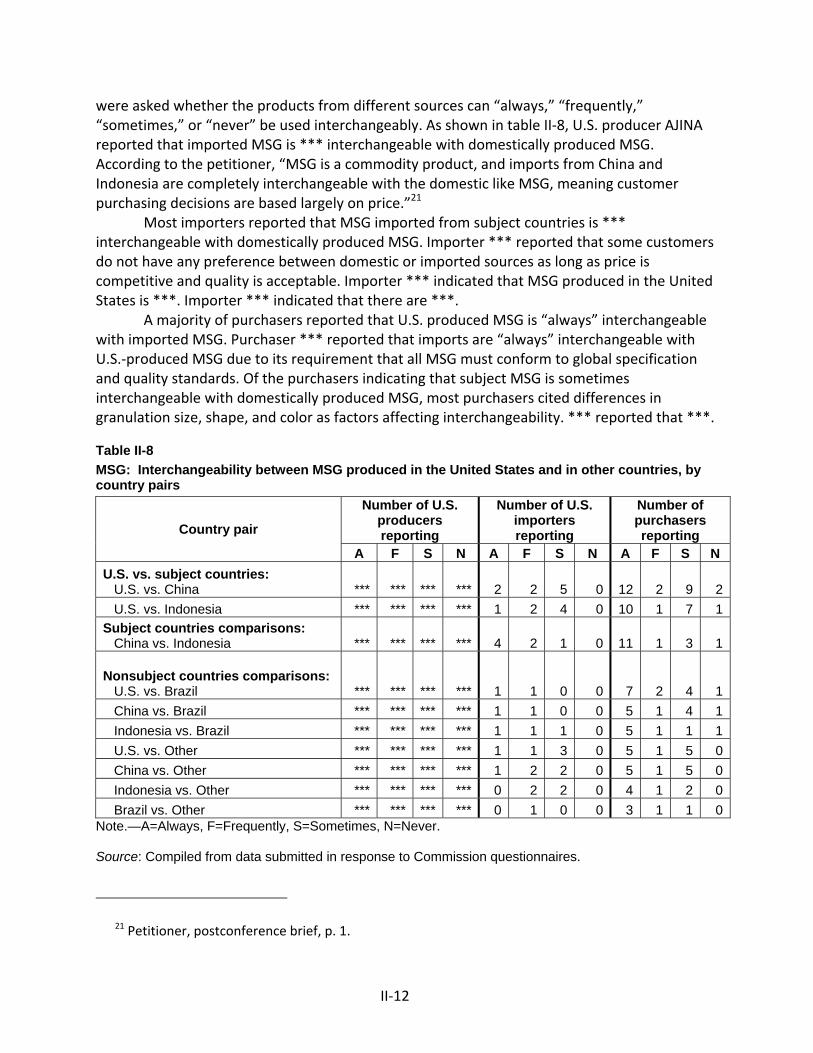
II‐12
were asked whether the products from different sources can “always,” “frequently,” “sometimes,” or “never” be used interchangeably. As shown in table II‐8, U.S. producer AJINA reported that imported MSG is *** interchangeable with domestically produced MSG. According to the petitioner, “MSG is a commodity product, and imports from China and Indonesia are completely interchangeable with the domestic like MSG, meaning customer purchasing decisions are based largely on price.”21
Most importers reported that MSG imported from subject countries is *** interchangeable with domestically produced MSG. Importer *** reported that some customers do not have any preference between domestic or imported sources as long as price is competitive and quality is acceptable. Importer *** indicated that MSG produced in the United States is ***. Importer *** indicated that there are ***.
A majority of purchasers reported that U.S. produced MSG is “always” interchangeable with imported MSG. Purchaser *** reported that imports are “always” interchangeable with U.S.‐produced MSG due to its requirement that all MSG must conform to global specification and quality standards. Of the purchasers indicating that subject MSG is sometimes interchangeable with domestically produced MSG, most purchasers cited differences in granulation size, shape, and color as factors affecting interchangeability. *** reported that ***.
Table II-8 MSG: Interchangeability between MSG produced in the United States and in other countries, by country pairs
Country pair
Number of U.S. producers reporting
Number of U.S. importers reporting
Number of purchasers reporting
A F S N A F S N A F S N U.S. vs. subject countries: U.S. vs. China *** *** *** *** 2 2 5 0 12 2 9 2 U.S. vs. Indonesia *** *** *** *** 1 2 4 0 10 1 7 1Subject countries comparisons: China vs. Indonesia *** *** *** *** 4 2 1 0 11 1 3 1
Nonsubject countries comparisons: U.S. vs. Brazil *** *** *** *** 1 1 0 0 7 2 4 1 China vs. Brazil *** *** *** *** 1 1 0 0 5 1 4 1 Indonesia vs. Brazil *** *** *** *** 1 1 1 0 5 1 1 1 U.S. vs. Other *** *** *** *** 1 1 3 0 5 1 5 0 China vs. Other *** *** *** *** 1 2 2 0 5 1 5 0 Indonesia vs. Other *** *** *** *** 0 2 2 0 4 1 2 0 Brazil vs. Other *** *** *** *** 0 1 0 0 3 1 1 0
Note.—A=Always, F=Frequently, S=Sometimes, N=Never. Source: Compiled from data submitted in response to Commission questionnaires.
21 Petitioner, postconference brief, p. 1.
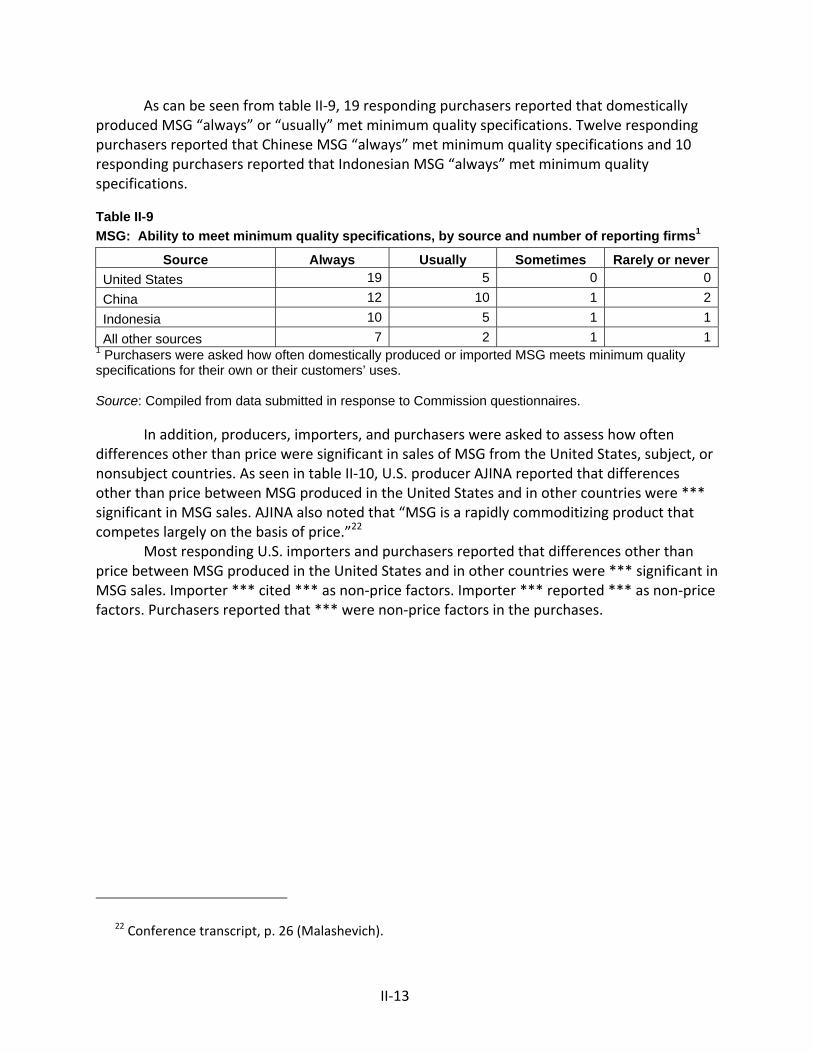
II‐13
As can be seen from table II‐9, 19 responding purchasers reported that domestically produced MSG “always” or “usually” met minimum quality specifications. Twelve responding purchasers reported that Chinese MSG “always” met minimum quality specifications and 10 responding purchasers reported that Indonesian MSG “always” met minimum quality specifications.
Table II-9 MSG: Ability to meet minimum quality specifications, by source and number of reporting firms1
Source Always Usually Sometimes Rarely or never United States 19 5 0 0China 12 10 1 2Indonesia 10 5 1 1All other sources 7 2 1 1
1 Purchasers were asked how often domestically produced or imported MSG meets minimum quality specifications for their own or their customers’ uses. Source: Compiled from data submitted in response to Commission questionnaires.
In addition, producers, importers, and purchasers were asked to assess how often differences other than price were significant in sales of MSG from the United States, subject, or nonsubject countries. As seen in table II‐10, U.S. producer AJINA reported that differences other than price between MSG produced in the United States and in other countries were *** significant in MSG sales. AJINA also noted that “MSG is a rapidly commoditizing product that competes largely on the basis of price.”22
Most responding U.S. importers and purchasers reported that differences other than price between MSG produced in the United States and in other countries were *** significant in MSG sales. Importer *** cited *** as non‐price factors. Importer *** reported *** as non‐price factors. Purchasers reported that *** were non‐price factors in the purchases.
22 Conference transcript, p. 26 (Malashevich).
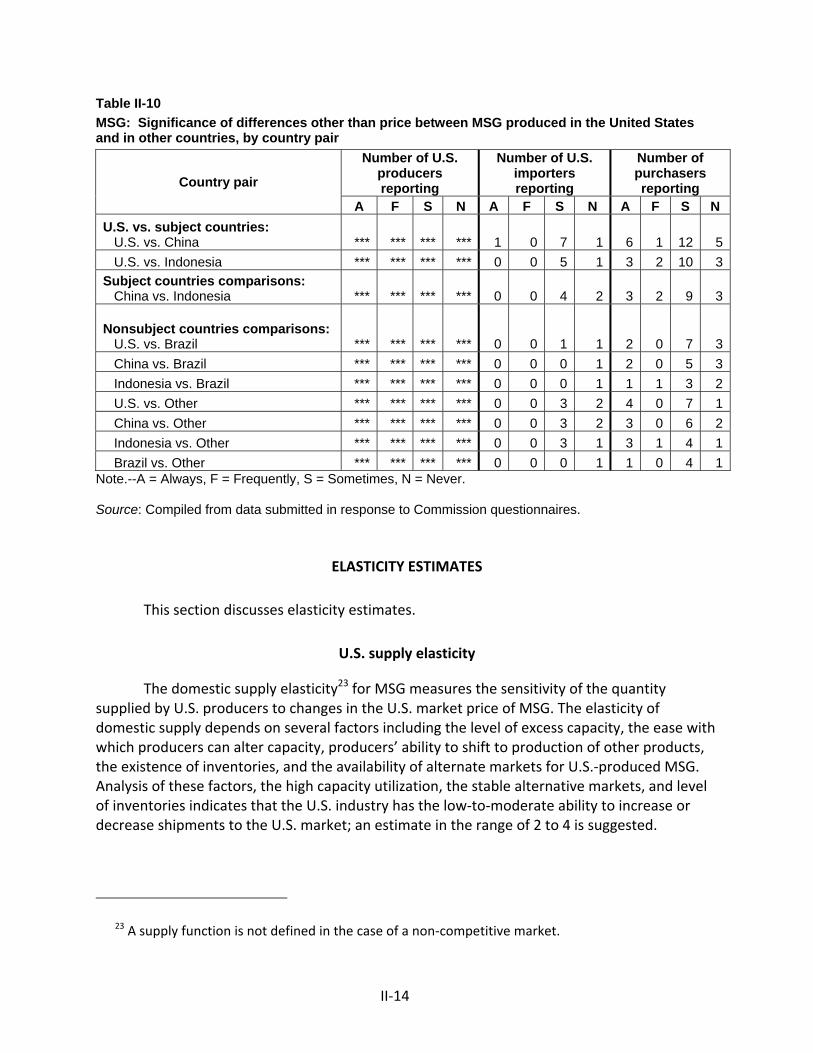
II‐14
Table II-10 MSG: Significance of differences other than price between MSG produced in the United States and in other countries, by country pair
Country pair
Number of U.S. producers reporting
Number of U.S. importers reporting
Number of purchasers reporting
A F S N A F S N A F S N U.S. vs. subject countries: U.S. vs. China *** *** *** *** 1 0 7 1 6 1 12 5 U.S. vs. Indonesia *** *** *** *** 0 0 5 1 3 2 10 3Subject countries comparisons: China vs. Indonesia *** *** *** *** 0 0 4 2 3 2 9 3
Nonsubject countries comparisons: U.S. vs. Brazil *** *** *** *** 0 0 1 1 2 0 7 3 China vs. Brazil *** *** *** *** 0 0 0 1 2 0 5 3 Indonesia vs. Brazil *** *** *** *** 0 0 0 1 1 1 3 2 U.S. vs. Other *** *** *** *** 0 0 3 2 4 0 7 1 China vs. Other *** *** *** *** 0 0 3 2 3 0 6 2 Indonesia vs. Other *** *** *** *** 0 0 3 1 3 1 4 1 Brazil vs. Other *** *** *** *** 0 0 0 1 1 0 4 1
Note.--A = Always, F = Frequently, S = Sometimes, N = Never. Source: Compiled from data submitted in response to Commission questionnaires.
ELASTICITY ESTIMATES
This section discusses elasticity estimates.
U.S. supply elasticity
The domestic supply elasticity23 for MSG measures the sensitivity of the quantity supplied by U.S. producers to changes in the U.S. market price of MSG. The elasticity of domestic supply depends on several factors including the level of excess capacity, the ease with which producers can alter capacity, producers’ ability to shift to production of other products, the existence of inventories, and the availability of alternate markets for U.S.‐produced MSG. Analysis of these factors, the high capacity utilization, the stable alternative markets, and level of inventories indicates that the U.S. industry has the low‐to‐moderate ability to increase or decrease shipments to the U.S. market; an estimate in the range of 2 to 4 is suggested.
23 A supply function is not defined in the case of a non‐competitive market.
II‐15
U.S. demand elasticity
The U.S. demand elasticity for MSG measures the sensitivity of the overall quantity demanded to a change in the U.S. market price of MSG. This estimate depends on factors discussed earlier such as the existence, availability, and commercial viability of substitute products, as well as the component share of the MSG in the production of any downstream products. Based on the available information, the aggregate demand for MSG is likely to be moderately inelastic; a range of –0. 5 to ‐1.0 is suggested.
Substitution elasticity
The elasticity of substitution depends upon the extent of MSG differentiation between the domestic and imported products.24 MSG differentiation, in turn, depends upon such factors as quality (e.g., chemistry, appearance, etc.) and conditions of sale (e.g., availability, sales terms/ discounts/ promotions, etc.). Based on available information, the elasticity of substitution between U.S.‐produced MSG and imported MSG is likely to be in the moderate‐to‐high range of 3 to 5.
24 The substitution elasticity measures the responsiveness of the relative U.S. consumption levels of the subject imports and the domestic like products to changes in their relative prices. This reflects how easily purchasers switch from the U.S. product to the subject products (or vice versa) when prices change.

III‐1
PART III: U.S. PRODUCERS’ PRODUCTION, SHIPMENTS, AND EMPLOYMENT
The Commission analyzes a number of factors in making injury determinations (see 19 U.S.C. §§ 1677(7)(B) and 1677(7)(C)). Information on the dumping margins was presented in Part I of this report and information on the volume and pricing of imports of the subject merchandise is presented in Part IV and Part V. Information on the other factors specified is presented in this section and/or Part VI and (except as noted) is based on the questionnaire response of AJINA that accounted for all U.S. production of MSG during 2013. In addition, the U.S. firm Akzo Nobel Functional Chemicals LLC (“Akzo Nobel”), a U.S. producer of ***, submitted a partial U.S. producer questionnaire response.1 Akzo Nobel *** the orders and is affiliated with ***. Akzo Nobel uses MSG in the ***.
U.S. PRODUCER
The petitioner, AJINA, is the only known U.S. producer of MSG, and its questionnaire response accounted for 100 percent of U.S. production of MSG during the period of investigation.2 AJINA is headquartered in Fort Lee, NJ, and produces MSG at its plant in Eddyville, Iowa. AJINA’s parent company, Ajinomoto Company3 of Japan, discovered and patented MSG in 1909.4 AJINA produces and sells a variety of products other than MSG in the United States, including frozen ethnic foods.5 It recently acquired Windsor Foods, a manufacturer of frozen ethnic foods in the United States; however, Windsor Foods is not a current MSG customer of AJINA and many of its products are made without MSG.6 In addition, as discussed in greater detail below, ***.
1 Akzo Nobel completed the U.S. producer questionnaire ***. Akzo Nobel did not provide any trade data in its questionnaire response; financial data is presented in Appendix E. Commission staff contacted other purchasers who are end users of MSG and produce products that contain 15 percent or more of MSG. *** all indicated that they are not producers of MSG.
2 AJINA has been the sole U.S. producer of MSG since the mid‐1990s. Conference transcript, pp. 58‐60 (Naulty, Barbour).
3 Ajinomoto holds ownership shares in companies that manufacture MSG in Brazil, France, Indonesia, Japan, Malaysia, Peru, Thailand, and Vietnam. Ajinomoto also indirectly holds a 25 percent share in, but does not control, Shangdong Linwei Seasoning Co., Ltd., a Chinese joint venture that manufactures MSG for the Chinese market. Ajinomoto controls two MSG production companies in Indonesia, PT Ajinomoto Indonesia (“Aji Indonesia”) and PT Ajinex International (“Ajinex”). It also owns a non‐controlling 50 percent share of PT Sasa Inti (“Sasa”). Petitioner states that none of these Chinese or Indonesian companies export MSG to the U.S. market. Petition, p. 3.
4 Petition, p. 3. 5 Petitioner’s posthearing brief, p. 1. 6 Hearing transcript, p. 52 (Naulty), and Petitioner’s posthearing brief, Response to Commission
Questions, p. 1.
III‐2
Producers were asked to report any changes in operations since January 2011. AJINA ***. In 2011, AJINA invested in a research and development project targeted at reducing the variable cost of the MSG process. It invested millions of dollars in its Iowa facility to install this technology.7 In 2014, AJINA ***. AJINA estimates it was able to increase capacity by ***.8
U.S. PRODUCTION, CAPACITY, AND CAPACITY UTILIZATION
Table III‐1 and figure III‐1 present AJINA’s production, capacity, and capacity utilization. AJINA’s reported capacity *** between 2011 and 2013 and between the interim periods. Reported production decreased overall by *** percent between 2011 and 2013, after a decrease of *** percent between 2011 and 2012. Production was *** percent higher between the interim periods. AJINA explained that ***. AJINA ***.9
AJINA further explained that ***.10
Table III-1 MSG: AJINA’S production, capacity, and capacity utilization, 2011-13, January-June 2013, and January-June 2014
* * * * * * *
Figure III-1 MSG: AJINA’S production, capacity, and capacity utilization, 2011-13, January-June 2013, and January-June 2014
* * * * * * *
The Commission asked the domestic producer to report constraints on its capacity to produce MSG. AJINA stated that its production volume is constrained by the ***. In addition, AJINA stated that because it runs a continuous batch operation which uses living microorganisms, it generally must shut down production in order to reduce production volumes. For this reason, it is important to run at a high level of capacity utilization.11 AJINA does not produce other products using the same equipment, machinery, and production and related workers employed to produce MSG.12
7 Conference transcript, pp. 16‐17 (Naulty). 8 AJINA’s U.S. producer questionnaire, p. 14. 9 Petitioner’s posthearing brief, Response to Commission Questions, p. 11. 10 AJINA’s U.S. producer questionnaire at p. 14. 11 AJINA’s prehearing brief, p. 31. 12 Conference transcript, p. 36 (Naulty).
III‐3
AJINA’S U.S. SHIPMENTS AND EXPORTS
Table III‐2 presents AJINA’s U.S. shipments, export shipments, and total shipments. The quantity of AJINA’s U.S. shipments decreased from 2011 to 2013 by *** percent, and was *** percent higher in the interim periods. The value of AJINA’s U.S. shipments decreased as well from 2011 to 2013 by *** percent, and was *** percent higher in the interim periods. The unit values of U.S. shipments decreased by *** percent from 2011 to 2013 and was *** percent lower in the interim periods. AJINA reported exporting to ***. Export shipments as a share of total shipments based on quantity were between *** percent from 2011 to 2013.
Table III-2 MSG: AJINA’S U.S. shipments, exports shipments, and total shipments, 2011-13, January-June 2013, and January-June 2014
* * * * * * *
AJINA’S INVENTORIES
Table III‐3 presents AJINA’s end‐of‐period inventories and the ratio of these inventories to AJINA’s production, U.S. shipments, and total shipments over the period examined. AJINA’S inventories of MSG increased by *** percent from 2011 to 2013 and were *** percent lower during the 2014 interim period than during the 2013 interim period. Inventories relative to total shipments increased by *** percentage points from 2011 to 2013 and were *** percentage points lower during the interim periods. While MSG has an indefinite shelf life, it is best used within five years. Most producers try to make sure the product is not held in inventory for longer than one year.13
Table III-3 MSG: AJINA’S inventories, 2011-13, January-June 2013, and January-June 2014
* * * * * * *
U.S. PRODUCERS’ IMPORTS
AJINA’S imports of MSG are presented in table III‐4. AJINA imported from ***. AJINA's imported approximately 4.4 million pounds of MSG from its affiliate in Brazil in 2012 to ensure adequate supply in case of problems encountered during a technology change at AJINA's production plant.14 ***. AJINA further explained that ***.15 AJINA did ***.
13 Conference transcript, pp. 32‐33(Barbour, Naulty). 14 Hearing transcript, p. 53 (Naulty). 15 Petitioner’s posthearing brief, response to Commission questions, pp. 3‐4.
III‐4
Table III-4 MSG: AJINA’S U.S. production and imports, 2011-13, January-June 2013, and January-June 2014
* * * * * * *
U.S. EMPLOYMENT, WAGES, AND PRODUCTIVITY
Table III‐5 shows AJINA’S employment‐related data during the period examined. The level of production‐related workers (PRWs) increased by *** percent from 2011 to 2013 and was *** percent higher during the interim periods. Hours worked per PRW increased by *** percent from 2011 to 2013, while productivity decreased by *** percent between 2011 and 2013.
Table III-5 MSG: Employment related data, 2011-13, January-June 2013, and January-June 2014
* * * * * * *
IV‐1
PART IV: U.S. IMPORTS, APPARENT U.S. CONSUMPTION, AND MARKET SHARES
U.S. IMPORTERS
The Commission issued importer questionnaires to 22 firms believed to be importers of MSG, as well as to all U.S. producers of MSG.1 Usable questionnaire responses were received from 11 companies, representing *** percent2 of U.S. imports from China and virtually all3 imports from Indonesia between January 2011 and June 2014 under HTS subheading 2922.42.10.4 Table IV‐1 lists all responding U.S. importers of MSG from China, Indonesia, and other sources, their headquarters, and their shares of U.S. imports, in January 2011 through June 2014.
1 The Commission issued questionnaires to those firms identified in the petition, along with firms that, based on a review of data provided by U.S. Customs and Border Protection (“Customs”), may have accounted for more than *** percent of total imports from China, Indonesia, or nonsubject sources under HTS subheading 2922.42.10 in January 2011 through March 2014.
2 Coverage was based on reported questionnaire import data of *** pounds dry weight in January 2011 to June 2014, versus official import data of 189.2 million pounds.
3 Coverage was based on reported questionnaire import data of *** million pounds dry weight in January 2011 to June 2014, versus official import data of 19.1 million pounds. Based on proprietary Customs data, ***. The Commission received questionnaire responses from these three U.S. importers.
4 In addition, the Commission received a U.S. importer questionnaire from ***. The Commission also received an ***.
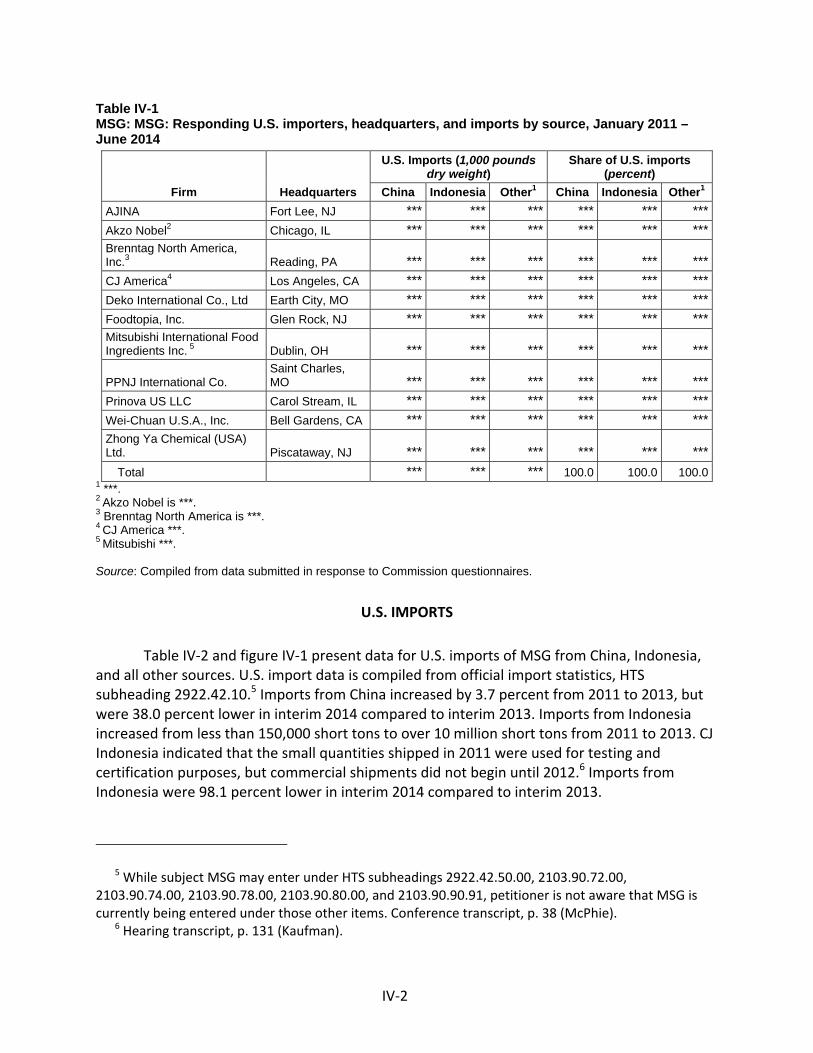
IV‐2
Table IV-1 MSG: MSG: Responding U.S. importers, headquarters, and imports by source, January 2011 – June 2014
Firm Headquarters
U.S. Imports (1,000 pounds dry weight)
Share of U.S. imports (percent)
China Indonesia Other1 China Indonesia Other1
AJINA Fort Lee, NJ *** *** *** *** *** ***Akzo Nobel2 Chicago, IL *** *** *** *** *** ***Brenntag North America, Inc.3 Reading, PA *** *** *** *** *** ***CJ America4 Los Angeles, CA *** *** *** *** *** ***Deko International Co., Ltd Earth City, MO *** *** *** *** *** ***Foodtopia, Inc. Glen Rock, NJ *** *** *** *** *** ***Mitsubishi International Food Ingredients Inc. 5 Dublin, OH *** *** *** *** *** ***
PPNJ International Co. Saint Charles, MO *** *** *** *** *** ***
Prinova US LLC Carol Stream, IL *** *** *** *** *** ***Wei-Chuan U.S.A., Inc. Bell Gardens, CA *** *** *** *** *** ***Zhong Ya Chemical (USA) Ltd. Piscataway, NJ *** *** *** *** *** ***
Total *** *** *** 100.0 100.0 100.01 ***. 2 Akzo Nobel is ***. 3 Brenntag North America is ***. 4 CJ America ***. 5 Mitsubishi ***. Source: Compiled from data submitted in response to Commission questionnaires.
U.S. IMPORTS
Table IV‐2 and figure IV‐1 present data for U.S. imports of MSG from China, Indonesia, and all other sources. U.S. import data is compiled from official import statistics, HTS subheading 2922.42.10.5 Imports from China increased by 3.7 percent from 2011 to 2013, but were 38.0 percent lower in interim 2014 compared to interim 2013. Imports from Indonesia increased from less than 150,000 short tons to over 10 million short tons from 2011 to 2013. CJ Indonesia indicated that the small quantities shipped in 2011 were used for testing and certification purposes, but commercial shipments did not begin until 2012.6 Imports from Indonesia were 98.1 percent lower in interim 2014 compared to interim 2013.
5 While subject MSG may enter under HTS subheadings 2922.42.50.00, 2103.90.72.00, 2103.90.74.00, 2103.90.78.00, 2103.90.80.00, and 2103.90.90.91, petitioner is not aware that MSG is currently being entered under those other items. Conference transcript, p. 38 (McPhie).
6 Hearing transcript, p. 131 (Kaufman).
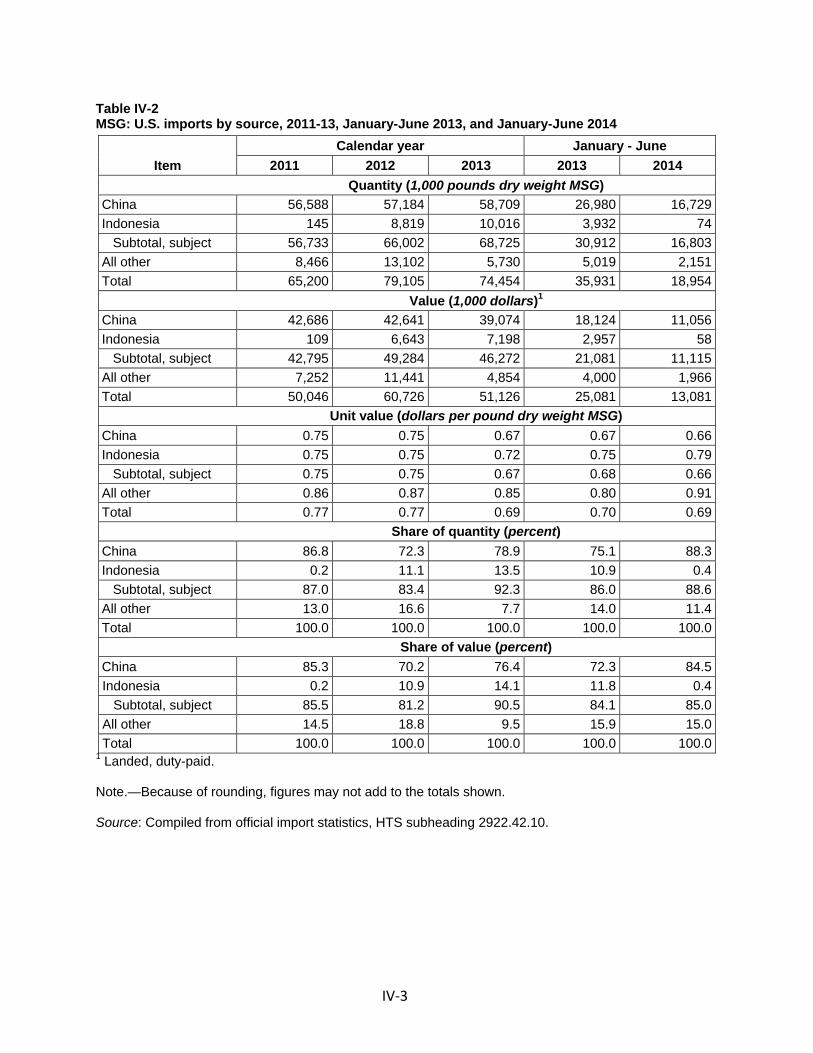
IV‐3
Table IV-2 MSG: U.S. imports by source, 2011-13, January-June 2013, and January-June 2014
Item Calendar year January - June
2011 2012 2013 2013 2014 Quantity (1,000 pounds dry weight MSG) China 56,588 57,184 58,709 26,980 16,729Indonesia 145 8,819 10,016 3,932 74 Subtotal, subject 56,733 66,002 68,725 30,912 16,803All other 8,466 13,102 5,730 5,019 2,151Total 65,200 79,105 74,454 35,931 18,954 Value (1,000 dollars)1 China 42,686 42,641 39,074 18,124 11,056Indonesia 109 6,643 7,198 2,957 58 Subtotal, subject 42,795 49,284 46,272 21,081 11,115All other 7,252 11,441 4,854 4,000 1,966Total 50,046 60,726 51,126 25,081 13,081 Unit value (dollars per pound dry weight MSG) China 0.75 0.75 0.67 0.67 0.66Indonesia 0.75 0.75 0.72 0.75 0.79 Subtotal, subject 0.75 0.75 0.67 0.68 0.66All other 0.86 0.87 0.85 0.80 0.91Total 0.77 0.77 0.69 0.70 0.69 Share of quantity (percent) China 86.8 72.3 78.9 75.1 88.3Indonesia 0.2 11.1 13.5 10.9 0.4 Subtotal, subject 87.0 83.4 92.3 86.0 88.6All other 13.0 16.6 7.7 14.0 11.4Total 100.0 100.0 100.0 100.0 100.0 Share of value (percent) China 85.3 70.2 76.4 72.3 84.5Indonesia 0.2 10.9 14.1 11.8 0.4 Subtotal, subject 85.5 81.2 90.5 84.1 85.0All other 14.5 18.8 9.5 15.9 15.0Total 100.0 100.0 100.0 100.0 100.0
1 Landed, duty-paid. Note.—Because of rounding, figures may not add to the totals shown. Source: Compiled from official import statistics, HTS subheading 2922.42.10.
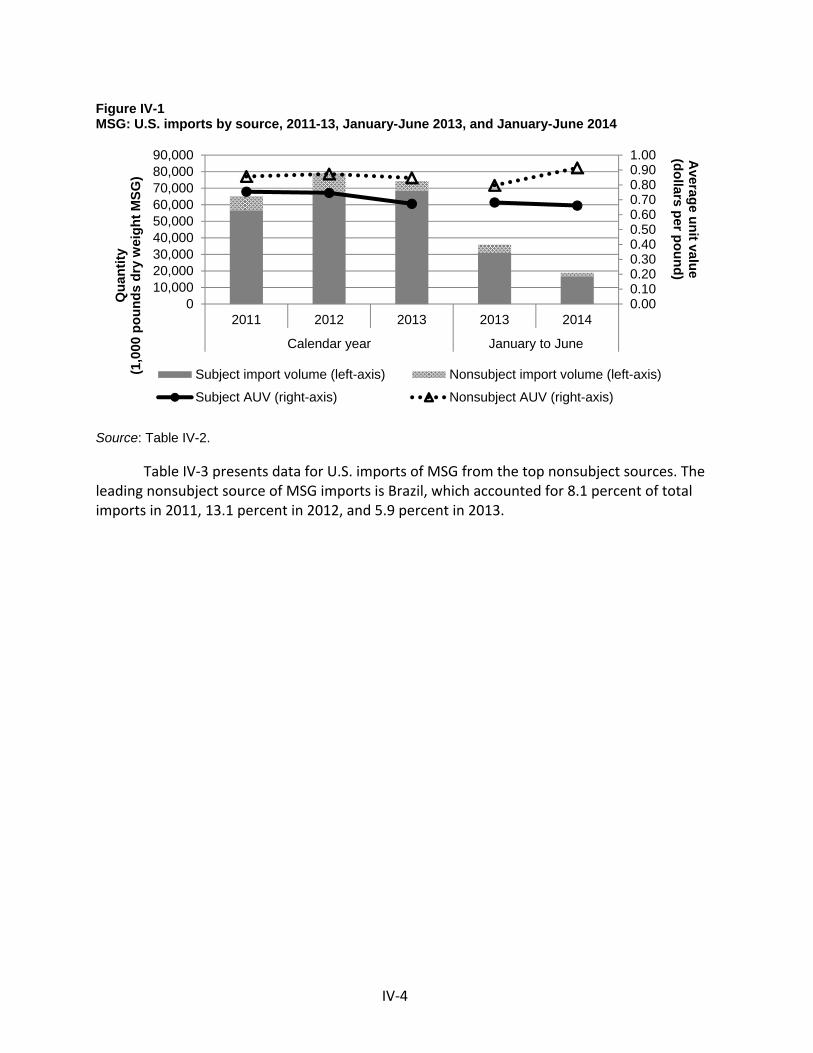
IV‐4
Figure IV-1 MSG: U.S. imports by source, 2011-13, January-June 2013, and January-June 2014
Source: Table IV-2.
Table IV‐3 presents data for U.S. imports of MSG from the top nonsubject sources. The leading nonsubject source of MSG imports is Brazil, which accounted for 8.1 percent of total imports in 2011, 13.1 percent in 2012, and 5.9 percent in 2013.
0.000.100.200.300.400.500.600.700.800.901.00
010,00020,00030,00040,00050,00060,00070,00080,00090,000
2011 2012 2013 2013 2014
Calendar year January to June
Average unit value
(dollars per pound)Q
uant
ity(1
,000
pou
nds
dry
wei
ght M
SG)
Subject import volume (left-axis) Nonsubject import volume (left-axis)
Subject AUV (right-axis) Nonsubject AUV (right-axis)
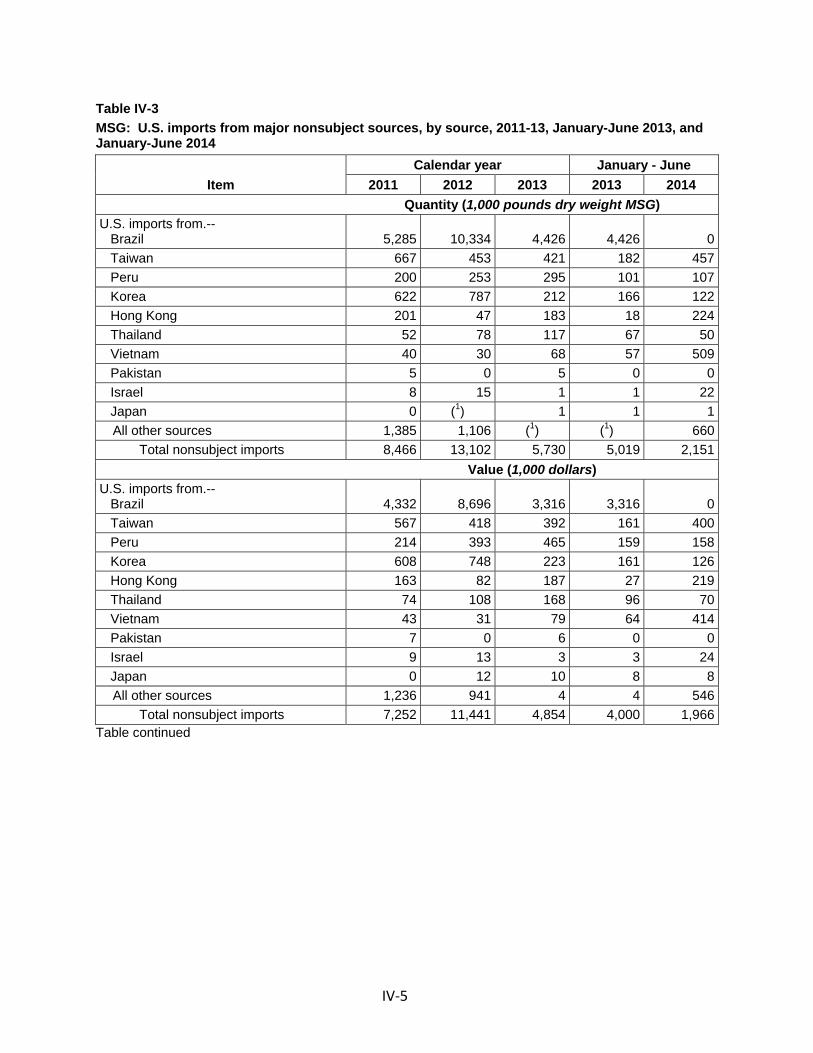
IV‐5
Table IV-3 MSG: U.S. imports from major nonsubject sources, by source, 2011-13, January-June 2013, and January-June 2014
Item Calendar year January - June
2011 2012 2013 2013 2014 Quantity (1,000 pounds dry weight MSG) U.S. imports from.-- Brazil 5,285 10,334 4,426 4,426 0 Taiwan 667 453 421 182 457 Peru 200 253 295 101 107 Korea 622 787 212 166 122 Hong Kong 201 47 183 18 224 Thailand 52 78 117 67 50 Vietnam 40 30 68 57 509 Pakistan 5 0 5 0 0 Israel 8 15 1 1 22 Japan 0 (1) 1 1 1
All other sources 1,385 1,106 (1) (1) 660 Total nonsubject imports 8,466 13,102 5,730 5,019 2,151
Value (1,000 dollars) U.S. imports from.-- Brazil 4,332 8,696 3,316 3,316 0 Taiwan 567 418 392 161 400 Peru 214 393 465 159 158 Korea 608 748 223 161 126 Hong Kong 163 82 187 27 219 Thailand 74 108 168 96 70 Vietnam 43 31 79 64 414 Pakistan 7 0 6 0 0 Israel 9 13 3 3 24 Japan 0 12 10 8 8
All other sources 1,236 941 4 4 546 Total nonsubject imports 7,252 11,441 4,854 4,000 1,966
Table continued
IV‐6
Table IV-3--Continued MSG: U.S. imports from major nonsubject sources, by source, 2011-13, January-June 2013, and January-June 2014
Item Calendar year January - June
2011 2012 2013 2013 2014 Unit value (dollars per pound dry weight MSG) U.S. imports from.-- Brazil 0.82 0.84 0.75 0.75 - Taiwan 0.85 0.92 0.93 0.89 0.88 Peru 1.07 1.55 1.58 1.58 1.48 Korea 0.98 0.95 1.05 0.97 1.04 Hong Kong 0.81 1.76 1.03 1.49 0.98 Thailand 1.40 1.39 1.43 1.44 1.39 Vietnam 1.07 1.04 1.17 1.13 0.81 Pakistan 1.53 - 1.29 - - Israel 1.05 0.85 2.42 2.42 1.11 Japan - 24.78 10.13 10.16 10.82
All other sources 0.89 0.85 14.29 14.29 0.83Total nonsubject imports 0.86 0.87 0.85 0.80 0.91
1 Less than 500 pounds dry weight. Source: Compiled from official U.S. import statistics.
CRITICAL CIRCUMSTANCES
On September 29, 2014, Commerce issued its final determination that “critical circumstances” exist with regard to imports of MSG from China from the Meihua Group,7 the separate rate companies,8 and the PRC‐wide entity.9 In this investigation, if both Commerce and the Commission make affirmative final critical circumstances determinations, certain subject
7 Langfang Meihua Bio‐Technology Co., Ltd.; Meihua Group International Trading (Hong Kong) Limited; Tongliao Meihua Biological SCI–TECH Co., Ltd.; and Meihua Holdings Group Co., Ltd., Bazhou Branch (collectively, the Meihua Group).
8 Fujian Province Jianyang Wuyi MSG Co., Ltd.; Neimenggu Fufeng Biotechnologies Co., Ltd.; and Baoji Fufeng Biotechnologies Co., Ltd. (collectively, the separate rate companies).
9Monosodium Glutamate From the People’s Republic of China: Final Determination of Sales at Less Than Fair Value and the Final Affirmative Determination of Critical Circumstances, 79 FR 58326, September 29, 2014, referenced in app. A. When petitioners file timely allegations of critical circumstances, Commerce examines whether there is a reasonable basis to believe or suspect that (1) either there is a history of dumping and material injury by reason of dumped imports in the United States or elsewhere of the subject merchandise, or the person by whom, or for whose account, the merchandise was imported knew or should have known that the exporter was selling the subject merchandise at LTFV and that there was likely to be material injury by reason of such sales; and (2) there have been massive imports of the subject merchandise over a relatively short period.
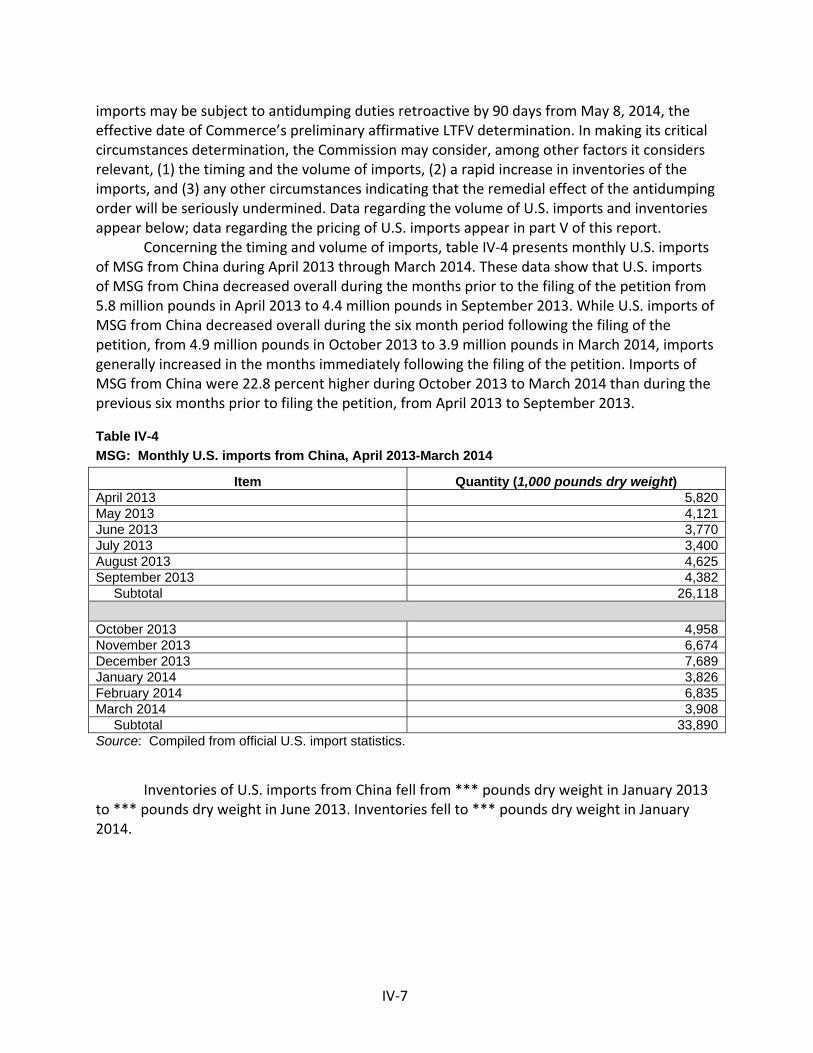
IV‐7
imports may be subject to antidumping duties retroactive by 90 days from May 8, 2014, the effective date of Commerce’s preliminary affirmative LTFV determination. In making its critical circumstances determination, the Commission may consider, among other factors it considers relevant, (1) the timing and the volume of imports, (2) a rapid increase in inventories of the imports, and (3) any other circumstances indicating that the remedial effect of the antidumping order will be seriously undermined. Data regarding the volume of U.S. imports and inventories appear below; data regarding the pricing of U.S. imports appear in part V of this report.
Concerning the timing and volume of imports, table IV‐4 presents monthly U.S. imports of MSG from China during April 2013 through March 2014. These data show that U.S. imports of MSG from China decreased overall during the months prior to the filing of the petition from 5.8 million pounds in April 2013 to 4.4 million pounds in September 2013. While U.S. imports of MSG from China decreased overall during the six month period following the filing of the petition, from 4.9 million pounds in October 2013 to 3.9 million pounds in March 2014, imports generally increased in the months immediately following the filing of the petition. Imports of MSG from China were 22.8 percent higher during October 2013 to March 2014 than during the previous six months prior to filing the petition, from April 2013 to September 2013.
Table IV-4 MSG: Monthly U.S. imports from China, April 2013-March 2014
Item Quantity (1,000 pounds dry weight) April 2013 5,820 May 2013 4,121 June 2013 3,770 July 2013 3,400 August 2013 4,625 September 2013 4,382
Subtotal 26,118 October 2013 4,958 November 2013 6,674 December 2013 7,689 January 2014 3,826 February 2014 6,835 March 2014 3,908
Subtotal 33,890 Source: Compiled from official U.S. import statistics.
Inventories of U.S. imports from China fell from *** pounds dry weight in January 2013 to *** pounds dry weight in June 2013. Inventories fell to *** pounds dry weight in January 2014.
IV‐8
NEGLIGIBILITY
The statute requires that an investigation be terminated without an injury determination if imports of the subject merchandise are found to be negligible.10 Negligible imports are generally defined in the Tariff Act of 1930, as amended, as imports from a country of merchandise corresponding to a domestic like product where such imports account for less than 3 percent of the volume of all such merchandise imported into the United States in the most recent 12‐month period for which data are available that precedes the filing of the petition or the initiation of the investigation. However, if there are imports of such merchandise from a number of countries subject to investigations initiated on the same day that individually account for less than 3 percent of the total volume of the subject merchandise, and if the imports from those countries collectively account for more than 7 percent of the volume of all such merchandise imported into the United States during the applicable 12‐month period, then imports from such countries are deemed not to be negligible.11 Imports from China accounted for 73.6 percent of total imports of MSG by quantity from September 2012 to August 2013. Imports from Indonesia accounted for 15.9 percent of total imports of MSG by quantity from September 2012 to August 2013.
CUMULATION CONSIDERATIONS
In assessing whether imports should be cumulated, the Commission determines whether U.S. imports from the subject countries compete with each other and with the domestic like product and has generally considered four factors: (1) fungibility, (2) presence of sales or offers to sell in the same geographical markets, (3) common or similar channels of distribution, and (4) simultaneous presence in the market. Information concerning fungibility and channels of distribution are discussed in Part II of this report. Additional information concerning geographical markets, and simultaneous presence in the market is presented below.
Geographical markets
Both AJINA and U.S. importers reported shipping MSG throughout the United States.12 Imports of MSG from China entered through 26 different ports13 during January 2011 through
10 Sections 703(a)(1), 705(b)(1), 733(a)(1), and 735(b)(1) of the Act (19 U.S.C. §§ 1671b(a)(1), 1671d(b)(1), 1673b(a)(1), and 1673d(b)(1)).
11 Section 771 (24) of the Act (19 U.S.C § 1677(24)). 12 See Part II, Table II‐2. 13 In 2013, 61.1 percent of imports from China entered through Los Angeles, CA; New York, NY; and
Chicago, IL.
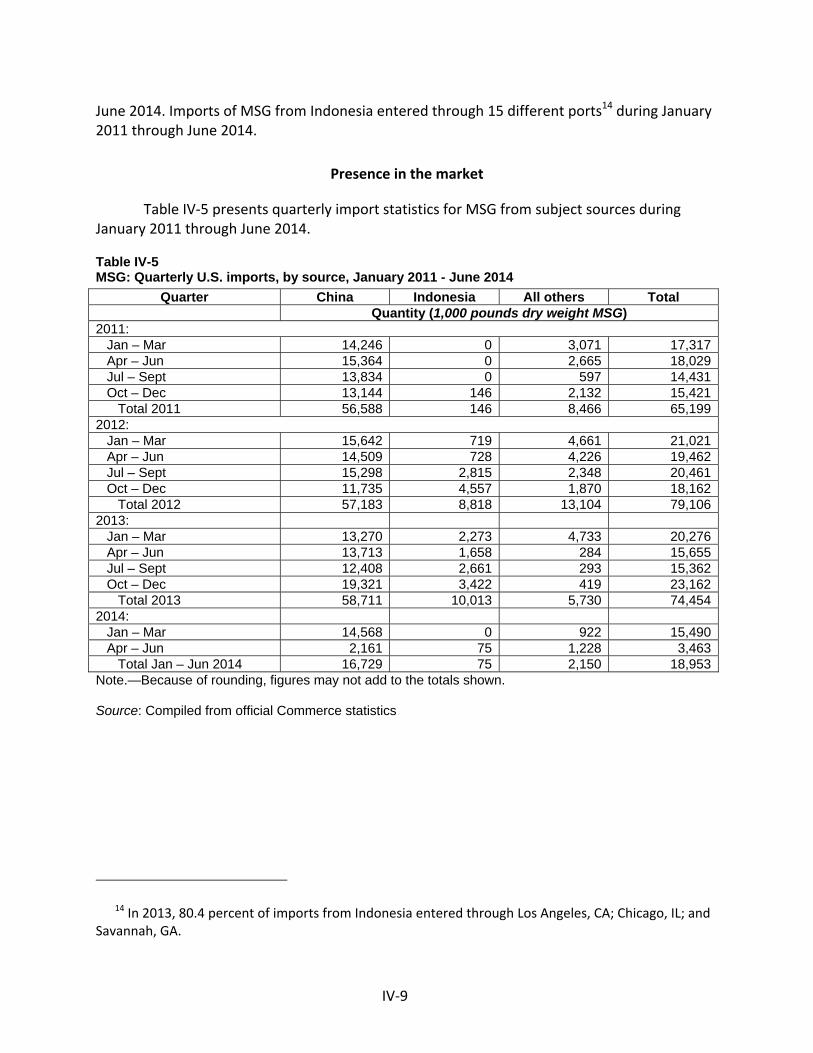
IV‐9
June 2014. Imports of MSG from Indonesia entered through 15 different ports14 during January 2011 through June 2014.
Presence in the market
Table IV‐5 presents quarterly import statistics for MSG from subject sources during January 2011 through June 2014.
Table IV-5 MSG: Quarterly U.S. imports, by source, January 2011 - June 2014
Quarter China Indonesia All others Total Quantity (1,000 pounds dry weight MSG) 2011: Jan – Mar 14,246 0 3,071 17,317 Apr – Jun 15,364 0 2,665 18,029 Jul – Sept 13,834 0 597 14,431 Oct – Dec 13,144 146 2,132 15,421 Total 2011 56,588 146 8,466 65,1992012: Jan – Mar 15,642 719 4,661 21,021 Apr – Jun 14,509 728 4,226 19,462 Jul – Sept 15,298 2,815 2,348 20,461 Oct – Dec 11,735 4,557 1,870 18,162 Total 2012 57,183 8,818 13,104 79,1062013: Jan – Mar 13,270 2,273 4,733 20,276 Apr – Jun 13,713 1,658 284 15,655 Jul – Sept 12,408 2,661 293 15,362 Oct – Dec 19,321 3,422 419 23,162 Total 2013 58,711 10,013 5,730 74,4542014: Jan – Mar 14,568 0 922 15,490 Apr – Jun 2,161 75 1,228 3,463 Total Jan – Jun 2014 16,729 75 2,150 18,953Note.—Because of rounding, figures may not add to the totals shown. Source: Compiled from official Commerce statistics
14 In 2013, 80.4 percent of imports from Indonesia entered through Los Angeles, CA; Chicago, IL; and Savannah, GA.
IV‐10
APPARENT U.S. CONSUMPTION AND MARKET SHARES
Table IV‐6 and figure IV‐2 presents data on apparent U.S. consumption for MSG over the period examined. Apparent consumption based on quantity increased by *** percent from 2011 to 2013, and was *** percent lower in interim 2014 than in interim 2013.
U.S. market share data are presented in table IV‐6. U.S. producers’ share of U.S. consumption, based on quantity, decreased by *** percentage points from 2011 to 2012, then increased by *** percentage points from 2012 to 2013; decreasing overall from 2011 to 2013, by *** percentage points. U.S. producers’ share of U.S. consumption was *** percentage points higher in interim 2014 than in interim 2013. The market share of imports of MSG from the subject countries increased steadily from 2011 to 2013, increasing overall by *** percentage points; the market share of subject imports however, was *** percentage points lower in interim 2014 than in interim 2013.
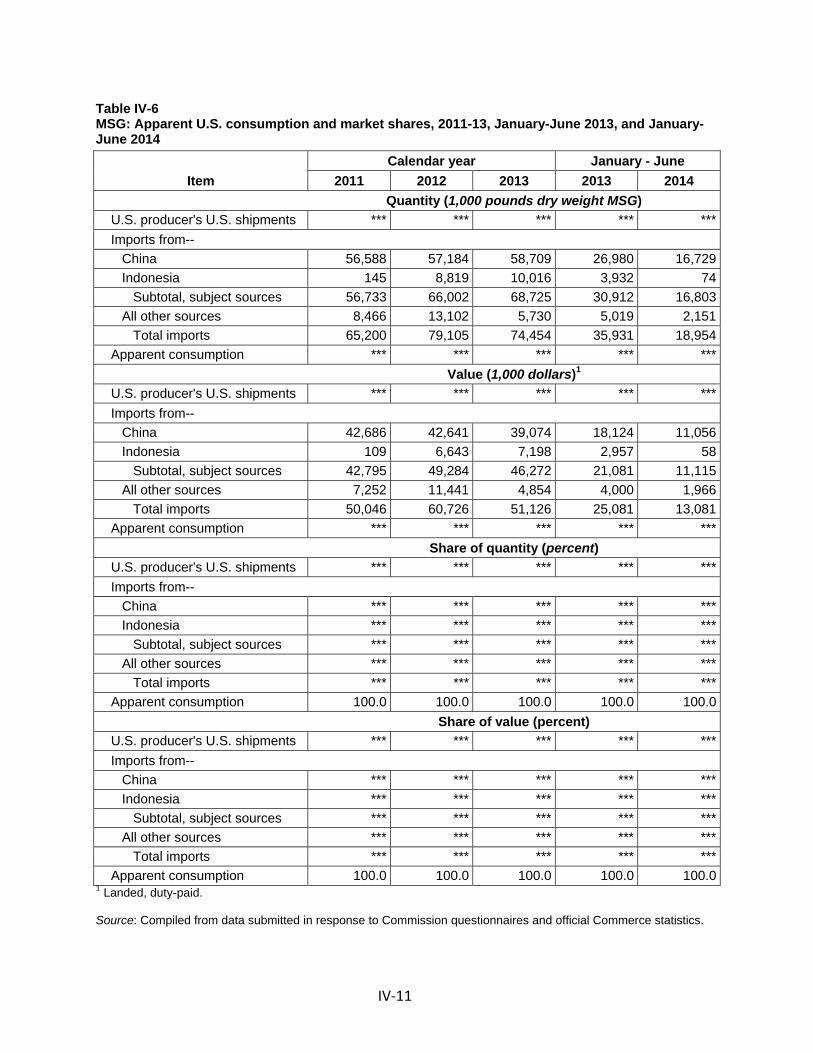
IV‐11
Table IV-6 MSG: Apparent U.S. consumption and market shares, 2011-13, January-June 2013, and January-June 2014
Item Calendar year January - June
2011 2012 2013 2013 2014 Quantity (1,000 pounds dry weight MSG)
U.S. producer's U.S. shipments *** *** *** *** ***Imports from-- China 56,588 57,184 58,709 26,980 16,729 Indonesia 145 8,819 10,016 3,932 74 Subtotal, subject sources 56,733 66,002 68,725 30,912 16,803 All other sources 8,466 13,102 5,730 5,019 2,151 Total imports 65,200 79,105 74,454 35,931 18,954 Apparent consumption *** *** *** *** ***
Value (1,000 dollars)1 U.S. producer's U.S. shipments *** *** *** *** ***Imports from-- China 42,686 42,641 39,074 18,124 11,056 Indonesia 109 6,643 7,198 2,957 58 Subtotal, subject sources 42,795 49,284 46,272 21,081 11,115 All other sources 7,252 11,441 4,854 4,000 1,966 Total imports 50,046 60,726 51,126 25,081 13,081 Apparent consumption *** *** *** *** ***
Share of quantity (percent) U.S. producer's U.S. shipments *** *** *** *** ***Imports from-- China *** *** *** *** *** Indonesia *** *** *** *** *** Subtotal, subject sources *** *** *** *** *** All other sources *** *** *** *** *** Total imports *** *** *** *** ***Apparent consumption 100.0 100.0 100.0 100.0 100.0
Share of value (percent) U.S. producer's U.S. shipments *** *** *** *** ***Imports from-- China *** *** *** *** *** Indonesia *** *** *** *** *** Subtotal, subject sources *** *** *** *** *** All other sources *** *** *** *** *** Total imports *** *** *** *** ***Apparent consumption 100.0 100.0 100.0 100.0 100.0
1 Landed, duty-paid. Source: Compiled from data submitted in response to Commission questionnaires and official Commerce statistics.
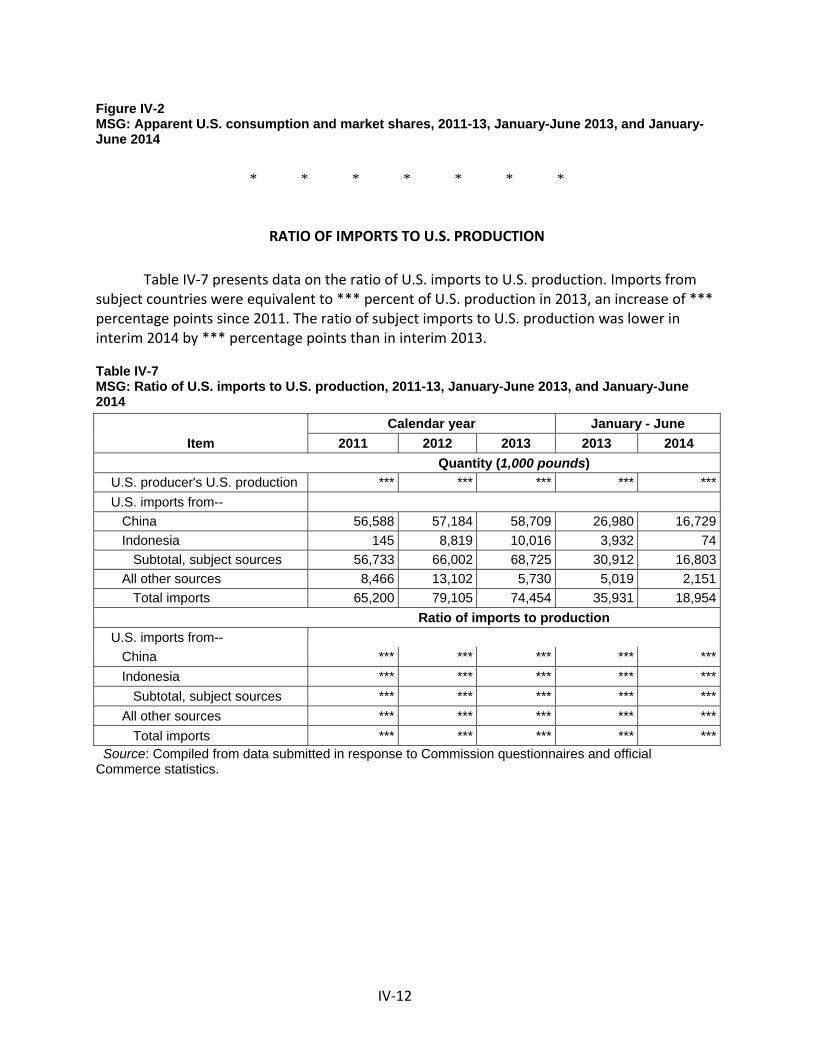
IV‐12
Figure IV-2 MSG: Apparent U.S. consumption and market shares, 2011-13, January-June 2013, and January-June 2014
* * * * * * *
RATIO OF IMPORTS TO U.S. PRODUCTION
Table IV‐7 presents data on the ratio of U.S. imports to U.S. production. Imports from subject countries were equivalent to *** percent of U.S. production in 2013, an increase of *** percentage points since 2011. The ratio of subject imports to U.S. production was lower in interim 2014 by *** percentage points than in interim 2013.
Table IV-7 MSG: Ratio of U.S. imports to U.S. production, 2011-13, January-June 2013, and January-June 2014
Item Calendar year January - June
2011 2012 2013 2013 2014 Quantity (1,000 pounds)
U.S. producer's U.S. production *** *** *** *** ***U.S. imports from-- China 56,588 57,184 58,709 26,980 16,729 Indonesia 145 8,819 10,016 3,932 74 Subtotal, subject sources 56,733 66,002 68,725 30,912 16,803 All other sources 8,466 13,102 5,730 5,019 2,151 Total imports 65,200 79,105 74,454 35,931 18,954
Ratio of imports to production U.S. imports from-- China *** *** *** *** *** Indonesia *** *** *** *** *** Subtotal, subject sources *** *** *** *** *** All other sources *** *** *** *** *** Total imports *** *** *** *** ***
Source: Compiled from data submitted in response to Commission questionnaires and official Commerce statistics.
V‐1
PART V: PRICING DATA
FACTORS AFFECTING PRICES
Raw material costs
Major raw materials for the MSG industry are corn and other dextrose sources, which account for *** of the variable costs of MSG production.1 Raw materials accounted for approximately *** percent of total cost of goods sold during the POI (see Part VI: Financial Experience of U.S. Producers for additional information). AJINA reported that “bushels of corn are purchased on the market, milled and refined into corn starch ***.2 U.S. producer AJINA reported that raw material prices were ***. AJINA cited ***.3 Four importers reported declining raw material costs. Importers *** reported that declining raw material costs were due to the decrease in the price of corn.4
Figure V‐1 shows the average monthly price for corn in Iowa. The average monthly price for corn peaked in August 2012 and was at its lowest in January 2014. AJINA reported that ***. AJINA reported using glucose, which is made from corn and other imports, as their feedstock for MSG.5 In addition, AJINA reported that the cost of glucose *** by *** percent within the period of investigation and peaked in ***.6 Additional raw materials used to manufacture MSG include ***. AJINA reported that their overall raw material index *** by *** percent from January 2011 to July 2013 and peaked in ***, which followed the glucose trends.7
1 Petition, Volume I, p. 20. 2 Ibid. 3 Email from ***, September 9, 2014. 4 Importer *** reported raw material costs as decreasing for ***. 5 Email from ***, September 9, 2014 and hearing transcript, p. 78 (Naulty). 6 AJINA Producer Questionnaire, addendum C. 7 AJINA Producer Questionnaire, question IV‐17 and addendum C.
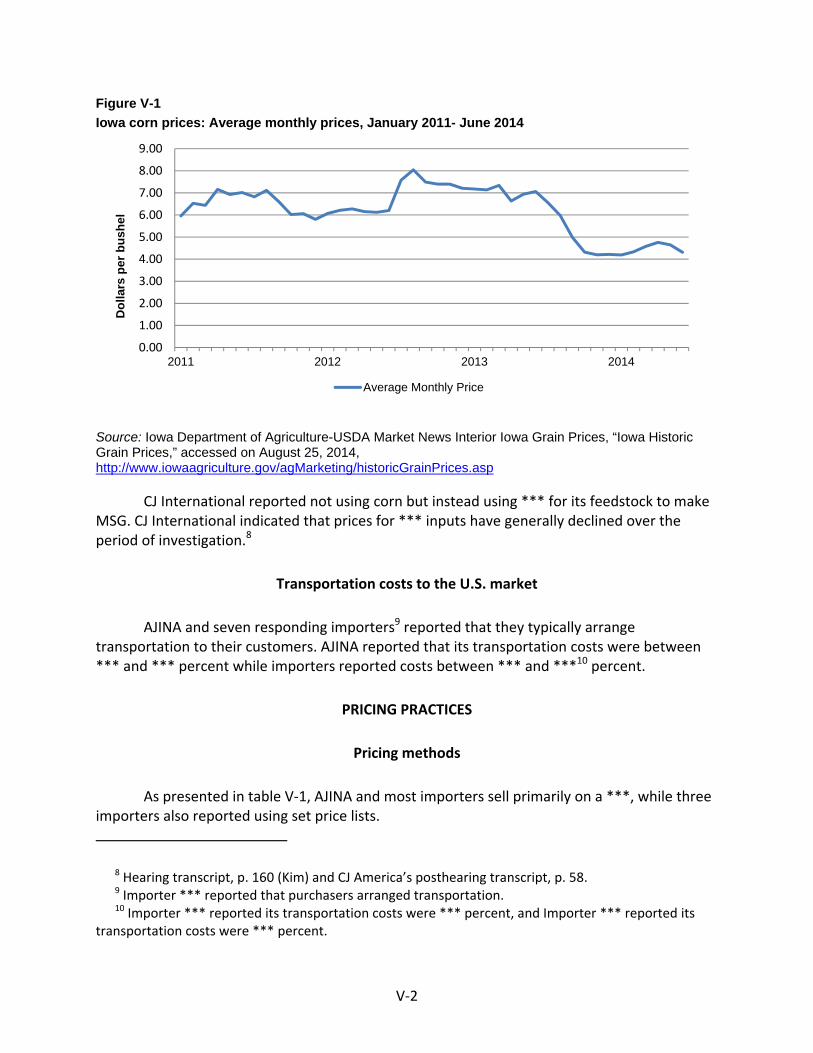
V‐2
Figure V-1 Iowa corn prices: Average monthly prices, January 2011- June 2014
Source: Iowa Department of Agriculture-USDA Market News Interior Iowa Grain Prices, “Iowa Historic Grain Prices,” accessed on August 25, 2014, http://www.iowaagriculture.gov/agMarketing/historicGrainPrices.asp
CJ International reported not using corn but instead using *** for its feedstock to make MSG. CJ International indicated that prices for *** inputs have generally declined over the period of investigation.8
Transportation costs to the U.S. market
AJINA and seven responding importers9 reported that they typically arrange transportation to their customers. AJINA reported that its transportation costs were between *** and *** percent while importers reported costs between *** and ***10 percent.
PRICING PRACTICES
Pricing methods
As presented in table V‐1, AJINA and most importers sell primarily on a ***, while three importers also reported using set price lists.
8 Hearing transcript, p. 160 (Kim) and CJ America’s posthearing transcript, p. 58. 9 Importer *** reported that purchasers arranged transportation. 10 Importer *** reported its transportation costs were *** percent, and Importer *** reported its
transportation costs were *** percent.
0.00
1.00
2.00
3.00
4.00
5.00
6.00
7.00
8.00
9.00
2011 2012 2013 2014
Dol
lars
per
bus
hel
Average Monthly Price
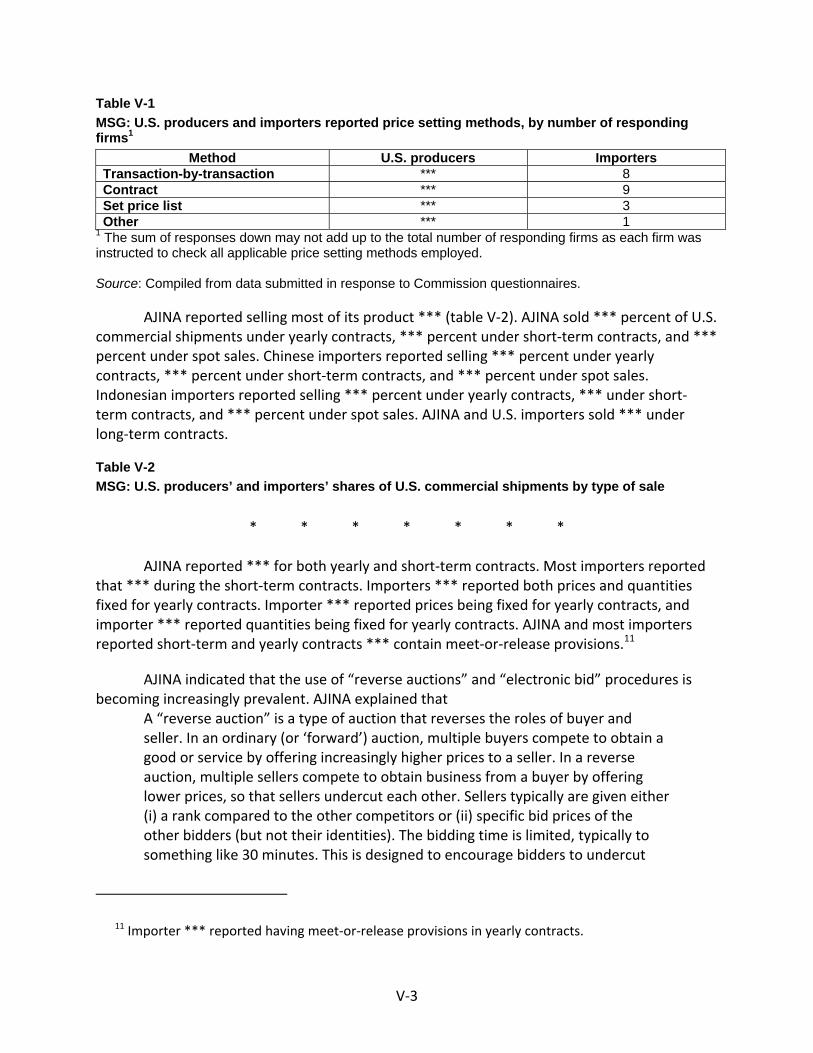
V‐3
Table V-1 MSG: U.S. producers and importers reported price setting methods, by number of responding firms1
Method U.S. producers Importers Transaction-by-transaction *** 8 Contract *** 9 Set price list *** 3 Other *** 1
1 The sum of responses down may not add up to the total number of responding firms as each firm was instructed to check all applicable price setting methods employed. Source: Compiled from data submitted in response to Commission questionnaires.
AJINA reported selling most of its product *** (table V‐2). AJINA sold *** percent of U.S. commercial shipments under yearly contracts, *** percent under short‐term contracts, and *** percent under spot sales. Chinese importers reported selling *** percent under yearly contracts, *** percent under short‐term contracts, and *** percent under spot sales. Indonesian importers reported selling *** percent under yearly contracts, *** under short‐term contracts, and *** percent under spot sales. AJINA and U.S. importers sold *** under long‐term contracts.
Table V-2 MSG: U.S. producers’ and importers’ shares of U.S. commercial shipments by type of sale
* * * * * * *
AJINA reported *** for both yearly and short‐term contracts. Most importers reported that *** during the short‐term contracts. Importers *** reported both prices and quantities fixed for yearly contracts. Importer *** reported prices being fixed for yearly contracts, and importer *** reported quantities being fixed for yearly contracts. AJINA and most importers reported short‐term and yearly contracts *** contain meet‐or‐release provisions.11
AJINA indicated that the use of “reverse auctions” and “electronic bid” procedures is becoming increasingly prevalent. AJINA explained that
A “reverse auction” is a type of auction that reverses the roles of buyer and seller. In an ordinary (or ‘forward’) auction, multiple buyers compete to obtain a good or service by offering increasingly higher prices to a seller. In a reverse auction, multiple sellers compete to obtain business from a buyer by offering lower prices, so that sellers undercut each other. Sellers typically are given either (i) a rank compared to the other competitors or (ii) specific bid prices of the other bidders (but not their identities). The bidding time is limited, typically to something like 30 minutes. This is designed to encourage bidders to undercut
11 Importer *** reported having meet‐or‐release provisions in yearly contracts.
V‐4
each other to the least acceptable price to the supplier. Reverse auctions often are structured with multiple rounds, in which winners of a first round of bidding are invited to a second round…. The information that suppliers are able to include in their bids generally is limited only to price and other price‐related factors (e.g. shipping costs). This has the effect of focusing the customer’s purchasing decision on price to the exclusion of non‐price related factors. In addition to reverse auctions, several MSG customers recently have employed “electronic bid” procedures for procuring MSG supplies. While this procedure is not formally structured as an auction, it does employ an electronic bidding form in which each bidder must provide certain requested information relating to price and other price‐related factors. This form also typically restricts the information that can be provided to only the price‐related information requested by the form. It therefore similarly has the effect of focusing a customer’s purchasing decision on price to the exclusion of other factors.12
One purchaser *** reported using reverse auctions, two purchasers ***13 reported using electronic bidding, and 27 purchasers reported using neither reverse auctions nor electronic bidding when purchasing MSG. Importer CJ America reported using reverse auctions once over the period of investigation with purchaser ***. CJ America indicated that *** its bid was not the lowest bid in the auction.14 *** indicated that reverse auctions played a ***. *** reported that *** of its contracting is done through electronic bidding. *** reported sending electronic bidding requirements to suppliers with a given time frame to return with pricing and volume from the entertaining bid.
Sales terms and discounts
AJINA and most importers typically quote prices on ***. Importers *** reported quoting prices on a f.o.b. basis. U.S. producer AJINA and eight responding importers reported offering ***.15 AJINA and ten responding importers reported sales terms of ***.
12 Petitioner’s postconference brief, exh. 1, pp. 6‐7. 13 AJINA reported that Importer *** uses reverse auctions and/or electronic bidding. However, ***
reports using neither. Petitioner’s prehearing brief, exh. 8, p 1 and *** purchaser questionnaire, question III‐24.
14 CJ America’s Posthearing brief, pp.44‐46 and hearing transcript, pp. 172‐3 (Lee). 15 Importer *** reported offering discounts on the basis of quantity and annual total volume.
V‐5
Price leadership
Thirteen responding purchasers reported that ***. *** described *** price leadership as a result of being ***. *** indicated that *** was a price leader because of its lower prices.
PRICE DATA
The Commission requested U.S. producers and importers to provide quarterly data for the total quantity and f.o.b. value of the following MSG products shipped to unrelated U.S. customers during January 2011 to June 2014.
Product 1.—MSG Extra Fine 50 LB — Paper Bag. All crystal passed through ASTM #60 or above; no second screen used.
Product 2.—MSG Fine 50 LB – Paper Bag. First screen passed through of crystal smaller than ASTM #60; second screen of ASTM #120 up to or including ASTM #170.
Product 3.—MSG Regular 50 LB – Paper Bag. First screen passed through of crystal smaller than ASTM #20 up to or on ASTM #50; second screen of ASTM #40 up to or including ASTM #100.
Product 4.—MSG Regular 100 LB DRM – Fiber Drum. First screen passed through of crystal smaller than ASTM #20 up to or on ASTM #50; second screen of ASTM #40 up to or including ASTM #100.
AJINA and six importers provided usable pricing data for sales of the requested products, although not all firms reported pricing for all products for all quarters. The Commission did not receive pricing data from Indonesian importers for 2011 or for product 4. Pricing data reported by these firms accounted for *** of U.S. producers’ shipments of product, *** percent of U.S. commercial shipments of subject imports from China, and *** percent of U.S. commercial shipments of subject imports from Indonesia over the period of investigation.
Price data for products 1‐4 are presented in tables V‐3 to V‐6 and figures V‐2 to V‐5. Nonsubject import prices are presented in Appendix D.
Table V-3 MSG: Weighted-average f.o.b. prices and quantities of domestic and imported product 11 and margins of underselling/(overselling), by quarters, January 2011-June 2014
* * * * * * *
V‐6
Table V-4 MSG: Weighted-average f.o.b. prices and quantities of domestic and imported product 21 and margins of underselling/(overselling), by quarters, January 2011-June 2014
* * * * * * *
Table V-5 MSG: Weighted-average f.o.b. prices and quantities of domestic and imported product 31 and margins of underselling/(overselling), by quarters, January 2011-June 2014
* * * * * * * Table V-6 MSG: Weighted-average f.o.b. prices and quantities of domestic and imported product 41 and margins of underselling/(overselling), by quarters, January 2011-June 2014
* * * * * * *
Figure V-2 MSG: Weighted-average prices and quantities of domestic and imported product, by quarters, January 2011-June 2014
* * * * * * *
Figure V-3 MSG: Weighted-average prices and quantities of domestic and imported product, by quarters, January 2011-June 2014
* * * * * * * Figure V-4 MSG: Weighted-average prices and quantities of domestic and imported product, by quarters, January 2011-June 2014
* * * * * * * Figure V-5 MSG: Weighted-average prices and quantities of domestic and imported product, by quarters, January 2011-June 2014
* * * * * * *
Price trends
Table V‐7 summarizes the price trends, by country and by product. As shown in the table, domestic prices increased ranged *** to *** percent during the period of investigation. Chinese import prices decreased for products 1, 3, and 4 ranged *** to *** percent whereas
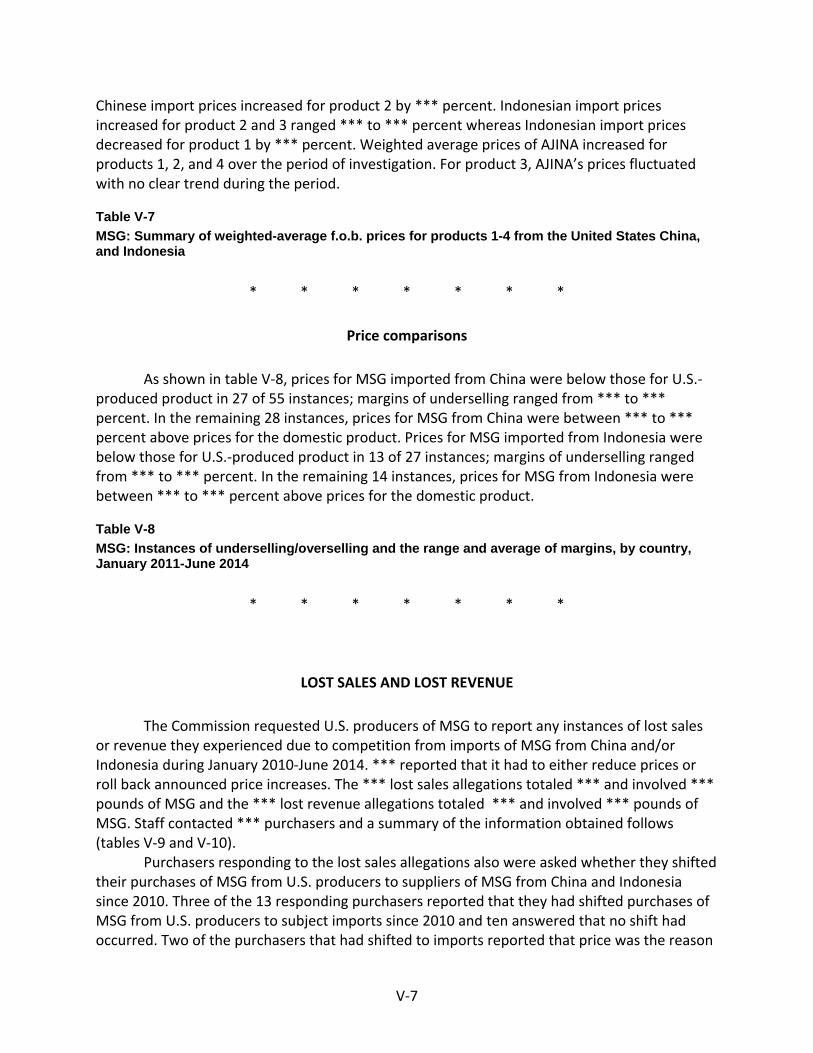
V‐7
Chinese import prices increased for product 2 by *** percent. Indonesian import prices increased for product 2 and 3 ranged *** to *** percent whereas Indonesian import prices decreased for product 1 by *** percent. Weighted average prices of AJINA increased for products 1, 2, and 4 over the period of investigation. For product 3, AJINA’s prices fluctuated with no clear trend during the period.
Table V-7 MSG: Summary of weighted-average f.o.b. prices for products 1-4 from the United States China, and Indonesia
* * * * * * *
Price comparisons
As shown in table V‐8, prices for MSG imported from China were below those for U.S.‐produced product in 27 of 55 instances; margins of underselling ranged from *** to *** percent. In the remaining 28 instances, prices for MSG from China were between *** to *** percent above prices for the domestic product. Prices for MSG imported from Indonesia were below those for U.S.‐produced product in 13 of 27 instances; margins of underselling ranged from *** to *** percent. In the remaining 14 instances, prices for MSG from Indonesia were between *** to *** percent above prices for the domestic product.
Table V-8 MSG: Instances of underselling/overselling and the range and average of margins, by country, January 2011-June 2014
* * * * * * *
LOST SALES AND LOST REVENUE
The Commission requested U.S. producers of MSG to report any instances of lost sales or revenue they experienced due to competition from imports of MSG from China and/or Indonesia during January 2010‐June 2014. *** reported that it had to either reduce prices or roll back announced price increases. The *** lost sales allegations totaled *** and involved *** pounds of MSG and the *** lost revenue allegations totaled *** and involved *** pounds of MSG. Staff contacted *** purchasers and a summary of the information obtained follows (tables V‐9 and V‐10).
Purchasers responding to the lost sales allegations also were asked whether they shifted their purchases of MSG from U.S. producers to suppliers of MSG from China and Indonesia since 2010. Three of the 13 responding purchasers reported that they had shifted purchases of MSG from U.S. producers to subject imports since 2010 and ten answered that no shift had occurred. Two of the purchasers that had shifted to imports reported that price was the reason
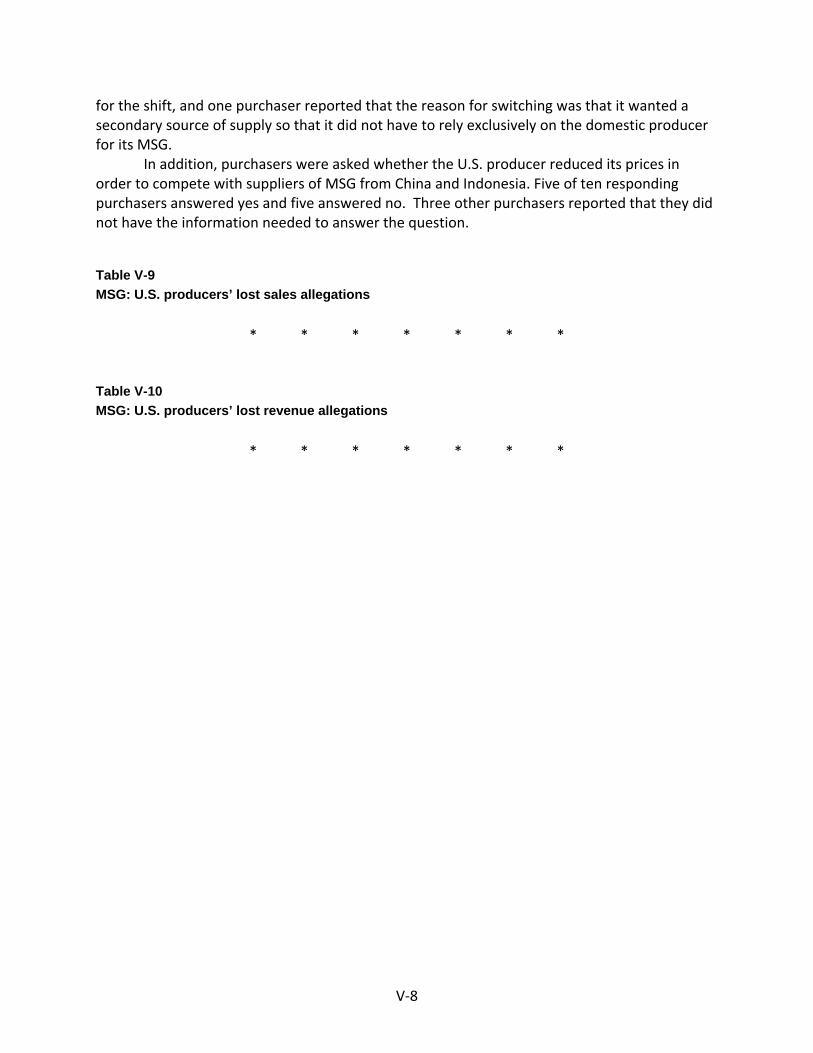
V‐8
for the shift, and one purchaser reported that the reason for switching was that it wanted a secondary source of supply so that it did not have to rely exclusively on the domestic producer for its MSG.
In addition, purchasers were asked whether the U.S. producer reduced its prices in order to compete with suppliers of MSG from China and Indonesia. Five of ten responding purchasers answered yes and five answered no. Three other purchasers reported that they did not have the information needed to answer the question.
Table V-9 MSG: U.S. producers’ lost sales allegations
* * * * * * *
Table V-10 MSG: U.S. producers’ lost revenue allegations
* * * * * * *
VI-1
FINANCIAL EXPERIENCE OF THE U.S. PRODUCER Part VI:
INTRODUCTION
The sole U.S. producer, AJINA, provided usable financial data on its operations on MSG.1 These data are believed to account for all U.S. production of MSG during the period examined. ***.
OPERATIONS ON MSG
Income-and-loss data for the U.S. producer are presented in table VI-1. The reported financial condition of the U.S. industry *** from 2011 to 2013, but *** between the comparable interim periods. The reported aggregate net sales quantity and value *** from 2011 to 2013. Collectively, the aggregate cost of goods sold (“COGS”) and selling, general, and administrative (“SG&A”) expenses *** during this time. As a result of the *** in operating costs and expenses and the *** in revenue, aggregate operating income *** from an operating margin of *** percent in 2011 to *** percent in 2013. Between the comparable interim periods, net sales quantity ***, net sales value ***, and combined operating costs and expenses ***. The *** in operating costs and expenses compared to the change in revenue resulted in an operating margin of *** percent in January-June 2014 as compared to *** percent in January-June 2013.
Per-pound raw material costs *** from 2011 to 2013, but *** between the comparable interim periods. Raw materials accounted for an average *** percent of total COGS for the reporting period, and had a notable impact on the increase or decrease in per-pound COGS during this time. Per-pound raw material costs *** from 2011 to 2013, but *** between the comparable interim periods.
Also having a notable impact on the movement in overall COGS were other factory costs, which accounted for an average *** percent of total COGS for the reporting period. Per-pound other factory costs *** from 2011 to 2013, and *** between the comparable interim periods.2 3
1 Akzo Nobel also provided a U.S. producer questionnaire in these investigations. Akzo Nobel
produces a chelating agent, ***. Akzo Nobel ***. The financial data provided by Akzo Nobel are included in appendix E.
2 ***. Email from ***, August 15, 2014, and AJINA’s response to questions III-7 and III-8 of the U.S. producers’ questionnaire.
3 Direct labor *** of AJINA’s reported COGS. A company official noted that the MSG fermentation process requires ***. Email from *** of AJINA, October 31, 2013.
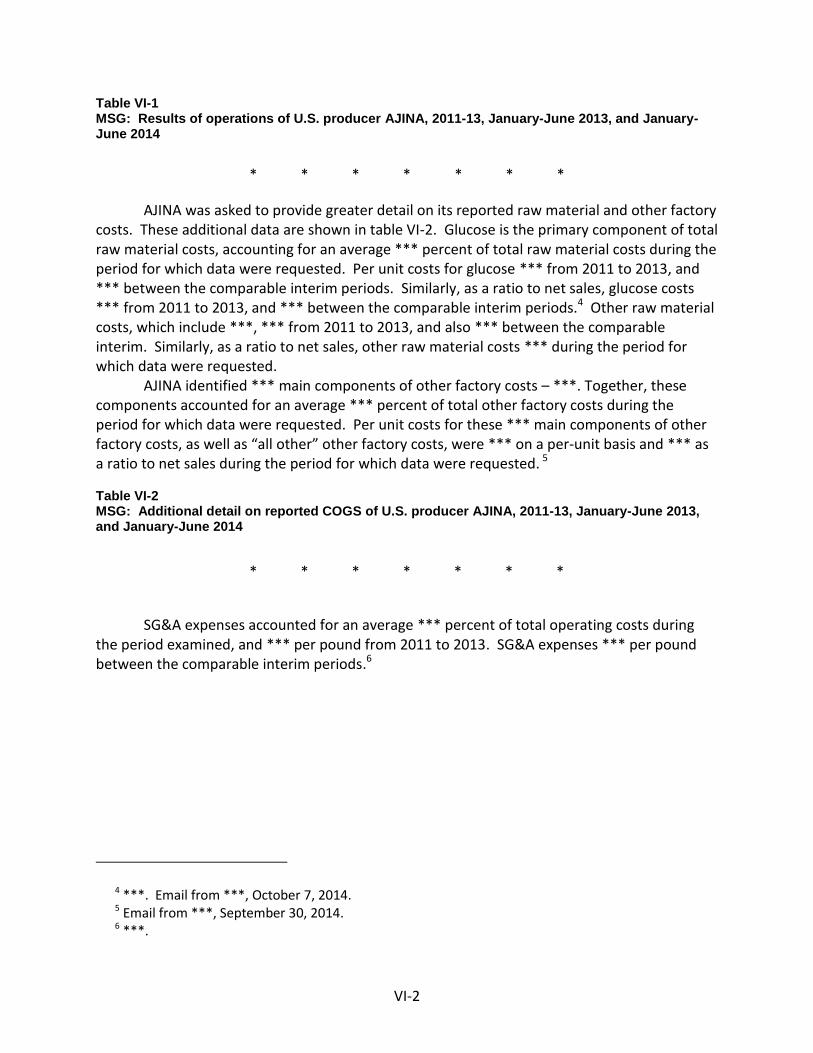
VI-2
Table VI-1 MSG: Results of operations of U.S. producer AJINA, 2011-13, January-June 2013, and January-June 2014
* * * * * * *
AJINA was asked to provide greater detail on its reported raw material and other factory costs. These additional data are shown in table VI-2. Glucose is the primary component of total raw material costs, accounting for an average *** percent of total raw material costs during the period for which data were requested. Per unit costs for glucose *** from 2011 to 2013, and *** between the comparable interim periods. Similarly, as a ratio to net sales, glucose costs *** from 2011 to 2013, and *** between the comparable interim periods.4 Other raw material costs, which include ***, *** from 2011 to 2013, and also *** between the comparable interim. Similarly, as a ratio to net sales, other raw material costs *** during the period for which data were requested.
AJINA identified *** main components of other factory costs – ***. Together, these components accounted for an average *** percent of total other factory costs during the period for which data were requested. Per unit costs for these *** main components of other factory costs, as well as “all other” other factory costs, were *** on a per-unit basis and *** as a ratio to net sales during the period for which data were requested. 5 Table VI-2 MSG: Additional detail on reported COGS of U.S. producer AJINA, 2011-13, January-June 2013, and January-June 2014
* * * * * * *
SG&A expenses accounted for an average *** percent of total operating costs during the period examined, and *** per pound from 2011 to 2013. SG&A expenses *** per pound between the comparable interim periods.6
4 ***. Email from ***, October 7, 2014. 5 Email from ***, September 30, 2014. 6 ***.
VI-3
Variance analysis
The variance analysis presented in table VI-3 is based on the data in table VI-1.7 The analysis shows that the decline in operating income from 2011 to 2013 is attributable to both unfavorable price and net cost/expense variances (that is, costs and expenses increased, and prices declined). In January-June 2014 as compared to January-June 2013, the analysis shows that the increase in operating income is attributable to a higher favorable net cost/expense variance despite an unfavorable price variance (that is, costs and expenses decreases more than prices declined).
Table VI-3 MSG: Variance analysis on the operations of U.S. producer AJINA, 2011-13, and January-June 2013-14
* * * * * * *
Capital expenditures, research and development expenses, and total assets
The responding firm’s aggregate data on capital expenditures, research and development (“R&D”) expenses, and total assets are shown in table VI-4. Aggregate capital expenditures *** from 2011 to 2013. In January-June 2014, capital expenditures were *** than in January-June 2013. R&D expenses *** from 2011 to 2013, and were *** in January-June 2014 as compared to January-June 2013. Total assets also *** from 2011 to 2013. According to AJINA, ***.8 9
7 The Commission’s variance analysis is calculated in three parts: sales variance, cost of sales
variance (COGS variance), and SG&A expense variance. Each part consists of a price variance (in the case of the sales variance) or a cost variance (in the case of the COGS and SG&A expense variance), and a volume variance. The sales or cost variance is calculated as the change in unit price or unit cost/expense times the new volume, while the volume variance is calculated as the change in volume times the old unit price or unit cost. Summarized at the bottom of the table, the price variance is from sales; the cost/expense variance is the sum of those items from COGS and SG&A variances, respectively, and the volume variance is the sum of the volume components of the net sales, COGS, and SG&A expense variances.
8 Emails from ***, October 28, 2013 and ***, August 15, 2014. See also Petitioner’s postconference brief, p. 25.
9 Based on the reported data for operating income and total assets, the calculated return on investment during the period examined is *** percent (2011), *** percent (2012), and *** percent (2013).
VI-4
Table VI-4 MSG: Capital expenditures, R&D expenses, and total assets of U.S. producer AJINA, 2011-13, January-June 2013, and January-June 2014
* * * * * * *
Capital and investment
The Commission requested the U.S. producer of MSG to describe any current or anticipated negative effects of imports of MSG from China or Indonesia on its growth, investment, ability to raise capital, development and production efforts, or the scale of capital investments. Responses by the U.S. producer AJINA follow.10
Effects of imports:
* * * * * * *
Anticipated effects of imports:
* * * * * * *
10 Akzo Nobel responded ***.
VII‐1
PART VII: THREAT CONSIDERATIONS AND INFORMATION ON NONSUBJECT COUNTRIES
Section 771(7)(F)(i) of the Act (19 U.S.C. § 1677(7)(F)(i)) provides that—
In determining whether an industry in the United States is threatened with material injury by reason of imports (or sales for importation) of the subject merchandise, the Commission shall consider, among other relevant economic factors1‐‐ (I) if a countervailable subsidy is involved, such information as may
be presented to it by the administering authority as to the nature of the subsidy (particularly as to whether the countervailable subsidy is a subsidy described in Article 3 or 6.1 of the Subsidies Agreement), and whether imports of the subject merchandise are likely to increase,
(II) any existing unused production capacity or imminent, substantial increase in production capacity in the exporting country indicating the likelihood of substantially increased imports of the subject merchandise into the United States, taking into account the availability of other export markets to absorb any additional exports,
(III) a significant rate of increase of the volume or market penetration of imports of the subject merchandise indicating the likelihood of substantially increased imports,
(IV) whether imports of the subject merchandise are entering at prices that are likely to have a significant depressing or suppressing effect on domestic prices, and are likely to increase demand for further imports,
(V) inventories of the subject merchandise,
1 Section 771(7)(F)(ii) of the Act (19 U.S.C. § 1677(7)(F)(ii)) provides that “The Commission shall consider {these factors} . . . as a whole in making a determination of whether further dumped or subsidized imports are imminent and whether material injury by reason of imports would occur unless an order is issued or a suspension agreement is accepted under this title. The presence or absence of any factor which the Commission is required to consider . . . shall not necessarily give decisive guidance with respect to the determination. Such a determination may not be made on the basis of mere conjecture or supposition.”
VII‐2
(VI) the potential for product‐shifting if production facilities in the foreign country, which can be used to produce the subject merchandise, are currently being used to produce other products,
(VII) in any investigation under this title which involves imports of both a raw agricultural product (within the meaning of paragraph (4)(E)(iv)) and any product processed from such raw agricultural product, the likelihood that there will be increased imports, by reason of product shifting, if there is an affirmative determination by the Commission under section 705(b)(1) or 735(b)(1) with respect to either the raw agricultural product or the processed agricultural product (but not both),
(VIII) the actual and potential negative effects on the existing development and production efforts of the domestic industry, including efforts to develop a derivative or more advanced version of the domestic like product, and
(IX) any other demonstrable adverse trends that indicate the probability that there is likely to be material injury by reason of imports (or sale for importation) of the subject merchandise (whether or not it is actually being imported at the time).2
Information on the volume and pricing of imports of the subject merchandise is presented in Parts IV and V; information on the effects of imports of the subject merchandise on U.S. producers’ existing development and production efforts is presented in Part VI. Information on inventories of the subject merchandise; foreign producers’ operations, including the potential for “product‐shifting;” any other threat indicators, if applicable; and any dumping in third‐country markets, follows. Also presented in this section of the report is information obtained for consideration by the Commission on nonsubject countries.
THE INDUSTRY IN CHINA
China is the world’s largest MSG producing country with an annual capacity of approximately *** pounds in 2009. AJINA now estimates the Chinese industry’s total capacity in 2012 to be *** pounds.3 China produced *** pounds of MSG in 2009. There are over fifteen
2 Section 771(7)(F)(iii) of the Act (19 U.S.C. § 1677(7)(F)(iii)) further provides that, in antidumping investigations, “. . . the Commission shall consider whether dumping in the markets of foreign countries (as evidenced by dumping findings or antidumping remedies in other WTO member markets against the same class or kind of merchandise manufactured or exported by the same party as under investigation) suggests a threat of material injury to the domestic industry.”
3 Petitioner’s prehearing brief, p. 62 and Petition, Exhibit I‐29, referencing ***.
VII‐3
producers of MSG in China, including Hebei Meihua Monosodium Glutamate Group Co., Ltd.; Henan Lianhua Monosodium Glutamate Co., Ltd.; Henan Lotus Gourmet Powder Inc.; Qilu Monosodium Glutamate Group Co., Ltd.; Shandong Fufeng Fermentation Co., Ltd. and Shandong Linghua Group Co., Ltd. The Fufeng Group alone reported a production capacity of 2.3 billion pounds for MSG in 2012.4 In China, MSG is produced through fermentation processes, largely using corn or cassava starch.5 In 2006, China became the world’s largest MSG exporting country, followed by Brazil and Indonesia. Chinese MSG exports accounted for approximately *** percent of the world’s MSG exports in 2009.6 The largest producers of MSG in China and their annual capacities are presented in table VII‐1.
Table VII-1 MSG: Chinese producers and production capacities, 2009
* * * * * * *
The Commission issued foreign producers’ or exporters’ questionnaires to 15 firms believed to produce and/or export MSG from China.7 The Commission received one questionnaire response from Akzo Nobel Chemicals (Ningbo) Co. Ltd. (“Akzo Nobel(Ningbo)”). Akzo Nobel (Ningbo) uses MSG in the ***.
Akzo Nobel (Ningbo) did not provide complete data. Its annual average production capacity of MSG is ***. It produced ***.
THE INDUSTRY IN INDONESIA
Indonesia is the world’s second largest MSG producing country with an annual capacity of approximately *** pounds in 2009. Indonesia produced *** pounds of MSG in 2009.8 Indonesian producers use largely sugar, tapioca, and molasses as the primary raw material in the production of MSG.9 CJ Indonesia’s most significant feedstock is ***.10 There are seven known producers of MSG in Indonesia. Those firms and their annual capacities are presented in table VII‐2.
4 Petitioner’s prehearing brief, p. 62, Exhibit 14, and Petition, Exhibit I‐10. 5 ***. 6 ***. 7 These firms were identified through a review of information submitted in the petition and through
staff research. 8 ***. 9 CJ’s prehearing brief, p. 29. 10 CJ’s posthearing brief, p. 58.
VII‐4
Table VII-2 MSG: Indonesian producers and production capacities, 2009
* * * * * * *
The Commission issued foreign producers’ or exporters’ questionnaires to seven firms believed to produce and/or export MSG from Indonesia.11 Useable responses to the Commission’s questionnaire were received from three firms: PT Ajinex International (“PT Ajinex”) and PT Ajinomoto Indonesia (“PT Ajinomoto), both affiliates of AJINA, as well as P.T. Cheil Jedang Indonesia (“CJ Indonesia”). PT Ajinex and PT Ajinomoto do not export to the United States.12 CJ Indonesia estimates that its exports to the United States accounted for *** U.S. imports of MSG from Indonesia in 2013. According to estimates requested of the responding Indonesian producers, the production of MSG in Indonesia reported in this Part of the report accounts for at least *** percent13 of overall production of MSG in Indonesia. Table VII‐3 presents 2013 capacity, production, and export shipment data for the responding Indonesian firms.
Table VII-3 MSG: Responding Indonesian producers’ reported production capacity, production, and U.S. exports, by firm, 2013
* * * * * * *
Foreign producers were asked to report any changes in operations since January 2011. PT Ajinex ***. PT Ajinomoto ***. CJ Indonesia ***. CJ Indonesia reorganized its production operations in Indonesia, resulting in an increase and then a decrease in capacity as the second plant was brought online. Then the first plant ceased production of MSG. CJ Indonesia states that is currently operating at full capacity and has operated at close to full capacity throughout the period of investigation.14
*** reported they are not able to switch production between MSG and other products using the same manufacturing equipment. The primary constraint on production in Indonesia is the fermentation process.
Table VII‐4 presents information on the MSG operations of the responding producers and exporters in Indonesia. CJ Indonesia explained that its capacity increased in 2012 and then decreased in 2013 because of an internal reorganization that closed one facility and relocated
11 These firms were identified through a review of information submitted in the petition and contained through staff research.
12 Petition, p. 3. 13 ***. 14 CJ’s prehearing brief, p. 25.
VII‐5
to Jombang.15 CJ Indonesia exports to more than 50 countries, primarily in Asia.16 In 2014, CJ Indonesia’s five largest markets were ***.17
Table VII-4 MSG: Data for producers in Indonesia, 2011-13, January-June 2013, January-June 2014, and projected 2014-15
* * * * * * *
U.S. INVENTORIES OF IMPORTED MERCHANDISE
Table VII‐5 presents data on U.S. importers’ reported inventories of MSG.
Table VII-5 MSG: U.S. importers’ inventories, 2011-13, January-June 2013, January-June 2014
* * * * * * *
The Commission requested importers to indicate whether they imported or arranged for the importation of MSG from China or Indonesia after June 30, 2014. Three responding importers reported that they arranged such shipments. Table VII‐6 presents data reported by U.S. importers concerning their arranged imports of MSG from subject sources.
Table VII-6 MSG: Arranged imports after June 30, 2014
* * * * * * *
ANTIDUMPING OR COUNTERVAILING DUTY ORDERS IN THIRD‐COUNTRY MARKETS
In November 2008, the European Union imposed an antidumping duty order on imports of MSG from China. The duty rates for China are between 36.5 and 39.7 percent.18 In September 2013, Ajinomoto Foods Europe SAS requested to extend the presently‐applicable antidumping duties against China and the investigation is scheduled to conclude in 2015.19 In addition, on October 16, 2013, Ajinomoto’s European affiliate filed a complaint with the European Commission against imports of MSG from Indonesia. The European Commission
15 Hearing transcript, pp. 131‐132 (Kaufman). 16 Hearing transcript, p. 169 (Kim) and pp. 174‐175 (Lee). 17 Respondents’ posthearing brief, p. 60. 18 Official Journal of the European Union, Council Regulation (EC) No 1187/2008, November 27, 2008. 19 Official Journal of the European Union, Notice of initiation of an expiry review of the anti‐dumping
measures applicable to imports of monosodium glutamate originating in the People’s Republic of China (2013/C 349/05), November 29, 2013.
VII‐6
provided notice of initiation of the anti‐dumping proceeding on November 29, 2013 and the investigation will not be completed until 2015.20 Provisional measures were published on August 21, 2014 at the following rates: PT Cheil Jedang Indonesia, 7 percent; PT Miwon Indonesia, 13.3 percent; and all other companies, 28.4 percent.21
INFORMATION ON NONSUBJECT COUNTRIES
In assessing whether the domestic industry is materially injured or threatened with material injury “by reason of subject imports,” the legislative history states “that the Commission must examine all relevant evidence, including any known factors, other than the dumped or subsidized imports, that may be injuring the domestic industry, and that the Commission must examine those other factors (including non‐subject imports) ‘to ensure that it is not attributing injury from other sources to the subject imports.’”22
Table VII‐7 presents world capacity and production of MSG in 2009, as well as projected capacity in 2014. Ajinomoto produces MSG in many nonsubject countries, including ***. 23 Other firms in nonsubject countries with substantial capacity to produce MSG include Daesang Corporation of South Korea and Vedan Enterprise Corp. of Vietnam. Additional information concerning the price of nonsubject imports is included in Appendix D.
AJINA estimates world demand for MSG in 2012 to be *** metric tons. Consumption of MSG is greatest in Asia. The per capita intake of MSG is *** The per capita intake of MSG in the United States is ***, while Europe is ***.24
Table VII-7 MSG: World capacity and production, by country, 2009 and projected 2014
* * * * * * *
20 Notice of initiation of an anti‐dumping proceeding concerning imports of monosodium glutamate originating in Indonesia (2013/C 349/04), Official Journal of the European Union, November 11, 2013.
21 Hearing exhibits, EU Antidumping Proceedings Regarding Imports of Monosodium Glutamate (MSG), Till Muller‐Ibold, p. 5
22 Mittal Steel Point Lisas Ltd. v. United States, Slip Op. 2007‐1552 at 17 (Fed. Cir., Sept. 18, 2008), quoting from Statement of Administrative Action on Uruguay Round Agreements Act, H.R. Rep. 103‐316, Vol. I at 851‐52; see also Bratsk Aluminum Smelter v. United States, 444 F.3d 1369 (Fed. Cir. 2006).
23 ***. 24 Petitioner’s posthearing brief, Exhibit 11.
A‐1
APPENDIX A
FEDERAL REGISTER NOTICES

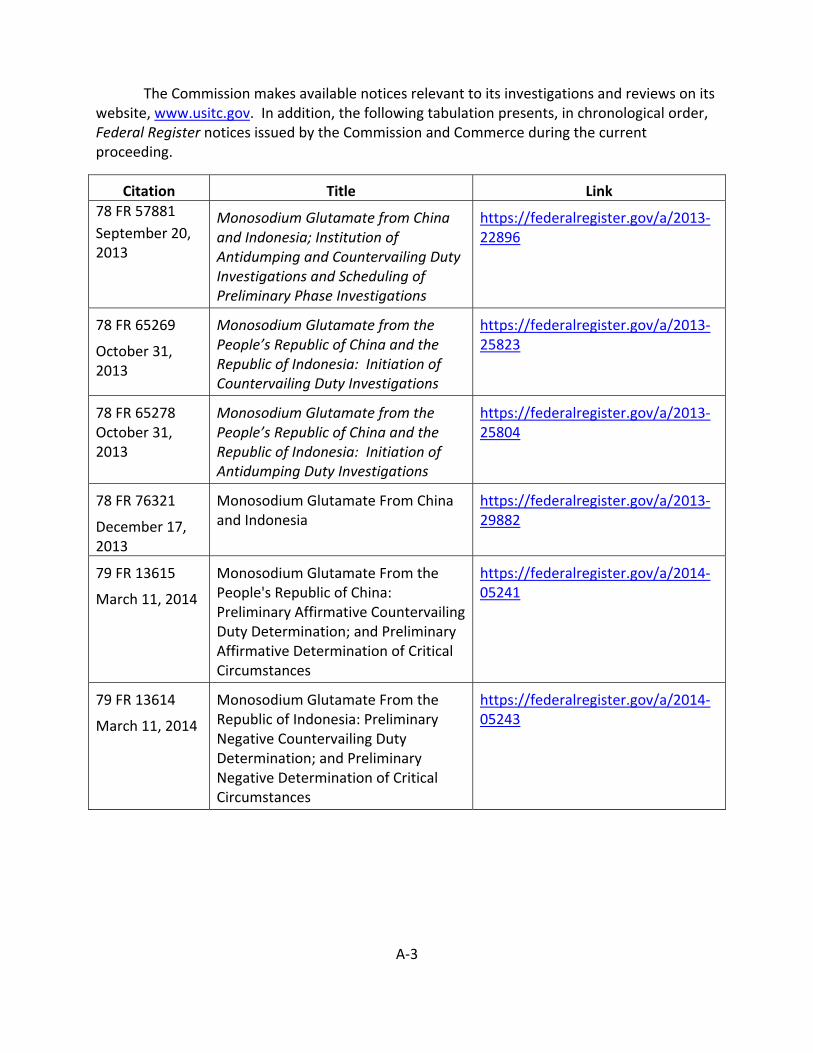
A‐3
The Commission makes available notices relevant to its investigations and reviews on its website, www.usitc.gov. In addition, the following tabulation presents, in chronological order, Federal Register notices issued by the Commission and Commerce during the current proceeding.
Citation Title Link
78 FR 57881
September 20, 2013
Monosodium Glutamate from China and Indonesia; Institution of Antidumping and Countervailing Duty Investigations and Scheduling of Preliminary Phase Investigations
https://federalregister.gov/a/2013‐22896
78 FR 65269
October 31, 2013
Monosodium Glutamate from the People’s Republic of China and the Republic of Indonesia: Initiation of Countervailing Duty Investigations
https://federalregister.gov/a/2013‐25823
78 FR 65278 October 31, 2013
Monosodium Glutamate from the People’s Republic of China and the Republic of Indonesia: Initiation of Antidumping Duty Investigations
https://federalregister.gov/a/2013‐25804
78 FR 76321
December 17, 2013
Monosodium Glutamate From China and Indonesia
https://federalregister.gov/a/2013‐29882
79 FR 13615
March 11, 2014
Monosodium Glutamate From the People's Republic of China: Preliminary Affirmative Countervailing Duty Determination; and Preliminary Affirmative Determination of Critical Circumstances
https://federalregister.gov/a/2014‐05241
79 FR 13614
March 11, 2014
Monosodium Glutamate From the Republic of Indonesia: Preliminary Negative Countervailing Duty Determination; and Preliminary Negative Determination of Critical Circumstances
https://federalregister.gov/a/2014‐05243
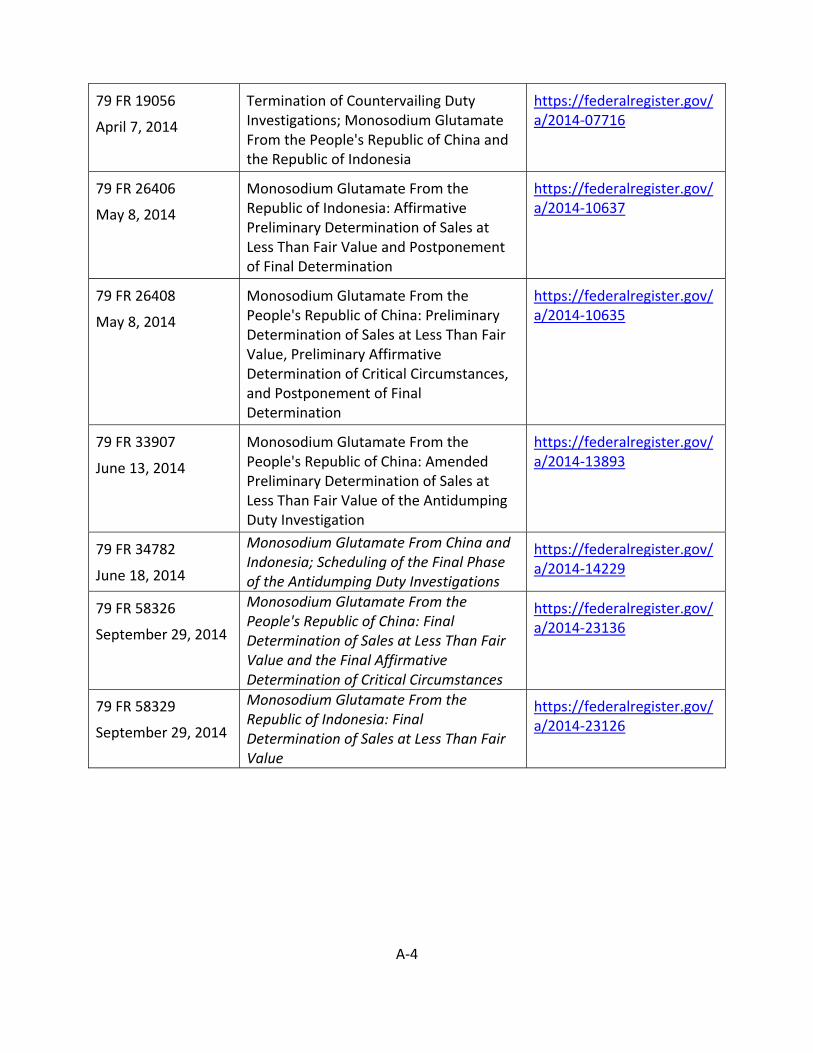
A‐4
79 FR 19056
April 7, 2014
Termination of Countervailing Duty Investigations; Monosodium Glutamate From the People's Republic of China and the Republic of Indonesia
https://federalregister.gov/a/2014‐07716
79 FR 26406
May 8, 2014
Monosodium Glutamate From the Republic of Indonesia: Affirmative Preliminary Determination of Sales at Less Than Fair Value and Postponement of Final Determination
https://federalregister.gov/a/2014‐10637
79 FR 26408
May 8, 2014
Monosodium Glutamate From the People's Republic of China: Preliminary Determination of Sales at Less Than Fair Value, Preliminary Affirmative Determination of Critical Circumstances, and Postponement of Final Determination
https://federalregister.gov/a/2014‐10635
79 FR 33907
June 13, 2014
Monosodium Glutamate From the People's Republic of China: Amended Preliminary Determination of Sales at Less Than Fair Value of the Antidumping Duty Investigation
https://federalregister.gov/a/2014‐13893
79 FR 34782
June 18, 2014
Monosodium Glutamate From China and Indonesia; Scheduling of the Final Phase of the Antidumping Duty Investigations
https://federalregister.gov/a/2014‐14229
79 FR 58326
September 29, 2014
Monosodium Glutamate From the People's Republic of China: Final Determination of Sales at Less Than Fair Value and the Final Affirmative Determination of Critical Circumstances
https://federalregister.gov/a/2014‐23136
79 FR 58329
September 29, 2014
Monosodium Glutamate From the Republic of Indonesia: Final Determination of Sales at Less Than Fair Value
https://federalregister.gov/a/2014‐23126
B‐1
APPENDIX B
LIST OF HEARING WITNESSES

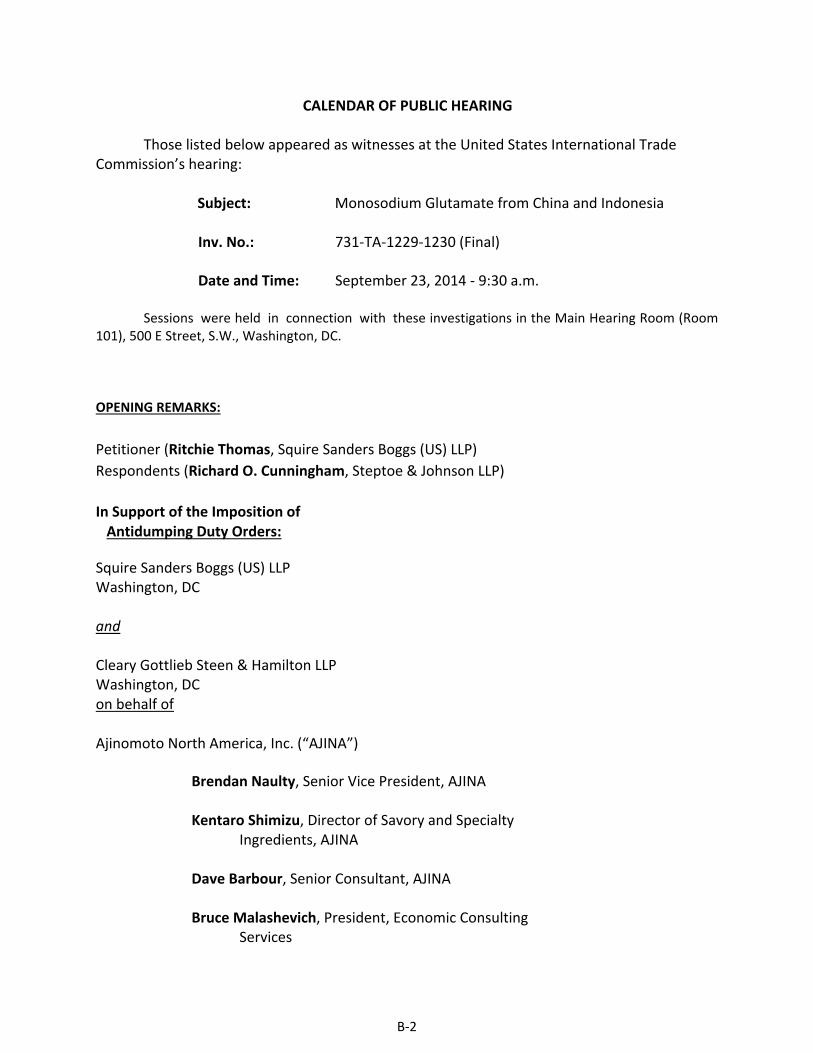
B‐2
CALENDAR OF PUBLIC HEARING
Those listed below appeared as witnesses at the United States International Trade Commission’s hearing:
Subject: Monosodium Glutamate from China and Indonesia
Inv. No.: 731‐TA‐1229‐1230 (Final)
Date and Time: September 23, 2014 ‐ 9:30 a.m.
Sessions were held in connection with these investigations in the Main Hearing Room (Room
101), 500 E Street, S.W., Washington, DC.
OPENING REMARKS:
Petitioner (Ritchie Thomas, Squire Sanders Boggs (US) LLP)
Respondents (Richard O. Cunningham, Steptoe & Johnson LLP)
In Support of the Imposition of Antidumping Duty Orders: Squire Sanders Boggs (US) LLP Washington, DC and Cleary Gottlieb Steen & Hamilton LLP Washington, DC on behalf of Ajinomoto North America, Inc. (“AJINA”) Brendan Naulty, Senior Vice President, AJINA
Kentaro Shimizu, Director of Savory and Specialty Ingredients, AJINA
Dave Barbour, Senior Consultant, AJINA
Bruce Malashevich, President, Economic Consulting Services
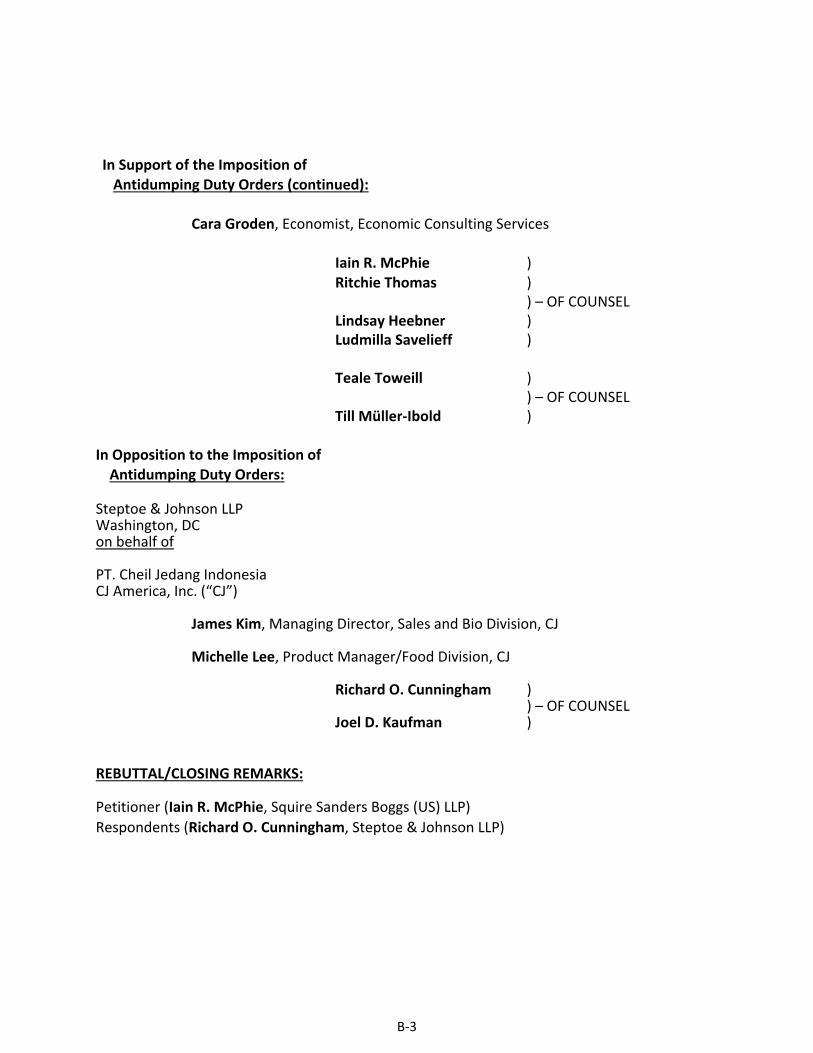
B‐3
In Support of the Imposition of Antidumping Duty Orders (continued): Cara Groden, Economist, Economic Consulting Services
Iain R. McPhie ) Ritchie Thomas ) ) – OF COUNSEL
Lindsay Heebner ) Ludmilla Savelieff )
Teale Toweill ) ) – OF COUNSEL Till Müller‐Ibold ) In Opposition to the Imposition of Antidumping Duty Orders: Steptoe & Johnson LLP Washington, DC on behalf of PT. Cheil Jedang Indonesia CJ America, Inc. (“CJ”) James Kim, Managing Director, Sales and Bio Division, CJ Michelle Lee, Product Manager/Food Division, CJ Richard O. Cunningham ) ) – OF COUNSEL Joel D. Kaufman ) REBUTTAL/CLOSING REMARKS: Petitioner (Iain R. McPhie, Squire Sanders Boggs (US) LLP)
Respondents (Richard O. Cunningham, Steptoe & Johnson LLP)
C‐1
APPENDIX C
SUMMARY DATA

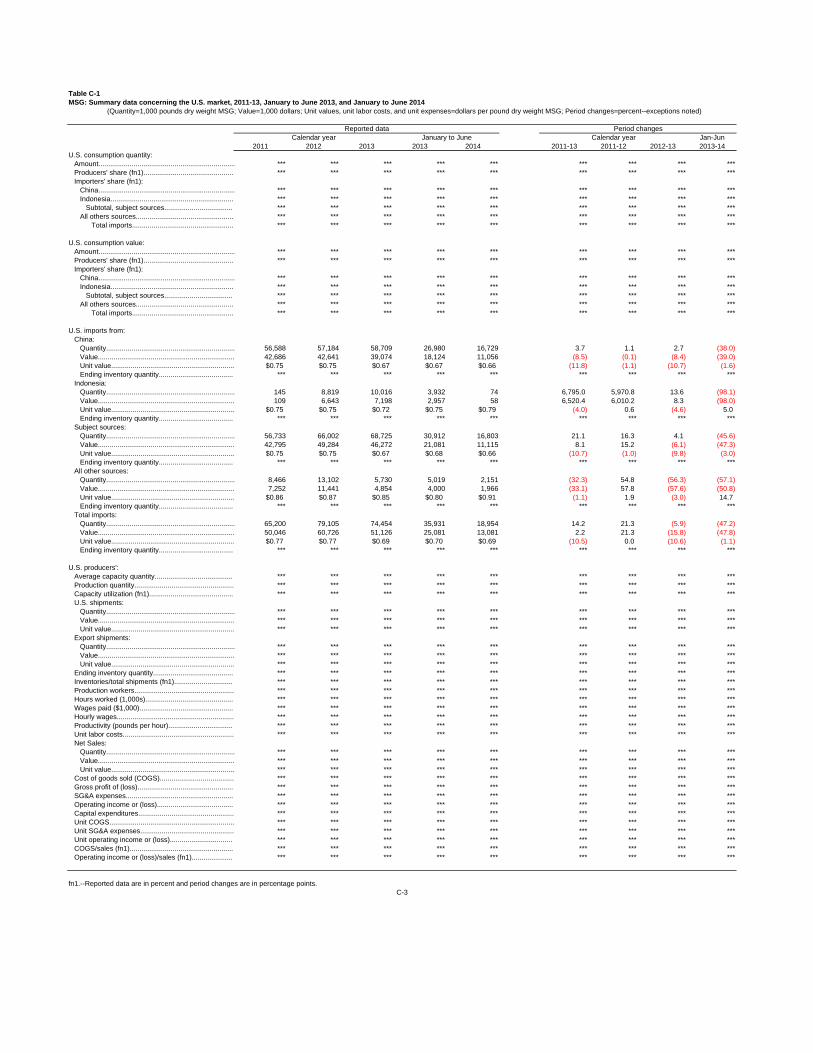
Table C-1MSG: Summary data concerning the U.S. market, 2011-13, January to June 2013, and January to June 2014
Jan-Jun2011 2012 2013 2013 2014 2011-13 2011-12 2012-13 2013-14
U.S. consumption quantity:Amount...................................................................... *** *** *** *** *** *** *** *** ***Producers' share (fn1).............................................. *** *** *** *** *** *** *** *** ***Importers' share (fn1):
China...................................................................... *** *** *** *** *** *** *** *** ***Indonesia............................................................... *** *** *** *** *** *** *** *** *** Subtotal, subject sources................................... *** *** *** *** *** *** *** *** ***All others sources.................................................. *** *** *** *** *** *** *** *** ***
Total imports.................................................... *** *** *** *** *** *** *** *** ***
U.S. consumption value:Amount...................................................................... *** *** *** *** *** *** *** *** ***Producers' share (fn1).............................................. *** *** *** *** *** *** *** *** ***Importers' share (fn1):
China...................................................................... *** *** *** *** *** *** *** *** ***Indonesia............................................................... *** *** *** *** *** *** *** *** *** Subtotal, subject sources................................... *** *** *** *** *** *** *** *** ***All others sources.................................................. *** *** *** *** *** *** *** *** ***
Total imports.................................................... *** *** *** *** *** *** *** *** ***
U.S. imports from:China:
Quantity.................................................................. 56,588 57,184 58,709 26,980 16,729 3.7 1.1 2.7 (38.0)Value...................................................................... 42,686 42,641 39,074 18,124 11,056 (8.5) (0.1) (8.4) (39.0)Unit value............................................................... $0.75 $0.75 $0.67 $0.67 $0.66 (11.8) (1.1) (10.7) (1.6)Ending inventory quantity...................................... *** *** *** *** *** *** *** *** ***
Indonesia:Quantity.................................................................. 145 8,819 10,016 3,932 74 6,795.0 5,970.8 13.6 (98.1)Value...................................................................... 109 6,643 7,198 2,957 58 6,520.4 6,010.2 8.3 (98.0)Unit value............................................................... $0.75 $0.75 $0.72 $0.75 $0.79 (4.0) 0.6 (4.6) 5.0Ending inventory quantity...................................... *** *** *** *** *** *** *** *** ***
Subject sources:Quantity.................................................................. 56,733 66,002 68,725 30,912 16,803 21.1 16.3 4.1 (45.6)Value...................................................................... 42,795 49,284 46,272 21,081 11,115 8.1 15.2 (6.1) (47.3)Unit value............................................................... $0.75 $0.75 $0.67 $0.68 $0.66 (10.7) (1.0) (9.8) (3.0)Ending inventory quantity...................................... *** *** *** *** *** *** *** *** ***
All other sources:Quantity.................................................................. 8,466 13,102 5,730 5,019 2,151 (32.3) 54.8 (56.3) (57.1)Value...................................................................... 7,252 11,441 4,854 4,000 1,966 (33.1) 57.8 (57.6) (50.8)Unit value............................................................... $0.86 $0.87 $0.85 $0.80 $0.91 (1.1) 1.9 (3.0) 14.7Ending inventory quantity...................................... *** *** *** *** *** *** *** *** ***
Total imports:Quantity.................................................................. 65,200 79,105 74,454 35,931 18,954 14.2 21.3 (5.9) (47.2)Value...................................................................... 50,046 60,726 51,126 25,081 13,081 2.2 21.3 (15.8) (47.8)Unit value............................................................... $0.77 $0.77 $0.69 $0.70 $0.69 (10.5) 0.0 (10.6) (1.1)Ending inventory quantity...................................... *** *** *** *** *** *** *** *** ***
U.S. producers':Average capacity quantity........................................ *** *** *** *** *** *** *** *** ***Production quantity................................................... *** *** *** *** *** *** *** *** ***Capacity utilization (fn1)........................................... *** *** *** *** *** *** *** *** ***U.S. shipments:
Quantity.................................................................. *** *** *** *** *** *** *** *** ***Value...................................................................... *** *** *** *** *** *** *** *** ***Unit value............................................................... *** *** *** *** *** *** *** *** ***
Export shipments:Quantity.................................................................. *** *** *** *** *** *** *** *** ***Value...................................................................... *** *** *** *** *** *** *** *** ***Unit value............................................................... *** *** *** *** *** *** *** *** ***
Ending inventory quantity......................................... *** *** *** *** *** *** *** *** ***Inventories/total shipments (fn1).............................. *** *** *** *** *** *** *** *** ***Production workers................................................... *** *** *** *** *** *** *** *** ***Hours worked (1,000s)............................................. *** *** *** *** *** *** *** *** ***Wages paid ($1,000)................................................ *** *** *** *** *** *** *** *** ***Hourly wages............................................................ *** *** *** *** *** *** *** *** ***Productivity (pounds per hour)................................. *** *** *** *** *** *** *** *** ***Unit labor costs......................................................... *** *** *** *** *** *** *** *** ***Net Sales:
Quantity.................................................................. *** *** *** *** *** *** *** *** ***Value...................................................................... *** *** *** *** *** *** *** *** ***Unit value............................................................... *** *** *** *** *** *** *** *** ***
Cost of goods sold (COGS)...................................... *** *** *** *** *** *** *** *** ***Gross profit of (loss)................................................. *** *** *** *** *** *** *** *** ***SG&A expenses....................................................... *** *** *** *** *** *** *** *** ***Operating income or (loss)....................................... *** *** *** *** *** *** *** *** ***Capital expenditures................................................. *** *** *** *** *** *** *** *** ***Unit COGS................................................................ *** *** *** *** *** *** *** *** ***Unit SG&A expenses................................................ *** *** *** *** *** *** *** *** ***Unit operating income or (loss)................................ *** *** *** *** *** *** *** *** ***COGS/sales (fn1)..................................................... *** *** *** *** *** *** *** *** ***Operating income or (loss)/sales (fn1)..................... *** *** *** *** *** *** *** *** ***
fn1.--Reported data are in percent and period changes are in percentage points.C-3
(Quantity=1,000 pounds dry weight MSG; Value=1,000 dollars; Unit values, unit labor costs, and unit expenses=dollars per pound dry weight MSG; Period changes=percent--exceptions noted)
Reported data Period changesCalendar year January to June Calendar year

D‐1
APPENDIX D
NONSUBJECT COUNTRY PRICE DATA

D‐3
*** reported price data for nonsubject country Brazil for products 2, 3, and 4. Price data reported by these firms accounted for *** percent of U.S. imports from Brazil. These price items and accompanying data are comparable to those presented in tables V‐3 to V‐6 and figure V‐2 to V‐5. Price and quantity data for Brazil are shown in tables D‐1 to D‐3 and in figure D‐1 to D‐3(with domestic and subject sources).
In comparing nonsubject country pricing data with U.S. producer pricing data, prices for product imported from Brazil were lower than prices for U.S.‐produced product in 12 instances and higher in 18 instances. In comparing nonsubject country pricing data with subject country pricing data, prices for product imported from Brazil were lower than prices for product imported from subject countries in 11 instances and higher in 33 instances. A summary of margins of underselling and overselling is presented in table D‐4.
Table D-1 MSG: Weighted-average f.o.b. prices and quantities of imported product 21 and margins of underselling/(overselling), by quarters, January 2011-June 2014
* * * * * * * Table D-2 MSG: Weighted-average f.o.b. prices and quantities of imported product 31 and margins of underselling/(overselling), by quarters, January 2011-June 2014
* * * * * * *
Table D-3 MSG: Weighted-average f.o.b. prices and quantities of imported product 41 and margins of underselling/(overselling), by quarters, January 2011-June 2014
* * * * * * * Figure D-1 MSG: Weighted-average f.o.b. prices and quantities of domestic and imported product, by quarters, January 2011-June 2014
* * * * * * *
Figure D-2 MSG: Weighted-average f.o.b. prices and quantities of domestic and imported product, by quarters, January 2011-June 2014
* * * * * * *
D‐4
Figure D-3 MSG: Weighted-average f.o.b. prices and quantities of domestic and imported product, by quarters, January 2011-June 2014
* * * * * * *
Table D-4 MSG: Summary of underselling/(overselling), by country, January 2011-June 2014
* * * * * * *
E‐1
APPENDIX E
REPORTED FINANCIAL DATA FOR AKZO NOBEL

E‐3
Akzo Nobel’s reported financial data are included below:
Table E-1 MSG: Results of operations of Akzo Nobel, 2011-13, January to June 2013, and January to June 2014
* * * * * * *


![Research Article Effect of Monosodium Glutamate …...Monosodium L-glutamate is stable, soluble in water, and was considered as having no adverse effects during about 80 years [1-5].](https://static.documents.pub/doc/80x56/5f9d65d38fe9bf14db3f2a77/research-article-effect-of-monosodium-glutamate-monosodium-l-glutamate-is-stable.jpg)


