3
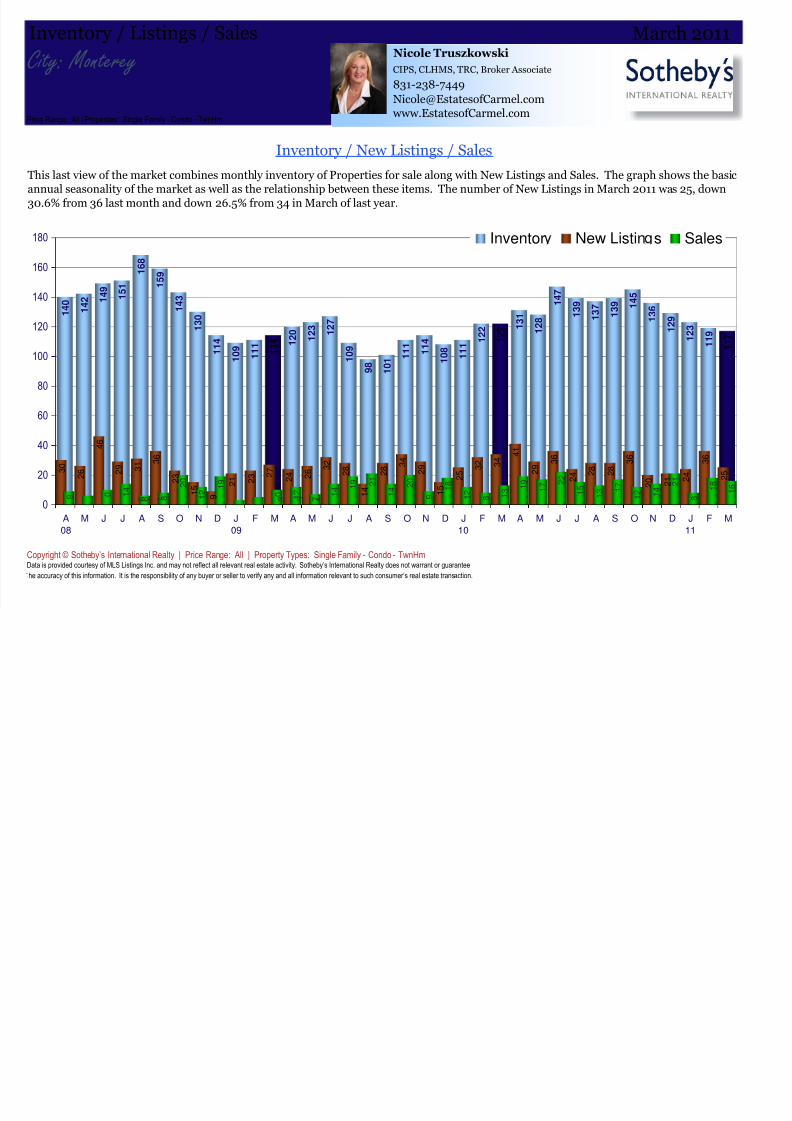
March 2011 Price Range: All | Properties: Single Family - Condo - TwnHm Market Profile & Trends Overview LM L3M PYM LY Pri or YTD Pr ior Ye ar Median List Price of all Current Listings Average List Price of all Current Listings March Median Sales Price March Average Sales Price Total Properties Currently for Sale (Inventory) March Number of Properties Sold March Average Days on Market (Solds) Asking Price per Square Foot (based on New Listings) March Sold Price per Square Foot March Month's Supply of Inventory March Sale Price vs List Price Ratio Property Sales Prices Inventory & MSI The Total Inventory of Properties available for sale as of March was 117, down 1.7% from 119 last month and down 4.1% from 122 in March of last year. March 2011 Inventory was at a mid level compared with March of 2010 and 2009. Trending versus*: * LM=Last Month / L3M=Last 3 Months / PYM=Sa me Month Prior Year / LY=Last Year (2010) / YTD = Year-to-date | Arrows indicate if Month / YTD values are highe r (up), lower (down) or unchanged (flat) Number of Properties Sold March Property sales were 16, up 23.1% from 13 in March of 2010 and 11.1% lower than the 18 sales last month. March 2011 sales were at their highest level compared to March of 2010 and 2009. March YTD sales of 42 are running 27.3% ahead of last year's year to-date sales of 33. $383 96.1% $347 $330 9.8 $346 Copyright © Sotheby’s Interna tional Rea lty | Price Rang e: All | Property Types: Single Family - Condo - TwnHm Data is provided courtesy of MLS Listings Inc. and may not reflect all relevant real estate activity. Sotheby’s Interna tional Realty does not warrant or guarantee 100 he accuracy of this information. It is the responsibility of any buyer or seller to verify any and all information relevant to such consumer’s real estate transaction Total Inventory & Month's Supply of Inventory (MSI) A comparatively lower MSI is more beneficial for sellers while a higher MSI is better fo r buyers. The March 2011 MSI of 7.3 months was at its lowest level compared with March of 2010 and 2009. The Median Sales Price in March was $449,000, down 0.2% from $450,000 in March of 2010 and up 45.8% from $307,950 last month. The Average Sales Price in March was $540,925, down 4.5% from $566,248 in March of 2010 and up 74.1% from $310,778 last month. March 2011 ASP was at a mid range compared to March of 2010 and 2009. $431,429 16 MARKET ACTION REPORT 124 101.7% $539,000 $628,925 $449,000 $540,925 117 Trending versus*: $391,000 City: Monterey Median Sales Price and Average Sales Price 42 7.3 Month YTD 9 6 1 0 1 4 6 8 2 0 1 2 1 9 3 5 1 2 7 1 4 1 9 2 1 1 4 2 0 9 1 8 1 2 8 1 9 1 7 2 2 1 5 1 3 1 7 1 2 1 4 2 1 8 1 8 1 0 1 3 1 6 0 5 10 15 20 25 A 08 MJ J AS ON DJ 09 FM AMJ J ASO NDJ 10 FM AMJ JA SO NDJ 11 F M 200 300 400 500 600 700 800 A 08 MJ JASO NDJ 09 FMA MJ JA SO NDJ 10 FMA MJ J ASO NDJ 11 F M Median means Middle (the same # of properties sold above and below the Median) MSI is the # of month's needed to sell all of the Inventory at the monthly Sales Pace 1 4 0 1 4 2 1 4 9 1 5 1 1 6 8 1 5 9 1 4 3 1 3 0 1 1 4 1 0 9 1 1 1 1 2 0 1 2 3 1 2 7 1 0 9 9 8 1 0 1 1 1 1 1 1 4 1 0 8 1 1 1 1 2 2 1 3 1 1 2 8 1 4 7 1 3 9 1 3 7 1 3 9 1 4 5 1 3 6 1 2 9 1 2 3 1 1 9 1 1 7 1 2 2 1 1 4 0 20 40 60 80 100 120 140 160 180 A 08 MJ JASO NDJ 09 FM AM J JASONDJ 10 FM AMJJ ASO NDJ 11 F M 0 5 10 15 20 25 30 35 40 (000's) 3 Mo Avg 3 Mo Avg Nicole Truszkowski CIPS, CLHMS, TRC, Broker Associate [email protected] 831-238-7449 www.EstatesofCarmel.com