49

Management Leadership Service Review
MONTGOMERY COUNTY, MARYLAND
Personnel Management Review
Merit System Employment ProfileTurnover Analysis
Wage and Salary Comparability
Montgomery County Government
Office of Human Resources
Classification and Compensation Team
101 Monroe Street, 12th Floor
Rockville, Maryland 20850
Page
Introduction
Merit System Employment ProfileGeneral Workforce Statistics 1-1
Pay Grade and Salary Distribution 1-6
Collective Bargaining 1-8
Leave Usage and Balances 1-10
Tuition Assistance 1-11
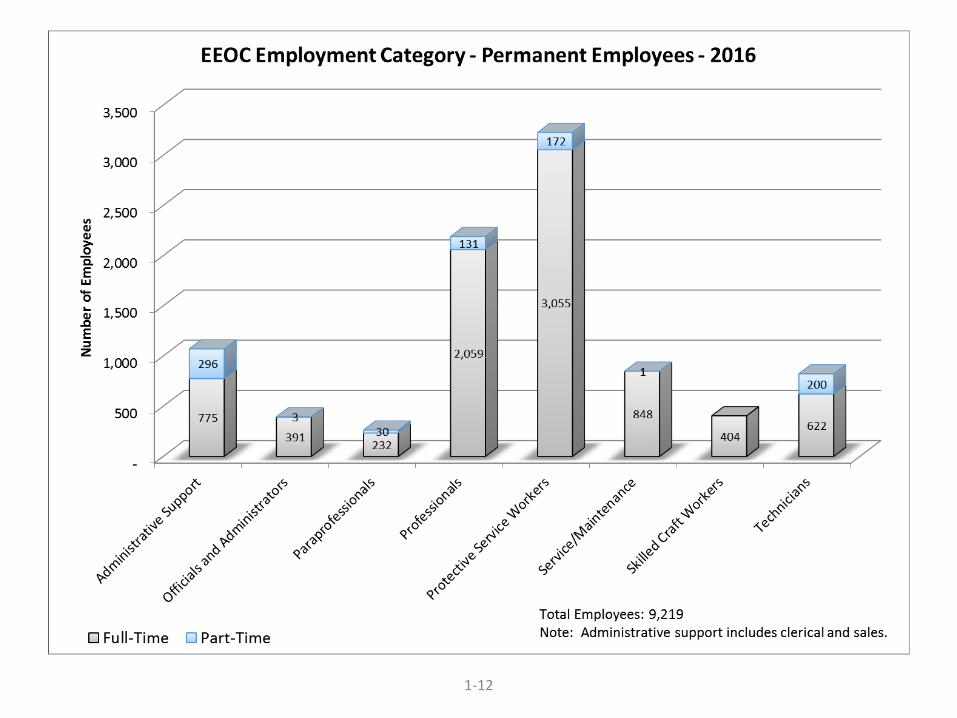
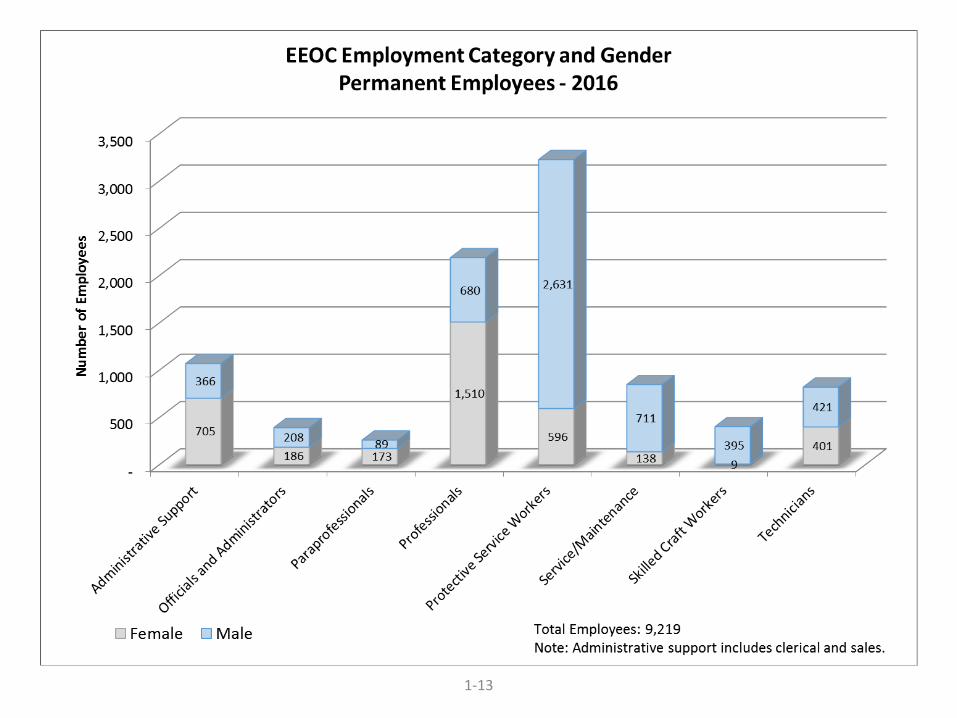
Equal Employment Opportunity 1-12
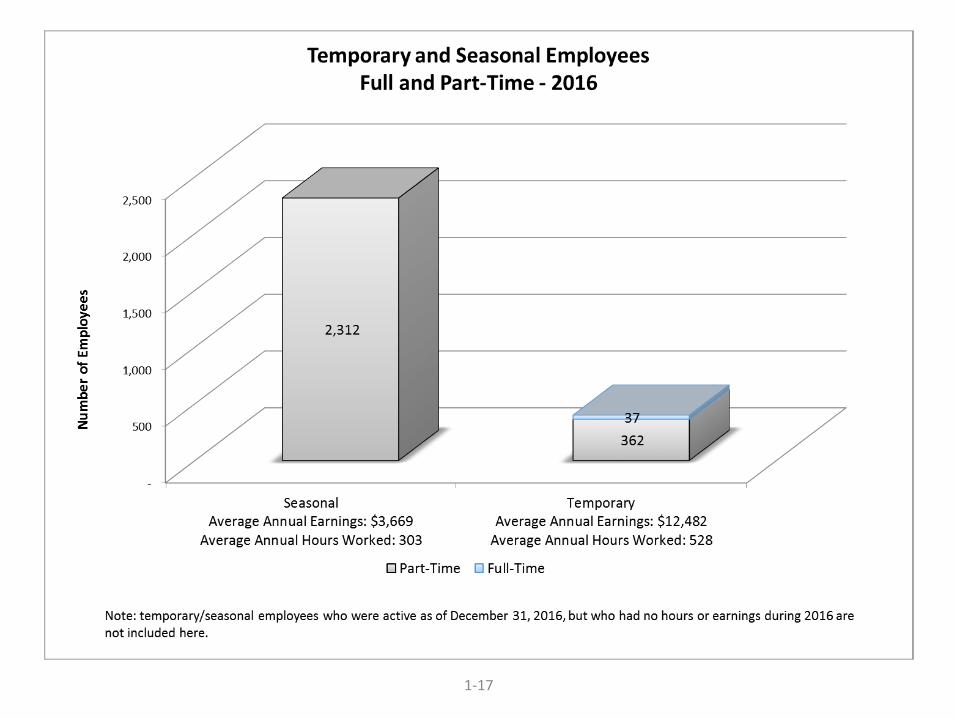
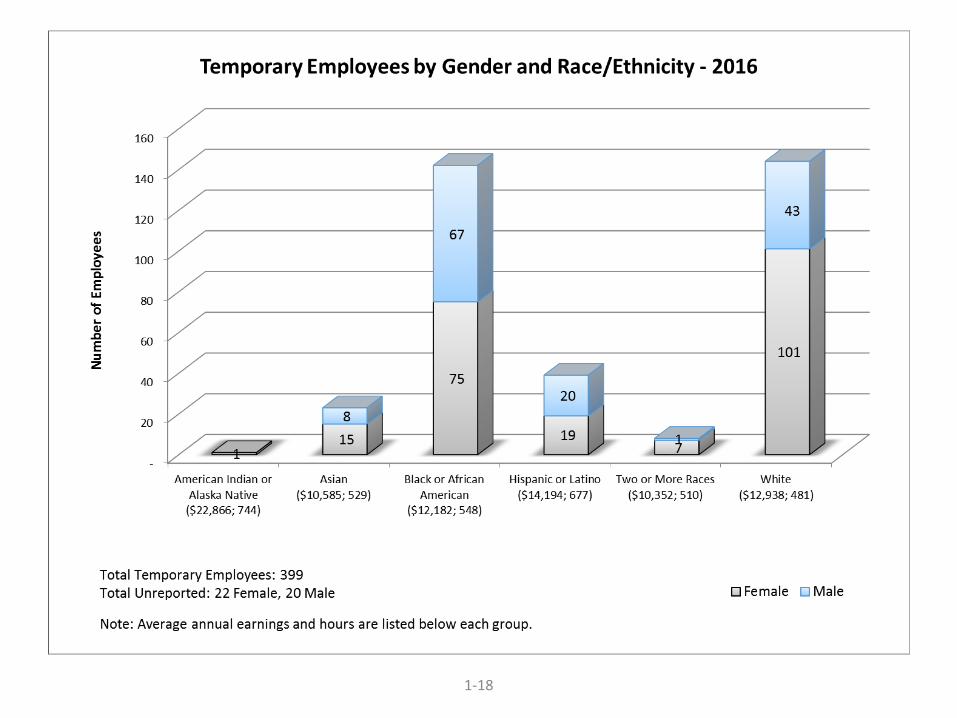
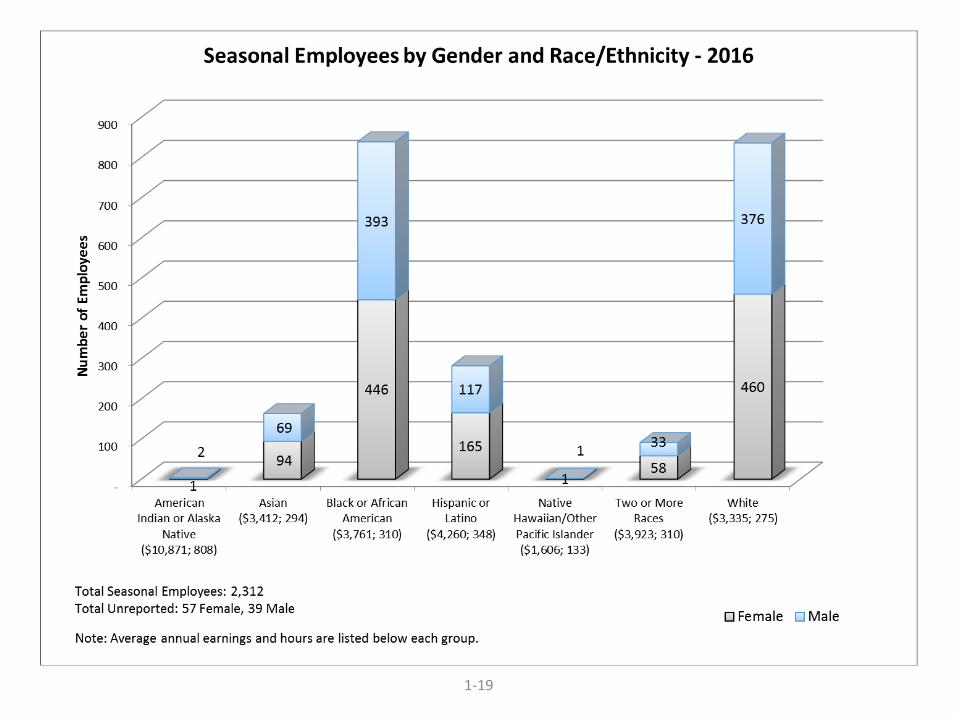
Temporary and Seasonal Employees 1-17
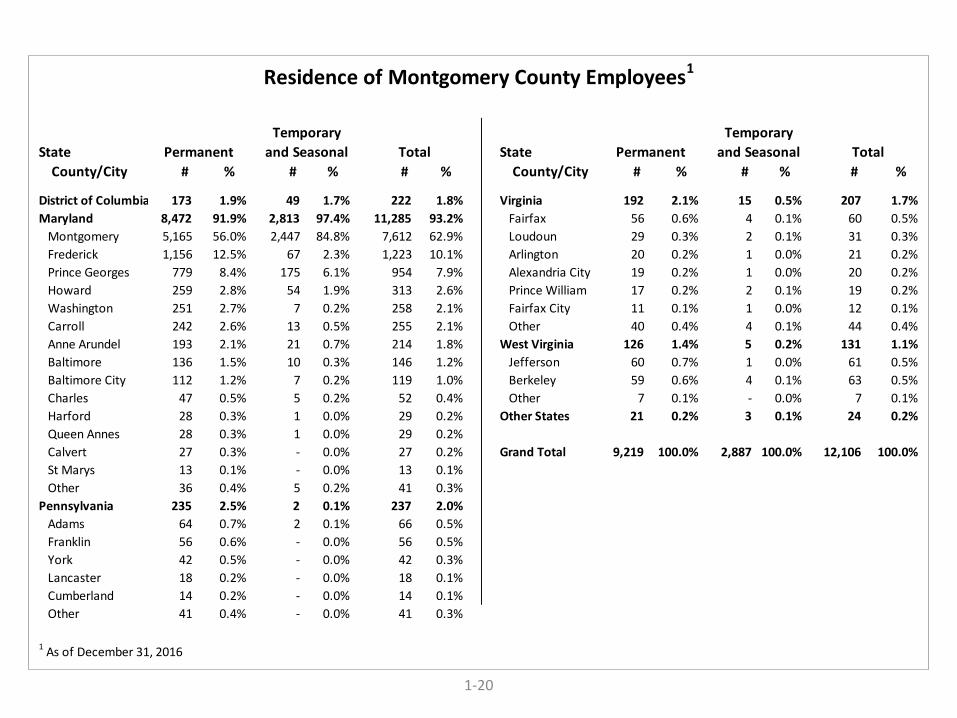
Location of Employee Residences 1-20
Turnover AnalysisSummary - Turnover History 2-1
Separated Employee Analysis 2-2
Wage and Salary ComparabilityComparison of Pay Increases to CPI 3-1
Comparison of Pay Increases to Private Sector 3-3
Comparison of Salaries to Federal Government 3-6
Comparison of Salaries to Local Area Employer Salaries 3-7
Comparison of Actual and Projected Pay Increases 3-12
Management Leadership Service ReviewMLS Demographic Data by Grade 4-1
MLS Separations by Reason for Separation 4-2
MLS Demographic Data by Rating Category 4-3
Distribution of Performance Ratings by Pay Band 4-4
Average Pay Award Based on Rating Category and Salary Range Position 4-5
Key Changes to MLS Performance-Based Pay 4-6
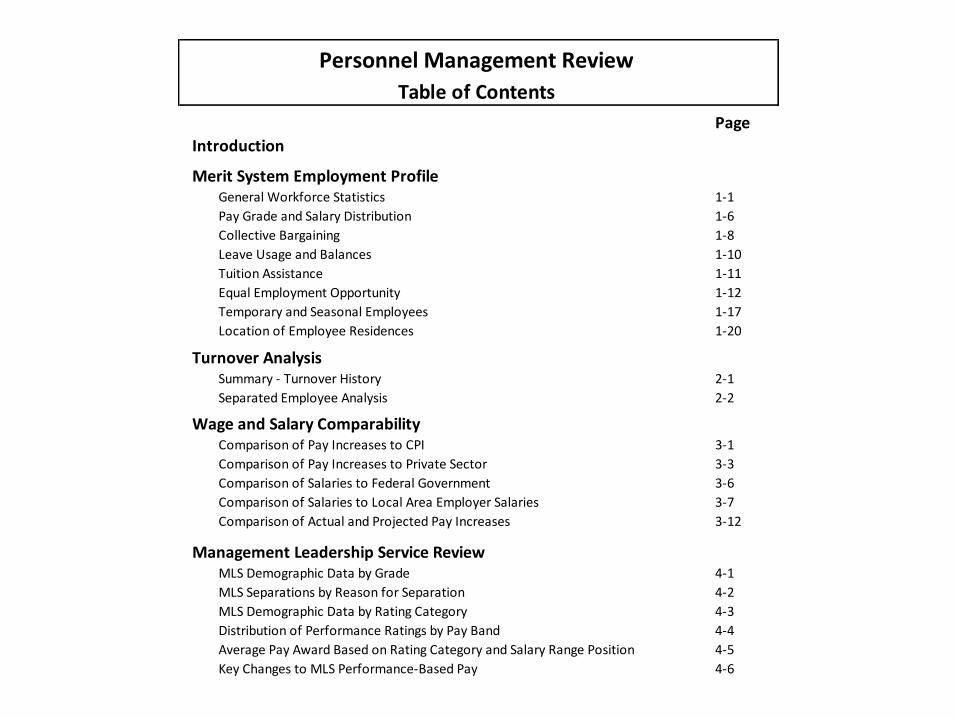
Personnel Management Review
Table of Contents

INTRODUCTION
The Personnel Management Review is compiled by the Office of Human Resources. The purpose ofthis report is to provide the County Council and the public with general information concerning thesize and composition of the County government workforce; employee turnover rates and reasons forturnover; and information concerning the comparability of County salary ranges with those of publicand private sector organizations in the Washington-Baltimore metropolitan area. This edition adds anadditional section, a review of the management leadership service, required by Montgomery CountyPersonnel Regulations, Section 10-10(c)(3)(F).
Additional information concerning the County government workforce and employee compensation ispresented in the County Executive’s Recommended FY17 Operating Budget and FY17-22 PublicServices Program.
Any questions concerning information contained in this report may be directed to Lori O’Brien,Compensation Manager, Business Operations and Performance, Office of Human Resources, at240.777.5032.
Credits
Lori O’Brien
Liji Scaria
Pamela Vaughn
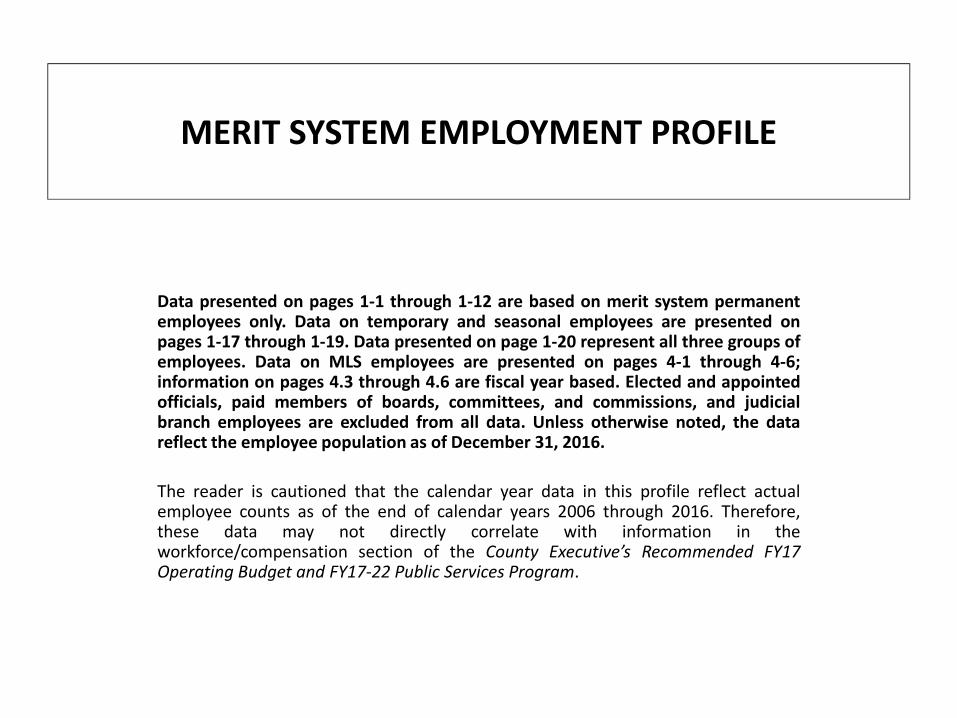
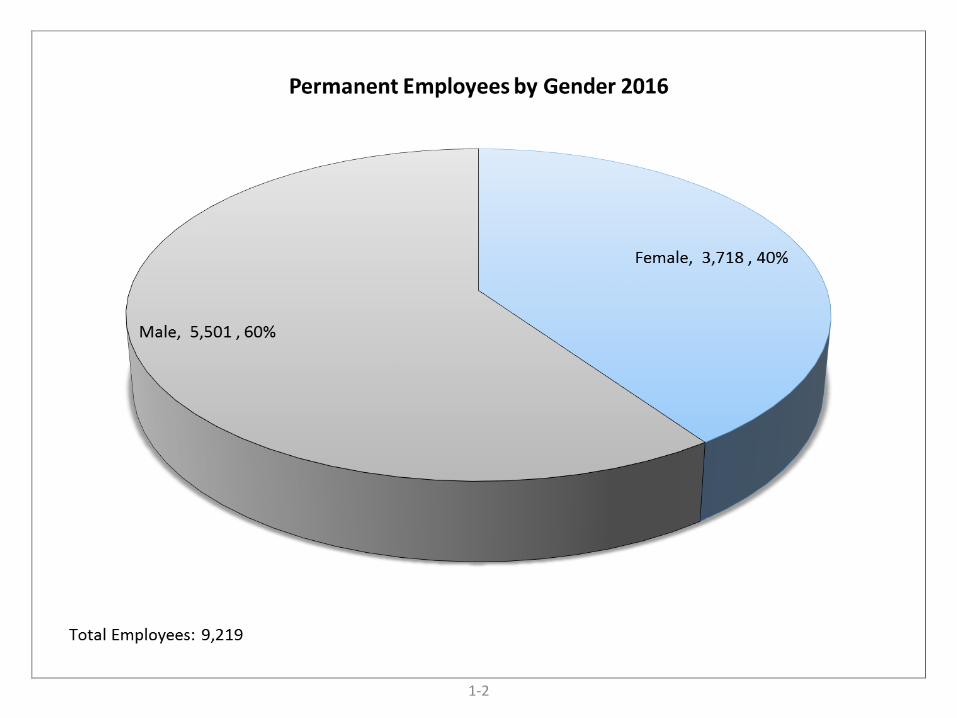
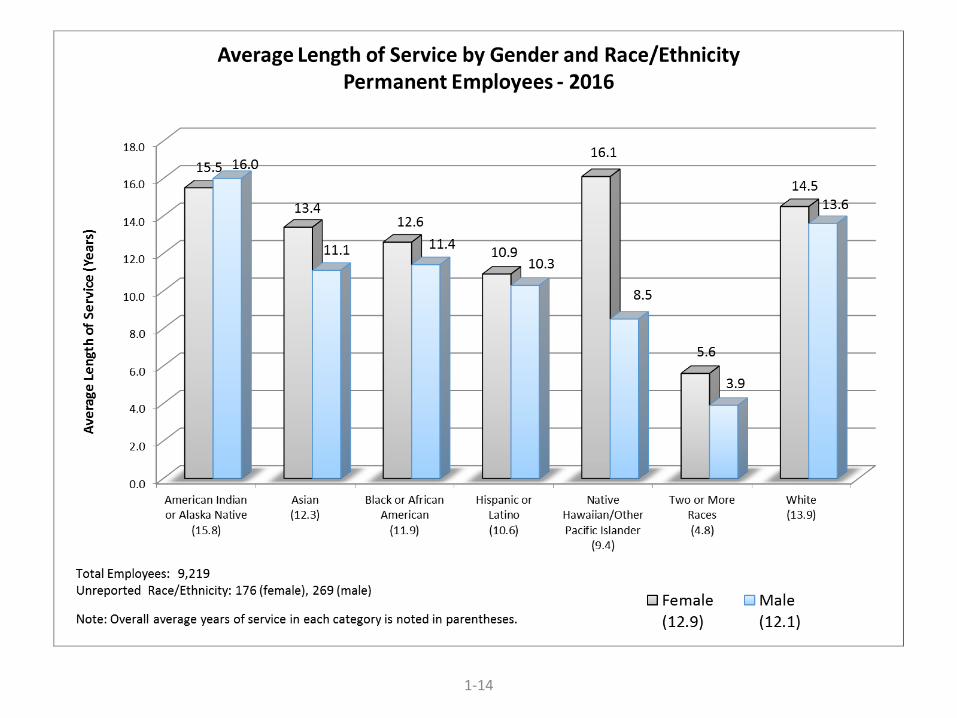
MERIT SYSTEM EMPLOYMENT PROFILE
Data presented on pages 1-1 through 1-12 are based on merit system permanentemployees only. Data on temporary and seasonal employees are presented onpages 1-17 through 1-19. Data presented on page 1-20 represent all three groups ofemployees. Data on MLS employees are presented on pages 4-1 through 4-6;information on pages 4.3 through 4.6 are fiscal year based. Elected and appointedofficials, paid members of boards, committees, and commissions, and judicialbranch employees are excluded from all data. Unless otherwise noted, the datareflect the employee population as of December 31, 2016.
The reader is cautioned that the calendar year data in this profile reflect actualemployee counts as of the end of calendar years 2006 through 2016. Therefore,these data may not directly correlate with information in theworkforce/compensation section of the County Executive’s Recommended FY17Operating Budget and FY17-22 Public Services Program.
1-1
-
1,000
2,000
3,000
4,000
5,000
6,000
7,000
8,000
9,000
10,000
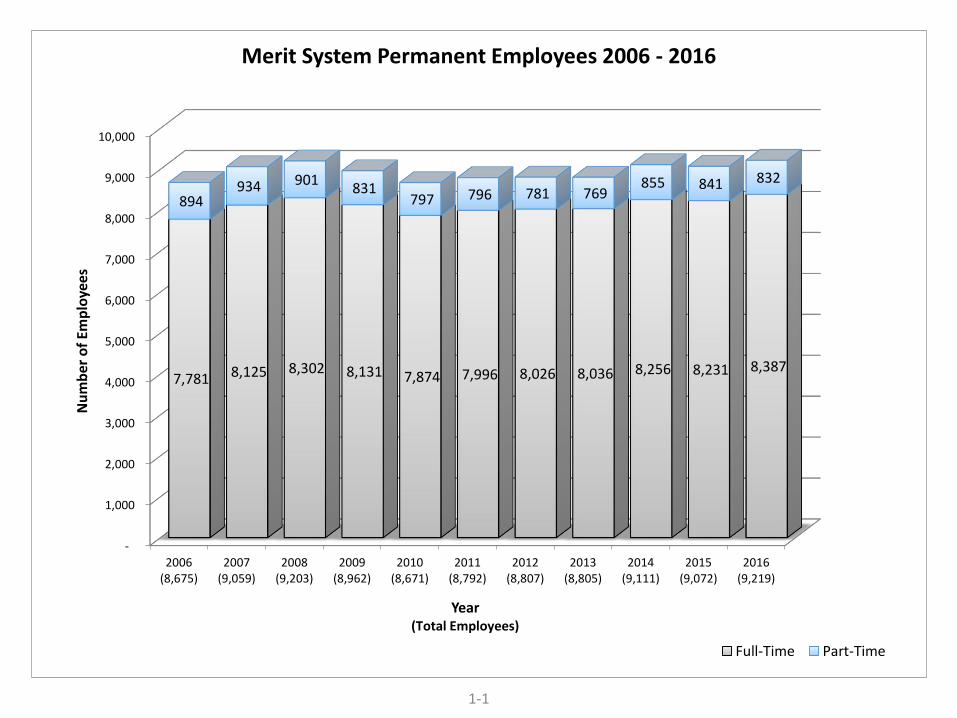
2006(8,675)
2007(9,059)
2008(9,203)
2009(8,962)
2010(8,671)
2011(8,792)
2012(8,807)
2013(8,805)
2014(9,111)
2015(9,072)
2016(9,219)
7,781 8,125 8,302 8,131 7,874 7,996 8,026 8,036 8,256 8,231 8,387
894 934 901
831 797 796 781 769
855 841 832
Nu
mb
er o
f Em
plo
yees
Year(Total Employees)
Merit System Permanent Employees 2006 - 2016
Full-Time Part-Time
1-2
1-3
1-4
1-5
1-6
Grade Number of
Employees
Average
Annual Salary Grade
Number of
Employees
Average
Annual Salary Grade
Number of
Employees
Average
Annual Salary
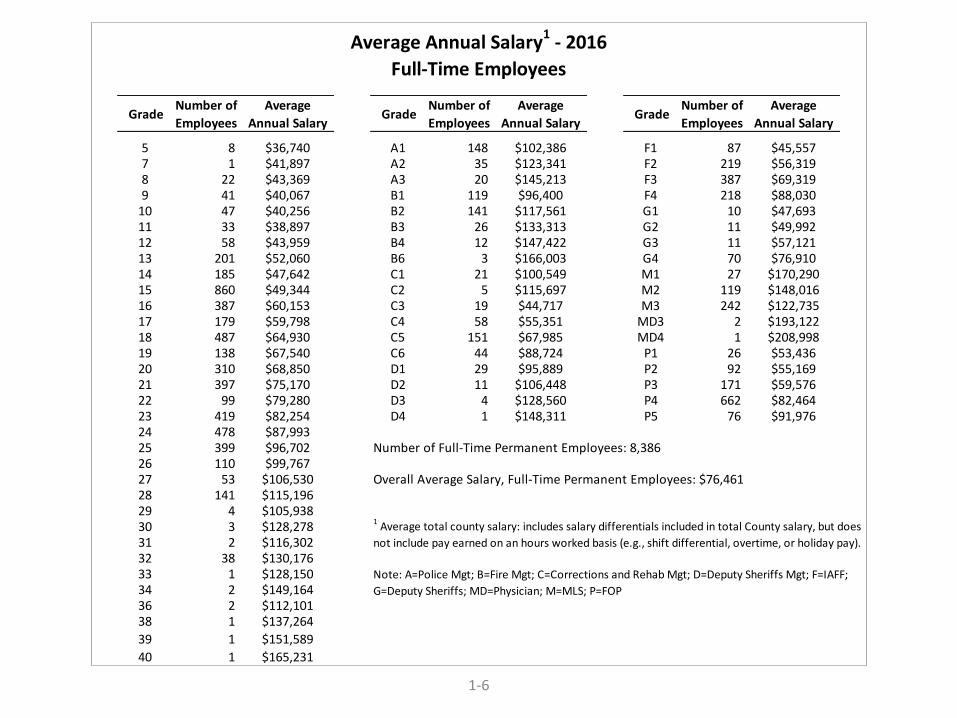
5 8 $36,740 A1 148 $102,386 F1 87 $45,5577 1 $41,897 A2 35 $123,341 F2 219 $56,3198 22 $43,369 A3 20 $145,213 F3 387 $69,3199 41 $40,067 B1 119 $96,400 F4 218 $88,030
10 47 $40,256 B2 141 $117,561 G1 10 $47,69311 33 $38,897 B3 26 $133,313 G2 11 $49,99212 58 $43,959 B4 12 $147,422 G3 11 $57,12113 201 $52,060 B6 3 $166,003 G4 70 $76,91014 185 $47,642 C1 21 $100,549 M1 27 $170,29015 860 $49,344 C2 5 $115,697 M2 119 $148,01616 387 $60,153 C3 19 $44,717 M3 242 $122,73517 179 $59,798 C4 58 $55,351 MD3 2 $193,12218 487 $64,930 C5 151 $67,985 MD4 1 $208,99819 138 $67,540 C6 44 $88,724 P1 26 $53,43620 310 $68,850 D1 29 $95,889 P2 92 $55,16921 397 $75,170 D2 11 $106,448 P3 171 $59,57622 99 $79,280 D3 4 $128,560 P4 662 $82,46423 419 $82,254 D4 1 $148,311 P5 76 $91,97624 478 $87,99325 399 $96,702 Number of Full-Time Permanent Employees: 8,38626 110 $99,76727 53 $106,530 Overall Average Salary, Full-Time Permanent Employees: $76,46128 141 $115,19629 4 $105,93830 3 $128,27831 2 $116,30232 38 $130,17633 1 $128,15034 2 $149,16436 2 $112,10138 1 $137,264
39 1 $151,589
40 1 $165,231
Average Annual Salary1 - 2016
Full-Time Employees
1 Average total county salary: includes salary differentials included in total County salary, but does
not include pay earned on an hours worked basis (e.g., shift differential, overtime, or holiday pay).
Note: A=Police Mgt; B=Fire Mgt; C=Corrections and Rehab Mgt; D=Deputy Sheriffs Mgt; F=IAFF;
G=Deputy Sheriffs; MD=Physician; M=MLS; P=FOP
1-7
1-8
1-9
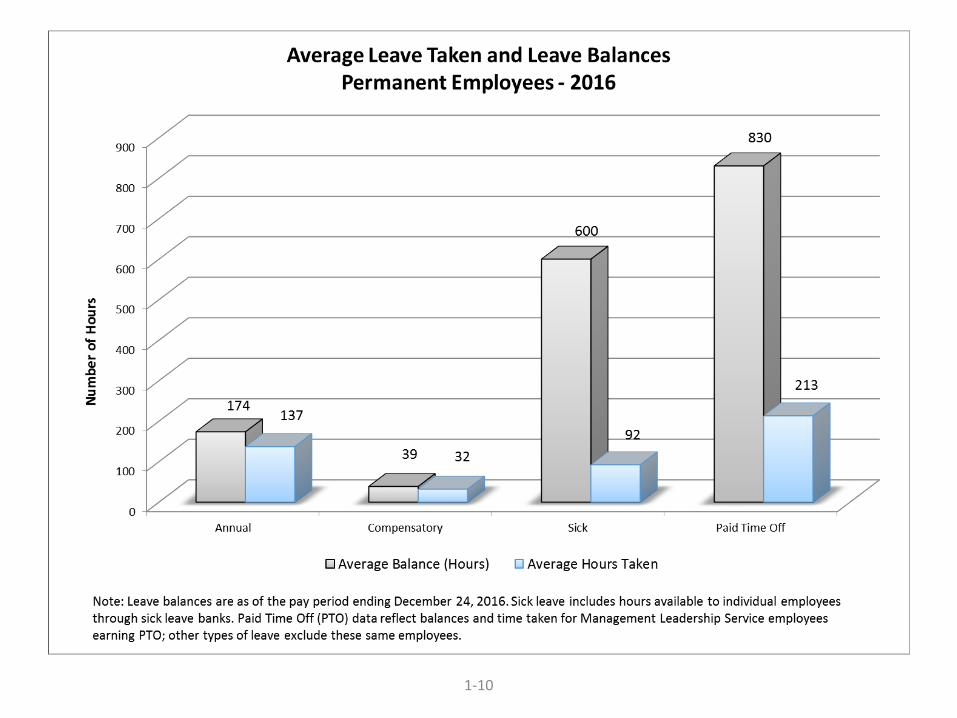
1-10
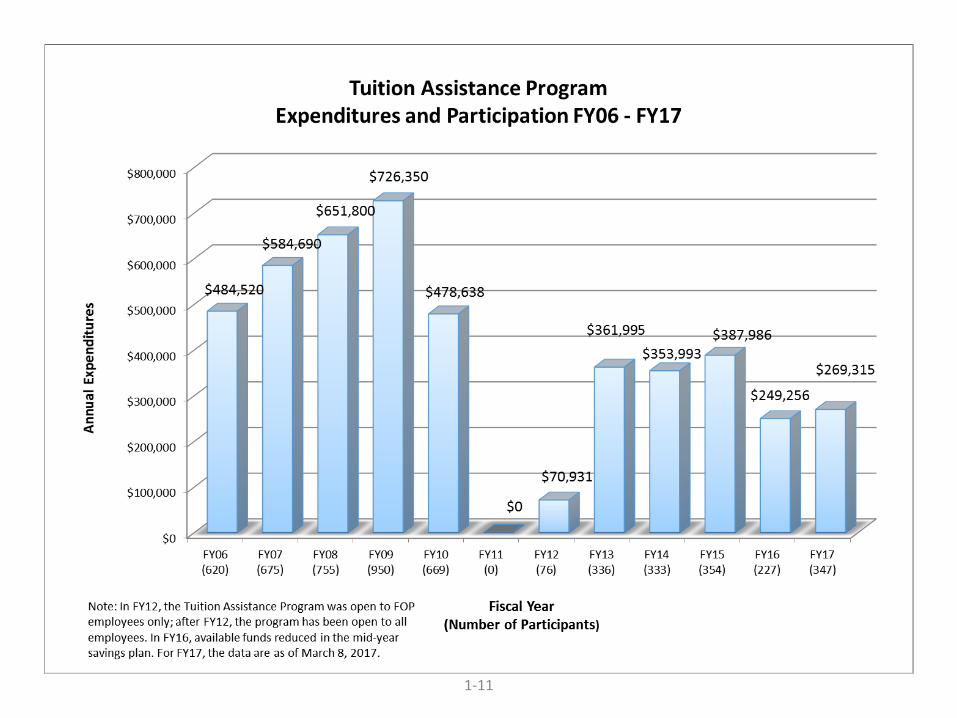
1-11
1-12
1-13
1-14
1-15
1-16
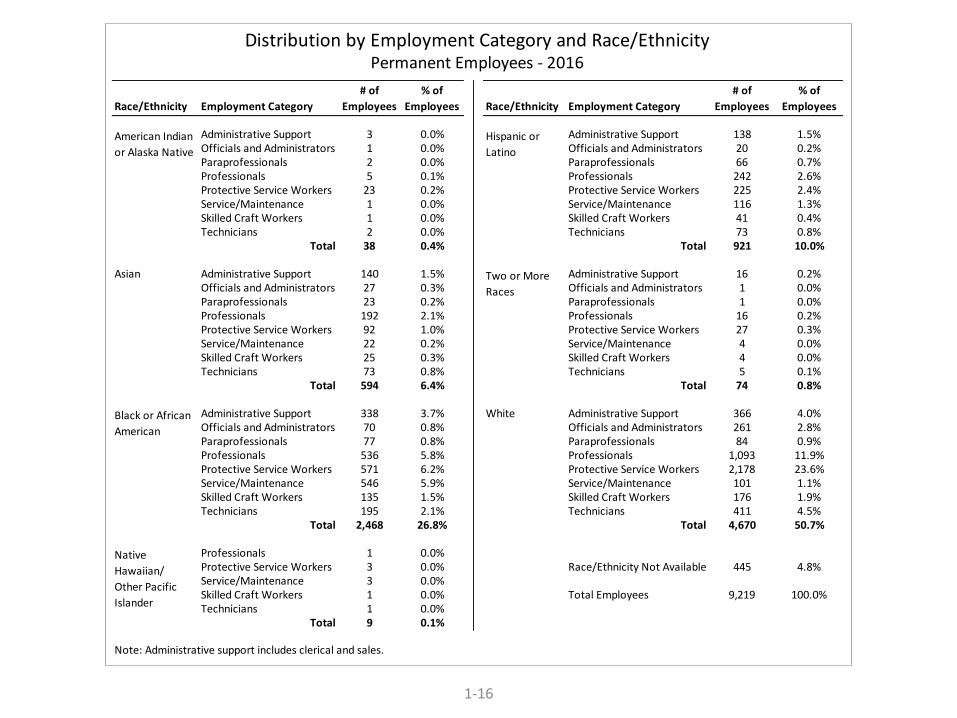
Distribution by Employment Category and Race/EthnicityPermanent Employees - 2016
Race/Ethnicity Employment Category
# of
Employees
% of
Employees Race/Ethnicity Employment Category
# of
Employees
% of
Employees
Administrative Support 3 0.0% Administrative Support 138 1.5%Officials and Administrators 1 0.0% Officials and Administrators 20 0.2%Paraprofessionals 2 0.0% Paraprofessionals 66 0.7%Professionals 5 0.1% Professionals 242 2.6%Protective Service Workers 23 0.2% Protective Service Workers 225 2.4%Service/Maintenance 1 0.0% Service/Maintenance 116 1.3%Skilled Craft Workers 1 0.0% Skilled Craft Workers 41 0.4%Technicians 2 0.0% Technicians 73 0.8%
Total 38 0.4% Total 921 10.0%
Asian Administrative Support 140 1.5% Administrative Support 16 0.2%Officials and Administrators 27 0.3% Officials and Administrators 1 0.0%Paraprofessionals 23 0.2% Paraprofessionals 1 0.0%Professionals 192 2.1% Professionals 16 0.2%Protective Service Workers 92 1.0% Protective Service Workers 27 0.3%Service/Maintenance 22 0.2% Service/Maintenance 4 0.0%Skilled Craft Workers 25 0.3% Skilled Craft Workers 4 0.0%Technicians 73 0.8% Technicians 5 0.1%
Total 594 6.4% Total 74 0.8%
Administrative Support 338 3.7% White Administrative Support 366 4.0%Officials and Administrators 70 0.8% Officials and Administrators 261 2.8%Paraprofessionals 77 0.8% Paraprofessionals 84 0.9%Professionals 536 5.8% Professionals 1,093 11.9%Protective Service Workers 571 6.2% Protective Service Workers 2,178 23.6%Service/Maintenance 546 5.9% Service/Maintenance 101 1.1%Skilled Craft Workers 135 1.5% Skilled Craft Workers 176 1.9%Technicians 195 2.1% Technicians 411 4.5%
Total 2,468 26.8% Total 4,670 50.7%
Professionals 1 0.0%Protective Service Workers 3 0.0% Race/Ethnicity Not Available 445 4.8%Service/Maintenance 3 0.0%Skilled Craft Workers 1 0.0% Total Employees 9,219 100.0%Technicians 1 0.0%
Total 9 0.1%
Note: Administrative support includes clerical and sales.
American Indian
or Alaska Native
Hispanic or
Latino
Two or More
Races
Black or African
American
Native
Hawaiian/
Other Pacific
Islander
1-17
1-18
1-19
1-20
State State
County/City # % # % # % County/City # % # % # %
District of Columbia 173 1.9% 49 1.7% 222 1.8% Virginia 192 2.1% 15 0.5% 207 1.7%
Maryland 8,472 91.9% 2,813 97.4% 11,285 93.2% Fairfax 56 0.6% 4 0.1% 60 0.5%
Montgomery 5,165 56.0% 2,447 84.8% 7,612 62.9% Loudoun 29 0.3% 2 0.1% 31 0.3%
Frederick 1,156 12.5% 67 2.3% 1,223 10.1% Arlington 20 0.2% 1 0.0% 21 0.2%
Prince Georges 779 8.4% 175 6.1% 954 7.9% Alexandria City 19 0.2% 1 0.0% 20 0.2%
Howard 259 2.8% 54 1.9% 313 2.6% Prince William 17 0.2% 2 0.1% 19 0.2%
Washington 251 2.7% 7 0.2% 258 2.1% Fairfax City 11 0.1% 1 0.0% 12 0.1%
Carroll 242 2.6% 13 0.5% 255 2.1% Other 40 0.4% 4 0.1% 44 0.4%
Anne Arundel 193 2.1% 21 0.7% 214 1.8% West Virginia 126 1.4% 5 0.2% 131 1.1%
Baltimore 136 1.5% 10 0.3% 146 1.2% Jefferson 60 0.7% 1 0.0% 61 0.5%
Baltimore City 112 1.2% 7 0.2% 119 1.0% Berkeley 59 0.6% 4 0.1% 63 0.5%
Charles 47 0.5% 5 0.2% 52 0.4% Other 7 0.1% - 0.0% 7 0.1%
Harford 28 0.3% 1 0.0% 29 0.2% Other States 21 0.2% 3 0.1% 24 0.2%
Queen Annes 28 0.3% 1 0.0% 29 0.2%
Calvert 27 0.3% - 0.0% 27 0.2% Grand Total 9,219 100.0% 2,887 100.0% 12,106 100.0%
St Marys 13 0.1% - 0.0% 13 0.1%
Other 36 0.4% 5 0.2% 41 0.3%
Pennsylvania 235 2.5% 2 0.1% 237 2.0%
Adams 64 0.7% 2 0.1% 66 0.5%
Franklin 56 0.6% - 0.0% 56 0.5%
York 42 0.5% - 0.0% 42 0.3%
Lancaster 18 0.2% - 0.0% 18 0.1%
Cumberland 14 0.2% - 0.0% 14 0.1%
Other 41 0.4% - 0.0% 41 0.3%
1 As of December 31, 2016
Residence of Montgomery County Employees1
Permanent
Temporary
and Seasonal Total Permanent
Temporary
and Seasonal Total
TURNOVER ANALYSIS
2-1
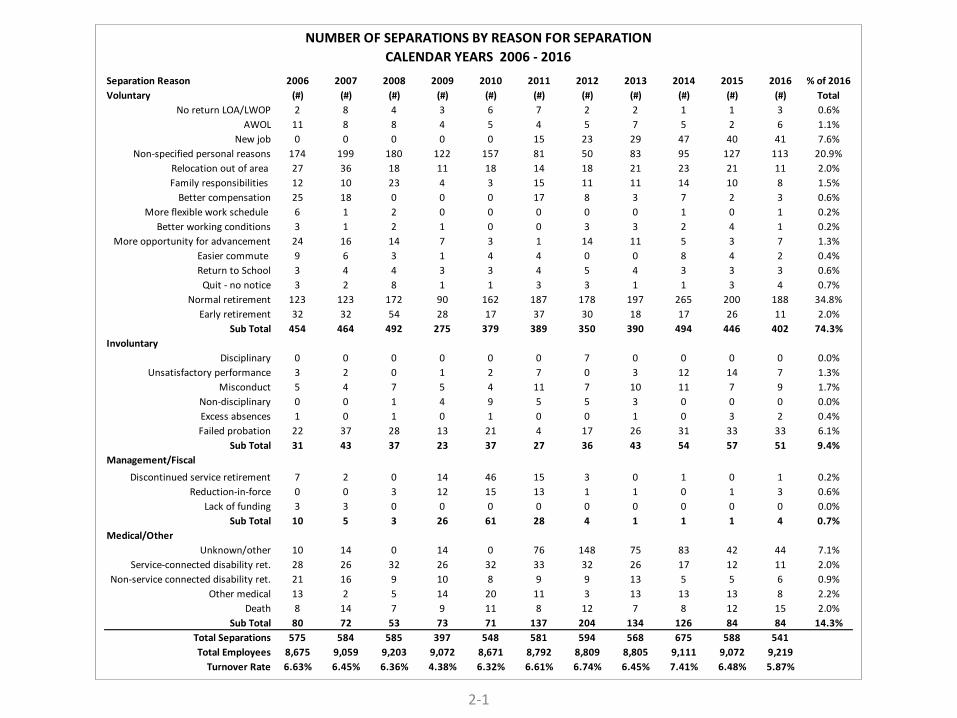
Separation Reason 2006 2007 2008 2009 2010 2011 2012 2013 2014 2015 2016 % of 2016
Voluntary (#) (#) (#) (#) (#) (#) (#) (#) (#) (#) (#) Total
No return LOA/LWOP 2 8 4 3 6 7 2 2 1 1 3 0.6%
AWOL 11 8 8 4 5 4 5 7 5 2 6 1.1%
New job 0 0 0 0 0 15 23 29 47 40 41 7.6%
Non-specified personal reasons 174 199 180 122 157 81 50 83 95 127 113 20.9%
Relocation out of area 27 36 18 11 18 14 18 21 23 21 11 2.0%
Family responsibilities 12 10 23 4 3 15 11 11 14 10 8 1.5%
Better compensation 25 18 0 0 0 17 8 3 7 2 3 0.6%
More flexible work schedule 6 1 2 0 0 0 0 0 1 0 1 0.2%
Better working conditions 3 1 2 1 0 0 3 3 2 4 1 0.2%
More opportunity for advancement 24 16 14 7 3 1 14 11 5 3 7 1.3%
Easier commute 9 6 3 1 4 4 0 0 8 4 2 0.4%
Return to School 3 4 4 3 3 4 5 4 3 3 3 0.6%
Quit - no notice 3 2 8 1 1 3 3 1 1 3 4 0.7%
Normal retirement 123 123 172 90 162 187 178 197 265 200 188 34.8%
Early retirement 32 32 54 28 17 37 30 18 17 26 11 2.0%
Sub Total 454 464 492 275 379 389 350 390 494 446 402 74.3%
Involuntary
Disciplinary 0 0 0 0 0 0 7 0 0 0 0 0.0%
Unsatisfactory performance 3 2 0 1 2 7 0 3 12 14 7 1.3%
Misconduct 5 4 7 5 4 11 7 10 11 7 9 1.7%
Non-disciplinary 0 0 1 4 9 5 5 3 0 0 0 0.0%
Excess absences 1 0 1 0 1 0 0 1 0 3 2 0.4%
Failed probation 22 37 28 13 21 4 17 26 31 33 33 6.1%
Sub Total 31 43 37 23 37 27 36 43 54 57 51 9.4%
Management/Fiscal
Discontinued service retirement 7 2 0 14 46 15 3 0 1 0 1 0.2%
Reduction-in-force 0 0 3 12 15 13 1 1 0 1 3 0.6%
Lack of funding 3 3 0 0 0 0 0 0 0 0 0 0.0%
Sub Total 10 5 3 26 61 28 4 1 1 1 4 0.7%
Medical/Other
Unknown/other 10 14 0 14 0 76 148 75 83 42 44 7.1%
Service-connected disability ret. 28 26 32 26 32 33 32 26 17 12 11 2.0%
Non-service connected disability ret. 21 16 9 10 8 9 9 13 5 5 6 0.9%
Other medical 13 2 5 14 20 11 3 13 13 13 8 2.2%
Death 8 14 7 9 11 8 12 7 8 12 15 2.0%
Sub Total 80 72 53 73 71 137 204 134 126 84 84 14.3%
Total Separations 575 584 585 397 548 581 594 568 675 588 541
Total Employees 8,675 9,059 9,203 9,072 8,671 8,792 8,809 8,805 9,111 9,072 9,219
Turnover Rate 6.63% 6.45% 6.36% 4.38% 6.32% 6.61% 6.74% 6.45% 7.41% 6.48% 5.87%
NUMBER OF SEPARATIONS BY REASON FOR SEPARATION
CALENDAR YEARS 2006 - 2016
2-2
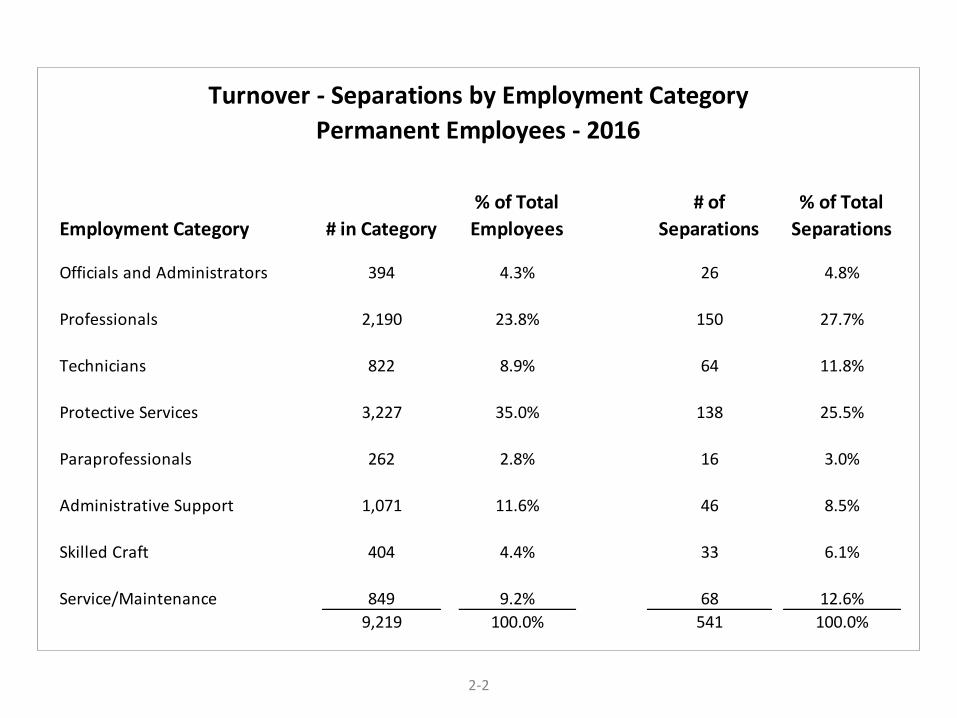
Employment Category # in Category
% of Total
Employees
# of
Separations
% of Total
Separations
Officials and Administrators 394 4.3% 26 4.8%
Professionals 2,190 23.8% 150 27.7%
Technicians 822 8.9% 64 11.8%
Protective Services 3,227 35.0% 138 25.5%
Paraprofessionals 262 2.8% 16 3.0%
Administrative Support 1,071 11.6% 46 8.5%
Skilled Craft 404 4.4% 33 6.1%
Service/Maintenance 849 9.2% 68 12.6%
9,219 100.0% 541 100.0%
Turnover - Separations by Employment Category
Permanent Employees - 2016
2-3
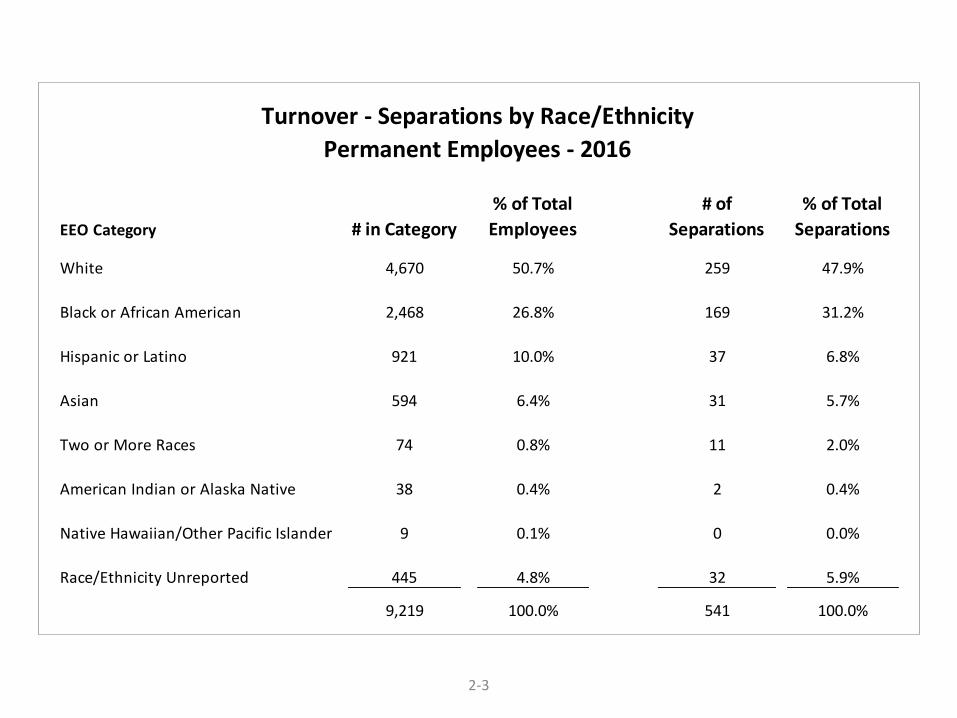
Turnover - Separations by Race/Ethnicity
Permanent Employees - 2016
EEO Category # in Category
% of Total
Employees
# of
Separations
% of Total
Separations
White 4,670 50.7% 259 47.9%
Black or African American 2,468 26.8% 169 31.2%
Hispanic or Latino 921 10.0% 37 6.8%
Asian 594 6.4% 31 5.7%
Two or More Races 74 0.8% 11 2.0%
American Indian or Alaska Native 38 0.4% 2 0.4%
Native Hawaiian/Other Pacific Islander 9 0.1% 0 0.0%
Race/Ethnicity Unreported 445 4.8% 32 5.9%
9,219 100.0% 541 100.0%

WAGE AND SALARYCOMPARABILITY
3-1
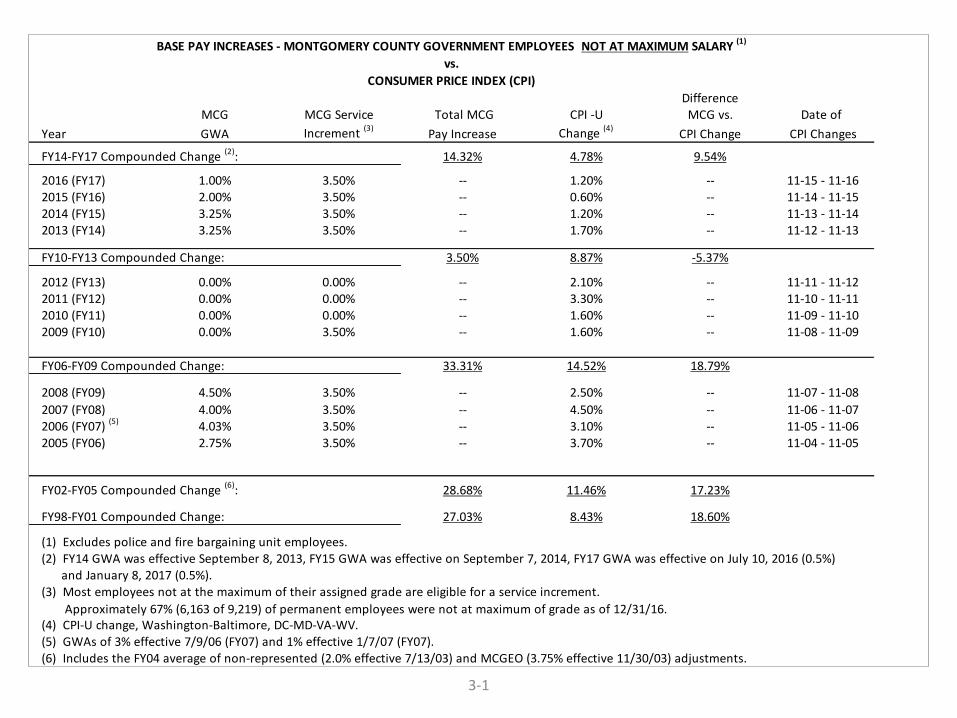
Difference MCG MCG Service Total MCG CPI -U MCG vs. Date of
Year GWA Increment (3) Pay Increase Change (4)
CPI Change CPI Changes
FY14-FY17 Compounded Change (2): 14.32% 4.78% 9.54%
2016 (FY17) 1.00% 3.50% -- 1.20% -- 11-15 - 11-162015 (FY16) 2.00% 3.50% -- 0.60% -- 11-14 - 11-152014 (FY15) 3.25% 3.50% -- 1.20% -- 11-13 - 11-142013 (FY14) 3.25% 3.50% -- 1.70% -- 11-12 - 11-13
FY10-FY13 Compounded Change: 3.50% 8.87% -5.37%
2012 (FY13) 0.00% 0.00% -- 2.10% -- 11-11 - 11-122011 (FY12) 0.00% 0.00% -- 3.30% -- 11-10 - 11-112010 (FY11) 0.00% 0.00% -- 1.60% -- 11-09 - 11-102009 (FY10) 0.00% 3.50% -- 1.60% -- 11-08 - 11-09
FY06-FY09 Compounded Change: 33.31% 14.52% 18.79%
2008 (FY09) 4.50% 3.50% -- 2.50% -- 11-07 - 11-08
2007 (FY08) 4.00% 3.50% -- 4.50% -- 11-06 - 11-072006 (FY07) (5) 4.03% 3.50% -- 3.10% -- 11-05 - 11-062005 (FY06) 2.75% 3.50% -- 3.70% -- 11-04 - 11-05
FY02-FY05 Compounded Change (6)
: 28.68% 11.46% 17.23%
FY98-FY01 Compounded Change: 27.03% 8.43% 18.60%
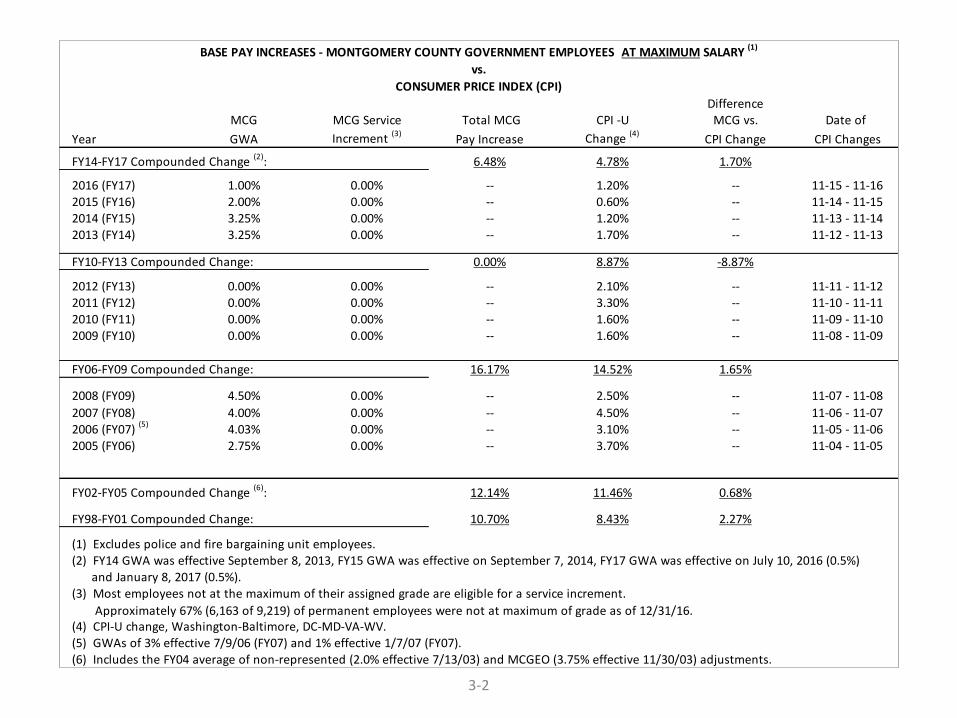
(1) Excludes police and fire bargaining unit employees. (2) FY14 GWA was effective September 8, 2013, FY15 GWA was effective on September 7, 2014, FY17 GWA was effective on July 10, 2016 (0.5%) and January 8, 2017 (0.5%).(3) Most employees not at the maximum of their assigned grade are eligible for a service increment.
(4) CPI-U change, Washington-Baltimore, DC-MD-VA-WV. (5) GWAs of 3% effective 7/9/06 (FY07) and 1% effective 1/7/07 (FY07).(6) Includes the FY04 average of non-represented (2.0% effective 7/13/03) and MCGEO (3.75% effective 11/30/03) adjustments.
BASE PAY INCREASES - MONTGOMERY COUNTY GOVERNMENT EMPLOYEES NOT AT MAXIMUM SALARY (1)
vs.
CONSUMER PRICE INDEX (CPI)
Approximately 67% (6,163 of 9,219) of permanent employees were not at maximum of grade as of 12/31/16.
3-2
Difference MCG MCG Service Total MCG CPI -U MCG vs. Date of
Year GWA Increment (3) Pay Increase Change (4)
CPI Change CPI Changes
FY14-FY17 Compounded Change (2): 6.48% 4.78% 1.70%
2016 (FY17) 1.00% 0.00% -- 1.20% -- 11-15 - 11-162015 (FY16) 2.00% 0.00% -- 0.60% -- 11-14 - 11-152014 (FY15) 3.25% 0.00% -- 1.20% -- 11-13 - 11-142013 (FY14) 3.25% 0.00% -- 1.70% -- 11-12 - 11-13
FY10-FY13 Compounded Change: 0.00% 8.87% -8.87%
2012 (FY13) 0.00% 0.00% -- 2.10% -- 11-11 - 11-122011 (FY12) 0.00% 0.00% -- 3.30% -- 11-10 - 11-112010 (FY11) 0.00% 0.00% -- 1.60% -- 11-09 - 11-102009 (FY10) 0.00% 0.00% -- 1.60% -- 11-08 - 11-09
FY06-FY09 Compounded Change: 16.17% 14.52% 1.65%
2008 (FY09) 4.50% 0.00% -- 2.50% -- 11-07 - 11-08
2007 (FY08) 4.00% 0.00% -- 4.50% -- 11-06 - 11-072006 (FY07) (5) 4.03% 0.00% -- 3.10% -- 11-05 - 11-062005 (FY06) 2.75% 0.00% -- 3.70% -- 11-04 - 11-05
FY02-FY05 Compounded Change (6)
: 12.14% 11.46% 0.68%
FY98-FY01 Compounded Change: 10.70% 8.43% 2.27%
(1) Excludes police and fire bargaining unit employees. (2) FY14 GWA was effective September 8, 2013, FY15 GWA was effective on September 7, 2014, FY17 GWA was effective on July 10, 2016 (0.5%) and January 8, 2017 (0.5%).(3) Most employees not at the maximum of their assigned grade are eligible for a service increment.
(4) CPI-U change, Washington-Baltimore, DC-MD-VA-WV. (5) GWAs of 3% effective 7/9/06 (FY07) and 1% effective 1/7/07 (FY07).(6) Includes the FY04 average of non-represented (2.0% effective 7/13/03) and MCGEO (3.75% effective 11/30/03) adjustments.
BASE PAY INCREASES - MONTGOMERY COUNTY GOVERNMENT EMPLOYEES AT MAXIMUM SALARY (1)
vs.
CONSUMER PRICE INDEX (CPI)
Approximately 67% (6,163 of 9,219) of permanent employees were not at maximum of grade as of 12/31/16.
3-3
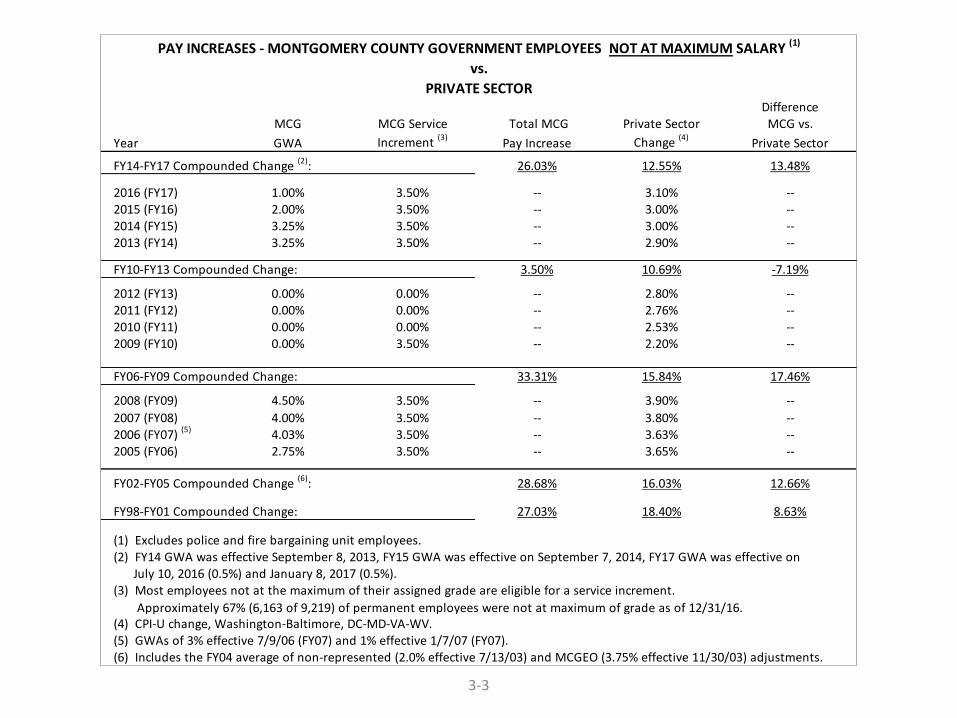
PAY INCREASES - MONTGOMERY COUNTY GOVERNMENT EMPLOYEES NOT AT MAXIMUM SALARY (1)
vs.
PRIVATE SECTOR Difference
MCG MCG Service Total MCG Private Sector MCG vs.
Year GWA Increment (3) Pay Increase Change (4)
Private Sector
FY14-FY17 Compounded Change (2): 26.03% 12.55% 13.48%
2016 (FY17) 1.00% 3.50% -- 3.10% --2015 (FY16) 2.00% 3.50% -- 3.00% --2014 (FY15) 3.25% 3.50% -- 3.00% --2013 (FY14) 3.25% 3.50% -- 2.90% --
FY10-FY13 Compounded Change: 3.50% 10.69% -7.19%
2012 (FY13) 0.00% 0.00% -- 2.80% --2011 (FY12) 0.00% 0.00% -- 2.76% --2010 (FY11) 0.00% 0.00% -- 2.53% --2009 (FY10) 0.00% 3.50% -- 2.20% -- FY06-FY09 Compounded Change: 33.31% 15.84% 17.46%
2008 (FY09) 4.50% 3.50% -- 3.90% --
2007 (FY08) 4.00% 3.50% -- 3.80% --2006 (FY07) (5) 4.03% 3.50% -- 3.63% --2005 (FY06) 2.75% 3.50% -- 3.65% --
FY02-FY05 Compounded Change (6): 28.68% 16.03% 12.66%
FY98-FY01 Compounded Change: 27.03% 18.40% 8.63%
(1) Excludes police and fire bargaining unit employees. (2) FY14 GWA was effective September 8, 2013, FY15 GWA was effective on September 7, 2014, FY17 GWA was effective on July 10, 2016 (0.5%) and January 8, 2017 (0.5%).(3) Most employees not at the maximum of their assigned grade are eligible for a service increment.
(4) CPI-U change, Washington-Baltimore, DC-MD-VA-WV. (5) GWAs of 3% effective 7/9/06 (FY07) and 1% effective 1/7/07 (FY07).(6) Includes the FY04 average of non-represented (2.0% effective 7/13/03) and MCGEO (3.75% effective 11/30/03) adjustments.
Approximately 67% (6,163 of 9,219) of permanent employees were not at maximum of grade as of 12/31/16.
3-4
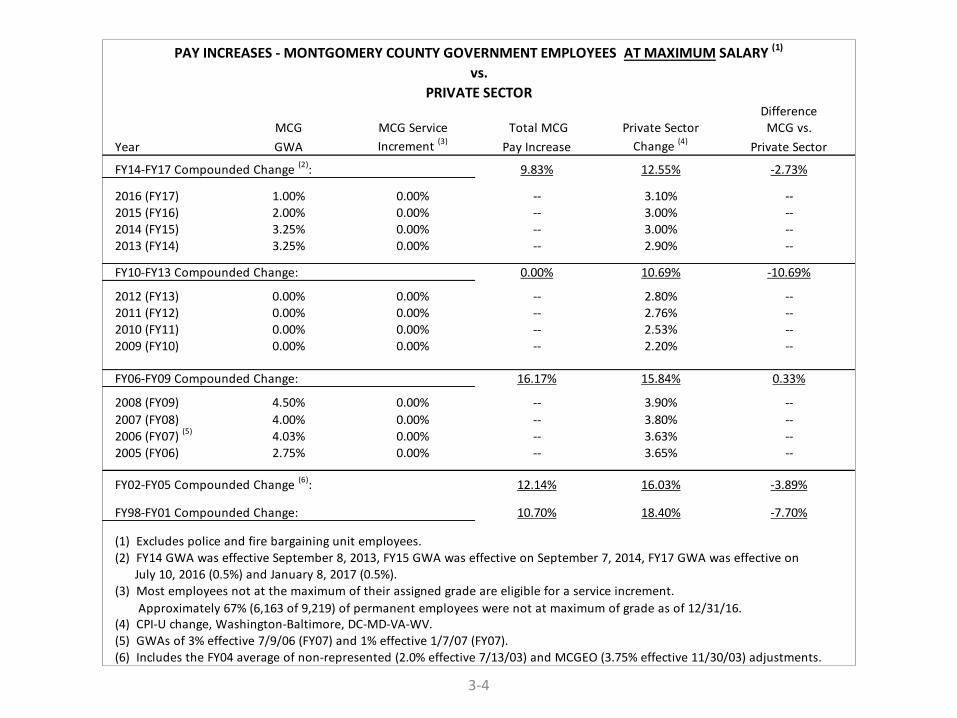
PAY INCREASES - MONTGOMERY COUNTY GOVERNMENT EMPLOYEES AT MAXIMUM SALARY (1)
vs.
PRIVATE SECTOR Difference
MCG MCG Service Total MCG Private Sector MCG vs.
Year GWA Increment (3) Pay Increase Change (4)
Private Sector
FY14-FY17 Compounded Change (2): 9.83% 12.55% -2.73%
2016 (FY17) 1.00% 0.00% -- 3.10% --2015 (FY16) 2.00% 0.00% -- 3.00% --2014 (FY15) 3.25% 0.00% -- 3.00% --2013 (FY14) 3.25% 0.00% -- 2.90% --
FY10-FY13 Compounded Change: 0.00% 10.69% -10.69%
2012 (FY13) 0.00% 0.00% -- 2.80% --2011 (FY12) 0.00% 0.00% -- 2.76% --2010 (FY11) 0.00% 0.00% -- 2.53% --2009 (FY10) 0.00% 0.00% -- 2.20% -- FY06-FY09 Compounded Change: 16.17% 15.84% 0.33%
2008 (FY09) 4.50% 0.00% -- 3.90% --
2007 (FY08) 4.00% 0.00% -- 3.80% --2006 (FY07) (5) 4.03% 0.00% -- 3.63% --2005 (FY06) 2.75% 0.00% -- 3.65% --
FY02-FY05 Compounded Change (6): 12.14% 16.03% -3.89%
FY98-FY01 Compounded Change: 10.70% 18.40% -7.70%
(1) Excludes police and fire bargaining unit employees. (2) FY14 GWA was effective September 8, 2013, FY15 GWA was effective on September 7, 2014, FY17 GWA was effective on July 10, 2016 (0.5%) and January 8, 2017 (0.5%).(3) Most employees not at the maximum of their assigned grade are eligible for a service increment.
(4) CPI-U change, Washington-Baltimore, DC-MD-VA-WV. (5) GWAs of 3% effective 7/9/06 (FY07) and 1% effective 1/7/07 (FY07).(6) Includes the FY04 average of non-represented (2.0% effective 7/13/03) and MCGEO (3.75% effective 11/30/03) adjustments.
Approximately 67% (6,163 of 9,219) of permanent employees were not at maximum of grade as of 12/31/16.
3-5
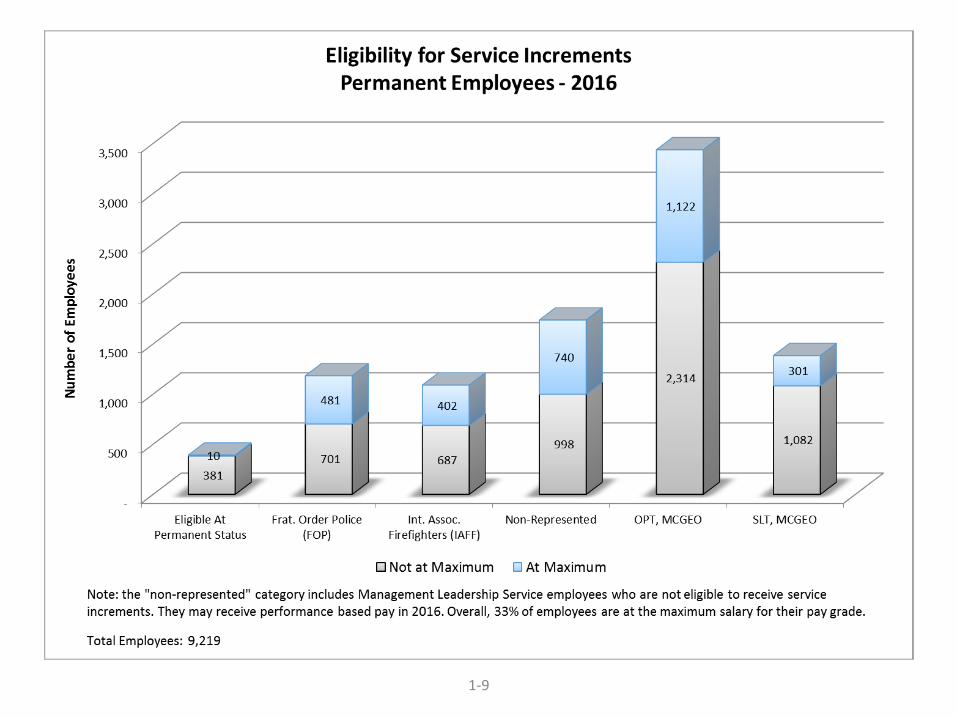
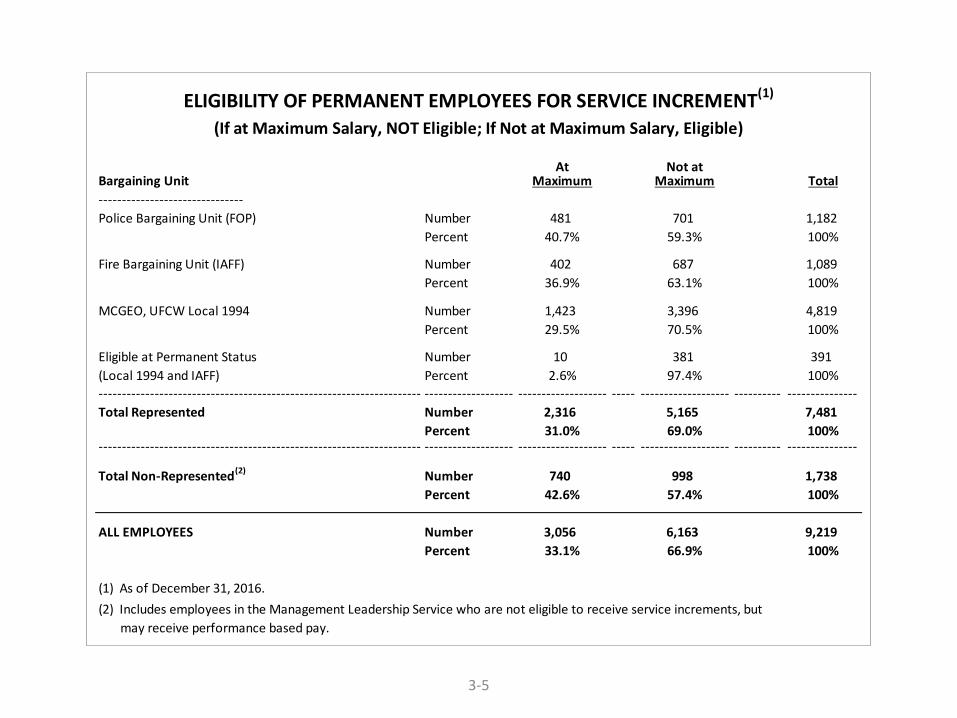
At Not atBargaining Unit Maximum Maximum Total
-------------------------------
Police Bargaining Unit (FOP) Number 481 701 1,182
Percent 40.7% 59.3% 100%
Fire Bargaining Unit (IAFF) Number 402 687 1,089
Percent 36.9% 63.1% 100%
MCGEO, UFCW Local 1994 Number 1,423 3,396 4,819
Percent 29.5% 70.5% 100%
Eligible at Permanent Status Number 10 381 391
(Local 1994 and IAFF) Percent 2.6% 97.4% 100%
--------------------------------------------------------------------- ------------------- ------------------- ----- ------------------- ---------- ---------------
Total Represented Number 2,316 5,165 7,481
Percent 31.0% 69.0% 100%--------------------------------------------------------------------- ------------------- ------------------- ----- ------------------- ---------- ---------------
Total Non-Represented(2) Number 740 998 1,738
Percent 42.6% 57.4% 100%
ALL EMPLOYEES Number 3,056 6,163 9,219
Percent 33.1% 66.9% 100%
(1) As of December 31, 2016.
ELIGIBILITY OF PERMANENT EMPLOYEES FOR SERVICE INCREMENT(1)
(If at Maximum Salary, NOT Eligible; If Not at Maximum Salary, Eligible)
(2) Includes employees in the Management Leadership Service who are not eligible to receive service increments, but
may receive performance based pay.
3-6
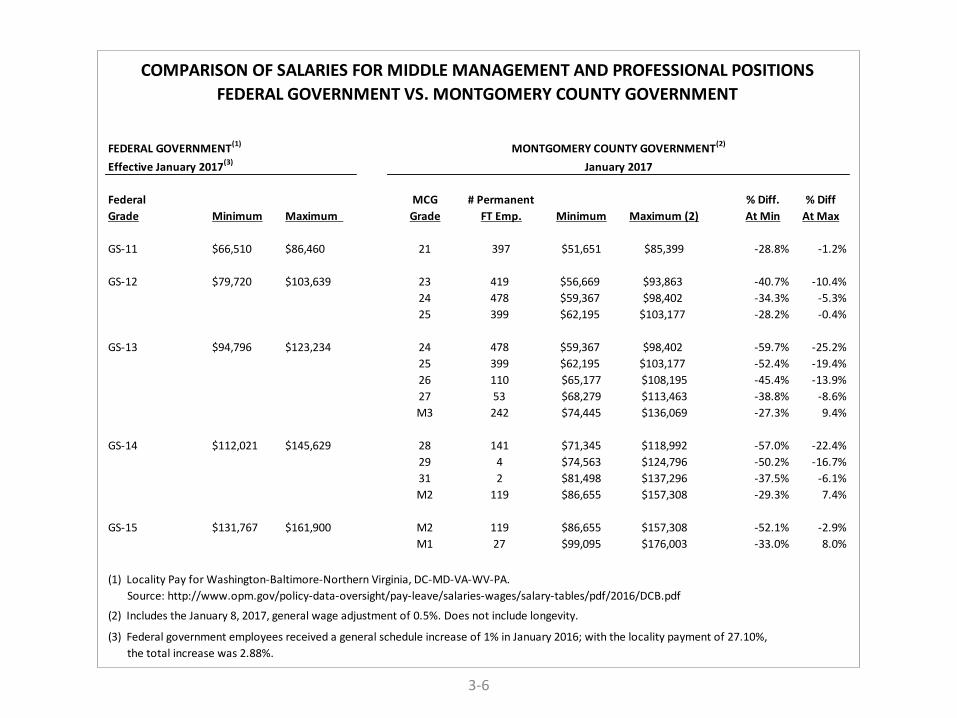
FEDERAL GOVERNMENT(1)
Effective January 2017(3)
Federal MCG # Permanent % Diff. % Diff
Grade Minimum Maximum Grade FT Emp. Minimum Maximum (2) At Min At Max
GS-11 $66,510 $86,460 21 397 $51,651 $85,399 -28.8% -1.2%
GS-12 $79,720 $103,639 23 419 $56,669 $93,863 -40.7% -10.4%
24 478 $59,367 $98,402 -34.3% -5.3%
25 399 $62,195 $103,177 -28.2% -0.4%
GS-13 $94,796 $123,234 24 478 $59,367 $98,402 -59.7% -25.2%
25 399 $62,195 $103,177 -52.4% -19.4%
26 110 $65,177 $108,195 -45.4% -13.9%
27 53 $68,279 $113,463 -38.8% -8.6%
M3 242 $74,445 $136,069 -27.3% 9.4%
GS-14 $112,021 $145,629 28 141 $71,345 $118,992 -57.0% -22.4%
29 4 $74,563 $124,796 -50.2% -16.7%
31 2 $81,498 $137,296 -37.5% -6.1%
M2 119 $86,655 $157,308 -29.3% 7.4%
GS-15 $131,767 $161,900 M2 119 $86,655 $157,308 -52.1% -2.9%
M1 27 $99,095 $176,003 -33.0% 8.0%
(2) Includes the January 8, 2017, general wage adjustment of 0.5%. Does not include longevity.
(3) Federal government employees received a general schedule increase of 1% in January 2016; with the locality payment of 27.10%,
the total increase was 2.88%.
COMPARISON OF SALARIES FOR MIDDLE MANAGEMENT AND PROFESSIONAL POSITIONS
FEDERAL GOVERNMENT VS. MONTGOMERY COUNTY GOVERNMENT
MONTGOMERY COUNTY GOVERNMENT(2)
January 2017
(1) Locality Pay for Washington-Baltimore-Northern Virginia, DC-MD-VA-WV-PA.
Source: http://www.opm.gov/policy-data-oversight/pay-leave/salaries-wages/salary-tables/pdf/2016/DCB.pdf
3-7
% Change % ChangeReq. to % Dif. Req. to % Dif.
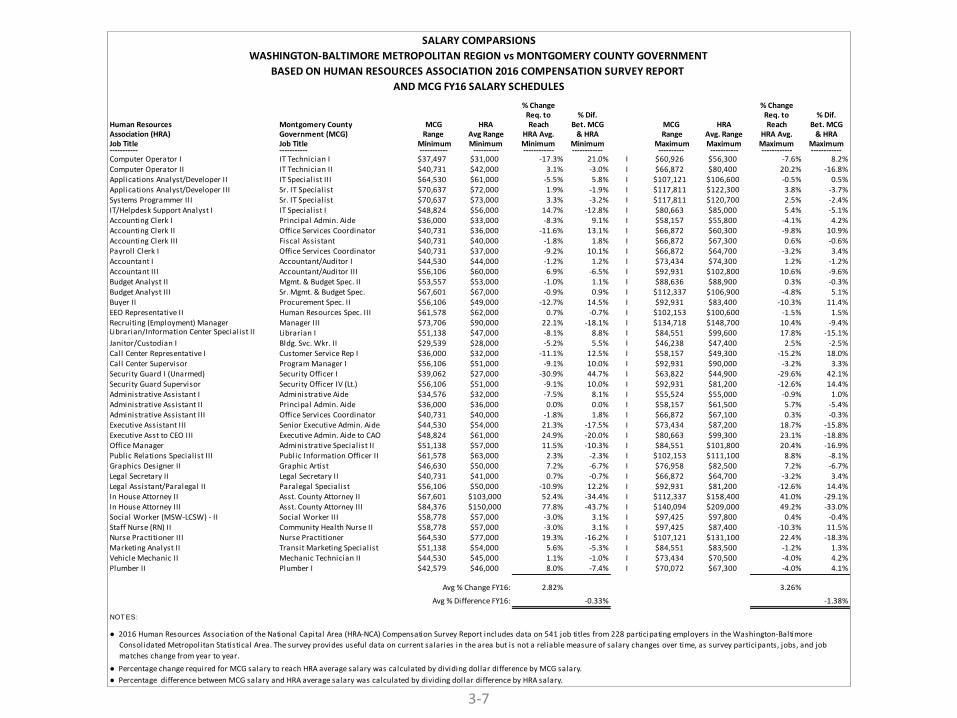
Human Resources Montgomery County MCG HRA Reach Bet. MCG MCG HRA Reach Bet. MCGAssociation (HRA) Government (MCG) Range Avg Range HRA Avg. & HRA Range Avg. Range HRA Avg. & HRAJob Title Job Title Minimum Minimum Minimum Minimum Maximum Maximum Maximum Maximum----------- ----------- ----------- ---------- ------------ ------------ ---------- ----------- ------------ ------------Computer Operator I IT Technician I $37,497 $31,000 -17.3% 21.0% I $60,926 $56,300 -7.6% 8.2%Computer Operator II IT Technician II $40,731 $42,000 3.1% -3.0% I $66,872 $80,400 20.2% -16.8%Applications Analyst/Developer II IT Specialist III $64,530 $61,000 -5.5% 5.8% I $107,121 $106,600 -0.5% 0.5%Applications Analyst/Developer III Sr. IT Specialist $70,637 $72,000 1.9% -1.9% I $117,811 $122,300 3.8% -3.7%Systems Programmer III Sr. IT Specialist $70,637 $73,000 3.3% -3.2% I $117,811 $120,700 2.5% -2.4%IT/Helpdesk Support Analyst I IT Specialist I $48,824 $56,000 14.7% -12.8% I $80,663 $85,000 5.4% -5.1%Accounting Clerk I Principal Admin. Aide $36,000 $33,000 -8.3% 9.1% I $58,157 $55,800 -4.1% 4.2%Accounting Clerk II Office Services Coordinator $40,731 $36,000 -11.6% 13.1% I $66,872 $60,300 -9.8% 10.9%Accounting Clerk III Fiscal Assistant $40,731 $40,000 -1.8% 1.8% I $66,872 $67,300 0.6% -0.6%Payroll Clerk I Office Services Coordinator $40,731 $37,000 -9.2% 10.1% I $66,872 $64,700 -3.2% 3.4%Accountant I Accountant/Auditor I $44,530 $44,000 -1.2% 1.2% I $73,434 $74,300 1.2% -1.2%Accountant III Accountant/Auditor III $56,106 $60,000 6.9% -6.5% I $92,931 $102,800 10.6% -9.6%Budget Analyst II Mgmt. & Budget Spec. II $53,557 $53,000 -1.0% 1.1% I $88,636 $88,900 0.3% -0.3%Budget Analyst III Sr. Mgmt. & Budget Spec. $67,601 $67,000 -0.9% 0.9% I $112,337 $106,900 -4.8% 5.1%Buyer II Procurement Spec. II $56,106 $49,000 -12.7% 14.5% I $92,931 $83,400 -10.3% 11.4%EEO Representative II Human Resources Spec. III $61,578 $62,000 0.7% -0.7% I $102,153 $100,600 -1.5% 1.5%Recruiting (Employment) Manager Manager III $73,706 $90,000 22.1% -18.1% I $134,718 $148,700 10.4% -9.4%Librarian/Information Center Specialist II Librarian I $51,138 $47,000 -8.1% 8.8% I $84,551 $99,600 17.8% -15.1%Janitor/Custodian I Bldg. Svc. Wkr. II $29,539 $28,000 -5.2% 5.5% I $46,238 $47,400 2.5% -2.5%Call Center Representative I Customer Service Rep I $36,000 $32,000 -11.1% 12.5% I $58,157 $49,300 -15.2% 18.0%Call Center Supervisor Program Manager I $56,106 $51,000 -9.1% 10.0% I $92,931 $90,000 -3.2% 3.3%Security Guard I (Unarmed) Security Officer I $39,062 $27,000 -30.9% 44.7% I $63,822 $44,900 -29.6% 42.1%Security Guard Supervisor Security Officer IV (Lt.) $56,106 $51,000 -9.1% 10.0% I $92,931 $81,200 -12.6% 14.4%Administrative Assistant I Administrative Aide $34,576 $32,000 -7.5% 8.1% I $55,524 $55,000 -0.9% 1.0%Administrative Assistant II Principal Admin. Aide $36,000 $36,000 0.0% 0.0% I $58,157 $61,500 5.7% -5.4%Administrative Assistant III Office Services Coordinator $40,731 $40,000 -1.8% 1.8% I $66,872 $67,100 0.3% -0.3%Executive Assistant III Senior Executive Admin. Aide $44,530 $54,000 21.3% -17.5% I $73,434 $87,200 18.7% -15.8%Executive Asst to CEO III Executive Admin. Aide to CAO $48,824 $61,000 24.9% -20.0% I $80,663 $99,300 23.1% -18.8%Office Manager Administrative Specialist II $51,138 $57,000 11.5% -10.3% I $84,551 $101,800 20.4% -16.9%Public Relations Specialist III Public Information Officer II $61,578 $63,000 2.3% -2.3% I $102,153 $111,100 8.8% -8.1%Graphics Designer II Graphic Artist $46,630 $50,000 7.2% -6.7% I $76,958 $82,500 7.2% -6.7%Legal Secretary II Legal Secretary II $40,731 $41,000 0.7% -0.7% I $66,872 $64,700 -3.2% 3.4%Legal Assistant/Paralegal II Paralegal Specialist $56,106 $50,000 -10.9% 12.2% I $92,931 $81,200 -12.6% 14.4%In House Attorney II Asst. County Attorney II $67,601 $103,000 52.4% -34.4% I $112,337 $158,400 41.0% -29.1%In House Attorney III Asst. County Attorney III $84,376 $150,000 77.8% -43.7% I $140,094 $209,000 49.2% -33.0%Social Worker (MSW-LCSW) - II Social Worker III $58,778 $57,000 -3.0% 3.1% I $97,425 $97,800 0.4% -0.4%Staff Nurse (RN) II Community Health Nurse II $58,778 $57,000 -3.0% 3.1% I $97,425 $87,400 -10.3% 11.5%Nurse Practitioner III Nurse Practitioner $64,530 $77,000 19.3% -16.2% I $107,121 $131,100 22.4% -18.3%Marketing Analyst II Transit Marketing Specialist $51,138 $54,000 5.6% -5.3% I $84,551 $83,500 -1.2% 1.3%Vehicle Mechanic II Mechanic Technician II $44,530 $45,000 1.1% -1.0% I $73,434 $70,500 -4.0% 4.2%Plumber II Plumber I $42,579 $46,000 8.0% -7.4% I $70,072 $67,300 -4.0% 4.1%
Avg % Change FY16: 2.82% 3.26%
Avg % Difference FY16: -0.33% -1.38%
NOTES:
● Percentage change required for MCG salary to reach HRA average salary was calculated by dividing dollar difference by MCG salary.
● Percentage difference between MCG salary and HRA average salary was calculated by dividing dollar difference by HRA salary.
● 2016 Human Resources Association of the National Capital Area (HRA-NCA) Compensation Survey Report includes data on 541 job titles from 228 participating employers in the Washington-Baltimore
Consolidated Metropolitan Statistical Area. The survey provides useful data on current salaries in the area but is not a reliable measure of salary changes over time, as survey participants, jobs, and job
matches change from year to year.
SALARY COMPARSIONS
WASHINGTON-BALTIMORE METROPOLITAN REGION vs MONTGOMERY COUNTY GOVERNMENT
BASED ON HUMAN RESOURCES ASSOCIATION 2016 COMPENSATION SURVEY REPORT
AND MCG FY16 SALARY SCHEDULES
3-8
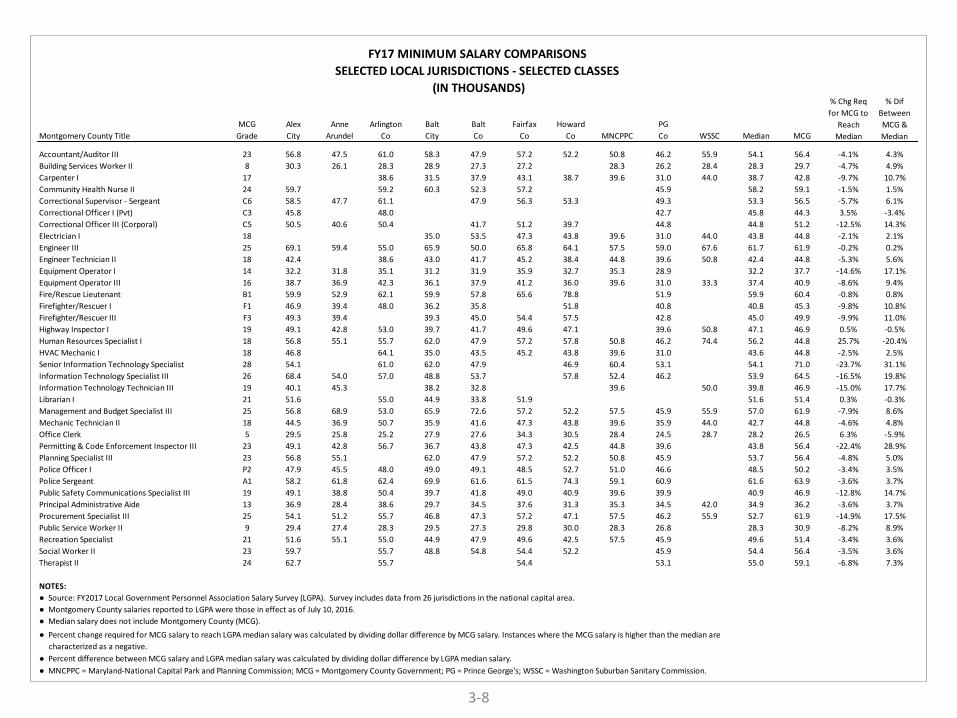
MCG Alex Anne Arlington Balt Balt Fairfax Howard PG
Montgomery County Title Grade City Arundel Co City Co Co Co MNCPPC Co WSSC Median MCG
Accountant/Auditor III 23 56.8 47.5 61.0 58.3 47.9 57.2 52.2 50.8 46.2 55.9 54.1 56.4 -4.1% 4.3%
Building Services Worker II 8 30.3 26.1 28.3 28.9 27.3 27.2 28.3 26.2 28.4 28.3 29.7 -4.7% 4.9%
Carpenter I 17 38.6 31.5 37.9 43.1 38.7 39.6 31.0 44.0 38.7 42.8 -9.7% 10.7%
Community Health Nurse II 24 59.7 59.2 60.3 52.3 57.2 45.9 58.2 59.1 -1.5% 1.5%
Correctional Supervisor - Sergeant C6 58.5 47.7 61.1 47.9 56.3 53.3 49.3 53.3 56.5 -5.7% 6.1%
Correctional Officer I (Pvt) C3 45.8 48.0 42.7 45.8 44.3 3.5% -3.4%
Correctional Officer III (Corporal) C5 50.5 40.6 50.4 41.7 51.2 39.7 44.8 44.8 51.2 -12.5% 14.3%
Electrician I 18 35.0 53.5 47.3 43.8 39.6 31.0 44.0 43.8 44.8 -2.1% 2.1%
Engineer III 25 69.1 59.4 55.0 65.9 50.0 65.8 64.1 57.5 59.0 67.6 61.7 61.9 -0.2% 0.2%
Engineer Technician II 18 42.4 38.6 43.0 41.7 45.2 38.4 44.8 39.6 50.8 42.4 44.8 -5.3% 5.6%
Equipment Operator I 14 32.2 31.8 35.1 31.2 31.9 35.9 32.7 35.3 28.9 32.2 37.7 -14.6% 17.1%
Equipment Operator III 16 38.7 36.9 42.3 36.1 37.9 41.2 36.0 39.6 31.0 33.3 37.4 40.9 -8.6% 9.4%
Fire/Rescue Lieutenant B1 59.9 52.9 62.1 59.9 57.8 65.6 78.8 51.9 59.9 60.4 -0.8% 0.8%
Firefighter/Rescuer I F1 46.9 39.4 48.0 36.2 35.8 51.8 40.8 40.8 45.3 -9.8% 10.8%
Firefighter/Rescuer III F3 49.3 39.4 39.3 45.0 54.4 57.5 42.8 45.0 49.9 -9.9% 11.0%
Highway Inspector I 19 49.1 42.8 53.0 39.7 41.7 49.6 47.1 39.6 50.8 47.1 46.9 0.5% -0.5%
Human Resources Specialist I 18 56.8 55.1 55.7 62.0 47.9 57.2 57.8 50.8 46.2 74.4 56.2 44.8 25.7% -20.4%
HVAC Mechanic I 18 46.8 64.1 35.0 43.5 45.2 43.8 39.6 31.0 43.6 44.8 -2.5% 2.5%
Senior Information Technology Specialist 28 54.1 61.0 62.0 47.9 46.9 60.4 53.1 54.1 71.0 -23.7% 31.1%
Information Technology Specialist III 26 68.4 54.0 57.0 48.8 53.7 57.8 52.4 46.2 53.9 64.5 -16.5% 19.8%
Information Technology Technician III 19 40.1 45.3 38.2 32.8 39.6 50.0 39.8 46.9 -15.0% 17.7%
Librarian I 21 51.6 55.0 44.9 33.8 51.9 51.6 51.4 0.3% -0.3%
Management and Budget Specialist III 25 56.8 68.9 53.0 65.9 72.6 57.2 52.2 57.5 45.9 55.9 57.0 61.9 -7.9% 8.6%
Mechanic Technician II 18 44.5 36.9 50.7 35.9 41.6 47.3 43.8 39.6 35.9 44.0 42.7 44.8 -4.6% 4.8%
Office Clerk 5 29.5 25.8 25.2 27.9 27.6 34.3 30.5 28.4 24.5 28.7 28.2 26.5 6.3% -5.9%
Permitting & Code Enforcement Inspector III 23 49.1 42.8 56.7 36.7 43.8 47.3 42.5 44.8 39.6 43.8 56.4 -22.4% 28.9%
Planning Specialist III 23 56.8 55.1 62.0 47.9 57.2 52.2 50.8 45.9 53.7 56.4 -4.8% 5.0%
Police Officer I P2 47.9 45.5 48.0 49.0 49.1 48.5 52.7 51.0 46.6 48.5 50.2 -3.4% 3.5%
Police Sergeant A1 58.2 61.8 62.4 69.9 61.6 61.5 74.3 59.1 60.9 61.6 63.9 -3.6% 3.7%
Public Safety Communications Specialist III 19 49.1 38.8 50.4 39.7 41.8 49.0 40.9 39.6 39.9 40.9 46.9 -12.8% 14.7%
Principal Administrative Aide 13 36.9 28.4 38.6 29.7 34.5 37.6 31.3 35.3 34.5 42.0 34.9 36.2 -3.6% 3.7%
Procurement Specialist III 25 54.1 51.2 55.7 46.8 47.3 57.2 47.1 57.5 46.2 55.9 52.7 61.9 -14.9% 17.5%
Public Service Worker II 9 29.4 27.4 28.3 29.5 27.3 29.8 30.0 28.3 26.8 28.3 30.9 -8.2% 8.9%
Recreation Specialist 21 51.6 55.1 55.0 44.9 47.9 49.6 42.5 57.5 45.9 49.6 51.4 -3.4% 3.6%
Social Worker II 23 59.7 55.7 48.8 54.8 54.4 52.2 45.9 54.4 56.4 -3.5% 3.6%
Therapist II 24 62.7 55.7 54.4 53.1 55.0 59.1 -6.8% 7.3%
NOTES:
% Chg Req
for MCG to
Reach
Median
● MNCPPC = Maryland-National Capital Park and Planning Commission; MCG = Montgomery County Government; PG = Prince George's; WSSC = Washington Suburban Sanitary Commission.
SELECTED LOCAL JURISDICTIONS - SELECTED CLASSES
(IN THOUSANDS)
FY17 MINIMUM SALARY COMPARISONS
● Percent change required for MCG salary to reach LGPA median salary was calculated by dividing dollar difference by MCG salary. Instances where the MCG salary is higher than the median are
characterized as a negative.
● Percent difference between MCG salary and LGPA median salary was calculated by dividing dollar difference by LGPA median salary.
● Source: FY2017 Local Government Personnel Association Salary Survey (LGPA). Survey includes data from 26 jurisdictions in the national capital area.
● Montgomery County salaries reported to LGPA were those in effect as of July 10, 2016.
● Median salary does not include Montgomery County (MCG).
% Dif
Between
MCG &
Median
3-9
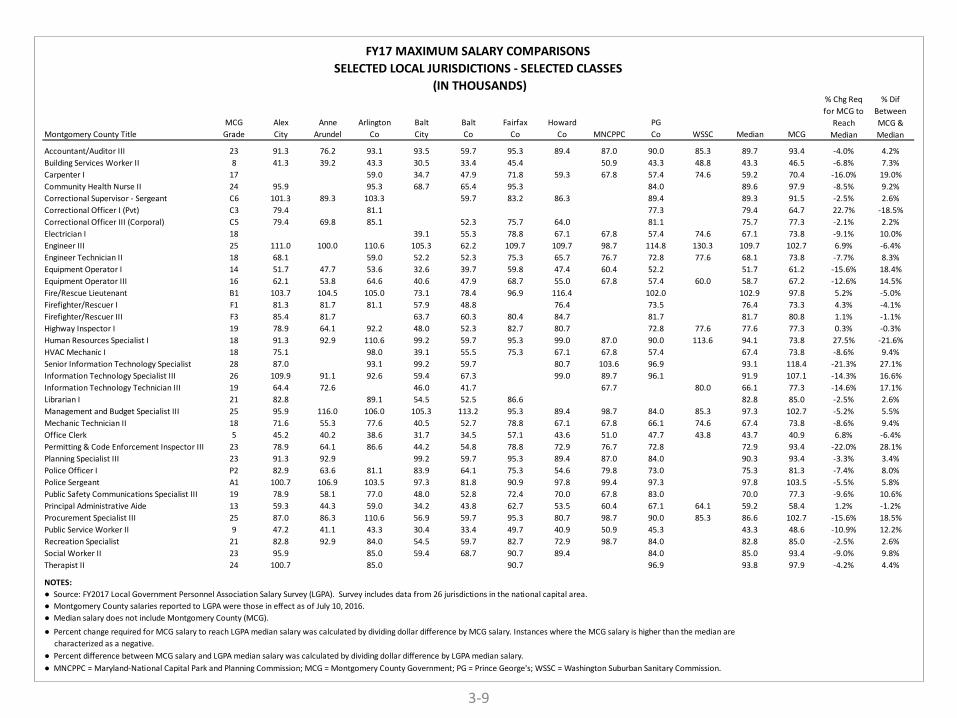
MCG Alex Anne Arlington Balt Balt Fairfax Howard PG
Montgomery County Title Grade City Arundel Co City Co Co Co MNCPPC Co WSSC Median MCG
Accountant/Auditor III 23 91.3 76.2 93.1 93.5 59.7 95.3 89.4 87.0 90.0 85.3 89.7 93.4 -4.0% 4.2%
Building Services Worker II 8 41.3 39.2 43.3 30.5 33.4 45.4 50.9 43.3 48.8 43.3 46.5 -6.8% 7.3%
Carpenter I 17 59.0 34.7 47.9 71.8 59.3 67.8 57.4 74.6 59.2 70.4 -16.0% 19.0%
Community Health Nurse II 24 95.9 95.3 68.7 65.4 95.3 84.0 89.6 97.9 -8.5% 9.2%
Correctional Supervisor - Sergeant C6 101.3 89.3 103.3 59.7 83.2 86.3 89.4 89.3 91.5 -2.5% 2.6%
Correctional Officer I (Pvt) C3 79.4 81.1 77.3 79.4 64.7 22.7% -18.5%
Correctional Officer III (Corporal) C5 79.4 69.8 85.1 52.3 75.7 64.0 81.1 75.7 77.3 -2.1% 2.2%
Electrician I 18 39.1 55.3 78.8 67.1 67.8 57.4 74.6 67.1 73.8 -9.1% 10.0%
Engineer III 25 111.0 100.0 110.6 105.3 62.2 109.7 109.7 98.7 114.8 130.3 109.7 102.7 6.9% -6.4%
Engineer Technician II 18 68.1 59.0 52.2 52.3 75.3 65.7 76.7 72.8 77.6 68.1 73.8 -7.7% 8.3%
Equipment Operator I 14 51.7 47.7 53.6 32.6 39.7 59.8 47.4 60.4 52.2 51.7 61.2 -15.6% 18.4%
Equipment Operator III 16 62.1 53.8 64.6 40.6 47.9 68.7 55.0 67.8 57.4 60.0 58.7 67.2 -12.6% 14.5%
Fire/Rescue Lieutenant B1 103.7 104.5 105.0 73.1 78.4 96.9 116.4 102.0 102.9 97.8 5.2% -5.0%
Firefighter/Rescuer I F1 81.3 81.7 81.1 57.9 48.8 76.4 73.5 76.4 73.3 4.3% -4.1%
Firefighter/Rescuer III F3 85.4 81.7 63.7 60.3 80.4 84.7 81.7 81.7 80.8 1.1% -1.1%
Highway Inspector I 19 78.9 64.1 92.2 48.0 52.3 82.7 80.7 72.8 77.6 77.6 77.3 0.3% -0.3%
Human Resources Specialist I 18 91.3 92.9 110.6 99.2 59.7 95.3 99.0 87.0 90.0 113.6 94.1 73.8 27.5% -21.6%
HVAC Mechanic I 18 75.1 98.0 39.1 55.5 75.3 67.1 67.8 57.4 67.4 73.8 -8.6% 9.4%
Senior Information Technology Specialist 28 87.0 93.1 99.2 59.7 80.7 103.6 96.9 93.1 118.4 -21.3% 27.1%
Information Technology Specialist III 26 109.9 91.1 92.6 59.4 67.3 99.0 89.7 96.1 91.9 107.1 -14.3% 16.6%
Information Technology Technician III 19 64.4 72.6 46.0 41.7 67.7 80.0 66.1 77.3 -14.6% 17.1%
Librarian I 21 82.8 89.1 54.5 52.5 86.6 82.8 85.0 -2.5% 2.6%
Management and Budget Specialist III 25 95.9 116.0 106.0 105.3 113.2 95.3 89.4 98.7 84.0 85.3 97.3 102.7 -5.2% 5.5%
Mechanic Technician II 18 71.6 55.3 77.6 40.5 52.7 78.8 67.1 67.8 66.1 74.6 67.4 73.8 -8.6% 9.4%
Office Clerk 5 45.2 40.2 38.6 31.7 34.5 57.1 43.6 51.0 47.7 43.8 43.7 40.9 6.8% -6.4%
Permitting & Code Enforcement Inspector III 23 78.9 64.1 86.6 44.2 54.8 78.8 72.9 76.7 72.8 72.9 93.4 -22.0% 28.1%
Planning Specialist III 23 91.3 92.9 99.2 59.7 95.3 89.4 87.0 84.0 90.3 93.4 -3.3% 3.4%
Police Officer I P2 82.9 63.6 81.1 83.9 64.1 75.3 54.6 79.8 73.0 75.3 81.3 -7.4% 8.0%
Police Sergeant A1 100.7 106.9 103.5 97.3 81.8 90.9 97.8 99.4 97.3 97.8 103.5 -5.5% 5.8%
Public Safety Communications Specialist III 19 78.9 58.1 77.0 48.0 52.8 72.4 70.0 67.8 83.0 70.0 77.3 -9.6% 10.6%
Principal Administrative Aide 13 59.3 44.3 59.0 34.2 43.8 62.7 53.5 60.4 67.1 64.1 59.2 58.4 1.2% -1.2%
Procurement Specialist III 25 87.0 86.3 110.6 56.9 59.7 95.3 80.7 98.7 90.0 85.3 86.6 102.7 -15.6% 18.5%
Public Service Worker II 9 47.2 41.1 43.3 30.4 33.4 49.7 40.9 50.9 45.3 43.3 48.6 -10.9% 12.2%
Recreation Specialist 21 82.8 92.9 84.0 54.5 59.7 82.7 72.9 98.7 84.0 82.8 85.0 -2.5% 2.6%
Social Worker II 23 95.9 85.0 59.4 68.7 90.7 89.4 84.0 85.0 93.4 -9.0% 9.8%
Therapist II 24 100.7 85.0 90.7 96.9 93.8 97.9 -4.2% 4.4%
NOTES:
% Chg Req
for MCG to
Reach
Median
● Percent change required for MCG salary to reach LGPA median salary was calculated by dividing dollar difference by MCG salary. Instances where the MCG salary is higher than the median are
characterized as a negative.
● Percent difference between MCG salary and LGPA median salary was calculated by dividing dollar difference by LGPA median salary.
● MNCPPC = Maryland-National Capital Park and Planning Commission; MCG = Montgomery County Government; PG = Prince George's; WSSC = Washington Suburban Sanitary Commission.
FY17 MAXIMUM SALARY COMPARISONS
SELECTED LOCAL JURISDICTIONS - SELECTED CLASSES
(IN THOUSANDS)
● Source: FY2017 Local Government Personnel Association Salary Survey (LGPA). Survey includes data from 26 jurisdictions in the national capital area.
● Montgomery County salaries reported to LGPA were those in effect as of July 10, 2016.
● Median salary does not include Montgomery County (MCG).
% Dif
Between
MCG &
Median
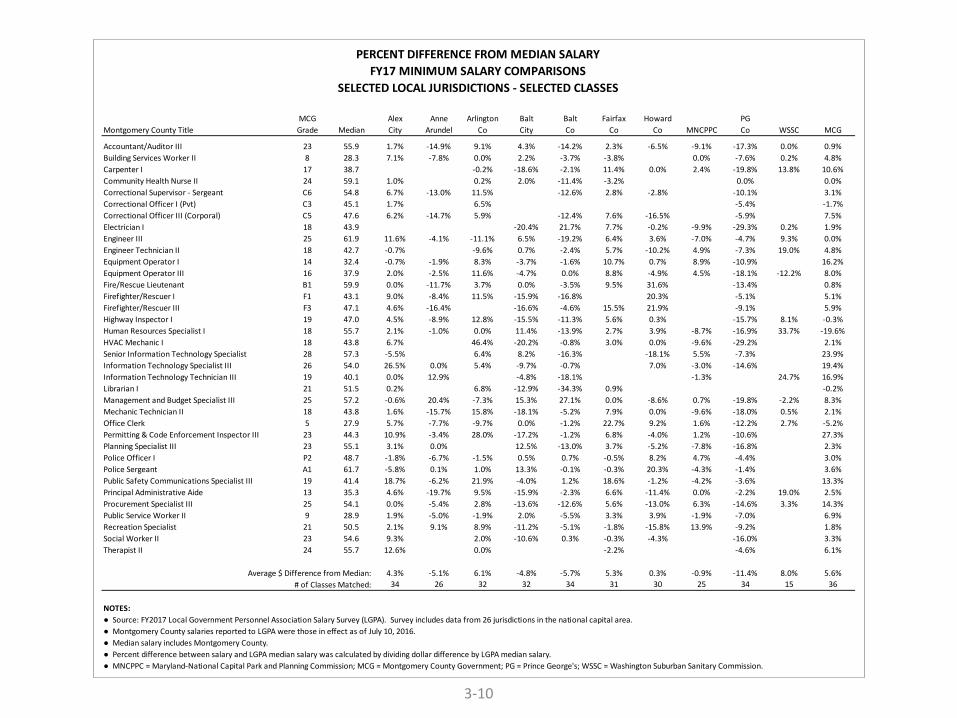
3-10
MCG Alex Anne Arlington Balt Balt Fairfax Howard PG
Montgomery County Title Grade Median City Arundel Co City Co Co Co MNCPPC Co WSSC MCG
Accountant/Auditor III 23 55.9 1.7% -14.9% 9.1% 4.3% -14.2% 2.3% -6.5% -9.1% -17.3% 0.0% 0.9%
Building Services Worker II 8 28.3 7.1% -7.8% 0.0% 2.2% -3.7% -3.8% 0.0% -7.6% 0.2% 4.8%
Carpenter I 17 38.7 -0.2% -18.6% -2.1% 11.4% 0.0% 2.4% -19.8% 13.8% 10.6%
Community Health Nurse II 24 59.1 1.0% 0.2% 2.0% -11.4% -3.2% 0.0% 0.0%
Correctional Supervisor - Sergeant C6 54.8 6.7% -13.0% 11.5% -12.6% 2.8% -2.8% -10.1% 3.1%
Correctional Officer I (Pvt) C3 45.1 1.7% 6.5% -5.4% -1.7%
Correctional Officer III (Corporal) C5 47.6 6.2% -14.7% 5.9% -12.4% 7.6% -16.5% -5.9% 7.5%
Electrician I 18 43.9 -20.4% 21.7% 7.7% -0.2% -9.9% -29.3% 0.2% 1.9%
Engineer III 25 61.9 11.6% -4.1% -11.1% 6.5% -19.2% 6.4% 3.6% -7.0% -4.7% 9.3% 0.0%
Engineer Technician II 18 42.7 -0.7% -9.6% 0.7% -2.4% 5.7% -10.2% 4.9% -7.3% 19.0% 4.8%
Equipment Operator I 14 32.4 -0.7% -1.9% 8.3% -3.7% -1.6% 10.7% 0.7% 8.9% -10.9% 16.2%
Equipment Operator III 16 37.9 2.0% -2.5% 11.6% -4.7% 0.0% 8.8% -4.9% 4.5% -18.1% -12.2% 8.0%
Fire/Rescue Lieutenant B1 59.9 0.0% -11.7% 3.7% 0.0% -3.5% 9.5% 31.6% -13.4% 0.8%
Firefighter/Rescuer I F1 43.1 9.0% -8.4% 11.5% -15.9% -16.8% 20.3% -5.1% 5.1%
Firefighter/Rescuer III F3 47.1 4.6% -16.4% -16.6% -4.6% 15.5% 21.9% -9.1% 5.9%
Highway Inspector I 19 47.0 4.5% -8.9% 12.8% -15.5% -11.3% 5.6% 0.3% -15.7% 8.1% -0.3%
Human Resources Specialist I 18 55.7 2.1% -1.0% 0.0% 11.4% -13.9% 2.7% 3.9% -8.7% -16.9% 33.7% -19.6%
HVAC Mechanic I 18 43.8 6.7% 46.4% -20.2% -0.8% 3.0% 0.0% -9.6% -29.2% 2.1%
Senior Information Technology Specialist 28 57.3 -5.5% 6.4% 8.2% -16.3% -18.1% 5.5% -7.3% 23.9%
Information Technology Specialist III 26 54.0 26.5% 0.0% 5.4% -9.7% -0.7% 7.0% -3.0% -14.6% 19.4%
Information Technology Technician III 19 40.1 0.0% 12.9% -4.8% -18.1% -1.3% 24.7% 16.9%
Librarian I 21 51.5 0.2% 6.8% -12.9% -34.3% 0.9% -0.2%
Management and Budget Specialist III 25 57.2 -0.6% 20.4% -7.3% 15.3% 27.1% 0.0% -8.6% 0.7% -19.8% -2.2% 8.3%
Mechanic Technician II 18 43.8 1.6% -15.7% 15.8% -18.1% -5.2% 7.9% 0.0% -9.6% -18.0% 0.5% 2.1%
Office Clerk 5 27.9 5.7% -7.7% -9.7% 0.0% -1.2% 22.7% 9.2% 1.6% -12.2% 2.7% -5.2%
Permitting & Code Enforcement Inspector III 23 44.3 10.9% -3.4% 28.0% -17.2% -1.2% 6.8% -4.0% 1.2% -10.6% 27.3%
Planning Specialist III 23 55.1 3.1% 0.0% 12.5% -13.0% 3.7% -5.2% -7.8% -16.8% 2.3%
Police Officer I P2 48.7 -1.8% -6.7% -1.5% 0.5% 0.7% -0.5% 8.2% 4.7% -4.4% 3.0%
Police Sergeant A1 61.7 -5.8% 0.1% 1.0% 13.3% -0.1% -0.3% 20.3% -4.3% -1.4% 3.6%
Public Safety Communications Specialist III 19 41.4 18.7% -6.2% 21.9% -4.0% 1.2% 18.6% -1.2% -4.2% -3.6% 13.3%
Principal Administrative Aide 13 35.3 4.6% -19.7% 9.5% -15.9% -2.3% 6.6% -11.4% 0.0% -2.2% 19.0% 2.5%
Procurement Specialist III 25 54.1 0.0% -5.4% 2.8% -13.6% -12.6% 5.6% -13.0% 6.3% -14.6% 3.3% 14.3%
Public Service Worker II 9 28.9 1.9% -5.0% -1.9% 2.0% -5.5% 3.3% 3.9% -1.9% -7.0% 6.9%
Recreation Specialist 21 50.5 2.1% 9.1% 8.9% -11.2% -5.1% -1.8% -15.8% 13.9% -9.2% 1.8%
Social Worker II 23 54.6 9.3% 2.0% -10.6% 0.3% -0.3% -4.3% -16.0% 3.3%
Therapist II 24 55.7 12.6% 0.0% -2.2% -4.6% 6.1%
4.3% -5.1% 6.1% -4.8% -5.7% 5.3% 0.3% -0.9% -11.4% 8.0% 5.6%
34 26 32 32 34 31 30 25 34 15 36
NOTES:
PERCENT DIFFERENCE FROM MEDIAN SALARY
FY17 MINIMUM SALARY COMPARISONS
SELECTED LOCAL JURISDICTIONS - SELECTED CLASSES
● Source: FY2017 Local Government Personnel Association Salary Survey (LGPA). Survey includes data from 26 jurisdictions in the national capital area.
● Montgomery County salaries reported to LGPA were those in effect as of July 10, 2016.
Average $ Difference from Median:
# of Classes Matched:
● Median salary includes Montgomery County.
● Percent difference between salary and LGPA median salary was calculated by dividing dollar difference by LGPA median salary.
● MNCPPC = Maryland-National Capital Park and Planning Commission; MCG = Montgomery County Government; PG = Prince George's; WSSC = Washington Suburban Sanitary Commission.
3-11
MCG Alex Anne Arlington Balt Balt Fairfax Howard PG
Montgomery County Title Grade Median City Arundel Co City Co Co Co MNCPPC Co WSSC MCG
Accountant/Auditor III 23 90.0 1.5% -15.2% 3.5% 3.9% -33.6% 5.9% -0.7% -3.3% 0.0% -5.1% 3.8%
Building Services Worker II 8 43.3 -4.7% -9.5% 0.0% -29.5% -22.9% 4.8% 17.5% 0.0% 12.6% 7.3%
Carpenter I 17 59.3 -0.4% -41.5% -19.2% 21.2% 0.0% 14.3% -3.2% 25.9% 18.8%
Community Health Nurse II 24 95.3 0.6% 0.0% -27.9% -31.4% 0.0% -11.9% 2.8%
Correctional Supervisor - Sergeant C6 89.3 13.4% -0.1% 15.6% -33.2% -6.8% -3.4% 0.1% 2.5%
Correctional Officer I (Pvt) C3 78.3 1.3% 3.5% -1.3% -17.4%
Correctional Officer III (Corporal) C5 76.5 3.8% -8.7% 11.3% -31.6% -1.1% -16.3% 6.1% 1.1%
Electrician I 18 67.4 -42.0% -18.0% 16.9% -0.5% 0.5% -14.9% 10.7% 9.4%
Engineer III 25 109.7 1.2% -8.8% 0.8% -4.0% -43.3% 0.0% 0.0% -10.1% 4.7% 18.7% -6.4%
Engineer Technician II 18 70.4 -3.3% -16.2% -25.8% -25.7% 6.9% -6.7% 8.9% 3.3% 10.1% 4.8%
Equipment Operator I 14 52.0 -0.5% -8.3% 3.2% -37.2% -23.6% 15.1% -8.7% 16.2% 0.5% 17.8%
Equipment Operator III 16 60.0 3.5% -10.4% 7.7% -32.4% -20.2% 14.4% -8.4% 12.9% -4.4% 0.0% 12.0%
Fire/Rescue Lieutenant B1 102.0 1.7% 2.5% 2.9% -28.3% -23.1% -4.9% 14.1% 0.0% -4.1%
Firefighter/Rescuer I F1 75.0 8.4% 9.0% 8.1% -22.8% -34.9% 1.9% -1.9% -2.3%
Firefighter/Rescuer III F3 81.2 5.1% 0.6% -21.5% -25.8% -1.0% 4.3% 0.5% -0.5%
Highway Inspector I 19 77.5 1.9% -17.2% 19.0% -38.0% -32.4% 6.8% 4.2% -6.1% 0.1% -0.1%
Human Resources Specialist I 18 92.9 -1.7% 0.0% 19.0% 6.8% -35.7% 2.6% 6.6% -6.4% -3.2% 22.3% -20.6%
HVAC Mechanic I 18 67.8 10.9% 44.6% -42.3% -18.0% 11.1% -1.0% 0.0% -15.3% 8.9%
Senior Information Technology Specialist 28 95.0 -8.5% -2.0% 4.4% -37.2% -15.1% 9.0% 2.0% 24.6%
Information Technology Specialist III 26 92.6 18.6% -1.7% 0.0% -35.8% -27.3% 6.9% -3.1% 3.7% 15.7%
Information Technology Technician III 19 67.7 -4.9% 7.2% -32.1% -38.5% 0.0% 18.1% 14.2%
Librarian I 21 83.9 -1.3% 6.2% -35.0% -37.5% 3.2% 1.3%
Management and Budget Specialist III 25 98.7 -2.8% 17.6% 7.4% 6.7% 14.7% -3.4% -9.4% 0.0% -14.9% -13.5% 4.1%
Mechanic Technician II 18 67.8 5.6% -18.4% 14.5% -40.2% -22.2% 16.3% -1.0% 0.0% -2.4% 10.1% 8.9%
Office Clerk 5 43.6 3.5% -7.8% -11.6% -27.2% -21.0% 30.9% 0.0% 16.9% 9.4% 0.4% -6.2%
Permitting & Code Enforcement Inspector III 23 74.8 5.5% -14.3% 15.8% -40.9% -26.8% 5.4% -2.6% 2.6% -2.7% 24.9%
Planning Specialist III 23 91.3 0.0% 1.7% 8.6% -34.6% 4.3% -2.2% -4.8% -8.1% 2.3%
Police Officer I P2 77.5 6.9% -18.0% 4.6% 8.2% -17.3% -2.9% -29.6% 2.9% -5.9% 4.8%
Police Sergeant A1 98.6 2.1% 8.4% 4.9% -1.4% -17.1% -7.9% -0.8% 0.8% -1.4% 4.9%
Public Safety Communications Specialist III 19 71.2 10.8% -18.4% 8.2% -32.6% -25.9% 1.7% -1.7% -4.8% 16.6% 8.6%
Principal Administrative Aide 13 59.0 0.5% -25.0% 0.0% -42.0% -25.9% 6.2% -9.4% 2.3% 13.7% 8.6% -1.0%
Procurement Specialist III 25 87.0 0.0% -0.8% 27.1% -34.6% -31.4% 9.5% -7.2% 13.4% 3.4% -1.9% 18.0%
Public Service Worker II 9 44.3 6.6% -7.2% -2.3% -31.3% -24.7% 12.1% -7.7% 14.8% 2.3% 9.7%
Recreation Specialist 21 83.4 -0.7% 11.4% 0.7% -34.6% -28.4% -0.8% -12.6% 18.3% 0.7% 1.9%
Social Worker II 23 87.2 10.0% -2.5% -31.8% -21.2% 4.0% 2.5% -3.7% 7.1%
Therapist II 24 96.9 3.9% -12.2% -6.4% 0.0% 1.1%
2.9% -5.1% 5.7% -24.2% -26.3% 5.3% -3.5% 4.8% -1.0% 7.8% 5.1%
34 26 32 32 34 31 30 25 34 15 36
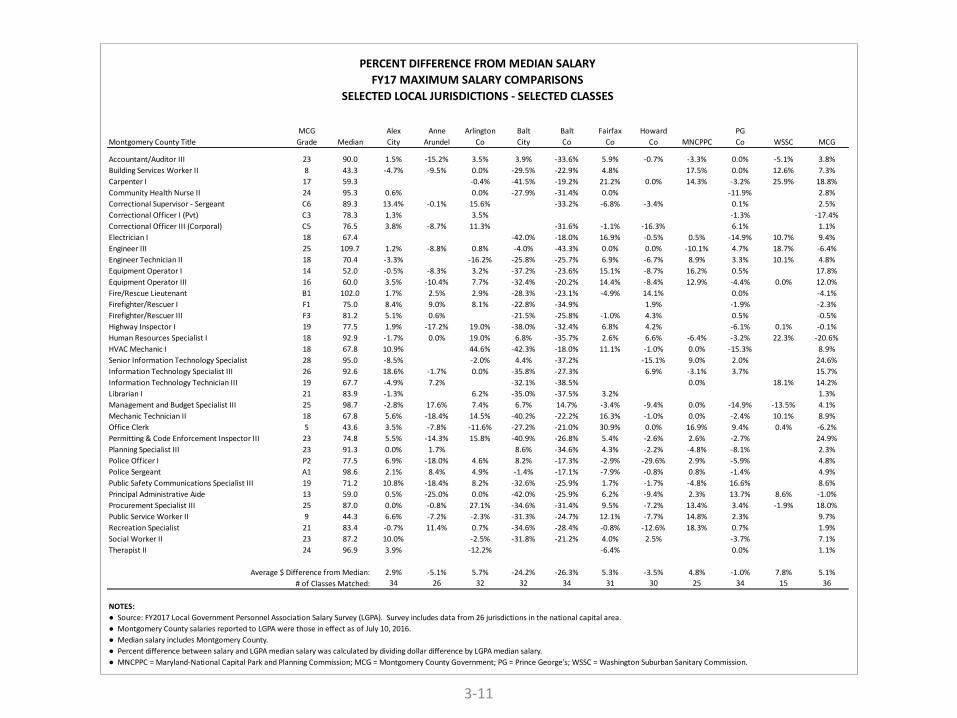
NOTES:
PERCENT DIFFERENCE FROM MEDIAN SALARY
FY17 MAXIMUM SALARY COMPARISONS
SELECTED LOCAL JURISDICTIONS - SELECTED CLASSES
● Source: FY2017 Local Government Personnel Association Salary Survey (LGPA). Survey includes data from 26 jurisdictions in the national capital area.
● Montgomery County salaries reported to LGPA were those in effect as of July 10, 2016.
● Median salary includes Montgomery County.
Average $ Difference from Median:
# of Classes Matched:
● Percent difference between salary and LGPA median salary was calculated by dividing dollar difference by LGPA median salary.
● MNCPPC = Maryland-National Capital Park and Planning Commission; MCG = Montgomery County Government; PG = Prince George's; WSSC = Washington Suburban Sanitary Commission.
3-12
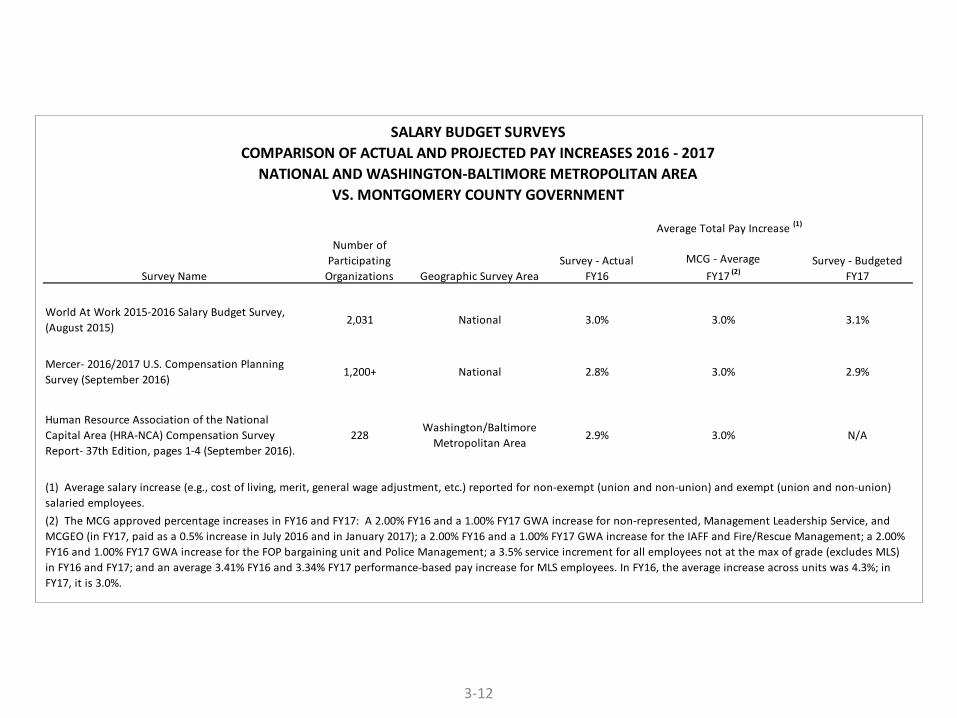
World At Work 2015-2016 Salary Budget Survey,
(August 2015)2,031 National 3.0% 3.0% 3.1%
Mercer- 2016/2017 U.S. Compensation Planning
Survey (September 2016)1,200+ National 2.8% 3.0% 2.9%
Human Resource Association of the National
Capital Area (HRA-NCA) Compensation Survey
Report- 37th Edition, pages 1-4 (September 2016).
228Washington/Baltimore
Metropolitan Area2.9% 3.0% N/A
SALARY BUDGET SURVEYS
COMPARISON OF ACTUAL AND PROJECTED PAY INCREASES 2016 - 2017
NATIONAL AND WASHINGTON-BALTIMORE METROPOLITAN AREA
VS. MONTGOMERY COUNTY GOVERNMENT
Average Total Pay Increase (1)
(2) The MCG approved percentage increases in FY16 and FY17: A 2.00% FY16 and a 1.00% FY17 GWA increase for non-represented, Management Leadership Service, and
MCGEO (in FY17, paid as a 0.5% increase in July 2016 and in January 2017); a 2.00% FY16 and a 1.00% FY17 GWA increase for the IAFF and Fire/Rescue Management; a 2.00%
FY16 and 1.00% FY17 GWA increase for the FOP bargaining unit and Police Management; a 3.5% service increment for all employees not at the max of grade (excludes MLS)
in FY16 and FY17; and an average 3.41% FY16 and 3.34% FY17 performance-based pay increase for MLS employees. In FY16, the average increase across units was 4.3%; in
FY17, it is 3.0%.
Survey - Budgeted
FY17Survey Name
Number of
Participating
Organizations Geographic Survey Area
Survey - Actual
FY16
MCG - Average
FY17 (2)
(1) Average salary increase (e.g., cost of living, merit, general wage adjustment, etc.) reported for non-exempt (union and non-union) and exempt (union and non-union)
salaried employees.

Management Leadership Service Review
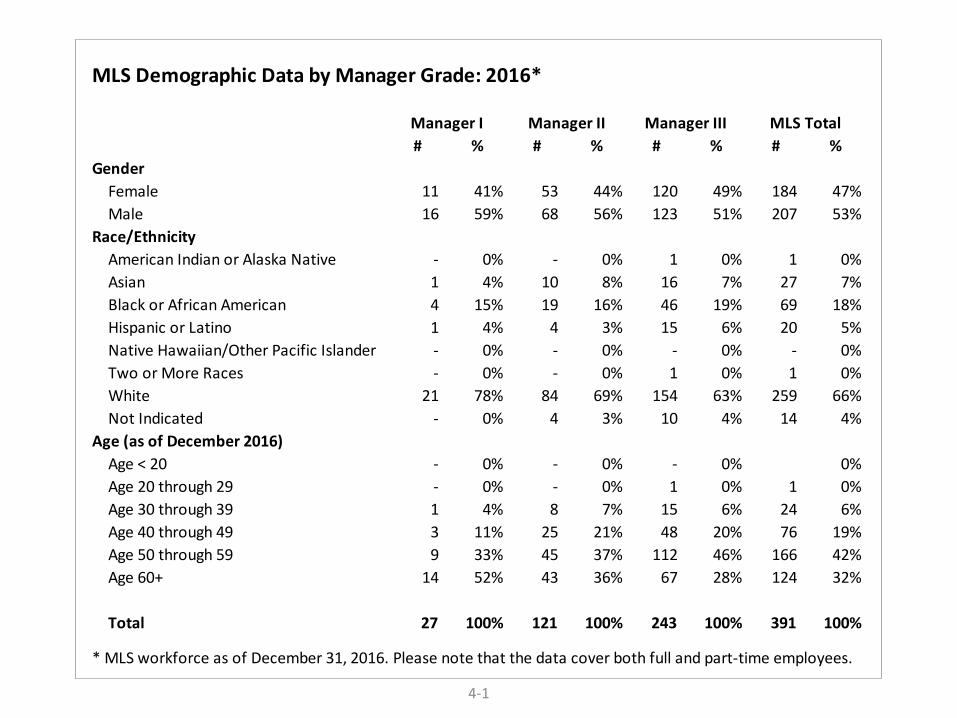
4-1
MLS Demographic Data by Manager Grade: 2016*
# % # % # % # %
Gender
Female 11 41% 53 44% 120 49% 184 47%
Male 16 59% 68 56% 123 51% 207 53%
Race/Ethnicity
American Indian or Alaska Native - 0% - 0% 1 0% 1 0%
Asian 1 4% 10 8% 16 7% 27 7%
Black or African American 4 15% 19 16% 46 19% 69 18%
Hispanic or Latino 1 4% 4 3% 15 6% 20 5%
Native Hawaiian/Other Pacific Islander - 0% - 0% - 0% - 0%
Two or More Races - 0% - 0% 1 0% 1 0%
White 21 78% 84 69% 154 63% 259 66%
Not Indicated - 0% 4 3% 10 4% 14 4%
Age (as of December 2016)
Age < 20 - 0% - 0% - 0% 0%
Age 20 through 29 - 0% - 0% 1 0% 1 0%
Age 30 through 39 1 4% 8 7% 15 6% 24 6%
Age 40 through 49 3 11% 25 21% 48 20% 76 19%
Age 50 through 59 9 33% 45 37% 112 46% 166 42%
Age 60+ 14 52% 43 36% 67 28% 124 32%
Total 27 100% 121 100% 243 100% 391 100%
* MLS workforce as of December 31, 2016. Please note that the data cover both full and part-time employees.
Manager I Manager II Manager III MLS Total
4-2
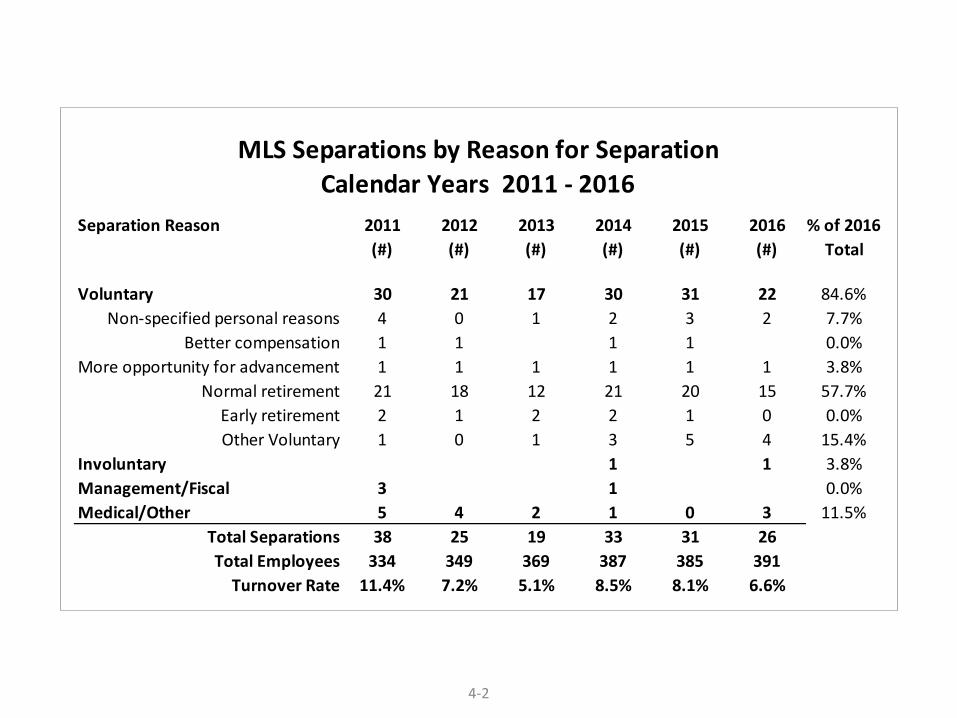
Separation Reason 2011 2012 2013 2014 2015 2016 % of 2016
(#) (#) (#) (#) (#) (#) Total
Voluntary 30 21 17 30 31 22 84.6%
Non-specified personal reasons 4 0 1 2 3 2 7.7%
Better compensation 1 1 1 1 0.0%
More opportunity for advancement 1 1 1 1 1 1 3.8%
Normal retirement 21 18 12 21 20 15 57.7%
Early retirement 2 1 2 2 1 0 0.0%
Other Voluntary 1 0 1 3 5 4 15.4%
Involuntary 1 1 3.8%
Management/Fiscal 3 1 0.0%
Medical/Other 5 4 2 1 0 3 11.5%
Total Separations 38 25 19 33 31 26
Total Employees 334 349 369 387 385 391
Turnover Rate 11.4% 7.2% 5.1% 8.5% 8.1% 6.6%
MLS Separations by Reason for Separation
Calendar Years 2011 - 2016
4-3
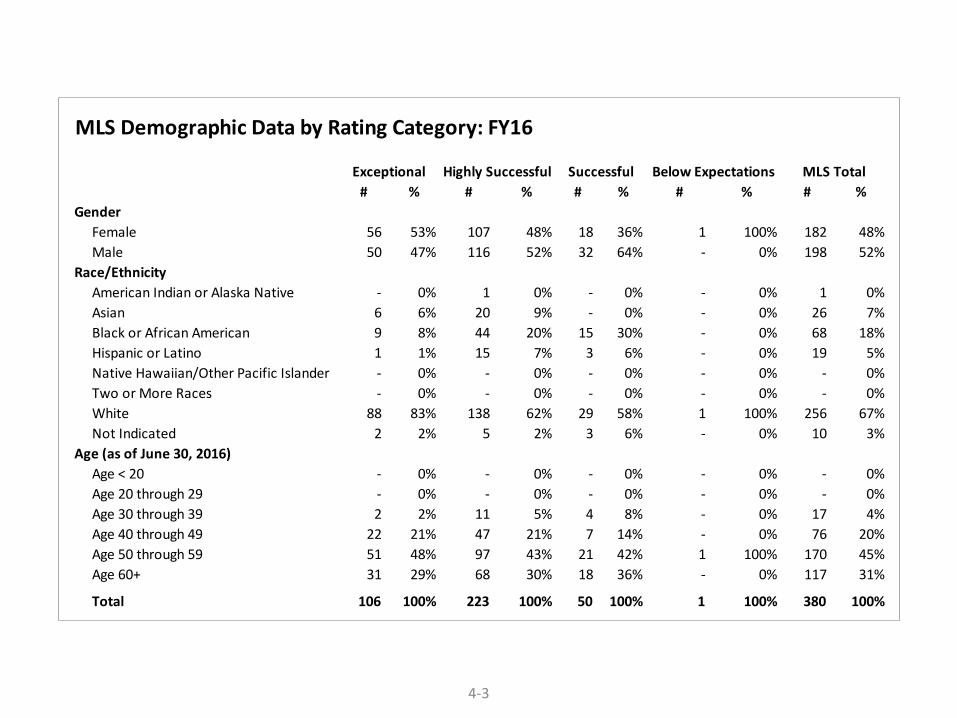
MLS Demographic Data by Rating Category: FY16
# % # % # % # % # %
Gender
Female 56 53% 107 48% 18 36% 1 100% 182 48%
Male 50 47% 116 52% 32 64% - 0% 198 52%
Race/Ethnicity
American Indian or Alaska Native - 0% 1 0% - 0% - 0% 1 0%
Asian 6 6% 20 9% - 0% - 0% 26 7%
Black or African American 9 8% 44 20% 15 30% - 0% 68 18%
Hispanic or Latino 1 1% 15 7% 3 6% - 0% 19 5%
Native Hawaiian/Other Pacific Islander - 0% - 0% - 0% - 0% - 0%
Two or More Races - 0% - 0% - 0% - 0% - 0%
White 88 83% 138 62% 29 58% 1 100% 256 67%
Not Indicated 2 2% 5 2% 3 6% - 0% 10 3%
Age (as of June 30, 2016)
Age < 20 - 0% - 0% - 0% - 0% - 0%
Age 20 through 29 - 0% - 0% - 0% - 0% - 0%
Age 30 through 39 2 2% 11 5% 4 8% - 0% 17 4%
Age 40 through 49 22 21% 47 21% 7 14% - 0% 76 20%
Age 50 through 59 51 48% 97 43% 21 42% 1 100% 170 45%
Age 60+ 31 29% 68 30% 18 36% - 0% 117 31%
Total 106 100% 223 100% 50 100% 1 100% 380 100%
Exceptional Highly Successful Successful Below Expectations MLS Total
4-4
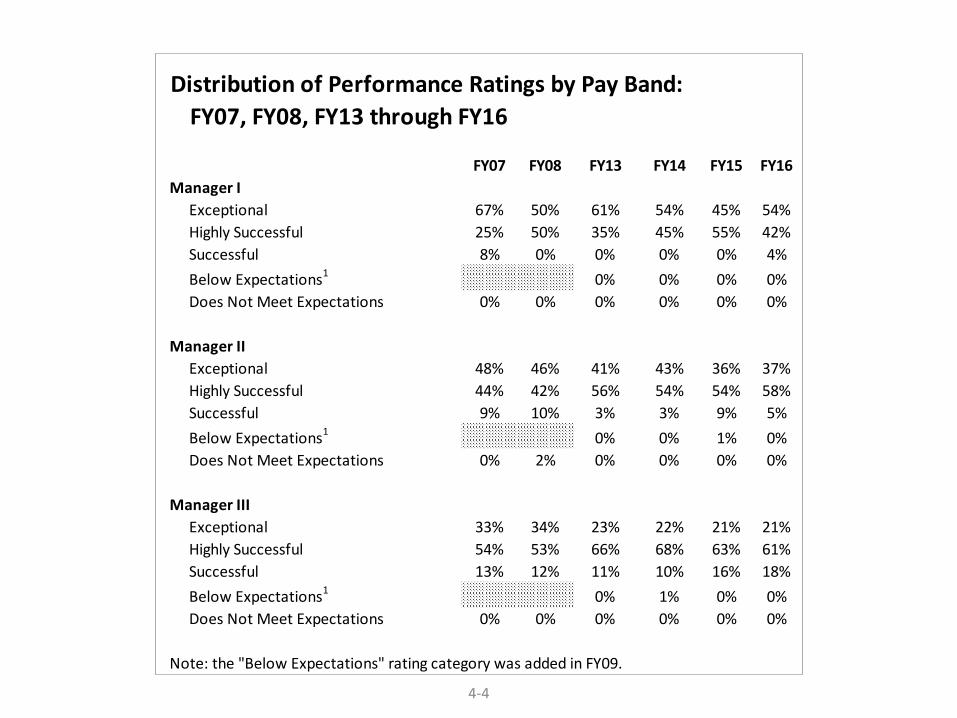
Distribution of Performance Ratings by Pay Band:
FY07, FY08, FY13 through FY16
FY07 FY08 FY13 FY14 FY15 FY16
Manager I
Exceptional 67% 50% 61% 54% 45% 54%
Highly Successful 25% 50% 35% 45% 55% 42%
Successful 8% 0% 0% 0% 0% 4%
Below Expectations1 0% 0% 0% 0%
Does Not Meet Expectations 0% 0% 0% 0% 0% 0%
Manager II
Exceptional 48% 46% 41% 43% 36% 37%
Highly Successful 44% 42% 56% 54% 54% 58%
Successful 9% 10% 3% 3% 9% 5%
Below Expectations1 0% 0% 1% 0%
Does Not Meet Expectations 0% 2% 0% 0% 0% 0%
Manager III
Exceptional 33% 34% 23% 22% 21% 21%
Highly Successful 54% 53% 66% 68% 63% 61%
Successful 13% 12% 11% 10% 16% 18%
Below Expectations1 0% 1% 0% 0%
Does Not Meet Expectations 0% 0% 0% 0% 0% 0%
Note: the "Below Expectations" rating category was added in FY09.
4-5
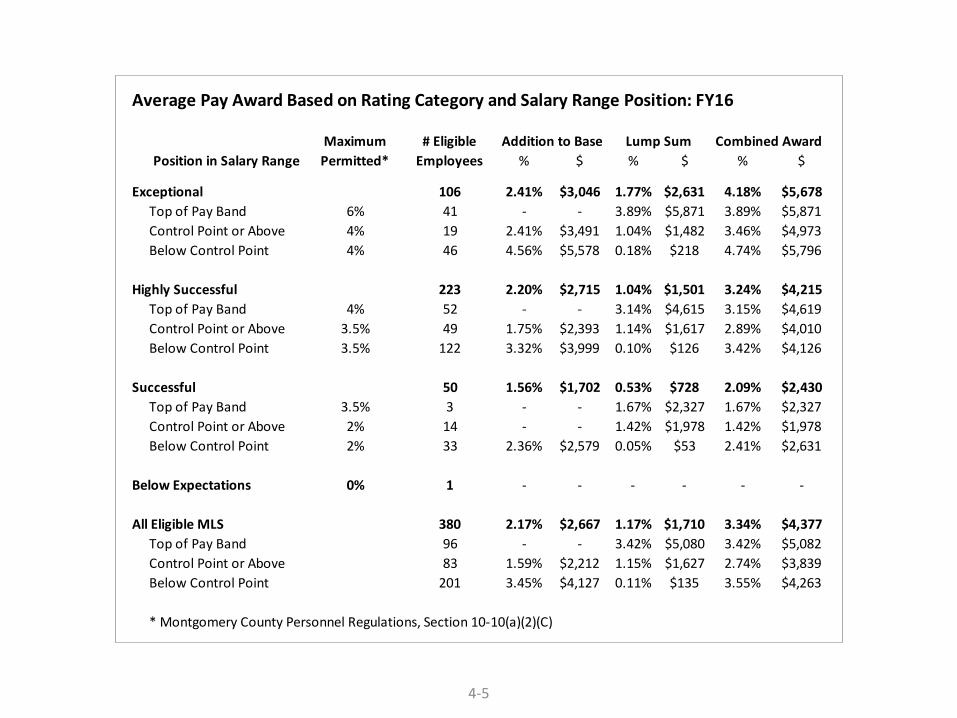
Average Pay Award Based on Rating Category and Salary Range Position: FY16
% $ % $ % $
Exceptional 106 2.41% $3,046 1.77% $2,631 4.18% $5,678
Top of Pay Band 6% 41 - - 3.89% $5,871 3.89% $5,871
Control Point or Above 4% 19 2.41% $3,491 1.04% $1,482 3.46% $4,973
Below Control Point 4% 46 4.56% $5,578 0.18% $218 4.74% $5,796
Highly Successful 223 2.20% $2,715 1.04% $1,501 3.24% $4,215
Top of Pay Band 4% 52 - - 3.14% $4,615 3.15% $4,619
Control Point or Above 3.5% 49 1.75% $2,393 1.14% $1,617 2.89% $4,010
Below Control Point 3.5% 122 3.32% $3,999 0.10% $126 3.42% $4,126
Successful 50 1.56% $1,702 0.53% $728 2.09% $2,430
Top of Pay Band 3.5% 3 - - 1.67% $2,327 1.67% $2,327
Control Point or Above 2% 14 - - 1.42% $1,978 1.42% $1,978
Below Control Point 2% 33 2.36% $2,579 0.05% $53 2.41% $2,631
Below Expectations 0% 1 - - - - - -
All Eligible MLS 380 2.17% $2,667 1.17% $1,710 3.34% $4,377
Top of Pay Band 96 - - 3.42% $5,080 3.42% $5,082
Control Point or Above 83 1.59% $2,212 1.15% $1,627 2.74% $3,839
Below Control Point 201 3.45% $4,127 0.11% $135 3.55% $4,263
* Montgomery County Personnel Regulations, Section 10-10(a)(2)(C)
Combined Award
Position in Salary Range
Maximum
Permitted*
# Eligible
Employees
Addition to Base Lump Sum
4-6
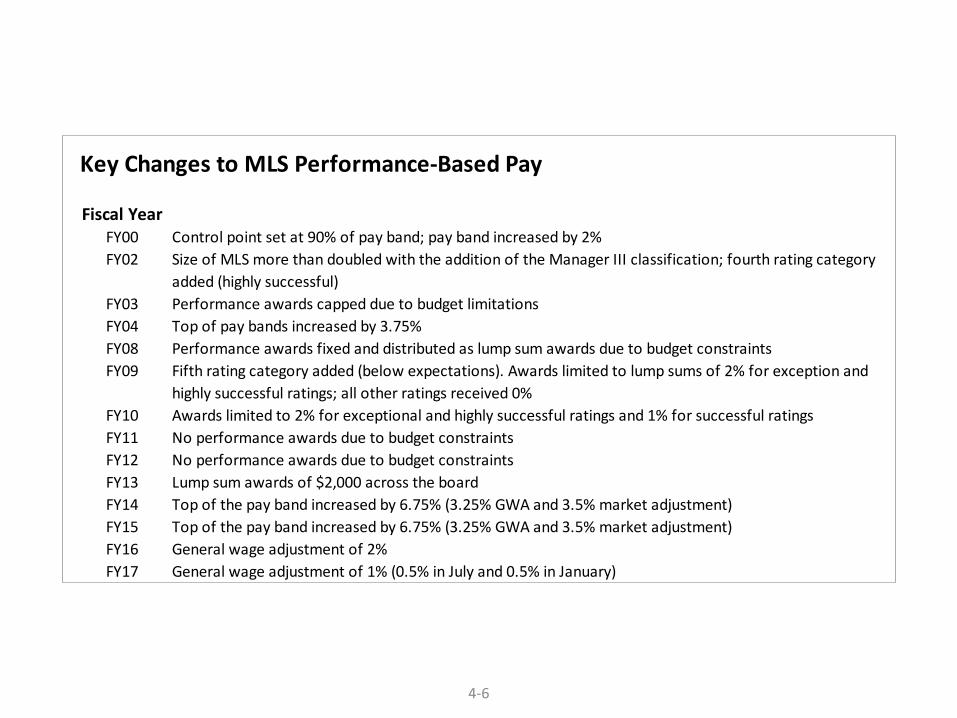
Key Changes to MLS Performance-Based Pay
Fiscal YearFY00 Control point set at 90% of pay band; pay band increased by 2%
FY02 Size of MLS more than doubled with the addition of the Manager III classification; fourth rating category
added (highly successful)
FY03 Performance awards capped due to budget limitations
FY04 Top of pay bands increased by 3.75%
FY08 Performance awards fixed and distributed as lump sum awards due to budget constraints
FY09 Fifth rating category added (below expectations). Awards limited to lump sums of 2% for exception and
highly successful ratings; all other ratings received 0%
FY10 Awards limited to 2% for exceptional and highly successful ratings and 1% for successful ratings
FY11 No performance awards due to budget constraints
FY12 No performance awards due to budget constraints
FY13 Lump sum awards of $2,000 across the board
FY14 Top of the pay band increased by 6.75% (3.25% GWA and 3.5% market adjustment)
FY15 Top of the pay band increased by 6.75% (3.25% GWA and 3.5% market adjustment)
FY16 General wage adjustment of 2%
FY17 General wage adjustment of 1% (0.5% in July and 0.5% in January)


