23
OCTOBER 2011 | Vol. 2 No. 8 MONTHL Y THE OPTION TRADERS JOURNAL USING WEIGHTED VEGA - ALSO - Investing Implications of the VIX Term Structure Analyzing Individual Stock Volatility

OCTOBER 2011 | Vol. 2 No. 8
M O N T H LYT H E O P T I O N T R A D E R S J O U R N A L
Using Weighted
Vega- aLsO -
Investing Implications of the VIX Term Structure
Analyzing Individual Stock Volatility

www.expiringmonthly.com OCTOBER 2011 2
M O N T H LYT H E O P T I O N T R A D E R S J O U R N A L
C o n t e n t s
4 editor’s notes Bill Luby
5 Ask the Xperts The Expiring Monthly Editors
6 Analyzing Individual stock Volatility with the CBoe equity VIX IndexesJared Woodard
8 Building with optionsTyler Craig, Guest Contributor
10 eXpIrIng Monthly FeAture using Weighted VegaMark Sebastian
14 Can option Implied Volatility Be a predictive Measure for underlying Direction?Andrew Giovinazzi, Guest Contributor
17 Investing Implications of the VIX term structureBill Luby
20 follow that trade: trading a short time spreadMark Sebastian
23 back page: orphaned Volatility products?Jared Woodard
e D I to r I A l
Bill LubyJared WoodardMark Sebastian
D e s I g n / l Ayo u t
Lauren Woodrow
C o n tAC t I n F o r M At I o n
Editorial comments: [email protected] and SalesExpiring Monthly PresidentMark Sebastian: [email protected]: 773.661.6620
The information presented in this publication does not consider your personal investment objectives or financial situation; therefore, this publication does not make personalized recommendations. This information should not be construed as an offer to sell or a solicitation to buy any security. The investment strategies or the securities may not be suitable for you. We believe the information provided is reliable; however, Expiring Monthly and its affiliated personnel do not guarantee its accuracy, timeliness, or completeness. Any and all opinions expressed in this publication are subject to change without notice. In respect to the companies or securities covered in these materials, the respective person, analyst, or writer certifies to Expiring Monthly that the views expressed accurately reflect his or her own personal views about the subject securities and issuing entities and that no part of the person’s compensation was, is, or will be related to the specific recommendations (if made) or views contained in this publication. Expiring Monthly and its affiliates, their employees, directors, consultants, and/or their respective family members may directly or indirectly hold positions in the securities referenced in these materials.
Options transactions involve complex tax considerations that should be carefully reviewed prior to entering into any transaction. The risk of loss in trading securities, options, futures, and forex can be substantial. Customers must consider all relevant risk factors, including their own personal financial situation, before trading. Options involve risk and are not suitable for all investors. See the options disclosure document Characteristics and Risks of Standardized Options. A copy can be downloaded at http://www.optionsclearing.com/about/publications/character-risks.jsp.
Expiring Monthly does not assume any liability for any action taken based on information or advertisements presented in this publication. No part of this material is to be reproduced or distributed to others by any means without prior written permission of Expiring Monthly or its affiliates. Photocopying, including transmission by facsimile or email scan, is prohibited and subject to liability. Copyright © 2011, Expiring Monthly.

www.expiringmonthly.com OCTOBER 2011 3
about the
expiring Monthly teamBill Luby
Bill is a private investor whose research and trading interests focus on volatility, market sentiment, technical analysis, and ETFs. His work has been has been quoted in the Wall Street Journal, Financial Times, Barron’s and other publications. A contributor to Barron’s and Minyanville, Bill also authors the VIX and More blog and an investment newsletter from just north of San Francisco.
He has been trading options since 1998.
Prior to becoming a full-time investor, Bill was a business strategy consultant for two decades and advised clients across a broad range of industries on issues such as strategy formulation, strategy implementation, and metrics. When not trading or blogging, he can often be found running, hiking, and kayaking in Northern California.
Bill has a BA from Stanford University and an MBA from Carnegie-Mellon University.
Jared WoodardJared is the principal of Condor Options. With over a decade of experience trading options, equities, and futures, he publishes the Condor Options newsletter (iron condors) and associated blog.
Jared has been quoted in various media outlets including The Wall Street Journal, Bloomberg, Financial Times Alphaville, and The Chicago Sun-Times. He is also a
contributor to TheStreet’s Options Profits service.
In 2008, he was profiled as a top options mentor in Stocks, Futures, and Options Magazine. He is also an associate member of the National Futures Association and registered principal of Clinamen Financial Group LLC, a commodity trading advisor.
Jared has master’s degrees from Fordham University and the University of Edinburgh.
Mark sebastian Mark is a professional option trader and option mentor. He graduated from Villanova University in 2001 with a degree in finance. He was hired into an option trader training program by Group 1 Trading. He spent two years in New York trading options on the American Stock Exchange before moving back to Chicago to trade SPX and DJX options For the next five years, he
traded a variety of option products successfully, both on and off the CBOE floor.
In December 2008 he started working as a mentor at Sheridan Option Mentoring. Currently, Mark writes a daily blog on all things option trading at Option911.com and works part time as risk manager for a hedge fund. In March 2010 he became Director of Education for a new education firm OptionPit.com.
www.expiringmonthly.com OCTOBER 2011 4
editor’s
notesBill Luby
We are now at three high volatility options expira-tion cycles and counting, as Europe inches toward what many are beginning to believe will at least be a workable framework for resolving the sovereign debt crisis.
In recognition of the rising tide of volatility, we devoted the entire September issue to the VIX and volatility. This month we continue with a number of volatility themes, from VIX to vega to implied volatility and beyond.
Mark Sebastian authors this month’s feature, Using Weighted Vega, which looks at how vega varies according to time to expiration. He follows up on this item with a Follow That Trade effort involving a calendar spread on S&P 500 futures.
Also, Jared examines the CBOE’s new VIX-style volatility indexes for individual equities and finds some interesting differences between these new indices and the VIX with respect to their underlying.
Guest contributor Andrew Giovinazzi tackles one of my favorite subjects in Can Option Implied Volatility Be a Predictive Measure for Underlying Direction? and uses precious metals as the backdrop for his analysis.
This month I am extending a theme I developed last week by examining the Investment Implications of the VIX Term Structure as it applies not just to the VIX exchange-traded products, but also to a couple of equity groupings and asset classes.
In a reflective piece, Tyler Craig returns to these pages to explain why trading options reminds him of playing with building blocks.
Once again, the EM team is back to answer reader questions in the Ask the Xperts segment and Jared haunts the Back Page with his musings about that lack of interest in some of the more exotic volatility products.
As always, readers are encouraged to send questions, comments or guest article contribution ideas to [email protected].
Happy Halloween,
Bill Luby Contributing Editor

www.expiringmonthly.com OCTOBER 2011 5
ask the
pertsThe Expiring Monthly Editors
Q: It looks like VIX options are traded very actively these days. I understand that the spot or “cash” VIX that every-body looks at isn’t actually the underlying for VIX options, but I don’t understand what the underlying really is.
— J. L.
A: First, thanks for mentioning that the spot VIX index is not the under-lying on which VIX options are based — it took a little time, I think, for that fact to really sink in with a lot of traders. Sometimes people refer to the VIX futures as the underlying for VIX options; but this isn’t actu-ally so. The underlying for VIX options is the “forward value” of VIX based on SPX option prices. This is explained in more detail at the CBOE website. You can use the VIX futures as a close proxy underlying, but you’ll run into some trouble if you try to trade as if that relationship were actual, since VIX options are desig-nated for equity accounts (SEC regulated) while you need a futures account (CFTC regulated) to trade VIX futures. And VIX
options are cash settled, so you won’t receive a futures contract position if you hold a VIX option that expires in the money.
— Jared
Q: Over the last few months I began an active credit spread selling strategy. I pick stocks that I like or dislike and sell a call spread or put spread against it. Over the last few months this has done exteremly well. My question is this: are my returns abnormally large because of the VIX?
— Josh
A: The answer is: it depends. If you are selling based on a specific delta, the answer is probably not. You should receive the same amount of credit on your spreads. However, the spreads will be closer to where the under-lying is trading. If you are selling spreads based on percent out of the money, the amount of credit you receive will actually fall. This is a direct function of vola-tility in the pricing model.
— Mark
Q: I recalled you have done some previous work in studying the options IV behavior pre/post earning for individual companies. Can you share some of your findings? I wonder if there’s any edge in buying OTM calls/puts the day before the earning if there’s an expectation that a big move is most probable. At first thought this might work as price can move up/down 10% easily. However, one would think corresponding options calls/puts would have already priced this volatility in and would most likely be artificially expensive due to high IV. I wonder how the IV profile for most companies looks like during earning season or more importantly how one can capitalize on this extreme volatility within a decent risk/reward trade profile.
— Ken
A: This is one of the huge questions in the options world — and I don’t think there is any general consensus on the answer.
I won’t claim to be an expert on earnings-related IV, but most of my
research shows a substan-tial increase in IV for 1–2 weeks prior to the earn-ings report, which is typically followed by a volatility “crush” imme-diately after the earnings report. The big question relates to the size of the price jump immediately following earnings. What I have seen suggests that more often than not a short options position is better going into earnings. Short will give you more winners, but the size of the spikes will determine whether these offset the volatility crush.
An alternative strategy to take advantage of what I have observed would be to be long OTM options in the week or so going into earnings, closing out this position just prior to the announcement.
However you choose to play this, you need quite a few data points to estab-lish profitability, as it is the size of the outliers — and their frequency — that determines the P&L.
Good trading, — Bill
www.expiringmonthly.com OCTOBER 2011 6
analyzing individual stock Volatility with the CBOe
equity ViX indexes Jared Woodard
Implied volatility is an intrinsic part of an option’s price. Any priced option contract will inherently imply a certain range of price movement in the underlying asset during the life of the option. If implied volatility has been around for so long, then, why did it take the development and widespread adoption of the CBOE’s VIX index for implied volatility to become a steady feature of mainstream financial coverage? One reason was probably the shift in 2003 from the S&P 100 to the much more widely followed S&P 500. Another likely reason was the change, also in 2003, to a methodology that incorpo-rated information from out of the money options.
If the VIX methodology proved so popular for watchers of the S&P 500, it stood to reason that the same methodology might be valuable when applied to other underlying assets. Such, anyway, was likely the thinking at the CBOE when the exchange began publishing VIX-style indexes for several individual equities in early 2011. Apple (AAPL), Amazon (AMZN), Goldman Sachs (GS), Google (GOOG), and IBM (IBM) each now have VIX-style bench-marks that track 30-day implied volatility estimates for those stocks based on their options. For more
introductory material on these indexes, check the CBOE website.
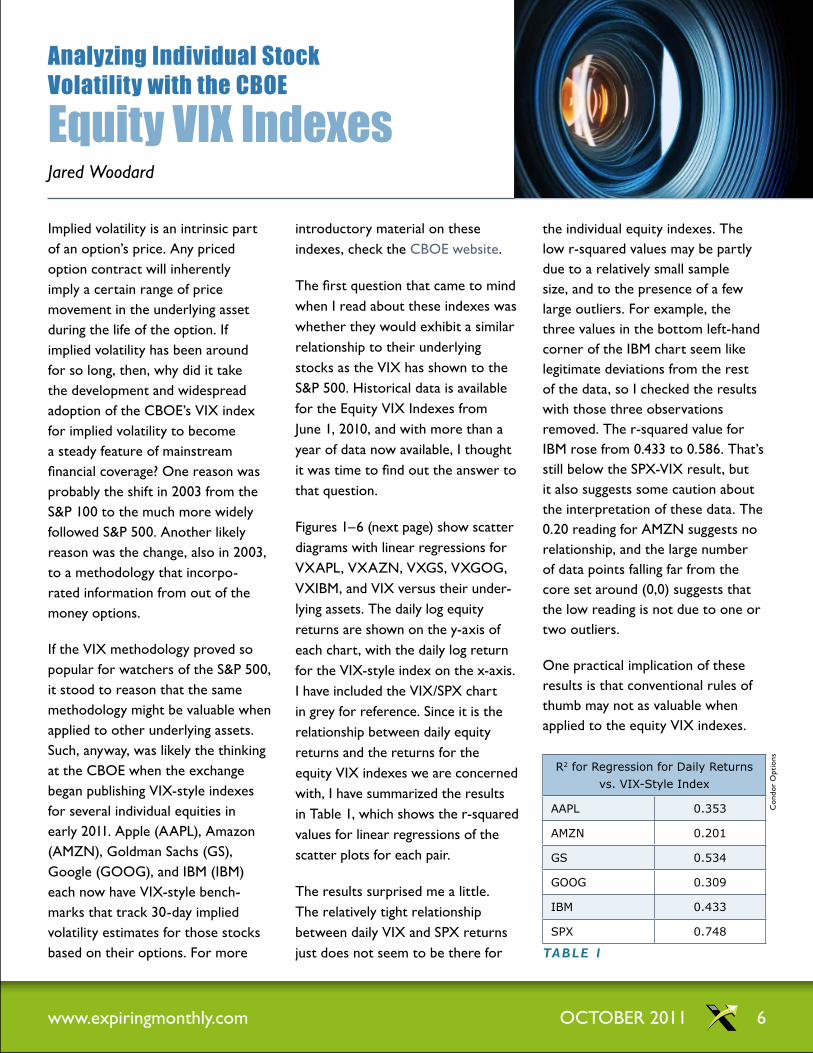
The first question that came to mind when I read about these indexes was whether they would exhibit a similar relationship to their underlying stocks as the VIX has shown to the S&P 500. Historical data is available for the Equity VIX Indexes from June 1, 2010, and with more than a year of data now available, I thought it was time to find out the answer to that question.
Figures 1–6 (next page) show scatter diagrams with linear regressions for VXAPL, VXAZN, VXGS, VXGOG, VXIBM, and VIX versus their under-lying assets. The daily log equity returns are shown on the y-axis of each chart, with the daily log return for the VIX-style index on the x-axis. I have included the VIX/SPX chart in grey for reference. Since it is the relationship between daily equity returns and the returns for the equity VIX indexes we are concerned with, I have summarized the results in Table 1, which shows the r-squared values for linear regressions of the scatter plots for each pair.
The results surprised me a little. The relatively tight relationship between daily VIX and SPX returns just does not seem to be there for
the individual equity indexes. The low r-squared values may be partly due to a relatively small sample size, and to the presence of a few large outliers. For example, the three values in the bottom left-hand corner of the IBM chart seem like legitimate deviations from the rest of the data, so I checked the results with those three observations removed. The r-squared value for IBM rose from 0.433 to 0.586. That’s still below the SPX-VIX result, but it also suggests some caution about the interpretation of these data. The 0.20 reading for AMZN suggests no relationship, and the large number of data points falling far from the core set around (0,0) suggests that the low reading is not due to one or two outliers.
One practical implication of these results is that conventional rules of thumb may not as valuable when applied to the equity VIX indexes.
R2 for Regression for Daily Returns vs. VIX-Style Index
AAPL 0.353
AMZN 0.201
GS 0.534
GOOG 0.309
IBM 0.433
SPX 0.748
TAble 1
Con
dor
Opt
ions

www.expiringmonthly.com OCTOBER 2011 7
I know that a lot of traders use the “10% above the 10-day moving average” rule to identify moments when the VIX index has risen too far and is likely to revert, portending a rally for the underlying stocks. Rules like that would not be expected to work as well for assets whose options order flow (as measured
by the VIX methodology) does not have such a tight relationship to equity returns.
The real value of the VIX index is not, in my view, as a market timing indicator unto itself, and certainly not as a quasi-asset whose future values can be predicted by technical
analysis. The real value of the VIX index is that it provides a meaningful snapshot in one quick number of what options traders are expecting in the near term. Whether or not the new Equity VIX indexes bear as tight a relationship on a daily basis, they each provide the same helpful snapshots. eM
analyzing individual stock Volatility with the CBOe equity ViX indexes (continued)
Figures 1– 6 Scatter diagrams with linear regres-sions for VXAPL, VXAZN, VXGS, VXGOG, VXIBM, and VIX versus their underlying assets.
Con
dor
Opt
ions
, CBO
E
www.expiringmonthly.com OCTOBER 2011 8
Building
with OptionsTyler Craig, Guest Contributor
I like to think I was born a builder. While I didn’t spring from the womb with a hammer and chisel in hand, I did come equipped with an insatiable appetite for creative construction. During my childhood I had a variety of tools at my disposal to express my creativity. Over time as my skill set improved I moved from basic blocks to Lincoln Logs to K’NEX. If you were to ask me at the age of 10 what I thought was the coolest invention ever I undoubtedly would have answered “LEGO”. To this day any time we visit my in-laws in California I drag my wife into the mall so we can canvass the LEGO store to discover what kinds of new sets have been developed.
There’s something about the satis-faction that comes after completing some grand construction. You can step back, marvel at your handiwork, and take pride in the fact that you just created something worthwhile. Or, if the end result of your labors turned out to be poorly designed or a far cry from what you were trying to construct, you can simply tear it down and start anew.
Little did I know the block building of my toddler years and LEGO playing of my adolescence would give rise to creating with tools of a financial nature as an adult. Only
now monetary compensation or loss becomes an added variable. As I’ve progressed as an option trader I’ve noticed a few distinct similari-ties between option contracts and building blocks.
Options are BlocksIn many option trading texts when discussing spreads or complex strategies, the vernacular used is that of building or constructing a trade. These terms help convey the notion that options are building blocks. In my LEGO building adven-tures of days past my success hinged on my familiarity with the characteristics of each individual block, such as rectangles, arches, squares, and circles. Upon reaching a solid understanding of these basic blocks I could then begin to map out the best way to combine them to construct a more complex structure like a castle. In the same vein there are core building blocks one must master with option contracts prior to jumping into trading advanced spreads like condors and butterflies. All too often beginning traders want to jump into spread trades without
first achieving a sufficient knowledge of calls and puts. That’s the equiva-lent of wanting to construct a castle without first knowing the difference between a triangle and a square. You can try, but don’t be surprised if your castle ends up looking more like a shack.
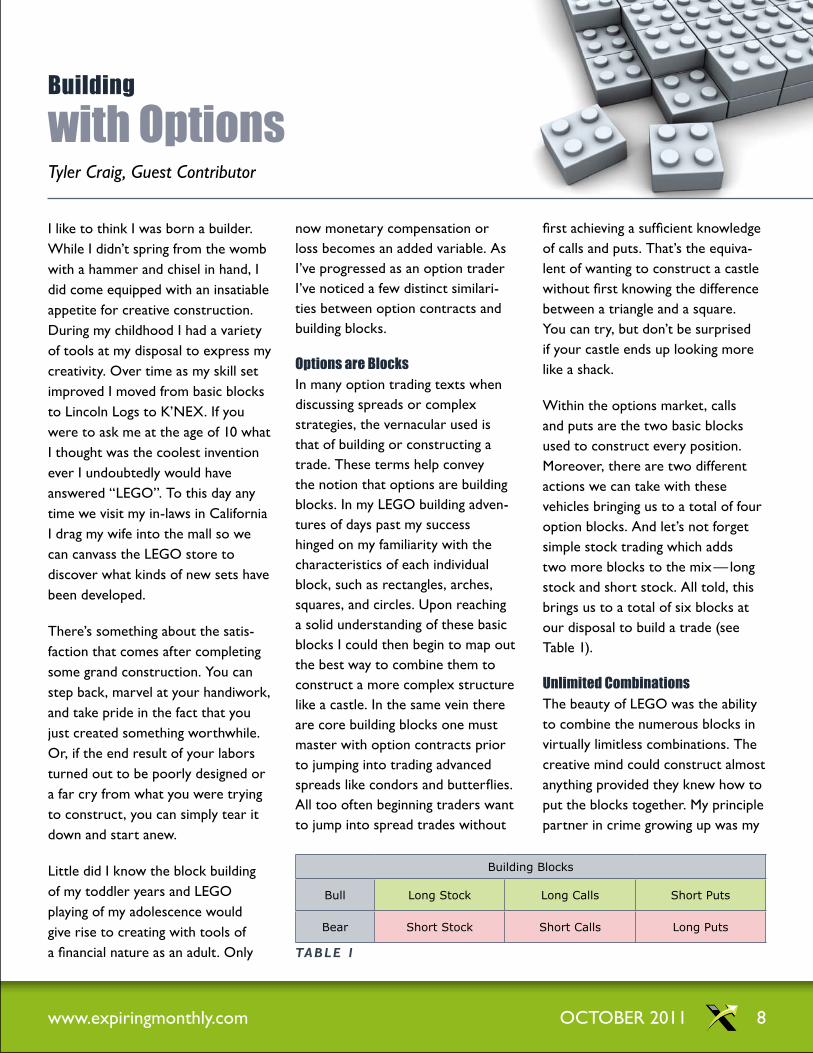
Within the options market, calls and puts are the two basic blocks used to construct every position. Moreover, there are two different actions we can take with these vehicles bringing us to a total of four option blocks. And let’s not forget simple stock trading which adds two more blocks to the mix — long stock and short stock. All told, this brings us to a total of six blocks at our disposal to build a trade (see Table 1).
Unlimited CombinationsThe beauty of LEGO was the ability to combine the numerous blocks in virtually limitless combinations. The creative mind could construct almost anything provided they knew how to put the blocks together. My principle partner in crime growing up was my
Building Blocks
Bull Long Stock Long Calls Short Puts
Bear Short Stock Short Calls Long Puts
TAble 1
www.expiringmonthly.com OCTOBER 2011 9
younger brother. As is the case with most siblings we were quite compet-itive and since I was two years older I usually held an unfair advantage. On occasion we would compete to see who could build the coolest castle or fort out of LEGO. On his first few attempts at the task my brother would combine the blocks in nonsensical ways. In the end his structure was a strange amalgama-tion of different sized blocks and colors. Despite his exuberance he failed to see that just because you can combine the blocks in unlimited combinations doesn’t mean you should. There has to be a rhyme and a reason as to which blocks you select and how or why you combine them. Having already learned this myself, my simple constructions usually won the contests.
Options are much the same. They too can be combined in limitless combinations and the creative mind can structure trades to exploit
virtually any environment. For example you could purchase a call and a put simultaneously to construct a straddle. You could purchase one put option while selling another with a different strike price to build a vertical spread. While some combi-nations make sense, others don’t. In some traders’ misguided quests to hedge every last bit of exposure they create messy, convoluted positions. Such a venture racks up transaction costs like commission and slippage and makes the position increasingly difficult to manage. The superior route is often one of simplicity.
Picture the BlocksPerhaps the greatest benefit to understanding options as building blocks is reading a risk graph. Like the actual position itself, the risk graph of a spread is the sum of its parts. Each of the six core building blocks has their own respective risk graph. The graph of a spread position then is simply a combina-tion of the graphs of each individual block. For example, a bull put spread is constructed by selling a higher strike put and buying a lower strike
put in the same expiration month. Its risk graph is the combination of the individual risk graphs of a long and short put. Learning the shape of each building block lies at the heart of risk graph analysis. Once this is accomplished, both simple and complex graphs become much easier to understand.
I’ve found the building blocks analogy to be particularly helpful in my own trading as well as when teaching others the importance of learning options from the bottom up. Next time you’re attempting to master a new spread trade try identifying the individual blocks to acquire more clarity. eM
Tyler Craig is president of TC Trading, Inc. He has personally coached hundreds of traders over the years through his contract work with one of the nation’s leading educational firms. In 2009 he began his venture into the blogosphere by starting Tyler’s Trading (www.tylerstrading.com), where he can be found giving daily market commen-tary for stocks and options.
Building with Options (continued)
Learning the shape of each building block lies at the heart of risk graph analysis.
M O N T H LY F E AT U R E
One of the most misunderstood trades is the calendar and/or time spread. Calendars, double calendars, and diagonals are common trades used by the retail public. Because time spreads are long vega, they are often presented to traders as a ‘vega hedge.’ Well, any trader that has traded when the VIX explodes will tell you this:
A calendar does NOT hedge a trader’s exposure to volatility.
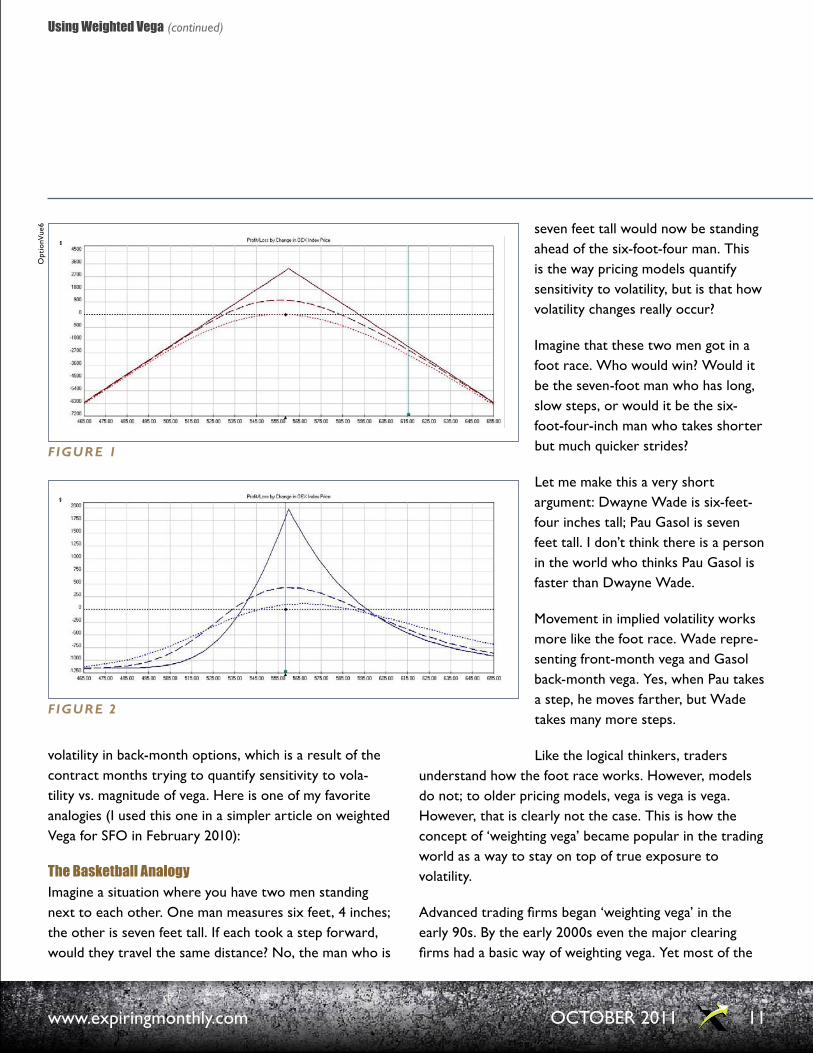
While the trader may actually get long vega, the trade itself is sensitive to volatility in multiple ways. It is one thing to be sensitive to implied volatility; in that respect, long calendars may be a bit of hedge. However, the long calendar is not a hedge against ‘realized volatility,’ the movement in the actual market. Any trader that has seen a long calendar (Figure 1) should notice how similar it looks to a straddle (Figure 2).
Because of this sensitivity to ‘realized’ volatility traders may have noticed that front-month options are more sensitive to changes in volatility than back-month options. Actually, except in rare circumstances, the sensitivity to realized volatility causes the IV in near term options to move much quicker than
Mark Sebastian
Using Weighted
Vega
OCTOBER 2011 10www.expiringmonthly.com
OCTOBER 2011 11www.expiringmonthly.com
Using Weighted Vega (continued)
volatility in back-month options, which is a result of the contract months trying to quantify sensitivity to vola-tility vs. magnitude of vega. Here is one of my favorite analogies (I used this one in a simpler article on weighted Vega for SFO in February 2010):
the Basketball analogyImagine a situation where you have two men standing next to each other. One man measures six feet, 4 inches; the other is seven feet tall. If each took a step forward, would they travel the same distance? No, the man who is
seven feet tall would now be standing ahead of the six-foot-four man. This is the way pricing models quantify sensitivity to volatility, but is that how volatility changes really occur?
Imagine that these two men got in a foot race. Who would win? Would it be the seven-foot man who has long, slow steps, or would it be the six-foot-four-inch man who takes shorter but much quicker strides?
Let me make this a very short argument: Dwayne Wade is six-feet-four inches tall; Pau Gasol is seven feet tall. I don’t think there is a person in the world who thinks Pau Gasol is faster than Dwayne Wade.
Movement in implied volatility works more like the foot race. Wade repre-senting front-month vega and Gasol back-month vega. Yes, when Pau takes a step, he moves farther, but Wade takes many more steps.
Like the logical thinkers, traders understand how the foot race works. However, models do not; to older pricing models, vega is vega is vega. However, that is clearly not the case. This is how the concept of ‘weighting vega’ became popular in the trading world as a way to stay on top of true exposure to volatility.
Advanced trading firms began ‘weighting vega’ in the early 90s. By the early 2000s even the major clearing firms had a basic way of weighting vega. Yet most of the
Figure 1
Opt
ionV
ue6
Figure 2
Using Weighted Vega (continued)
institutional world and almost the entire retail trading world has never heard of this concept. This is shocking to me, as the concept is so readily used by professionals, including the clearing firms that many institutional and retail traders use to clear trades through. Here are a few ways you can weight vega, along with a brief explanation of how the major trading firms are weighting their vega.
eyeball itI imagine that suggesting traders eyeball weighted vega sounds ridiculous. Proprietary firms spend millions of dollars and thousands of hours to develop ways to weight vega.
Proprietary trading firms have hundreds of millions of dollars at stake on every position, most of which are extremely complex, and have vega risk that can extend beyond two years. Most retail traders and even many institutional traders will not have positions that are dated much farther out than two months.
When I do my homework, before I make a single trade I have a good idea of how the relationships between the months work. It takes some study and looking at histor-ical implied volatilities, but with a little research traders should be able to estimate a simple position’s real vega sensitivity based on most points in the option cycle. Just estimating, shows an understanding of true vega exposure and will help the trader manage simple positions in a more profitable way.
One way to get some practice at this method is to watch front-month vs. back-month options trade against each other into earnings. Almost every trader is aware that the front-month options IVs explode into earnings and treats front-month differently than back-month options. Believe it or not, when traders take this into account in managing earnings plays, this is a form of weighting vega.
the dirty Vega CalculationIn Dynamic Hedging, Nassim Taleb’s first (and in my opinion best) book, almost as soon as he breaks into managing vega risk he enters the topic of weighted vega. While he was not the first to use WV, he was the first to write about it. The first method he uses takes a base number of days until expiration and then uses that number as a part of a calculation to convert all of the expiration cycles to 30 days to expiration. The VIX itself is trying to do almost the exact same thing (although it is a much more advanced formula than the one I am about to present).
The basic formula is to divide base days to expiration by days to expiration and then find the square root of that quotient, then multiply it by the raw vega or:
SQRT (Base/Days to Expiration) x Raw Vega
Personally, like VIX, I use 30 days for my base days to expiration, but many traders pick a specific month to weight everything. This method is VERY dirty and does not do much better of a job of weighting things than eyeballing it. However, it can be very helpful to use this formula for slightly more complex time spreads — things like double calendars and double diagonals or positions that have more than 2 expirations. We are including a very basic spreadsheet in this article that you may feel free to use at your leisure.
CorrelationWhile there are firms that I am certain use much more advanced methods to manage vega exposures, the most accurate, documented way to produce weighted vega is to correlate points in terms to expiration. For example, the correlation might say that when Product A month 1 has 30 days to expiration, month 2 correlates at a beta of .7 if it has 58 days to expiration, .68 if it has 59 days to expiration and .71 if it has 59 days to expiration.
OCTOBER 2011 12www.expiringmonthly.com

Using Weighted Vega (continued)
While that may seem simple, believe me it is not, because this type of correlating has to be done for every possible term difference, between every expiration month. It ends up being a very large number of calcula-tions to the point that one needs to be a combination of amateur statisti-cian and an expert with Microsoft Excel to make it work properly.
If the trader is looking for additional granularity, the trader can remove the terms month 1 and month 2 and use the specific months for the correla-tion. Thus, if December has 30 days to expiration and January has 59 days to expiration, the two months correlate at a beta of .8. This would need to be done for all days to expiration for all months. While this sounds like some work, it is also helps the modeling process bring seasonality into the correlation.
While this may be a lot of work, everyone I have talked to that has taken the time to go along this path has been happy that he or she did. It has improved his or her ability to manage every position from the simple to the complex. There are a few programs that traders can buy that will help traders write this or do it themselves (we are not giving this one away, sorry).
Looking at a 6-month chart of the SPX (Figure 3) one can see that different terms, volatilities do move differently.
While weighting one’s vega may seem like a lot of work, and something only for advanced traders, in many ways most traders do it internally already. By acknowledging that vega is not a uniform concept and that the months move in many directions up and down, traders will be
able to truly process the risk of their net position in a particular product. It will also help traders to better understand how all of their positions interact. The ability of the trader to quantify what is in front of him or her is the one of the most powerful tools a trader can have. eM
OCTOBER 2011 13www.expiringmonthly.com
Figure 3
Live
VolP
ro

www.expiringmonthly.com OCTOBER 2011 14
Can Option implied Volatility Be a Predictive Measure for
Underlying direction?Andrew Giovinazzi, Guest Contributor
I thought I would launch a cruise missile of an idea right at the readers of Expiring Monthly. At first blush someone would read that title and say, “Yeah, yeah, when the VIX is under 20 it is bullish and when the VIX is over 20 it is bearish for stocks in general.” Surprise, I am not going to talk about the VIX. But for those wondering, the market just rallied 1000 Dow handles and the VIX went from the 40s to the 30s in the first 10 days of October. There goes that theory. It thought I would use a slightly more sophisticated view of the interplay between 30-day historical (realized) volatility and 30-day implied volatility (forward looking options) and see if there is an interesting pattern to be had.
First I want to describe the action between HV30, how the underlying has moved, and IV30, how the market is pricing the next 30 days movement. Options are one of the few instru-ments that actually try to predict and price future movement. Want to see what the market has in store for your favorite momentum stock? Just check
out the IV30. You can back out the daily movement easily enough but you cannot get direction. That is the tough part and a reason many profes-sional traders limit delta whenever possible. Under certain conditions there might be something to the difference between HV30 and IV30.
If the HV30 trails the IV30 by a large number, say 10 points or more, the market is predicting a bigger move in the future than recent history. Standard trading practice (at least how I know it) would say selling options would be the way to go since the decay would destroy any reason-able action to scalp the curvatures of the position. Traders call this a frontspread. The other side of the coin has IV30 trading at a discount to HV30. Here you would want to own options to take advantage of the ride since the underlying is moving much more than the options predict. Traders call this position a backspread and look to gain from increasing option prices or scalping stock into position curvature. In general as stocks climb, paper sells
call options to lock in gains. Any trader who has been long options and short stock (backspread) on a slow melt up will attest to the feeling. They can describe this viscerally. That is just how the option world works and a reason why the call skew is negative as measured from the At the Money options for most equity and index options. Volatility compres-sion is what happens under normal circumstances as names drift upward for most equities.
What happens when the traditional order flow pattern breaks down? When paper buys options instead of sells them on the grind up? Look at Figure 1 (next page) and look at the action in HV30/IV30 for the SLV (IShares Silver Trust) prior to the collapse in the price of silver in early May. All through the month of April you note that as the SLV climbed higher and higher, IV30 stayed on top of HV30 until the relationship inverted right after the SLV crash. Paper was not selling calls into the SLV upswing; paper was buying calls into the upswing. Silver mania was gripping the market and the bubble appeared in full swing. The large spike in HV30 show the subsequent big drop in the SLV with the IV30 imploding as the market direction became clear. The key here is the launch of HV30 as SLV
If the HV30 trails the IV30 by a large number, say 10 points or more, the market is predicting a bigger move in the future than recent history.

www.expiringmonthly.com OCTOBER 2011 15
continued to climb with IV30 racing ahead of it. Is there
another example?
Now let’s examine the pricing action (Figure 2) in the
GLD prior to the recent big sellout this fall. Essentially
you see a similar pattern to the SLV. From early July
and gaining steam in August with the increase in HV30, GLD kept IV30 ahead of the underlying movement in a measureable way. More paper on balance was piling in with the increasing HV30. The key is: will buyers with the expanding underlying volatility. By early September the big sell off in the GLD had happened. The only thing
Can Option implied Volatility Be a Predictive Measure for Underlying direction? (continued)
IVol
atili
ty.c
om
Figure 2Figure 1

www.expiringmonthly.com OCTOBER 2011 16
keeping GLD up, really, is the Euro Zone crisis or most likely the metal would have seen $1500 per ounce.
Now we have this nifty idea of using two volatility measures to help pick direction. I will grant you the skew in the commodities is inverted as the call skew is positive, but the increasing HV30 on the way up is a warning flag. By using volatility this way you get to see the character of the move up as not every pop in an underlying will display this. But I found it interesting that both the big metal plays this year showed very similar circumstances in these two common volatilities measures and it looks like a reasonable
way to test highs in the next great momentum stock. There has been chatter about the Treasury bond bubble, so take a look at the same measures I identified above. Is the TLT really the next great bubble? eM
Andrew Giovinazzi started his career in the financial markets after graduating from the University of California,
Santa Cruz with a B.A. in Economics in 1989. He joined Group One, Ltd. and quickly became a member of the Pacific
Stock Exchange (and later the CBOE), where he traded both equity and index options over a 15 year span. During that period he never had a down year. At the same time, Andrew started and ran the Designated Primary Market Marker post for GroupOne on the floor of the CBOE. It became one of the highest-grossing posts for the company in 1992 and 1993. While actively trading, Andrew was instrumental in creating and managing an option trader training program for Group One. He left Group One, Ltd. to co-found Henry Capital Management in 2001. Andrew then joined Aqumin LLC (2008–2011) to help bring 3D quoting and analysis to financial data. He is Chief Options Strategist at Option Pit.
Can Option implied Volatility Be a Predictive Measure for Underlying direction? (continued)
The brokers at Price Futures Group are dedi-
cated to meeting the needs of our clients.
We have the expertise to create customized
strategies and portfolio planning encompass-
ing futures, options, spreads, cash/futures,
and unique fundamental analysis.
P r o d u c t s
E x P E r i E n c E
s E r v i c E
We Understand Strategy

www.expiringmonthly.com OCTOBER 2011 17
investing implications of the
ViX term structureBill Luby
Last month in A History of VIX Futures Roll Yields, I examined 7 ½ years of VIX futures data and identified some patterns and other notable features of the VIX term structure data. While the focus of this article was primarily on understanding movements in the VIX futures themselves, I did extend the analysis to incorporate some impli-cations for several of the VIX futures exchange-traded products (ETPs).
This month my intent is to broaden the scope of the investment impli-cations of the VIX futures term structure to include securities such as equity indices, sectors, U.S. Treasuries and commodities. In so doing, I examined the performance of a wide variety of securities during periods in which the front two months of VIX futures were in contango and also when they were in backwardation.
Research designWhile the VIX futures have been traded since March 2004, it was not until August 2006 that the CBOE began to list the front month and second month VIX futures on a continuous basis. As the front two months of VIX futures are the most sensitive to changes in future volatility expectations and also the most actively traded, the research highlighted here elected to focus exclusively on those two months.
To quickly review, contango is a term which is used to describe a market with an upwardly sloping term structure in which more distant months are more expensive than the nearer months. The opposite type of term structure is known as back-wardation and occurs when the front months are more expensive than the back months.
The data below cover August 2006 through October 2011 and aggregate 100 blocks of time in which the front two VIX futures have been in contango or backwardation, with durations lasting from one day to as many as 178 consecutive trading days.
Contango Versus BackwardationDuring the course of the five years and two months of VIX futures covered in this study, the front two months of VIX futures have been in contango approximately 73% of the time. Typically, when the VIX futures term structure flips from contango to backwardation, it remains in back-wardation for only a short period: 40% of the time backwardation lasts
only one day; while 72% of the time backwardation persists for four days or less. In fact while the maximum duration for backwardation is 63 days, the median duration is only two days. The story is similar for contango, where half of all transitions from backwardation to contango persist for three days or less. Contango is much more likely than backward-ation to persist for extended periods, however, with 32% of all instances lasting more than ten days and a median duration of four days.
I mention the dynamics of frequent short duration term structure patterns to highlight the fact that in the long run it is those few outliers where contango and backwardation persist for extended periods that has the strongest influence on aggregate performance data.
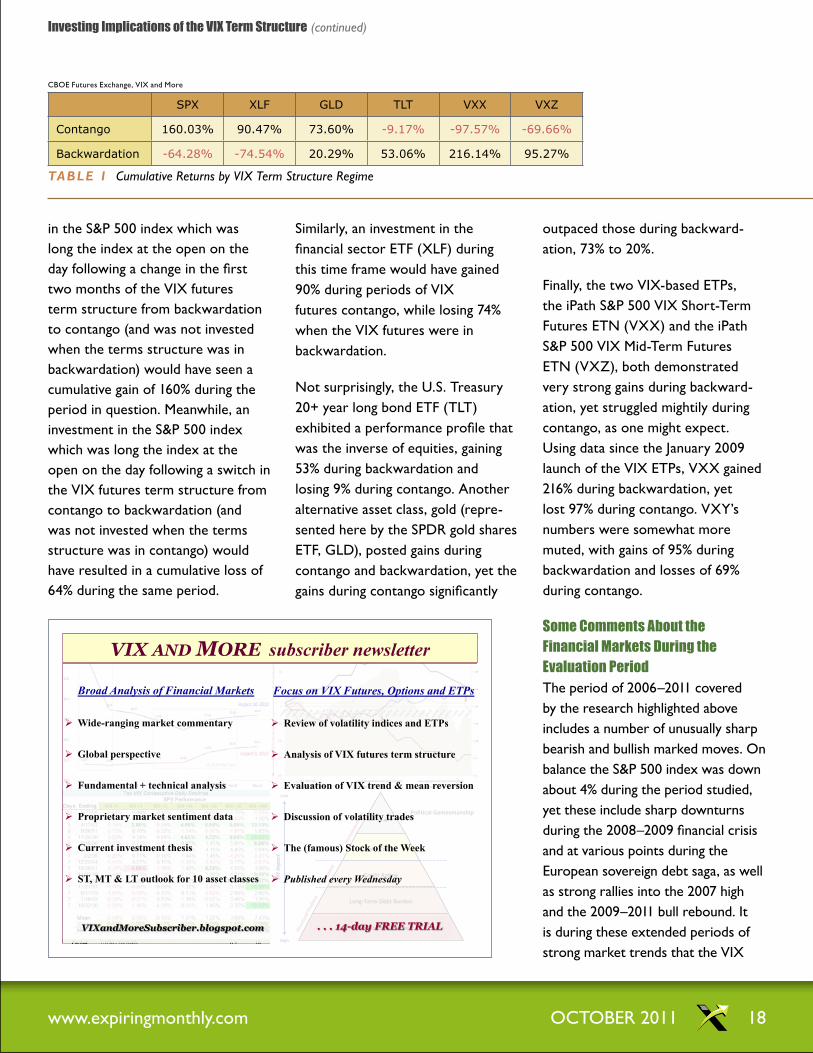
Performance data by ViX term structure RegimeTable 1 below summarizes the aggregate performance of a variety of securities under the two different volatility regimes during
the course of the past five plus years. The divergence in perfor-mance during contango and backwardation is quite remarkable. For instance, an investment
The divergence in performance during contango and backwardation is quite remarkable.
www.expiringmonthly.com OCTOBER 2011 18
in the S&P 500 index which was long the index at the open on the day following a change in the first two months of the VIX futures term structure from backwardation to contango (and was not invested when the terms structure was in backwardation) would have seen a cumulative gain of 160% during the period in question. Meanwhile, an investment in the S&P 500 index which was long the index at the open on the day following a switch in the VIX futures term structure from contango to backwardation (and was not invested when the terms structure was in contango) would have resulted in a cumulative loss of 64% during the same period.
Similarly, an investment in the financial sector ETF (XLF) during this time frame would have gained 90% during periods of VIX futures contango, while losing 74% when the VIX futures were in backwardation.
Not surprisingly, the U.S. Treasury 20+ year long bond ETF (TLT) exhibited a performance profile that was the inverse of equities, gaining 53% during backwardation and losing 9% during contango. Another alternative asset class, gold (repre-sented here by the SPDR gold shares ETF, GLD), posted gains during contango and backwardation, yet the gains during contango significantly
outpaced those during backward-ation, 73% to 20%.
Finally, the two VIX-based ETPs, the iPath S&P 500 VIX Short-Term Futures ETN (VXX) and the iPath S&P 500 VIX Mid-Term Futures ETN (VXZ), both demonstrated very strong gains during backward-ation, yet struggled mightily during contango, as one might expect. Using data since the January 2009 launch of the VIX ETPs, VXX gained 216% during backwardation, yet lost 97% during contango. VXY’s numbers were somewhat more muted, with gains of 95% during backwardation and losses of 69% during contango.
some Comments about the Financial Markets during the evaluation PeriodThe period of 2006–2011 covered by the research highlighted above includes a number of unusually sharp bearish and bullish marked moves. On balance the S&P 500 index was down about 4% during the period studied, yet these include sharp downturns during the 2008–2009 financial crisis and at various points during the European sovereign debt saga, as well as strong rallies into the 2007 high and the 2009–2011 bull rebound. It is during these extended periods of strong market trends that the VIX
investing implications of the ViX term structure (continued)
SPX XLF GLD TLT VXX VXZ
Contango 160.03% 90.47% 73.60% -9.17% -97.57% -69.66%
Backwardation -64.28% -74.54% 20.29% 53.06% 216.14% 95.27%
TAble 1 Cumulative Returns by VIX Term Structure Regime
CBOE Futures Exchange, VIX and More
Effective Governance
Long-Term Debt Burden
Credit Rating
Debt Ceiling
Political Gamesmanship
Low
High
VIX
Impa
ct
VIX AND MORE subscriber newsletter
Broad Analysis of Financial Markets
Wide-ranging market commentary
Global perspective
Fundamental + technical analysis
Proprietary market sentiment data
Current investment thesis
ST, MT & LT outlook for 10 asset classes
Focus on VIX Futures, Options and ETPs
Review of volatility indices and ETPs
Analysis of VIX futures term structure
Evaluation of VIX trend & mean reversion
Discussion of volatility trades
The (famous) Stock of the Week
Published every Wednesday
VIXandMoreSubscriber.blogspot.com . . . 14-day FREE TRIAL

www.expiringmonthly.com OCTOBER 2011 19
futures term structure is most likely to remain stuck either in contango or backwardation for weeks or months, thus providing the raw material for the extremes in performance data captured in the above graphic.
The relatively short history of VIX futures data should limit the extent to which readers ascribe any sort of statistical significance to the perfor-mance data extracted during this period. Most likely the extremes in the performance data are due to the sharp market moves and would not be present during choppier trading in which the markets remained in a much tighter trading range.
ConclusionThe above cautionary notes notwith-standing, the last five years of VIX futures data should help to make the case that markets have very different personalities during periods of extended VIX futures contango and backwardation. In the contango world, equities have a tendency to be very strong performers, while VIX-based ETPs and to a lesser extent U.S. Treasury Notes can are generally more attractive as shorts than as longs. Backwardation, on the other hand, is often an indication that short or defensive positions will be the top performers. Certainly this is the case with VIX-based ETPs,
which benefit from positive roll yield during periods of backwardation.
Extrapolating from historical data to trading strategies that should be successful in the future is always more difficult than it sounds. For starters, the volatility environment of the last three years has borne very little resemblance to the vola-tility environment that characterized the first fifteen years of the VIX. With an understanding of the VIX futures term structure, however, both short-term traders and long-term investors should be able to tailor strategies that are effective in any type of volatility regime. eM
investing implications of the ViX term structure (continued)
Fearful investors: keeping option premiums artificially high since 1987.
historical volatility
implied volatility
Condor Options Advisory Newsletter (iron condors)
Calendar Options Advisory Newsletter (time spreads)
Backtesting & Research Mentoring & [email protected](212) 203-0693
www.expiringmonthly.com OCTOBER 2011 20
trading a
short time spreadMark Sebastian
One of the more unique trades is the short time spread. It also happens to be one of my favorite trades to put on because:
1. It is Long gamma: thus it has a positive sensitivity to movement in the market place
2. It is SHORT vega: thus it has a negative correlation to volatility
As a market maker, while I never wanted to ‘choke on premium,’ I was always interested in owning premium, especially if I thought it was somewhat cheap. Like all traders, I had this constant fear that the market was going to blow up. That said, when the market is slow the constant fear of the VIX dropping endlessly was almost as great of a concern as the market blowing up.
The combo above was especially concerning in conditions such as we saw during August, September and October of this year. No trader wants to be open to the crazy swings we have seen over the last few months, but at some point volatility and the VIX are both going to drop back to 19%. By buying front month options and selling back month options the trader is somewhat insulated, as long as he or she is willing to be disciplined.
For those of you who are complaining you cannot do this trade, you are wrong. This trade can be executed using futures options at an initial margin that is comparable to buying a long calendar or putting on a butterfly. Thus, I am going to us the S&P 500 Futures Options, or ES. This will be a two-part Follow That Trade as this trade is actually still on and I want traders to see exactly how this trade plays out.
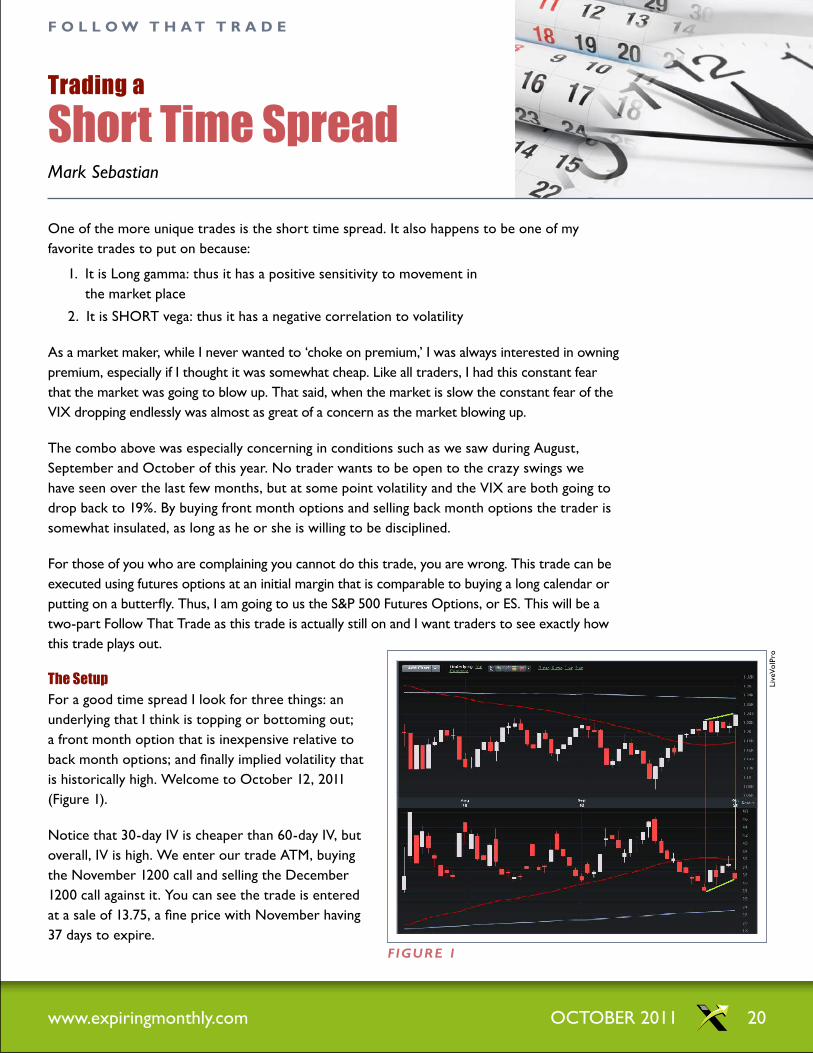
the setupFor a good time spread I look for three things: an underlying that I think is topping or bottoming out; a front month option that is inexpensive relative to back month options; and finally implied volatility that is historically high. Welcome to October 12, 2011 (Figure 1).
Notice that 30-day IV is cheaper than 60-day IV, but overall, IV is high. We enter our trade ATM, buying the November 1200 call and selling the December 1200 call against it. You can see the trade is entered at a sale of 13.75, a fine price with November having 37 days to expire.
F o l l o W t h A t t r A D e
Figure 1
Live
VolP
ro

www.expiringmonthly.com OCTOBER 2011 21
Noticing the Greeks we can see that the trade is long gamma, short vega and just a little bit short delta. The only real issue we have on this trade is whether or not we can outpace the decay on the trade.
Figure 3
Opt
ionV
ue6
As long as the trade moves fast or the spread between November and December tightens, we will be fine. Here is the trade P&L graph at onset. I would note that unlike a butterfly or a condor trades should remember that calendar’s P&Ls can move. This trade could go worse or better for us depending on how the trade moves.
Over the next week and a half, IV does dip lower and the spread tightens (as you can see in Figure 1). Since onset the P&L of the spread has varied from plus 250 to down 625. At no point does the spread push anywhere near an out on either end.
For the spreads we sold, we are trying to buy them back for 12.00–12.50 a spread, if the spread widens to much over 15.00 a spread we are out. As of Friday, October 21st, the spread is priced at 14.00 a spread, basically break even. The ES has rallied about 39.00 handles.
Follow that trade (continued)
Opt
ionV
ue6
Figure 2
Delta -8.35
Gamma 0.86
Theta -64.19
Vega -239.2
Figure 4
www.expiringmonthly.com OCTOBER 2011 22
Figure 5
Opt
ionV
ue6
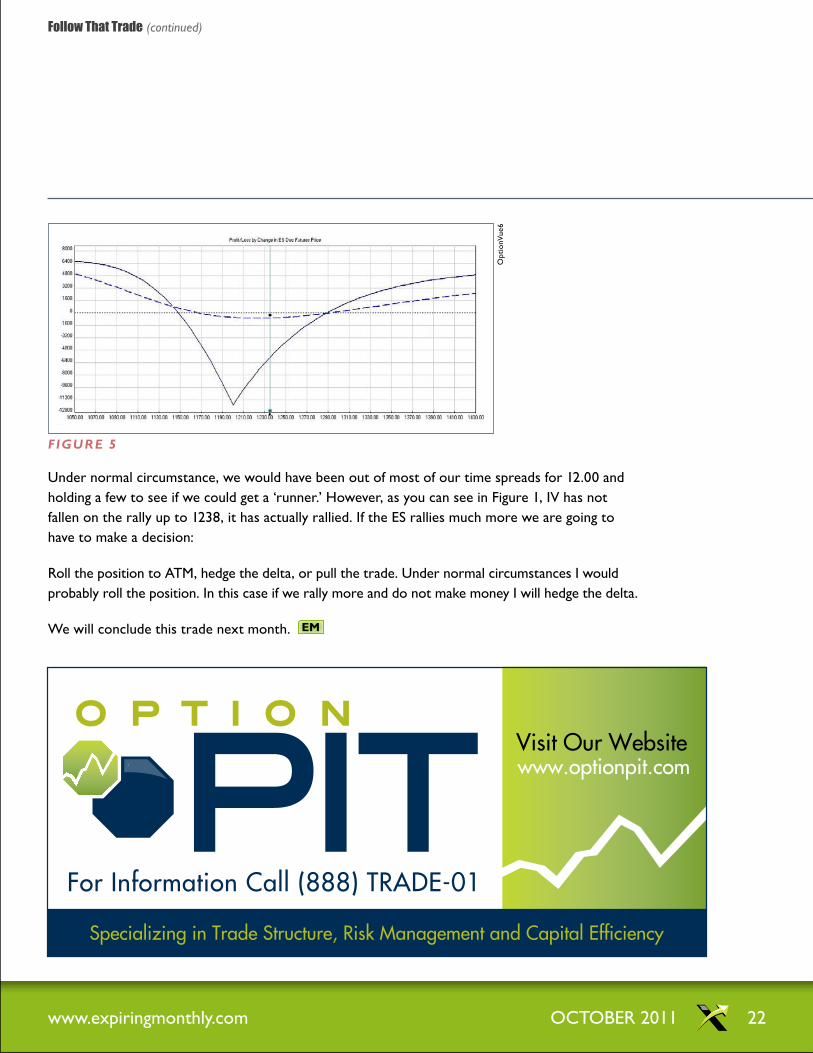
Under normal circumstance, we would have been out of most of our time spreads for 12.00 and holding a few to see if we could get a ‘runner.’ However, as you can see in Figure 1, IV has not fallen on the rally up to 1238, it has actually rallied. If the ES rallies much more we are going to have to make a decision:
Roll the position to ATM, hedge the delta, or pull the trade. Under normal circumstances I would probably roll the position. In this case if we rally more and do not make money I will hedge the delta.
We will conclude this trade next month. eM
Follow that trade (continued)
Specializing in Trade Structure, Risk Management and Capital Efficiency
www.optionpit.com
For Information Call (888) TRADE-01
Visit Our Website

www.expiringmonthly.com OCTOBER 2011 23
Orphaned
Volatility Products?Jared Woodard
The major U.S. exchanges have not been shy in recent years about launching new products, but they haven’t been as eager to help those products find audiences and mature into something useful and liquid. Here are some examples of new products that I regard as inherently good ideas:
■ Implied volatility futures and options from CBOE & CME Group These exchanges both launched volatility futures for gold, CBOE also launched options on those GVZ futures, and CME listed futures for oil volatility. There were plans for vol futures on soybeans and corn at the CME, which we all assume are now scrapped or on hold. Why? Because none of these new products has seen any trading volume to speak of.
■ Options on VIX and mini-VIX futures at CBOE I was a fan of these options even before they were launched, but no one ever traded them, probably in part because the markets were embarrassingly wide at times.
■ Realized volatility futures on EUR/USD at the CME I interviewed Robert Krause and Charles Barwis of VolX in a previous issue when these futures launched, and I still think they’re a great idea. At pixel time, however, the 3-month EUR/
USD realized volatility contract for December 2011 had an open interest of 2, and that was the only contract being reported. Hopefully the CME or some other provider will make it possible for VolX to launch addi-tional realized volatility futures and, more importantly, will help this great idea become a liquid, active reality.
■ NASDAQ OMX Alpha Index options These are options on indexes that track the daily perfor-mance of a given stock relative to SPY. For example, the AVSPY pair tracks the daily return of AAPL less the return of SPY. Options on these indexes offer a way to express an incredibly nuanced view about expected returns in the underlying pair without the complexity and cost that would be associated with two pairs of options spreads.
Why haven’t these products taken off? I think one reason is that it is a lot cheaper and easier to list new products than it is to educate customers about them, generate interest in them, and get brokerage platforms to adopt them. On the one hand, I can’t blame intermedi-aries and traders for being reticent about jumping into trading new products: there are already plenty of ways to add strange kids of risk to a portfolio without looking at new
contracts that you’ve never heard of. For intelligent, educated speculators, however, I think the issue is that no one wants to be the first to step out on the dance floor.
I encountered a problem in this vein just this week. I was trading a position for a client account, and had to choose between a newer product that did exactly what I wanted and an older, established product that wasn’t really a perfect fit but was much more liquid and more actively traded. The bid and offer quoted in the newer product were aggressively, almost hilariously wide, and the markets were so thin that I had no way of knowing what the total price for my order would have been. The older product was plenty deep, and had markets that were one tick wide. You can guess where my order flow went.
I suspect that this sort of situation has played out countless times in the last several years. It’s not that traders don’t recognize the value of innova-tion, but when the costs to trading a legitimately valuable but illiquid product might swamp the perceived edge in the product, why should customers take that risk? eM
B A C k p A g e


