32
[Date] NOVEMBER 2015
[Date]
NOVEMBER 2015

i
MONTHLY ECONOMIC REVIEW
TABLE OF CONTENTS
SELECTED ECONOMIC INDICATORS ________________________________________ 1
STOCK MARKET DEVELOPMENTS __________________________________________ 2
MONETARY DEVELOPMENTS ______________________________________________ 3
INFLATION OUTTURN ______________________________________________________ 4
Annual Inflation __________________________________________________________________ 4
Monthly Inflation _________________________________________________________________ 4
NATIONAL PAYMENTS SYSTEM ____________________________________________ 5
Zimbabwe Electronic Transfer Settlement System (ZETSS) ______________________________ 5
Card Based Transactions ___________________________________________________________ 5
Mobile and Internet Based Transactions ______________________________________________ 5
Cheque Transactions ______________________________________________________________ 5
1
MONTHLY ECONOMIC REVIEW
2015
October
2015
November
Month-on-
Month
Change
Z.S.E. Mining Index1 23.6 22.3 -5.3%
Z.S.E. Industrial Index1 131.8 117.6 -10.2%
Money Supply (US$)2 4 600.8 million 4 745.2 million 3.1%
Money Supply (M3) Annual Growth2 3.2% 7.5%
Yearly Inflation3 -3.3% -2.5%
Monthly Inflation3 -0.3% -0.2%
Nominal Lending Rate 4.0-18.0% 4.0-16.3%
Sources:
1 Zimbabwe Stock Exchange (ZSE)
2 Reserve Bank of Zimbabwe (RBZ)
3 Zimbabwe National Statistics Agency (ZIMSTAT)
SELECTED ECONOMIC INDICATORS
MONTHLY ECONOMIC REVIEW
2
STOCK MARKET DEVELOPMENTS
Global investors reduced their holdings of
investments in both emerging and frontier markets in
November 2015. This was largely due to expectations
of a hike in interest rates in the United States of
America.
In line with these developments, most of the major
African stock markets recorded losses due to portfolio
investment outflows. The losses were recorded as
follows: Egypt, 14.5%; South Africa, 6.2% and
Nigeria, 3.9%. The Kenyan stock market, however,
registered a gain of 4.5%.
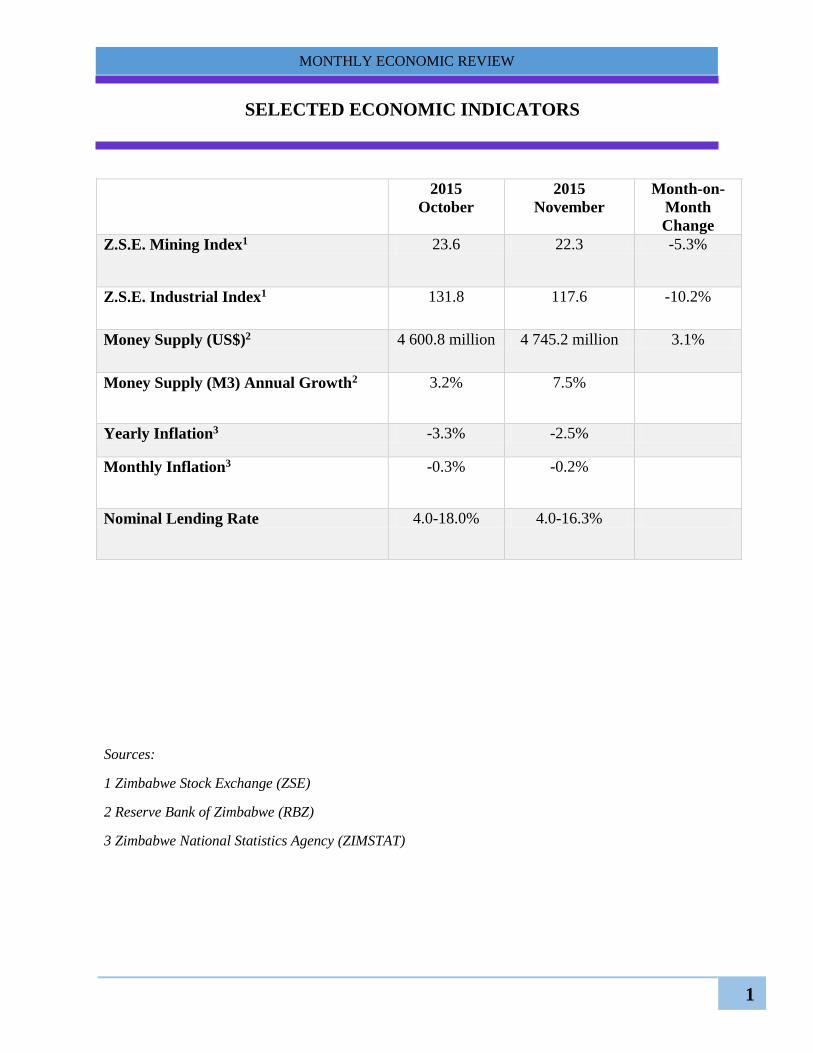
The Zimbabwe Stock Exchange (ZSE) continued on
a downward trend, with both the mining and
industrial indices registering declines during the
month of November 2015. The industrial index
declined from 130.8 points in October 2015 to 117.6
points in November 2015. Over the same period, the
mining index fell from 23.6 points to 22.3 points.
Trading volumes, however, rose from 63.8 million
shares in October 2015, to 90.4 million shares in
November 2015. Over the same period, turnover
declined from US$12.9 million to US$8.9 million.
Source: Zimbabwe Stock Exchange, 2015
0
50
100
150
200
250
30-J
an-1
3
30-M
ar-1
3
30-M
ay-1
3
30-J
ul-
13
30-S
ep-1
3
30-N
ov-1
3
31-J
an-1
4
31-M
ar-1
4
31-M
ay-1
4
31-J
ul-
14
30-S
ep-1
4
30-N
ov-1
4
31-J
an-1
5
31-M
ar-1
5
31-M
ay-1
5
31-J
ul-
15
30-S
ep-1
5
30-N
ov-1
5
Figure 1: ZSE Indices
Industrial Mining
0.00
0.50
1.00
1.50
2.00
2.50
3.00
3.50
4.00
0.00
20.00
40.00
60.00
80.00
100.00
120.00
140.00
03
-Jun
-15
13
-Jun
-15
23
-Jun
-15
03
-Jul-
15
13
-Jul-
15
23
-Jul-
15
02
-Aug
-15
12
-Aug
-15
22
-Aug
-15
01
-Sep
-15
11
-Sep
-15
21
-Sep
-15
01
-Oct
-15
11
-Oct
-15
21
-Oct
-15
31
-Oct
-15
10
-Nov
-15
20
-Nov
-15
30
-Nov
-15
VA
LU
ES
TR
AD
ED
(U
S$
MIL
LIO
NS
)
VO
LU
ME
S T
RA
DE
D (
MIL
LIO
NS
)
Figure 2: ZSE: Daily Volumes and
Values Traded
Volume Turnover
Source: Zimbabwe Stock Exchange, 2015
MONTHLY ECONOMIC REVIEW
3
The negative trading on the ZSE, coupled with losses
recorded in some blue chip counters, resulted in the
ZSE market capitalisation declining to
US$3.14 billion in November 2015, from
US$3.42 billion in October 2015.
MONETARY DEVELOPMENTS
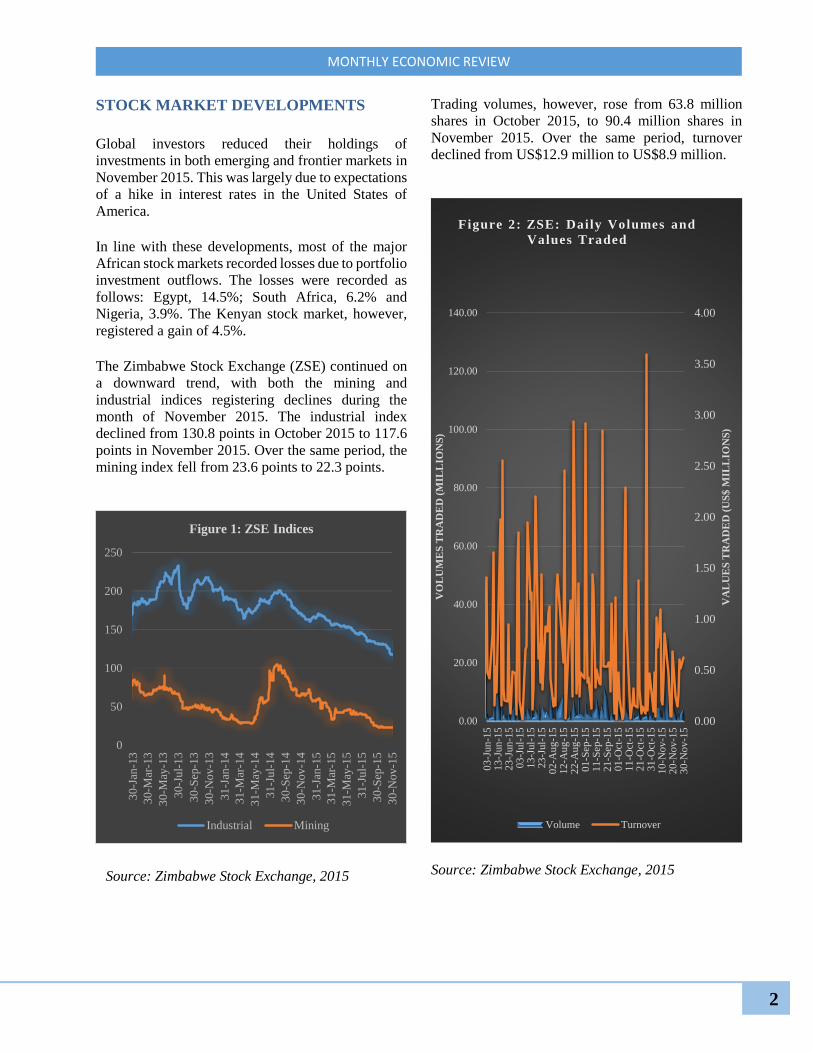
Annual growth in money supply surged to 7.5% in
November 2015, from 3.2% in October 2015. On a
monthly basis, broad money increased by 3.1% to
US$4 745.2 million in November 2015. The increases
partly reflected a marked improvement in confidence
in the banking sector.
Source: Reserve Bank of Zimbabwe, 2015
The growth in annual broad money was on account of
increases in savings deposits, 12.2%; demand
deposits, 11.8%; and long term deposits, 9.8%. Short
term deposits, however, declined by 10.9%.
The composition of deposits was as follows: demand,
51%; long term, 21%; short term, 15% and savings
deposits, 14%, as shown in Figure 4 below.
The year-on-year growth in total banking sector credit
increased to 23% in November 2015, from 20% in
October 2015. On a monthly basis, banking sector
credit increased by 2.9% in November 2015 to
US$5 345.3 million, from US$5 196.7 million in
October 2015.
Annual growth in credit to the private sector stood at
2.0% in November 2015, up from 1.9% in October
2015. Month-on-month, credit to the private sector
increased by 1.1% to US$3 901.6 million in
November 2015.
The sectorial distribution of private sector credit was
as follows: agriculture (22.5%); services including
tourism (15.3%); distribution (15.2%);
manufacturing (14.8%); mining (5.3%); transport and
communications (3.1%); and construction (1.0%).
Credit to households stood at 18.8% in November
-2
0
2
4
6
8
10
12
14
16
18
-
0.5
1.0
1.5
2.0
2.5
3.0
3.5
4.0
4.5
5.0
Mar
May Ju
l
Sep
No
v
Jan
Mar
May Ju
l
Sep
No
v
Jan
Mar
May Ju
l
Sep
No
v
%
US
$ B
ILL
ION
S
Figure 3: Money Supply
M3 M3 Annual Growth (RHS)
Short Term
15%
Long Term
21%
Demand
51%
savings
13%
Figure 4: Banking Sector Deposits
November 2015
Source: Reserve Bank of Zimbabwe, 2015
MONTHLY ECONOMIC REVIEW
4
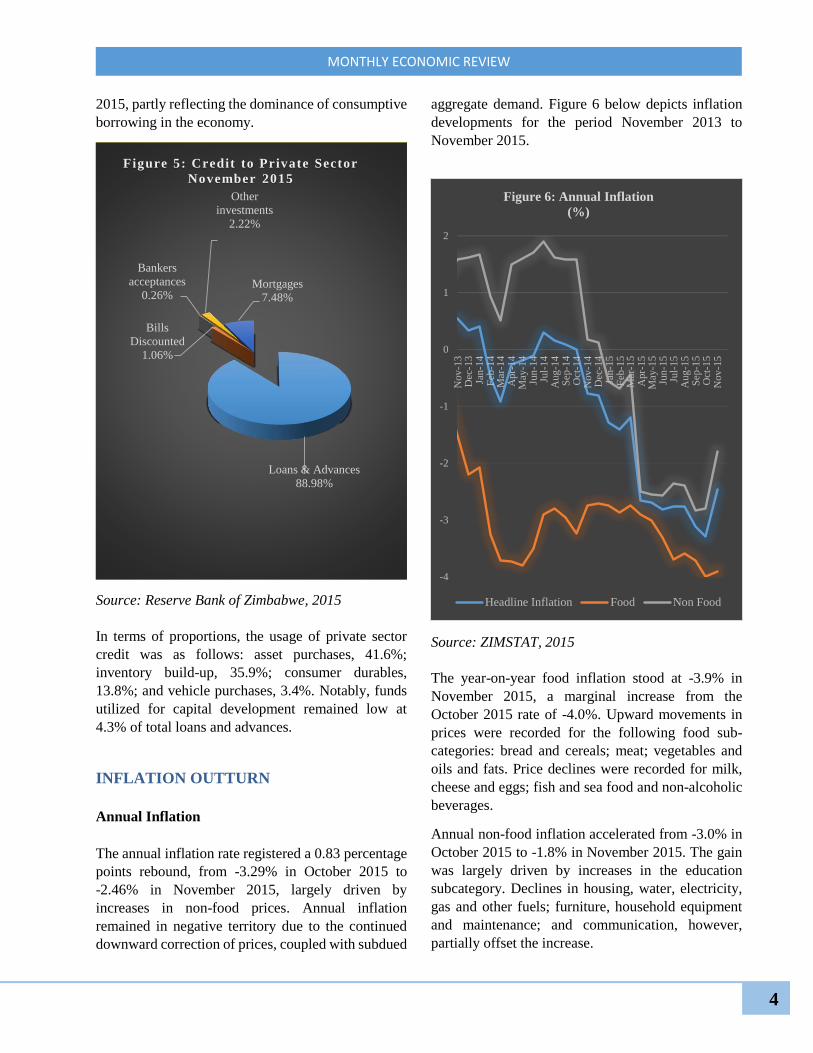
2015, partly reflecting the dominance of consumptive
borrowing in the economy.
Source: Reserve Bank of Zimbabwe, 2015
In terms of proportions, the usage of private sector
credit was as follows: asset purchases, 41.6%;
inventory build-up, 35.9%; consumer durables,
13.8%; and vehicle purchases, 3.4%. Notably, funds
utilized for capital development remained low at
4.3% of total loans and advances.
INFLATION OUTTURN
Annual Inflation
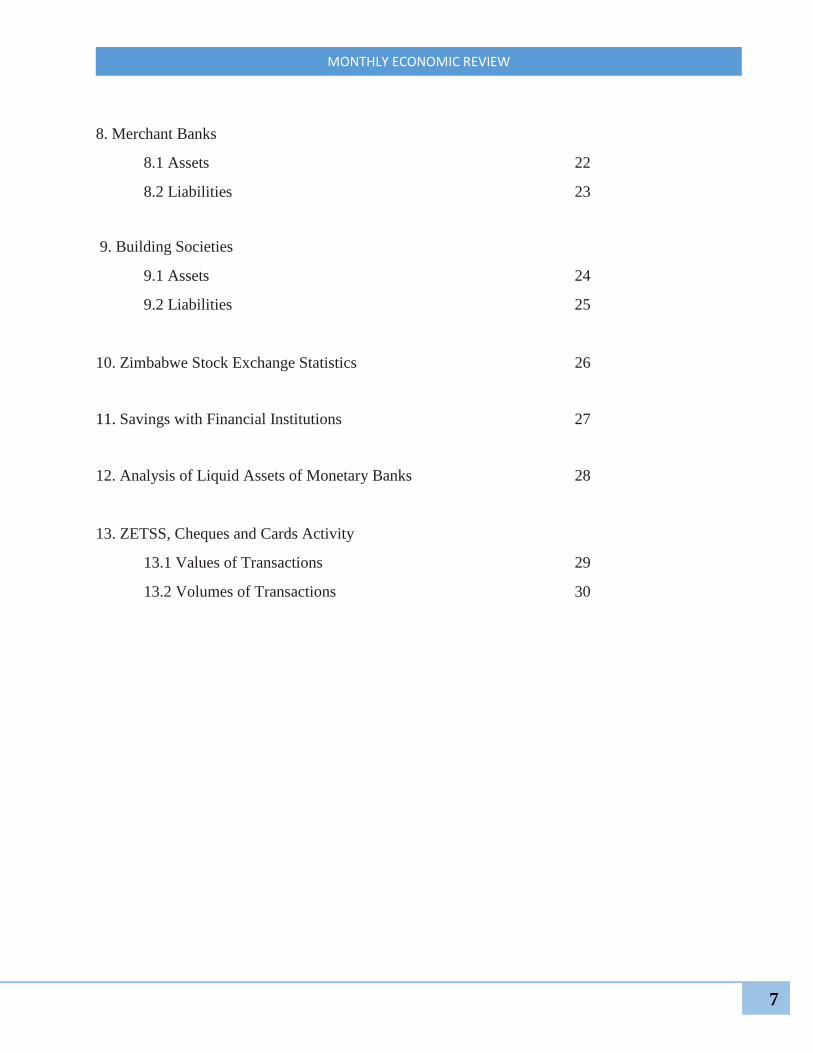
The annual inflation rate registered a 0.83 percentage
points rebound, from -3.29% in October 2015 to
-2.46% in November 2015, largely driven by
increases in non-food prices. Annual inflation
remained in negative territory due to the continued
downward correction of prices, coupled with subdued
aggregate demand. Figure 6 below depicts inflation
developments for the period November 2013 to
November 2015.
Source: ZIMSTAT, 2015
The year-on-year food inflation stood at -3.9% in
November 2015, a marginal increase from the
October 2015 rate of -4.0%. Upward movements in
prices were recorded for the following food sub-
categories: bread and cereals; meat; vegetables and
oils and fats. Price declines were recorded for milk,
cheese and eggs; fish and sea food and non-alcoholic
beverages.
Annual non-food inflation accelerated from -3.0% in
October 2015 to -1.8% in November 2015. The gain
was largely driven by increases in the education
subcategory. Declines in housing, water, electricity,
gas and other fuels; furniture, household equipment
and maintenance; and communication, however,
partially offset the increase.
Loans & Advances
88.98%
Bills
Discounted
1.06%
Bankers
acceptances
0.26%
Other
investments
2.22%
Mortgages
7.48%
Figure 5: Credit to Private Sector
November 2015
-4
-3
-2
-1
0
1
2
Nov
-13
Dec
-13
Jan-1
4F
eb-1
4M
ar-1
4A
pr-
14
May
-14
Jun
-14
Jul-
14
Aug
-14
Sep
-14
Oct
-14
Nov
-14
Dec
-14
Jan-1
5F
eb-1
5M
ar-1
5A
pr-
15
May
-15
Jun
-15
Jul-
15
Aug
-15
Sep
-15
Oct
-15
Nov
-15
Figure 6: Annual Inflation
(%)
Headline Inflation Food Non Food

MONTHLY ECONOMIC REVIEW
5
Monthly Inflation
The month-on-month inflation rate for November
2015 accelerated to 0.2%, from -0.3% in October
2015. The increase in monthly inflation was driven by
both food and non-food inflation.
Monthly food inflation rose from -0.53% in October
2015 to 0.04% in November 2015. This was on
account of increases in meat, vegetables and fruit sub-
categories.
Month-on-month, non-food inflation stood at 0.22%
in November 2015, up from -0.17% in October 2015.
The increase was largely driven by the education
subcategory.
NATIONAL PAYMENTS SYSTEM
Zimbabwe Electronic Transfer Settlement
System (ZETSS)
The value of transactions processed through the
RTGS system decreased by 10% to US$3.55 billion,
in November 2015, from US$3.96 billion in October
2015. Over the same period, the volume of
transactions registered a decrease of 8.3%, from
156 428 to 143 435 transactions.
Mobile and Internet Based Transactions
The total value of mobile and internet based
transactions declined from US$585.7 million in
October 2015, to US$571.3 million in November
2015.
Source: Reserve Bank of Zimbabwe, 2015
Card Based Transactions
Card based transactions declined from
US$484.3 million in October 2015, to
US$477.9 million in November 2015.
Cheque Transactions
The value of cheque transactions registered a
US$0.2 million increase, from US$11.8 million in
October 2015 to US$12.0 million in November 2015.
RESERVE BANK OF ZIMBABWE
DECEMBER 2015
-
0.5
1.0
1.5
2.0
2.5
3.0
3.5
4.0
4.5
5.0
Nov
-12
Mar
-13
Jul-
13
Nov
-13
Mar
-14
Jul-
14
Nov
-14
Mar
-15
Jul-
15
Nov
-15
-
50
100
150
200
250
VA
LU
E I
N U
S$
BIL
LIO
NS
VO
LU
ME
IN
TH
OU
SA
ND
S
Figure 7: ZETSS Volumes and
Values
Volume Value

6
MONTHLY ECONOMIC REVIEW
Statistical Tables
1. Monetary Statistics
1.1 Monetary Aggregates 8
1.2 Broad Money Survey 9
1.3 Analysis of Monthly Changes in Money Supply 10
1.4 Analysis of Yearly Changes in Money Supply 11
2. Sectoral Analysis of Bank Loans and Advances and Deposits
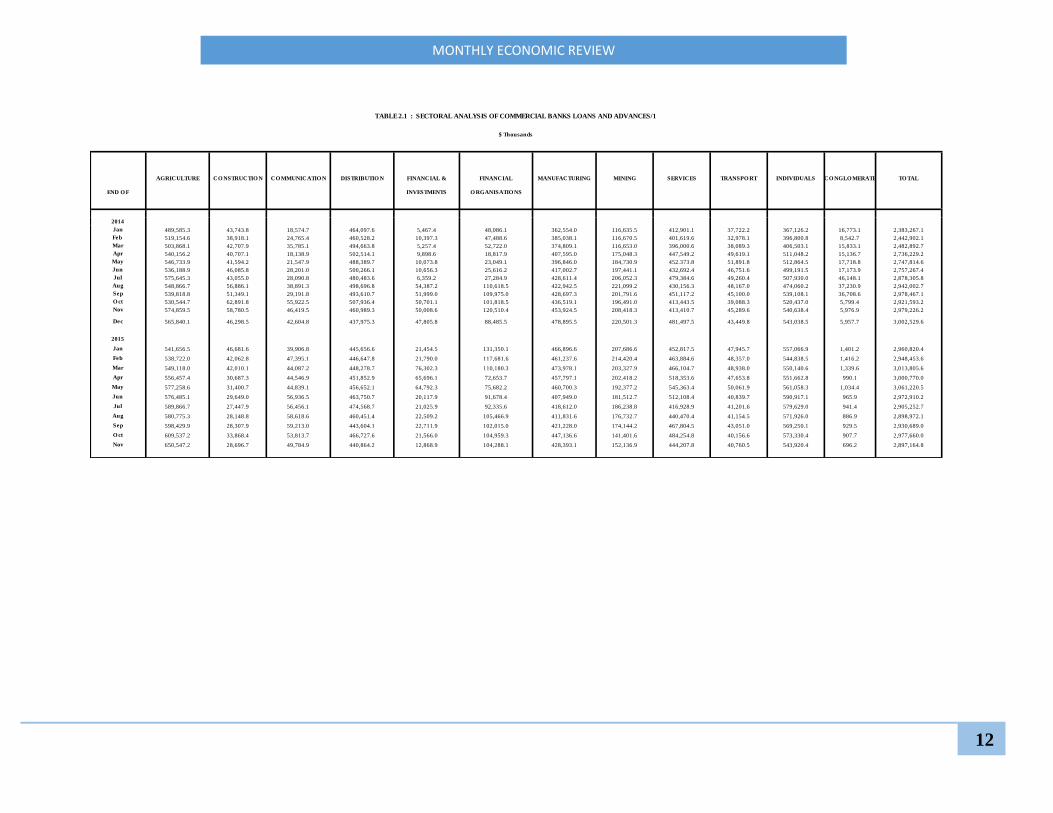
2.1 Sectoral Analysis of Commercial Banks Loans and Advances 12
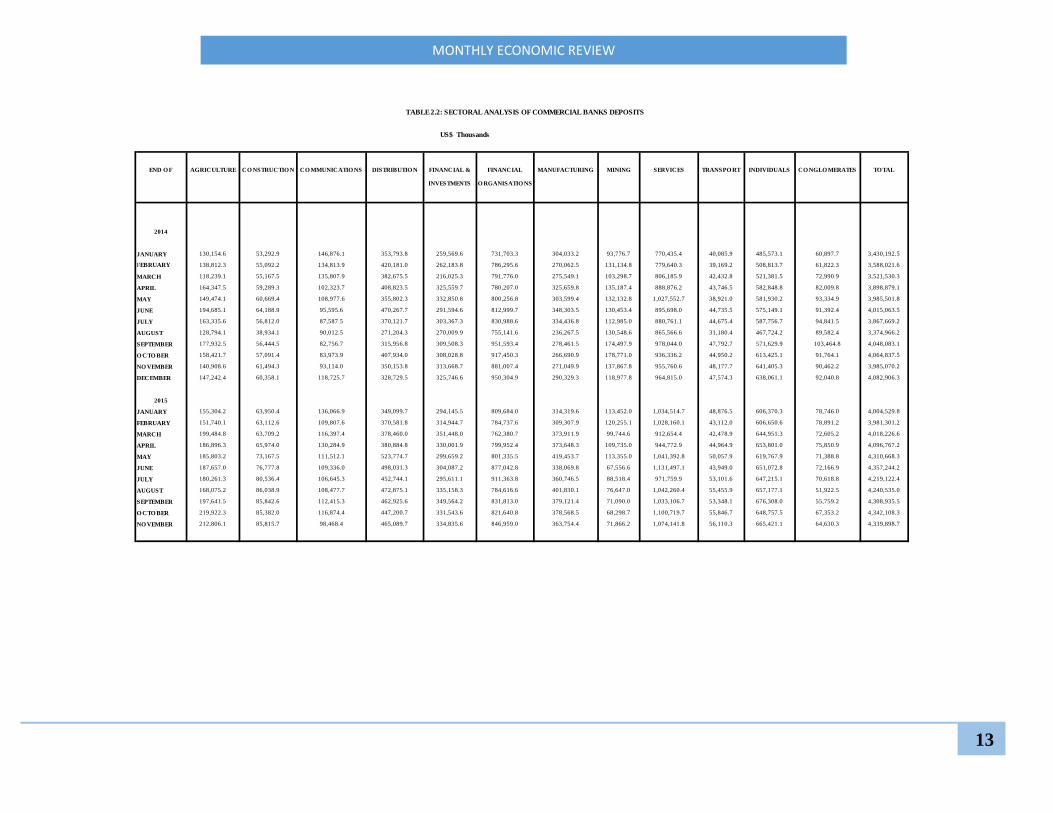
2.2 Sectoral Analysis of Commercial Banks Deposits 13
3. External Statistics
3.1 Total External Debt Outstanding by Debtor 14
4. Interest Rates
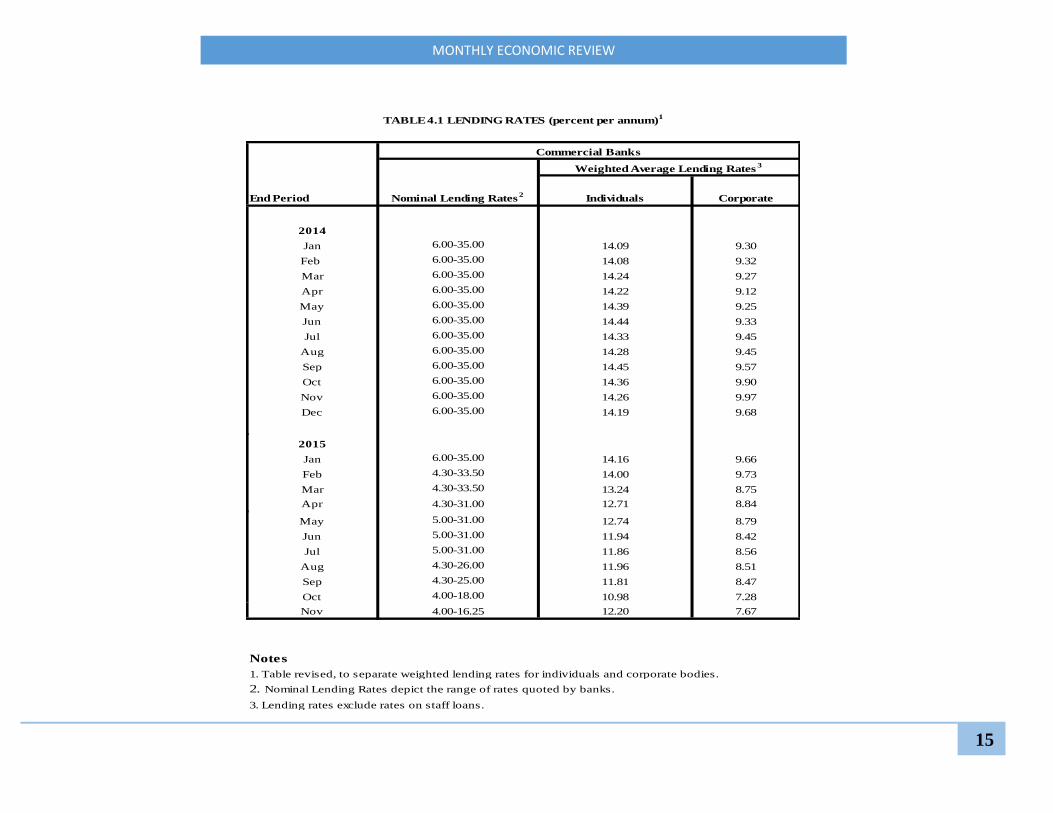
4.1 Lending Rates 15
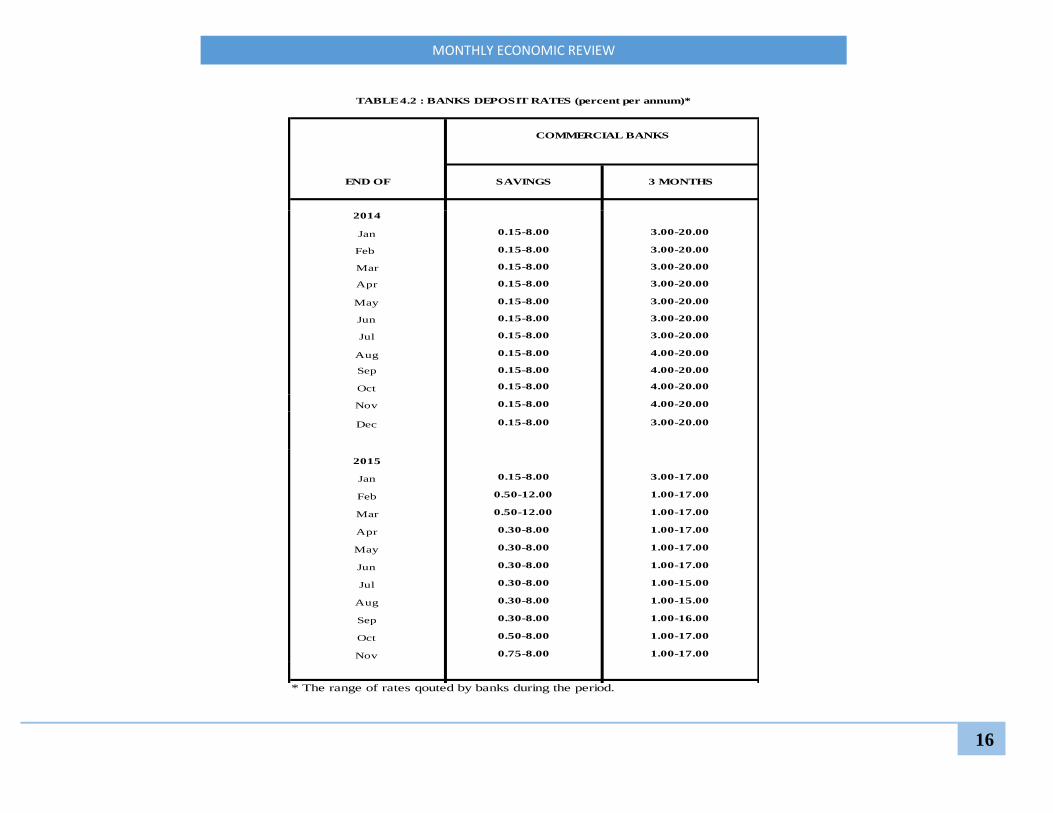
4.2 Banks Deposit Rates 16
5. Inflation
5.1 Monthly Inflation 17
5.2 Yearly Inflation 18
6. Exchange Rates 19
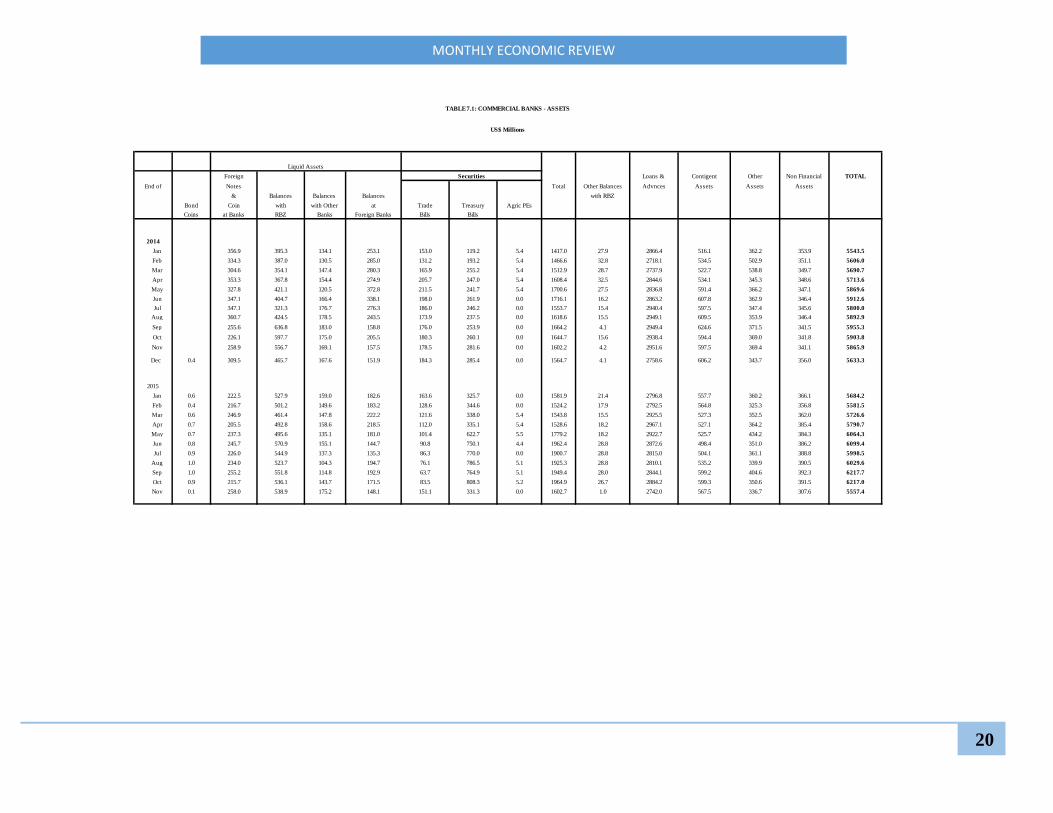
7. Commercial Banks
7.1 Assets 20
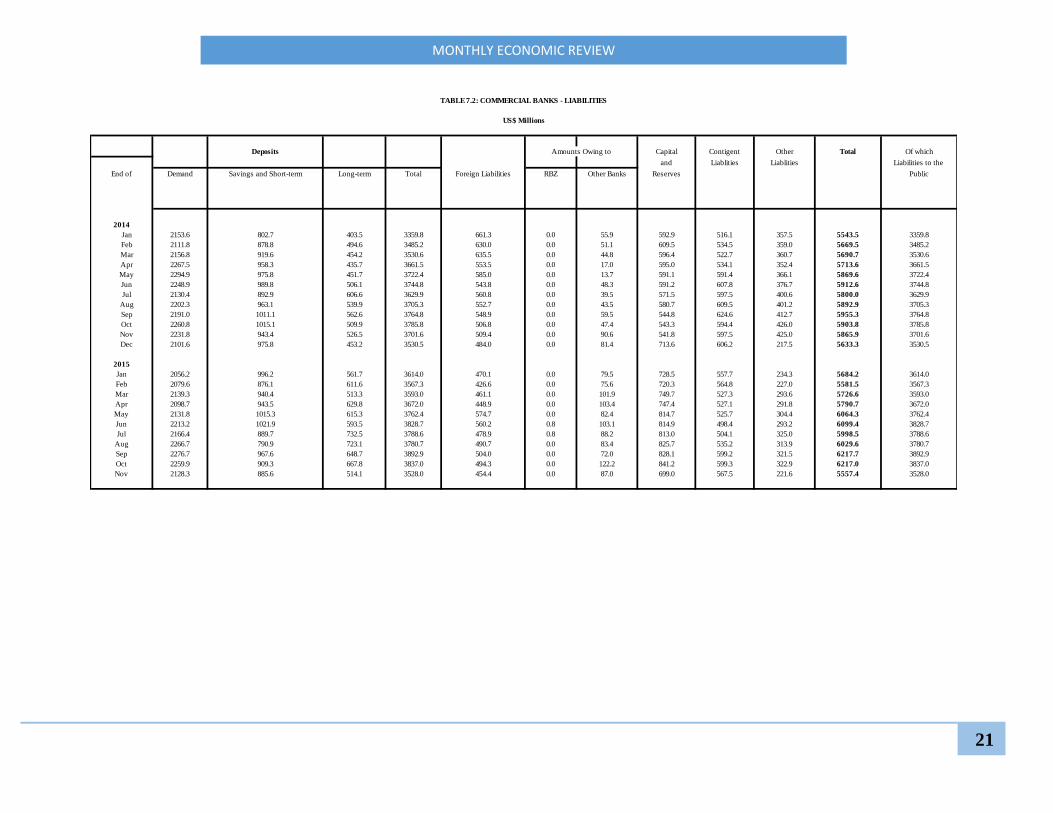
7.2 Liabilities 21
MONTHLY ECONOMIC REVIEW
7
8. Merchant Banks
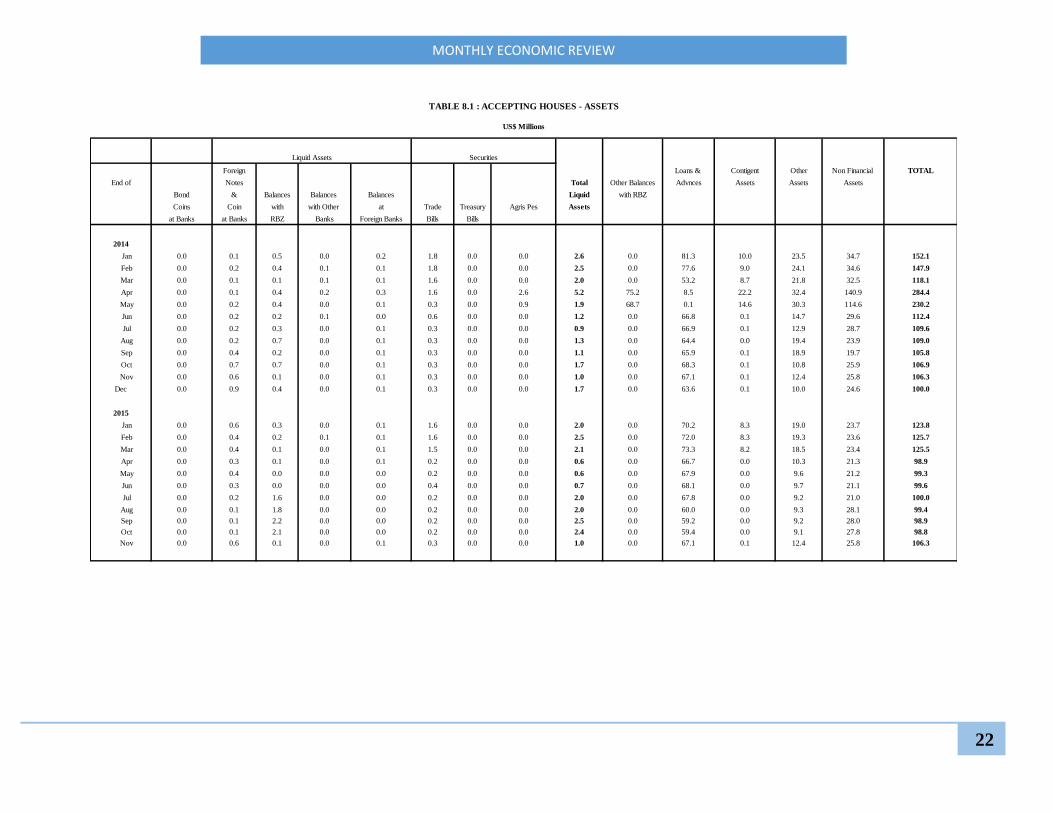
8.1 Assets 22
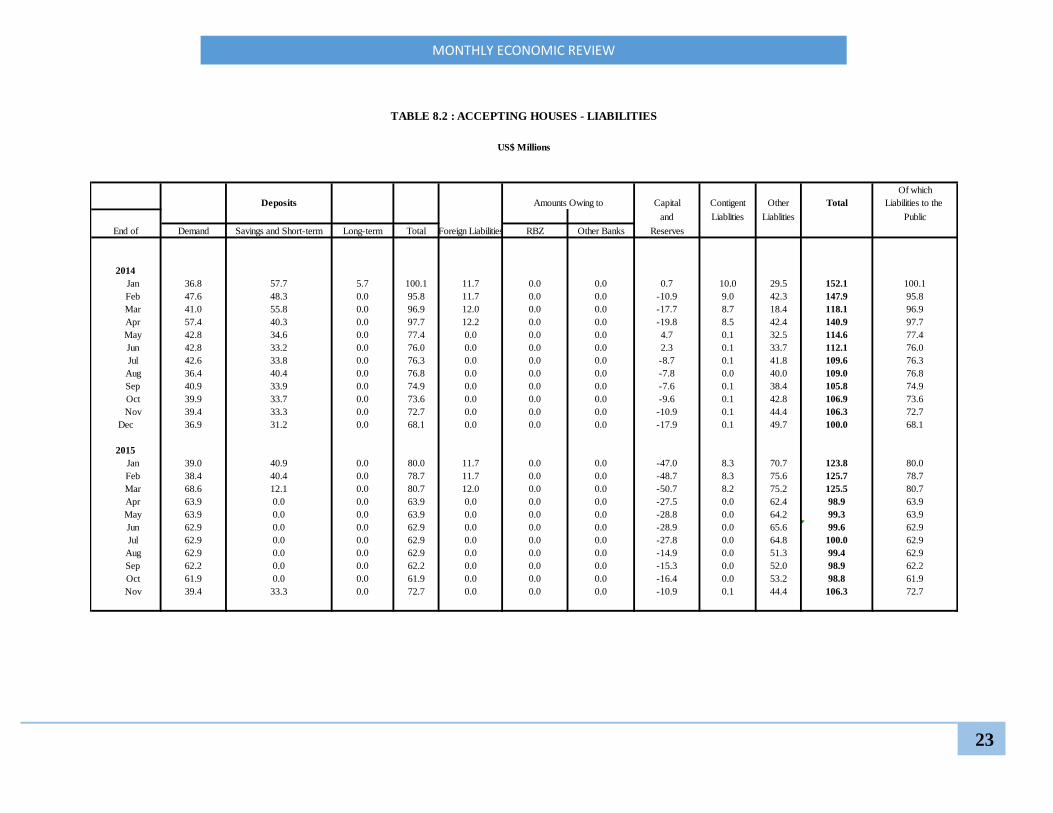
8.2 Liabilities 23
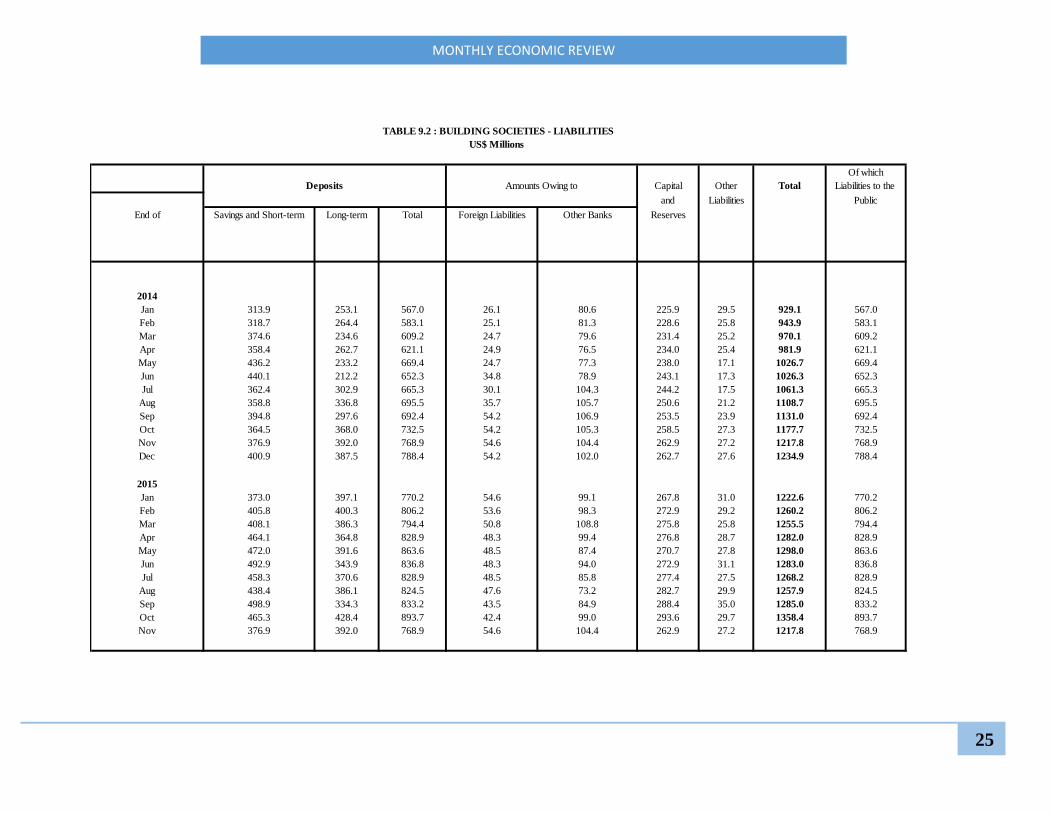
9. Building Societies
9.1 Assets 24
9.2 Liabilities 25
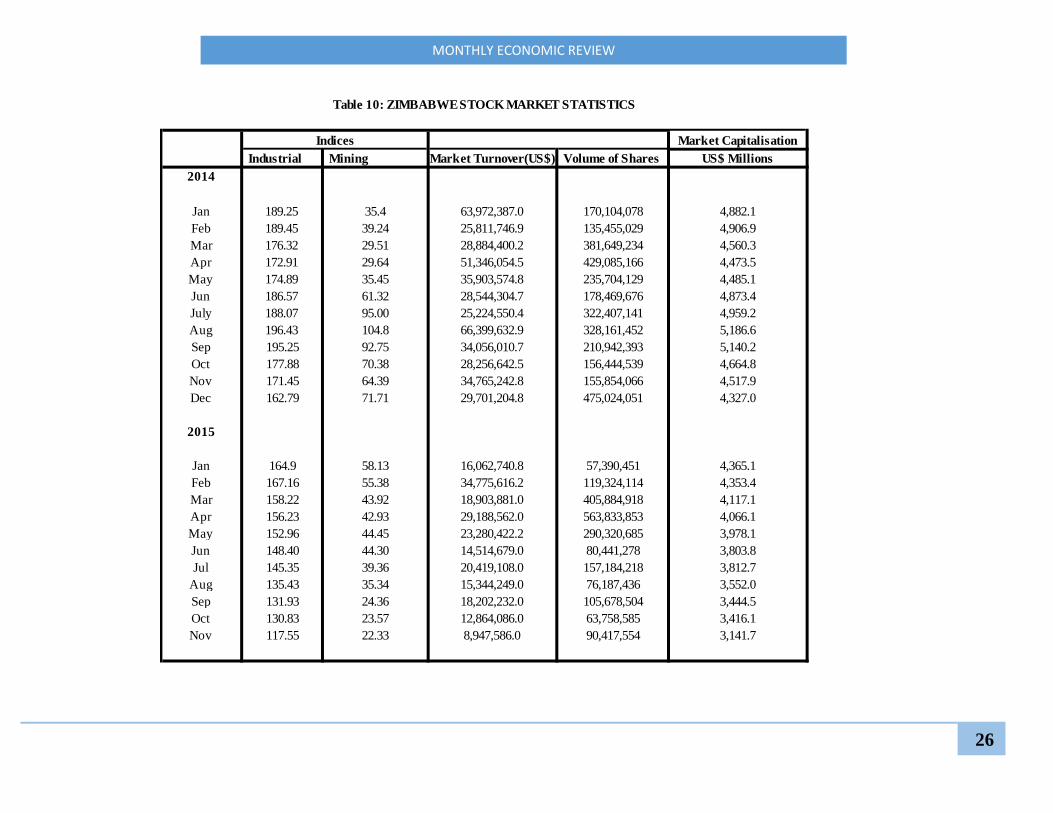
10. Zimbabwe Stock Exchange Statistics 26
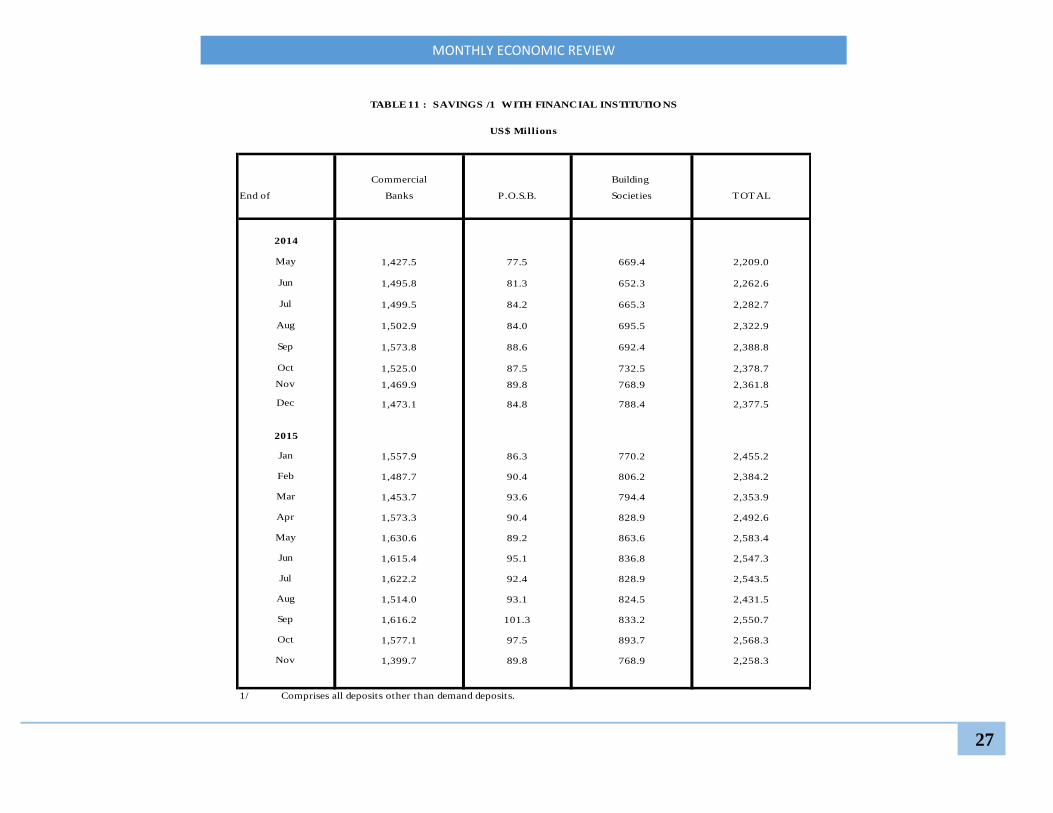
11. Savings with Financial Institutions 27
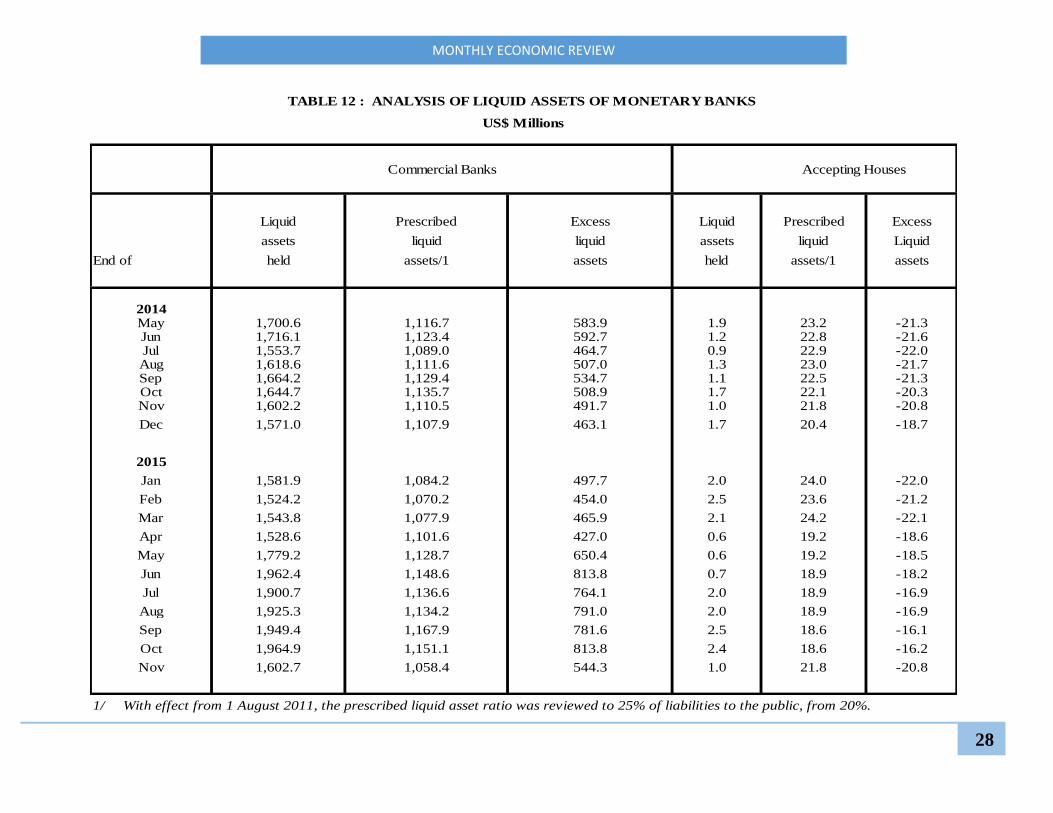
12. Analysis of Liquid Assets of Monetary Banks 28
13. ZETSS, Cheques and Cards Activity
13.1 Values of Transactions 29
13.2 Volumes of Transactions 30

8
MONTHLY ECONOMIC REVIEW
O ctober November December January February March April May June July August September O ctober November
Bond Coins 0.0 0.0 298.6 567.1 1,096.7 1,294.0 1,749.3 2,316.7 2,684.1 2,719.3 3,016.3 3,425.5 4,445.3 5,789.3
RBZ Demand Deposits 94.4 94.0 144.5 714.7 898.5 545.0 491.6 340.2 4,035.0 3,889.6 3,480.3 3,478.9 3,485.7 2,470.9
Comm. Banks Dem. Deposits 2,162,566.6 2,124,944.0 2,121,401.6 1,967,789.9 1,978,595.1 2,051,081.7 1,990,235.2 2,017,918.3 2,112,470.2 2,023,527.6 2,168,409.0 2,166,471.3 2,149,026.8 2,358,226.5
Merchant Banks Dem. Deposits 39,909.5 39,446.4 36,942.7 39,049.7 38,382.5 68,611.1 63,935.0 63,899.2 62,949.9 62,949.9 62,949.9 62,157.8 61,925.6 58,750.3
M1 2,202,570.5 2,164,484.4 2,158,787.4 2,008,121.3 2,018,972.8 2,121,531.8 2,056,411.0 2,084,474.4 2,182,139.2 2,093,086.3 2,237,855.5 2,235,533.5 2,218,883.4 2,425,237.0
Comm. Banks Savings Deposits 252,758.2 250,745.7 267,179.5 282,832.4 240,444.7 230,198.0 267,921.4 275,167.8 248,074.6 239,113.1 227,534.6 230,176.6 231,465.3 259,856.4
Building Soc. Savings Deposits 236,100.8 253,699.7 236,423.8 233,498.2 238,848.9 244,746.0 256,526.3 280,947.9 279,625.3 275,914.5 277,271.4 230,176.6 294,208.3 308,439.9
P O S B Savings Deposits 65,414.5 70,142.9 69,601.1 70,144.8 72,839.1 75,993.4 74,678.1 71,195.6 73,397.6 68,785.7 71,554.2 77,161.5 73,380.5 76,307.7
Comm. Banks U-30 Day Deposits 686,998.0 630,856.1 654,559.9 638,395.6 574,946.1 645,401.5 607,334.3 670,242.5 707,686.1 587,421.2 505,981.9 613,287.8 565,136.6 565,317.5
Merchant Banks U-30 Day Deposits 33,679.6 33,288.9 31,176.0 40,928.2 40,362.2 12,132.4 0.0 0.0 0.0 0.0 0.0 0.0 0.0 0.0
Building Soc. U- 30 Day Deposits 116,270.3 113,090.1 144,211.5 127,399.4 149,834.6 152,280.6 189,428.7 175,953.7 188,805.2 171,250.8 156,077.5 190,548.2 144,911.8 127,578.2
M2 3,593,792.1 3,516,307.8 3,561,939.1 3,401,319.9 3,336,248.4 3,482,283.7 3,452,299.9 3,557,981.9 3,679,728.0 3,435,571.5 3,476,274.9 3,635,952.6 3,527,985.9 3,762,736.7
Comm. Banks O-30 Day Deposits 492,200.3 508,747.2 449,703.8 544,421.5 597,685.2 503,769.1 618,804.9 536,216.7 509,642.0 651,895.8 622,991.6 611,608.0 628,213.7 503,244.7
Merchant Banks O-30 Day Deposits 0.0 0.0 0.0 0.0 0.0 0.0 0.0 0.0 0.0 0.0 0.0 0.0 0.0 0.0
Building Soc. O- 30 Day Deposits 337,930.1 359,491.3 365,334.8 366,978.6 375,166.9 355,362.1 340,739.4 364,490.5 326,111.5 351,579.9 340,974.7 303,177.5 409,350.0 444,267.1
Building Soc. Other Share Deposits 11,266.6 11,266.6 11,266.6 11,266.6 11,266.6 11,266.6 11,266.6 11,266.6 11,266.6 11,266.6 11,266.6 11,266.6 11,266.6 11,266.6
P O S B Time Deposits 22,070.6 19,652.7 15,174.4 16,138.8 17,519.8 17,638.5 15,733.8 18,011.8 17,261.6 23,646.5 21,540.3 24,019.0 24,010.2 23,668.6
M3 4,457,259.7 4,415,465.6 4,403,418.7 4,340,125.3 4,337,886.9 4,370,320.0 4,438,844.6 4,487,967.5 4,544,009.7 4,473,960.3 4,473,048.2 4,586,023.7 4,600,826.4 4,745,183.7
TABLE 1.1 : MO NETARY AGGREGATES
US$ Thousands
20152014
MONTHLY ECONOMIC REVIEW
9
SEPTEMBER O CTO BER NO VEMBER DECEMBER JANUARY FEBRUARY MARCH APRIL MAY JUNE JULY AUGUST SEPTEMBER O CTO BER NO VEMBER
NET FO REIGN ASSETS -536,234.0 -598,846.1 -767,824.4 -719,401.4 -714,190.6 -763,306.5 -565,959.3 -636,028.1 -681,066.5 -775,512.6 -723,772.8 -727,785.7 -715,689.4 -822,417.2 -771,548.0
Assets 1,105,902.8 999,042.7 827,514.2 896,179.7 830,959.4 737,833.5 816,079.6 755,493.4 811,200.4 926,353.7 843,689.2 867,447.1 889,018.6 784,372.6 667,350.7
Reserve Bank (RBZ) 620,484.9 508,155.9 334,534.3 363,181.1 356,661.9 280,889.9 282,170.1 282,900.6 303,218.6 453,986.1 395,771.0 360,705.6 360,255.9 335,321.7 300,180.5
Deposit Money Banks (DMBs) 414,981.4 432,341.0 416,989.8 463,112.7 405,880.7 400,473.5 469,563.3 424,368.1 418,721.9 390,608.3 361,517.6 428,702.8 448,219.8 387,305.0 310,522.6
Other Banking Institutions (OBIs) \1 70,436.5 58,545.8 75,990.2 69,886.0 68,416.9 56,470.0 64,346.2 48,224.7 89,260.0 81,759.3 86,400.6 78,038.7 80,542.9 61,745.9 56,647.6
Liabilities \2 -1,642,136.8 -1,597,888.8 -1,595,338.6 -1,615,581.1 -1,545,150.0 -1,501,140.0 -1,382,038.9 -1,391,521.5 -1,492,266.9 -1,701,866.3 -1,567,462.0 -1,595,232.7 -1,604,707.9 -1,606,789.8 -1,438,898.6
RBZ 1,037,740.5 1,035,611.2 1,030,053.8 1,020,936.5 1,007,096.0 1,009,161.8 858,095.4 894,207.5 868,931.4 1,093,306.3 1,039,959.7 1,056,817.9 1,057,080.8 1,069,972.4 1,048,664.8
DMBs 550,158.8 508,060.2 510,711.1 540,423.0 483,463.5 438,356.5 473,182.2 448,998.0 574,792.7 560,305.8 478,956.0 490,791.1 504,085.0 494,458.0 347,787.2
OBIs 54,237.5 54,217.5 54,573.7 54,221.6 54,590.6 53,621.8 50,761.3 48,315.9 48,542.8 48,254.1 48,546.3 47,623.8 43,542.1 42,359.5 42,446.6
NET DO MESTIC ASSETS 4,924,736.6 5,056,105.8 5,183,290.0 5,122,820.1 5,054,316.0 5,101,193.5 4,936,279.4 5,074,872.7 5,169,034.0 5,319,522.4 5,197,733.1 5,200,833.8 5,301,713.1 5,423,243.6 5,516,731.6
DO MESTIC CREDIT 4,267,182.2 4,331,335.1 4,352,932.2 4,378,653.6 4,231,495.4 4,249,052.3 4,371,027.6 4,529,777.2 4,817,875.2 4,869,072.4 4,981,511.5 5,029,107.1 5,079,842.4 5,196,662.7 5,345,272.0
Claims on Government (net) 442,435.9 470,504.6 462,425.7 515,636.4 544,026.1 549,179.2 537,675.3 665,258.8 950,594.0 1,074,237.6 1,160,044.8 1,192,006.7 1,182,354.0 1,253,218.7 1,359,827.4
RBZ -35,915.4 -14,433.2 -14,031.5 -25,063.7 -12,594.0 -12,908.0 -22,274.1 98,377.6 97,847.8 91,807.5 243,082.9 244,517.6 254,297.8 271,997.2 314,096.4
DMBs 426,769.3 433,084.8 443,478.0 487,962.9 504,696.7 510,080.3 500,344.5 498,836.6 784,428.5 904,112.3 845,865.3 860,228.9 838,982.9 890,154.0 954,556.6
OBIs 51,582.0 51,852.9 32,979.1 52,737.2 51,923.4 52,007.0 59,604.9 68,044.6 68,317.8 78,317.8 71,096.6 87,260.2 89,073.3 91,067.5 91,174.4
Claims on Public Enterprises 72,390.6 72,375.0 66,661.0 66,750.2 64,967.7 68,944.3 71,543.2 102,474.3 104,306.3 53,148.2 48,641.8 56,508.0 54,523.7 84,877.1 83,806.0
RBZ 0.0 0.0 0.0 0.0 0.0 0.0 0.0 737.3 1,087.1 1,189.1 1,931.5 2,098.7 2,423.7 30,362.6 30,375.1
DMBs 72,390.6 72,375.0 66,661.0 66,750.2 64,967.7 68,944.3 69,816.8 100,742.9 102,436.0 51,254.0 46,510.3 53,130.2 50,787.7 53,348.0 52,504.5
Agri-PEs 0.0 0.0 0.0 0.0 0.0 0.0 0.0 0.0 0.0 0.0 0.0 0.0 0.0 0.0 0.0
Other 72,390.6 72,375.0 66,661.0 66,750.2 64,967.7 68,944.3 69,816.8 100,742.9 102,436.0 51,254.0 46,510.3 53,130.2 50,787.7 53,348.0 52,504.5
OBIs 0.0 0.0 0.0 0.0 0.0 0.0 1,726.4 994.2 783.2 705.1 200.0 1,279.1 1,312.2 1,166.5 926.4
Claims on Private Sector 3,752,355.7 3,788,455.5 3,823,845.6 3,796,267.1 3,622,501.6 3,630,928.8 3,761,809.1 3,762,044.1 3,762,974.9 3,741,686.6 3,772,824.9 3,780,592.5 3,842,964.7 3,858,567.0 3,901,638.6
RBZ 34,725.3 34,725.3 34,725.3 34,725.3 34,725.3 34,725.3 31,409.0 31,558.0 31,155.6 51,689.8 66,722.4 92,768.9 67,359.3 75,959.6 77,442.5
DMBs 3,021,389.7 3,016,750.9 3,036,795.2 3,010,101.6 2,835,002.6 2,824,415.9 2,960,892.4 2,948,993.7 2,960,917.8 2,900,630.1 2,910,157.5 2,875,477.3 2,956,930.6 2,950,844.9 2,981,759.1
OBIs 696,240.7 736,979.3 752,325.1 751,440.3 752,773.8 771,787.7 769,507.7 781,492.4 770,901.6 789,366.8 795,945.0 812,346.3 818,674.8 831,762.5 842,437.0
O THER ITEMS (NET) 657,554.4 724,770.7 830,357.8 744,166.4 822,820.5 852,141.2 565,251.8 545,095.4 351,158.7 450,450.0 216,221.6 171,726.7 221,870.7 226,580.9 171,459.6
BRO AD MO NEY (M3) 4,388,502.6 4,457,259.7 4,415,465.6 4,403,418.7 4,340,125.3 4,337,887.0 4,370,320.1 4,438,844.6 4,487,967.5 4,544,009.7 4,473,960.3 4,473,048.2 4,586,023.7 4,600,826.4 4,745,183.7
1. Building societies and P. O. S. B.
2. Sign reversal.
TABLE 1.2 : BROAD MONEY SURVEY
US$ Thousands
20152014

MONTHLY ECONOMIC REVIEW
10
O CTO BER NO VEMBER DECEMBER JANUARY FEBRUARY MARCH APRIL MAY JUNE JULY AUGUST SEPTEMBER O CTO BER NO VEMBER
NET FO REIGN ASSETS -62,612.2 -168,978.3 48,423.1 5,210.8 -49,115.9 197,347.2 -70,068.7 -45,038.4 -94,446.1 51,739.9 -4,012.9 12,096.3 -106,727.8 50,869.2
Assets -106,860.1 -171,528.5 68,665.5 -65,220.3 -93,125.9 78,246.1 -60,586.2 55,707.0 115,153.3 -82,664.5 23,757.8 21,571.5 -104,646.0 -117,021.9
Reserve Bank (RBZ) -112,329.0 -173,621.7 28,646.8 -6,519.2 -75,771.9 1,280.1 730.6 20,317.9 150,767.5 -58,215.1 -35,065.4 -449.7 -24,934.2 -35,141.2
Deposit Money Banks (DMBs) 17,359.6 -15,351.2 46,122.9 -57,232.0 -5,407.1 69,089.7 -45,195.2 -5,646.2 -28,113.6 -29,090.7 67,185.1 19,517.0 -60,914.8 -76,782.4
Other Banking Institutions (OBIs) \1 -11,890.7 17,444.4 -6,104.2 -1,469.1 -11,946.9 7,876.2 -16,121.6 41,035.3 -7,500.7 4,641.3 -8,361.9 2,504.2 -18,797.0 -5,098.3
Liabilities \2 44,248.0 2,550.2 -20,242.5 70,431.1 44,010.0 119,101.1 -9,482.6 -100,745.5 -209,599.4 134,404.3 -27,770.7 -9,475.2 -2,081.9 167,891.2
RBZ -2,129.4 -5,557.4 -9,117.3 -13,840.5 2,065.8 -151,066.4 36,112.1 -25,276.1 224,375.0 -53,346.7 16,858.2 262.9 12,891.6 -21,307.6
DMBs -42,098.6 2,651.0 29,711.9 -56,959.6 -45,107.0 34,825.7 -24,184.2 125,794.7 -14,486.9 -81,349.8 11,835.0 13,293.9 -9,627.0 -146,670.7
OBIs -20.0 356.2 -352.1 369.0 -968.8 -2,860.4 -2,445.4 226.9 -288.7 292.2 -922.5 -4,081.6 -1,182.7 87.1
NET DO MESTIC ASSETS \3 131,369.2 127,184.2 -60,469.9 -68,504.1 46,877.5 -164,914.1 138,593.3 94,161.3 150,488.4 -121,789.3 3,100.7 100,879.2 121,530.5 93,488.0
DO MESTIC CREDIT 64,152.8 21,597.2 25,721.4 -147,158.2 17,556.9 121,975.3 158,749.6 288,098.0 51,197.2 112,439.1 47,595.6 50,735.3 116,820.4 148,609.3
Claims on Government (net) 28,068.6 -8,078.9 53,210.7 28,389.7 5,153.1 -11,503.9 127,583.5 285,335.2 123,643.6 85,807.2 31,961.9 -9,652.6 70,864.7 106,608.7
RBZ 21,482.2 401.6 -11,032.2 12,469.7 -314.0 -9,366.0 120,651.7 -529.8 -6,040.3 151,275.4 1,434.7 9,780.2 17,699.4 42,099.2
DMBs 6,315.6 10,393.2 44,484.8 16,733.8 5,383.6 -9,735.8 -1,507.9 285,591.8 119,683.9 -58,247.0 14,363.6 -21,245.9 51,171.1 64,402.6
OBIs 270.8 -18,873.7 19,758.1 -813.8 83.5 7,597.9 8,439.7 273.1 10,000.0 -7,221.2 16,163.6 1,813.1 1,994.2 106.9
Claims on Public Enterprises -15.6 -5,714.0 89.2 -1,782.4 3,976.6 2,598.9 30,931.2 1,832.0 -51,158.1 -4,506.4 7,866.2 -1,984.3 30,353.4 -1,071.0
RBZ 0.0 0.0 0.0 0.0 0.0 0.0 737.3 349.8 102.0 742.4 167.2 325.0 27,938.9 12.5
DMBs -15.6 -5,714.0 89.2 -1,782.4 3,976.6 872.5 30,926.1 1,693.1 -51,182.0 -4,743.6 6,619.9 -2,342.5 2,560.3 -843.4
Agri-PEs -1,515.5 -1,515.5 -1,516.5 -1,517.5 -1,518.5 -1,519.5 -1,520.5 -1,521.5 -1,522.5 -1,523.5 -1,524.5 -1,525.5 -1,526.5 -1,527.5
Other 1,499.9 -4,198.5 1,605.7 -264.9 5,495.1 2,392.0 32,446.6 3,214.7 -49,659.5 -3,220.1 8,144.4 -816.9 4,086.8 684.1
OBIs 0.0 0.0 0.0 0.0 0.0 1,726.4 -732.2 -211.0 -78.1 -505.2 1,079.1 33.1 -145.7 -240.1
Claims on Private Sector 36,099.8 35,390.1 -27,578.5 -173,765.5 8,427.2 130,880.3 234.9 930.9 -21,288.3 31,138.3 7,767.5 62,372.2 15,602.3 43,071.6
RBZ 0.0 0.0 0.0 0.0 0.0 -3,316.3 149.0 -402.4 20,534.2 15,032.7 26,046.5 -25,409.6 8,600.4 1,482.9
DMBs -4,638.8 20,044.3 -26,693.6 -175,099.0 -10,586.7 136,476.5 -11,898.7 11,924.1 -60,287.7 9,527.4 -34,680.2 81,453.3 -6,085.7 30,914.2
OBIs 40,738.6 15,345.8 -884.9 1,333.5 19,013.9 -2,280.0 11,984.7 -10,590.8 18,465.2 6,578.2 16,401.3 6,328.5 13,087.7 10,674.5
O THER ITEMS (NET) 67,216.3 105,587.1 -86,191.4 78,654.1 29,320.6 -286,889.4 -20,156.4 -193,936.7 99,291.2 -234,228.4 -44,494.9 50,144.0 4,710.2 -55,121.3
BRO AD MO NEY (M3) 68,757.0 -41,794.1 -12,046.9 -63,293.4 -2,238.4 32,433.1 68,524.5 49,122.9 56,042.3 -70,049.4 -912.2 112,975.5 14,802.7 144,357.2
Broad Money (M3) 1.6% -0.9% -0.3% -1.4% -0.1% 0.7% 1.57% 1.11% 1.2% -1.54% -0.02% 2.53% 0.32% 3.14%
Domestic Credit 1.5% 0.5% 0.6% -3.4% 0.4% 2.9% 3.63% 6.36% 1.1% 2.31% 0.96% 1.01% 2.30% 2.86%
Claims on Private Sector 1.0% 0.9% -0.7% -4.6% 0.2% 3.6% 0.01% 0.02% -0.6% 0.83% 0.21% 1.65% 0.41% 1.12%
TABLE 1.3 : ANALYSIS O F MO NTHLY CHANGES IN MO NEY SUPPLY (M3)
US$ Thousands
2014 2015
MONTHLY ECONOMIC REVIEW
11
OCTOBER NOVEMBER DECEMBER JANUARY FEBRUARY MARCH APRIL MAY JUNE JULY AUGUST SEPTEMBER OCTOBER NOVEMBER
NET FOREIGN ASSETS 251,490.3 233,974.4 90,771.0 132,431.5 36,127.1 250,879.1 59,815.5 -95,449.8 -180,094.9 -22,698.6 -100,052.1 -179,455.4 -223,571.1 -3,723.5
Assets 4,716.6 -29,140.7 -145,986.2 -178,961.3 -294,685.4 -205,308.8 -308,111.1 -379,009.3 -200,283.4 -183,460.8 -212,180.1 -216,884.3 -214,670.1 -160,163.5
Reserve Bank (RBZ) 185,705.6 69,707.4 24,693.2 1,841.7 -84,185.9 -74,987.2 -76,958.8 -107,685.7 79,429.5 68,475.7 -50,976.1 -260,229.1 -172,834.3 -34,353.8
Deposit Money Banks (DMBs) -168,281.7 -114,069.3 -180,447.4 -204,438.1 -219,094.2 -115,561.0 -204,196.9 -282,081.0 -294,731.2 -262,175.5 -175,757.2 33,238.4 -45,036.0 -106,467.2
Other Banking Institutions (OBIs) \1 -12,707.3 15,221.1 9,767.9 23,635.1 8,594.7 -14,760.6 -26,955.3 10,757.3 15,018.3 10,239.0 14,553.2 10,106.4 3,200.1 -19,342.5
Liabilities \2 246,773.7 263,115.2 236,757.2 311,392.8 330,812.5 456,187.9 367,926.6 283,559.6 20,188.5 160,762.2 112,128.0 37,428.9 -8,901.0 156,440.0
RBZ -114,916.2 -117,925.2 -129,214.3 -141,597.9 -142,138.7 -294,509.5 -261,255.8 -283,804.9 -48,600.0 -96,131.8 -60,845.6 19,340.3 34,361.2 18,611.0
DMBs -165,096.0 -178,769.8 -131,012.2 -198,281.1 -217,181.2 -187,715.9 -130,095.6 -23,610.5 14,958.5 -83,111.7 -63,177.9 -46,073.7 -13,602.2 -162,923.9
OBIs 33,238.5 33,579.8 23,469.3 28,486.1 28,507.4 26,037.5 23,424.8 23,855.8 13,453.0 18,481.3 11,895.4 -10,695.4 -11,858.0 -12,127.1
NET DOMESTIC ASSETS \3 254,086.5 374,380.8 380,322.6 319,048.5 279,980.3 25,501.8 148,570.5 257,686.8 400,538.7 272,589.1 251,024.5 376,976.5 367,137.9 333,441.6
DOMESTIC CREDIT 252,119.7 261,621.9 309,956.1 245,588.9 134,866.3 190,918.6 379,639.8 679,564.0 695,004.5 776,284.9 794,638.6 812,660.2 865,327.7 992,339.8
Claims on Government (net) 170,818.5 130,627.9 157,639.0 185,227.8 122,671.7 47,442.1 188,341.5 482,132.6 575,620.5 736,056.5 754,533.2 739,918.1 782,714.1 897,401.8
RBZ -12,964.3 -12,843.3 -23,881.4 -11,412.3 -11,726.2 -21,094.5 99,556.4 99,026.6 92,986.5 289,241.2 270,492.4 290,213.2 286,430.3 328,127.9
DMBs 152,163.6 150,725.7 168,946.7 184,880.3 122,554.5 49,095.3 60,904.0 354,951.8 444,479.8 415,882.2 448,362.7 412,213.7 457,069.2 511,078.6
OBIs 31,619.3 -7,254.5 12,573.7 11,759.9 11,843.4 19,441.3 27,881.1 28,154.2 38,154.2 30,933.0 35,678.2 37,491.3 39,214.6 58,195.3
Claims on Public Enterprises 12,950.8 5,816.2 6,105.2 4,414.7 8,255.0 -7,984.8 24,181.6 25,922.7 -20,025.0 -28,752.0 -13,816.8 -17,867.0 12,502.1 17,145.1
RBZ 0.0 0.0 0.0 0.0 0.0 0.0 737.3 1,087.1 1,189.1 1,931.5 2,098.7 2,423.7 30,362.6 30,375.1
DMBs 12,950.8 5,816.2 6,105.2 4,414.7 8,255.0 -9,711.2 22,450.1 24,052.3 -21,919.3 -30,883.4 -17,194.6 -21,602.9 -19,027.0 -14,156.5
Agri-PEs -5,003.2 -5,004.2 -5,005.2 -7,246.8 -7,246.8 -6,896.5 -6,898.8 -6,908.9 -1,516.3 -1,511.0 -1,514.5 -1,515.5 -1,515.5 -1,516.5
Other 17,954.0 10,820.4 11,110.4 11,661.5 15,501.8 -2,814.7 29,348.9 30,961.2 -20,403.0 -29,372.5 -15,680.0 -20,087.4 -17,511.5 -12,639.9
OBIs 0.0 0.0 0.0 0.0 0.0 1,726.4 994.2 783.2 705.1 200.0 1,279.1 1,312.2 1,166.5 926.4
Claims on Private Sector 68,350.4 125,177.8 146,211.9 55,946.4 3,939.6 151,461.2 167,116.7 171,508.7 139,409.0 68,980.4 53,922.1 90,609.0 70,111.5 77,793.0
RBZ -394.8 -390.8 -390.8 -390.8 -390.8 -3,336.1 -3,187.1 -3,589.5 16,964.5 31,997.2 58,043.6 32,634.0 41,234.4 42,717.2
DMBs -124,890.6 -69,400.6 -43,543.7 -120,031.2 -192,169.1 -33,095.8 -19,566.9 4,881.3 -55,223.4 -103,031.0 -141,232.5 -64,459.1 -65,906.0 -55,036.1
OBIs 193,635.8 194,969.2 190,146.4 176,368.4 196,499.5 187,893.1 189,870.6 170,216.9 177,667.9 140,014.2 137,110.9 122,434.1 94,783.1 90,111.8
OTHER ITEMS (NET) 1,966.8 112,758.9 70,366.5 73,459.6 145,114.0 -165,416.8 -231,069.3 -421,877.2 -294,465.8 -503,695.8 -543,614.1 -435,683.7 -498,189.8 -658,898.2
BROAD MONEY (M3) 505,576.8 608,355.2 471,093.6 451,480.0 316,107.4 276,380.8 208,386.1 162,237.0 220,443.8 249,890.4 150,972.4 197,521.1 143,566.8 329,718.1
GROWTH RATES
Broad Money (M3) 12.8% 16.0% 12.0% 11.6% 7.9% 6.8% 4.9% 3.8% 5.1% 5.9% 3.5% 4.5% 3.2% 7.5%
Domestic Credit 6.2% 6.4% 7.6% 6.2% 3.3% 4.6% 9.1% 16.4% 16.7% 18.5% 18.8% 19.0% 20.0% 22.8%
Claims on Private Sector 1.8% 3.4% 4.0% 1.6% 0.1% 4.2% 4.6% 4.8% 3.9% 1.9% 1.4% 2.4% 1.9% 2.0%
1. Finance houses, building societies and P. O. S. B.
2. Sign reversal.
3. Net Domestic Assets consist of domestic credit and other items net.
TABLE 1.4 : ANALYSIS OF YEARLY CHANGES IN MONEY SUPPLY (M3)
20152014
$ Thousands
MONTHLY ECONOMIC REVIEW
12
AGRICULTURE CO NSTRUCTIO N CO MMUNICATIO N DISTRIBUTIO N FINANCIAL & FINANCIAL MANUFACTURING MINING SERVICES TRANSPO RT INDIVIDUALS CO NGLO MERATE TO TAL
END O F INVESTMENTS O RGANISATIO NS
2014
Jan 489,585.3 43,743.8 18,574.7 464,097.6 5,467.4 48,086.1 362,554.0 116,635.5 412,901.1 37,722.2 367,126.2 16,773.1 2,383,267.1
Feb 519,154.6 38,918.1 24,765.4 460,528.2 10,397.3 47,488.6 385,038.1 116,670.5 401,619.6 32,978.1 396,800.8 8,542.7 2,442,902.1
Mar 503,868.1 42,707.9 35,785.1 494,663.8 5,257.4 52,722.0 374,809.1 116,653.0 396,000.6 38,089.3 406,503.1 15,833.1 2,482,892.7
Apr 540,156.2 40,707.1 18,138.9 502,514.1 9,898.6 18,817.9 407,595.0 175,048.3 447,549.2 49,619.1 511,048.2 15,136.7 2,736,229.2
May 546,733.9 41,594.2 21,547.9 488,389.7 10,073.8 23,049.1 396,846.0 184,730.9 452.373.8 51,891.8 512,864.5 17,718.8 2,747,814.6
Jun 536,188.9 46,085.8 28,201.0 500,266.1 10,656.3 25,616.2 417,002.7 197,441.1 432,692.4 46,751.6 499,191.5 17,173.9 2,757,267.4
Jul 575,645.3 43,055.0 28,090.8 480,483.6 6,359.2 27,284.9 428,611.4 206,052.3 479,384.6 49,260.4 507,930.0 46,148.1 2,878,305.8
Aug 548,866.7 56,886.1 38,891.3 498,696.8 54,387.2 110,618.5 422,942.5 221,099.2 430,156.3 48,167.0 474,060.2 37,230.9 2,942,002.7
Sep 539,818.8 51,349.1 29,191.8 493,610.7 51,999.0 109,975.0 428,697.3 201,791.6 451,117.2 45,100.0 539,108.1 36,708.6 2,978,467.1
O ct 530,544.7 62,891.8 55,922.5 507,936.4 50,701.1 101,818.5 436,519.1 196,491.0 413,443.5 39,088.3 520,437.0 5,799.4 2,921,593.2
Nov 574,859.5 58,780.5 46,419.5 460,989.3 50,008.6 120,510.4 453,924.5 208,418.3 413,410.7 45,289.6 540,638.4 5,976.9 2,979,226.2
Dec 565,840.1 46,298.5 42,604.8 437,975.3 47,805.8 88,485.5 478,895.5 220,501.3 481,497.5 43,449.8 543,038.5 5,957.7 3,002,529.6
2015
Jan 541,656.5 46,681.6 39,906.8 445,656.6 21,454.5 131,350.1 466,896.6 207,686.6 452,817.5 47,945.7 557,066.9 1,401.2 2,960,820.4
Feb 538,722.0 42,062.8 47,395.1 446,647.8 21,790.0 117,681.6 461,237.6 214,420.4 463,884.6 48,357.0 544,838.5 1,416.2 2,948,453.6
Mar 549,118.0 42,010.1 44,087.2 448,278.7 76,302.3 110,180.3 473,978.1 203,327.9 466,104.7 48,938.0 550,140.6 1,339.6 3,013,805.6
Apr 556,457.4 30,687.3 44,546.9 451,852.9 65,696.1 72,653.7 457,797.1 202,418.2 518,353.6 47,653.8 551,662.8 990.1 3,000,770.0
May 577,258.6 31,400.7 44,839.1 456,652.1 64,792.3 75,682.2 460,700.3 192,377.2 545,363.4 50,061.9 561,058.3 1,034.4 3,061,220.5
Jun 576,485.1 29,649.0 56,936.5 463,750.7 20,117.9 91,678.4 407,949.0 181,512.7 512,108.4 40,839.7 590,917.1 965.9 2,972,910.2
Jul 589,866.7 27,447.9 56,456.1 474,568.7 21,025.9 92,335.6 418,612.0 186,238.8 416,928.9 41,201.6 579,629.0 941.4 2,905,252.7
Aug 580,775.3 28,148.8 58,618.6 460,451.4 22,509.2 105,466.9 411,831.6 176,732.7 440,470.4 41,154.5 571,926.0 886.9 2,898,972.1
Sep 598,429.9 28,307.9 59,213.0 443,604.1 22,711.9 102,015.0 421,228.0 174,144.2 467,804.5 43,051.0 569,250.1 929.5 2,930,689.0
O ct 609,537.2 33,868.4 53,813.7 466,727.6 21,566.0 104,959.3 447,136.6 141,401.6 484,254.8 40,156.6 573,330.4 907.7 2,977,660.0
Nov 650,547.2 28,696.7 49,784.9 440,864.2 12,868.9 104,288.1 428,393.1 152,136.9 444,207.8 40,760.5 543,920.4 696.2 2,897,164.8
TABLE 2.1 : SECTORAL ANALYSIS OF COMMERCIAL BANKS LOANS AND ADVANCES/1
$ Thousands
MONTHLY ECONOMIC REVIEW
13
END O F AGRICULTURE CO NSTRUCTIO N CO MMUNICATIO NS DISTRIBUTIO N FINANCIAL & FINANCIAL MANUFACTURING MINING SERVICES TRANSPO RT INDIVIDUALS CO NGLO MERATES TO TAL
INVESTMENTS O RGANISATIO NS
2014
JANUARY 130,154.6 53,292.9 146,876.1 353,793.8 259,569.6 731,703.3 304,033.2 93,776.7 770,435.4 40,085.9 485,573.1 60,897.7 3,430,192.5
FEBRUARY 138,812.3 55,092.2 134,813.9 420,181.0 262,183.8 786,295.6 270,062.5 131,134.8 779,640.3 39,169.2 508,813.7 61,822.3 3,588,021.6
MARCH 118,239.1 55,167.5 135,807.9 382,675.5 216,025.3 791,776.0 275,549.1 103,298.7 806,185.9 42,432.8 521,381.5 72,990.9 3,521,530.3
APRIL 164,347.5 59,289.3 102,323.7 408,823.5 325,559.7 780,207.0 325,659.8 135,187.4 888,876.2 43,746.5 582,848.8 82,009.8 3,898,879.1
MAY 149,474.1 60,669.4 108,977.6 355,802.3 332,850.8 800,256.8 303,599.4 132,132.8 1,027,552.7 38,921.0 581,930.2 93,334.9 3,985,501.8
JUNE 194,685.1 64,188.9 95,595.6 470,267.7 291,594.6 812,999.7 348,303.5 130,453.4 895,698.0 44,735.5 575,149.1 91,392.4 4,015,063.5
JULY 163,335.6 56,812.0 87,587.5 370,121.7 303,367.3 830,988.6 334,436.8 112,985.0 880,761.1 44,675.4 587,756.7 94,841.5 3,867,669.2
AUGUST 128,794.1 38,934.1 90,012.5 271,204.3 270,009.9 755,141.6 236,267.5 130,548.6 865,566.6 31,180.4 467,724.2 89,582.4 3,374,966.2
SEPTEMBER 177,932.5 56,444.5 82,756.7 315,956.8 309,508.3 951,593.4 278,461.5 174,497.9 978,044.0 47,792.7 571,629.9 103,464.8 4,048,083.1
O CTO BER 158,421.7 57,091.4 83,973.9 407,934.0 308,028.8 917,450.3 266,690.9 178,771.0 936,336.2 44,950.2 613,425.1 91,764.1 4,064,837.5
NO VEMBER 140,908.6 61,494.3 93,114.0 350,153.8 313,668.7 881,007.4 271,049.9 137,867.8 955,760.6 48,177.7 641,405.3 90,462.2 3,985,070.2
DECEMBER 147,242.4 60,358.1 118,725.7 328,729.5 325,746.6 950,304.9 290,329.3 118,977.8 964,815.0 47,574.3 638,061.1 92,040.8 4,082,906.3
2015
JANUARY 155,304.2 63,950.4 136,066.9 349,099.7 294,145.5 809,684.0 314,319.6 113,452.0 1,034,514.7 48,876.5 606,370.3 78,746.0 4,004,529.8
FEBRUARY 151,740.1 63,112.6 109,807.6 370,581.8 314,944.7 784,737.6 309,307.9 120,255.1 1,028,160.1 43,112.0 606,650.6 78,891.2 3,981,301.2
MARCH 199,484.8 63,709.2 116,397.4 378,460.0 351,448.0 762,380.7 373,911.9 99,744.6 912,654.4 42,478.9 644,951.3 72,605.2 4,018,226.6
APRIL 186,896.3 65,974.0 130,284.9 380,884.8 330,001.9 799,952.4 373,648.3 109,735.0 944,772.9 44,964.9 653,801.0 75,850.9 4,096,767.2
MAY 185,803.2 73,167.5 111,512.1 523,774.7 299,659.2 801,335.5 419,453.7 113,355.0 1,041,392.8 50,057.9 619,767.9 71,388.8 4,310,668.3
JUNE 187,657.0 76,777.8 109,336.0 498,031.3 304,087.2 877,042.8 338,069.8 67,556.6 1,131,497.1 43,949.0 651,072.8 72,166.9 4,357,244.2
JULY 180,261.3 80,536.4 106,645.3 452,744.1 295,611.1 911,363.8 360,746.5 88,518.4 971,759.9 53,101.6 647,215.1 70,618.8 4,219,122.4
AUGUST 168,075.2 86,038.9 108,477.7 472,875.1 335,158.3 784,616.6 401,830.1 76,647.0 1,042,260.4 55,455.9 657,177.1 51,922.5 4,240,535.0
SEPTEMBER 197,641.5 85,842.6 112,415.3 462,925.6 349,564.2 831,813.0 379,121.4 71,090.0 1,033,106.7 53,348.1 676,308.0 55,759.2 4,308,935.5
O CTO BER 219,922.3 85,382.0 116,874.4 447,200.7 331,543.6 821,640.8 378,568.5 68,298.7 1,100,719.7 55,846.7 648,757.5 67,353.2 4,342,108.3
NO VEMBER 212,806.1 85,815.7 98,468.4 465,089.7 334,835.6 846,959.0 363,754.4 71,866.2 1,074,141.8 56,110.3 665,421.1 64,630.3 4,339,898.7
TABLE 2.2: SECTORAL ANALYSIS OF COMMERCIAL BANKS DEPOSITS
US$ Thousands

MONTHLY ECONOMIC REVIEW
14
End Period 1999 2000 2001 2002 2003 2004 2005 2006 2007 2008 2009 2010 2011 2012 2013 2014
(US$ millions)
Long-Term External Debt 3,530 3,227 3,255 3,327 3,644 3,927 3,805 3,965 4,032 4,464 4,951 5,175 6,096 6,607 7,370 8,444
Government 2,461 2,249 2,328 2,376 2,617 2,844 2,895 3,024 3,054 3,464 4,037 4,095 4,638 4,929 5,012 4,522
Bilateral Creditors 935 1,050 1,115 1,107 1,255 1,455 1,438 1,520 1,520 1,863 2,308 2,325 2,597 2,694 2,928 2,445
Multilateral Creditors 1,235 1,199 1,213 1,269 1,362 1,389 1,457 1,504 1,524 1,592 1,729 1,770 2,041 2,235 2,084 2,078
Private Creditors 291 0 0 0 0 0 0 0 10 10 0 0 0 0 0 0
Public Enterprises 543 534 568 616 698 714 709 766 790 825 857 938 1,092 1,198 1,356 1,661
Bilateral Creditors 316 301 315 351 403 442 439 464 474 497 453 238 711 703 858 1,155
Multilateral Creditors 224 233 253 265 295 272 270 302 316 327 403 700 382 495 498 506
Private Creditors 3 0 0 0 0 0 0 0 0 0 0 0 0 0 0 0
Monetary Authorities 364 292 292 279 288 291 144 130 137 140 140 138 127 125 125 120
Multilateral Creditors - IMF 364 292 292 279 288 291 144 130 137 140 140 138 127 125 125 120
Private 162 152 67 56 41 78 57 45 51 35 57 142 366 480 1,002 2,261
Short-Term External Debt 532 298 167 183 169 144 173 281 387 226 1,198 1,382 1,289 890 1,564 2,394
Supplier's Credits 150 42 13 26 51 69 107 122 178 41 193 286 134 30 0 0
Reserve Bank 642 642 618 614 614 587
Private 382 256 154 157 118 75 66 159 209 185 363 454 537 246 950 1,807
Total External Debt 4,062 3,525 3,422 3,510 3,812 4,071 3,978 4,246 4,419 4,690 6,149 6,557 7,385 7,497 8,934 10,838
Gross Domestic Product 5,990 6,107 10,887 6,715 5,037 4,299 2,918 6,645 4,000 3,175 8,157 9,457 10,956 12,472 13,490 14,068
External Debt / GDP 68% 57.7% 31.4% 52.3% 75.7% 94.7% 136.3% 63.9% 110.5% 147.7% 75.4% 69.3% 67.4% 60.1% 66.2% 77.0%
SOURCE: Ministry of Finance and Reserve Bank of Zimbabwe
TABLE 3.1: ZIMBABWE: EXTERNAL DEBT OUTSTANDING BY DEBTOR (INCLUDING ALL ARREARS)
MONTHLY ECONOMIC REVIEW
15
End Period Nominal Lending Rates2
Individuals Corporate
2014
Jan 6.00-35.00 14.09 9.30
Feb 6.00-35.00 14.08 9.32
Mar 6.00-35.00 14.24 9.27
Apr 6.00-35.00 14.22 9.12
May 6.00-35.00 14.39 9.25
Jun 6.00-35.00 14.44 9.33
Jul 6.00-35.00 14.33 9.45
Aug 6.00-35.00 14.28 9.45
Sep 6.00-35.00 14.45 9.57
Oct 6.00-35.00 14.36 9.90
Nov 6.00-35.00 14.26 9.97
Dec 6.00-35.00 14.19 9.68
2015
Jan 6.00-35.00 14.16 9.66
Feb 4.30-33.50 14.00 9.73
Mar 4.30-33.50 13.24 8.75
Apr 4.30-31.00 12.71 8.84
May 5.00-31.00 12.74 8.79
Jun 5.00-31.00 11.94 8.42
Jul 5.00-31.00 11.86 8.56
Aug 4.30-26.00 11.96 8.51
Sep 4.30-25.00 11.81 8.47
Oct 4.00-18.00 10.98 7.28
Nov 4.00-16.25 12.20 7.67
Notes
3. Lending rates exclude rates on staff loans.
TABLE 4.1 LENDING RATES (percent per annum)1
2. Nominal Lending Rates depict the range of rates quoted by banks.
Commercial Banks
Weighted Average Lending Rates3
1. Table revised, to separate weighted lending rates for individuals and corporate bodies.
MONTHLY ECONOMIC REVIEW
16
END OF SAVINGS 3 MONTHS
2014
Jan 0.15-8.00 3.00-20.00
Feb 0.15-8.00 3.00-20.00
Mar 0.15-8.00 3.00-20.00
Apr 0.15-8.00 3.00-20.00
May 0.15-8.00 3.00-20.00
Jun 0.15-8.00 3.00-20.00
Jul 0.15-8.00 3.00-20.00
Aug 0.15-8.00 4.00-20.00
Sep 0.15-8.00 4.00-20.00
Oct 0.15-8.00 4.00-20.00
Nov 0.15-8.00 4.00-20.00
Dec 0.15-8.00 3.00-20.00
2015
Jan 0.15-8.00 3.00-17.00
Feb 0.50-12.00 1.00-17.00
Mar 0.50-12.00 1.00-17.00
Apr 0.30-8.00 1.00-17.00
May 0.30-8.00 1.00-17.00
Jun 0.30-8.00 1.00-17.00
Jul 0.30-8.00 1.00-15.00
Aug 0.30-8.00 1.00-15.00
Sep 0.30-8.00 1.00-16.00
Oct 0.50-8.00 1.00-17.00
Nov 0.75-8.00 1.00-17.00
* The range of rates qouted by banks during the period.
TABLE 4.2 : BANKS DEPOSIT RATES (percent per annum)*
COMMERCIAL BANKS

MONTHLY ECONOMIC REVIEW
17
F OOD IN F LA TION A LL
A LC OHOLIC
B EV ER A GES C LOTHIN G HS IN G, WA TER , F U R N ITU R E HEA LTH TR A N S P OR T C OM M U N IC A TION R EC R EA TION & ED U C A TION R ES TA U R A N TS & M IS C . TOTA L N ON F OOD & ITEM S
& TOB A C C O F OOTWEA RELEC TR IC TY ,
GA SA N D C U LTU R E HOTELS GOOD S & F OOD
N ON A LC OHOLIC
B EV ER A GES
& OTHER EQU IP M EN T S ER V IC ES
F U ELS
WEIGHTS 4 .3 8 6 .0 5 17 .74 9 .9 1 2 .16 9 .76 3 .4 1 2 .1 5 .6 7 1.3 8 3 .9 1 6 6 .4 7 3 3 .53 10 0
2013
OC TOB ER 1.2 1 0 .0 0 - 0 .0 1 - 0 .3 6 0 .0 6 - 0 .3 2 - 0 .0 7 - 0 .15 0 .0 2 - 0 .0 8 - 0 .2 0 - 0 .0 4 0 .0 4 - 0 .0 1
N OV EM B ER 0 .3 8 - 0 .19 - 0 .0 1 - 0 .3 7 0 .10 - 0 .13 - 0 .0 1 - 0 .13 5 .57 1.0 8 - 0 .2 7 0 .4 3 - 0 .6 0 0 .0 9
D EC EM B ER 0 .14 - 0 .0 1 0 .3 7 - 0 .2 9 0 .12 0 .2 7 0 .0 5 - 0 .2 2 0 .0 0 0 .0 0 - 0 .4 6 0 .0 8 - 0 .4 1 - 0 .0 8
2014
JA N U A R Y 0 .2 0 - 0 .0 7 0 .0 0 0 .0 1 - 0 .2 3 0 .0 1 0 .0 0 - 0 .0 7 0 .0 2 0 .16 - 0 .0 9 0 .0 0 0 .4 4 0 .14
F EB R U A R Y - 0 .0 1 - 0 .0 9 - 0 .11 - 0 .0 8 0 .0 9 0 .0 8 0 .0 0 - 0 .0 4 0 .2 3 - 0 .0 8 0 .0 7 - 0 .0 1 0 .18 0 .0 5
M A R C H - 0 .0 5 - 0 .0 6 - 0 .8 2 - 0 .12 0 .0 2 0 .0 0 0 .0 1 0 .0 0 0 .0 0 0 .0 1 - 0 .3 0 - 0 .2 6 - 0 .14 - 0 .2 2
A P R IL 0 .3 0 - 0 .10 - 0 .13 - 0 .75 0 .16 0 .3 3 - 0 .0 2 0 .3 4 12 .6 4 - 1.0 2 - 0 .0 3 1.0 9 - 0 .4 6 0 .58
M A Y 0 .11 - 0 .11 - 0 .0 6 - 0 .2 9 0 .0 0 0 .2 3 - 0 .0 3 - 0 .2 0 0 .0 7 - 0 .13 - 0 .4 3 - 0 .0 5 - 0 .3 0 - 0 .13
JU N E - 0 .0 5 0 .12 0 .0 0 0 .0 6 0 .3 0 - 0 .0 3 0 .0 0 - 0 .0 9 0 .0 0 - 0 .11 0 .15 0 .0 2 - 0 .12 - 0 .0 3
JU LY - 0 .4 7 - 0 .2 1 0 .12 0 .3 0 - 0 .0 1 0 .11 - 0 .12 - 0 .13 - 0 .0 8 1.79 0 .8 5 - 0 .3 7 0 .2 5 0 .0 1
A U GU S T - 0 .8 1 - 0 .0 5 - 0 .0 9 0 .0 0 - 0 .14 0 .0 4 0 .2 8 - 0 .0 6 - 0 .0 8 - 0 .0 2 0 .0 2 - 1.2 1 - 0 .0 7 - 0 .3 1
S EP TEM B ER 0 .10 0 .14 0 .4 5 - 0 .2 7 0 .2 1 0 .3 8 - 0 .0 6 - 0 .14 0 .0 0 - 0 .4 0 0 .11 0 .15 - 0 .3 4 - 0 .0 1
OC TOB ER 0 .16 0 .0 7 0 .0 0 - 0 .14 - 0 .0 1 - 0 .2 7 - 0 .0 6 - 0 .0 4 0 .0 1 0 .0 2 0 .0 3 - 0 .0 4 - 0 .2 4 - 0 .11
N OV EM B ER 0 .19 0 .12 - 0 .0 3 - 0 .0 9 0 .0 9 0 .10 0 .0 2 0 .0 2 - 9 .18 - 0 .6 2 0 .0 6 - 0 .9 6 - 0 .11 - 0 .6 9
D EC EM B ER 0 .0 1 - 0 .10 0 .16 - 0 .10 0 .13 0 .19 0 .0 0 - 0 .16 0 .0 0 - 0 .2 3 - 0 .15 0 .0 4 - 0 .3 6 - 0 .0 9
2015
JA N U A R Y - 0 .0 4 - 0 .0 1 0 .0 8 0 .0 7 0 .0 6 - 0 .9 7 - 13 .4 1 0 .0 2 - 0 .0 8 - 0 .4 8 0 .3 0 - 0 .6 9 0 .4 0 - 0 .3 4
F EB R U A R Y 0 .2 5 - 0 .3 5 - 0 .0 9 - 0 .11 - 0 .0 2 - 0 .4 1 - 0 .10 - 0 .17 0 .0 0 - 0 .2 8 0 .10 - 0 .13 0 .0 5 - 0 .0 7
M A R C H 0 .12 - 0 .2 7 - 0 .0 6 - 0 .0 2 - 0 .0 5 0 .0 2 0 .0 0 0 .0 3 0 .0 0 0 .12 0 .10 - 0 .0 3 - 0 .0 3 - 0 .0 3
A P R IL - 0 .6 3 - 0 .0 1 - 0 .71 - 3 .3 5 - 0 .4 6 - 0 .0 5 - 0 .15 - 0 .13 - 0 .0 7 0 .59 0 .4 1 - 0 .0 4 - 1.0 1 - 0 .8 9
M A Y - 0 .17 - 0 .4 1 0 .18 - 0 .2 5 0 .10 - 0 .2 5 - 0 .0 2 - 0 .11 0 .0 0 - 0 .0 8 - 0 .4 4 - 0 .10 - 0 .3 7 - 0 .19
JU N E 0 .3 6 - 0 .0 6 - 0 .0 2 - 0 .0 7 - 0 .17 0 .0 6 0 .0 1 - 0 .0 9 0 .0 0 - 0 .0 7 0 .11 0 .0 1 - 0 .4 5 - 0 .14
JU LY - 0 .0 8 0 .0 5 - 0 .56 - 0 .8 2 0 .15 - 0 .0 9 - 0 .0 2 - 0 .14 7 .4 8 - 0 .0 2 0 .0 3 0 .4 7 - 0 .8 1 0 .0 6
A U GU S T- 0 .2 7 - 0 .0 1 0 .0 2 - 0 .14 - 0 .0 4 - 0 .2 9 - 0 .0 6 - 0 .2 6 0 .0 0 - 0 .14 - 0 .0 9 - 0 .10 - 0 .75 - 0 .3 6
S EP TEM B ER- 0 .0 5 0 .0 0 - 0 .6 2 - 0 .52 0 .0 4 - 0 .4 2 - 0 .3 8 - 0 .0 1 0 .0 0 1.2 8 - 0 .3 0 - 0 .3 1 - 0 .4 7 - 0 .3 6
OC TOB ER- 0 .4 3 - 0 .3 1 - 0 .0 8 - 0 .3 2 0 .6 1 - 0 .4 7 0 .0 2 - 0 .14 0 .0 0 - 0 .18 0 .12 - 0 .17 - 0 .53 - 0 .2 9
N OV EM B ER- 0 .15 - 0 .19 - 0 .0 1 - 0 .2 4 0 .0 0 - 0 .0 8 - 0 .2 3 - 0 .0 2 2 .8 3 - 0 .0 3 - 0 .0 2 0 .2 2 0 .0 4 0 .16
N ON - F OOD IN F LA TION
TABLE 5.1 : MONTHLY INFLATION -- PERCENTAGE CHANGE IN CONSUMER PRICE INDEX
( DECEMBER 2012 = 100)

MONTHLY ECONOMIC REVIEW
18
F OOD
IN F LA TIONA LL
A LC OHOLIC
B EV ER A GES C LOTHIN G
HS IN G,
WA TER ,F U R N ITU R E HEA LTH TR A N S P OR T
C OM M U N IC A
TION
R EC R EA TION
&ED U C A TION
R ES TA U R A N
TS &M IS C . TOTA L N ON F OOD & ITEM S
& TOB A C C O F OOTWEA RELEC TR IC TY ,
GA SA N D C U LTU R E HOTELS GOOD S & F OOD
N ON
A LC OHOLIC
B EV ER A GES
& OTHER EQU IP M EN T S ER V IC ES
F U ELS
WEIGHTS 4 .3 8 6 .0 5 17 .74 9 .9 1 2 .16 9 .76 3 .4 1 2 .1 5 .6 7 1.3 8 3 .9 1 6 6 .4 7 3 3 .53 10 0
2 0 14
JA N U A R Y 5.0 3 0 .0 3 3 .6 3 - 1.0 7 1.8 7 1.6 2 - 14 - 1.12 11.3 2 .18 - 0 .4 3 1.6 7 - 2 .0 8 0 .4 1
F EB R U A R Y 2 .2 1 - 0 .4 3 3 .0 9 - 1.3 5 0 .4 4 0 .0 5 - 13 .8 6 - 1.0 8 11.4 7 1.3 2 - 1.4 5 0 .9 3 - 3 .2 6 - 0 .4 9
M A R C H 1.6 7 - 0 .53 2 .2 1 - 1.8 2 0 .4 - 0 .4 4 - 13 .6 8 - 1.2 1 11.4 7 2 .4 7 - 1.8 2 0 .51 - 3 .71 - 0 .9 1
A P R IL 1.78 - 0 .55 0 .4 6 - 2 .6 0 .2 2 - 0 .11 - 0 .6 2 - 0 .9 3 2 0 .71 1.13 - 1.56 1.5 - 3 .73 - 0 .2 6
M A Y 1.9 1 - 0 .8 3 0 .3 9 - 2 .6 2 0 .2 9 0 .8 6 - 0 .6 - 0 .6 4 2 0 .79 0 .9 5 - 1.6 9 1.6 2 - 3 .75 - 0 .19
JU N E 1.6 8 - 0 .8 1 0 .4 - 2 .54 0 .6 4 0 .9 7 - 0 .2 7 - 0 .8 4 2 0 .79 0 .9 9 - 1.6 7 1.6 7 - 3 .54 - 0 .0 8
JU LY - 2 .8 8 1.6 4 - 0 .6 8 0 .7 - 2 .4 0 .8 0 .5 - 0 .4 - 0 .8 2 3 1.8 - 2 1.9 0 .3
A U GU S T - 2 .79 2 .0 2 - 0 .4 4 - 0 .1 - 2 .5 0 .6 0 .7 - 0 .3 - 0 .8 2 1.4 0 .9 - 2 .8 1.6 0 .2
S EP TEM B ER 2 .10 - 0 .3 4 - 0 .0 3 - 2 .6 0 0 .9 8 0 .9 9 - 0 .3 2 - 0 .8 5 2 1.4 2 0 .2 8 - 3 .0 6 1.59 - 2 .9 5 0 .0 9
OC TOB ER 1.0 4 - 0 .2 7 - 0 .0 1 - 2 .3 8 0 .9 1 1.0 4 - 0 .3 1 - 0 .75 2 1.4 1 0 .3 8 - 2 .8 3 1.59 - 3 .2 3 0 .0 0
N OV EM B ER 0 .8 4 0 .0 4 - 0 .0 3 - 2 .11 0 .9 1 1.2 6 - 0 .2 8 - 0 .59 4 .4 4 - 1.3 1 - 2 .50 0 .17 - 2 .75 - 0 .78
D EC EM B ER 0 .71 - 0 .0 5 - 0 .2 4 - 1.9 2 0 .9 2 1.18 - 0 .3 3 - 0 .53 4 .4 5 - 1.54 - 2 .2 1 0 .13 - 2 .7 - 0 .8
2 0 15
JA N U A R Y 0 .4 7 0 .0 0 - 0 .16 - 1.8 6 1.2 1 0 .19 - 13 .6 9 - 0 .4 4 4 .3 5 - 2 .16 - 1.8 2 - 0 .57 - 2 .74 - 1.2 8
F EB R U A R Y 0 .73 - 0 .2 5 - 0 .14 - 1.8 8 1.10 - 0 .3 0 - 13 .78 - 0 .57 4 .11 - 2 .3 6 - 1.8 0 - 0 .6 8 - 2 .8 7 - 1.4 0
M A R C H 0 .9 0 - 0 .4 6 0 .6 2 - 1.78 1.0 3 - 0 .2 8 - 13 .78 - 0 .54 4 .11 - 2 .2 6 - 1.4 1 - 0 .4 4 - 2 .77 - 1.2 0
A P R IL - 2 .9 3 0 .59 - 1.0 7 - 2 .6 2 - 1.50 0 .8 1 - 0 .76 - 13 .8 8 - 0 .9 5 - 7 .0 2 - 0 .8 4 - 1.4 1 - 2 .51 - 2 .6 5
M A Y 0 .3 1 - 1.3 7 - 2 .3 9 - 1.4 5 0 .9 2 - 1.2 3 - 13 .8 7 - 0 .8 6 - 7 .0 9 - 0 .79 - 1.4 2 - 2 .56 - 3 .0 0 - 2 .70
JU N E 0 .72 - 1.54 - 2 .4 1 - 1.58 0 .4 5 - 1.14 0 .0 0 - 0 .8 7 - 7 .0 9 - 0 .75 - 1.3 8 - 2 .57 - 3 .3 2 - 2 .8 1
JU LY 0 .74 - 1.6 1 - 3 .2 4 - 2 .3 7 0 .50 - 1.12 - 13 .77 - 0 .9 3 - 1.9 0 - 1.6 1 - 0 .9 9 - 2 .3 5 - 3 .6 5 - 2 .77
A U GU S T 0 .6 1 - 1.53 - 3 .2 2 - 2 .3 7 0 .4 2 - 1.6 7 - 13 .77 - 1.11 - 1.8 8 - 1.78 0 .13 - 2 .3 8 - 3 .59 - 2 .77
S EP TEM B ER 0 .4 7 - 1.6 7 - 4 .2 5 - 2 .6 2 0 .2 5 - 2 .4 5 - 14 .0 5 - 0 .9 9 - 1.8 8 - 0 .12 - 0 .2 8 - 2 .8 3 - 3 .72 - 3 .11
OC TOB ER - 0 .12 - 2 .0 4 - 4 .3 3 - 2 .8 0 0 .8 6 - 2 .6 4 - 13 .9 8 - 1.0 9 - 1.8 9 - 0 .3 2 - 0 .2 0 - 2 .9 5 - 4 .0 0 - 3 .2 9
N OV EM B ER - 0 .4 5 - 2 .3 5 - 4 .3 2 - 2 .9 4 0 .77 - 2 .8 1 - 14 .19 - 1.14 11.0 8 0 .2 8 - 0 .2 7 - 1.8 0 - 3 .8 5 - 2 .4 6
N ON - F OOD IN F LA TION
TABLE 5.2 : YEARLY INFLATION -- PERCENTAGE CHANGE IN CONSUMER PRICE INDEX \1
(DECEMBER 2012 = 100)

MONTHLY ECONOMIC REVIEW
19
SA BW JAPANESE EURO PEAN PO UND
END O F RAND/1 PULA/1 YEN/1 CURRENCY/2 STERLING/2
2014
JANUARY 11.21 9.09 102.47 1.35 1.65
FEBRUARY 10.71 8.85 101.74 1.37 1.67
MARCH 10.56 8.85 102.38 1.38 1.68
APRIL 10.57 8.85 102.38 1.38 1.68
MAY 10.44 8.73 101.61 1.36 1.67
JUNE 10.58 8.67 101.3 1.36 1.7
JULY 10.68 8.85 102.76 1.36 1.69
AUGUST 10.98 9.07 107.35 1.29 1.63
SEPTEMBER 11.26 9.26 109.39 1.27 1.63
O CTO BER 10.90 9.11 110.87 1.26 1.59
NO VEMBER 11.02 9.22 118.21 1.38 1.57
DECEMBER 11.56 9.51 119.65 1.22 1.56
2015
JANUARY 11.55 9.61 117.85 1.13 1.51
FEBRUARY 11.55 9.61 119.17 1.12 1.54
MARCH 12.16 9.96 120.19 1.08 1.48
APRIL 11.82 9.74 118.60 1.11 1.54
MAY 12.13 9.76 123.87 1.09 1.53
JUNE 12.26 9.92 122.31 1.12 1.57
JULY 12.71 10.67 124.03 1.09 1.56
AUGUST 13.31 10.20 121.11 1.12 1.54
SEPTEMBER 13.90 10.55 119.94 1.12 1.54
O CTO BER 13.85 10.47 121.15 1.10 1.54
NO VEMBER 14.40 10.70 122.73 1.06 1.53
TABLE 6 : SELECTED INTERNATIONAL EXCHANGE RATES
1. Fo re ign currency per US Do lla r.
2. US Do lla r per unit o f fo re ign currency.
MONTHLY ECONOMIC REVIEW
20
Foreign Loans & Contigent Other Non Financial TOTAL
End of Notes Total Other Balances Advnces Assets Assets Assets
& Balances Balances Balances with RBZ
Bond Coin with with Other at Trade Treasury Agric PEs
Coins at Banks RBZ Banks Foreign Banks Bills Bills
2014
Jan 356.9 395.3 134.1 253.1 153.0 119.2 5.4 1417.0 27.9 2866.4 516.1 362.2 353.9 5543.5
Feb 334.3 387.0 130.5 285.0 131.2 193.2 5.4 1466.6 32.8 2718.1 534.5 502.9 351.1 5606.0
Mar 304.6 354.1 147.4 280.3 165.9 255.2 5.4 1512.9 28.7 2737.9 522.7 538.8 349.7 5690.7
Apr 353.3 367.8 154.4 274.9 205.7 247.0 5.4 1608.4 32.5 2844.6 534.1 345.3 348.6 5713.6
May 327.8 421.1 120.5 372.8 211.5 241.7 5.4 1700.6 27.5 2836.8 591.4 366.2 347.1 5869.6
Jun 347.1 404.7 166.4 338.1 198.0 261.9 0.0 1716.1 16.2 2863.2 607.8 362.9 346.4 5912.6
Jul 347.1 321.3 176.7 276.3 186.0 246.2 0.0 1553.7 15.4 2940.4 597.5 347.4 345.6 5800.0
Aug 360.7 424.5 178.5 243.5 173.9 237.5 0.0 1618.6 15.5 2949.1 609.5 353.9 346.4 5892.9
Sep 255.6 636.8 183.0 158.8 176.0 253.9 0.0 1664.2 4.1 2949.4 624.6 371.5 341.5 5955.3
Oct 226.1 597.7 175.0 205.5 180.3 260.1 0.0 1644.7 15.6 2938.4 594.4 369.0 341.8 5903.8
Nov 258.9 556.7 169.1 157.5 178.5 281.6 0.0 1602.2 4.2 2951.6 597.5 369.4 341.1 5865.9
Dec 0.4 309.5 465.7 167.6 151.9 184.3 285.4 0.0 1564.7 4.1 2758.6 606.2 343.7 356.0 5633.3
2015
Jan 0.6 222.5 527.9 159.0 182.6 163.6 325.7 0.0 1581.9 21.4 2796.8 557.7 360.2 366.1 5684.2
Feb 0.4 216.7 501.2 149.6 183.2 128.6 344.6 0.0 1524.2 17.9 2792.5 564.8 325.3 356.8 5581.5
Mar 0.6 246.9 461.4 147.8 222.2 121.6 338.0 5.4 1543.8 15.5 2925.5 527.3 352.5 362.0 5726.6
Apr 0.7 205.5 492.8 158.6 218.5 112.0 335.1 5.4 1528.6 18.2 2967.1 527.1 364.2 385.4 5790.7
May 0.7 237.3 495.6 135.1 181.0 101.4 622.7 5.5 1779.2 18.2 2922.7 525.7 434.2 384.3 6064.3
Jun 0.8 245.7 570.9 155.1 144.7 90.8 750.1 4.4 1962.4 28.8 2872.6 498.4 351.0 386.2 6099.4
Jul 0.9 226.0 544.9 137.3 135.3 86.3 770.0 0.0 1900.7 28.8 2815.0 504.1 361.1 388.8 5998.5
Aug 1.0 234.0 523.7 104.3 194.7 76.1 786.5 5.1 1925.3 28.8 2810.1 535.2 339.9 390.5 6029.6
Sep 1.0 255.2 551.8 114.8 192.9 63.7 764.9 5.1 1949.4 28.0 2844.1 599.2 404.6 392.3 6217.7
Oct 0.9 215.7 536.1 143.7 171.5 83.5 808.3 5.2 1964.9 26.7 2884.2 599.3 350.6 391.5 6217.0
Nov 0.1 258.0 538.9 175.2 148.1 151.1 331.3 0.0 1602.7 1.0 2742.0 567.5 336.7 307.6 5557.4
Liquid Assets
TABLE 7.1: COMMERCIAL BANKS - ASSETS
Securities
US$ Millions
MONTHLY ECONOMIC REVIEW
21
Deposits Capital Contigent Other Total Of which
and Liablities Liablities Liabilities to the
End of Demand Savings and Short-term Long-term Total Foreign Liabilities RBZ Other Banks Reserves Public
2014
Jan 2153.6 802.7 403.5 3359.8 661.3 0.0 55.9 592.9 516.1 357.5 5543.5 3359.8
Feb 2111.8 878.8 494.6 3485.2 630.0 0.0 51.1 609.5 534.5 359.0 5669.5 3485.2
Mar 2156.8 919.6 454.2 3530.6 635.5 0.0 44.8 596.4 522.7 360.7 5690.7 3530.6
Apr 2267.5 958.3 435.7 3661.5 553.5 0.0 17.0 595.0 534.1 352.4 5713.6 3661.5
May 2294.9 975.8 451.7 3722.4 585.0 0.0 13.7 591.1 591.4 366.1 5869.6 3722.4
Jun 2248.9 989.8 506.1 3744.8 543.8 0.0 48.3 591.2 607.8 376.7 5912.6 3744.8
Jul 2130.4 892.9 606.6 3629.9 560.8 0.0 39.5 571.5 597.5 400.6 5800.0 3629.9
Aug 2202.3 963.1 539.9 3705.3 552.7 0.0 43.5 580.7 609.5 401.2 5892.9 3705.3
Sep 2191.0 1011.1 562.6 3764.8 548.9 0.0 59.5 544.8 624.6 412.7 5955.3 3764.8
Oct 2260.8 1015.1 509.9 3785.8 506.8 0.0 47.4 543.3 594.4 426.0 5903.8 3785.8
Nov 2231.8 943.4 526.5 3701.6 509.4 0.0 90.6 541.8 597.5 425.0 5865.9 3701.6
Dec 2101.6 975.8 453.2 3530.5 484.0 0.0 81.4 713.6 606.2 217.5 5633.3 3530.5
2015
Jan 2056.2 996.2 561.7 3614.0 470.1 0.0 79.5 728.5 557.7 234.3 5684.2 3614.0
Feb 2079.6 876.1 611.6 3567.3 426.6 0.0 75.6 720.3 564.8 227.0 5581.5 3567.3
Mar 2139.3 940.4 513.3 3593.0 461.1 0.0 101.9 749.7 527.3 293.6 5726.6 3593.0
Apr 2098.7 943.5 629.8 3672.0 448.9 0.0 103.4 747.4 527.1 291.8 5790.7 3672.0
May 2131.8 1015.3 615.3 3762.4 574.7 0.0 82.4 814.7 525.7 304.4 6064.3 3762.4
Jun 2213.2 1021.9 593.5 3828.7 560.2 0.8 103.1 814.9 498.4 293.2 6099.4 3828.7
Jul 2166.4 889.7 732.5 3788.6 478.9 0.8 88.2 813.0 504.1 325.0 5998.5 3788.6
Aug 2266.7 790.9 723.1 3780.7 490.7 0.0 83.4 825.7 535.2 313.9 6029.6 3780.7
Sep 2276.7 967.6 648.7 3892.9 504.0 0.0 72.0 828.1 599.2 321.5 6217.7 3892.9
Oct 2259.9 909.3 667.8 3837.0 494.3 0.0 122.2 841.2 599.3 322.9 6217.0 3837.0
Nov 2128.3 885.6 514.1 3528.0 454.4 0.0 87.0 699.0 567.5 221.6 5557.4 3528.0
TABLE 7.2: COMMERCIAL BANKS - LIABILITIES
US$ Millions
Amounts Owing to
MONTHLY ECONOMIC REVIEW
22
Foreign Loans & Contigent Other Non Financial TOTAL
End of Notes Total Other Balances Advnces Assets Assets Assets
Bond & Balances Balances Balances Liquid with RBZ
Coins Coin with with Other at Trade Treasury Agris Pes Assets
at Banks at Banks RBZ Banks Foreign Banks Bills Bills
2014
Jan 0.0 0.1 0.5 0.0 0.2 1.8 0.0 0.0 2.6 0.0 81.3 10.0 23.5 34.7 152.1
Feb 0.0 0.2 0.4 0.1 0.1 1.8 0.0 0.0 2.5 0.0 77.6 9.0 24.1 34.6 147.9
Mar 0.0 0.1 0.1 0.1 0.1 1.6 0.0 0.0 2.0 0.0 53.2 8.7 21.8 32.5 118.1
Apr 0.0 0.1 0.4 0.2 0.3 1.6 0.0 2.6 5.2 75.2 8.5 22.2 32.4 140.9 284.4
May 0.0 0.2 0.4 0.0 0.1 0.3 0.0 0.9 1.9 68.7 0.1 14.6 30.3 114.6 230.2
Jun 0.0 0.2 0.2 0.1 0.0 0.6 0.0 0.0 1.2 0.0 66.8 0.1 14.7 29.6 112.4
Jul 0.0 0.2 0.3 0.0 0.1 0.3 0.0 0.0 0.9 0.0 66.9 0.1 12.9 28.7 109.6
Aug 0.0 0.2 0.7 0.0 0.1 0.3 0.0 0.0 1.3 0.0 64.4 0.0 19.4 23.9 109.0
Sep 0.0 0.4 0.2 0.0 0.1 0.3 0.0 0.0 1.1 0.0 65.9 0.1 18.9 19.7 105.8
Oct 0.0 0.7 0.7 0.0 0.1 0.3 0.0 0.0 1.7 0.0 68.3 0.1 10.8 25.9 106.9
Nov 0.0 0.6 0.1 0.0 0.1 0.3 0.0 0.0 1.0 0.0 67.1 0.1 12.4 25.8 106.3
Dec 0.0 0.9 0.4 0.0 0.1 0.3 0.0 0.0 1.7 0.0 63.6 0.1 10.0 24.6 100.0
2015
Jan 0.0 0.6 0.3 0.0 0.1 1.6 0.0 0.0 2.0 0.0 70.2 8.3 19.0 23.7 123.8
Feb 0.0 0.4 0.2 0.1 0.1 1.6 0.0 0.0 2.5 0.0 72.0 8.3 19.3 23.6 125.7
Mar 0.0 0.4 0.1 0.0 0.1 1.5 0.0 0.0 2.1 0.0 73.3 8.2 18.5 23.4 125.5
Apr 0.0 0.3 0.1 0.0 0.1 0.2 0.0 0.0 0.6 0.0 66.7 0.0 10.3 21.3 98.9
May 0.0 0.4 0.0 0.0 0.0 0.2 0.0 0.0 0.6 0.0 67.9 0.0 9.6 21.2 99.3
Jun 0.0 0.3 0.0 0.0 0.0 0.4 0.0 0.0 0.7 0.0 68.1 0.0 9.7 21.1 99.6
Jul 0.0 0.2 1.6 0.0 0.0 0.2 0.0 0.0 2.0 0.0 67.8 0.0 9.2 21.0 100.0
Aug 0.0 0.1 1.8 0.0 0.0 0.2 0.0 0.0 2.0 0.0 60.0 0.0 9.3 28.1 99.4
Sep 0.0 0.1 2.2 0.0 0.0 0.2 0.0 0.0 2.5 0.0 59.2 0.0 9.2 28.0 98.9
Oct 0.0 0.1 2.1 0.0 0.0 0.2 0.0 0.0 2.4 0.0 59.4 0.0 9.1 27.8 98.8
Nov 0.0 0.6 0.1 0.0 0.1 0.3 0.0 0.0 1.0 0.0 67.1 0.1 12.4 25.8 106.3
US$ Millions
TABLE 8.1 : ACCEPTING HOUSES - ASSETS
Liquid Assets Securities
MONTHLY ECONOMIC REVIEW
23
Of which
Deposits Capital Contigent Other Total Liabilities to the
and Liablities Liablities Public
End of Demand Savings and Short-term Long-term Total Foreign Liabilities RBZ Other Banks Reserves
2014
Jan 36.8 57.7 5.7 100.1 11.7 0.0 0.0 0.7 10.0 29.5 152.1 100.1
Feb 47.6 48.3 0.0 95.8 11.7 0.0 0.0 -10.9 9.0 42.3 147.9 95.8
Mar 41.0 55.8 0.0 96.9 12.0 0.0 0.0 -17.7 8.7 18.4 118.1 96.9
Apr 57.4 40.3 0.0 97.7 12.2 0.0 0.0 -19.8 8.5 42.4 140.9 97.7
May 42.8 34.6 0.0 77.4 0.0 0.0 0.0 4.7 0.1 32.5 114.6 77.4
Jun 42.8 33.2 0.0 76.0 0.0 0.0 0.0 2.3 0.1 33.7 112.1 76.0
Jul 42.6 33.8 0.0 76.3 0.0 0.0 0.0 -8.7 0.1 41.8 109.6 76.3
Aug 36.4 40.4 0.0 76.8 0.0 0.0 0.0 -7.8 0.0 40.0 109.0 76.8
Sep 40.9 33.9 0.0 74.9 0.0 0.0 0.0 -7.6 0.1 38.4 105.8 74.9
Oct 39.9 33.7 0.0 73.6 0.0 0.0 0.0 -9.6 0.1 42.8 106.9 73.6
Nov 39.4 33.3 0.0 72.7 0.0 0.0 0.0 -10.9 0.1 44.4 106.3 72.7
Dec 36.9 31.2 0.0 68.1 0.0 0.0 0.0 -17.9 0.1 49.7 100.0 68.1
2015
Jan 39.0 40.9 0.0 80.0 11.7 0.0 0.0 -47.0 8.3 70.7 123.8 80.0
Feb 38.4 40.4 0.0 78.7 11.7 0.0 0.0 -48.7 8.3 75.6 125.7 78.7
Mar 68.6 12.1 0.0 80.7 12.0 0.0 0.0 -50.7 8.2 75.2 125.5 80.7
Apr 63.9 0.0 0.0 63.9 0.0 0.0 0.0 -27.5 0.0 62.4 98.9 63.9
May 63.9 0.0 0.0 63.9 0.0 0.0 0.0 -28.8 0.0 64.2 99.3 63.9
Jun 62.9 0.0 0.0 62.9 0.0 0.0 0.0 -28.9 0.0 65.6 99.6 62.9
Jul 62.9 0.0 0.0 62.9 0.0 0.0 0.0 -27.8 0.0 64.8 100.0 62.9
Aug 62.9 0.0 0.0 62.9 0.0 0.0 0.0 -14.9 0.0 51.3 99.4 62.9
Sep 62.2 0.0 0.0 62.2 0.0 0.0 0.0 -15.3 0.0 52.0 98.9 62.2
Oct 61.9 0.0 0.0 61.9 0.0 0.0 0.0 -16.4 0.0 53.2 98.8 61.9
Nov 39.4 33.3 0.0 72.7 0.0 0.0 0.0 -10.9 0.1 44.4 106.3 72.7
Amounts Owing to
TABLE 8.2 : ACCEPTING HOUSES - LIABILITIES
US$ Millions

MONTHLY ECONOMIC REVIEW
24
Foreign Mortgage Other Other Non Financial TOTALEnd of Notes Total Other Balances Advances Advances Assets Assets
& Balances Nostro with RBZ/1
Bond Coin with Other Balances Trade Treasury Agris Pes
at Banks at Banks Banks Bills
2014
Jan 0.0 30.9 147.5 0.0 0.2 40.0 0.0 218.6 0.0 384.5 136.4 64.4 125.3 929.1
Feb 0.0 30.2 165.0 0.0 0.2 40.0 0.0 235.3 0.0 385.8 132.0 65.4 125.4 943.9
Mar 0.0 47.5 166.2 0.0 0.2 40.0 0.0 253.8 0.0 390.4 132.1 68.8 125.0 970.1
Apr 0.0 45.2 161.0 0.0 0.2 40.0 0.0 246.5 0.0 401.8 132.4 76.6 124.7 981.9
May 0.0 47.7 190.7 0.0 0.2 40.0 0.0 278.6 0.0 394.0 147.0 82.7 124.3 1026.7
Jun 0.0 39.5 187.9 0.0 0.0 40.0 0.0 267.4 0.0 400.0 150.4 84.0 124.4 1026.1
Jul 0.0 40.6 180.9 0.0 0.0 40.0 0.0 261.5 0.0 431.8 159.4 84.1 124.4 1061.2
Aug 0.0 17.8 219.8 0.0 0.0 51.4 0.0 289.1 0.0 442.4 166.5 86.4 124.2 1108.6
Sep 0.0 51.2 183.1 0.0 0.0 51.4 0.0 285.7 0.0 452.1 173.8 95.6 123.8 1131.0
Oct 0.0 37.1 199.8 0.0 0.0 51.7 0.0 288.6 0.0 483.1 179.7 102.2 124.0 1177.6
Nov 0.0 53.2 217.5 0.0 0.0 32.8 0.0 303.5 0.0 512.4 169.3 109.0 123.5 1217.6
Dec 0.1 47.0 224.9 0.0 0.2 52.6 0.0 324.8 0.0 512.9 169.0 102.9 125.3 1234.9
2015
Jan 0.1 37.3 196.0 0.0 0.1 51.8 0.0 307.1 0.0 511.6 172.1 105.8 126.1 1222.6
Feb 0.1 32.1 244.4 0.0 0.1 51.9 0.0 328.6 0.0 522.9 176.2 106.8 125.8 1260.2
Mar 0.1 52.4 214.4 0.0 0.1 52.0 0.0 319.0 0.0 508.7 180.0 122.5 125.5 1255.5
Apr 0.1 32.5 243.2 0.0 0.1 60.4 0.0 336.3 0.0 520.2 182.5 118.3 124.8 1282.0
May 0.1 33.6 257.7 0.0 0.1 60.1 0.0 351.5 0.0 448.7 235.1 137.5 125.2 1298.0
Jun 0.2 59.6 204.9 0.0 0.1 60.1 0.0 324.8 0.0 464.9 231.9 139.4 122.0 1283.0
Jul 0.2 51.6 205.5 0.0 0.1 62.9 0.0 320.2 0.0 461.5 230.6 133.9 121.9 1268.2
Aug 0.1 53.0 158.9 0.0 0.1 76.2 0.0 288.4 0.0 482.9 228.4 136.0 122.2 1257.9
Sep 0.1 55.4 161.7 0.0 0.1 76.0 0.0 293.3 0.0 480.4 235.9 153.3 122.1 1285.0
Oct 0.1 45.2 229.1 0.0 0.1 76.0 0.0 350.5 0.0 494.0 237.8 153.3 122.8 1358.4
Nov 0.0 53.2 217.5 0.0 0.2 32.8 0.0 303.6 0.0 512.4 169.3 109.0 123.5 1217.8
Liquid Assets Securities
TABLE 9.1 : BUILDING SOCIETIES - ASSETS
US$ Millions
MONTHLY ECONOMIC REVIEW
25
Of which
Capital Other Total Liabilities to the
and Liabilities Public
End of Savings and Short-term Long-term Total Foreign Liabilities Other Banks Reserves
2014
Jan 313.9 253.1 567.0 26.1 80.6 225.9 29.5 929.1 567.0
Feb 318.7 264.4 583.1 25.1 81.3 228.6 25.8 943.9 583.1
Mar 374.6 234.6 609.2 24.7 79.6 231.4 25.2 970.1 609.2
Apr 358.4 262.7 621.1 24.9 76.5 234.0 25.4 981.9 621.1
May 436.2 233.2 669.4 24.7 77.3 238.0 17.1 1026.7 669.4
Jun 440.1 212.2 652.3 34.8 78.9 243.1 17.3 1026.3 652.3
Jul 362.4 302.9 665.3 30.1 104.3 244.2 17.5 1061.3 665.3
Aug 358.8 336.8 695.5 35.7 105.7 250.6 21.2 1108.7 695.5
Sep 394.8 297.6 692.4 54.2 106.9 253.5 23.9 1131.0 692.4
Oct 364.5 368.0 732.5 54.2 105.3 258.5 27.3 1177.7 732.5
Nov 376.9 392.0 768.9 54.6 104.4 262.9 27.2 1217.8 768.9
Dec 400.9 387.5 788.4 54.2 102.0 262.7 27.6 1234.9 788.4
2015
Jan 373.0 397.1 770.2 54.6 99.1 267.8 31.0 1222.6 770.2
Feb 405.8 400.3 806.2 53.6 98.3 272.9 29.2 1260.2 806.2
Mar 408.1 386.3 794.4 50.8 108.8 275.8 25.8 1255.5 794.4
Apr 464.1 364.8 828.9 48.3 99.4 276.8 28.7 1282.0 828.9
May 472.0 391.6 863.6 48.5 87.4 270.7 27.8 1298.0 863.6
Jun 492.9 343.9 836.8 48.3 94.0 272.9 31.1 1283.0 836.8
Jul 458.3 370.6 828.9 48.5 85.8 277.4 27.5 1268.2 828.9
Aug 438.4 386.1 824.5 47.6 73.2 282.7 29.9 1257.9 824.5
Sep 498.9 334.3 833.2 43.5 84.9 288.4 35.0 1285.0 833.2
Oct 465.3 428.4 893.7 42.4 99.0 293.6 29.7 1358.4 893.7
Nov 376.9 392.0 768.9 54.6 104.4 262.9 27.2 1217.8 768.9
Deposits
TABLE 9.2 : BUILDING SOCIETIES - LIABILITIES
US$ Millions
Amounts Owing to
MONTHLY ECONOMIC REVIEW
26
Market Capitalisation
Industrial Mining Market Turnover(US$) Volume of Shares US$ Millions
2014
Jan 189.25 35.4 63,972,387.0 170,104,078 4,882.1
Feb 189.45 39.24 25,811,746.9 135,455,029 4,906.9
Mar 176.32 29.51 28,884,400.2 381,649,234 4,560.3
Apr 172.91 29.64 51,346,054.5 429,085,166 4,473.5
May 174.89 35.45 35,903,574.8 235,704,129 4,485.1
Jun 186.57 61.32 28,544,304.7 178,469,676 4,873.4
July 188.07 95.00 25,224,550.4 322,407,141 4,959.2
Aug 196.43 104.8 66,399,632.9 328,161,452 5,186.6
Sep 195.25 92.75 34,056,010.7 210,942,393 5,140.2
Oct 177.88 70.38 28,256,642.5 156,444,539 4,664.8
Nov 171.45 64.39 34,765,242.8 155,854,066 4,517.9
Dec 162.79 71.71 29,701,204.8 475,024,051 4,327.0
2015
Jan 164.9 58.13 16,062,740.8 57,390,451 4,365.1
Feb 167.16 55.38 34,775,616.2 119,324,114 4,353.4
Mar 158.22 43.92 18,903,881.0 405,884,918 4,117.1
Apr 156.23 42.93 29,188,562.0 563,833,853 4,066.1
May 152.96 44.45 23,280,422.2 290,320,685 3,978.1
Jun 148.40 44.30 14,514,679.0 80,441,278 3,803.8
Jul 145.35 39.36 20,419,108.0 157,184,218 3,812.7
Aug 135.43 35.34 15,344,249.0 76,187,436 3,552.0
Sep 131.93 24.36 18,202,232.0 105,678,504 3,444.5
Oct 130.83 23.57 12,864,086.0 63,758,585 3,416.1
Nov 117.55 22.33 8,947,586.0 90,417,554 3,141.7
Indices
Table 10: ZIMBABWE STOCK MARKET STATISTICS
MONTHLY ECONOMIC REVIEW
27
Commercial Building
End of Banks P.O.S.B. Societies TOTAL
2014
May 1,427.5 77.5 669.4 2,209.0
Jun 1,495.8 81.3 652.3 2,262.6
Jul 1,499.5 84.2 665.3 2,282.7
Aug 1,502.9 84.0 695.5 2,322.9
Sep 1,573.8 88.6 692.4 2,388.8
Oct 1,525.0 87.5 732.5 2,378.7
Nov 1,469.9 89.8 768.9 2,361.8
Dec 1,473.1 84.8 788.4 2,377.5
2015
Jan 1,557.9 86.3 770.2 2,455.2
Feb 1,487.7 90.4 806.2 2,384.2
Mar 1,453.7 93.6 794.4 2,353.9
Apr 1,573.3 90.4 828.9 2,492.6
May 1,630.6 89.2 863.6 2,583.4
Jun 1,615.4 95.1 836.8 2,547.3
Jul 1,622.2 92.4 828.9 2,543.5
Aug 1,514.0 93.1 824.5 2,431.5
Sep 1,616.2 101.3 833.2 2,550.7
Oct 1,577.1 97.5 893.7 2,568.3
Nov 1,399.7 89.8 768.9 2,258.3
1/ Comprises all deposits other than demand deposits.
TABLE 11 : SAVINGS /1 WITH FINANCIAL INSTITUTIO NS
US$ Millions
MONTHLY ECONOMIC REVIEW
28
Liquid Prescribed Excess Liquid Prescribed Excess
assets liquid liquid assets liquid Liquid
End of held assets/1 assets held assets/1 assets
2014May 1,700.6 1,116.7 583.9 1.9 23.2 -21.3Jun 1,716.1 1,123.4 592.7 1.2 22.8 -21.6Jul 1,553.7 1,089.0 464.7 0.9 22.9 -22.0Aug 1,618.6 1,111.6 507.0 1.3 23.0 -21.7Sep 1,664.2 1,129.4 534.7 1.1 22.5 -21.3Oct 1,644.7 1,135.7 508.9 1.7 22.1 -20.3Nov 1,602.2 1,110.5 491.7 1.0 21.8 -20.8
Dec 1,571.0 1,107.9 463.1 1.7 20.4 -18.7
2015
Jan 1,581.9 1,084.2 497.7 2.0 24.0 -22.0
Feb 1,524.2 1,070.2 454.0 2.5 23.6 -21.2
Mar 1,543.8 1,077.9 465.9 2.1 24.2 -22.1
Apr 1,528.6 1,101.6 427.0 0.6 19.2 -18.6
May 1,779.2 1,128.7 650.4 0.6 19.2 -18.5
Jun 1,962.4 1,148.6 813.8 0.7 18.9 -18.2
Jul 1,900.7 1,136.6 764.1 2.0 18.9 -16.9
Aug 1,925.3 1,134.2 791.0 2.0 18.9 -16.9
Sep 1,949.4 1,167.9 781.6 2.5 18.6 -16.1
Oct 1,964.9 1,151.1 813.8 2.4 18.6 -16.2
Nov 1,602.7 1,058.4 544.3 1.0 21.8 -20.8
1/ With effect from 1 August 2011, the prescribed liquid asset ratio was reviewed to 25% of liabilities to the public, from 20%.
US$ Millions
TABLE 12 : ANALYSIS OF LIQUID ASSETS OF MONETARY BANKS
Commercial Banks Accepting Houses
MONTHLY ECONOMIC REVIEW
29
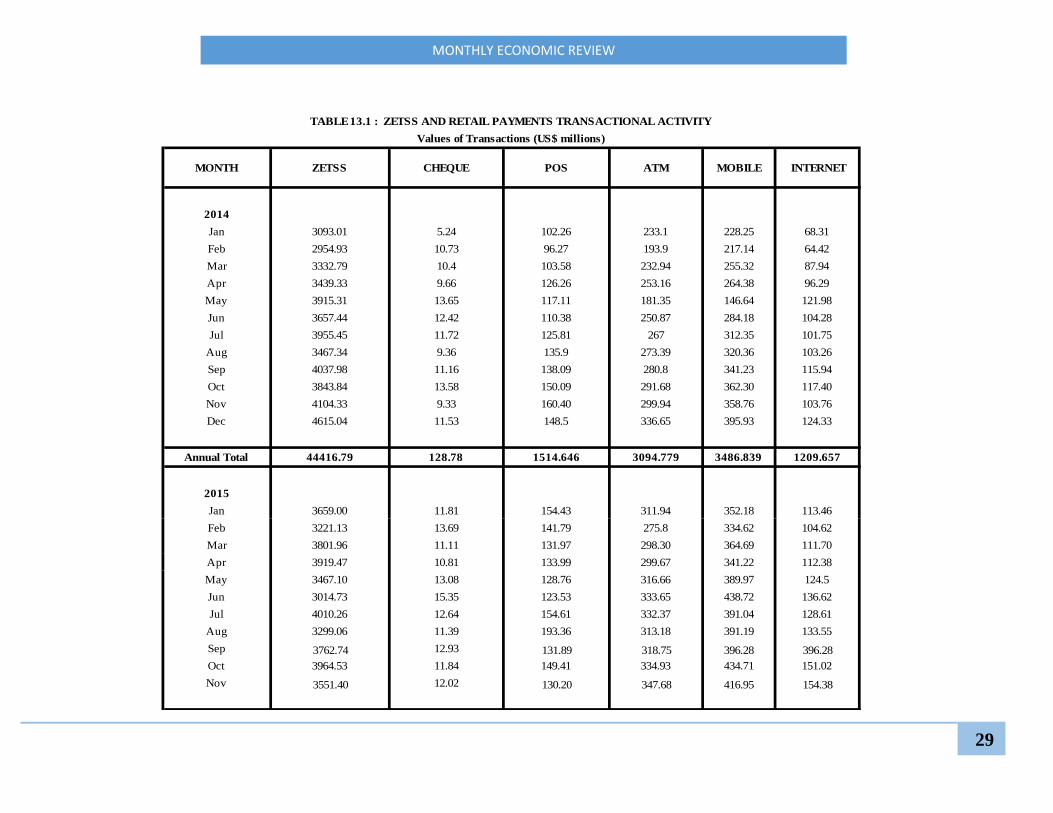
MONTH ZETSS CHEQUE POS ATM MOBILE INTERNET
2014
Jan 3093.01 5.24 102.26 233.1 228.25 68.31
Feb 2954.93 10.73 96.27 193.9 217.14 64.42
Mar 3332.79 10.4 103.58 232.94 255.32 87.94
Apr 3439.33 9.66 126.26 253.16 264.38 96.29
May 3915.31 13.65 117.11 181.35 146.64 121.98
Jun 3657.44 12.42 110.38 250.87 284.18 104.28
Jul 3955.45 11.72 125.81 267 312.35 101.75
Aug 3467.34 9.36 135.9 273.39 320.36 103.26
Sep 4037.98 11.16 138.09 280.8 341.23 115.94
Oct 3843.84 13.58 150.09 291.68 362.30 117.40
Nov 4104.33 9.33 160.40 299.94 358.76 103.76
Dec 4615.04 11.53 148.5 336.65 395.93 124.33
Annual Total 44416.79 128.78 1514.646 3094.779 3486.839 1209.657
2015
Jan 3659.00 11.81 154.43 311.94 352.18 113.46
Feb 3221.13 13.69 141.79 275.8 334.62 104.62
Mar 3801.96 11.11 131.97 298.30 364.69 111.70
Apr 3919.47 10.81 133.99 299.67 341.22 112.38
May 3467.10 13.08 128.76 316.66 389.97 124.5
Jun 3014.73 15.35 123.53 333.65 438.72 136.62
Jul 4010.26 12.64 154.61 332.37 391.04 128.61
Aug 3299.06 11.39 193.36 313.18 391.19 133.55
Sep 3762.74 12.93 131.89 318.75 396.28 396.28
Oct 3964.53 11.84 149.41 334.93 434.71 151.02
Nov 3551.40 12.02 130.20 347.68 416.95 154.38
TABLE 13.1 : ZETSS AND RETAIL PAYMENTS TRANSACTIONAL ACTIVITY
Values of Transactions (US$ millions)
MONTHLY ECONOMIC REVIEW
30
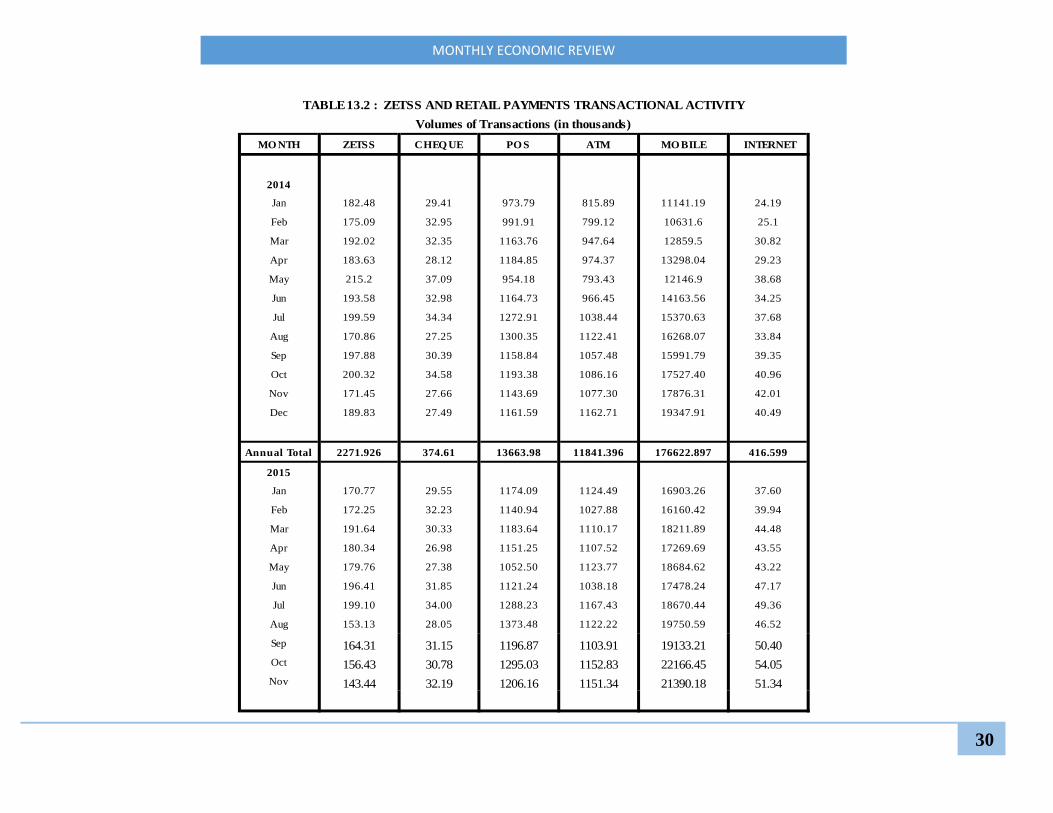
MO NTH ZETSS CHEQ UE PO S ATM MO BILE INTERNET
2014
Jan 182.48 29.41 973.79 815.89 11141.19 24.19
Feb 175.09 32.95 991.91 799.12 10631.6 25.1
Mar 192.02 32.35 1163.76 947.64 12859.5 30.82
Apr 183.63 28.12 1184.85 974.37 13298.04 29.23
May 215.2 37.09 954.18 793.43 12146.9 38.68
Jun 193.58 32.98 1164.73 966.45 14163.56 34.25
Jul 199.59 34.34 1272.91 1038.44 15370.63 37.68
Aug 170.86 27.25 1300.35 1122.41 16268.07 33.84
Sep 197.88 30.39 1158.84 1057.48 15991.79 39.35
Oct 200.32 34.58 1193.38 1086.16 17527.40 40.96
Nov 171.45 27.66 1143.69 1077.30 17876.31 42.01
Dec 189.83 27.49 1161.59 1162.71 19347.91 40.49
Annual Total 2271.926 374.61 13663.98 11841.396 176622.897 416.599
2015
Jan 170.77 29.55 1174.09 1124.49 16903.26 37.60
Feb 172.25 32.23 1140.94 1027.88 16160.42 39.94
Mar 191.64 30.33 1183.64 1110.17 18211.89 44.48
Apr 180.34 26.98 1151.25 1107.52 17269.69 43.55
May 179.76 27.38 1052.50 1123.77 18684.62 43.22
Jun 196.41 31.85 1121.24 1038.18 17478.24 47.17
Jul 199.10 34.00 1288.23 1167.43 18670.44 49.36
Aug 153.13 28.05 1373.48 1122.22 19750.59 46.52
Sep 164.31 31.15 1196.87 1103.91 19133.21 50.40
Oct 156.43 30.78 1295.03 1152.83 22166.45 54.05
Nov 143.44 32.19 1206.16 1151.34 21390.18 51.34
TABLE 13.2 : ZETSS AND RETAIL PAYMENTS TRANSACTIONAL ACTIVITY
Volumes of Transactions (in thousands)


![Monthly Economic Reviewbsl.gov.sl/MER October 2019- Finalised Version.pdf · Monthly Economic Review October 2019 Publisher: The Monthly Economic Review [MER] is published by the](https://static.documents.pub/doc/80x56/5eddde83ad6a402d66691757/monthly-economic-october-2019-finalised-versionpdf-monthly-economic-review-october.jpg)


