1 First sales in Europe: Denmark: Plaice and cod Norway: Haddock and mackerel Global Supply Case study: Hake in Spain Consumption: Anchovy and salmon Macroeconomic context ISSN 2314-9671 CONTENTS Find all data and information and much more on: www.eumofa.eu In this issue Belgium, Denmark, France, Lithuania, Norway, Portugal and Sweden registered increase of first-sales value in the first seven months of 2015. In Denmark, the increase in herring, cod, and saithe first-sales prices caused an overall increase in value (+17%) during the first seven months of 2015. Lower volume of mussels (−76%) caused a decrease in the overall first-sales volume. Norway registered in July 2015 higher prices for cod and Greenland halibut, as well as smaller landings especially for capelin. In Spain the production of marine finfish grew 12% in 2014 compared with 2013. Seabass, and trout experienced the highest production growth rates. Meanwhile, the first-sales prices for seabass increased 8%, while those for trout had an opposite trend, showing an 11% decrease. The main aquaculture product in Spain in volume is mussel (200.000 tonnes). The Russian embargo on certain food products from the EU, Norway, USA, Canada and Australia was extended in August 2015 to products from other countries including Iceland. Iceland was so far one the leading country of origin for Russian seafood imports in particular frozen herring. In addition, the Russian embargo which concerns fresh and frozen fish has been extended for an additional year until August 2016. In Spain, the most important market for fresh anchovy, retail prices are the highest among the Member States surveyed. In Italy, prices were relatively stable during the period observed and exhibited a slightly increasing trend. Marine fuel in fish harbours in France, Italy and Spain has averaged between 42 and 45 cents/litre in August 2015. It confirms the decrease observed since the beginning of the year, −30% on a year-to-year basis (September 2014-August 2015). No. 8/2015 MONTHLY HIGHLIGHTS
Transcript
1
First sales in Europe:
Denmark: Plaice and cod Norway: Haddock and mackerel
Global Supply
Case study: Hake in Spain
Consumption: Anchovy and salmon
Macroeconomic context
ISSN 2314-9671
CONTENTS
Find all data and information and much more on:
www.eumofa.eu
In this issue Belgium, Denmark, France, Lithuania, Norway, Portugal and Sweden registered increase of first-sales value in the first seven months of 2015. In Denmark, the increase in herring, cod, and saithe first-sales prices caused an overall increase in value (+17%) during the first seven months of 2015. Lower volume of mussels (−76%) caused a decrease in the overall first-sales volume. Norway registered in July 2015 higher prices for cod and Greenland halibut, as well as smaller landings especially for capelin. In Spain the production of marine finfish grew 12% in 2014 compared with 2013. Seabass, and trout experienced the highest production growth rates. Meanwhile, the first-sales prices for seabass increased 8%, while those for trout had an opposite trend, showing an 11% decrease. The main aquaculture product in Spain in volume is mussel (200.000 tonnes).
The Russian embargo on certain food products from the EU, Norway, USA, Canada and Australia was extended in August 2015 to products from other countries including Iceland. Iceland was so far one the leading country of origin for Russian seafood imports in particular frozen herring. In addition, the Russian embargo which concerns fresh and frozen fish has been extended for an additional year until August 2016.
In Spain, the most important market for fresh anchovy, retail prices are the highest among the Member States surveyed. In Italy, prices were relatively stable during the period observed and exhibited a slightly increasing trend.
Marine fuel in fish harbours in France, Italy and Spain has averaged between 42 and 45 cents/litre in August 2015. It confirms the decrease observed since the beginning of the year, −30% on a year-to-year basis (September 2014-August 2015).
European Market Observatory for Fisheries and Aquaculture Products
1. First sales in Europe
In January–July 2015, ten EU Member States and Norway reported first-sales data for ten commodity groups.1 First sales increased over the previous year (January–July 2014) in both value and volume for five of the reporting countries.
In Belgium, squid, plaice, ray, and cuttlefish were the main contributors to increased first sales in volume and value in the first seven months of 2015. Prices register a significant decrease for squid (−44%) and cuttlefish (−13%). By contrast, in July 2015, first sales of sole experienced important increases (31% in value and 12% in volume), and a 17% rise in the average price. In France, the good results during the first seven months of 2015 (+8% in value) relied on the positive evolution of first sales in the major ports (+23% Lorient, +18% Boulogne-sur-Mer, +10% Le Guilvinec) and on the significant rise in unit prices (+13% on average). This was the case for hake (highest in volume) during this period (+10% over January–July 2014), which experienced a 13% price increase. Monk and sole had the highest first-sales values. Monk increased 5% in value with a stable price, while sole first-sales volume decreased 14% and prices increased 9%. In July 2015, first sales in France decreased strongly in volume (−13%) but increased in value (+7%), thanks to a considerable unit-price rise (+24%). Reduced supplies in July 2014 of sardine (−50% in volume), haddock (−46%), sole (−27%), and hake (−14%) caused significant rises in unit prices (+24%, +53%, +22%, and +21%, respectively). In July 2015, first sales in Greece increased significantly in volume (+14%) but decreased slightly in value (−5%). This situation can be explained by a change in the structure of landings (a larger portion of low-priced species such as small pelagics) and by unit-price decreases for some major species (−15% for sardine, −21% for anchovy, and −3% for hake). The same evolution is observed for the period January–July 2015. The significant increase in the volume landed in Piraeus (+7%) did not prevent a decrease in first-sales value (−5%). The same influences were felt: a larger portion of low-unit-price species (small pelagics) in the total sales (58% of total volumes in 2015 vs. 54% in 2014) and unit-price decreases for some leading species (e.g. −19% for anchovy, −13% for albacore tuna, and −16% for red mullet). In Latvia, sprat was the main cause of the overall decrease in first sales. Prices fell 18% from January–July 2014, owing to a lack of demand by the Latvian canning industry, which uses sprat as raw material. However, in July 2015, first sales increased significantly,
mainly because of increased value and volume of herring (+32% and +49%, respectively) over July 2014.
In Portugal, July 2015 first sales were dominated by small pelagics, which represented 78% of volume and 57% of value (+35% and +13%, respectively, over July 2014); first sales of most species increased in value (mackerel +62%, horse mackerel +46%, and anchovy +189%); only sardine decreased slightly (−3%). Noticeable decreases in value were observed for octopus (−36%) and shrimp (−46%). In the period January–July 2015, most commodity groups increased or at least stabilised, compared with the same period in 2014. Groundfish experienced a moderate decrease in value (−4%), mostly caused by hake (−13%), whiting (−24%), and blue whiting (−22%). The most noticeable increases in value were for anchovy (+488%), squid (+144%), small pelagics (+62%), mackerel (+43%), horse mackerel (+28%), and turbot (+25%).
Spain landed 134.500 tonnes of fresh fish in January–July 2015, an 11% decrease, compared with the same period in 2014. This trend was confirmed in July 2015, when Spain landed 17.000 tonnes of fresh fish, 27% less than in July 2014. In January–July 2015, 16 out of the 22 reporting fishing ports recorded decreases in volume from the same period last year.2
In Sweden, first-sales value in January–July 2015 was EUR 56,25 million, a 5% increase over the first seven months last year. First-sales volume was 114.408 tonnes (+9%). Herring was one of the main contributors to the increase in both value (+18%) and volume (+25%). But, in the same period some species decreased, including sprat, 40% in value and 38% in volume. In July 2015, first-sales value was EUR 5,9 million, a 25% increase over July 2014. First-sales volume was 2.479 tonnes (+52%). The increase in first-sales value and volume was mainly the result of an increase in landings of herring (+116%). First-sales value increased 78% over July last year. In the UK, first-sales value in January–July 2015 was EUR 402 million, approximately the same as in the corresponding period in 2014, while first-sales volume decreased 11%, ending at 219.218 tonnes. The decrease in first-sales volume was caused mainly by smaller landings of mackerel, following the reduction in quotas in 2015, dropping 41% from the same period last year. In July 2015, first-sales value increased 1% to EUR 64,19 million. First-sales volume decreased 9% in the same month, to 34.343 tonnes. The slight increase in first-sales value and the decrease in first-sales volume were caused mainly by higher prices and smaller landings of the two groundfish species, haddock and cod.
3
MONTHLY HIGHLIGHTS | NO. 8/2015
European Market Observatory for Fisheries and Aquaculture Products
Table 1. JANUARY–JULY OVERVIEW OF THE REPORTING COUNTRIES (volume in tonnes and value in million euro)
Country January–July 2013 January–July 2014 January–July 2015
Change from January–July 2014
Volume Value Volume Value Volume Value Volume Value
Portugal 59.841 100,24 52.848 100,50 59.417 109,17 12% 9%
Sweden 105.088 63,89 105.084 53,40 114.408 56,25 33% 23%
United Kingdom 190.459 273,80 247.265 403,34 219.218 402,04 -11% 0%
Source: EUMOFA (updated 10.09.2015); volume data is reported in net weight. *Partial data. First-sales data for Greece covers the port of Piraeus (35%). First-sales data for Italy covers 11 ports (10%). First-sales data for Lithuania covers the Klaipeda fish auction.
Table 2. JULY OVERVIEW OF THE REPORTING COUNTRIES (volume in tonnes and value in million euro)
Country July 2013 July 2014 July 2015
Change from July 2014
Volume Value Volume Value Volume Value Volume Value
Portugal 15.336 20,01 10.625 20,72 13.930 21,92 31% 6%
Sweden 1.017 4,22 1.630 4,73 2.479 5,90 52% 25%
United Kingdom 29.815 41,56 37.877 63,84 34.343 64,19 -9% 1%
Source: EUMOFA (updated 10.09.2015); volume data is reported in net weight. *Partial data. First-sales data for Greece covers the port of Piraeus (35%). First-sales data for Italy covers 11 ports (10%). First-sales data for Lithuania covers the Klaipeda fish auction.
4
MONTHLY HIGHLIGHTS | NO. 8/2015
European Market Observatory for Fisheries and Aquaculture Products
1.1. DENMARK
Fishing is an important economic activity in Denmark, especially for the western and northern Jutland regions, as well as the island of Bornholm.
The Danish fishing fleet is highly diversified and has a broad range of vessels, which operate predominantly in the North Sea, Baltic Sea, and the North Atlantic. Of the approximately 1.500 active fishing vessels, 50% are small scale, shorter than 12 m, use static gears, and fish largely in the Baltic Sea, the Sounds, and the Kattegat. The large-scale fleet targets a wide variety of species including cod, flatfish, Norway lobster, herring, mackerel, sprat, and sandeel, and they fish in the Baltic Sea, the Sounds, the Kattegat, the Skagerrak, the North Sea, and the Norwegian Sea.3
Fish is landed in more than 250 ports and landing points. In 2014, the total value of fish landed in Denmark was EUR 446 million corresponding to over one million tonnes.4 70% of the volume of landings or 719.000 tonnes are used for industrial purposes, i.e. fishmeal and fish oil production. In value, this represents 23% of total landings. The main species are sandeel, Norway pout, blue whiting and sprat and they are subject to total allowable catches (TACs). Denmark gets almost the entire EU quota for Norway pout and sandeel (94%). For 2015, these are 129.000 tonnes and 305.000 tonnes respectively, 20% and 56% higher than in 2014. For sprat, Denmark’s quota is about half the EU’s. In 2015 it was set at 243.500 tonnes, 43% higher than the previous year.
Figure 1. FIRST SALES IN DENMARK BY MAIN SPECIES (2014)
Source: EUMOFA (updated 10.09.2015).
The Danish fishing fleet takes multiple species for human consumption and the most important ports are also located on the west coast of Jutland; Hanstholm, Hirtshals, and Skagen receive most of the landings. Cod, herring, Norway lobster, plaice, and saithe were among the most valuable species landed and sold in Denmark in 2014, and accounted for 64% of the fish landed for human consumption.
Figure 2. JANUARY–JULY FIRST SALES IN DENMARK
Source: EUMOFA (updated 10.09.2015).
In January–July 2015, first-sales value of all reported species increased 17% and volume decreased 27% compared to January–July last year. Cod, herring, plaice, Norway lobster, and saithe accounted for 50% of total first-sales value and 71% of total first-sales volume in January–July 2015. Except for Norway lobster, which experienced a 15% decrease in first-sales value, all other main species experienced increases, of which the highest were saithe (+36%) and herring (+33%). The other species experiencing important increases in first-sales value were cod (+24%), plaice (+19%), and hake (+91%). First-sales volume of main species increased, except for Norway lobster (−17%), compared with January–July 2014. A substantial decrease of first-sales volume of mussel (−76%), caused the overall decrease in first-sales volume. The average price of the five main commercial species landed was higher than in January–July 2014, led by herring (+20%), plaice (+16%), and saithe (12%). In July 2015, both first-sales value and volume of these species increased significantly over July 2014.This was primarily the result of herring, cod, hake, and saithe.
Figure 3. JANUARY–JULY FIRST SALES IN DENMARK BY MAIN SPECIES (million EUR)
Source: EUMOFA (updated 10.09.2015).
0
10
20
30
40
50
60
0
20
40
60
80
100
120
Valu
e
Volu
me
Volume (1000 tonnes) Value (million EUR)
0
20
40
60
80
100
120
140
160
180
0
20
40
60
80
100
120
140
160
180
200
Jan-Jul 2013 Jan-Jul 2014 Jan-Jul 2015
Valu
e
Volu
me
Volume (1000 tonnes) Value (million EUR)
0
5
10
15
20
25
30
35
Cod Herring Norwaylobster
Plaice Saithe
Jan-Jul 2013 Jan-Jul 2014 Jan-Jul 2015
5
MONTHLY HIGHLIGHTS | NO. 8/2015
European Market Observatory for Fisheries and Aquaculture Products
1.1.1. PLAICE
Plaice is a demersal flatfish living in marine and brackish waters at depths of up to 200 m. Plaice is a bottom dweller, using sand as camouflage. It is active at
night and feeds on small bottom-dwelling invertebrates including clams and worms.5
The species is easily identified by distinctive orange spots, which also indicate freshness (the brighter the spots, the fresher the plaice). The quality of the fish is conditioned by the spawning cycle. The flesh is thin and watery during and after spawning. Timing of spawning depends on the stock.6 Stocks are not threatened by overfishing.
Most plaice is caught by trawler (60–70%) and gillnet fisheries. In the North Sea, where most of the catches occur, plaice is caught in mixed fisheries along with sole.7
The species is subject to total allowable catches (TACs). Denmark has about 26% of the total EU quota. In 2015 it was set at 36.548 tonnes, the highest since 2010 (+56%). The adult plaice stocks in the North Sea, Kattegat, and Skagerrak, as well as in the Baltic, are developing positively in size.
Plaice is caught year-round, with peaks during April–May and September–October, when the fish is most abundant.
Plaice landed in Denmark is mainly exported whole, chilled, to northern European markets; it is consumed domestically and, to a lesser extent, is exported as frozen fillets to a variety of European countries.8
The Danish Fishermen’s Producer Organisation achieved MSC certification for 2.500 tonnes of North Sea plaice.
In January–July 2015, the accumulated first sales of plaice reached EUR 19,44 million and 13.500 tonnes, an increase in both value (+19%) and volume (+3%) over January–July last year.
Figure 4. PLAICE: FIRST-SALES IN DENMARK
Source: EUMOFA (updated 10.09.2015).
Figure 5. PLAICE: FIRST-SALES PRICE IN DENMARK
Source: EUMOFA (updated 10.09.2015).
The average unit price of plaice in January–July 2015 was 1,44 EUR/kg, a 16% increase over January–July 2014.
0,80
0,90
1,00
1,10
1,20
1,30
1,40
1,50
1,60
1,70
1,80
Se
p
Nov
Jan
Ma
r
May
Jul
Se
p
Nov
Jan
Mar
May
Jul
Se
p
Nov
Jan
Ma
r
May
Jul
2012 2013 2014 2015
EU
R/k
g
0,0
0,5
1,0
1,5
2,0
2,5
3,0
3,5
4,0
4,5
0,0
0,5
1,0
1,5
2,0
2,5
3,0
3,5
Se
pN
ov
Jan
Ma
rM
ay
Jul
Se
pN
ov
Jan
Mar
Ma
yJul
Se
pN
ov
Jan
Ma
rM
ay
Jul
2012 2013 2014 2015
Valu
e
Volu
me
Volume (1000 tonnes) Value (million EUR)
6
MONTHLY HIGHLIGHTS | NO. 8/2015
European Market Observatory for Fisheries and Aquaculture Products
1.1.2. COD
Cod is found on the continental shelves and in coastal waters throughout the North Atlantic. Cod is a demersal species, living at
depths of less than 200 m. However, in the Baltic Sea, owing to the lack of oxygen at lower depths, cod behaviour is pelagic, living in midwater.9 The presence of cod usually depends on prey distribution rather than on water temperature. However, larger individuals are found in colder waters (0–5 °C). Cod lives in water ranging from nearly fresh to full oceanic/salt water, in a wide range of temperatures.10 Because cod preys mainly on herring and sprat, the fishery for these species can influence the availability of food for cod. Conversely, the cod fishery can affect the sprat and herring stocks indirectly, by changing predation mortality on these species. Denmark’s main fishing grounds for cod are the North Sea and the Skagerrak, as well as the Western and the Eastern Baltic Sea. Cod is fished mainly with trawls and gillnets in mixed demersal fisheries, along with other species such as plaice, dab, flounder, and turbot. The species is subject to total allowable catches (TACs). In addition, management plans have been in place in the North and the Baltic seas. A new multi-annual management plan is under development in the Baltic Sea. The Danish quota for cod represents 16%–19% of the total EU quota. For 2015, the Danish quota was set at 27.109 tonnes, the lowest since 2010 and 11% lower than in 2014. Cod is caught year-round, with peaks during January–March, when the supply is abundant.
In January–July 2015, the accumulated first sales of cod reached EUR 30,63 million and 14.900 tonnes. This was an increase in both value (+24%) and volume (+20%), over January–July last year.
Figure 6. COD: FIRST SALES IN DENMARK
Source: EUMOFA (updated 10.09.2015).
Figure 7. COD: FIRST-SALES PRICE IN DENMARK
Source: EUMOFA (updated 10.09.2015).
The average unit price of cod in January–July 2015 was 2,06 EUR/kg, a 4% increase over January–July 2014, when fewer fish were landed.
0,00
0,50
1,00
1,50
2,00
2,50
3,00
3,50
4,00
Se
p
Nov
Jan
Ma
r
May
Jul
Se
p
Nov
Jan
Ma
r
May
Jul
Se
p
Nov
Jan
Ma
r
May
Jul
2012 2013 2014 2015
EU
R/k
g
0,0
1,0
2,0
3,0
4,0
5,0
6,0
7,0
0,0
0,5
1,0
1,5
2,0
2,5
3,0
Se
pN
ov
Jan
Mar
May
Jul
Se
pN
ov
Jan
Mar
May
Jul
Se
pN
ov
Jan
Mar
May
Jul
2012 2013 2014 2015
Valu
e
Volu
me
Volume (tonnes) Value (million EUR)
7
MONTHLY HIGHLIGHTS | NO. 8/2015
European Market Observatory for Fisheries and Aquaculture Products
1.2. NORWAY
With a coastline stretching for more than 83.000 km, including fjords and islands, Norway has the second longest coastline after Canada and is one of the leading nations in marine fisheries and aquaculture production.11 In addition to commercial fisheries, aquaculture is an important economic activity, with farmed Atlantic salmon accounting for more than 50% of the world’s supply. Rainbow trout is also important for Norway’s aquaculture industry.12 Salmon and trout farming takes place along most of Norway’s coastline, from Lindesnes in the south, and nearly to the Russian border in the north with more than 1.000 sea-sites under operation. The Norwegian offshore fleet comprises four segments: industrial trawlers, purse-seiners, longliners, and cod, saithe, and shrimp trawlers. The number of fishermen has decreased steadily to 9.400 in 2014 (a decrease of 9% compared to 2010). The number of Norwegian fishing vessels in 2014 experienced the same trend, decreasing to 6.000 (–6%). In 2014, Norwegian landings totalled 2,3 million tonnes of fish, crustaceans and molluscs, an 11% increase over 2013. The landings increased 12% in value, ending at approximately EUR 1,57 billion.13 The EU has a bilateral agreement with Norway regarding the management of shared fish stocks in the North Sea and Atlantic Ocean. The main species in the North Sea are cod, haddock, saithe, whiting, plaice, and herring. In 2015, total allowable catches (TACs) for cod (29.189 tonnes), haddock (40.711 tonnes), and plaice (128.376 tonnes) are 5%, 6%, and 15% higher than in 2014. The TACs for saithe (66.006 tonnes) and whiting (13.678 tonnes) have been reduced 15% for both; for herring, the quota is 5% lower than in 2014.14
Figure 8. FIRST SALES IN NORWAY BY MAIN SPECIES (2014)
Source: EUMOFA (updated 10.09.2015).
In January–July 2015, the cumulative first-sales value for all reported species was EUR 1,18 billion, a 16% increase over last year. A decline in certain fish quotas and a significant upswing of the first-sales prices over 2014, especially for cod and saithe, were also observed. In July 2015, first-sales value increased 5%, reaching
EUR 93,87 million, whereas volume declined 15% from July 2014, ending at 102.197 tonnes. This was the result of higher first-sales prices for Atlantic cod and Greenland halibut in July 2015 and reduced/almost zero landings of capelin in July 2014.
Figure 9. JANUARY–JULY FIRST SALES IN NORWAY
Source: EUMOFA (updated 10.09.2015).
Figure 10. JANUARY–JULY FIRST SALES IN NORWAY BY MAIN SPECIES (million EUR)
Source: EUMOFA (updated 10.09.2015).
In January–July 2015, the five most important species were blue whiting, cod, coldwatwer shrimp, herring, and saithe, represented approximately 74% of the total first-sales value. The Norwegian landings of blue whiting have increased from 20.000 tonnes in 2011 to almost 400.000 tonnes in 2014. The increasing trend has continued in 2015 with approximately 500.000 tonnes (January–July 2015). Coldwater shrimp saw an 82% increase in first-sales value so far in 2015. This is mainly because of higher volume landed, but also lower availability of shrimp from Greenland and Canada may have pushed up prices.
0
100
200
300
400
500
600
700
0
100
200
300
400
500
600
Valu
e
Volu
me
Volume (1000 tonnes) Value (million EUR)
850
900
950
1.000
1.050
1.100
1.150
1.200
0
200
400
600
800
1.000
1.200
1.400
1.600
1.800
2.000
Jan-Jul 2013 Jan-Jul 2014 Jan-Jul 2015
Valu
e
Volu
me
Volume (1000 tonnes) Value (million EUR)
0
100
200
300
400
500
600
Jan-July 2013 Jan-July 2014 Jan-July 2015
8
MONTHLY HIGHLIGHTS | NO. 8/2015
European Market Observatory for Fisheries and Aquaculture Products
1.2.1. HADDOCK
Haddock is mainly a demersal fish, but it can also be found higher in the water columns, particularly smaller
individuals. The spawning period is from March to June. This occurs when the haddock is 4–7 years old and around 40–60 cm long. Tromsøflaket in the north is an important spawning location, as are coastal regions outside the southwestern areas of Norway.15 Haddock is caught on the entire Norwegian coast and in the Barents Sea, Northeast Atlantic, North Sea, and the Skagerrak and Kattegat. Most Norwegian catches occur in the Northeast Atlantic and the Barents Sea. The most important Norwegian ports for landing haddock in 2014 were Tromsø, Ålesund, and Båtsfjord. The quota for haddock is fixed relative to other species. As smaller haddock is a popular choice for larger predators, like cod, the annual quota negotiations are discussed and fixed in relationship. In 2013 and 2014, the Northeast Atlantic cod quota was high, so the haddock quota was reduced, to avoid undue pressure on the stock. For 2015, the quota for the Northeast Atlantic stock was set at 178.500 tonnes; later, it was adjusted to 223.000 tonnes during summer, mainly because of the presence of greater numbers of older fish (9–11 years) in the stock than initially projected.16 In January–July 2015, the cumulative first sales of haddock reached EUR 64,73 million and 69.876 tonnes. This was a 12% decrease in value and a 5% increase in volume over January–July 2014. The decrease in value was mostly because of a depreciation of the NOK against the EUR during 2014, a trend that has continued since January 2015.
Figure 11. HADDOCK: FIRST SALES IN NORWAY
Source: EUMOFA (updated 10.09.2015).
Figure 12. HADDOCK: FIRST-SALES PRICE IN NORWAY
Source: EUMOFA (updated 10.09.2015).
The average unit price of haddock in January–July 2015 was 0,93 EUR/kg, a 17% decrease from January–July 2014, when less fish were landed. The decrease in the first-sales price is mainly caused by an over supplied market as well as the availably of frozen haddock on the market.
0,0
2,0
4,0
6,0
8,0
10,0
12,0
14,0
16,0
18,0
20,0
0
2
4
6
8
10
12
14
16
18
Se
pN
ov
Jan
Ma
rM
ay
Jul
Se
pN
ov
Jan
Ma
rM
ay
Jul
Se
pN
ov
Jan
Ma
rM
ay
Jul
2012 2013 2014 2015
Valu
e
Vo
lum
e
Volume (1000 tonnes) Value (million EUR)
0,00
0,20
0,40
0,60
0,80
1,00
1,20
1,40
1,60
1,80
Se
p
Nov
Jan
Ma
r
May
Jul
Se
p
Nov
Jan
Mar
May
Jul
Se
p
Nov
Jan
Ma
r
May
Jul
2012 2013 2014 2015
EU
R/k
g
9
MONTHLY HIGHLIGHTS | NO. 8/2015
European Market Observatory for Fisheries and Aquaculture Products
1.2.2. MACKEREL
Mackerel is a pelagic species, commonly found in the Northeast Atlantic, from the
northwest of Africa to the Barents Sea. The mackerel in European waters is managed as one stock, the Northeast Atlantic mackerel, which is differentiated according to its spawning patterns: (a) the North Sea and Skagerrak (May–July); (b) west of Ireland and the British islands (March–July); and (c) Spanish and Portuguese waters (February–May). Mackerel feeds mainly on zooplankton, molluscs, and small fish, such as herring and sprat.17 The mackerel landed in Norway is commonly caught with seine or trawl. Most catches occur from August to November, when the mackerel has finished spawning and migrates from the spawning grounds. The three most important ports for landing mackerel in Norway in 2014 were Ålesund and Selje, on the coast of Sunnmøre, and Egersund on the southwest coast.18 The cumulative first sales of mackerel in January–July 2015 were EUR 66,10 million and 74.241 tonnes. This was a decrease in value (−22%) but a slight increase in volume (+2%) over January–July 2014. During 2014, particularly in the second half, a higher volume of mackerel landings caused a significant drop in unit prices.
Figure 13. MACKEREL: FIRST SALES IN NORWAY
Source: EUMOFA (updated 10.09.2015).
The average unit price of mackerel in January–July 2015 was 0,89 EUR/kg, a 24% decrease from the corresponding period in 2014. First-sales price in July was similar to the average of the first seven months, at 0,87 EUR/kg.
Figure 14. MACKEREL: FIRST-SALES PRICE IN NORWAY
Source: EUMOFA (updated 10.09.2015).
0,00
0,50
1,00
1,50
2,00
2,50
3,00
3,50
Se
p
Nov
Jan
Ma
r
Ma
y
Jul
Se
p
Nov
Jan
Ma
r
Ma
y
Jul
Se
p
Nov
Jan
Ma
r
Ma
y
Jul
2012 2013 2014 2015
EU
R/k
g
0,0
20,0
40,0
60,0
80,0
100,0
120,0
140,0
160,0
180,0
0
20
40
60
80
100
120
140
160
180
200
Se
pN
ov
Jan
Ma
rM
ay
Ju
lS
ep
Nov
Jan
Ma
rM
ay
Ju
lS
ep
Nov
Jan
Ma
rM
ay
Ju
l
2012 2013 2014 2015
Valu
e
Vo
lum
e
Volume (1000 tonnes) Value (million EUR)
10
MONTHLY HIGHLIGHTS | NO. 8/2015
European Market Observatory for Fisheries and Aquaculture Products
2. Global Supply
Resources / Baltic Sea: The European Commission has proposed the fishing opportunities for 2016 in the Baltic Sea, so that stocks are fished at Maximum Sustainable Yield (MSY) levels, in accordance with scientific advice. Based on this proposal, the Total Allowable Catches (TACs) for all stocks, except salmon, would decrease approximately 15% from 2015 levels, to 565.692 tonnes. The catch limit for salmon will increase 6%, to 115.874 pieces. The EC proposed to increase the catch limits for herring in the Western and Central Baltic, as well as for plaice in the Baltic Main Basin.19 European Maritime and Fisheries Fund / Denmark, Estonia, Germany, Lithuania, Slovenia, and Sweden: The European Commission has adopted the Operational Programmes (OP) of the European Maritime and Fisheries Fund (EMFF), for the period 2014–2020 for several countries: Denmark (EUR 268 million), Estonia (EUR 130 million), Germany (EUR 285 million), Lithuania (EUR 82 million), Slovenia (EUR 32,6 million), and Sweden (173 million). Investments will support projects that promote sustainable aquaculture and fisheries in particular, for example reduction in unwanted catches, improved added-value, diversification of professional activities, improved competitiveness, as well as in projects limiting the impact of fishing on the marine environment.20 EU / Madagascar, Cape Verde, and Guinea Bissau / Fisheries Partnership Agreement: The European Parliament has approved the fishery protocols between the EU and Madagascar, Cape Verde, and Guinea Bissau. The protocols contribute to the responsible fishing and sustainable management of fishery resources and consolidate the network of agreements for the fishing of tuna in the Indian Ocean and the waters of West Africa. For Guinea-Bissau, EU vessels will also be allowed to fish other species such as shrimp, finfish, and cephalopods. In addition, the EU will dedicate EUR 11,3 million per year to the partnerships.21 Fisheries / Iceland: Icelandic vessels caught 114.000 tonnes of fish in August 2015, an increase of 9.800 tonnes over August 2014. The increase was caused mainly by demersal species (+27%) and flatfish, particularly Greenland halibut and plaice. Catches of pelagic species increased 3%, while shellfish remained at around 1.200 tonnes, compared with 900 tonnes in August 2014.22
Aquaculture / Scotland: In 2014, Scotland registered the highest level ever recorded for the production of farmed Atlantic salmon, approximately 179.000 tonnes. This was an increase of 10% from previous year. Rainbow trout, halibut, and brown/sea trout production also increased.23 In 2014, UK salmon exports reached EUR 751 million and 121.500 tonnes.24 Aquaculture / Spain: In Spain, in 2014, the aquaculture production of marine finfish reached almost 44.000 tonnes, (+12% compared with 2013). Main farmed species were seabass 17.400 tonnes (–11%), seabream 16.200 tonnes (–3%), and turbot 7.800 tonnes (–15%). In 2014, the average first-sales prices for these species were higher than in 2013: seabass 5,79 EUR/kg (+8%), seabream 5,45 EUR/kg (+14%), turbot 7,50 EUR/kg (-11%). The main aquaculture product in volume is mussel, which is estimated at around 200.000 tonnes.25
Trade / Italy: During January–June 2015, Italian imports of octopus increased 33% in value, compared with the same period a year ago. In volume, they grew 15%, reaching 27.000 tonnes. Morocco strengthened its position as the number one supplier (9.100 tonnes), followed by Spain (5.200 tonnes) and Indonesia (2.800 tonnes).26
Supply / Germany: In 2014, the downward trend in recent years of German fish consumption stopped. Per capita consumption rose from 13,8 kg in 2013 to 14,0 kg in 2014, despite a significant price rise at retail level (+1,9% compared with 0% for meat products). Supply to the German market is covered 88% by imports. Marine fish species represent 61% of total consumption, freshwater fish 27%, and crustaceans and molluscs 12%. The top species consumed remain Alaska pollock, salmon, herring, and tuna.27
Russian embargo on fishery products: The Russian Federation extended the embargo on food to include Iceland, Albania, Montenegro, Lichtenstein and Ukraine. For seafood products, this had the greatest impact on imports from Iceland, which during the last year has moved from being the third most important country, to the leading country of origin for Russian seafood imports. Of total Icelandic exports of frozen herring, 41% (in volume) went to Russia (August 2014 – June 2015), compared to less than 20% in the two years before when the ban on imports from EU and Norway was imposed.28
11
MONTHLY HIGHLIGHTS | NO. 8/2015
European Market Observatory for Fisheries and Aquaculture Products
3. Case study: hake in Spain
This case study is a summary of an extensive analysis conducted by the EUMOFA on the price formation for fresh hake in Spain. The full study will be available soon on EUMOFA website in English, French, and Spanish.
Hake is the main fish consumed in Spain. It is purchased mainly fresh (75% of volumes purchased for home consumption), which makes Spain by far the largest market for fresh hake in the EU. For the past ten years, the EU market has been influenced by the EU recovery plan for European hake, implemented in 2004, and the subsequent stock recovery, as well as the overall decrease in the worldwide supply of hake.
3.1. Evolution of the world supply of hake
The total world production of hake reached approximately 1,2 million tonnes of catches in 2013. Argentine hake, North Pacific hake, and cape hakes, the three main species, account for 30%, 25%, and 24%, respectively, of the total world production in volume. European hake, the dominant hake species in the EU, represents only 9% of total hake catches around the world.
Between 2003 and 2013, catches of European hake increased 48%, whereas overall catches of hake declined 3%. The share of the three main species remained stable at around 78% of world catches, but with different trends.
Table 3. WORLD CATCHES OF HAKE, EUROPEAN HAKE, AND TOTAL (1000 TONNES)
Cape hakes and Argentine hake catches, the main species imported into the EU, decreased 15% and 8%, respectively, whereas North Pacific hake production increased 40%.
At the same time, EU catches of Argentine hake increased considerably, from about 4.000 tonnes in 2003 to more than 40.000 tonnes in 2013, made almost entirely by Spanish vessels. As a result of the overall reduced availability of hake and the increase in EU catches of both European (landed fresh) and Argentine hake (landed frozen in the EU), EU imports of frozen and fresh hake from third countries dropped. Imports of hake, prepared or preserved, increased but remain marginal.
3.2. The EU market for fresh hake
The EU market for fresh hake amounted to 122.042 tonnes in 2013. Spain accounted for 67% of that market, with an apparent consumption of around 81.000 tonnes/we.
Figure 15. EU IMPORTS OF HAKE FROM THIRD COUNTRIES BY PRESENTATION (1000 TONNES/LWE)
Source: COMEXT.
0
100
200
300
400
500
600
1000 t
onneslw
e
Hake, prepared or preserved Fresh hake
Frozen hake Frozen fillets of hake
12
MONTHLY HIGHLIGHTS | NO. 8/2015
European Market Observatory for Fisheries and Aquaculture Products
Table 4. THE EU MARKET FOR FRESH HAKE IN 2013
(VOLUME IN TONNES/ LWE)
Catches29 Imports of fresh
hake
Exports of fresh
hake
Apparent consumption
Spain 30.332 58.404 7.283 81.453
France 32.348 5.259 21.667 15.940
Italy 9.767 1.801 258 11.310
UK 8.936 235 1.353 7.817
Greece 4.694 406 34 5.066
Portugal 3.020 2.832 852 5.000
Total EU30
95.980 26.611 549 122.042
Source: Calculations from FAO (catches) and COMEXT (trade).
3.3. The Spanish market for fresh hake
Unlike in other EU Member States, in Spain imports of fresh hake exceed national catches, which represent only 34% of supply. Although historically hake is a “local” Spanish product, national catches dropped in the late 1970s and again in the late 1980s, after Spain’s entry into the EU and the subsequent substantial reduction of its fleet. In 2001, when Spanish catches of European hake were at their lowest level, they accounted for only 19% of the supply of fresh hake. Since then, national catches have increased again, back to 30.000 tonnes a year. Intra-EU imports, which come mainly from France, have more than doubled. But the most significant trend is the decline in extra-EU imports, which have fallen 66%.
Figure 16. EVOLUTION OF THE SPANISH SUPPLY OF FRESH HAKE 1988–2013 (1000 TONNES/ LWE)
Source: FAO (catches), COMEXT (trade).
In 2014, per capita consumption of hake (fresh and frozen) was 3,5 kg (out of which 2,53 kg for fresh and 0,98 kg for frozen), more than three times the consumption of cod or salmon, the main fish consumed in other large markets for fish in the EU, such as France or the UK.
Trends demonstrate, however, that hake consumption tends to decrease faster than the overall consumption of fish, especially since 2009.
0
10
20
30
40
50
60
70
80
1000 t
onneslw
e
Catches of European hake Extra-EU imports of fresh hake (mostly Cape hakes)
Intra-EU imports of fresh hake (mostly European hake)
13
MONTHLY HIGHLIGHTS | NO. 8/2015
European Market Observatory for Fisheries and Aquaculture Products
Figure 17. EVOLUTION OF THE CONSUMPTION OF HAKE IN SPAIN 2004–2014 (KG)
Source: MAGRAMA.
3.4. Market prices in Spain
Market prices depend on what is perceived as a good price–quality relationship, based on various factors including size – merluza for hake >1,5 kg and pescadilla for hake 0,5–1,5 kg – cultural tradition, and fishing techniques, but also freshness and origin (local species vs non-local).
The recovery plan for the Bay of Biscay (2005–2007) resulted in a sharp price increase and high variability of
first-sales prices. After that, prices decreased progressively until 2011, and have remained fairly stable since then at around 4 EUR/kg.
Intra-EU import prices also increased slightly during the recovery plan and decreased after that. Conversely, extra-EU import prices do not seem to have been affected by the recovery plan.
Figure 18. MONTHLY FIRST-SALES PRICES OF SPANISH HAKE (HKE) AND EU IMPORT PRICES (EUR/KG)
Source: MAGRAMA.
Wholesale prices exhibit trends similar to first-sales prices.
In the long run, price variations at first sale are passed to consumers. In the short run, however, retail prices tend to fluctuate substantially less than first-sales prices.
Research has also revealed that price-transmission mechanisms vary depending on specific market segments. For example, price transmission along the supply chain seems to be more systematic for high-quality products such as Galician longline hake or labelled products, because they are more difficult to substitute.
Total fish products Total finfish Total fresh finfish Total hake Fresh hake
0
2
4
6
8
10
12
14
Price (
EU
R/k
g)
First sales - Merluza First sales - Pescadilla Intra-EU imports Extra-EU imports
14
MONTHLY HIGHLIGHTS | NO. 8/2015
European Market Observatory for Fisheries and Aquaculture Products
Figure 19. MONTHLY RETAIL PRICES OF FRESH HAKE IN SPAIN (EUR/KG)
Source: MAGRAMA.
3.5. Costs and margins in the fresh-hake supply chain
The analysis below is based on MAGRAMA’s 2012 study of the value chain and price transmission for the European hake (merluza)31 and covers merluza sold through large retailers. In that case, fish is usually brought directly to wholesalers located in the ports, bypassing the large Mercas (wholesale markets). The retail purchase price includes transport to the distribution platform.
The Spanish price observatory for food, set up by the Ministry of Agriculture, Food and Environment (MAGRAMA) provides cost and margin data for 2010. The following costs and prices were originally based on interviews with a sample of economic operators and the collaboration of organisations representative of the sector.
Table 5. COSTS AND MARGINS IN THE FRESH HAKE SUPPLY CHAIN IN SPAIN (2013)
EUR/KG % of % of
Interval Average Wholesale price Retail price
First-sales price 3,56 – 5,07 4,26 84% 46%
Transport vessel -> platform 0,17 – 0,22 0,19 4% 2%
Average selling price, exclusive of VAT 7,67 – 11 9,29 100%
VAT (10%) 0,77 – 1,1 0,93
Average selling price 8,44 – 12,1 10,22
Source: MAGRAMA, Eurostat, INE.
0
5
10
15
20
25
Price (
EU
R/k
g)
gro
ss m
ark
et
Merluza Pescadilla
15
MONTHLY HIGHLIGHTS | NO. 8/2015
European Market Observatory for Fisheries and Aquaculture Products
According to the stakeholders interviewed, the overall cost structure has remained stable since then. Updates, therefore, have consisted in integrating the evolution of intermediary costs, based on national statistics (price series, labour costs, industrial costs, etc.). Shrink costs32 represent the greatest expense for retailers (6% of the retail price). Hake is a large fish, which implies important losses at the preparation stage (heading, filleting, etc.) and a faster deterioration of the animal, hence the relatively high shrink costs.
3.6. Price transmission analysis
The following chart shows the main average costs and margins. Like the analysis above, it represents the value chain for European merluza sold through large retailers. The net margin for fresh merluza is estimated at 2,43 EUR/kg at the retail level, i.e. 26% of retail price (excluding VAT), compared with 2,58 EUR/kg and 28% of retail price in 2010. Net margin at the first stage is estimated at 0,19 EUR/kg (or 3,7% of wholesaler price – mayorista en origen) compared with 0,23 EUR/kg and 4,6% of wholesale price in 2010.
Figure 20. PRICE TRANSMISSION FOR FRESH EUROPEAN MERLUZA ALONG THE SUPPLY CHAIN (2013)
Source: MAGRAMA, Eurostat, INE.
Ex-vessel price4,26
Transportvessel
0,19
Othercosts 0,28
Labour cost0,15
Net margin0,19
Price delivered
at platform
5,07Platform
costs0,12
Transport 0,23
Shrink0,54
Labourcost0,46
Othercosts 0,45
Netmargin
2,43
Retail price excl VAT9,29
VAT (10%)0,93
Retail price
incl VAT10,22
0,00
2,00
4,00
6,00
8,00
10,00
12,00
16
MONTHLY HIGHLIGHTS | NO. 8/2015
European Market Observatory for Fisheries and Aquaculture Products
4. Consumption
FRESH ANCHOVY
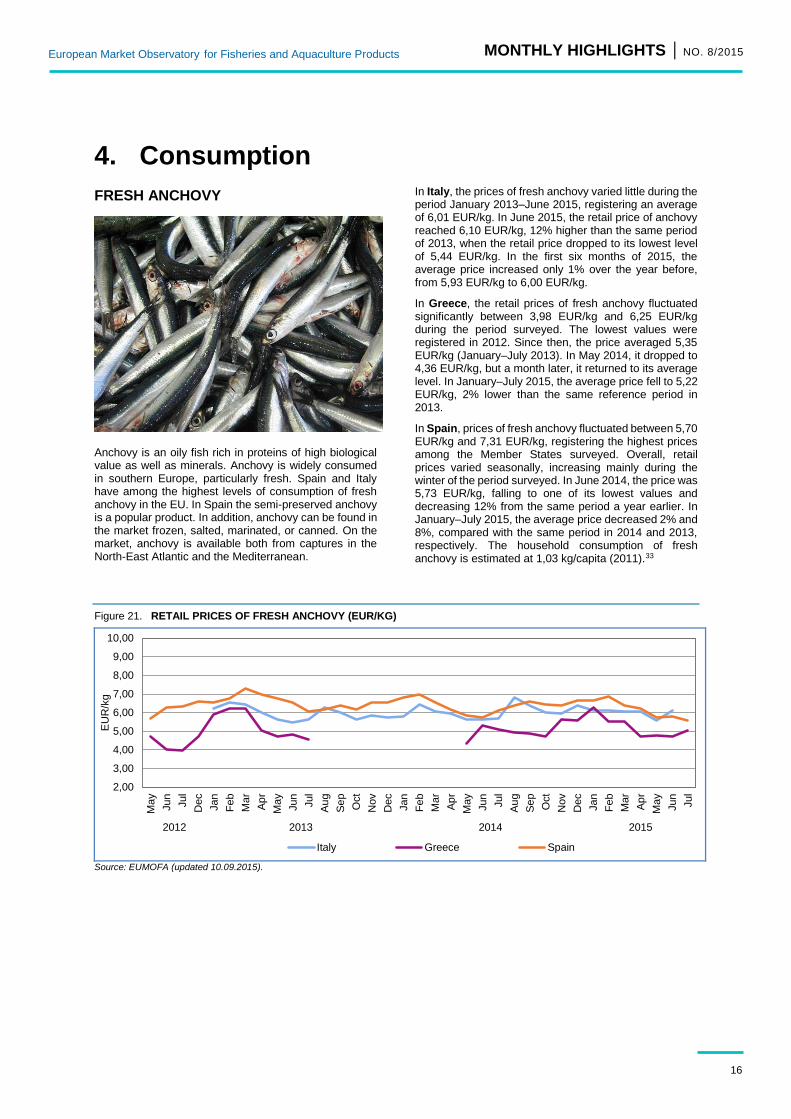
Anchovy is an oily fish rich in proteins of high biological value as well as minerals. Anchovy is widely consumed in southern Europe, particularly fresh. Spain and Italy have among the highest levels of consumption of fresh anchovy in the EU. In Spain the semi-preserved anchovy is a popular product. In addition, anchovy can be found in the market frozen, salted, marinated, or canned. On the market, anchovy is available both from captures in the North-East Atlantic and the Mediterranean.
In Italy, the prices of fresh anchovy varied little during the period January 2013–June 2015, registering an average of 6,01 EUR/kg. In June 2015, the retail price of anchovy reached 6,10 EUR/kg, 12% higher than the same period of 2013, when the retail price dropped to its lowest level of 5,44 EUR/kg. In the first six months of 2015, the average price increased only 1% over the year before, from 5,93 EUR/kg to 6,00 EUR/kg.
In Greece, the retail prices of fresh anchovy fluctuated significantly between 3,98 EUR/kg and 6,25 EUR/kg during the period surveyed. The lowest values were registered in 2012. Since then, the price averaged 5,35 EUR/kg (January–July 2013). In May 2014, it dropped to 4,36 EUR/kg, but a month later, it returned to its average level. In January–July 2015, the average price fell to 5,22 EUR/kg, 2% lower than the same reference period in 2013.
In Spain, prices of fresh anchovy fluctuated between 5,70 EUR/kg and 7,31 EUR/kg, registering the highest prices among the Member States surveyed. Overall, retail prices varied seasonally, increasing mainly during the winter of the period surveyed. In June 2014, the price was 5,73 EUR/kg, falling to one of its lowest values and decreasing 12% from the same period a year earlier. In January–July 2015, the average price decreased 2% and 8%, compared with the same period in 2014 and 2013, respectively. The household consumption of fresh anchovy is estimated at 1,03 kg/capita (2011).33
Figure 21. RETAIL PRICES OF FRESH ANCHOVY (EUR/KG)
Source: EUMOFA (updated 10.09.2015).
2,00
3,00
4,00
5,00
6,00
7,00
8,00
9,00
10,00
Ma
y
Jun
Jul
Dec
Jan
Fe
b
Ma
r
Ap
r
Ma
y
Jun
Jul
Au
g
Se
p
Oct
Nov
Dec
Jan
Fe
b
Ma
r
Ap
r
Ma
y
Jun
Jul
Au
g
Se
p
Oct
Nov
Dec
Jan
Fe
b
Mar
Ap
r
Ma
y
Jun
Jul
2012 2013 2014 2015
EU
R/k
g
Italy Greece Spain
17
MONTHLY HIGHLIGHTS | NO. 8/2015
European Market Observatory for Fisheries and Aquaculture Products
FRESH SALMON
The consumer market for farmed Atlantic salmon has witnessed continued growth. Important reasons for salmon’s continued popularity include affordability, variety of presentation, lack of any obvious substitute and year-round availability. The average yearly EU consumption of salmon is 2 kg/capita and is growing. Consumption of salmon varies among EU countries. France is the major consumption market for farmed salmon (in volume), followed by Germany and the UK. In per capita consumption (all farmed salmon categories, in round weight equivalents), the estimated consumption for these countries in 2014 is 2,9 kg (France), 2,2 kg (UK) and 2,1 kg (Germany). Italy, Spain, Sweden, Netherlands and Poland (ranked by importance of volume) are among the other largest consumption markets. Netherlands (3,0 kg) and Sweden (over 6 kg), are the EU countries with highest consumption per capita. The yearly per capita
consumption in Poland, Italy and Spain is estimated at 1,3 kg, 1,2 kg and 1,5 kg respectively.34 In France, the retail prices of fresh, whole salmon, remained low relative to the other Member States surveyed. Overall, prices increased over May 2012–August 2015, registering fluctuations between 7,44 and 10,19 EUR/kg. The retail price of salmon, whole, had its lowest values in the surveyed months of 2012. Since then, the prices have increased and have maintained a relatively stable yearly average. Only in autumn 2014, particularly in September, the price fell and reached a two-year low of 8,19 EUR/kg. During the subsequent months, the price returned to its average level, and in January–August 2015 was 9,51 EUR/kg.
In Italy, the retail prices of salmon, whole, fresh, have varied in the period January 2013–June 2015. In 2013, the prices were relatively stable, at an average of 10,31 EUR/kg, compared with 2014, when prices reached their highest level. In March 2014, the price of salmon peaked at 12,25 EUR/kg, 22% and 23% higher than the same month in 2013 and 2014, respectively. In January–June 2015, the prices of salmon reached an average of 10,14 EUR/kg, a 14% decrease compared with the same period a year earlier.
In Spain, retail prices of fresh salmon remained relatively stable at an average of 10,92 EUR/kg (May 2012–July 2015). After a drop at the end of 2012, the retail price increased slightly. In March 2014, an increase of 11,92 EUR/kg was registered, a 14% increase over 2013. Since then, the prices of fresh salmon have fluctuated between 10,83 EUR/kg and 11,88 EUR/kg. In the first seven months of 2015, the average retail price of salmon was 11,16 EUR/kg.
Figure 22. RETAIL PRICES OF WHOLE FRESH SALMON (EUR/KG)
Source: EUMOFA (updated 10.09.2015).
0,00
2,00
4,00
6,00
8,00
10,00
12,00
14,00
Ma
y
Jun
Jul
Au
g
Se
p
Oct
Nov
Dec
Jan
Fe
b
Ma
r
Ap
r
Ma
y
Jun
Jul
Au
g
Se
p
Oct
Nov
Dec
Jan
Fe
b
Mar
Ap
r
Ma
y
Jun
Jul
Au
g
Se
p
Oct
Nov
Dec
Jan
Fe
b
Ma
r
Ap
r
Ma
y
Jun
Jul
Au
g
2012 2013 2014 2015
EU
R/k
g
France Italy Spain
18
MONTHLY HIGHLIGHTS | NO. 8/2015
European Market Observatory for Fisheries and Aquaculture Products
5. Macroeconomic context
5.1. MARINE FUEL
Figure 23. AVERAGE PRICE OF MARINE DIESEL IN ITALY, FRANCE, AND SPAIN (EUR/LITRE)
Source: Chamber of Commerce of Forlì-Cesena, Italy; DPMA, France; ARVI, Spain; MABUX (May–August 2015).
In August 2015, the fuel price in the French ports of Lorient and Boulogne was 0,42 EUR/litre, 11% less than in July 2015 and 35% less than August 2014. In Italy, in the ports of Ancona and Livorno, the average price of marine fuel in August 2015 was 0,50 EUR/litre. This was 10% lower compared with the previous month and 29% less than August 2014. The price of marine fuel in the ports of A Coruña and Vigo (Spain) reached 0,45 EUR/litre in August 2015. It was 11% lower than the previous month and 25% less than August 2014.
5.2. FOOD AND FISH PRICES Annual EU inflation was 0,1% in August 2015, down from 0,2% in July. In August 2015, negative annual rates were observed in Cyprus (−1,9%), Romania (−1,7%), and Lithuania (−1,0%), while the highest annual rates were recorded in Malta (+1,4%), Austria (+0,9%), and Belgium (+0,9%). Compared with July 2015, annual inflation fell in 14 Member States, remained stable in 4, and rose in 10. In August 2015, prices of food and non-alcoholic beverages decreased slightly, and prices of fish and seafood increased over the previous month (July 2015). Since August 2013, food prices decreased 0,8%, while fish prices increased 2,6%.
Table 6. HARMONISED INDEX OF CONSUMER PRICES IN THE EU (2005 = 100)
HICP Aug 2013
Aug 2014
July 2015
Aug 201535
Food and non–alcoholic beverages
125,81 124,60 124,86 124,84
Fish and seafood
124,60 126,34 126,92 127,81
Source: Eurostat.
5.3. EXCHANGE RATES
In August 2015, the euro appreciated against the Norwegian krone (+4,0%), and the US dollar (+2,3%) over July 2015. It depreciated slightly against the Japanese yen (−0,8%). The euro fluctuated around 1,10 against the US dollar in the past five months. Compared to a year ago (August 2014), the euro has appreciated 15,0% against the Norwegian krone and depreciated 15,0% against the US dollar.
Table 7. THE EURO EXCHANGE RATES AGAINST THREE SELECTED CURRENCIES
Currency Aug 2013
Aug 2014
Jul 2015
Aug 2015
USD 1,3235 1,3188 1,0967 1,1215
JPY 130,01 137,11 136,34 136,07
NOK
8,0905 8,1465 9,0015 9,3585
Source: European Central Bank.
0,35
0,40
0,45
0,50
0,55
0,60
0,65
0,70
0,75
0,80
Italy
France
Spain
19
MONTHLY HIGHLIGHTS | NO. 8/2015
European Market Observatory for Fisheries and Aquaculture Products
Figure 24. TREND OF EURO EXCHANGE RATES
Source: European Central Bank.
5.4. EUROPEAN UNION ECONOMIC OVERVIEW
In April–June 2015, the EU GDP grew at a rate of 0,4%, declining slightly from 0,5% in January–March 2015. The annual GDP growth rate improved to 1,9%, compared with 1,7% in January–March 2015.
The highest GDP growth rates were observed in Malta (+4,8%), the Czech Republic (+4,4%), Spain (+3,1%), Sweden (+2,9%), and Latvia (+2,7%).
90
100
110
120
130
140
150
160
Jun
/12
Se
p/1
2D
ec/1
2M
ar/
13
Jun
/13
Se
p/1
3D
ec/1
3M
ar/
14
Jun
/14
Se
p/1
4D
ec/1
4M
ar/
15
Jun
/15
Se
p/1
5
JPY
1,05
1,10
1,15
1,20
1,25
1,30
1,35
1,40
1,45
1,50
Jun
/12
Se
p/1
2D
ec/1
2M
ar/
13
Jun
/13
Se
p/1
3D
ec/1
3M
ar/
14
Jun
/14
Se
p/1
4D
ec/1
4M
ar/
15
Jun
/15
Se
p/1
5
USD
7,00
7,40
7,80
8,20
8,60
9,00
9,40
9,80
Jun
/12
Se
p/1
2D
ec/1
2M
ar/
13
Jun
/13
Se
p/1
3D
ec/1
3M
ar/
14
Jun
/14
Se
p/1
4D
ec/1
4M
ar/
15
Jun
/15
Se
p/1
5
NOK
20
MONTHLY HIGHLIGHTS | NO. 8/2015
European Market Observatory for Fisheries and Aquaculture Products
European Market Observatory for Fisheries and Aquaculture Products
6. Endnotes 1 Bivalves and other molluscs and aquatic invertebrates, cephalopods, crustaceans, flatfish, freshwater fish, groundfish, other marine fish, salmonids, small pelagics, and tuna and tuna-like species.
32 Losses caused by fish failing to be sold (out-of-date, low quality, etc.) and weight loss caused by the progressive drying of fish, especially after they are put on the fish counter.