150
Monthly Report March 2018 Vol 70 No 3

Monthly ReportMarch 2018
Vol 70 No 3

Deutsche Bundesbank
Wilhelm-Epstein-Strasse 14
60431 Frankfurt am Main
Germany
Postal address
Postfach 10 06 02
60006 Frankfurt am Main
Germany
Tel +49 69 9566 0
Fax +49 69 9566 3077
http://www.bundesbank.de
Reproduction permitted only if source is stated.
ISSN 0418-8292 (print edition)
ISSN 1862-1325 (online edition)
The German original of this Monthly Report
went to press at 11 am on 16 March 2018.
Annual and weekly publishing schedules for
selected statistics of the Deutsche Bundes-
bank can be downloaded from our website.
The statistical data are also published on the
website.
The Monthly Report is published by the
Deutsche Bundesbank, Frankfurt am Main,
by virtue of section 18 of the Bundesbank
Act. It is available to interested parties free of
charge.
This is a translation of the original German-
language version, which is the sole authorita-
tive text.
Deutsche Bundesbank Monthly Report March 2018 2

Contents
Commentaries .......................................................................................................... 5
Economic conditions ........................................................................................................... 5
Public finances .................................................................................................................... 7
Securities markets ............................................................................................................... 11
Balance of payments ........................................................................................................... 12
German balance of payments in 2017 ............................................................ 15
The savings of non- financial corporations in Germany ....................................................... 20
Determinants of German cross- border portfolio investment ................................................ 28
The demand for euro banknotes at the Bundesbank ............................... 37
Seasonal adjustment of daily data ..................................................................................... 40
Banknote holdings by credit institutions .............................................................................. 43
The return flow of €500 banknotes..................................................................................... 45
Contingent convertible bonds: design, regulation, usefulness .............. 53
Deutsche Bundesbank Monthly Report
March 2018 3

Statistical Section.................................................................................................... 1•
Key economic data for the euro area .................................................................................. 5•
Overall monetary survey in the euro area ............................................................................ 8•
Consolidated financial statement of the Eurosystem ............................................................ 16•
Banks .................................................................................................................................. 20•
Minimum reserves ............................................................................................................... 42•
Interest rates ....................................................................................................................... 43•
Insurance corporations and pension funds .......................................................................... 48•
Capital market .................................................................................................................... 50•
Financial accounts ............................................................................................................... 54•
Public finances in Germany ................................................................................................. 58•
Economic conditions in Germany ........................................................................................ 65•
External sector .................................................................................................................... 74•
Overview of publications by the Deutsche Bundesbank .......................... 83•
Abbreviations and symbols
e Estimated
p Provisional
pe Partly estimated
r Revised
… Data available at a later date
. Data unknown, not to be published or not meaningful
0 Less than 0.5 but more than nil
– Nil
Discrepancies in the totals are due to rounding.
Deutsche Bundesbank Monthly Report March 2018 4

Commentaries
Economic conditions
Underlying trends
The German economy’s robust upswing is likely
to have continued in the first quarter of 2018.
Supported by an exceptionally large volume of
orders received by firms in the second half of
the last year, the industrial sector remains the
driving force behind economic developments.
According to the Ifo Institute, despite a minor
downward revision, manufacturing firms still
assess the business situation as very favourable.
The marked damper in the expectations com-
ponent is not expected to have an effect until
next quarter. In fact, the assessment of the
business situation in the main construction sec-
tor reached a new record high, and the order
books are in excellent shape, too. However, the
already significant capacity shortages will prob-
ably prevent a rapid increase of construction
activity. The construction sector’s contribution
to aggregate growth is therefore likely to be
moderate at best, while the persistently strong
labour market momentum is continuing to sup-
port private consumption.
Industry
In January 2018, German industrial output was
up distinctly on the month in seasonally ad-
justed terms (+½%). Compared with the final
quarter of 2017, the increase, at 1½%, was
much stronger still. With regard to the individ-
ual sectors, mechanical engineering as well as
repairs and installation of machinery and equip-
ment reported particularly significant growth in
output. Production in the capital goods sector
therefore posted the strongest growth overall
(+2¼%). Manufacturers of consumer goods
also expanded their output sharply (+1¾%). By
contrast, the production of intermediate goods
remained at the same level as in the previous
quarter.
After seasonal adjustment, industrial orders de-
clined steeply in January 2018 compared with
the previous month (-3¾%), which meant that
they were thus also clearly down compared
with the average of the fourth quarter of 2017
(-2%). However, the strong contraction should
be seen in the light of the entire second half of
2017, when German firms reported a very ex-
tensive inflow of orders; the orders situation in
industry can thus still be considered extremely
positive overall. Nonetheless, the countermove-
ment was broadly based. Broken down by re-
gion, demand for German products, both in
Germany as well as in the euro area and in
non- euro area countries, shrank considerably.
Excluding large orders, the volume of new
orders declined less strongly overall (-1%).
Broken down by individual sectors, manufac-
turers of capital goods had to cope with the
sharpest drop in new orders, followed by inter-
mediate goods producers. By contrast, signifi-
cantly more new orders landed in the order
books of consumer goods producers.
Industrial sales in January 2018 remained
broadly unchanged on the month after adjust-
ment for seasonal variations. However, com-
pared with the average of the last three months
of 2017, they increased by 1%. In regional
terms, sales of German products showed par-
ticularly robust growth in Germany and in the
euro area, yet industrial enterprises also re-
ported a distinct rise in sales in non- euro area
countries. In a breakdown by sector, manufac-
turers of capital goods stood out with substan-
tial sales growth. The quite considerable sales
growth in Germany, in particular, is likely to be
related to the brisk investment activity at the
current time. By contrast, sales of intermediate
and consumer goods were down slightly from
the previous quarter. In January, nominal ex-
ports dropped considerably on the month in
seasonally adjusted terms (-½%). There was a
significant increase compared with the fourth
quarter last year, however (+¾%). After adjust-
German economy’s robust upswing continues
Distinct rise in industrial output
New orders below very high level of previous month
Industrial sales and exports up moderately in January
Deutsche Bundesbank Monthly Report
March 2018 5
ment for price effects, the rise was slightly
lower, at ½%. In January, month- on- month
and also quarter- on- quarter (real and nominal)
growth of nominal imports was similar to that
of exports.
Construction
Seasonally adjusted construction output in
January 2018 showed a steep decline on the
month (-2¼%). It was also down significantly
from the last quarter of 2017 (-3%). The main
reason for the decrease was a quite consider-
able decline in construction activity in the fin-
ishing trades (-7½%). On the other hand, out-
put in the main construction sector was up
sharply once again (+3%). The relevant indica-
tors show that the stagnation in construction
output observed since early summer 2017 is
likely to have been caused by supply- side fac-
tors, and the buoyant construction activity will
have persisted despite the dip in January. Ac-
cording to the Ifo Institute, the assessment of
the business situation in the main construction
sector reached a new all- time high in February.
The same goes for equipment utilisation ac-
cording to the most recent reports by the con-
struction firms. In addition, the final quarter of
2017 – the most recent quarter for which data
are available – saw a surge in new orders in the
main construction sector. In the light of a prob-
ably fairly high proportion of large orders and
the fact that capacity is already clearly being
overutilised, this jump in orders will probably
only gradually lead to higher production.
Labour market
The prolonged growth in employment con-
tinued unabated at the beginning of 2018. In
January, the total seasonally adjusted number
of persons in work in Germany was up by
60,000 on the month. Compared with January
2017, the increase amounted to 625,000 per-
sons, or 1.4%. Growth in total employment
continued to be sustained by jobs subject to
Major slump in construction likely to be temporary
Strong increase in employment; outlook remains very positive
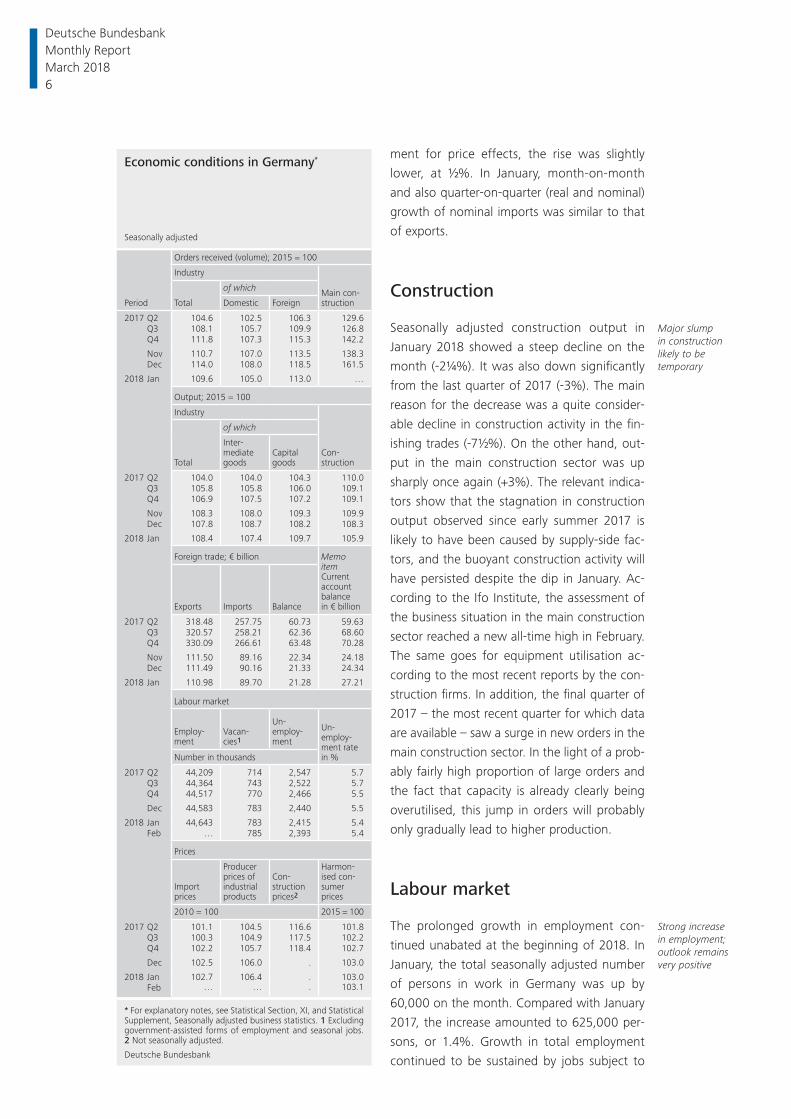
Economic conditions in Germany*
Seasonally adjusted
Period
Orders received (volume); 2015 = 100
Industry
Main con-structionTotal
of which
Domestic Foreign
2017 Q2 104.6 102.5 106.3 129.6 Q3 108.1 105.7 109.9 126.8 Q4 111.8 107.3 115.3 142.2
Nov 110.7 107.0 113.5 138.3 Dec 114.0 108.0 118.5 161.5
2018 Jan 109.6 105.0 113.0 …
Output; 2015 = 100
Industry
Con-structionTotal
of which
Inter-mediategoods
Capitalgoods
2017 Q2 104.0 104.0 104.3 110.0 Q3 105.8 105.8 106.0 109.1 Q4 106.9 107.5 107.2 109.1
Nov 108.3 108.0 109.3 109.9 Dec 107.8 108.7 108.2 108.3
2018 Jan 108.4 107.4 109.7 105.9
Foreign trade; € billion MemoitemCurrentaccountbalance in € billionExports Imports Balance
2017 Q2 318.48 257.75 60.73 59.63 Q3 320.57 258.21 62.36 68.60 Q4 330.09 266.61 63.48 70.28
Nov 111.50 89.16 22.34 24.18 Dec 111.49 90.16 21.33 24.34
2018 Jan 110.98 89.70 21.28 27.21
Labour market
Employ-ment
Vacan-cies1
Un-employ-ment
Un-employ-ment ratein %Number in thousands
2017 Q2 44,209 714 2,547 5.7 Q3 44,364 743 2,522 5.7 Q4 44,517 770 2,466 5.5
Dec 44,583 783 2,440 5.5
2018 Jan 44,643 783 2,415 5.4 Feb … 785 2,393 5.4
Prices
Importprices
Producerprices ofindustrialproducts
Con-structionprices2
Harmon-ised con-sumerprices
2010 = 100 2015 = 100
2017 Q2 101.1 104.5 116.6 101.8 Q3 100.3 104.9 117.5 102.2 Q4 102.2 105.7 118.4 102.7
Dec 102.5 106.0 . 103.0
2018 Jan 102.7 106.4 . 103.0 Feb … … . 103.1
* For explanatory notes, see Statistical Section, XI, and Statistical Supplement, Seasonally adjusted business statistics. 1 Excluding government-assisted forms of employment and seasonal jobs. 2 Not seasonally adjusted.
Deutsche Bundesbank
Deutsche Bundesbank Monthly Report March 2018 6

social security contributions, the number of
which rose by as much as 711,000 (according
to data as at December 2017) compared with
the previous year. By contrast, there was a con-
tinuation of the downward trend in the num-
ber of persons working exclusively in low- paid
part- time jobs and of the self- employed, al-
though this trend decelerated considerably for
the latter group towards the end of 2017. Lead-
ing indicators of the demand for labour such as
the Ifo employment barometer, the Federal
Employ ment Agency’s BA- X job index and the
labour market barometer of the Institute for
Employment Research (IAB) are all holding
steady at an extremely high level.
After seasonal adjustment, unemployment in
February again showed a significant month- on-
month fall. There were 2.39 million persons
registered as unemployed with the Federal Em-
ployment Agency, 22,000 fewer than in Janu-
ary. This means that the registered unemploy-
ment figure was 216,000 lower on the year.
The unemployment rate was 5.4% at the end
of the period under review. The relatively strong
drop in unemployment over the past few
months is probably also related to the fact that
unemployment among refugees stopped in-
creasing, bringing the underlying cyclical trend
more into the foreground. Total underemploy-
ment showed a stronger decrease recently as
the number of persons taking part in labour
market policy measures was likewise in gradual
decline. The unemployment component of the
IAB labour market barometer has decreased
slightly at the current end but is still clearly
positive. This suggests that unemployment will
continue to decline in the future.
Prices
Crude oil prices fell markedly in the first half of
February, against the background of stock mar-
ket corrections and increased US oil produc-
tion. They rebounded slightly over the course
of the month, however. On average, prices
were down by just over 5% from January, fall-
ing again slightly in the first half of March. As
this report went to press, the price of a barrel
of Brent crude oil stood at US$65. The discount
on crude oil futures was US$1¼ for deliveries
six months ahead and US$3 for 12 months
ahead.
Both import prices and industrial producer
prices in domestic sales rose further in January
in seasonally adjusted terms. The increase in
import prices was driven by energy, while the
decrease in prices of other goods was due to
currency appreciation. By contrast, domestic
prices for all goods continued to rise. As import
prices had increased more strongly in the previ-
ous year, the corresponding growth rate went
down to 0.7%. The growth rate of industrial
domestic sales prices remained broadly stable
at 2.1%, however.
In February, consumer prices (HICP) rose slightly
by 0.1% in seasonally adjusted terms. This was
due partly to the slight decline in energy and
food prices. Inflation was moderate in the case
of services, including rents. Non- energy indus-
trial goods became more expensive owing to
the marked price increases for clothing. Never-
theless, annual inflation fell from 1.4% to 1.2%
(CPI 1.4% from 1.6%), mainly due to the sharp
rise in food prices in February 2017. Excluding
energy and food, however, inflation rose to
1.4% from 1.3%. The rate is expected to pick
up significantly overall in March, as the Easter
holidays, during which travel prices normally
rise markedly, already start at the end of the
month and not, as in 2017, in April.
Public finances
Statutory health insurance scheme
According to preliminary data, the statutory
health insurance (SHI) scheme finished 2017
with a surplus of €2½ billion overall. This con-
stituted a year- on- year improvement of €2 bil-
lion and was mainly driven by the health insur-
Considerable fall in registered unemployment
Crude oil prices down again
Import and pro-ducer prices in domestic sales up further
Moderate rise in consumer prices in February
Clear surplus and high reserves in 2017
Deutsche Bundesbank Monthly Report
March 2018 7

ance institutions recording a surplus of €3 bil-
lion (compared with €1½ billion in the previous
year). As in the previous years, the health insur-
ance institutions’ surplus is predominantly at-
tributable to the fact that spending growth
was overestimated in the budget plans, mean-
ing that the supplementary contribution rates
were set too high. The health fund, by con-
trast, posted a deficit of €½ billion. Compared
with 2016, the fund’s deficit narrowed by €½
billion despite it being required to make a spe-
cial transfer of €1½ billion to the health insur-
ance institutions. The health fund’s reserves
amounted to €9 billion after its final transac-
tions for 2017 and thus remained almost un-
changed, while the financial reserves of the
health insurance institutions as a whole in-
creased to a total of €19 billion.1 The statutory
upper limit of a month’s average expenditure
has therefore been reached by the health insur-
ance institutions as a whole.
With supplementary contribution rates remain-
ing virtually unchanged on the whole, the
health insurance institutions’ revenue (mainly
transfers from the health fund) climbed by al-
most 4½%. By comparison, expenditure rose
at a more subdued rate of 3½%. Growth in
spending on hospital treatment – the most sig-
nificant item in quantitative terms – was rela-
tively moderate at 2½%. Significantly higher
growth had been expected here as a result of a
legal extension of benefits. At 3½%, spending
on remedies and therapeutic appliances rose at
a subdued rate despite benefit increases bring-
ing about a financial burden from mid-2017. By
contrast, outlays on pharmaceuticals (+4%)
and out- patient treatment (+4½%) recorded
above- average growth. On the whole, the
3½% increase in spending on benefits was
relatively restrained given the fact that the
number of insured persons rose again by just
over 1%. It would appear that these newly in-
sured persons not only have a more favourable
age structure than that of existing insured per-
sons but, moreover, they also make less use of
health services.2 Administrative spending was
down slightly on the year, not least because of
the health insurance institutions’ lower pension
provisions.
The health fund recorded growth in revenue of
4½% in 2017. Contribution receipts from per-
sons in employment increased sharply (just
over 4½%) due to continued growth in em-
Limited growth in spending on benefits
Health fund’s deficit down despite a one-off special transfer
Finances of the statutory health
insurance scheme *
Source: Federal Ministry of Health. * Health fund and health insurance institutions (consolidated). The final annual figures differ from the total of the reported preliminary quarterly figu-res, as the latter are not revised subsequently.
Deutsche Bundesbank
Q1 Q2 Q3 Q4
4
2
0
2
4
–
–
+
+
– 6
– 4
– 2
0
+ 2
+ 4
Surplus/deficit, quarterly
Cumulated from beginning of year
2016
2017
2015
2016
2015
2017
2015 2016 2017
0
2
4
6
8
2015 2016 2017
0
2
4
6
8 Revenue Expenditure
€ bn
€ bn
Year-on-year percentage change
1 Each statutory health insurance institution, as well as the health fund, is required to hold minimum reserves of one- quarter of a month’s average expenditure (sections 261 (2) and 271 (2) of the Social Security Code Book V). This cur-rently corresponds to a sum of €5 billion for the health in-surance institutions and €4½ billion for the health fund.2 On balance, the newly insured persons are probably largely immigrants; this term refers to persons migrating to participate in the labour market as well as refugees (once their status has been approved).
Deutsche Bundesbank Monthly Report March 2018 8

ployment subject to social security contribu-
tions and a rise in per capita earnings. Follow-
ing the somewhat more moderate pension in-
crease in mid-2017, contributions paid for old-
age pensioners were up by a slightly smaller
rate (4%). Turning to other revenue items, the
increase in the central government grant (€½
billion) to its new standard level of €14½ billion
per year made a positive impact. By contrast, at
just under 4½%, spending by the health fund
(which essentially determines the health insur-
ance institutions’ revenue and which (with the
exception of administrative spending) is deter-
mined prior to the start of the year and not
adjusted as it progresses) rose at a somewhat
slower pace than revenue despite the above-
mentioned one- off special transfer to the
health insurance institutions.
Last autumn, the group of SHI estimators had
forecast a small deficit of €½ billion in the
health fund for 2018 (as well as for 2017). The
risk- adjusted transfers to the health insurance
institutions were fixed at the level of estimated
revenue,3 which thus means that after factor-
ing in administrative spending, the result is ex-
pected to be balanced. However, the fund is
still required to make transfers of €½ billion to
the innovation and structural funds, and these
are to be drawn from the liquidity reserve.4 On
balance, the reserve will thus fall slightly but
will still significantly exceed the statutory min-
imum. The upward revision of the macroeco-
nomic growth assumptions (for instance in the
Health fund could record further improve-ment in 2018
Statutory health insurance schemeOverview of fi nances for the scheme as a whole
€ billion
Revenue 20161 20172 Expenditure 20161 20172
Health fund (HF)
Contributions 191.93 200.25 Transfers to HII5 220.49 229.99Additional contributions 13.89 14.95 Administration 0.05 0.05Central government grants 13.86 14.36Other revenue 0.00 0.00Defi cit 0.86 0.48Total 220.54 230.04 Total 220.54 230.04
Health insurance institutions (HII)
Transfers from HF 220.49 229.99 Spending on benefi ts 210.36 217.99Other contributions 1.01 1.02 Administration 10.98 10.88Central government grants to AHII3 0.14 0.14 Other expenditure 1.55 2.02Other revenue4 2.87 2.90Defi cit Surplus 1.62 3.15Total 224.50 234.05 Total 224.50 234.05
Statutory health insurance (SHI) scheme
Contributions 206.83 216.22 Spending on benefi ts 210.36 217.99Central government grants 14.00 14.50 Administration 11.03 10.93Other revenue 2.86 2.90 Other expenditure 1.55 2.02Defi cit Surplus 0.76 2.67Total 223.69 233.62 Total 223.69 233.62
1 Final annual fi gures (KJ1). 2 Preliminary quarterly fi gures (KV45). 3 Agricultural health insurance institutions. 4 Including the difference compared with the transfers recorded by the health fund as well as the difference between claims and liabilities. 5 Including transfers to the innovation and structural funds.
Deutsche Bundesbank
3 Including the central government grant of €14½ billion.4 The innovation fund is used by the health fund and health insurance institutions to provide annual funding of €300 million, starting in 2016 and ending in 2019, for in-novations in healthcare provision and related research. Funding provided by the structural fund (totalling €500 mil-lion) is channelled into state government investment to im-prove healthcare provision structures in the hospital sector, with state governments being required to invest the same amount in each case. In view of the principle of dual hos-pital financing, according to which the costs of treatment are borne by the insured persons but investment is to be made by the state governments, it seems to be inconsistent with the system for members of the statutory health insur-ance scheme to be called upon to invest in hospital infra-structure.
Deutsche Bundesbank Monthly Report
March 2018 9

Federal Government’s Annual Economic Re-
port) in comparison with those assumptions
from last autumn is likely to mean a better an-
nual result for the health fund, possibly making
a withdrawal from the reserve superfluous.
The group of SHI estimators expected the
health insurance institutions’ total expenditure
to increase by 4½% in 2018. They attribute the
acceleration largely to catch- up effects, as the
impact made on expenditure by some of the
new benefits already adopted is expected to in-
crease further in 2018. Based on its estimate,
the Federal Ministry of Health has lowered the
necessary arithmetical supplementary contribu-
tion rate to cover relevant expenditure by
0.1 percentage point. However, the supple-
mentary contribution rates determined by the
individual health insurance institutions re-
mained virtually unchanged on average at the
beginning of the year. This means that the
health insurance institutions are set to record a
surplus of €1 billion.
Given the favourable base effects from the
close of the previous year5 and the fact that
expenditure growth may once again be over-
stated, the surplus for 2018 may be even
higher. Furthermore, as the reserves as a whole
were already at the statutory upper limit at the
end of 2017 and a number of health insurance
institutions were probably well in excess of said
limit, it would be appropriate to cut the supple-
mentary contribution rates, thus providing at
least temporary relief for contribution payers.
This is all the more important as the gradual
implementation of contributions to the statu-
tory health insurance scheme that cover ex-
penditure for persons receiving unemployment
benefit II,6 which is envisaged under the coali-
tion agreement between the CDU, CSU and
SPD, is likely to mean considerable additional
revenue for the health insurance institutions. In
the coalition agreement, it was also agreed to
shift back to full joint financing in the future; at
present, supplementary contributions are paid
solely by members. The fact that health insur-
ance institutions have thus far largely abstained
from cutting contribution rates indicates that
price competition among the institutions is
underdeveloped.
With regard to the expenditure side, the coali-
tion agreement envisages a number of benefit
increases, in particular in the area of in- patient
and out- patient medical care. Together with
the planned extension of the innovation and
Practically no change in sup-plementary con-tribution rates implies another cash surplus
Lowering of supplementary contribution rates plausible
Finances of the public long-term care
insurance scheme *
Source: Federal Ministry of Health. * Preliminary quarterly figu-res (PV45). The final annual figures differ from the total of the reported preliminary quarterly figures, as the latter are not revi-sed subsequently. 1 Including the transfers to the long-term care provident fund.
Deutsche Bundesbank
Q1 Q2 Q3 Q4
1.0
0.5
0
0.5
1.0
–
–
+
+
– 2.5
– 2.0
– 1.5
– 1.0
– 0.5
0
+ 0.5
+ 1.0
+ 1.5
+ 2.0
Surplus/deficit, quarterly
Cumulated from beginning of year
20162017
2015
2016
2015
2017
2015 2016 2017
0
5
10
15
20
25
30
2015 2016 2017
0
5
10
15
20
25
30
Revenue Expenditure 1
€ bn
€ bn
Year-on-year percentage change
5 For instance, the eligible spending on benefits was €½ billion lower than estimated by the Federal Ministry of Health.6 Up to now, cost coverage for sub- groups has not been a constituent element of the statutory health insurance scheme.
Deutsche Bundesbank Monthly Report March 2018 10

structural funds beyond 2019, the focus of the
new government is on increasing expenditure
further rather than reining it in. In order to pre-
vent sharp upward pressure on contribution
rates again in the future, especially in the light
of demographic trends, it is still advisable to
seek efficiency improvements in the healthcare
system.
Public long- term care insurance scheme
The public long- term care insurance scheme re-
corded a deficit of €2½ billion in the core area7
in 2017 as a whole following a surplus of €1
billion one year previously. A withdrawal from
the general reserves was required for financing
purposes, thus cutting the reserves consider-
ably down to €7 billion. By contrast, the long-
term care provident fund was topped up by
just under €1½ billion as planned.
After the contribution rate was raised by
0.2 percentage point at the beginning of 2017,
revenue soared by 12½%; however, expend-
iture rose by twice that figure (over 24%). This
was primarily driven by benefit increases under
the second Act to Strengthen Long- term Care
(Zweites Pflegestärkungsgesetz). Despite more
favourable macroeconomic growth, which
meant an additional increase in contribution re-
ceipts, the scheme’s financial balance fell by
more than was expected when the reform was
adopted. As was the case when benefits were
expanded back in 2015, spending pressure can
be expected to continue to rise even beyond
the first year as there is a delay before some
new benefits are fully utilised. The public long-
term care insurance scheme’s general reserves
are thus likely to be quickly dissolved and
– contrary to expectations at the time when
the reform was adopted – a further contribu-
tion rate rise may be necessary before 2023.
Securities markets
Bond market
At €96.2 billion, gross issuance in the German
bond market in January 2018 was again signifi-
cantly up on the previous month’s figure (€60.6
billion). Nevertheless, after taking account of
increased redemptions and changes in issuers’
holdings of their own debt securities, the out-
standing volume of domestic bonds fell by €2.3
billion, following a drop of €18.9 billion in the
previous month. The outstanding volume of
foreign debt securities in the German market
grew by €16.5 billion, which meant that the
outstanding volume of domestic and foreign
debt instruments in Germany increased by
€14.2 billion on balance.
The public sector redeemed bonds totalling
€4.0 billion net in the reporting month. Central
government cut its capital market debt by €2.1
billion on balance. While it primarily redeemed
ten- year Federal bonds (Bunds) worth €6.4 bil-
lion, it also redeemed Treasury discount paper
(Bubills) to a lesser extent (€2.0 billion). This
contrasted with net issuance of two- year Fed-
eral Treasury notes (Schätze) worth €5.6 billion
and 30-year Bunds worth €2.0 billion. State
governments redeemed bonds with a net value
of €1.9 billion.
German credit institutions increased their cap-
ital market debt by €1.2 billion net in January.
This was mainly attributable to debt securities
issued by specialised credit institutions (€3.3
billion) and mortgage Pfandbriefe (€1.6 billion).
By contrast, other bank debt securities that can
be structured flexibly and public Pfandbriefe
were redeemed to the tune of €2.8 billion and
€1.0 billion net respectively.
German enterprises, too, expanded their cap-
ital market debt slightly in January (€0.5 bil-
Further benefit increases would push up struc-tural spending and heighten pressure on con-tribution rates going forward
Sharp deterior-ation in results and clear deficit for 2017 as a whole
Unexpected hike in spending ups pressure to raise contribution rate
Net redemptions of German debt securities
Decline in public sector capital market debt
Net issuance of bank debt securities
Slight rise in enterprises’ cap-ital market debt
7 The long- term care provident fund is not included in the definition of the core budget. Since 2015, revenue amount-ing to one- tenth of a percentage point of the contribution rate has been paid into this fund.
Deutsche Bundesbank Monthly Report
March 2018 11

lion). On balance, the new issues were almost
exclusively short- term commercial paper.
Foreign investors were the main purchasers in
January, adding domestic debt securities with a
net value of €16.1 billion to their portfolios. The
Deutsche Bundesbank was a buyer as well – it
made most of its purchases under the Eurosys-
tem’s expanded asset purchase programme
(APP), acquiring bonds worth €6.1 billion net. The
lower value compared with that of previous
months reflects, amongst other things, the Euro-
system’s reduced purchase volume under the APP
since the start of the year. Domestic credit institu-
tions expanded their bond portfolios by €1.2 bil-
lion in net terms. This contrasted with net sales by
domestic non- banks totalling €9.3 billion.
Equity market
In the reporting month, domestic enterprises
raised hardly any fresh funds on balance (€0.2
billion) from placing new shares in the German
equity market. Net issuance of foreign shares in
Germany totalled €7.5 billion in the same
period. Domestic non- banks were the main
buyers, acquiring equities worth €8.1 billion on
balance. Domestic credit institutions added
shares totalling €0.9 billion net to their port-
folios, while non- resident investors offloaded
shares held in Germany worth €1.4 billion net.
Mutual funds
Domestic mutual funds recorded inflows of
€15.0 billion in January. Specialised funds re-
served for institutional investors were the main
beneficiaries (€9.0 billion). Of the various asset
classes, mixed securities funds attracted the
most investment (€7.4 billion). But equity funds,
open- end real estate funds and funds of funds
likewise recorded inflows, which amounted to
€3.3 billion, €1.5 billion and €1.3 billion re-
spectively. Foreign mutual funds placed shares
worth €9.8 billion in the German market in
January. On balance, domestic non- banks were
virtually the only purchasers of mutual fund
shares in the reporting month (€23.0 billion).
Domestic credit institutions and foreign invest-
ors each purchased mutual fund shares worth
€0.9 billion net.
Balance of payments
The German current account recorded a sur-
plus of €22.0 billion in January 2018. The result
was €6.9 billion down on the level of the previ-
ous month due to the fact that the decline in
the surplus in the invisible current transactions
balance, which comprises services as well as
primary and secondary income, significantly
outweighed the increase in the trade in goods
surplus.
In January, the surplus on the goods account
was €1.1 billion up on the month at €19.6 bil-
lion. Although foreign trade imports increased
more strongly than the corresponding exports
Little net issu-ance in the German equity market
German mutual funds record high inflows
Current account surplus down
Increase in goods account surplus
Sales and purchases of debt securities
€ billion
Item
2017 2018
January December January
Sales
Domestic debtsecurities1 22.6 – 18.9 – 2.3of which
Bank debt securities 12.0 – 5.8 1.2Public debt securities 5.9 – 12.2 – 4.0
Foreign debt securities2 2.3 – 1.5 16.5
Purchases
Residents 20.8 3.5 – 2.0Credit institutions3 – 7.4 – 12.1 1.2Deutsche Bundesbank 18.1 10.1 6.1Other sectors4 10.1 5.5 – 9.3of which
Domestic debtsecurities 6.1 6.0 – 21.7
Non-residents2 4.0 – 24.0 16.1
Total sales/purchases 24.9 – 20.5 14.2
1 Net sales at market values plus/minus changes in issuers’ hold-ings of their own debt securities. 2 Transaction values. 3 Book values, statistically adjusted. 4 Re sidual.
Deutsche Bundesbank
Deutsche Bundesbank Monthly Report March 2018 12

of goods, this was, on balance, more than off-
set by the increase in net receipts on merchant-
ing and higher net deductions on imported
goods.
The surplus on invisible current transactions fell
by €8.0 billion to €2.4 billion in January, mainly
owing to deteriorations in the balances of the
primary income and the services account. Net
receipts on primary income fell by €4.0 billion
to €7.6 billion. Much of this was due to the
normalisation of other income following pay-
ment in December – as is standard practice at
year’s end – of the bulk of agricultural subsidies
under the EU budget. Services showed a net
deficit of €0.4 billion in January after recording
a surplus of €3.7 billion in December. The main
reasons for this turnaround were that, after ris-
ing in the previous month, income, especially
from IT services and various other business ser-
vices, declined more strongly on balance than
the corresponding expenditure items, whilst
revenue from personal, cultural and recre-
ational services normalised and travel expend-
iture increased. In the secondary income ac-
count, the deficit narrowed slightly by €0.1 bil-
lion to €4.9 billion.
In January, the international financial markets
were influenced by the positive economic out-
look and expectations regarding monetary pol-
icy decisions in the major economic areas.
Against this backdrop, Germany’s cross- border
portfolio investment generated net capital ex-
ports in the amount of €16.8 billion, compared
with €32.9 billion in December 2017. Domestic
investors increased their net purchases of for-
eign securities (€32.5 billion) across all instru-
ments. They purchased foreign bonds in the
amount of €14.2 billion and money market in-
struments to the tune of €2.2 billion. Domestic
investors added foreign mutual fund shares
worth €9.8 billion and shares issued abroad
worth €6.2 billion to their portfolios. In turn,
foreign investors bought German securities in
the amount of €15.7 billion net. Their demand
focused in particular on German bonds, from
the public and private sector alike (€19.9 billion
Surplus in invisible current transactions down
Capital outflows in portfolio investment
Major items of the balance of payments
€ billion
Item
2017 2018
Janr Decr Janp
I Current account + 11.9 + 28.8 + 22.0 1 Goods1 + 15.7 + 18.5 + 19.6
Exports (fob) 97.9 99.1 106.9 Imports (fob) 82.2 80.6 87.3 Memo itemForeign trade2 + 14.6 + 18.1 + 17.4
Exports (fob) 98.6 100.6 107.1 Imports (cif) 84.0 82.5 89.7
2 Services3 – 1.0 + 3.7 – 0.4 Receipts 20.9 28.7 21.5 Expenditure 21.9 25.0 21.8
3 Primary income + 6.9 + 11.7 + 7.6 Receipts 15.5 21.0 15.7 Expenditure 8.6 9.3 8.0
4 Secondary income – 9.7 – 5.0 – 4.9
II Capital account – 0.1 – 0.3 + 0.5
III Financial account (increase: +) + 7.1 + 38.8 + 5.6 1 Direct investment 0.0 + 10.7 + 6.4
Domestic investment abroad + 14.0 + 8.0 + 11.4 Foreign investment in the reporting country + 14.0 – 2.8 + 5.0
2 Portfolio investment + 7.6 + 32.9 + 16.8 Domestic investment in foreign securities + 12.2 + 7.1 + 32.5
Shares4 + 1.2 + 3.1 + 6.2 Investment fund shares5 + 8.8 + 5.5 + 9.8 Long-term debt securities6 + 1.5 + 1.6 + 14.2 Short-term debt securities7 + 0.8 – 3.1 + 2.2
Foreign investment in domestic securities + 4.6 – 25.8 + 15.7
Shares 4 + 1.2 – 2.7 – 1.4 Investment fund shares – 0.6 + 0.8 + 0.9 Long-term debt securities6 + 9.8 – 23.1 + 32.6 Short-term debt securities7 – 5.7 – 0.9 – 16.5
3 Financial derivatives8 – 0.3 + 0.1 + 0.2 4 Other investment9 – 0.1 – 2.7 – 17.7
Monetary fi nancial institutions10 – 53.9 + 45.5 – 50.8
of which Short-term – 55.9 + 42.3 – 51.3
Enterprises and households11 + 1.9 – 20.2 + 13.1 General government – 5.4 + 9.9 – 1.1 Bundesbank + 57.3 – 37.9 + 21.1
5 Reserve assets – 0.1 – 2.4 – 0.1
IV Errors and omissions12 – 4.6 + 10.3 – 16.8
1 Excluding freight and insurance costs of foreign trade. 2 Spe-cial trade according to the offi cial foreign trade statistics (source: Federal Statistical Offi ce). 3 Including freight and insurance costs of foreign trade. 4 Including participation certifi cates. 5 Includ-ing reinvestment of earnings. 6 Long- term: original maturity of more than one year or unlimited. 7 Short- term: original maturity of up to one year. 8 Balance of transactions arising from options and fi nancial futures contracts as well as employee stock op-tions. 9 Includes in particular loans and trade credits as well as currency and deposits. 10 Excluding the Bundesbank. 11 In-cludes the following sectors: fi nancial corporations (excluding monetary fi nancial institutions) as well as non- fi nancial corpor-ations, households and non- profi t institutions serving house-holds. 12 Statistical errors and omissions, resulting from the difference between the balance on the fi nancial account and the balances on the current account and the capital account.
Deutsche Bundesbank
Deutsche Bundesbank Monthly Report
March 2018 13

and €12.7 billion respectively). Furthermore,
they acquired mutual fund shares, albeit to a
far lesser extent (€0.9 billion). By contrast, they
sold domestic money market paper (€16.5 bil-
lion) and shares (€1.4 billion).
Direct investment generated net capital exports
of €6.4 billion in January compared with €10.7
billion in December 2017. Domestic enterprises
supplied their affiliates abroad with funds
worth €11.4 billion net, mainly by stepping up
their equity capital (€10.7 billion). They issued
intra- group loans to a lesser extent (€0.7 bil-
lion), providing mainly financial credit, whilst
trade credits primarily saw redemptions. Mean-
while, foreign enterprises invested €5.0 billion
in affiliated enterprises in Germany, providing
funds mainly via financial credit (€10.9 billion).
By contrast, they scaled back the volume of
intra- group trade credits (€6.0 billion). The
equity capital invested in Germany by foreign
enterprises remained virtually unchanged on
balance in January (+€0.1 billion).
Other statistically recorded investment, which
comprises loans and trade credits (where these
do not constitute direct investment), bank de-
posits and other investments, saw net capital
imports of €17.7 billion in January. Much of this
was attributable to inflows to monetary finan-
cial institutions (excluding the Bundesbank)
amounting to €50.8 billion and arising from
the fact that the deposits of foreign customers
at German banks grew significantly more
strongly than their non- securitised claims on
the foreign sector. General government, too,
attracted net inflows of funds from abroad
(€1.1 billion). By contrast, transactions by enter-
prises and households resulted in net capital
exports (€13.1 billion); these were partly the re-
sult of this sector’s rising claims and falling li-
abilities vis- à- vis non- residents. Bundesbank ac-
counts also recorded outflows of funds (€21.1
billion) because the deposits held by foreign
central banks and international institutions at
the Bundesbank fell at a faster pace than the
Bundesbank’s foreign claims, which likewise
decreased. The Bundesbank’s TARGET2 bal-
ance consequently went down by €24.9 billion.
The Bundesbank’s reserve assets fell – at trans-
action values – by €0.1 billion in January.
Direct invest-ment sees net capital exports
Capital imports in other invest-ment
Reserve assets
Deutsche Bundesbank Monthly Report March 2018 14

German balance of payments in 2017
The German economy’s current account surplus declined further to 8% of nominal gross domes-
tic product (GDP) in 2017 in a continuation of the development observed in the previous year
which has now left the surplus perceptibly short of the record level of 9% seen back in 2015. In
absolute terms, the surplus came in at €262½ billion, which is well down on the figures for the
two previous years but still far in excess of the 6% of GDP threshold set by the European Commis-
sion to prevent and correct macroeconomic imbalances. Looking at the sub- accounts, 2017 was
the first year since 2009 in which the goods trade surplus stopped expanding. This was largely
down to terms of trade effects relating to the increase in the cost of internationally traded com-
modities as well as the continued strength of domestic demand and the resulting high demand
for imports. The rosy demand conditions worldwide meant that the slight appreciation of the
euro on an annual average was almost of no consequence. Viewed in terms of the domestic
savings and investment decisions made, last year’s decline in the current account surplus as a
share of GDP was attributable to the increase in business and household investment activity on
the back of a strongly expanding German economy.
Germany’s financial account last year was likewise influenced by the recovery in global activity;
furthermore, the persistently accommodative monetary policy in the euro area contributed to
cross- border portfolio adjustments. At €275½ billion, net capital exports were slightly up on their
2016 level. Continued purchases of assets for monetary policy purposes drove down the volume
of German debt securities held by non- resident investors and led to sustained domestic demand
for foreign securities. The Eurosystem’s asset purchase operations were likewise the driving force
behind the further expansion of the Bundesbank’s TARGET2 claims, while commercial banks’ stock
of external liabilities also picked up. Direct investment flows worldwide receded, but German
enterprises once again stepped up their direct investment operations. Germany also proved to be
a popular destination for inbound foreign direct investment. In both directions, euro area coun-
tries were the main partner countries.
Deutsche Bundesbank Monthly Report
March 2018 15

Current account
Underlying trends in the current account
Germany’s current account surplus declined to
€262½ billion in 2017, dropping by ½ percent-
age point to 8% of nominal gross domestic
product (GDP), which is perceptibly lower than
the record level of 9% seen in 2015. The sur-
plus nonetheless persisted well above the 6%
of GDP threshold set by the European Commis-
sion to prevent and correct macroeconomic
imbalances. In the in- depth review that was
consequently required as part of the 2018
European Semester, the European Commission
identified Germany as once again having
macroeconomic imbalances.1
While the current account surplus declined in
absolute terms, there were contrasting devel-
opments in the individual sub- accounts. Unlike
in the previous years, the goods account sur-
plus did not increase in 2017. This was largely
due to the deterioration in the terms of trade,
which cancelled out the strong increase – in
volume terms – in the goods trade balance
brought about by the vibrant exports growth.
By contrast, the deficit in the services account
narrowed slightly. In the primary income ac-
count, the surplus bounced back from its dip
last year. Given the strong growth in Germany’s
external assets and liabilities in 2017, yields on
both assets and liabilities are likely to have con-
tracted further. As for the secondary income
account, the shortfall was widened distinctly by
one- off effects on the expenditure side result-
ing from private unilateral transfers to the rest
of the world.
The world economy’s cyclical recovery in 2017
created a very favourable global setting for
German enterprises. The broad regional up-
ward trend was accompanied by more vigor-
ous investment, above all in the advanced
economies. Furthermore, data from the Inter-
national Monetary Fund (IMF) show that world
trade accelerated distinctly after last year’s lull.
Economic activity in Germany, meanwhile, is
likely to have been dampened slightly by a
number of price factors, two of which – the
brighter global economic outlook, and the
agreement reached by the Organization of the
Petroleum Exporting Countries (OPEC) with
other major oil- producing countries at the end
of 2016 to curb the output of crude oil – sent
the oil price sharply higher.2 A barrel of Brent
Current account surplus as a share of GDP down again slightly
Deterioration in terms of trade cancels out vibrant exports growth
Global setting expansionary despite stronger euro and higher commodity prices
Germany's current account
1 Special trade according to the official foreign trade statistics, including supplementary trade items, which also contain freight and insurance costs as a deduction from imports.
Deutsche Bundesbank
1999 00 05 10 15 17
6
4
2
0
2
4
6
8
10
12
–
–
–
+
+
+
+
+
+
As a percentage of GDP
Secondary income
Components:
Trade in goods1
Services excludingtravel
Primary income
– 3
– 2
– 1
0
+ 1
+ 2
+ 3
+ 4
+ 5
+ 6
Travel
of which
With theeuro areacountries
(enlarged scale)
Overall
Current account balance
1 See: European Commission, Country Report Germany 2018, which includes an in- depth review on the prevention and correction of macroeconomic imbalances, Brussels, 7 March 2018.2 See also Deutsche Bundesbank, Supply- side influences on the price of oil, Monthly Report, August 2017, p 12.
Deutsche Bundesbank Monthly Report March 2018 16

crude cost an average of US$54 in 2017 – one-
quarter more than in the previous year. Head-
winds also came from the stronger euro, the
nominal effective exchange rate of which
against the currencies of the euro area’s 38
most important trading partners (the EER-38
group) in 2017 was up by an average of around
2% on the year. The euro gained ground
against the pound sterling and the Japanese
yen in particular, but it also appreciated against
the US dollar and the Swiss franc. These head-
winds slightly worsened the German econo-
my’s price competitiveness.
Goods exports, stimulated by vibrant external
demand, bounced back from last year’s
breather to register considerable gains. Imports
were likewise well up on the previous year,
partly as a result of the current boom in the
German economy. Major sources of stimulus
were the brisk demand for intermediate goods
to meet the strong upturn in industrial output,
the pick- up in investment activity as well as
lively household consumption. With import
prices returning to a robust growth path in
2017 for the first time in five years on the back
of the increase in oil and industrial commodity
prices, imports outpaced exports in nominal
terms. The real data, however, show that the
growth of goods exports outstripped the up-
turn in goods imports. In net terms, the surplus-
reducing price effect slightly overshadowed the
positive volume effect, leaving the foreign
trade balance in the reporting year €4 billion
down at €244½ billion.
An analysis of the current account surplus from
a regional perspective reveals that the surplus
was slightly larger with other euro area coun-
tries and significantly lower with non- euro area
countries. As a share of nominal GDP, the sur-
plus with non- euro area countries contracted
by ¾ percentage point to 5½%; with other
euro area countries it came to just under 2½%.
The drop in the current account surplus with
non- euro area countries came as a result of a
wider deficit in the secondary income account
and a narrower goods account surplus.
Germany’s current account surplus can also be
seen as the outcome of the investment and
savings decisions made by the country’s gen-
eral government, households and enterprises.
Viewed from this particular angle, the decline
in Germany’s current account surplus as a share
of GDP in 2017 can be explained by an upturn
in investment activity spurred by the robust up-
swing in the German economy. This upturn
was primarily attributable to brisker business
invest ment and another increase in private resi-
dential investment. Aggregate savings as a per-
centage of GDP, on the other hand, saw little
change in 2017, even if the individual sectors
did not always move in the same direction. Net
general government lending climbed again last
year on the back of robust activity and low
interest rates. The strong rise in non- financial
corporations’ savings since the beginning of
the 2000s fell back significantly in 2017, in par-
ticular because the enterprises paid out almost
all their additional profits and made unusually
Goods exports and imports very lively
Surplus with non- euro area countries narrower
Investment picks up; aggregate savings remain unchanged
Price and volume effects on the
German foreign trade balance*
Source of unadjusted figures: Federal Statistical Office. * Decomposed using the Shapley-Siegel index.
Deutsche Bundesbank
2005 06 07 08 09 10 11 12 13 14 15 16 2017
140
170
200
230
260
– 90
– 60
– 30
0
+ 30
+ 60
+ 90
Lin scale
Log scale
Foreign trade balance
€ billion
Price effect
Volume effect
Annual percentage changeof which
Deutsche Bundesbank Monthly Report
March 2018 17

high other current transfers.3 On balance, net
lending/ net borrowing, which includes not just
investment and savings but capital transfers as
well, receded sharply in the non- financial cor-
porate sector and recorded a minor gain in the
general government sector.
Goods flows and balance of trade
German foreign trade activity gained significant
traction in 2017, with exports benefiting as the
global economic upswing took hold. On bal-
ance, price- adjusted goods exports grew by
4¼%, after 1¾% in 2016. The pace of this
growth was faster still in nominal terms due to
the sign reversal in the path of foreign trade
prices. Manufacturers abroad reaped consider-
able benefits from the surge in German domes-
tic demand. Additional stimulus for imports
came from the faster growth of exports which,
just like machinery and equipment investment,
have a high import content. Goods imports
expanded at much the same robust pace as
exports from a price- adjusted perspective. In
value terms, imports rose by 8¼%, outpacing
exports on account of the stronger overall price
increase recorded above all by energy and
products at the upstream stages of the produc-
tion process. As a result, the foreign trade sur-
plus shrank for the first time since 2009, falling
by €4 billion to €244½ billion.
Goods exports to EU and non- EU countries in
2017 improved significantly on the year after a
distinctly weaker showing one year earlier. As
far as exports to EU countries are concerned,
business with the central and east European
member states outside the euro area fared par-
ticularly well, as they had done in previous
years. There was also a surge in exports to the
euro area, partly due to a strengthening of
growth across the bloc. Exports to all of Ger-
many’s main trading partners picked up
strongly, with deliveries to the Netherlands
gaining the most ground. Trade with the
smaller euro area countries, above all Ireland
and Finland, generally increased at a robust
pace as well. By contrast, there was another
distinct drop in the value of exports to the
United Kingdom. The substantial appreciation
of the euro against the pound sterling is also
likely to have had a dampening effect here.
Other headwinds for exports to the UK might
have included the spring increase in motor ve-
hicle tax on new vehicles and its negative im-
pact on car imports.
2017 was the first year in quite some time in
which the growth of exports to non- EU coun-
tries in value terms was back on track with that
to the EU. German exports to emerging market
economies were particularly gratifying. In Rus-
sia, sales of German products bounced back
markedly after a four- year spell that had mostly
seen declines. Exports to China likewise made
exceptionally strong advances as the Chinese
economy experienced a cyclical upswing. Simi-
larly, there was considerable growth in exports
to south and east Asian emerging market econ-
omies. Exports to industrial countries outside
the EU were brisk as well. German firms sub-
stantially boosted their exports to Switzerland
and Japan. Sales to the United States bounced
back strongly from last year’s marked lull. The
growth in exports to the newly industrialised
Strong expan-sion in foreign trade
Exports to EU countries surge higher, …
… as do those to non- EU countries
1991 95 00 05 10 15 17
0
2
4
6
8
10
12
As a percentage of GDP
Savings
Investment 1
Aggregate savings and investment
Source: Federal Statistical Office. 1 Gross investment less con-sumption.
Deutsche Bundesbank
3 See also the box on pp 20-22.
Deutsche Bundesbank Monthly Report March 2018 18

economies in Asia was below par. Sales to the
OPEC countries, meanwhile, contracted signifi-
cantly. The multi- year low in oil prices also
probably curbed these countries’ ability to re-
cycle petrodollars.
German exporters in all economic sectors bene-
fited from the surge in external demand. Sales
of consumer and intermediate goods shot
higher, expanding by 8% and 6¾%, respect-
ively, in price- adjusted terms. And with invest-
ment activity gradually picking up around the
world, exporters of machinery and equipment
put last year’s subdued growth behind them to
record very substantial gains. Tailwinds came
not just in the form of the strong upswing in
global industrial activity; the increase in world
market prices for commodities also buoyed
spending on machinery and equipment in
commodity- exporting countries. Manufacturers
of machinery and equipment considerably in-
creased their exports in price- adjusted terms.
Exports of computers, electronic and optical
products as well as electrical equipment like-
wise registered very strong gains. Growth in
exports of motor vehicles and motor vehicle
parts, meanwhile, fell short of the average
pace of aggregate goods exports – as it had in
the previous year – and also failed to match the
rates of increase recorded in 2014 and 2015,
which were both very successful years for the
automotive industry. One factor at play here
was the persistently flat growth of sales in the
major UK and US export markets, which in
2016 had each accounted for roughly one-
eighth of German car exports.
The brisk consumption and investment activity
in Germany and, indirectly, the growth in ex-
ports as well also made itself felt on a broad
array of goods imports from abroad. Imports of
consumer, capital and intermediate goods
surged at an exceptionally robust pace of more
than 7% in price- adjusted terms. Particularly
strong gains were again registered by foreign
exporters of pharmaceutical products and of
motor vehicles and motor vehicle parts. Fur-
thermore, the brisker demand for machinery
Surge in demand for broad array of export goods
Demand for broad range of import goods
Foreign trade by region
%
Country/group of countries
Per-cent-age share
Annual percentagechange
2017 2015 2016 2017
Exports
Euro area 36.9 4.9 1.6 7.0
Other EU countries 21.7 10.1 2.3 5.1
of which
United Kingdom 6.6 12.4 – 3.5 – 1.8
Central and east European EU countries1 11.6 9.8 5.2 9.4
Switzerland 4.2 6.2 2.2 7.7
Russia 2.0 – 25.9 – 0.6 20.2
United States 8.7 18.6 – 6.1 4.4
Japan 1.5 0.3 7.9 6.7
Newly industrialised economies in Asia2 3.0 8.8 1.4 1.9
China 6.7 – 4.1 6.7 13.3
South and east Asian emerging market economies3 2.2 4.5 1.4 10.0
OPEC 2.4 8.3 – 5.6 – 11.8
All countries 100.0 6.2 0.9 6.2
Imports
Euro area 36.9 1.7 0.6 6.4
Other EU countries 20.2 5.7 3.1 8.6
of which
United Kingdom 3.6 – 0.3 – 7.2 4.2
Central and east European EU countries1 13.9 9.2 6.8 10.0
Switzerland 4.4 6.8 4.3 4.1
Russia 3.0 – 21.5 – 12.0 18.7
United States 5.9 22.4 – 3.7 5.3
Japan 2.2 6.2 8.6 4.5
Newly industrialised economies in Asia2 2.8 8.3 – 0.9 22.6
China 9.7 15.2 2.4 6.7
South and east Asian emerging market economies3 3.9 14.5 4.4 11.5
OPEC 0.9 – 31.7 – 17.8 39.3
All countries 100.0 4.3 0.6 8.3
1 Bulgaria, Croatia, Czech Republic, Hungary, Poland, Romania. 2 Hong Kong, Singapore, South Korea, Taiwan. 3 India, Indo-nesia, Malaysia, Philippines, Thailand, Vietnam.
Deutsche Bundesbank
Deutsche Bundesbank Monthly Report
March 2018 19

The savings of non- fi nancial corporations in Germany
The high level of savings among Germany’s corporate sector has become a topic of economic policy debate in recent years. For more than a decade now, German non- fi nancial corporations have, as a whole, been net lenders. The increase in net lend-ing by corporations since the turn of the millennium has been driven primarily by an increase in the formation of savings, while there has been only a slight decline in net investment relative to gross value added. The resulting change in the fi nancing struc-ture of non- fi nancial corporations could im-pact the transmission of monetary policy.1 Furthermore, it is suspected that growing corporate savings have contributed to the current high level of Germany’s current ac-count surplus, which by defi nition corres-ponds to the difference between aggregate savings and aggregate investment.2
The relative scale of the strong formation of savings by German enterprises becomes clear when compared with the formation of savings by the other domestic sectors and by enterprises in the rest of the euro area and the European Union (EU). Moreover, a breakdown of the components of corpor-ate savings in the national accounts can in-dicate which factors were behind enter-prises’ increased saving efforts in recent years.
Contributions by sector to aggregate net lending/ net borrowing
Net lending by the German economy to the rest of the world has increased sharply since the beginning of the last decade. Whereas Germany was a net borrower in the period 1991 to 2000, when net borrowing was 1¼% of GDP on average, it has been a net lender since 2011, with net lending rising to over 6% of GDP.3 While the biggest contri-bution to aggregate net lending in the past two decades has, as usual, been made by households, their net lending has remained virtually unchanged since the start of the millennium. The bulk of the increase in ag-gregate net lending, by contrast, was attrib-
1 See Deutsche Bundesbank, Developments in corpor-ate fi nancing in the euro area since the fi nancial and economic crisis, Monthly Report, January 2018, pp 53-71.2 Broken down by domestic sector, this can be attrib-uted to the contributions made by fi nancial corpor-ations, non- fi nancial corporations, households and non- profi t institutions serving households, and general government. Net lending/ net borrowing by these sec-tors, which includes the difference between savings and investment as well as capital transfers, refl ects the arithmetic contribution of these sectors to aggregate net lending/ net borrowing, which, in turn, approxi-mately corresponds to the current account balance.3 Small discrepancies between the current account balance, including the capital transfers balance, and the net lending/ net borrowing position are attributable to the partial use of different statistical sources, varying methods of calculation and the fact that the revision method applied to the two sets of fi gures is not identical.
Net lending/net borrowing in Germany
by sector
9
6
3
0
3
6
9
12
–
–
–
+
+
+
+
As a percentage of GDP
1991 95 00 05 10 15 17
1 Including non-profit institutions serving households. 2 One-off effect largely due to the assumption of the Treuhand agency’s debt by general government. 3 One-off effect from the auction of UMTS licences.
Deutsche Bundesbank
3
2
Households1
Financial corporations
Non-financial corporations
General government
of whichNet lending/net borrowing
Deutsche Bundesbank Monthly Report March 2018 20

utable to net lending by non- fi nancial cor-porations. The sharp reduction in net bor-rowing by general government, which gave way to net lending in 2014, also contrib-uted to the currently very high level of ag-gregate net lending.
Corporate savings in Germany compared with other European countries
At the beginning of the last decade, corpor-ate savings4 in Germany relative to the cor-porate sector’s gross value added was markedly below the average rate in the rest of the euro area and the EU.5 While a strong upward trend was observed in corporate savings in Germany up until 2007, the aver-age saving rate of non- fi nancial corpor-ations in other countries followed a down-ward trend during this time. As a result, the saving rates converged sharply. From the end of the 2000s onwards, the saving rates of non- fi nancial corporations in Germany and the other countries of the EU and the euro area changed more or less uniformly. While the upward trend in Germany con-tinued – except for the interruption during the Great Recession of 2008-2009 – there was a shift in the saving behaviour of non- fi nancial enterprises in the other countries, where net saving increased. It is likely that catch- up effects played a role in these countries following the period of decline in corporate savings prior to the crisis. In Ger-many, savings of German corporations reached their most recent peak in 2015. Since then, they have receded somewhat. As a result, the average saving rate of enter-prises in the rest of the euro area, which was somewhat lower than in Germany in the period after 2010, is now again on a par with the rate in Germany.
Components of corporate savings
The upward trend in corporate savings in Germany since 1999 (in relation to the cor-porate sector’s gross value added) is, in this
period, primarily attributable to the declin-ing contribution of employee compensation as a share of total expenditure, lower inter-est costs, and the subdued distribution of corporate profi ts.
The individual factors’ directional impact on corporate savings (ie whether they caused savings to rise or fall) is not always the same in the period before the 2007-2008 fi nan-cial crisis as it is in the period thereafter. For example, in the period up to 2007, wage moderation in Germany led to a clear de-cline in the contribution of employee com-pensation to expenditure and thus had a positive impact on corporate savings. By contrast, the somewhat higher wage growth seen since then has dampened cor-porate savings. Furthermore, the fall since 2007 in the distributed income of corpor-
4 In the national accounts, corporate sector net sav-ings are defi ned as retained earnings after the deduc-tion of taxes and the addition of net transfers. In the case of gross savings, consumption of fi xed capital is also taken into account. The fi gures presented in this box are net fi gures.5 For the aggregation of data for the other countries in the euro area and the EU, data are weighted accord-ing to the gross value added of the non- fi nancial cor-porations of the respective countries. For reasons of consistency, only countries for which data are available for the entire period of 1999 to 2016 are included in the calculation. Croatia, Cyprus, Hungary, Malta and Romania are therefore not taken into account.
Net savings of non-financial corporations *
Source: Eurostat and Bundesbank calculations. * Weighting ac-cording to the gross value added of non-financial corporations in the respective countries. 1 Excluding Croatia, Cyprus, Hun-gary, Malta, and Romania. 2 Excluding Malta and Cyprus.
Deutsche Bundesbank
1999 00 05 10 15
2
0
2
4
6
8
–
+
+
+
+
As a percentage of their gross value added
EU excluding Germany 1
Euro areaexcluding Germany 2
Germany
Deutsche Bundesbank Monthly Report
March 2018 21

and equipment in Germany sparked a sharp
upturn in purchases of traditional capital goods,
such as machinery, from foreign manufactur-
ers. Imports of computers, electronic and op-
tical products likewise picked up strongly. There
was also a very substantial increase indeed, in
value terms, in imports of energy products,
though the bulk of this can be put down to
price effects – in volume terms, the growth
was relatively small.
From a regional perspective, there was an
unusually robust increase in nominal imports
from both EU and non- EU countries. As in the
previous year, the upturn in imports from cen-
tral and east European EU countries outside the
euro area was relatively strong. Imports from
the United Kingdom, meanwhile, posted note-
worthy gains, after declining for a number of
years. Manufacturers in euro area countries
benefited considerably from Germany’s
cyclically- induced increasing demand for im-
ports. Price- adjusted growth in imports was
not quite as lively as it had been in 2016, but
this was largely due to the decline posted by
other transport equipment.4 Disregarding this
item, the main euro trading partners stepped
up their deliveries to German customers quite
substantially, with imports from Spain and the
Netherlands growing notably on balance. The
majority of the smaller countries also increased
their exports to Germany significantly, with the
exception of Greece. Furthermore, there was a
surge in imports from countries which are
major suppliers of energy products, such as
Russia and the OPEC states, though to a very
great extent, this increase was driven by higher
energy product prices. There was another sharp
upturn in imports from the United States, after
a weaker showing, and from Switzerland.
Broad regional growth in imports
ations relative to their gross value added has been the main factor behind the in-crease in corporate savings in Germany in this period. By contrast, in the previous period, the distributed income of corpor-ations had a dampening effect on savings
as a result of improved corporate profi tabil-ity. The contribution of declining interest costs, meanwhile, has been greatest in the period of expansionary monetary policy measures since the start of the fi nancial cri-sis.
Change in the savings of non-fi nancial corporations in Germany*
As a percentage of their gross value added
Item 1999 to 2017 1999 to 2007 2007 to 2017
Consumption of fi xed capital 0.4 0.1 0.3Compensation of employees 2.4 5.9 – 3.6Interest received 0.6 1.7 – 1.1Distributed income of corporations received 0.9 1.7 – 0.8Reinvested earnings on foreign direct investment received 0.9 1.4 – 0.5Interest paid 2.5 0.5 2.0Distributed income of corporations paid 1.0 – 6.1 7.1Reinvested earnings on foreign direct investment paid – 0.6 – 0.2 – 0.4Other factors – 2.5 – 1.9 – 0.6
Net savings 5.6 3.2 2.4
* Three-year averages are used for the start and end values of each period to smooth possible cyclical effects. In each case, the start year and end year constitute the fi nal year of the respective three-year period.
Deutsche Bundesbank
4 The other transport equipment item largely includes ships and boats, railway locomotives and rolling stock, but its chief components are air and spacecraft. Since the latter are also manufactured under a joint European arrange-ment, they are a particular driver of bilateral foreign trade flows for the countries involved.
Deutsche Bundesbank Monthly Report March 2018 22

South and east Asian countries, China and
Japan also saw their exports to Germany climb
strongly, with the newly industrialised countries
ranking among the most successful exporters.
In addition, that region’s emerging market
economies in particular significantly expanded
their deliveries to Germany.
Breakdown of invisibles
Germany’s service business with the rest of the
world usually records a deficit, which amounted
to €16 billion in 2017. This was €4 billion lower
than in the previous year. The main reason for
this was that, against the backdrop of strong
economic activity around the world, revenues
from abroad rose more sharply than residents’
expenditure on services provided by non-
residents.
The individual sub- items of the services account
shifted only moderately compared to 2016.
Nonetheless, within trade in services, contribu-
tions from business- related sectors and sectors
oriented to economic activity rose by an above-
average amount on both the revenue and ex-
penditure sides. In the year under review, the
traditionally very high sales of German enter-
prises in international transport business saw
very strong growth in line with the cyclical
trend. This narrowed the deficit in this sub-
account, which has been running a deficit for
many years now, as income grew faster than
expenditure. Some knowledge- based services
also reported disproportionately high growth in
international trade, which resulted in a slight
improvement in the sub- accounts in the areas
of research and development as well as use of
intellectual property. In the cases of manufac-
turing services as well as technical and other
services, there was a lack of momentum on the
revenue side, causing the balances to worsen
somewhat. As in 2016, cross- border sales in
professional and management services, which
saw strong growth a few years ago, rose only
slightly, notwithstanding a slight reduction in
the deficit. These services also include commer-
cial services, which have recorded a deficit in
the current account for a long time.
In 2017, service sectors with only indirect links
to the production sector grew very little or not
at all compared to the previous year. In the year
under review, cross- border insurance and fi-
nancial services were less in demand than in
2016 – from Germany’s perspective, the sur-
pluses generated grew by a small amount. In
the culture and leisure sector, a one- off effect
at the end of 2017 led to a surplus instead of
the slightly negative result that would have
normally been expected. The largest balance
sheet item within services – the deficit in the
Reduced deficit in services account
Strong momentum in cross- border commercial and business services
No growth in financial services, moderate growth rates in foreign travel
Germany's foreign trade within and
outside the euro area
Source: Federal Statistical Office.
Deutsche Bundesbank
2007 08 09 10 11 12 13 14 15 16 2017
0
100
200
300
400
500
600
700
800
900
€ billion
0
100
200
300
400
500
600
700
0
30
60
90
120
150
180
Goods exports
Enlarged scale
Foreign trade balance
Goods imports
Euro area countries Non-euro areacountries
Deutsche Bundesbank Monthly Report
March 2018 23

balance of cross- border travel – rose only mar-
ginally to just under €39 billion. This is due to
the fact that the expenditure of German resi-
dents abroad rose to a somewhat greater ex-
tent than residents’ revenues from non-
residents’ travel. On the expenditure side, there
was marked growth in both expenditure on
private travel – not least as a result of the large
increases in residents’ income over the past
few years – as well as on business travel. This
particularly benefited Spain, Greece, Austria,
some east European EU member states as well
as Asian destinations.
Germany accumulated a surplus of just over
€67 billion from cross- border primary income
in 2017. The year- on- year increase of €6½ bil-
lion offset the decline seen in 2016. The bal-
ance sheet is dominated by property incomes,
which rose to just under €69 billion in net
terms in 2017. Both higher income as well as
lower expenditure contributed to the improved
result. Germany’s net external asset position
also increased further in the year under review,
with a positive accumulation effect making an
impact. This was counteracted by the fact that
the yield level was again slightly lower overall
compared to the previous year. In contrast to
2016, yields on liabilities fell somewhat more
sharply than yields on assets last year, which
resulted in a more favourable yield differential
for Germany.5 The improved assets and liabil-
ities account was due largely to increased in-
come from direct investment, which, according
to current data, was not transferred to Ger-
many, but remained abroad. Both the revenue
and expenditure sides in cross- border portfolio
investment of residents were down, with net
income from the German perspective rising sig-
nificantly. On the other hand, the net interest
income position deteriorated considerably, as
expenditure was higher and revenue lower
than in the previous year.
In 2017, the deficit in the balance of cross-
border secondary income reached a value of
more than €54 billion, exceeding the €40 bil-
lion deficit of 2016 by a significant margin. This
increase is attributable to one- off effects from
private unilateral transfers to the rest of the
world. Personal transfers to the rest of the
world – which mainly comprised remittances –
also increased according to provisional figures.
The scale of these payments as well as the in-
crease are, however, relatively small. Moreover,
in comparison to 2016, there were only limited
movements both in terms of additional private
income as well as expenditure in the secondary
Investment income surplus grows consider-ably
Deficit in secondary income rises sharply due to one- off effects
Foreign trade by selected categories of goods in 2017
Source of unadjusted figures: Federal Statistical Office. Deviations from 100% due to rounding.
Deutsche Bundesbank
Imports
lntermediategoods30.5%
Capital goods45.5%
of whichMotorvehicles18.4%
Consumergoods18.1%
Energy 1.7%
Agricultural goods0.8% Unclassifiable goods
3.3%
Exports
Agricultural goods3.3%
lntermediate goods30.6%
Energy 8.1%
of whichMotor vehicles11.4%
Unclassifiable goods4.7%
Capital goods31.6%
Consumergoods21.8%
5 For details of the underlying trend, see Deutsche Bundes-bank, Effects on the cross- border investment income bal-ance: asset accumulation, portfolio shifts and changes in yields, Monthly Report, March 2015, pp 81-85.
Deutsche Bundesbank Monthly Report March 2018 24

income account, with hardly any change in the
balance. Insurance premiums and settlements
of balances by German reinsurers were pre-
dominant here. By contrast, the balance of
government current transfers improved, as
transfers to international institutions without
direct reciprocation – which include, amongst
others, contributions to the EU budget – de-
creased slightly. In 2017, transfers from the rest
of the world to general government remained
largely unchanged compared to the previous
year.
Financial transactions
Portfolio investment
At €200 billion in 2017, there were once again
high net capital exports in portfolio investment
(2016: €206½ billion). As in the previous year,
the balance was driven in roughly equal meas-
ure by the strong demand for foreign securities
from German investors and the decline in Ger-
man securities holdings in foreign portfolios.
In the past year, German investors purchased
€105 billion worth of foreign securities. This
was concentrated on mutual fund shares
(€47½ billion) with broad investment focuses
that tend to be demanded mainly by institu-
tional investors. Furthermore, German investors
also purchased foreign shares. At €14 billion,
the volume of these purchases was, however,
somewhat lower than in the previous two
years. This may have had something to do with
the appreciation of the euro, which had a
negative impact on returns from investments
outside of the euro area when converted into
euro. In the case of mutual fund shares, the
regional focus was on the euro area, especially
Luxembourg, where a large proportion of the
companies that sell funds in Germany are
based. The regional classification of the ac-
quired mutual fund shares, however, does not
provide any indication of the investors’ actual
investment targets. The acquired shares origin-
ated mainly from countries outside of the euro
area. The major investment targets were the
United Kingdom and Japan.
The demand for foreign interest- bearing secur-
ities in 2017 was slightly lower than in the pre-
vious year. German investors acquired €47 bil-
lion of foreign bonds, while they disposed
of money market instruments in net terms
(€3½ billion). As in previous years, German in-
vestors focused on long- term debt securities
issued outside of the euro area (€43½ billion).
Once again, bonds from the United States were
in particular demand. However, at €9 billion,
the acquisition volume was lower than in the
preceding years, while interest in bonds from
Continuing capital exports in portfolio investment
High demand for foreign mutual fund shares …
… while demand for foreign debt securities falls slightly
Key indicators of the cross-border
investment income balance
1 Direct, portofolio and other investment and reserve assets. Excluding financial derivatives. 2 Yields shown in terms of in-vestment income/expenditure as a percentage of the annual average level of the international investment position (IIP). 3 For the IIP as at the end of 2017 Q3.
Deutsche Bundesbank
1999 00 05 10 15 17
– 30
0
+ 30
+ 60
+ 90
€ billion
€ billion
0
300
600
900
1,200
1,500
1,800
%
1
2
3
4
5Yield 2
Net external assets1
Investmentincome balance(enlarged scale)
Assets
Liabilities
3
Deutsche Bundesbank Monthly Report
March 2018 25

Japan and China rose sharply. The shift to
bonds from countries outside of the euro area
was, however, not accompanied by an add-
itional shift in demand towards foreign cur-
rency bonds. While the proportion of bonds
denominated in foreign currency was still fairly
high by historical standards, German investors
increasingly acquired bonds denominated in
euro – even outside of the euro area. Given the
low level of interest rates, it appears that many
enterprises from non- euro area countries are
continuing to take the opportunity to issue
euro- denominated bonds. In the case of money
market instruments, investors disposed of in-
struments that had been issued in the euro
area and – to a lesser extent – purchased short-
dated bonds from outside the euro area in net
terms.
In the reverse direction, foreign investors made
net sales of German portfolio assets amounting
to €95 billion. Non- residents mainly sold public
sector debt securities, primarily due to the
Euro system’s expanded asset purchase pro-
gramme (APP). However, at €65½ billion, net
sales of German government bonds were sig-
nificantly lower than in the previous year (2016:
€116 billion). The reduction in purchase vol-
umes within the APP in April 2017 is likely to
have played a role here. Furthermore, a slight
recovery in the yields of Federal bonds (Bunds)
was observed.6 Despite positive net issuances,
non- resident investors also disposed of private
bonds totalling €5½ billion, which almost ex-
clusively comprised corporate bonds.
In 2017, non- residents purchased German
money market instruments from private issuers
totalling €1 billion. In contrast, short- term pub-
lic debt securities were disposed of in large vol-
umes. Sales and redemptions in this respect
amounted to €21 billion. International invest-
ors disposed of these instruments, especially in
the first few months of last year, when the
Net sales of German bonds by foreign investors
Net capital imports of money market instruments
Major items of the balance of payments
€ billion
Item 2015r 2016r 2017r
I Current account + 271.4 + 268.8 + 262.7
1 Goods1 + 261.1 + 268.0 + 265.6
Exports (fob) 1,179.1 1,192.1 1,270.2
Imports (fob) 918.0 924.1 1,004.6
Memo item
Foreign trade2 + 244.3 + 248.9 + 244.6
Exports (fob) 1,193.6 1,203.8 1,279.0
Imports (cif) 949.2 954.9 1,034.4
2 Services3 – 16.9 – 19.9 – 16.1
of which
Travel – 36.6 – 38.2 – 38.8
3 Primary income + 67.2 + 60.6 + 67.4
of which
Investment income + 66.0 + 60.9 + 68.6
4 Secondary income – 40.0 – 39.9 – 54.1
II Capital account + 0.5 + 3.5 – 0.3
III Financial account balance4 + 239.4 + 257.7 + 275.7
1 Direct investment + 67.5 + 31.2 + 42.2
2 Portfolio investment + 192.9 + 206.7 + 200.2
3 Financial derivatives5 + 26.0 + 32.5 + 8.9
4 Other investment6 – 44.8 – 14.4 + 25.6
5 Reserve assets – 2.2 + 1.7 – 1.3
IV Errors and omissions7 – 32.5 – 14.6 + 13.3
1 Excluding freight and insurance costs of foreign trade. 2 Spe-cial trade according to the offi cial foreign trade statistics (source: Federal Statistical Offi ce). 3 Including freight and insurance costs of foreign trade. 4 Increase in net external position: + / decrease in net external position: -. 5 Balance of transactions arising from options and fi nancial futures contracts as well as employee stock options. 6 Includes in particular loans and trade credits as well as currency and deposits. 7 Statistical errors and omissions, resulting from the difference between the balance on the fi nan-cial account and the balances on the current account and the capital account.
Deutsche Bundesbank 6 Over the course of the year, yields on ten- year Bunds rose by 5 basis points to 0.3% on average in December 2017.
Deutsche Bundesbank Monthly Report March 2018 26

short- term yields on German government
bonds fell below -0.9% for a time.
It is worth noting that investors from the euro
area made net sales of German debt securities,
while investors from outside the euro area in-
creased their holdings.7 This held true both for
short and longer- term securities as well as for
debt securities issued by the public sector and
private issuers. There was again high demand
from the United Kingdom, which plays an ex-
ceptional role due to London’s status as an
international financial centre.
There were also net capital exports in the other
segments of German portfolio investment.
Foreign holders sold both German shares
(€1 billion) as well as investment fund units
(€3½ billion). As was the case in debt secur-
ities, investors from the euro area reduced their
exposure, while investors from outside the euro
area – particularly from the United Kingdom –
acquired German shares.8
As in the previous two years, German portfolio
investment was shaped by the Eurosystem’s
asset purchase programme in 2017, too. In
addition, the robust state of the global econ-
omy as well as decreasing uncertainty meant
that investors began to build up something of
an appetite for risk again. As a direct effect of
the APP, the Bundesbank’s purchases led to a
reduction in German external liabilities in the
form of debt securities, thereby resulting in
capital exports in this segment. Indirect effects
arose from portfolio rebalancing by German in-
vestors, who reduced their exposure to domes-
tic fixed- income securities in favour of foreign,
dividend- bearing portfolio assets.
Financial derivatives, which are aggregated to
form a single item in the balance of payments,
recorded net capital exports of €9 billion in
2017. The balance was therefore significantly
lower than in the previous year (2016: €32½ bil-
lion). The capital outflows were attributable to
forward contracts and options trades in roughly
equal measure. Cross- border forward and
futures contracts relating to electricity and gas,
which are also recorded under financial deriva-
tives, resulted in net capital imports totalling
€1½ billion. Monetary financial institutions
were the main domestic counterparties for
cross- border financial derivatives.
Holdings decrease mainly within the euro area
Net capital exports in dividend- bearing securities
German port-folio investment also affected by APP in 2017
Net capital exports of financial derivatives
Major items of the German balance of
payments
1 Excluding transaction-related changes in reserve assets; net capital exports: +. 2 Statistical errors and omissions.
Deutsche Bundesbank
– 80 0 + 80 + 160 + 240
Balances in € billion
Current account
Financial derivatives
Otherinvestment
Direct investment
Portfolio investment
Errors andomissions 2
Financial account 1
2016
2017
7 Regional classifications in portfolio investment should always be interpreted with caution because, on the liabil-ities side, only direct buyers and sellers of German secur-ities are recorded. As securities transactions are often pro-cessed via commercial banks in the international financial centres and custodians generally serve as recipients of prin-cipal payments, the registered capital flows do not always reveal the actual change in ownership. However, an evalu-ation of securities holdings statistics for the first three quar-ters of 2017 suggests that euro area residents disposed of German debt securities over the past year.8 Due to the lack of information about the actual owners, the caveat of limited interpretability also applies to the re-gional classification of cross- border transactions involving shares and mutual fund shares.
Deutsche Bundesbank Monthly Report
March 2018 27

Determinants of German cross- border portfolio investment
Compared with the current account and the fi nancial account as a whole, the bal-ances of individual items in the fi nancial ac-count are signifi cantly more volatile, and also change their sign frequently over time. This is because, in some cases, capital fl ows respond very quickly to changes in (macro)economic conditions and market partici-pants’ risk assessments. As a result, it is dif-fi cult to identify clear determinants of cap-ital fl ows, especially since the impact of in-dividual factors can vary over time in both quantitative and qualitative terms.1 In order to nonetheless be in a position to draw conclusions about the determinants, this box uses an approach which allows the es-timated parameters to vary over time.
To identify which determinants drive differ-ent types of capital fl ow, a model with time- varying parameters is estimated using the Kalman fi lter and maximum likelihood.2 Various net fl ows yt within the fi nancial ac-count are modelled on the basis of the fol-lowing estimation equation:
yt =Xn
i=0βi,txi,t1 + ✏t, (1)
where xi,t–1, i = 0,1,…,n describes the ex-ogenous variables specifi ed in the next sec-tion, including a constant (x0,t ≡ 1). To miti-gate the problem of regressor endogeneity, the exogenous variables are incorporated into the model with a one- period lag.3 Nor-mal distribution is assumed for the disturb-ance term: ✏t ⇠ N(0,σ2
✏ ). The time vari-ation of the estimated regression coeffi -cients βi,t is the result of a stochastic pro-cess which is described using the following equation:
βi,t = βi,t–1 + µi,t. (2)
The regression coeffi cients thus each follow a random walk process. The disturbance term of this process is likewise subject to
the normal distribution hypothesis: µi,t ⇠ N(0,2
µ,i); the impact of the con-stants in the model is not time- variable, however. Since the equation for the regres-sion coeffi cients (2) is not observable, it is determined using the Kalman fi lter. The product βi,t xi,t–1 can then be used to deter-mine the time- varying explanatory contribu-tion of the individual variables driving the capital fl ow under consideration. This ap-proach takes account of the different de-grees of importance which market partici-pants attach to the various variables de-pending on the market environment.
The approach presented here can be used to examine the impact of various macro-economic variables on Germany’s fi nancial account. The endogenous variable yt repre-sents either the total balance of portfolio investment or the balance of debt secur-ities.4 Ten- year government bond yields, economic growth, the change in the risk assessment in fi nancial markets, and the change in the nominal effective exchange rate are inputted as exogenous variables xi,t.5 The literature identifi es these variables
1 An overview of the literature on the determinants of capital fl ows can be found, inter alia, in R Koepke (2015), What drives capital fl ows to emerging markets? A survey of the empirical literature, Working Paper, In-stitute of International Finance, Washington.2 A detailed explanation of this approach can be found, inter alia, in H Lütkepohl (2006), New introduc-tion to multiple time series analysis, Heidelberg, Springer Verlag, pp 611ff.3 The results are robust to the use of simultaneous rather than lagged regressors.4 Portfolio investment is measured as a share of nom-inal gross domestic product (GDP). Owing to the higher volatility of capital exports and imports, the model used here does not deliver satisfactory results for gross fl ows. The present analysis is therefore con-fi ned to net fl ows. Similarly, portfolio investment in-volving shares can only be explained inadequately and is omitted here.5 Economic growth is proxied by the rate of change in industrial production. The risk assessment is based on the rate of change in the VIX volatility index, while the exchange rate variable is based on the nominal effect-ive exchange rate against seven advanced economies.
Deutsche Bundesbank Monthly Report March 2018 28

as important determinants of international capital fl ows.6 The yields and economic growth are each calculated as deviations from the weighted average of each variable for selected advanced economies.7
The above chart presents the determinants of Germany’s total balance of portfolio in-vestment and its balance of debt securities. What the two graphs show is that net cap-ital exports in both categories are driven in the fi rst instance by differences in returns and the risk assessment in fi nancial mar-kets. The regression coeffi cients of the yields (not depicted here) have the expected signifi cant and negative sign (ie an increase in relative yields in Germany is accompanied by net capital infl ows). For the risk measure, the sign of the coeffi cients is undetermined a priori. An elevated risk assessment in global fi nancial markets can be accompan-ied either by infl ows or outfl ows of capital, which mainly depends on how investors as-sess the infl uence of uncertainty on the
economies in question.8 This explains the multiple changes in sign observed for the estimated coeffi cients, though statistical signifi cance is only reached when the coef-fi cients are negative. This last observation would suggest that Germany is regarded as a safe haven among international investors, presumably not least on account of the
6 For more information, see R Koepke (2015), op cit.7 These countries are Canada, France, Italy, Japan, the United Kingdom and the United States. Gross domes-tic product fi gures adjusted for differences in purchas-ing power are used for weighting. The data are avail-able on a quarterly basis for the period from the fi rst quarter of 1999 to the fourth quarter of 2017. Data on industrial production in the fourth quarter of 2017 are only available for Germany and the United States. Missing data were estimated using an ARIMA process.8 Ideally, this approach would include measures de-picting the risk assessment relative to the other coun-tries under consideration. It is apparent, however, that such measures would not deliver any meaningful re-sults, given the high level of correlation between do-mestic risk proxies and a global risk index. Note also that the model with time- varying coeffi cients used here, in particular, is already capable of taking account of a time- varying risk assessment relative to other countries.
Determinants of German portfolio investment*
* Net capital exports: +.
Deutsche Bundesbank
1999 00 01 02 03 04 05 06 07 08 09 10 11 12 13 14 15 16 17
10
0
10
20
30
40
–
+
+
+
+
As a percentage of GDP
– 10
0
+ 10
+ 20
Difference in returns
Exchange rate
Economic growth
Risk assessment
UnexplainedTotal balance of portfolio investment
Balance of debt securities
Balance
Balance
Deutsche Bundesbank Monthly Report
March 2018 29

high importance of Federal bonds (Bunds), and that safe haven fl ows played at least a temporary role.
Differences in returns led to net capital in-fl ows in portfolio investment in Germany during the fi rst fi ve years of the monetary union and between 2007 and 2009. Yields were relatively high in Germany compared with other industrialised countries in both periods. Particularly following the onset of the global fi nancial crisis, when the non- standard monetary policy measures con-ducted in the United States and the United Kingdom were exerting pressure on long- term interest rates there, Germany recorded capital infl ows in portfolio investment. Since 2012, yields in Germany have been com-paratively low, which, viewed in isolation, has resulted in capital outfl ows. The Euro-system’s expanded asset purchase pro-gramme, in particular, has been accompan-ied by a signifi cant decline in yields in the euro area. Consequently, the negative dif-ferences in returns compared with other in-dustrialised countries resulted in a further signifi cant increase in German net capital exports in portfolio investment.
Changes in the risk assessment in fi nancial markets mainly seem to have a bearing dur-ing spells of heightened uncertainty. In the 2007-08 period, when the global fi nancial crisis came to a head, non- resident invest-ors appear to have viewed Germany as a safe haven. The second half of 2009, when stability began to return to the global econ-omy, saw the resurgent confi dence in global fi nancial markets trigger net capital out-fl ows, primarily in the case of debt secur-ities. At present, there are no signs that changes in the risk assessment in global fi -nancial markets are exerting a signifi cant infl uence on German net capital exports, and the same was true during the fi rst eight years of monetary union.
Changes in the exchange rate only had a bearing on the model during the early years
of the monetary union. Currency appreci-ation in this period was accompanied by net capital exports in total portfolio invest-ment, but tended to be associated with net capital imports in the case of debt secur-ities. During this spell, it seems that the pos-sibility of generating (quick) exchange rate gains was a stronger motive for holders of shares than it was for holders of debt secur-ities. This correlation disappeared in later years, however.
Differences in economic growth, mean-while, played a less prominent role. For Ger-man net capital exports recorded in port-folio investment, growth differentials in in-dustrial production were only of relevance during the fi rst half of the observation period. In the estimate for total portfolio in-vestment, the regression coeffi cient for growth in industrial production during this period was signifi cantly negative, an obser-vation which is also in line with the ex-pected sign. By contrast, in the estimate for debt securities, demand for which is prob-ably driven less by growth factors than it is for shares, the coeffi cient proved to be not signifi cantly different from zero.
The strong capital infl ows observed in the fi rst quarter of 2000 and the fourth quarter of 2010 cannot be explained by the model. Both of these episodes were characterised by special factors. In spring 2000 there was a major takeover in the mobile telephony sector, which saw portfolio investments being reduced in favour of foreign direct in-vestment. The outfl ows of debt securities recorded in the fourth quarter of 2010, meanwhile, can be traced back to the newly established resolution agencies, to which parts of the foreign business oper-ations of two German banking groups were transferred.9
9 See also Deutsche Bundesbank, The German balance of payments in 2000, Monthly Report, March 2001, pp 59-71; and Deutsche Bundesbank, The German bal-ance of payments for 2010, Monthly Report, March 2011, pp 17-36.
Deutsche Bundesbank Monthly Report March 2018 30

Direct investment
Despite the buoyant global economy and the
recovery in global trade, international direct in-
vestment flows in 2017 were once again down
on the year. This development was mainly at-
tributable to the marked decline in direct in-
vestment in the United States and the United
Kingdom, which itself resulted from special fac-
tors in both countries. For its part, the United
States recorded unusually low net inflows from
offshore financial centres such as Bermuda, or
from Ireland. The decline may have been
prompted by the prospect of US tax reforms,
which were duly given the green light at the
end of 2017. These reforms envisage consider-
able tax breaks in return for the repatriation of
American direct investment firms’ retained
earnings held abroad and the relocation of
corporate premises back to the United States.
The long- term effects of the tax reform on the
United States’ direct investment relationships
were not yet foreseeable in the reporting year.9
By contrast, the year- on- year comparison for
the United Kingdom was distorted by a num-
ber of large- scale corporate takeovers in 2016,
which led to an above- average level of direct
investment activity at the time. Therefore, the
decline seen in 2017 should not automatically
be attributed to the United Kingdom’s decision
to end its membership of the European Union.
Direct investment in emerging market econ-
omies and developing economies increased
somewhat in 2017, with countries in Asia and
South America receiving most of the higher in-
flows. On balance, however, estimates for 2017
presented by the United Nations Conference
on Trade and Development (UNCTAD) suggest
that the volume of global direct investment
transactions decreased by around 16% to
US$1.5 trillion in year- on- year terms.
International direct invest-ment flows slip despite buoyant global economy
Financial account
€ billion
Item 2015r 2016r 2017r
Financial account balance1 + 239.4 + 257.7 + 275.7
1 Direct investment + 67.5 + 31.2 + 42.2
Domestic investment abroad2 + 116.1 + 83.0 + 111.8
Foreign investment in the reporting country2 + 48.6 + 51.8 + 69.5
2 Portfolio investment + 192.9 + 206.7 + 200.2
Domestic investment in foreign securities2 + 124.1 + 98.2 + 105.2
Shares3 + 19.7 + 17.3 + 14.0
Investment fund shares4 + 35.8 + 36.1 + 47.7
Long-term debt securities5 + 74.3 + 51.0 + 47.1
Short-term debt securities6 – 5.7 – 6.2 – 3.7
Foreign investment in domestic securities2 – 68.8 – 108.5 – 95.0
Shares3 + 10.6 + 0.3 – 1.1
Investment fund shares + 7.4 – 6.9 – 3.4
Long-term debt securities5 – 96.0 – 97.3 – 70.6
Short-term debt securities6 + 9.3 – 4.6 – 19.9
3 Financial derivatives7 + 26.0 + 32.5 + 8.9
4 Other investment8 – 44.8 – 14.4 + 25.6
Monetary fi nancial institutions9 – 49.1 – 68.1 – 38.5
Long-term + 16.7 + 39.2 + 12.1
Short-term – 65.9 – 107.3 – 50.6
Enterprises and households10 – 33.5 – 10.0 – 13.8
Long-term – 3.9 – 6.9 – 6.7
Short-term – 29.7 – 3.1 – 7.1
General government – 1.1 + 4.0 + 1.2
Long-term – 3.6 – 2.9 – 0.4
Short-term + 2.5 + 7.0 + 1.6
Bundesbank + 39.0 + 59.6 + 76.8
5 Reserve assets – 2.2 + 1.7 – 1.3
1 Increase in net external position: + / decrease in net external position: -. 2 Increase: +. 3 Including participation certifi cates. 4 Including reinvestment of earnings. 5 Long- term: original ma-turity of more than one year or unlimited. 6 Short- term: original maturity of up to one year. 7 Balance of transactions arising from options and fi nancial futures contracts as well as employee stock options. 8 Includes in particular loans and trade credits as well as currency and deposits. 9 Excluding the Bundesbank. 10 Includes the following sectors: fi nancial corporations (ex-cluding monetary fi nancial institutions) as well as non- fi nancial corporations, households and non- profi t institutions serving households.
Deutsche Bundesbank
9 See UNCTAD, Global Investment Trends Monitor No 28, January 2018; and UNCTAD, Global Investment Trends Monitor No 29, Special Edition: Tax reforms in the United States: Implications for International Investment, February 2018.
Deutsche Bundesbank Monthly Report
March 2018 31

In contrast to the reduced overall volume of
direct investment recorded across the advanced
economies, Germany again exhibited an in-
crease in cross- border capital links amongst
affiliated enterprises. This was expressed in the
form of intensive foreign direct investment by
domestic enterprises as well as a strong inflow
of foreign capital to company offices located in
Germany.
In 2017, German direct investment saw net
capital exports amounting to €42 billion (2016:
€31 billion). This increase was attributable to
the higher level of German direct investment
abroad which, at €112 billion, expanded by
more than one- third compared with 2016.
Domestic companies bolstered their participat-
ing interests in foreign subsidiaries by €71 bil-
lion, partly by means of re- invested earnings, ie
undistributed profits.10 In net terms, intra- group
credit transactions entailed the allocation of
€40½ billion in funds, with a particular focus
on long- term loans to subsidiaries abroad.
Trade credits awarded to affiliated companies
were, on the other hand, mainly short- term in
nature.
Direct investment relationships, which tend to
be more long- term in nature, may be driven by
a variety of motives. The Association of Ger-
man Chambers of Commerce and Industry
(DIHK) annually surveys its member firms in the
manufacturing sector concerning the strategic
objectives they pursue in terms of planned par-
ticipating interests abroad. In 2017, as in previ-
ous years, just under half of all enterprises cited
the setting up or expansion of sales and cus-
tomer services as their main reason for invest-
ing abroad, followed by focusing on foreign
production sites in order to access markets
and, finally, cutting costs.11 It is worth noting
that the cost factor has gained in importance
with regard to investing in the euro area. Men-
tioned in 26% of all cases, this aspect was
more frequently cited as a key motivating fac-
tor for this region than on average for all coun-
tries (24%).
In disaggregated terms, almost all sectors of
the German economy boosted their equity cap-
ital abroad, with financial and insurance ser-
vices leading the way, closely followed by pro-
viders of professional and technical services.
Each of these two sectors accounted for almost
one- third of decipherable net transfers used to
Growing inter-national capital links in Germany
High level of German direct investment abroad
Distribution and sales key motive for foreign investment
Key area of focus in finan-cial and insur-ance services
Direct investment
Deutsche Bundesbank
2013 2014 2015 2016 2017
0
20
40
60
80
100
120
€ billion
German direct investment abroad
Foreign direct investment in Germany
0 20 40 60 80 100 120
Balance
... by region (2017)
All countries
Euro area
OtherEU countries
OtherEuropeancountries
North America
Central andSouth America
Asia
Africa and Oceania
10 According to figures provided by Thomson Reuters, €25 billion net of these credits were accounted for by cor-porate takeovers of companies domiciled abroad and pre-viously under foreign ownership. The time at which mer-gers and acquisitions are captured in the balance of pay-ments can, however, differ from that recorded by Thomson Reuters, with the result that the reported figures are not directly comparable.11 See DIHK Survey, Foreign investments in manufacturing industry, spring 2017.
Deutsche Bundesbank Monthly Report March 2018 32

augment equity capital.12 Within the manufac-
turing sector, the automotive industry was the
main beneficiary, followed by the chemicals in-
dustry.
In regional terms, direct investment from Ger-
man enterprises focused on other EU member
states and the euro area in particular. Around
two- thirds of German foreign investment was
concentrated on euro area countries, with the
financial centres of Luxembourg and the Neth-
erlands having an especially large impact on
the regional classification.13 Among the re-
maining EU countries, the United Kingdom
– despite its upcoming exit from the EU – was
the main country of destination for German
direct investment. In the case of the rest of the
world, the United States and China dominated
as destinations for German direct investment.
In the past year, foreign investors provided
their group enterprises domiciled in Germany
with additional funds totalling €69½ billion.
This represented a year- on- year increase of
more than 30% and was significantly above
the average of the last ten years. The direct in-
vestment funds coming into Germany mainly
comprised credit transactions, which totalled
€45½ billion, with financial credit issued by for-
eign subsidiaries to German parents making a
particular contribution. These reverse flows,
which had already played a major role in the
previous year, are often the result of capital
market transactions involving German enter-
prises’ financing subsidiaries, whereby secur-
ities are issued abroad and the proceeds are
forwarded to the parent companies in Ger-
many. Alongside this “backwards investment”,
a notable amount of financial credit was also
issued to affiliated enterprises. By contrast,
foreign parent enterprises tended to provide
their German subsidiaries with additional funds
in the form of equity capital, amounting to
€24 billion in net terms. Here – as in the oppos-
ite direction – reinvested earnings were also of
significance, contributing almost one third of
this amount.
In recent years, foreign direct investment enter-
prises in Germany consistently focused their
activities on distribution, followed by produc-
tion (including research and development), and
commercial services.14 Disaggregated by do-
mestic economic sector, foreign equity capital
in the past year (excluding reinvested earnings)
focused on providers of professional or tech-
nical services, vehicle manufacturers, as well as
investment in the transport and logistics sector.
By contrast, a considerable volume of equity
capital was withdrawn from the finance and
insurance sector.
As was the case in the opposite direction, other
EU countries – especially euro area partner
countries – were the primary countries of origin
of foreign direct investment in Germany. Ger-
man enterprises received high volumes of direct
investment funds from the Netherlands in par-
ticular. Outside of the EU, the United States
and Switzerland were major direct investors
from Germany’s perspective. By contrast, ac-
cording to regional information in the German
balance of payments, the People’s Republic of
China, which is regarded in economic policy
circles as an increasingly key player in corporate
take overs, reduced its exposure in Germany
mainly by withdrawing short- term loans. How-
ever, it is also possible that Chinese investors
participated in the German market via third
countries.
Other investment
Other investment, comprising financial and
trade credits (where these do not constitute a
part of direct investment) as well as bank de-
More than half of German direct invest-ment benefitted EU partner countries
Increased foreign direct investment in Germany
Distribution also in focus
High volume of direct invest-ment funds from the Netherlands
Net capital exports in other investment …
12 Reinvested earnings cannot be assigned to individual economic sectors and were therefore not taken into ac-count when making this calculation.13 These countries are major holding locations for inter-nationally active enterprises. As the balance of payments only captures the immediate counterparties of cross- border transactions, it is not possible to identify where the trans-ferred funds are ultimately invested.14 See Germany Trade and Invest, FDI Reporting 2016.
Deutsche Bundesbank Monthly Report
March 2018 33

posits and other assets, resulted in net capital
exports of €25½ billion in 2017.
The main reason for the outflows of funds was
the increase in the Bundesbank’s net external
assets, which grew by €77 billion. The reason
for this was a further increase in the TARGET2
claims vis- à- vis the European Central Bank
(+€152½ billion), which, as was the case in the
previous year, was ultimately due to the Euro-
system’s asset purchase programme (APP).15 At
the same time, however, the Bundesbank’s
liabil ities to non- residents also increased. These
include fixed- term deposits of non- Eurosystem
central banks accepted as part of the Bundes-
bank’s central bank services, which are then
invested in the money market.
Unlike the Bundesbank, the commercial bank-
ing sector recorded inflows of funds (€38½ bil-
lion). First, German banks reduced their de-
posits with monetary financial institutions
abroad to a greater extent than they provided
additional loans to foreign non- banks. Second,
foreign commercial banks – including those
domiciled outside of the euro area – increased
their deposits with credit institutions domiciled
in Germany. One- off effects arising from the
asset purchase programme are likely to have
played a part in this regard, as securities sales
to the Eurosystem by foreign investors are
often processed via commercial banks licenced
in Germany.16
Non- banks also received net inflows of funds
from abroad over the past year (€12½ billion).
At €14 billion, net capital imports by enter-
prises and individuals were of particular signifi-
cance here. These were due to additional up-
take of financial credits abroad. Public institu-
tions, by contrast, made net reductions in their
issuance of cross- border financial credits and
decreased their deposits with foreign banks. At
the same time, they also repaid financial credits
taken out abroad, which resulted in slight cap-
ital exports being recorded (€1 billion).
Reserve assets
As a result of transactions, the Bundesbank’s
reserve assets fell by €1½ billion in 2017. This
was mainly due to the reduction in the reserve
position at the International Monetary Fund.
… driven by increase in Bundes bank’s net external assets
Inflows of funds in the banking system …
… and in the case of non- banks
Transactions cause slight decline in reserve assets
Other investment*
broken down by sector
* Includes in particular loans and trade credits as well as cur-rency and deposits; net capital exports: +. 1 Excluding the Bundesbank.
Deutsche Bundesbank
Balances in € billion
80
60
40
20
0
20
40
60
80
–
–
–
–
+
+
+
+
Enterprisesand
households
Generalgovernment
BundesbankMonetaryfinancial
institutions 1
2017
2016
Impact of TARGET2 on other investment
* Netto-Kapitalexport: +.
Deutsche Bundesbank
2016 2017
200
150
100
50
0
50
100
150
200
–
–
–
–
+
+
+
+
€ billion
– 200
– 150
– 100
– 50
0
+ 50
+ 100
+ 150
+ 200Other investmentexcluding TARGET2
Change inTARGET2 balance
2016 2017
15 The Bundesbank’s TARGET2 claims rise when other Euro system central banks purchase securities as part of the APP but the sale proceeds are credited to the counterparty using an account with a commercial bank in Germany. See Deutsche Bundesbank, German balance of payments in 2016, Monthly Report, March 2017, pp 15-31.16 In this case, the deposits of foreign commercial banks were a counterpart to the Bundesbank’s increased TARGET2 claims.
Deutsche Bundesbank Monthly Report March 2018 34
The reserve asset holdings are also influenced
by balance sheet adjustments which, in line
with internationally agreed accounting stand-
ards, are not recognised in the balance of pay-
ments. The end- of- year revaluation of the
reserve assets at market prices resulted in an
additional decline of €7½ billion. This was due
to the lower price of gold as well as lower valu-
ations of the remaining reserve assets. All in all,
the balance sheet value of Germany’s reserve
assets fell by €9 billion in 2017, standing at
€167 billion as at 31 December 2017.
Balance sheet adjustments also have nega-tive impact
Deutsche Bundesbank Monthly Report
March 2018 35

Deutsche Bundesbank Monthly Report March 2018 36

The demand for euro banknotes at the Bundesbank
The volume of euro banknotes in circulation issued by the Bundesbank has continued to grow
strongly over the past few years. The value of the cumulative net issuance of euro banknotes by
the Bundesbank went up from €348 billion to €635 billion between late 2009 and the end of
2017. This means that, since 2010, the Bundesbank has issued euro banknotes with an average
annual net value of €35.8 billion, corresponding to an annual average rate of growth of 7.8%.
Estimates of how German- issued banknotes in circulation are distributed between banknotes held
for domestic transaction purposes (domestic transaction balance), domestic hoarding and for-
eign demand (banknotes in circulation abroad) have been shown to be useful for investigating
banknote issuance in Germany. According to such estimates, in the period since 2010, foreign
demand for banknotes has played the largest part in the increase in the value of German- issued
banknotes in circulation. There has also been an increase in domestic hoarding, which, in terms
of value, is the largest component of the volume of banknotes in circulation in Germany. By con-
trast, the domestic transaction balance remained largely constant in terms of value and explains
between 5% and 10% of the Bundesbank’s cumulative net issuance of euro banknotes. According
to new estimates, the domestic transaction balance of €5 banknotes amounts to around €2 bil-
lion, or 23%, the domestic transaction balance of €10 banknotes amounts to €4 billion, or 17%,
and the domestic transaction balance of €20 banknotes amounts to around €9 billion, or 19%,
of the net issuance of banknotes by the Bundesbank of each denomination.
In the recent past, there has been a focus on the impact of one- off developments on euro bank-
notes in circulation. Since proposals to discontinue the issuance of €500 banknotes became
public knowledge, banknotes of this denomination have been returning to the Bundesbank on a
significant scale. Economic agents have been replacing at least some of the returned €500 bank-
notes with banknotes of a lower denomination, however. Domestic hoarding is also of interest in
light of the current low- interest- rate environment. There are no identifiable material changes in
the estimated increase in domestic hoarding due to the low- interest- rate setting. This contrasts
with the notable growth in the reported cash balances of credit institutions in Germany since
2016. These show that credit institutions are additionally holding banknotes with a value esti-
mated at more than €10 billion in order to avoid negative rates of interest on deposits at the
Bundesbank.
Deutsche Bundesbank Monthly Report
March 2018 37

Euro banknotes in circulation
At the end of January 2002, shortly after the
introduction of euro cash, the value of euro
banknotes put into circulation by the Eurosys-
tem totalled €221 billion; at the end of Decem-
ber 2017, the figure was €1,171 billion (see the
chart below).1 Since the launch of euro bank-
notes and coins, the volume of euro banknotes
in circulation has been growing more quickly
than economic output and the monetary ag-
gregate M3 in the euro area.2 The cumulative
net issuance of euro banknotes by the Bundes-
bank increased at a particularly rapid pace
compared with total euro banknotes in circula-
tion.3 Between the introduction of euro cash
and the end of December 2017, the cumulative
net issuance of euro banknotes by the Bundes-
bank grew from €73 billion to €635 billion. The
chart below shows that, as a rule, the growth
rates of the Bundesbank’s cumulative net issu-
ance since the launch of euro cash have been
higher than the comparable Eurosystem growth
rates if the Bundesbank is excluded.
The question arises as to the reasons for this
strong growth, especially in German- issued
euro banknotes in circulation. Basically, the in-
terpretation of banknote issuance by national
central banks in the Eurosystem is made more
difficult by the fact that euro banknotes in cir-
culation can migrate across national borders.
Euro banknotes issued by the national central
bank of one member country of the euro area
may therefore also be located in another euro
area country or in a country outside the euro
area. It is possible to achieve a better under-
standing of banknote use in Germany by break-
ing down Bundesbank- issued banknotes into a
domestic and a foreign component. As will be
shown below, Germany is a net exporter of
euro banknotes both to the rest of the euro
area and to non- euro area countries. This
means that the value of banknotes issued by
the Bundesbank which are in circulation abroad
(German gross exports) exceeds the value of
those banknotes which are located in Germany
and were issued by other Eurosystem central
banks (German gross imports). Since Germany
is a net exporter of banknotes, domestic de-
mand for banknotes (banknotes in circulation
in Germany) is, in mathematical terms, fully
covered by the Bundesbank. In order to charac-
terise domestic banknote use in greater detail,
banknotes in circulation in Germany can be fur-
Value of euro banknotes in circulation growing
Cumulative net issuance by the Bundesbank is composed of banknotes in circulation abroad, the domestic trans-action balance and domestic hoarding
Volume of euro banknotes in circulation
Sources: ECB and Bundesbank calculations.
Deutsche Bundesbank
2002 03 04 05 06 07 08 09 10 11 12 13 14 15 16 17
0
200
400
600
800
1,000
1,200
Monthly data
%
€ billion
– 10
0
+ 10
+ 20
+ 30
+ 40
+ 50
+ 60
+ 70
of which
Bundesbank
Eurosystem
Annual change
Bundesbank
Eurosystem
Eurosystemexcluding Bundesbank
1 This article concentrates on euro banknotes in circula-tion. At the end of December 2017, a total of 126 billion euro coins with a value of €28.0 billion were in circulation, of which – in mathematical terms – 37 billion euro coins with a value of €8.37 billion were issued by the Bundes-bank. As the volume of euro coins in circulation is small in terms of value, growth in euro banknotes in circulation is informative with regard to developments in the value of the demand for euro cash.2 See Deutsche Bundesbank (2016), Cash as a means of payment and a store of value, Annual Report 2015, pp 25-45.3 The cumulative net issuance of euro banknotes by the Bundesbank corresponds to the sum of the Bundesbank’s cash outflows less the sum of banknotes paid in. The euro banknotes issued by the Bundesbank are occasionally described below as “German” euro banknotes. It should be noted in this context that “German” euro banknotes are not necessarily located in Germany and that a considerable part of them are, in fact, in circulation abroad.
Deutsche Bundesbank Monthly Report March 2018 38

ther subdivided into the domestic transaction
balance and domestic hoarding.4 Earlier studies
analysed developments in “German” euro
banknotes in circulation up to the end of 2009.
The outcome was that the sharp increase in
German- issued euro banknotes in circulation
was due chiefly to foreign demand and, to a
lesser extent, also hoarding in Germany.5
This article follows on from earlier studies and
analyses developments in the cumulative net
issuance of euro banknotes by the Bundesbank
in the period from 2010 up to the current end.6
During the observation period of this article,
this cumulative net issuance rose by an average
of €35.8 billion annually and thus at a compar-
ably rapid pace as in the period from 2003 to
2009, when its average annual growth was
€31.3 billion. Reasons for this continuing sharp
rise in German- issued euro banknotes in circu-
lation are given by the current estimates of the
banknote demand components presented
below. Following the introduction of new euro
banknotes of the second series (Europa series),
it is possible for the first time to estimate trans-
action balances by denomination, too.7 The
presented data are not directly observable in
most cases and, instead, have to be estimated,
which is why the results are subject to a degree
of estimation uncertainty.
Recently, there has also been a focus on the
impact of one- off developments on euro bank-
notes in circulation. In the wake of the decision
taken in May 2016 to discontinue the produc-
tion and issuance of €500 banknotes, anomal-
ies arose in the cumulative net issuance of indi-
vidual banknote denominations. These are de-
scribed in the box on pages 45 and 46. Infor-
mation on demand for banknotes in Germany
in the context of the current low- interest- rate
environment is provided by the estimated time
series of domestic hoarding as well as the box
on pages 43 and 44. For internal analyses, the
Bundesbank constantly observes the daily time
series of euro banknotes in circulation with re-
gard to anomalies in order to determine the
impact of relevant one- off developments at an
early stage. A sophisticated procedure is used
to adjust the daily data for calendar and sea-
sonal effects to allow a better assessment of
developments, especially at the current end.
The box on pages 40 and 41 contains details of
how the daily time series of banknotes in circu-
lation is seasonally adjusted.
Domestic transaction balance
The domestic transaction balance comprises
euro cash held by economic agents to settle
cash payments. The domestic transaction bal-
ance can be approximated by an estimate of
cash held by households for transaction pur-
poses, an estimate of the cash holdings of retail-
ers as well as by means of the available informa-
tion on cash holdings of the banking industry.8
Robust growth in “German” banknotes in circulation also since 2010
Particular questions
The transaction balance is com-posed of cash held by house-holds for trans-action purposes as well as the cash holdings of retailers and credit institu-tions
4 For information on the determination of these compon-ents of banknote demand, see N Bartzsch, G Rösl and F Seitz (2011a), Foreign demand for euro banknotes issued in Germany: estimation using direct approaches, Deutsche Bundesbank Discussion Paper No 20/ 2011; N Bartzsch, G Rösl and F Seitz (2011b), Foreign demand for euro bank-notes issued in Germany: estimation using indirect ap-proaches, Deutsche Bundesbank Discussion Paper No 21/ 2011; N Bartzsch and M Uhl (2017), Domestic and foreign demand for euro banknotes issued in Germany, in Deutsche Bundesbank International Cash Conference 2017 – War on Cash – Is there a Future for Cash?, Frankfurt am Main, pp 250-287. Estimates of components of the cumulative net issuance of euro coins by the Bundesbank may be found in Deutsche Bundesbank, Euro coins held for trans-action purposes in Germany, Monthly Report, April 2015, pp 61-74.5 See Deutsche Bundesbank, Foreign demand for euro banknotes issued in Germany, Monthly Report, January 2011, pp 29-41; Deutsche Bundesbank, The development and determinants of euro currency in circulation in Ger-many, Monthly Report, June 2009, pp 45-58.6 Statistical information on the volume of euro banknotes in circulation is available up to the end of 2017, although some other data used refer to other points in time. Esti-mates of the banknote demand components, for example, are available at present only up to the end of 2016.7 The first euro banknote series is designated as ES1 (first euro series) and the second euro banknote series as ES2 (second euro series). “Europa series” is an alternative desig-nation for the second series of euro banknotes.8 See Deutsche Bundesbank, The development and deter-minants of euro currency in circulation in Germany, op cit. The estimated transaction balance comprises holdings of coins that cannot be separated from the holdings of bank-notes. This fuzziness is likely to be acceptable, as the (esti-mated) euro coins held for transaction purposes are minor in terms of value. See Deutsche Bundesbank, Euro coins held for transaction purposes in Germany, op cit.
Deutsche Bundesbank Monthly Report
March 2018 39

Seasonal adjustment of daily data
When analysing currency in circulation, it is often not possible simply to derive new infor-mation from the unadjusted data. The un-adjusted data also refl ect periodically recur-ring movements which overlap with the underlying economic trends and exceptional movements. For instance, the annual Christ-mas trading period causes a signifi cant in-crease in the demand for banknotes at the end of the year without the existence of any potentially crisis- induced hoarding behaviour. Only an undershooting or overshooting of such periodic movements allows conclusions to be drawn about new information captured
in the data. The aim of seasonal adjustment is to eliminate such regularly recurring intra- year movements of similar magnitude, thus mak-ing it easier to analyse the demand for cash.
German currency is affected by periodic fl uc-tuations in essentially three ways (see the ad-jacent chart). First, besides the signifi cant peaks around the turn of the year (upper sec-tion of the chart), the enlarged views of pro-gressively smaller sections in the chart show that the volume of currency in circulation rises at the end of the month in connection with wages, salaries, and other payments (middle section of the chart). Second, there are add-itional peaks at the end of each week when more purchases are made for the coming weekend and the start of the following week (bottom section of the chart).1 There are, therefore, not only seasonal fl uctuations that recur annually but also ones which recur on a monthly or weekly basis. Third, calendar ef-fects occur owing to the variable date of Easter in March or April. Such effects, too, are eliminated as part of seasonal adjustment.2
It follows from these observations that the unadjusted fi gures of daily currency in circula-tion (Yt) at time t are composed of the trend- cycle component (Tt), the seasonal factors of the day of the week S(7)
t , day of the month S(31)t and day of the year S(365)
t , as well as the impact of moving holidays (Kt) and the irregular component (It):
Yt = Tt + S(7)t + S
(31)t + S
(365)t +Kt + It.
1 For further determinants of the demand for cash, see, for example, A Cabrero, G Camba- Méndez, A Hirsch and F Nieto (2002), Modelling the daily bank-notes in circulation in the context of the liquidity man-agement of the European Central Bank, European Central Bank Working Paper Series, No 142; N Bar-tzsch, F Seitz and R Setzer (2015), The demand for euro banknotes issued in Germany: Structural model-ling and forecasting, ROME Discussion Paper Series, No 15-03.2 See Deutsche Bundesbank, Calendar effects on eco-nomic activity, Monthly Report, December 2012, pp 51-60.
Currency in circulation in Germany
Deutsche Bundesbank
2011 2012 2013 2014 2015 2016 2017
350
400
450
500
550
600
650
€ billion; daily data
M T W T F M T W T F M T W T F M T W T F M
July
2017
610
611
612
613
614
Monthly trajectory
J F M A M J J A S O N D
2017
580
590
600
610
620
630
640
Yearly trajectory
CW 30CW 29CW 28CW 27
Weeklytrajectory
Deutsche Bundesbank Monthly Report March 2018 40

The series adjusted for calendar and seasonal effects is therefore
Yt S(7)t S
(31)t S
(365)t Kt = Tt + It
and is identical to the sum of the trend- cycle and the irregular component.
The procedures used for the offi cial seasonal adjustment of monthly or quarterly economic indicators, such as Census X-12-ARIMA3 which is employed by the Bundesbank, cannot be used for time series with daily observations. STL serves as the basis for an alternative method of seasonal adjustment.4 This estab-lished method is characterised by a high de-gree of fl exibility with regard to the periodicity of the underlying data. It is essentially based on a sequence of local regressions. Each indi-vidual observation is weighted and regressed to all values which lie in a predefi ned, tem-poral neighbourhood.
As STL only ever estimates the seasonal factor for a single given periodicity, such as S(7)
t , the procedure has to be performed completely three times in order to capture all the seasonal components relevant to daily data. First, the seasonal fi gure of the weekly period is ad-justed. Calendar adjustment is then performed using a RegARIMA model.5 Finally, the effects of the day of the month and the day of the year are eliminated.
Overall, it is apparent that the increase at the end of 2017 was weaker than usual at this time of year (see the chart on this page). The calendar and seasonally adjusted net issuance of banknotes was slightly negative in this period.
The peaks in March 2016 and April 2017 iden-tifi ed in the unadjusted fi gures are largely due to the usual greater demand for currency in connection with the Easter holidays. Accord-ingly, these peaks are adjusted in the context of estimating average calendar effects and can now be classifi ed as not very conspicuous.
Eliminating both periodically recurring intra- year effects and systematically calendar-
related factors of daily currency in circulation makes it possible to focus more strongly on identifying new information. Seasonal adjust-ment is therefore a useful instrument of eco-nomic analysis which can also be applied to time series with daily observations.
3 See Deutsche Bundesbank, The changeover from the seasonal adjustment method Census X-11 to Census X-12-ARIMA, Monthly Report, September 1999, pp 39-50.4 See R B Cleveland, W S Cleveland, J E McRae and I Terpenning (1990), STL: A seasonal- trend decompos-ition procedure based on Loess, Journal of Offi cial Stat-istics, 6 (1), pp 3-73. Initially, the unadjusted fi gures are adjusted for a provisional trend. Subsequently, a sea-sonal factor is determined for each day of the week, month, and year. Finally, a trend is estimated on the basis of the adjusted series, which is used in the next iteration. These steps are repeated several times and supplemented by the identifi cation of extreme values.5 The RegARIMA model is a combination of a regres-sion model and ARIMA error term: φ⇢(L)(1 L)d{yt
Xr
i=1βixit} = ✓q(L)✏t . p(L) and θq(L)
are polynomials of order p and q, and L is the lag op-erator. In the case of seasonally marked daily data, this model is extended to include periodic regressors or seasonal ARIMA terms.
Calendar adjusted and seasonally
adjusted currency in circulation
in Germany
Deutsche Bundesbank
J F M A M J J A S O N D J F M A M J J A S O N D
2016 2017
540
560
580
600
620
640
€ billion
– 2
– 1
0
+ 1
+ 2
+ 3
+ 4
Daily banknotes in circulation
Easter in AprilEaster in March
Weekly net issuance
Unadjusted figures
Calendar and seasonally adjusted figures
Deutsche Bundesbank Monthly Report
March 2018 41

Sectoral composition of the transaction balance
The estimate of the balances held by house-
holds for transaction purposes is based on the
study on payment behaviour that is conducted
regularly by the Bundesbank; those surveyed in
this study provide information on their cash
holdings and their usual withdrawal of cash at
the counter or an ATM.9 This showed that, in
2016, households held euro banknotes with a
value of €13.1 billion for payment purposes in
total. The cash holdings of retailers are calcu-
lated on the basis of assumptions about cash
inflows from trading and deposits at commer-
cial banks or the Bundesbank and are esti-
mated at €1.8 billion for 2016. The credit insti-
tutions’ cash holdings are recorded statistically
and stood at €26.0 billion at the end of 2016.
Overall, it is estimated that domestic transac-
tion balances of banknotes at the end of 2016
were around €40 billion. Taking into account
estimation uncertainty, they therefore have a
share of between 5% and 10% of the value of
German- issued banknotes in circulation.
The chart on page 47 shows the trajectory of
the cited components over time. The estimated
transaction balances of households as well as
the estimated cash holdings of retailers have
been roughly constant over time since 2008.
By contrast, the credit institutions’ cash hold-
ings went up from €19.5 billion in December
2015 to €26.0 billion in December 2016. This
increase is likely to be due chiefly to one- off
monetary policy factors (see the box on
pages 43 and 44). The total transaction bal-
ance computed here, amounting to around
€40 billion, is likely to be distorted insofar as
credit institutions hold part of their cash not for
transaction purposes but because they want to
avoid negative rates of interest on deposits at
the Bundesbank.
Overall, the value of banknotes held in Ger-
many for payment purposes is relatively small
in comparison with the total value of German-
issued banknotes in circulation. Euro banknotes
used for payment purposes circulate rapidly be-
tween consumers, retailers, credit institutions
and the branches of the Bundesbank, which
means that it is not necessary in terms of value
to hold large stocks to settle cash payments.10
As the value of the domestic transaction bal-
ance, according to the estimates, remains rela-
tively constantly at a low level, the domestic
transaction balance accordingly does not make
a crucial contribution to explaining the grow-
ing volume of “German” euro banknotes in cir-
culation. What is immediately striking is the un-
changed level of the domestic transaction
balance even in light of the fact that cashless
payment methods are gaining in importance
for the settlement of everyday payments by
consumers at the point of sale. According to
the estimates in the Bundesbank’s study on
payment behaviour, cash payments had a share
of 74.3% in terms of the number of transac-
tions in 2017, compared with 82.5% in 2008.11
The percentage of cash payments by turnover
fell in the same period from 57.9% in 2008 to
47.6% in 2017. According to the estimates, this
development is not reflected in a declining cash
balance held for transaction purposes and
therefore does not have an impact on bank-
note issuance in Germany either. The declining
share of payments in cash is evidently being
offset by rising consumption paid for in cash.
Sectoral com-position of the transaction balance
Domestic trans-action balance at a compara-tively low level in terms of value
9 Figures are available for 2008, 2011 and 2014; for years without their own survey, the last available value is adopted. See Deutsche Bundesbank (2009), Payment be-haviour in Germany – an empirical study of the selection and utilisation of payment instruments in the Federal Re-public of Germany; Deutsche Bundesbank (2012), Payment behaviour in Germany in 2011 – an empirical study of the utilisation of cash and cashless payment instruments; Deutsche Bundesbank (2015), Payment behaviour in Ger-many in 2014 – third study of the utilisation of cash and cashless payment instruments.10 The banknote cycle in Germany is described in Deutsche Bundesbank, Cash as a means of payment and a store of value, op cit; and Deutsche Bundesbank, The banknote cycle and banknote recycling in Germany, Monthly Report, January 2011, pp 17-27.11 See Deutsche Bundesbank (2018), Payment behaviour in Germany in 2017 – fourth study of the utilisation of cash and cashless payment instruments.
Deutsche Bundesbank Monthly Report March 2018 42

Banknote holdings by credit institutions
Since 11 June 2014, the interest rate on de-
posits at Eurosystem central banks has been
in negative territory. 16 March 2016 saw a
further cut to -0.4% per year. Credit institu-
tions have the option of increasing their
cash stocks to avoid paying interest on their
balances held with the central bank. The
stocks of cash held by credit institutions can
be inferred from the data which they are
required to report to the Bundesbank.1
Credit institutions keep these holdings pri-
marily for the purpose of settling cash pay-
ment transactions. They result from cash
deposits made at credit institutions or are
retained by credit institutions to be able to
supply cash to their customers.
The chart below shows how the cash hold-
ings of credit institutions have developed
over time. The signifi cant seasonal fl uctu-
ations – presumably resulting from trading
turnovers – make it more diffi cult to inter-
pret the reported data. Despite the seasonal
fl uctuations it can be seen that the cash
holdings of credit institutions have been ris-
ing markedly since 2016. Whereas cash
holdings in 2015 averaged €16.1 billion,
they totalled an average of €19.8 billion
and €26.7 billion in 2016 and 2017, respect-
ively. In terms of the annual average, cash
holdings in 2017 were thus €10.7 billion
higher than they were in 2015. The year-
end value of cash holdings in 2017 was
€32.1 billion – as much as €12.6 billion
1 The analysis covers credit institutions that fall under the defi nition of an MFI (monetary fi nancial institu-tion). All institutions that accept deposits or close sub-stitutes for deposits from the general public and grant loans for their own account are classifi ed as MFIs. The term cash holdings includes all currency holdings, in-cluding foreign banknotes and coins as well as post-age stamps and court fee stamps.
Cash holdings of credit institutions
Deutsche Bundesbank
2013 2014 2015 2016 2017 2018
14
16
18
20
22
24
26
28
30
32
€ billion
– 2
0
+ 2
+ 4
+ 6
+ 8Year-on-year change
Deutsche Bundesbank Monthly Report
March 2018 43

Transaction balances of small banknote denominations
The introduction of the new Europa series of
euro banknotes makes it possible for the first
time to estimate the size of the domestic trans-
action balance by denomination, too. Starting
in May 2013, the new euro banknotes with im-
proved security features are being issued in
stages, with the €5 to €50 denominations
being available so far.12 The chart on page 47
shows the trajectory over time of the Bundes-
bank’s cumulative net issuances separately for
old (ES1) and new (ES2) banknotes for the €5,
€10, €20 and €50 denominations. In the chart
sections for the €5, €10 and €20 banknotes,
the cumulative net issuance shows a similar tra-
jectory.13 Following the first issuance of the
new banknotes, the cumulative net issuance of
ES1 banknotes dropped off significantly at first,
but only slowly thereafter. Of all the banknote
denominations under consideration, a large
part of the – in mathematical terms – outstand-
ing ES1 banknotes has so far not returned to
the Bundesbank, which reflects the importance
of hoarding and, in particular, foreign demand
in explaining the volume of German- issued
banknotes of these denominations in circula-
tion.14
The estimates of the domestic transaction bal-
ance by denomination are based on this obser-
Since May 2013, introduction of new euro bank-notes with improved security features
higher than the 2015 year- end value of
€19.5 billion.
As a general rule, credit institutions are
likely to factor in the opportunity costs of
holding cash when determining their cash
balances. It is thus to be expected that,
when viewed in isolation, cash holdings will
rise whenever interest rates are low.2
Against the backdrop of the current low-
interest- rate environment, credit institutions
could consequently maintain larger stocks
of cash for the purpose of settling cash pay-
ment transactions than in times of higher
interest rates. The particularly striking devel-
opment in cash holdings from mid-2016
onwards, following the lowering of the de-
posit interest rate to -0.4%, indicates, how-
ever, that the build- up of cash holdings at
credit institutions in Germany is probably
the result of a move to avoid the negative
rates of interest on deposits at the Bundes-
bank.
Overall, the trajectory of the reported data
shows that credit institutions in Germany
are currently holding an additional amount
of over €10 billion worth of banknotes in
order to avoid negative interest rates. Since
mid-2016, the Bundesbank’s branches have
also been reporting a number of sizeable
cash orders by credit institutions on a simi-
lar scale.
2 The decision- making problem that credit institutions face when determining the number of cash supply trips to make between Bundesbank branches, bank branches and ATMs – taking due account of cash de-mand and the opportunity costs associated with hold-ing cash – is reminiscent of the Baumol- Tobin model, which looks at cash balances held for transaction pur-poses. See W Baumol (1952), The transactions de-mand for cash: an inventory theoretic approach, Quar-terly Journal of Economics, 66 (4), pp 545-556; J Tobin (1956), The interest- elasticity of transactions demand for cash, Review of Economics and Statistics, 38 (3), pp 241-247.
12 The new €100 and €200 banknotes of the second ser-ies are scheduled to be issued for the first time in the first half of 2019. The second series will no longer contain €500 banknotes.13 The new €50 banknote was first issued on 4 April 2017. At the present point in time, it is not possible to make a final assessment as to whether the cumulative net issuance of ES1 banknotes of this denomination will behave in a way that is comparable to those of the other banknotes under consideration.14 The cumulative net issuance of ES1 banknotes for the €5, €10 and €20 denominations by the Eurosystem exclud-ing the Bundesbank have negative values in each case at the present stage. This means that, overall, more ES1 bank-notes of these denominations have been paid into the Eu-rosystem excluding the Bundesbank than these central banks have paid out in total. This is likely to be due to banknote migration from Germany to the other euro area countries.
Deutsche Bundesbank Monthly Report March 2018 44

The return fl ow of €500 banknotes
On 4 May 2016, the Governing Council of
the ECB decided to discontinue the produc-
tion and issuance of the €500 banknote,
responding to concerns that the denomin-
ation could facilitate illicit activities.1 The
end of €500 banknote issuance will coin-
cide with the introduction of the new €100
and €200 banknotes of the second series.
The €500 banknotes already in circulation
will remain legal tender and can be ex-
changed at the national central banks of
the Eurosystem indefi nitely.
Media reports covering a potential move to
discontinue the €500 banknote began ap-
pearing in February 2016 and, as the chart
below shows, €500 banknotes have been
returning to the Eurosystem on a signifi cant
scale in net terms since then. Between Feb-
ruary and December 2016, net issuance of
€500 banknotes by the Bundesbank stood
at -€7.6 billion, while issuance by the Euro-
system as a whole amounted to -€36.0 bil-
lion. In 2017, the Bundesbank placed €1.4
billion net worth of €500 notes into circula-
tion; issuance by the Eurosystem as a whole
was -€13.2 billion in net terms. The cumula-
tive value of €500 banknotes issued by the
Bundesbank thus rose slightly in 2017. This
development – which deviates from that of
the Eurosystem – is likely to be largely due
to credit institutions maintaining holdings
of €500 banknotes in order to avoid nega-
tive interest rates (see the box entitled
“Banknote holdings by credit institutions”
on pages 43 and 44). Demand for €500
banknotes from the Bundesbank on the
part of non- banks is probably declining
similarly to the demand for €500 banknotes
from the Eurosystem as a whole.
It is possible that the decision to stop issu-
ing €500 banknotes could reduce the over-
all demand for euro banknotes. A drop in
the total demand for euro banknotes in the
wake of the end to issuance might be ex-
pected, for instance, if economic agents
from both within and outside of the euro
area were to increasingly hold their fi nancial
assets in the form of deposits with credit
institutions or banknotes in other curren-
cies. The tables on page 46 show the net
issuance of euro banknotes by the Eurosys-
tem and the Bundesbank across all denom-
inations combined, as well as individually
for the banknotes with a nominal value of
€50 and higher, for the period from 2013 to
2017. Net issuance of €500 banknotes in
2016 was signifi cantly lower than in the
previous years, although economic agents
swapped at least some of their €500 bank-
notes for banknotes of a lower denomin-
ation. This is shown by the fact that the
1 For a more detailed account of the discussion sur-rounding high- denomination banknotes, see Deutsche Bundesbank, Policy options for cash payments, Annual Report 2015, pp 36-38; P Sands (2016), Making it harder for the bad guys: the case for eliminating high denomination notes, M- RCBG Associate Working Paper No 52; K Rogoff (2016), The curse of cash, Princeton University Press.
Cumulative net issuance of
€500 banknotes
Sources: ECB und Bundesbank calculations.
Deutsche Bundesbank
2015 2016 2017
250
260
270
280
290
300
310
€ billion, log scale
Eurosystem
of whichBundesbank
160
165
170
Deutsche Bundesbank Monthly Report
March 2018 45

Eurosystem’s net issuance of €200 bank-
notes rose to €5.3 billion and its net issu-
ance of €100 banknotes climbed to €28.8
billion in 2016, while between 2013 and
2015 net issuance of €200 banknotes and
€100 banknotes had averaged €1.5 billion
and €14.6 billion, respectively. The total vol-
ume of euro banknotes in circulation rose
by €42.8 billion in 2016, following an aver-
age increase of €56.9 billion between 2013
and 2015. However, it is not possible to tell
conclusively from this kind of comparison
whether ceasing the issuance of the €500
note curbed the growth of euro banknote
circulation overall in 2016. There are a num-
ber of factors that may conceivably infl u-
ence developments in euro banknotes in
circulation, such as the level of interest rates,
the broader economic backdrop or the ex-
change rate of the euro against the US dol-
lar.2 This is why previous years’ net issuance
fi gures cannot serve as a direct indicator of
what net issuance might hypothetically
have been were it not for the decision to
discontinue issuing €500 banknotes.
Shifts from euro banknotes to banknotes in
other currencies are also a possibility. For
example, cash users within and outside of
the euro area could increase their demand
for US$100 banknotes or CHF 1,000 bank-
notes. It is hard to investigate substitutions
of this kind empirically, not least because
preferences in terms of cash use are persist-
ent and any changes in behaviour on the
part of cash users are likely to be evident
only in the long term. Moreover, banknote
circulation of a particular currency is infl u-
enced by many factors and it is not always
possible to directly identify the precise im-
pact of events such as discontinuing the is-
suance of the €500 banknote. Net issuance
of US$100 banknotes amounted to US$72.6
billion in 2016 compared with US$67.7 bil-
lion in 2015 and US$89.8 billion in 2014. At
CHF 3.0 billion, net issuance of CHF 1,000
banknotes was lower in 2016 than in 2015
when it totalled CHF 4.7 billion. These fi g-
ures do not reveal any clear effect stem-
ming from the end of €500 banknote issu-
ance.
2 The factors that infl uence euro banknote circulation are discussed, inter alia, in papers modelling demand for euro banknotes econometrically. See N Bartzsch, F Seitz and R Setzer (2015), The demand for euro banknotes issued in Germany: structural modelling and forecasting, ROME Discussion Paper Series, No 15-03.
Net issuance of euro banknotes by the Eurosystem, by denomination
€ billion
Year €500 €200 €100 €50 Total
2013 – 2.2 2.9 14.4 26.3 43.62014 11.5 1.0 16.6 27.3 60.42015 3.8 0.6 12.9 44.5 66.92016 – 36.9 5.3 28.8 41.7 42.82017 – 13.2 2.6 19.1 29.7 44.5
Source: European Central Bank.
Deutsche Bundesbank
Net issuance of euro banknotes by the Deutsche Bundesbank,by denomination
€ billion
Year €500 €200 €100 €50 Total
2013 5.7 3.5 10.4 9.4 34.02014 12.9 2.7 12.3 13.0 46.92015 8.9 2.3 12.2 13.4 44.22016 – 7.5 5.2 20.6 14.3 39.52017 1.4 3.2 16.9 12.8 42.5
Deutsche Bundesbank
Deutsche Bundesbank Monthly Report March 2018 46

vation. At the time of the initial issuance of the
new series of banknotes, the total volume of
ES1 banknotes in circulation of each denomin-
ation was made up of the domestic transaction
balance, domestic hoarding and banknotes in
circulation abroad. ES1 banknotes used for
transaction purposes have a quick circulation
time and are consequently rapidly replaced by
ES2 banknotes, whereas hoarded banknotes or
ES1 banknotes in circulation abroad do not
flow back to the Bundesbank, or do so only
slowly, and are therefore only partially replaced
by ES2 banknotes. In view of these consider-
ations, net returns of ES1 banknotes up to a
given date are generally attributable to the
transaction balance, which means that this
decline in the cumulative net issuance of ES1
banknotes up to a given date can be used to
estimate the domestic transaction balance ac-
counted for by the respective denomination.
In order to operationalise this estimation pro-
cedure, it is necessary to set a time limit as at
which the bulk of the ES1 banknotes in the do-
mestic transaction balance are assumed to
have been replaced by ES2 banknotes. The
launch of the new banknotes was successful
insofar as economic agents were already pri-
marily using banknotes of the second series for
payment purposes within a short period of
time following their introduction. By way of
illustra tion, the chart on page 48 shows how
the shares of ES2 banknotes developed over a
period of 12 months following their initial issu-
ance in relation to the total volume of these
denominations paid in and out at the Bundes-
bank’s branches. Nine months after the initial
issuance of the new ES2 banknotes, around
90% of the €5 banknotes paid in and 95% of
the €5 banknotes paid out were banknotes
from the second series. In the case of €10 and
€20 banknotes, this figure was as high as
around 95% of the inflows and almost 100%
of the outflows after this same period. Accord-
ing to these figures, it can be assumed that the
holdings of these banknotes for transaction
Estimating the domestic trans-action balance by denomin-ation on the basis of the ES2 introduction
Quick turn-around in domestic trans-action balance
Components of the domestic
transaction balance of
euro banknotes
1 Year-end data.
Deutsche Bundesbank
2008 2009 2010 2011 2012 2013 2014 2015 2016
0
6
12
18
24
30
36
42
€ billon
Households’ transaction balances
Credit institutions’ cash holdings 1
Total domestic transaction balance
Retailers’ cash holdings
Cumulative net issuance of “small”
euro banknotes by the Bundesbank
1 “Old” euro banknotes of the first euro banknote series. 2 “New” euro banknotes of the second euro banknote series.
Deutsche Bundesbank
2013 2014 2015 2016 2017
0
2
4
6
8
€ billion
0
10
20
30
0
10
20
30
40
50
0
40
80
120
160
200€50 banknote
€20 banknote
€10 banknote
€5 banknote
ES1 1 ES2 2
Deutsche Bundesbank Monthly Report
March 2018 47

purposes were almost completely replaced
within the space of nine months.15
The estimation results for the domestic transac-
tion balances of €5, €10 and €20 banknotes on
the basis of the ES2 introduction are shown in
the table on page 49.16 For each of the denom-
inations observed, the domestic transaction
balance accounts for roughly one- fifth or less
of their total volume in circulation (cumulative
net issuance). By comparison, according to the
estimates previously shown, the share of the
total domestic transaction balance in relation
to the Bundesbank’s cumulative net issuance is
between 5% and 10%.
The presented estimates of the breakdown of
the transaction balance by denomination on
the basis of the ES2 introduction are confirmed
by the findings of the study on payment behav-
iour. Based on an estimated value for the do-
mestic transaction balance of around €35 bil-
lion at the end of 2015, the €5 banknote
accounts for a 5.2% share, the €10 banknote
for an 11.6% share and the €20 banknote for a
24.7% share of the total domestic transaction
balance. This composition of the domestic
transaction balance can be compared with the
information contained in the payment behav-
iour study reporting the breakdown of the cash
Domestic trans-action balances of €5, €10 and €20 banknotes account for roughly one- fifth or less of the respective volumes in circulation
Results of the payment behaviour study confirm the estimates
ES2 series* banknotes as a share of the
Bundesbank's gross cash inflows and
outflows
* The ES2 series comprises the “new” euro banknotes of the second euro banknote series.
Deutsche Bundesbank
2013 2014
0
20
40
60
80
100
%
2014 2015
0
20
40
60
80
100
2015 2016
0
20
40
60
80
100
2017 2018
0
20
40
60
80
100
Cash paid inCash paid out
€50 banknote
€20 banknote
€10 banknote
€5 banknote
15 In order to take account of the fact that part of the transaction balance still consisted of ES1 banknotes at this time, the decline observed up to then in the cumulative net issuance of ES1 banknotes is weighed using the inverse of the share of ES2 banknotes in gross cash inflows at this point in time. See N Bartzsch (2017), Transaction balances of small denomination banknotes: findings from the intro-duction of ES2, in Deutsche Bundesbank International Cash Conference 2017 – War on Cash – Is there a Future for Cash?, Frankfurt am Main, pp 288-311.16 An estimate of the domestic transaction balance’s share in €50 notes on the basis of the ES2 introduction is not included here, as it is unclear whether the cumulative net issuance of the €50 banknotes of the first series has already reached a stable level. The €50 banknote is also presum-ably hoarded to a greater extent in Germany than €5, €10 and €20 banknotes, which means that a larger share of the ES1 banknotes that have made their way back to the Bun-desbank could also have been the result of people cashing in their hoarded cash stocks following the introduction of the ES2 banknotes.
Deutsche Bundesbank Monthly Report March 2018 48

carried by individuals in Germany.17 According
to the results of the 2017 study, the share in
terms of value of the total volume of euro
banknotes carried by individuals in their wallets
was broken down as follows: €5 banknotes
accounted for 6.2%, €10 banknotes for 13.7%
and €20 banknotes for 22.9%. The estimate of
the overall composition of the transaction bal-
ance on the basis of the ES2 introduction there-
fore strongly concurs with the estimate for the
composition of the cash carried by individuals
determined as part of the payment behaviour
study.18
Domestic hoarding
Domestic hoarding includes all stocks of bank-
notes in Germany that have not been covered
up to now, especially those held as a store of
value. From a methodological perspective, esti-
mating banknote hoarding is particularly chal-
lenging and the presented results are therefore
subject to greater uncertainty than the esti-
mates of the domestic transaction balance and
of German- issued banknotes in circulation
abroad. The results presented below are based
on the seasonal method.19 According to the
esti mates, the stocks of hoarded euro bank-
notes in Germany amounted to €150 billion in
2016, which, in rounded terms, is equivalent to
€1,800 per inhabitant. In terms of value, do-
mestic hoarding is thus the most significant
component of domestic demand. The chart on
page 50 shows the development of the esti-
mated domestic hoarding stocks over time.
Domestic hoarding increased by an estimated
€50 billion, or an annual average of around €7
billion, between 2010 and 2016 and thus con-
tributed in part to the increase of €244 billion
in German- issued euro banknotes in circulation
observed during this period.
As a result of the low interest rates, the oppor-
tunity costs of holding cash are currently low.
Since 11 June 2014, deposits held with Eurosys-
tem central banks have been remunerated at a
negative rate of interest and in some instances,
credit institutions in Germany have also been
imposing negative interest rates on their cus-
tomers’ deposits. Against this backdrop, devel-
opments in euro banknote hoarding are cur-
rently of particular interest because economic
agents in Germany could, in principle, show a
In terms of value, domestic hoarding is the largest compon-ent of domestic demand
Results of the seasonal method do not indicate large- scale shifts from deposits to cash
Domestic transaction balances of small German-issued euro banknotes
Item€5 banknote1
€10 banknote2
€20 banknote3
Cumulative net issuance4 7.9 23.4 43.9
Transaction balances4 1.8 4.0 8.5
Percentage share of cumulative net issuance 22.7 17.1 19.4
1 As at May 2013. 2 As at August 2014. 3 As at October 2015. 4 In € billion.
Deutsche Bundesbank
17 See Deutsche Bundesbank, Payment behaviour in Ger-many in 2017, op cit.18 The deposits made at the Bundesbank’s branches can be used as a sample of the domestic transaction balance, as these result primarily from the use of euro banknotes as a means of payment. Measured in terms of the overall value, €5 banknotes accounted for 2.3%, €10 banknotes for 7.7% and €20 banknotes for 14.6% of the total volume of deposited banknotes in 2017. The estimated shares of these banknotes in the domestic transaction balance are therefore higher than their shares in the deposits made at the Bundesbank’s branches. Smaller- denomination bank-notes are presumably deposited less frequently at the Bun-desbank’s branches than higher- value banknotes, as they are often reused as change.19 After estimating foreign demand and the domestic transaction balance, it would also be possible to calculate domestic hoarding as the residual figure. Calculations on the basis of the residual figure are problematic, as each estimation error that occurs when calculating the other components is reflected in the estimate for domestic hoarding. For example, the method used for estimating banknotes in circulation abroad does not take account of banknote flows resulting from migrants or cross- border transactions. Estimates of domestic banknote hoarding as a residual figure as well as on the basis of the seasonal method both come to comparable results at the current end, although their trajectories differ over time. For details on the seasonal method, see S Sumner (1990), The trans-actions and hoarding demand for currency, Quarterly Review of Economics and Business, 30 (1), pp 75-89; N Bartzsch, G Rösl and F Seitz (2011b), op cit; F Seitz (1995), Der DM- Umlauf im Ausland, Deutsche Bundesbank Discussion Paper, No 01/ 1995; Deutsche Bundesbank, Sea-sonal method, Monthly Report, January 2011, p 36.
Deutsche Bundesbank Monthly Report
March 2018 49

greater tendency to use cash as a store of value
in the current climate. According to the esti-
mates of banknote hoarding using the seasonal
method, domestic hoarding stocks did in fact
rise by just over €8 billion in 2015 and by
around €7 billion in 2016. However, these in-
creases are nothing out of the ordinary when
compared with the increases in previous years,
as it is estimated that domestic hoarding stocks
rose by around €12 billion in 2008, for ex-
ample, the year in which the financial crisis
escal ated. Furthermore, compared with the non-
bank sight deposits in the amount of €1,898
billion at the end of 2016, the calculated stocks
of hoarded banknotes in the amount of €150
billion are low. There are therefore no clear in-
dications of any large- scale shifts from deposits
to cash by non- banks in the context of the low-
interest- rate environment.
Banknotes in circulation abroad
Euro banknotes issued by the Bundesbank can
migrate to other euro area countries and non-
euro area countries through various channels.
Possible channels of international banknote
migra tion are deliveries of euro banknotes to
countries outside the euro area by international
wholesale currency shippers, euro banknotes
taken abroad by travellers as well as by foreign
workers and migrants, and cross- border pay-
ment transactions settled in cash. Deliveries by
international wholesale currency shippers and
cash taken abroad by travellers are recorded
statistically.20 On the basis of account transac-
tions with international wholesale currency
shippers, it is possible to determine to what ex-
tent, in net terms, these euro banknotes are in
circulation outside the euro area. In 2016, these
net deliveries by international wholesale cur-
rency shippers amounted to -€7 billion, which
means that there were net return flows to the
Bundesbank. Based on a household survey on
foreign travel conducted by the Bundesbank, it
is possible to determine how much euro cur-
rency has been taken abroad to other euro
area countries and also to countries outside the
euro area.21 In 2016, a net amount of €16.5
billion migrated abroad as a result of foreign
travel, a net €7.5 billion of which was taken
outside of the euro area and €9 billion to other
euro area countries. The cumulative net flows
since the introduction of the euro currency pro-
vide information about the holdings of German-
issued euro banknotes in circulation abroad.
The results are shown in the chart on page 51.
Accordingly, Bundesbank- issued euro bank-
notes with a value of €390 billion were in circu-
lation abroad at the end of 2016, around €270
billion of which were in countries outside the
euro area and around €120 billion in other euro
area countries. This means that around 70% (in
terms of value) of “German” euro banknotes
were in circulation abroad, 50 percentage
Estimating foreign demand on the basis of net shipments and foreign travel
In terms of value, 70% of German- issued euro banknotes are in circulation abroad, 50 per-centage points of which are held outside the euro area and 20 per-centage points in other euro area countries
Domestic hoarding of euro banknotes*
* Estimate using the seasonal method.
Deutsche Bundesbank
2002 03 04 05 06 07 08 09 10 11 12 13 14 15 2016
20
40
60
80
100
120
140
160
€ billion
20 See N Bartzsch, G Rösl and F Seitz (2011a), op cit; and Deutsche Bundesbank, Recording euro currency in the bal-ance of payments and the international investment pos-ition, Monthly Report, March 2015, pp 91-93.21 As part of the balance of payments statistics, the Bun-desbank conducts household surveys on how much euro cash residents in Germany take with them when they travel abroad. As there are no comparable surveys on euro cash inflows generated by foreign travellers to Germany, these are estimated based on the assumption that foreign travel-lers to Germany behave similarly to German travellers abroad. The household survey looks at cash carried, though this is primarily likely to constitute banknotes. For informa-tion about German- issued euro coins in circulation abroad, see Deutsche Bundesbank, Foreign demand for German euro coins, Monthly Report, April 2015, p 72.
Deutsche Bundesbank Monthly Report March 2018 50

points of which were held in countries outside
the euro area and 20 percentage points in
other euro area countries. Viewed in relation to
the period since the introduction of the euro
currency, the bulk of the growth in the cumula-
tive euro banknote issuance by the Bundes-
bank is attributable to foreign demand. In the
years from 2010 to 2016, the demand from
abroad rose by around an esti mated €165 bil-
lion, which consequently explains the largest
part of the increase in German- issued euro
banknotes in circulation during this period. In
recent years, however, the increase in German-
issued euro banknotes in circulation abroad has
tailed off. Whereas this foreign demand rose by
just under €31 billion in 2014 and by almost
€19 billion in 2015, the increase only amounted
to just over €9 billion in 2016. The decrease in
banknote outflows abroad is due mainly to a
corresponding decline in the net deliveries from
wholesale currency shippers, which fell from
€14 billion in 2014 to just over €2 billion in
2015 and -€7 billion in 2016.22
Conclusions
Estimates of the components of German- issued
banknotes in circulation can be used to investi-
gate the determinants of banknote issuance in
Germany. These estimates show that less than
10% in terms of the value of euro banknotes
issued by the Bundesbank is held for domestic
transaction purposes, over 20% is hoarded do-
mestically and around 70% is in circulation
abroad. In the period under review, the level of
the domestic transaction balance has remained
largely unchanged since 2010, meaning that
the observed increase in German- issued bank-
notes in circulation can be better explained by
increases above all in foreign demand as well
as, to a lesser extent, in domestic hoarding.
These conclusions confirm earlier findings
which also stressed the significance of bank-
notes in circulation abroad and domestic
hoarding for developments in the circulation of
German- issued euro banknotes for the period
from 2002 to 2009.23
In the period since 2010, the volume of euro
banknotes in circulation issued by the Bundes-
bank has continued to grow strongly on the
back of strong demand, as have euro bank-
notes in circulation issued by the Eurosystem as
a whole. This development reflects the popu-
larity of euro banknotes as a means of payment
and as a store of value both in Germany and
abroad.
Estimating bank-note demand components as a way of analys-ing banknote issuance in Germany
Demand for euro banknotes is growing
German-issued euro banknotes in
circulation abroad*
* Estimate based on data from deliveries of euro banknotes by international wholesale currency shippers and cash taken abroad by travellers.
Deutsche Bundesbank
2002 03 04 05 06 07 08 09 10 11 12 13 14 15 2016
0
50
100
150
200
250
300
350
400
€ billion
... outside the
euro area
... in the euro area
... in total
Volume in circulation abroad ...
22 With the introduction of ES2 banknotes, it was possible to derive – in addition to the described estimate of the total value of German- issued euro banknotes in circulation in countries outside the euro area – the transaction bal-ances of small euro banknote denominations. See N Bartzsch (2017), op cit. According to the results, the transaction bal-ances of the low- denomination German- issued euro bank-notes in circulation outside the euro area are small, amounting to €250 million in the case of the €5 banknote, €500 million in the case of the €10 banknote and just over €3 billion in the case of the €20 banknote. The results also indicate that hoarding is likely to account for the bulk of the German- issued euro banknotes of these denominations in circulation outside the euro area.23 See Deutsche Bundesbank, The development and de-terminants of euro currency in circulation in Germany, op cit and Deutsche Bundesbank, Foreign demand for euro banknotes issued in Germany, op cit.
Deutsche Bundesbank Monthly Report
March 2018 51

Deutsche Bundesbank Monthly Report March 2018 52

Contingent convertible bonds: design, regulation, usefulness
Strengthening banks’ capital base was one of regulatory and supervisory authorities’ central
objectives following the financial crisis of 2007-08. Contingent convertible bonds (CoCo bonds or
CoCos) were discussed as a possible instrument with which to achieve this goal. CoCos are bonds
that are converted into common equity tier 1 capital or written down if contractually specified
trigger events occur. Under the Basel III rules, they are recognised as regulatory capital under cer-
tain conditions. Investors and the regulatory authorities had expected this instrument both to set
suitable incentives to improve risk management and monitoring and to increase banks’ total loss
absorbing capacity under normal business conditions. This would, the logic went, strengthen
banks’ resilience. Finally, the hybrid nature of CoCo bonds – they include features of both equity
and debt – was to give them a cost advantage vis- à- vis common equity tier 1 capital.
However, a critical analysis of CoCo bonds, both at the theoretical level and in terms of how they
are currently employed in practice, makes it clear that this instrument’s high complexity makes it
difficult to steer the transmission and incentive mechanisms in a targeted manner and increases
the danger of undesirable side effects. Moreover, given the way in which CoCos are currently
being designed, banking regulators have doubts about their effectiveness as a loss absorbing
instrument for banks on a going-concern basis. This consequently raises the question of whether
the requirements for recognising CoCo bonds as regulatory capital should at least be tightened in
the short term. In the long term, however, a stronger focus on common equity tier 1 capital looks
like a better way to strengthen banks’ stability.
Deutsche Bundesbank Monthly Report
March 2018 53

Introduction
In response to the 2007-08 financial crisis, the
Squam Lake Group of Anglo- American econo-
mists in 2009 proposed contingent convertible
bonds as a possible instrument for strengthen-
ing banks’ capital base.1 These securities are a
hybrid form of financing and thus combine the
usual characteristics of debt financing2 with eq-
uity’s ability to absorb losses. The use of such
instruments is also intended to help create in-
centives for improved risk management and
monitoring and to strengthen banks’ stability
overall.
CoCo bonds are subordinated bonds that pay a
coupon and are either converted into common
equity tier 1 (CET1) capital or written down
when contractually specified trigger events
occur.3 In this manner, they may contribute to
a quantitative increase in banks’ regulatory
capital in a way that pure debt capital cannot.
After the write- down or conversion into com-
mon equity tier 1 capital, banks’ capital base
will even be strengthened in qualitative terms.
CoCos differ from traditional convertible de-
bentures in that conversion cannot be trig-
gered by the bondholder; it must take place
automatically and immediately, ie without
delay, when the conditions specified in the
contract are met.
In recent years, CoCo bonds have gained in
importance in practice. After a first issuance by
the UK’s Lloyds Banking Group in November
2009, CoCo bonds were initially issued mainly in
Europe. Because they are implicitly mentioned
in the Basel III rules on regulatory capital, they
have of late increasingly also been issued out-
side of Europe, especially in Asia.4 According to
the financial data services Bloomberg and Dea-
logic, by the end of 2017, 398 CoCo bonds had
been issued in Europe alone (of which EU: 285)
with a total volume of €230 billion (of which
EU: €193 billion).5 These numbers can largely be
attributed to issuance by UK as well as Swiss,
French and Spanish banks. In Germany, just 17
issues with a volume of €6.2 billion were regis-
tered in the same period (see the chart on
page 55). One possible explanation for the com-
paratively low issuance volume in Germany is
the earlier debate on the tax deductibility of
coupon payments for CoCo bonds, which was
not permitted until 2014.6 In terms of owner-
ship structure, little detailed data are currently
available. According to what is known, Euro-
pean CoCo bonds are currently mostly held by
investors outside the euro area, followed by
mutual funds mainly located in Ireland and
Luxem bourg. Banks and insurers, by contrast,
hardly ever hold CoCo bonds directly, though
they may be indirectly invested in them via for-
eign central securities depositories, for instance.7
Although CoCo bonds currently make up a
small percentage of European institutions’
regulatory capital, a critical assessment makes
sense given the current market situation and
Additional hybrid capital instrument
Characterisation
Market trends
Critical analysis and review of regulatory treatment
1 See Squam Lake Working Group on Financial Regulation (2009), An expedited resolution mechanism for distressed financial firms: regulatory hybrid securities, Council on For-eign Relations, April. For more on the original idea behind CoCos, see also M J Flannery (2005), No pain, no gain? Effect ing market discipline via reverse convertible deben-tures, in H S Scott, Capital adequacy beyond Basel: bank-ing, securities, and insurance, Oxford University Press, pp 171-196.2 Specifically, this means a fixed rate of interest, coupon payments that are potentially tax deductible, broader agreement among the existing equity holders to issue such paper in good times and, provided an appropriate design is chosen, potentially a lower cost of capital as well as pos-sibly easier issuance of debt capital given the signalling effects associated with issuing equity capital (see the sec-tion entitled “Bank- specific implications of CoCo design” on pp 57-61).3 In this context, write- down means that the issuer’s liabil-ities from the CoCo bond lapse. This generates a profit, which increases the issuer’s capital.4 CoCo bonds have been eligible as regulatory capital under Basel III since 2013. Within the EU, eligibility was introduced with the Capital Requirements Regulation (CRR) at the beginning of 2014.5 This does not include bonds for which no information on the loss absorbing mechanism (conversion or write- down) is available. Based on global data as at 2015, a study by the Bank for International Settlements puts total issuance vol-ume for CoCo bonds at €522 billion from 731 issues. Of these issues, 39% were conducted by European banks. See S Avdjiev, B Bogdanova, P Bolton, W Jiang and A Karta-sheva (2017), CoCo issuance and bank fragility, BIS Work-ing Papers No 678.6 See Federal Ministry of Finance, Steuerliche Behandlung von Instrumenten des zusätzlichen Kernkapitals nach Art. 51ff. CRR of 10 April 2014.7 See M A Boermans and S van Wijnbergen (2018), Contin-gent convertible bonds: who invests in European CoCos?, Applied Economics Letters 25 (4), pp 234-238.
Deutsche Bundesbank Monthly Report March 2018 54

their regulatory recognition.8 Signs that the
current issuance practice is having undesirable
side effects that could have resulted in the mar-
ket turbulence witnessed in the early part of
2016 raise the question of whether the expect-
ations that banks, investors and regulators
have placed in CoCos have been met so far. In
this context, a debate is needed on what role
the regulatory recognition of CoCo bonds in re-
lation to CET1 capital has for issuance practice
and whether this regulatory treatment should
be changed.
Objectives, design and regulatory treatment
According to the relevant literature, banks may
issue CoCo bonds in order to give themselves an
additional loss absorbing instrument besides
existing CET1 capital. In particular, that would
allow them to increase their loss absorbing cap-
acity even before a crisis occurred, while paying
a low market price for risk assumption and
without diluting the owners’ right of control
from the outset. Because it is assumed to have
a cost advantage as compared to CET1 capital,9
using this instrument is intended to help prevent
banks from having to curtail their activities, es-
pecially lending.10 In addition, the conversion of
CoCo bonds is to provide additional CET1 cap-
ital if needed. This helps prevent, say, balance-
sheet deleveraging at short notice, which would
otherwise be necessary.11 Moreover, through a
tailored contractual structure, the use of CoCo
bonds is intended to give banks’ management
incentives to enhance risk management and
monitoring. The purpose of this is to lower the
risks for individual banks and, as a consequence,
for the banking system as a whole. This could
reduce the need for government rescue meas-
ures and stabilise the real economy.12
Whether CoCo bonds meet the expectations out-
lined above largely depends on their design. Key
factors besides the nature of the trigger event
and its threshold value are the form of loss ab-
sorption and the volume of CoCo bonds issued.
In terms of the trigger event, the academic lit-
erature distinguishes between mechanical and
discretionary triggers. Where the trigger event
is mechanical, conversion or write- down is trig-
gered automatically once a threshold defined
either based on market values or on balance
sheet or regulatory metrics is reached. Market-
based threshold values can be derived from,
say, stock prices, sector indices or macroeco-
nomic parameters, while capital ratios and
measures of the return on equity, for instance,
can be used as regulatory or balance sheet
General expectations of CoCo bonds
Design of CoCo bonds
Trigger event
Total volume of CoCo bonds issued by
European banks from 2009 to 2017
Sources: Bloomberg and Dealogic.
Deutsche Bundesbank
0 10 20 30 40 50 60 70 80
€ billion
Sweden
Luxembourg
Ireland
Germany
Other
United Kingdom
Switzerland
France
Spain
Netherlands
Italy
8 For instance, CoCo bonds represent around 10% of UK banks’ total capital, but less than 2% of German banks’ total capital.9 The lower costs may result, amongst other things, from the potential tax deductibility of coupon payments. How-ever, this also depends on the design of tax legislation in the country in question.10 There is no consensus in the literature on how capital levels impact lending. Studies show, however, that irre-spective of any potential cost advantage that certain cap-ital instruments enjoy over others, a strengthened capital base alone can have positive effects on bank lending; see C M Buch and E Prieto (2014), Do better capitalized banks lend less? Long- run panel evidence from Germany, Inter-national Finance, 17 (1), pp 1-23.11 See A R Admati, P M DeMarzo, M F Hellwig and P Pflei-derer (2013), Fallacies, irrelevant facts, and myths in the discussion of capital regulation: why bank equity is not so-cially expensive, Rock Center for Corporate Governance Working Paper Series No 161.12 See R W Greene (2016), Understanding CoCos: what operational concerns and global trends mean for U.S. poli-cymakers, M- RCBG Associate Working Paper No 62, Har-vard University; C Pazarbasioglu, J Zhou, V Le Leslé and M Moore (2011), Contingent capital: economic rationale and design features, IMF Staff Discussion Note, SDN/ 11/ 01.
Deutsche Bundesbank Monthly Report
March 2018 55

thresholds. The calibration of the threshold
value determines when the trigger is activated.
By contrast, discretionary trigger events relate
to assessments and decisions by third parties,
such as supervisory or resolution authorities.
Another key feature of CoCo bonds is the loss
absorption mechanism. It determines whether
the trigger event prompts conversion or write-
down, and what this must look like. If conver-
sion into CET1 capital is prescribed, the conver-
sion rate13 determines the dilution of the ori-
ginal equity holders’ claims. Dilution refers to
the shift in control rights as well as in profit and
loss distribution. Depending on the conversion
rate, its impact on the original equity holders
may differ. Substantial dilution redistributes
future claims to profits and losses to the (for-
mer) CoCo bond holders to a considerable ex-
tent. A small degree of dilution leaves these
claims primarily with the original owners. In the
context of a CoCo bond issue, the conversion
rate may be defined as fixed (determined when
the bonds are issued) or variable (determined
at the point of conversion based on market
prices).14 Once effected, a conversion cannot
be reversed. After a write- down, by contrast,
“write- ups” are theoretically possible once a
bank has overcome its crisis. In a write- down,
the CoCo bond holder suffers direct losses, but
does not, unlike in a conversion, receive any
equity. In each of these cases, the contract
must specify whether a conversion or write-
down should take place in full or partially and
what gradations are envisaged in the case of a
partial conversion or write- down.
In addition to the trigger event and absorption
mechanism, a number of additional features
must be specified in the contract. These in-
clude, in particular, the term, issue volume, any
call options on the issuer’s part and the coupon
level as well as the possible option to suspend
or delay the coupon payment.
The design of the CoCo bond contract is up to
the issuer and is not subject to any special
regulatory requirements. However, the possibil-
ity of having CoCo bonds counted as additional
tier 1 capital (AT1) or tier 2 capital (T2) gives
banks an incentive to issue CoCo bonds with
features that enjoy preferential regulatory treat-
ment. In this way, banking regulators, too, can
influence the market and thus help ensure that
the general expectations regarding CoCo bonds
as outlined above are met.
From a prudential standpoint, CoCo bonds
must be permanently available to the issuing
institution to cover losses if they are to be rec-
ognised within the EU as AT1 capital pursuant
to Article 52 (1) Capital Requirements Regula-
tion (CRR) before their conversion. In this way,
they are intended primarily as going- concern
instruments. Specifically, CoCos must, amongst
other things, be subordinated to T2 capital in-
struments in the event of insolvency. They must
also have an unlimited maturity, and the terms
of the contract must contain a threshold value
for the CET1 ratio of the issuing institution of at
least 5.125%.15 A conversion or write- down of
the CoCo bond must therefore take place
when the CET1 ratio falls below this threshold,
at the latest. In addition, it must be possible for
the issuer to unilaterally suspend coupon pay-
ments for an indefinite period and on a non-
cumulative basis, ie without substitution.16
Around 80% of CoCo bonds issued in the EU
Loss absorption mechanism
Other features
Regulatory treatment
Criteria for eligibility as AT1 capital
13 The conversion rate expresses how many equity stakes CoCo bond holders will receive in return for their bonds.14 Where the conversion rate is variable, a floor and/ or a ceiling may additionally be specified.15 See Article 54 CRR. This figure is calculated as the min-imum requirement for common equity tier 1 capital plus the bottom quartile of the capital conservation buffer (4.5% minimum requirement plus 0.625% capital conser-vation buffer, expressed as a proportion of the total risk exposure amount) below which a full moratorium on divi-dend payments applies to the institution.16 In addition, Article 437 CRR also stipulates special trans-parency requirements for own funds for CoCo bonds as part of Pillar III reporting. The issuance of additional tier 1 capital is regularly monitored by the European Banking Author ity (EBA); see EBA (2016), EBA report on the moni-toring of Additional Tier 1 (AT1) instruments of European Union (EU) institutions – Second update: FINAL. In add-ition, the EBA has drawn up standardised clauses for AT1 issues. These clauses aim to make it easier for smaller insti-tutions especially to access hybrid capital instruments, and to create additional transparency. See EBA, EBA standard-ised templates for Additional Tier 1 (AT1) instruments – Final, EBA report, 10 October 2016.
Deutsche Bundesbank Monthly Report March 2018 56

as a whole are eligible as regulatory AT1 capital
according to the current definition. The remain-
ing issues include other CoCo bonds with con-
tractually fixed trigger events which may be
recognised as tier 2 capital (T2) under certain
circumstances (see the adjacent chart).
Where CoCo bonds do not meet the require-
ments of Article 52 (1) CRR, they may qualify as
T2 instruments if the conditions set out in Art-
icle 63 CRR are met. In contrast to AT1 eligibil-
ity, this does not require a mechanical trigger
event. In addition, T2 instruments may have a
limited maturity, though it must be at least five
years. There are, however, instances in which
instruments that are allocated to T2 capital be-
cause of their limited maturity have a mechan-
ical trigger event that could take place before
that of CoCos eligible as AT1 instruments. That
said, as CoCo bonds in T2 capital play a fairly
subordinate role in practice, we will not discuss
them in any great detail in this article.
Irrespective of the contractually pre- defined
trigger event, the resolution authorities must
stipulate conversion or write- down of all AT1
and T2 instruments if the point of non- viability
(PONV) was established. This describes the
point in time as of which an institution is no
longer viable without a (forced) conversion or
write- down of all relevant capital instruments.17
This is the case irrespective of the concrete de-
sign of the instruments in question.
In the event of resolution (gone concern), CoCo
bonds that have not already been triggered ul-
timately help ensure that losses are absorbed
by CoCo bond holders through write- down or
conversion and all senior creditors are therefore
potentially given preferential treatment. If the
relevant criteria are met, CoCos can therefore
be recognised under the Minimum Require-
ment for Own Funds and Eligible Liabilities
(MREL) or Total Loss Absorbing Capacity
(TLAC).18 However, unlike other MREL or TLAC-
eligible instruments, they offer no additional
advantages in the event of resolution.19
Bank- specific implications of CoCo design
The many different ways in which CoCo bonds
can be designed implies a complex system of
effects and incentives, which harbours the risk
of undesirable side effects. To be used effect-
ively, then, the trigger and absorption mechan-
ism must be chosen and structured prudently.
Their complexity also renders it difficult to
estab lish a liquid market, as investors need to
be aware of the exact design of each individual
CoCo.
When defining the trigger, some of the deci-
sions the issuer makes are as follows. Is the
trigger based on market values or accounting
values/ regulatory metrics? To what extent is the
CoCo triggered mechanically or with the in-
volvement of the competent supervisory au-
Criteria for eligibility as T2 capital
Exceptional regulatory power of intervention
CoCos in the event of resolution
Trigger
Composition of EU CoCo bond issuance
Sources: Bloomberg and Dealogic.
Deutsche Bundesbank
2009 10 11 12 13 14 15 16 2017
0
25
50
75
100
125
150
175
200
€ billion
Write-down AT1
Write-down T2
Write-down other
Conversion AT1
Conversion T2
Conversion other
17 See Recital (81) BRRD, Article 59 BRRD or section 89 of the Act on the Recovery and Resolution of Institutions and Financial Groups (Gesetz zur Sanierung und Abwicklung von Instituten und Finanzgruppen). As a result, almost all European CoCo bonds issued in practice are affected (see above chart).18 See also Deutsche Bundesbank, Bank recovery and resolution – the new TLAC and MREL minimum require-ments, Monthly Report, July 2016, pp 63-80.19 See Deutsche Bundesbank, The institutional framework for bank resolution in the EU, Financial Stability Review 2017, pp 34-36.
Deutsche Bundesbank Monthly Report
March 2018 57

thority? The issuer may also consider whether
to define multiple trigger events which have to
occur simultaneously or which can activate loss
absorption independently of each other.
With regard to accounting value/ regulatory
triggers, it should be noted that these can be
imprecise for two reasons. First, the use of dis-
cretionary scope for accounting valuations
could delay activation of the trigger. Second,
these metrics normally rely on data that are
publicly disclosed only on certain reporting
dates. However, the instrument would have to
be converted or written down immediately,
possibly between reporting dates.20 Yet there is
some question as to whether all issuers are
able to monitor the relevant triggers in suffi-
ciently good time, which means that timely loss
absorption is not always ensured.21 Market
value triggers, by contrast, are more transpar-
ent in principle, giving better assurance of
timely trigger activation. However, certain mar-
ket value metrics, such as stock prices, are not
available for all banks. In Europe, for example,
only around one- third of the banks directly
supervised by the European Central Bank (ECB)
are listed on an exchange.22 Market value trig-
gers can also be activated by market move-
ments which do not reflect changes in the fun-
damental values, but instead result from
changes in market liquidity, for instance. In
addition, it is also conceivable for speculative
attacks to activate the trigger.23 Even if the
contractual threshold is breached for just a
short time, this is generally enough to trigger
conversion or write- down. This can occur in
periods of heavy market turbulence, in particu-
lar. After weighing up the pros and cons, an
accounting value trigger would appear more
workable from a banking regulation perspec-
tive. The relevant rules in the EU stipulate that,
to qualify as AT1 capital, CoCo bonds must be
pegged to the CET1 ratio.
Mechanical triggers are especially transparent
and easy to use, as the issuer or CoCo bond
holder can observe when they are breached,
without the need for a third- party decision.
However, additional information over and
above the specific trigger cannot be taken into
account where exclusive use is made of a single
mechanical trigger. By contrast, discretionary
triggers permit the use of extensive and com-
plex information, but entail the risk that the
decision required to activate the trigger is made
too early or too late. Activation by supervisors
may also be taken as a negative signal by mar-
ket participants and could cause negative ex-
ternalities. It is also possible to consider com-
binations of different triggers. For example, it
would be conceivable to simultaneously com-
bine a mechanical trigger based primarily on
bank- specific aspects with a discretionary trig-
ger that takes into account the state of the en-
tire banking system.24
The CoCo bonds issued in the EU to date have
predominantly had a single mechanical trigger.
All of them use a CET1 capital ratio as a bank-
specific regulatory threshold, with conversion
or write- down automatically triggered when
capital falls below that level.25 For CoCo bonds
that qualify as AT1 or T2 instruments, regula-
tors in the EU generally also have the power to
intervene and force conversion or write- down
if the PONV is identified. Market value triggers
play no role for CoCos issued in the EU, nor is
there currently any evidence of combined trig-
ger events (eg allowing systemic components
to be taken into account), which have to occur
Accounting value/ regulatory triggers and market value triggers
Discretionary and mechanical triggers
Current trigger design in the EU
20 This is the case, for example, when the trigger is pegged to the CET1 ratio, which is normally publicly disclosed on a quarterly basis only.21 See C W Calomiris and R J Herring (2013), How to de-sign a contingent convertible debt requirement that helps solve our too- big- to- fail problem, Journal of Applied Cor-porate Finance 25 (2), pp 66-89.22 See T Berg and C Kaserer (2015), Does contingent cap-ital induce excessive risk- taking?, Journal of Financial Inter-mediation 24, pp 356-385.23 Holders of heavily dilutive CoCo bonds and investors short selling equity instruments could profit from specula-tive attacks, particularly if a market- based threshold (eg a stock price) is approached. This is not possible with ac-counting value triggers.24 The Squam Lake Group proposes that the CoCo bond be converted after the bank- specific trigger event only if the competent authorities identify a systemic crisis at the same time; see Squam Lake Working Group (2009), op cit.25 Any deviations from this are down to transitional provi-sions.
Deutsche Bundesbank Monthly Report March 2018 58

simultaneously. This principally reflects the pru-
dential requirements for CoCos to be recog-
nised as AT1 capital in the EU.
The other factor that is crucial to a CoCo
bond’s effect, besides the trigger, is the thresh-
old which activates conversion or write- down.
In order for a CoCo to effectively become avail-
able for loss absorption and thus ensure the
issuer remains a going concern, the threshold
should be defined such that timely activation
can be assured.26 This is the case if the positive
effects of loss absorption at least compensate
for potential side effects such as unwanted sig-
nalling effects. A threshold that triggers con-
version or write- down very early on can send a
negative signal at an especially early stage, thus
eliciting inappropriate market reactions. Share-
holders of listed banks could offload their
equity instruments to pre- empt the trigger. Any
slump in stock market prices that this might
potentially cause would thus be driven by low
market liquid ity, herd behaviour, a lack of trans-
parency and information asymmetries, and
could overstate the actual decrease in the
underlying enter prise value of the bank con-
cerned.27 Conversely, a CoCo bond with a
threshold that triggers conversion or write-
down at a very late stage fails to serve the
desired purpose, which is to function as a loss
absorbing instrument on a going- concern
basis.
Roughly 44% of the total issue volume of CoCo
bonds in the EU since 2009 have a CET1 ratio
of 5.125% as their threshold. This corresponds
to the minimum level required to qualify as AT1
capital in the EU. Looking at this threshold in
relation to the overall prudential CET1 capital
requirements – including the buffer require-
ments and, where applicable, the Pillar II re-
quirements – it is questionable whether the
CoCo bonds issued in the EU thus far are actu-
ally able to perform their function as a loss ab-
sorbing instrument on a going- concern basis.
As things currently stand, it is possible for these
overall requirements to be undershot or for the
PONV to be identified by the resolution and
supervisory authorities prior to the contractual
trigger event even occurring. CoCos would
then only really come into play in the event of
a bank failure and would no longer serve the
purpose of absorbing losses on a going- concern
basis. For this reason, it would be worth con-
sidering raising the regulatory requirement for
the threshold for AT1-eligible CoCos.
The regulatory requirements for AT1-eligible
CoCos allow for both conversion into CET1
capital and permanent or temporary write-
down as loss absorption mechanisms.
Conversion- to- equity (CE) CoCo bonds set
incen tives for equity holders and the bank’s
management to strengthen risk management
and monitoring when they entail sufficiently
substantial dilution.28 This is the case when
rights of control over, but also of participation
in, future profits and losses are transferred on a
large scale to the former CoCo bond holders.
This then sets an incentive for the original
equity holders to avoid conversion and to make
additional CET1 capital available ahead of time,
for example.29 Similarly to a threshold that acti-
vates loss absorption very early on, however,
substantial dilu tion can also prompt existing
stakeholders to sell their stock early and thus
cause a price drop.30 Principal write- down
(PWD) CoCo bonds flip this incentive structure.
They give equity holders and the bank’s man-
agement incentives to take on greater risk, be-
cause when the trigger event occurs the con-
trol and participation rights remain unchanged,
but a portion of the losses are borne by the
Threshold
Current threshold design in the EU
Loss absorption
26 See R W Greene (2016), op cit; C W Calomiris and R J Herring (2013) op cit; C Pazarbasioglu et al (2011), op cit.27 See R W Greene (2016), op cit.28 See C W Calomiris and R J Herring (2013) op cit; C Pazarbasioglu et al (2011), op cit; S Chan and S van Wijn-bergen (2017), CoCo design, risk shifting, incentives and capital regulation, Tinbergen Institute Discussion Paper TI 2016-007/ VI.29 See C W Calomiris and R J Herring (2013) op cit; S Chan and S van Wijnbergen (2015), CoCos, contagion and sys-temic risk, CEPR Discussion Paper No 10960.30 See R W Greene (2016), op cit.
Deutsche Bundesbank Monthly Report
March 2018 59

CoCo bond holders.31 In terms of incentives,
then, the literature favours CoCo bonds with a
conversion mechanism over those that are
written down. However, this form of bond is
only available to corporations. Other legal
structures, such as cooperatives, can only issue
PWD CoCos. It would thus appear logical to
give regulatory approval for both mechanisms.
One possible way to explain why the EU has
largely seen issuance of CoCo bonds with a
PWD loss absorption mechanism is that it is
ultim ately the holders of bank equity that
decide on CoCo issuance.32 By the end of 2017,
PWD CoCos made up 48% of the total issue
volume of CoCo bonds (see the above chart).
This decision- making power of the banks’
equity holders could also explain why, though
not the desired outcome from a regulatory per-
spective, CE CoCo bonds almost exclusively in-
volve a small degree of dilution of the original
equity holders’ stakes. As a result, the future
control and profit participation rights of the ori-
ginal equity holders are barely affected by the
trigger event occurring.33 The current design of
CoCo bonds thus tends to set perverse incen-
tives, leading banks to take on greater risk.
From a regulatory perspective, therefore, the
aim should be for substantial dilution, thus set-
ting incentives for the original equity holders to
ensure sustainable risk provisioning.
In order for CoCo bonds to effectively perform
their loss absorption function, the issue vol-
ume, which is converted or written down when
the trigger event occurs, has to be large enough
relative to a bank’s total capitalisation.34 Look-
ing at banks’ overall funding structure, the lit-
erature also advocates using CoCo bonds not
as a substitute for, but in addition to, available
equity capital.35 This aligns with the original
object ives of the Basel III framework, which
focuses on increasing and improving the qual-
ity of regulatory own funds and thus primarily
on strengthening CET1 capital.36 Accordingly,
AT1 instruments such as CoCo bonds should
only be used in addition to available CET1 cap-
ital.
Although the volume of CoCo bonds issued in
the EU has risen significantly since 2009, it has
so far remained at a relatively low level. CoCo
issuers tend to be larger, well- capitalised
banks.37 On the one hand, it therefore seems
unclear whether CoCo bonds are an effective
instrument for loss absorption in their current
design, but on the other hand, this may not be
necessary provided banks hold sufficient CET1
capital. In light of this, there is, in principle, no
need for higher volumes of CoCos from a regu-
latory perspective. Instead, it would seem more
expedient to maintain the focus on strengthen-
Current loss absorption set- up in the EU
Issue volume
Current issue volume in the EU
Market shares of EU CoCos with a
conversion or write-down mechanism
Sources: Bloomberg and Dealogic.
Deutsche Bundesbank
2009 10 11 12 13 14 15 16 2017
0
20
40
60
80
100
%
Conversion
Write-down
31 CoCos that are partially written down can also generate negative liquidity effects when triggered if, at the same time, the remaining principal amount is paid out to CoCo bond holders; see D Bleich, Contingent convertible bonds and the stability of bank funding: the case of partial write-down, Deutsche Bundesbank Discussion Paper, No 28/ 2014.32 See S Avdjiev, B Bogdanova, P Bolton, W Jiang and A Kartasheva (2017), CoCo issuance and bank fragility, BIS Working Papers No 678.33 This was the finding of a study of CoCo bonds issued by major European banks, which estimated their dilution in the period between 2009 and 2013. See T Berg and C Kaserer (2015), op cit.34 See S Maes and W Schoutens (2012), Contingent cap-ital: an in- depth discussion, Economic Notes 41 (1/ 2), pp 59-79.35 See C Pazarbasioglu et al (2011), op cit; C W Calomiris and R J Herring (2013), op cit; N Chen, P Glasserman, B Nouri and M Pelger (2017), Contingent capital, tail risk, and debt- induced collapse, Review of Financial Studies 30 (11), pp 3921-3969.36 See Basel Committee on Banking Supervision (2017), High- level summary of Basel III reforms.37 See S Avdjiev et al (2017), op cit.
Deutsche Bundesbank Monthly Report March 2018 60

ing CET1 capital, partly because market de-
mand for CoCos could be low.
There are primarily three identifiable reasons
for issuing CoCo bonds. Their potential to qual-
ify as regulatory capital, especially as AT1 cap-
ital, has already been discussed as a first incen-
tive for their use. A second motive relates to
the coupon payments being tax deductible, as
against equity capital.38 Whether or not the
coupons are tax deductible depends on the
applicable national tax law. Generally, the
actual CoCo design has to emphasise its debt-
like nature, thus clearly delineating it from
equity instruments. This can be achieved, for
instance, by defining a threshold which would
see the trigger activated at a comparatively late
stage. This results in a trade- off between regu-
latory and tax- related considerations in the de-
sign of CoCo bonds. From a regulatory per-
spective, the tax treatment creates a perverse
incentive for the threshold to be set as low as
possible.39 In terms of eligibility as AT1 capital,
European regulators should give this problem
due consideration. In this context, the current
CET1 ratio of 5.125% seems too low and
should be raised.
The third motive for issuance discussed in the
literature is whether CoCo bonds generate
lower costs for banks than CET1 capital.40 Be-
sides their preferential tax treatment, one pos-
sible reason for such cost advantages is that,
until the trigger event occurs or the coupon
payment is suspended, the equity holders alone
bear the bank’s losses. However, it is uncertain
whether this cost advantage over CET1 capital
actually exists. CoCo bonds make their holders
senior participants in the bank’s losses, but cap
their participation in its profits through a fixed
coupon. This has to be offset by higher cou-
pons compared to senior debt. Even factoring
in low market liquidity, it is at least conceivable
that CoCo bonds could generate higher costs
for banks than CET1 capital. Analyses of banks
indicate that there are indeed price premiums
of this sort compared with equity in the mar-
ket.41
Impact across banks
Whether or not the potential effect of individ-
ual banks seeing an improvement in their loss
absorbing capacity can spill over to the banking
system as a whole also depends on the possi-
bility of undesirable side effects of the use of
CoCo bonds across banks occurring. The afore-
mentioned complexity of CoCo bonds not only
affects the universe and behaviour of issuers
and holders but also increases the risk that the
instrument is not fit for purpose and therefore
ultimately fails to achieve its intended effect.
Thus, for instance, the trigger could be mis-
timed, impairing loss absorbing capacity. In
addition, the increased issuance of CoCo bonds
with a write- down mechanism could impair the
incentive to manage and monitor risk.42 Even in
the absence of such design flaws, CoCo bonds
could transmit bank- specific risks to other
banks and financial market agents (eg insurers,
mutual funds and hedge funds).43 There are
two transmission channels. One is that CoCos
can create additional linkages among banks.44
The other is that information- based contagion
effects could occur.45
Additional linkages of issuers with banks and
other financial agents can give rise to undesir-
able effects in a variety of ways. As regards
CoCo bonds with a write- down mechanism,
holders take an immediate hit if the trigger
event occurs. Once the final write- down has
occurred, CoCo bond holders relinquish their
Trade- off between tax deductibility of coupons and supervisory requirements
Costs compared with CET1 capital
Potentially undesirable side effects of CoCos across banks
Undesirable effects caused by additional linkages
38 See C W Calomiris and R J Herring (2013), op cit.39 See the previous section on the current threshold de-sign of European CoCos. Large parts of the total issue vol-ume use the exact regulatory requirements as thresholds.40 See C W Calomiris and R J Herring (2013), op cit.41 For example, this is demonstrated by an oft cited com-parison of average CoCo yields and dividends by Bank of America Merrill Lynch; see, for instance, https:// www.usatoday24x7.com/ are- happy- days- in- credit- over- according- to- bofa- just- one- thing- matters/42 See the above discussion on the design of CoCo bonds.43 See A R Admati, P M DeMarzo, M F Hellwig and P Pflei-derer (2013), op cit; R W Greene (2016), op cit.44 See R W Greene (2016), op cit; C Koziol and J Lawrenz (2012), Contingent convertibles. Solving or seeding the next banking crisis?, Journal of Banking and Finance 36, pp 90-104.45 See S Chan and S van Wijnbergen (2015), op cit.
Deutsche Bundesbank Monthly Report
March 2018 61

claim to a coupon payment and especially to
the face value of the CoCo bond. These losses
eat into the holders’ balance sheet capital,
thereby impairing additional loss absorbing
capacity. In the case of conversion, however,
linkages through debt can create linkages
through equity, thereby involving the new
owners directly in the issuer’s entrepreneurial
risk. If the new owners are subject to stricter
investment restrictions here than in the case of
CoCos,46 the equity instruments created in this
manner would have to be sold. That could trig-
ger price volatility in the equity markets. These
linkages could pose a problem in both designs
in those cases where banks hold each other’s
CoCo bonds,47 potentially impairing the loss
absorbing capacity of all institutions involved.48
The occurrence of the trigger event or suspen-
sion by a bank of coupon payments can also
lead to information- based contagion effects.
Owing to similar risks and performance pat-
terns of various banks’ investments, these
banks can suffer simultaneous losses. Holders
of CoCo bonds could therefore see the occur-
rence of a trigger event at another bank as a
negative signal and fear a triggering of their
CoCos. The more highly correlated the risks
and performance patterns of the banks in-
volved are, the stronger this effect is. These
CoCo bond holders could respond by offload-
ing their holdings, which would generally put
pressure on prices in the CoCo bond market.49
Such signals could, by the same token, create
interactions with other markets. The sell- off
stimulus from the CoCo market could, for in-
stance, spill over to other debt, ultimately trig-
gering a bank run. Equity instruments could
additionally come under pressure. That has the
potential to create a conflict between bank-
specific and interbank effects of CoCo bonds:
triggering a bank’s CoCo bonds can increase
that institution’s individual loss absorbing cap-
acity, while at the same time having the afore-
mentioned adverse side effects on other banks.
In addition to the specific design of the bond,
the holder structure is another factor which is
decisive as to whether the use of CoCo bonds
can bring about undesirable effects. The rele-
vance of information- based contagion effects is
illustrated by the market turmoil caused in early
2016 by fears that one individual bank could sus-
pend its coupon payments. What this observa-
tion also shows is that this type of instrument is
not a suitable investment instrument for all po-
tential holders. In principle, the relatively high
potential yields that CoCo bonds appear, at first
glance, to offer compared to conventional bank
bonds lend them (especially in the current low-
interest- rate environment) a certain attraction as
a capital investment. Owing to their major scope
for discretion in their design features, CoCos are,
however, highly complex and opaque instru-
ments. They are fraught with numerous risks
(such as losses caused by write- downs or conver-
sion, or coupon cancellation), making them diffi-
cult to price. The European Securities and Mar-
kets Authority (ESMA)50 and the German Federal
Financial Supervisory Author ity (BaFin)51 there-
fore both have their doubts about the suitability
of these instruments for private investors. In-
Information- based contagion effects
Potential holders
46 For instance, the Solvency II insurance regulation re-gime (Article 68 of Delegated Regulation (EU) 2015/ 35) provides for a deduction rule under which insurers’ partici-pations in financial and credit institutions in excess of 10% of the insurer’s own funds have to be deducted from regu-latory basic own funds. Moreover, mutual funds can also pursue clearly defined contractual investment strategies which could likewise lead to selling- off following the con-version of a CoCo bond.47 See F Allen and D Gale (2000), Financial contagion, Journal of Political Economy, Vol 108, No 1, pp 1-33.48 As holders of eligible CoCo bonds, banks are required to treat these the same as other mutual bank equity inter-ests for regulatory purposes before they are triggered. The risk- weighted capital ratio is reduced owing either to an increase in risk- weighted assets or to a deduction from capital.49 See S Chan and S van Wijnbergen (2015), op cit.50 See ESMA (2014), Statement on potential risks associ-ated with investing in contingent convertible instruments.51 “Those investors who lack a profound understanding of the financial sector, the functioning of the bonds and, above all, banks’ regulatory own funds requirements […] should not invest in CoCo bonds. It is very difficult to esti-mate the inherent risks, particularly for retail investors. […In] view of their complex product structure, their pur-pose, the difficulties in valuing them and the potential con-flict of interest for banks, BaFin has considerable doubts as to whether CoCo bonds are a suitable product for retail investors. In general, they are not suitable for active distri-bution to retail clients.” https://www.bafin.de/SharedDocs/Veroeffentlichungen/EN/Fachartikel/2014/fa_bj_1410_coco-bonds_en.html;jsessionid= 8DE62A70A238B6A2D3F3CFC6F14961BA.2_cid298
Deutsche Bundesbank Monthly Report March 2018 62

deed, the sale of these products to retail invest-
ors is prohibited in the United Kingdom.52 By
contrast, banks and other institutional investors,
such as insurance companies and mutual funds,
fundamentally appear to be a more plausible
group of investors in CoCo bonds.53 Owing to
their business activities, these entities should
possess sufficient risk assessment and portfolio
diversification capacity. This should put them in a
better position to adequately understand CoCo
bonds and how they work and to act accord-
ingly. Nonetheless, even institutional investors
seem to find it difficult to price these bonds.54
Owing in particular to potential interaction
caused by mutual equity holdings between
banks, these seem, among institutional investors,
to be the least suited to holding CoCo bonds.
The present level of usage and the current
holder structure do not indicate a material haz-
ard posed by undesirable interbank side effects
of the use of CoCo bonds. As described above,
European CoCo bonds are held mostly by non-
euro area investors and European mutual
funds. Banks and insurers are virtually irrelevant
as direct holders of CoCo bonds.55 Owing to
the insufficient availability of data, it is currently
impossible to tell whether or not they may be
holding CoCos indirectly, such as through for-
eign central securities depositories (CSDs). In
addition, the holder structure can vary consid-
erably by region and on a case-by-case basis,
and is also subject to considerable change over
time. Against this background, it would appear
appropriate for supervisory authorities to moni-
tor trends in the CoCo bond market more
closely in order to identify, in a timely manner,
potential undesirable effects, both for individ-
ual banks as well as across banks.
Conclusion
Following on from the 2007-08 financial crisis,
policymakers, regulators and academic re-
searchers all called for a strengthening of the
quantity and quality of bank capital. This was
to ensure that banks held sufficient loss ab-
sorbing capital in order to continue as a going
concern, while at the same time enhancing
banks’ stability. In the meantime, banks have
made major strides in increasing their capital
ratios, both by accumulating additional CET1
capital and by reducing their risk- weighted
assets.
CoCo bonds, a form of hybrid capital instru-
ment, can be recognised under certain condi-
tions as regulatory AT1 or T2 capital. The spe-
cific design of these highly complex instruments
is what ultimately determines whether CoCo
bonds will be able to meet expectations.
The actual design of CoCo bonds gives rise to
doubts about their effectiveness for banks as a
loss absorbing instrument on a going- concern
basis. It is particularly the low CET1 thresholds
seen in practice, below which a conversion or
write- down is triggered, which could temper
the effectiveness of this instrument. Regulatory
capital requirements could be undershot even
before the occurrence of the trigger events
enshrined in the CoCo bond contracts. This
would require authorities to intervene in banks’
business operations even prior to the contract-
ual conversion or write- down of CoCos. In
order to address this issue, the regulatory
require ments governing AT1 instruments in the
EU should be tightened.56 In particular, it
should be examined how much the mechanical
CET1 threshold has to be raised in order to
Current holder structure
52 See Financial Conduct Authority, Restrictions in relation to the retail distribution of contingent convertible instru-ments, 9 December 2016, https://www.fca.org.uk/publications/temporary-product-interventions/restrictions-relation-retail-distribution-contingent53 See S Avdjiev et al (2017), op cit.54 Even rating agencies seem to find it difficult thus far to reliably price CoCo bonds. See G Pennacchi, T Vermaelen and C C P Wolff (2014), Contingent capital: the case of CO-ERCs, Journal of Financial and Quantitative Analysis, Vol 49 (3), pp 541-574; A Delivorias (2016), Contingent convert-ible securities: is a storm brewing?, European Parliament Research Service Briefing, May 2016.55 See M A Boermans and S van Wijnbergen (2018), op cit.56 Such an adjustment would also be covered by the agreements contained in the Basel III framework, which do not set any quantitative parameters for the trigger thresh-old. See Basel Committee on Banking Supervision (2010), Basel III: a global regulatory framework for more resilient banks and banking systems, pp 14-19.
Deutsche Bundesbank Monthly Report
March 2018 63

ensure that CoCo bonds have the effect regula-
tors intend – to act as a loss absorbing instru-
ment for banks on a going- concern basis.
The CoCo bond designs currently observable
also provide grounds for doubt as to whether
these instruments will meet additional expect-
ations. The extent to which, as intended, in-
centives for banks to improve risk management
and monitoring are being set appears question-
able. Banks’ management could have an incen-
tive to take even more risk, in fact. This is to be
feared with regard to CoCo bonds with both a
write- down mechanism and conversion with a
small degree of dilution.
Moreover, CoCo bonds could also trigger un-
desirable effects across banks. One key reason
is additional linkages within the banking sector
and between banks and other institutional in-
vestors, which could be created by the holding
of CoCo bonds. According to available, albeit
patchy information, this cannot yet be empiric-
ally confirmed for the EU. Another key reason is
the possibility of information- based contagion,
which can appear in particular where similar
risks and performance patterns of the assets
held by individual issuers exist. If a trigger event
occurs with one issuer, this can be understood
as a negative signal for other banks in the
CoCo bond market and beyond. It is conse-
quently conceivable that individual banks’ at-
tempt to increase their loss absorbing capital
by issuing CoCo bonds could unleash undesir-
able effects across banks, all the more if the
high issue volumes cited in the relevant litera-
ture as essential to the effective use of CoCo
bonds are actually achieved.
On the whole, the assumed advantages of
CoCo bonds over CET1 capital are dubious. It is
unclear, for instance, whether the cost advan-
tage of CoCos over CET1 capital discussed in
the literature truly exists. Bearing in mind the
highly complex nature, and the risks, of CoCo
bonds, if correctly valued they could even be
more expensive for the issuer than CET1 capital
despite the tax advantage. At all events, any
cost advantage of CoCo bonds resulting purely
from preferential tax treatment compared to
CET1 capital and from preferential regulatory
treatment compared to straight debt is not suf-
ficient justification for their use. From a regula-
tory point of view, the primary benefit of using
CoCos derives from their ability to absorb
losses. As they are currently being imple-
mented, with low CET1 thresholds for con-
version or write- down, this is probably not
assured . Therefore, regulatory incentives to use
CoCo bonds should be examined critically and,
in future, be geared more closely to their in-
tended effects. Given the complexity and the
possibility of adverse side effects across banks,
however, regulatory incentives to use CoCo
bonds do not appear appropriate at present.
Instead, focusing on CET1 capital is likely to be
the more expedient approach in the long term
to safeguarding and improving the stability of
banks.
Deutsche Bundesbank Monthly Report March 2018 64

Statistical Section
Deutsche Bundesbank Monthly Report
March 2018 1•

Contents
I Key economic data for the euro area
1 Monetary developments and interest rates ................................................................... 5•
2 External transactions and positions ............................................................................... 5•
3 General economic indicators ........................................................................................ 6•
II Overall monetary survey in the euro area
1 The money stock and its counterparts .......................................................................... 8•
2 Consolidated balance sheet of monetary financial institutions (MFIs) ............................ 10•
3 Banking system’s liquidity position ................................................................................ 14•
III Consolidated financial statement of the Eurosystem
1 Assets ........................................................................................................................... 16•
2 Liabilities ...................................................................................................................... 18•
IV Banks
1 Assets and liabilities of monetary financial institutions (excluding the Bundesbank)
in Germany .................................................................................................................. 20•
2 Principal assets and liabilities of banks (MFIs) in Germany, by category of banks ........... 24•
3 Assets and liabilities of banks (MFIs) in Germany vis-à-vis residents ............................... 26•
4 Assets and liabilities of banks (MFIs) in Germany vis-à-vis non-residents ........................ 28•
5 Lending by banks (MFIs) in Germany to domestic non-banks (non-MFIs) ...................... 30•
6 Lending by banks (MFIs) in Germany to domestic enterprises and households, housing
loans, sectors of economic activity ............................................................................... 32•
7 Deposits of domestic non-banks (non-MFIs) at banks (MFIs) in Germany ...................... 34•
8 Deposits of domestic households and non-profit institutions at banks (MFIs) in
Germany ...................................................................................................................... 36•
9 Deposits of domestic government at banks (MFIs) in Germany, by creditor group ......... 36•
10 Savings deposits and bank savings bonds of banks (MFIs) in Germany sold to
non-banks (non-MFIs) ................................................................................................... 38•
11 Debt securities and money market paper outstanding of banks (MFIs) in Germany ....... 38•
12 Building and loan associations (MFIs) in Germany ......................................................... 39•
13 Assets and liabilities of the foreign branches and foreign subsidiaries of
German banks (MFIs) .................................................................................................... 40•
Deutsche Bundesbank Monthly Report March 2018 2•

V Minimum reserves
1 Reserve maintenance in the euro area .......................................................................... 42•
2 Reserve maintenance in Germany ................................................................................. 42•
VI Interest rates
1 ECB interest rates ......................................................................................................... 43•
2 Base rates ..................................................................................................................... 43•
3 Eurosystem monetary policy operations allotted through tenders ................................. 43•
4 Money market rates, by month .................................................................................... 43•
5 Interest rates and volumes for outstanding amounts and new business of
German banks (MFIs) .................................................................................................... 44•
VII Insurance corporations and pension funds
1 Assets ........................................................................................................................... 48•
2 Liabilities ...................................................................................................................... 49•
VIII Capital market
1 Sales and purchases of debt securities and shares in Germany ...................................... 50•
2 Sales of debt securities issued by residents ................................................................... 51•
3 Amounts outstanding of debt securities issued by residents .......................................... 52•
4 Shares in circulation issued by residents ........................................................................ 52•
5 Yields and indices on German securities ....................................................................... 53•
6 Sales and purchases of mutual fund shares in Germany ................................................ 53•
IX Financial accounts
1 Acquisition of financial assets and external financing of non-financial corporations ...... 54•
2 Financial assets and liabilities of non-financial corporations .......................................... 55•
3 Acquisition of financial assets and external financing of households ............................. 56•
4 Financial assets and liabilities of households ................................................................. 57•
X Public finances in Germany
1 General government: deficit/surplus and debt level as defined in the Maastricht Treaty.... 58•
2 General government: revenue, expenditure and deficit/surplus as shown in the
national accounts ......................................................................................................... 58•
3 General government: budgetary development (as per government’s financial statistics) 59•
4 Central, state and local government: budgetary development ...................................... 59•
5 Central, state and local government: tax revenue ......................................................... 60•
Deutsche Bundesbank Monthly Report
March 2018 3•

6 Central and state government and European Union: tax revenue, by type .................... 60•
7 Central, state and local government: individual taxes .................................................... 61•
8 German pension insurance scheme: budgetary development and assets ....................... 61•
9 Federal Employment Agency: budgetary development .................................................. 62•
10 Statutory health insurance scheme: budgetary development......................................... 62•
11 Statutory long-term care insurance scheme: budgetary development ........................... 63•
12 Central government: borrowing in the market .............................................................. 63•
13 General government: debt by creditor .......................................................................... 63•
14 Central, state and local government: debt by category ................................................. 64•
XI Economic conditions in Germany
1 Origin and use of domestic product, distribution of national income ............................ 65•
2 Output in the production sector ................................................................................... 66•
3 Orders received by industry .......................................................................................... 67•
4 Orders received by construction ................................................................................... 68•
5 Retail trade turnover, sales of motor vehicles ................................................................ 68•
6 Labour market .............................................................................................................. 69•
7 Prices ........................................................................................................................... 70•
8 Households’ income ..................................................................................................... 71•
9 Negotiated pay rates (overall economy) ........................................................................ 71•
10 Assets, equity and liabilities of listed non-financial groups ............................................ 72•
11 Revenues and operating income of listed non-financial groups ..................................... 73•
XII External sector
1 Major items of the balance of payments of the euro area ............................................ 74•
2 Major items of the balance of payments of the Federal Republic of Germany ............... 75•
3 Foreign trade (special trade) of the Federal Republic of Germany, by country and
group of countries ........................................................................................................ 76•
4 Services and Primary income of the Federal Republic of Germany ................................. 77•
5 Secondary income of the Federal Republic of Germany ................................................ 77•
6 Capital account of the Federal Republic of Germany ..................................................... 77•
7 Financial account of the Federal Republic of Germany .................................................. 78•
8 External position of the Bundesbank ............................................................................. 79•
9 Assets and liabilities of enterprises in Germany (other than banks) vis-à-vis
non-residents ............................................................................................................... 80•
10 ECB’s euro foreign exchange reference rates of selected currencies .............................. 81•
11 Euro-area member states and irrevocable euro conversion rates in the third stage
of European Economic and Monetary Union ................................................................ 81•
12 Effective exchange rates of the euro and indicators of the German economy’s price
competitiveness ............................................................................................................ 82•
Deutsche Bundesbank Monthly Report March 2018 4•

Deutsche Bundesbank
5
Monthly Report
March 2018
I Key economic data for the euro area 1 Monetary developments and interest rates
Money stock in various definitions 1,2 Determinants of the money stock 1 Interest rates
M 3 3 MFI lending to Yield on Euro-
3-month enterprises Monetary pean govern-MFI lending, and capital 3-month ment bondsmoving average
M1 M2 (centred) total households formation 4 Eonia 5,7 Euribor 6,7 outstanding 8
Period Annual percentage change % Annual percentage as a monthly average
2016 May 9.1 5.1 4.9 4.9 3.7 1.4 − 2.2 − 0.34 − 0.26 0.8 June 8.7 5.1 5.1 5.1 4.0 1.5 − 2.1 − 0.33 − 0.27 0.7
July 8.7 5.1 5.2 5.1 3.9 1.3 − 2.4 − 0.33 − 0.29 0.6 Aug 8.6 5.0 5.0 5.1 3.9 1.6 − 2.3 − 0.34 − 0.30 0.5 Sep 8.3 5.0 5.0 4.8 4.0 1.9 − 2.2 − 0.34 − 0.30 0.6
Oct 8.0 4.6 4.5 4.7 4.3 2.2 − 1.6 − 0.35 − 0.31 0.7 Nov 8.5 4.8 4.7 4.7 4.4 2.2 − 1.5 − 0.35 − 0.31 1.0 Dec 8.8 4.8 5.0 4.8 4.7 2.4 − 1.6 − 0.35 − 0.32 1.0
2017 Jan 8.4 4.6 4.7 4.8 4.5 2.4 − 1.4 − 0.35 − 0.33 1.1 Feb 8.4 4.7 4.6 4.8 4.3 2.2 − 1.0 − 0.35 − 0.33 1.2 Mar 9.0 5.0 5.1 4.8 4.8 2.8 − 1.1 − 0.35 − 0.33 1.2
Apr 9.2 5.0 4.8 4.9 4.5 2.6 − 1.4 − 0.36 − 0.33 1.1 May 9.2 5.1 4.9 4.8 4.3 2.6 − 1.2 − 0.36 − 0.33 1.1 June 9.6 5.2 4.8 4.8 4.2 2.8 − 1.1 − 0.36 − 0.33 1.0
July 9.2 5.0 4.5 4.8 3.9 2.6 − 0.8 − 0.36 − 0.33 1.2 Aug 9.6 5.4 5.0 4.9 3.8 2.3 − 0.8 − 0.36 − 0.33 1.0 Sep 9.9 5.4 5.2 5.1 3.9 2.5 − 0.7 − 0.36 − 0.33 1.0
Oct 9.5 5.4 5.0 5.0 3.8 2.6 − 1.3 − 0.36 − 0.33 1.1 Nov 9.2 5.3 4.9 4.8 3.9 2.9 − 1.2 − 0.35 − 0.33 0.9 Dec 8.7 5.1 4.6 4.7 3.6 2.6 − 1.1 − 0.34 − 0.33 0.9
2018 Jan 8.9 5.3 4.6 ... 3.5 2.9 − 0.8 − 0.36 − 0.33 1.1 Feb ... ... ... ... ... ... ... − 0.36 − 0.33 1.2
1 Source: ECB. 2 Seasonally adjusted. 3 Excluding money market fund shares/units, OverNight Index Average. 6 Euro Interbank Offered Rate. 7 See also footnotes tomoney market paper and debt securities with a maturity of up to two years held by Table VI.4, p 43 8 GDP-weighted yield on ten-year government bonds. Countriesnon-euro-area residents. 4 Longer-term liabilities to euro-area non-MFIs. 5 Euro include:DE,FR,NL,BE,AT,FI,IE,PT,ES,IT,GR,SK.
2 External transactions and positions *
Selected items of the euro-area balance of payments Euro exchange rates 1
Current account Financial account Effective exchange rate 3
of which Direct Portfolio Financial Other ReserveBalance Goods Balance investment investment investment assets Dollar rate Nominal Realderivatives 2
Period € million Q1 1999 = 1001 EUR = ... USD
2016 May + 18,451 + 32,635 + 20,637 + 22,024 + 692 − 14,460 + 9,269 + 3,113 1.1311 94.6 89.9 June + 38,432 + 39,130 + 21,352 + 441 + 399 − 10,507 + 30,394 + 625 1.1229 94.4 89.7
July + 34,064 + 33,814 + 20,275 + 16,364 + 44,592 + 12,999 − 52,738 − 942 1.1069 94.6 89.8 Aug + 24,225 + 25,247 + 36,314 + 36,165 + 54,943 + 6,248 − 63,016 + 1,974 1.1212 94.9 90.0 Sep + 36,416 + 33,600 + 61,444 + 75,335 + 21,913 + 4,333 − 46,882 + 6,746 1.1212 95.1 90.1
Oct + 34,178 + 28,338 + 16,836 + 21,989 + 44,325 + 6,346 − 51,876 − 3,949 1.1026 95.1 90.3 Nov + 37,311 + 34,182 + 6,029 − 251 − 27,345 + 2,918 + 28,161 + 2,545 1.0799 94.6 89.6 Dec + 45,185 + 33,239 + 76,341 + 56,256 + 18,499 + 6,620 − 11,081 + 6,046 1.0543 93.7 88.9
2017 Jan − 361 + 7,175 + 5,685 + 6,488 − 4,530 + 6,954 + 1,817 − 5,043 1.0614 93.9 89.1 Feb + 25,041 + 25,573 + 24,978 + 29,164 + 54,508 + 7,418 − 68,156 + 2,044 1.0643 93.4 88.8 Mar + 45,751 + 37,850 + 38,773 − 37,535 + 49,269 + 8,802 + 17,518 + 719 1.0685 94.0 89.2
Apr + 20,037 + 24,870 + 15,786 + 31,152 + 18,172 + 2,433 − 31,829 − 4,142 1.0723 93.7 89.0 May + 16,196 + 29,774 + 6,689 + 20,958 − 21,586 + 3,792 + 2,394 + 1,132 1.1058 95.6 90.5 June + 34,535 + 34,630 + 39,912 − 43,315 + 29,400 − 8,570 + 60,959 + 1,438 1.1229 96.3 91.2
July + 43,265 + 32,684 + 56,698 + 5,454 + 28,625 − 2,651 + 30,464 − 5,194 1.1511 97.6 92.4 Aug + 39,200 + 26,276 + 37,502 − 7,563 + 89,942 − 5,073 − 39,123 − 682 1.1807 99.0 93.6 Sep + 46,578 + 36,338 + 68,037 + 18,013 + 29,812 − 2,930 + 16,722 + 6,421 1.1915 99.0 93.6
Oct + 35,474 + 27,376 + 37,307 + 28,312 + 46,626 − 232 − 34,746 − 2,653 1.1756 98.6 93.1 Nov + 40,093 + 34,450 + 35,583 − 17,158 + 32,745 + 543 + 13,131 + 6,322 1.1738 98.5 93.0 Dec + 45,811 + 30,082 + 45,599 − 33,459 + 31,938 − 1,441 + 50,183 − 1,623 1.1836 98.8 93.3
2018 Jan ... ... ... ... ... ... ... ... 1.2200 99.4 p 93.9 Feb ... ... ... ... ... ... ... ... 1.2348 99.6 p 93.9
* Source: ECB, according to the international standards of the Balance of Payments XII.10 and 12, pp 81−82 2 Including employee stock options. 3 Vis-à-vis theManual in the 6th edition of the International Monetary Fund. 1 See also Tables currencies of The-EER-19 group.

Deutsche Bundesbank
6
Monthly Report
March 2018
I Key economic data for the euro area
3 General economic indicators
Period Euro area Belgium Germany Estonia Finland France Greece Ireland Italy Latvia
Real gross domestic product 1,2
2015 2.1 1.4 1.7 1.7 0.1 1.1 − 0.3 25.6 1.0 3.02016 1.8 1.5 1.9 2.1 2.1 1.2 − 0.2 5.1 0.9 2.22017 2.3 1.7 2.2 4.9 ... 1.8 1.3 ... 1.5 4.6
2016 Q3 1.7 1.6 1.7 2.0 2.5 0.7 1.1 2.7 0.6 0.7 Q4 2.0 1.5 1.3 3.1 2.2 1.0 − 1.3 9.9 0.6 3.0
2017 Q1 2.1 1.8 3.4 4.4 4.1 1.6 0.7 5.1 2.0 4.1 Q2 2.4 1.5 1.0 5.7 3.0 1.2 1.4 6.3 1.2 4.0 Q3 2.7 1.6 2.2 4.2 2.4 2.1 1.4 10.5 1.4 5.8 Q4 2.7 1.8 2.3 5.0 2.6 2.4 1.8 ... 1.3 4.2
Industrial production 1,3
2015 2.7 − 0.0 0.8 0.1 − 1.1 1.5 1.0 36.9 1.1 3.42016 1.6 4.3 1.0 2.6 4.0 0.3 2.6 0.7 1.7 4.92017 2.9 p 3.1 p 3.4 8.0 3.5 2.5 4.8 p − 2.2 ... 8.4
2016 Q3 1.1 4.9 0.6 4.1 4.9 − 0.5 2.1 − 0.8 1.6 1.4 Q4 2.5 4.6 1.4 9.0 5.3 0.9 3.9 3.2 3.6 9.8
2017 Q1 1.3 1.6 1.0 10.7 5.4 1.0 9.9 − 6.0 1.6 8.6 Q2 2.7 3.6 3.1 12.5 2.6 1.8 3.4 − 1.1 2.9 9.2 Q3 3.6 4.5 4.3 4.4 2.4 3.1 4.5 − 3.4 4.0 11.4 Q4 4.2 p 2.7 p 5.0 4.9 3.6 4.0 1.9 p 1.6 ... 4.9
Capacity utilisation in industry 4
2015 81.3 79.7 84.5 71.4 79.2 82.7 66.2 − 75.5 71.52016 81.8 80.0 85.0 73.6 78.0 83.2 67.6 − 76.3 72.62017 83.0 81.8 86.5 74.9 82.3 84.7 70.0 − 76.8 74.5
2016 Q4 82.3 80.9 85.7 75.0 80.6 83.6 69.3 − 75.7 73.1
2017 Q1 82.5 80.7 85.9 74.4 81.0 84.6 68.6 − 76.5 74.5 Q2 82.6 81.4 86.0 76.4 82.1 84.3 68.1 − 76.0 74.8 Q3 83.2 82.0 86.7 73.9 82.6 84.7 72.0 − 77.0 74.5 Q4 83.8 82.9 87.2 74.8 83.6 85.2 71.2 − 77.6 74.2
2018 Q1 84.4 82.1 88.0 75.5 83.1 86.2 70.4 − 78.3 75.8
Standardised unemployment rate 5
2015 10.9 8.5 4.6 6.2 9.4 10.4 24.9 10.0 11.9 9.92016 10.0 7.8 4.1 6.8 8.8 10.1 23.6 8.4 11.7 9.62017 9.1 7.2 3.8 5.8 8.6 9.4 ... 6.7 ... 8.7
2017 Sep 8.9 7.0 3.7 5.8 8.6 9.4 20.9 6.6 11.1 8.4
Oct 8.8 6.8 3.8 5.2 8.5 9.2 20.9 6.5 11.1 8.3 Nov 8.7 6.7 3.5 5.4 8.6 9.1 20.9 6.4 11.1 8.3 Dec 8.6 6.6 3.6 5.5 8.6 9.0 ... 6.2 10.9 8.3
2018 Jan 8.6 6.6 3.5 ... 8.5 9.0 ... 6.1 11.1 8.3 Feb ... ... ... ... ... ... ... 6.0 ... ...
Harmonised Index of Consumer Prices 1
2015 6 0.0 0.6 0.1 0.1 − 0.2 0.1 − 1.1 0.0 0.1 0.22016 0.2 1.8 0.4 0.8 0.4 0.3 0.0 − 0.2 − 0.1 0.12017 1.5 2.2 1.7 3.7 0.8 1.2 1.1 0.3 1.3 2.9
2017 Sep 1.5 2.0 1.8 3.9 0.8 1.1 1.0 0.2 1.3 3.0
Oct 1.4 1.8 1.5 4.0 0.5 1.2 0.5 0.5 1.1 2.7 Nov 1.5 2.1 1.8 4.5 0.9 1.2 1.1 0.5 1.1 2.7 Dec 1.4 2.1 1.6 3.8 0.5 1.2 1.0 0.5 1.0 2.2
2018 Jan 1.3 1.8 1.4 3.6 0.8 1.5 0.2 0.3 1.2 2.0 Feb e 1.2 1.5 1.2 3.2 0.6 ... 0.4 ... e 0.7 1.8
General government financial balance 7
2015 − 2.1 − 2.5 0.6 0.1 − 2.7 − 3.6 − 5.7 − 1.9 − 2.6 − 1.22016 − 1.5 − 2.5 0.8 − 0.3 − 1.7 − 3.4 0.5 − 0.7 − 2.5 0.02017 ... ... 1.1 ... ... ... ... ... ... ...
General government debt 7
2014 91.8 106.8 74.6 10.7 60.2 95.0 179.0 104.5 131.8 40.92015 89.9 106.0 70.9 10.0 63.6 95.8 176.8 76.9 131.5 36.92016 88.9 105.7 68.1 9.4 63.1 96.5 180.8 72.8 132.0 40.6
Sources: National data, European Commission, Eurostat, European Central Bank. 4 Manufacturing, in %; seasonally adjusted; data are collected in January, April, JulyLatest data are partly based on press reports and are provisional. 1 Annual and October. 5 As a percentage of the civilian labour force;percentage change. 2 GDP of the euro area calculated from seasonally adjusted seasonally adjusted. Standardised unemployment rate of Germany:data. 3 Manufacturing, mining and energy; adjusted for working-day variations. Bundesbank calculation based on unadjusted data from the Federal Statistical Office.

Deutsche Bundesbank
7
Monthly Report
March 2018
I Key economic data for the euro area
Lithuania Luxembourg Malta Netherlands Austria Portugal Slovakia Slovenia Spain Cyprus Period
Real gross domestic product 1,2
2.0 2.9 9.9 2.3 1.1 1.8 3.9 2.3 3.4 2.0 20152.3 3.1 5.5 2.2 1.4 1.6 3.3 3.1 3.3 3.0 20163.8 ... 6.6 3.1 2.9 2.7 3.4 5.0 3.0 . 2017
1.8 5.0 4.9 2.4 1.0 2.1 2.7 3.4 3.3 3.4 2016 Q33.6 4.3 5.7 2.4 1.1 1.9 3.2 3.5 2.5 3.9 Q4
4.2 3.8 6.8 3.2 3.1 3.2 3.0 5.0 2.8 3.8 2017 Q14.1 2.0 7.6 3.3 2.6 2.9 3.7 4.5 3.4 4.0 Q23.2 3.2 7.6 3.0 3.1 2.2 3.4 4.5 2.9 3.8 Q33.9 ... 4.3 2.9 2.9 2.4 3.5 6.0 3.0 3.9 Q4
Industrial production 1,3
4.2 1.1 6.3 − 3.3 2.1 2.1 7.3 5.1 3.4 3.4 20152.8 0.2 − 4.7 2.2 2.8 2.4 4.8 7.8 1.7 7.9 20166.8 − 0.1 4.1 2.0 p 4.2 3.5 4.1 p 8.0 3.3 p 7.9 2017
3.5 − 0.7 − 4.7 3.4 1.4 1.6 3.0 7.8 0.3 6.1 2016 Q32.9 − 1.7 − 2.5 5.5 4.4 1.6 4.1 9.3 1.8 7.1 Q4
5.1 − 3.8 6.8 2.3 2.1 3.4 7.8 6.4 1.9 9.0 2017 Q16.2 − 0.1 3.5 1.4 3.6 2.4 1.8 7.1 2.7 5.3 Q28.7 3.0 5.3 2.2 6.0 5.7 3.3 8.0 3.1 7.6 Q37.0 0.9 0.9 2.1 p 5.0 2.8 3.7 p 10.6 5.4 p 9.9 Q4
Capacity utilisation in industry 4
74.2 68.3 78.6 81.8 84.0 80.4 82.4 83.6 77.8 58.2 201575.9 76.9 79.1 81.7 84.3 80.2 84.5 83.5 78.6 59.8 201677.2 81.5 80.3 82.5 86.7 80.4 85.3 85.1 78.7 59.1 2017
76.0 81.3 79.9 82.1 85.1 80.3 85.4 84.1 79.1 59.6 2016 Q4
76.5 82.6 79.3 81.4 85.1 79.8 87.1 84.5 78.8 58.1 2017 Q177.4 82.1 79.1 82.5 86.6 79.1 86.5 85.4 78.1 57.6 Q277.6 80.1 80.0 83.1 86.9 80.9 84.4 85.1 78.7 61.5 Q377.4 81.1 82.8 83.1 88.0 81.7 83.0 85.2 79.1 59.1 Q4
77.8 83.1 77.5 83.9 88.8 81.6 83.7 85.0 79.7 60.4 2018 Q1
Standardised unemployment rate 5
9.1 6.5 5.4 6.9 5.7 12.6 11.5 9.0 22.1 15.0 20157.9 6.3 4.7 6.0 6.0 11.2 9.7 8.0 19.6 13.0 20167.1 5.6 4.0 4.9 5.5 9.0 8.1 6.8 17.2 11.1 2017
6.9 5.5 3.9 4.7 5.4 8.5 7.9 6.6 16.7 10.1 2017 Sep
6.7 5.4 3.6 4.5 5.4 8.4 7.7 6.5 16.7 10.1 Oct 6.7 5.4 3.6 4.4 5.5 8.1 7.6 6.4 16.6 10.3 Nov 6.8 5.4 3.6 4.4 5.5 8.0 7.5 6.2 16.4 10.3 Dec
7.3 5.3 3.5 4.2 5.5 7.9 7.5 5.9 16.3 9.8 2018 Jan ... ... ... ... ... ... ... ... ... ... Feb
Harmonised Index of Consumer Prices 1
− 0.7 0.1 1.2 0.2 0.8 0.5 − 0.3 − 0.8 − 0.6 − 1.5 20150.7 0.0 0.9 0.1 1.0 0.6 − 0.5 − 0.2 − 0.3 − 1.2 20163.7 2.1 1.3 1.3 2.2 1.6 1.4 1.6 2.0 0.7 2017
4.6 2.0 1.2 1.4 2.5 1.6 1.8 1.4 1.8 0.1 2017 Sep
4.2 2.0 1.5 1.3 2.4 1.9 1.8 1.3 1.7 0.4 Oct 4.2 2.0 1.5 1.5 2.4 1.8 2.1 1.4 1.8 0.2 Nov 3.8 1.6 1.3 1.2 2.3 1.6 2.0 1.9 1.2 − 0.4 Dec
3.6 1.3 1.2 1.5 1.9 1.1 2.6 1.7 0.7 − 1.5 2018 Jan 3.2 1.1 1.3 1.3 ... 0.7 2.2 1.4 1.2 − 0.4 Feb
General government financial balance 7
− 0.2 1.4 − 1.1 − 2.1 − 1.0 − 4.4 − 2.7 − 2.9 − 5.3 − 1.2 20150.3 1.6 1.1 0.4 − 1.6 − 2.0 − 2.2 − 1.9 − 4.5 0.5 2016
... ... ... ... ... ... ... ... ... ... 2017
General government debt 7
40.5 22.7 63.8 68.0 83.8 130.6 53.5 80.3 100.4 107.5 201442.6 22.0 60.3 64.6 84.3 128.8 52.3 82.6 99.4 107.5 201540.1 20.8 57.6 61.8 83.6 130.1 51.8 78.5 99.0 107.1 2016
6 Including Lithuania from 2015 onwards. 7 As a percentage of GDP (Maastricht procedure (Eurostat). Germany: current data according to the Federal StatisticalTreaty definition). Euro area: European Central Bank, regularly updated. Member Office and Bundesbank calculations. states excluding Germany: latest data publication under the excessive deficit

Deutsche Bundesbank
8
Monthly Report
March 2018
II Overall monetary survey in the euro area
1 The money stock and its counterparts *(a) Euro area
€ billion
I Lending to non-banks (non-MFIs) II Net claims on III Monetary capital formation at monetaryin the euro area non-euro-area residents financial institutions (MFIs) in the euro area
Enterprises Generaland households government Debt
Deposits securitiesLiabil- with an Deposits with
Claims ities to agreed at agreed maturitieson non- non-euro- maturity notice of of over Capital
of which of which euro-area area of over over 2 years andPeriod Total Total Total Total residents residents Total 2 years 3 months (net) 2 Securities Securities reserves 3
2016 June 55.6 5.1 − 7.0 50.5 62.1 31.2 − 23.2 − 54.4 − 10.3 − 20.8 − 0.8 − 10.3 21.6
July 54.5 29.5 14.7 25.0 24.1 − 84.9 56.9 141.8 − 25.4 − 7.1 − 0.5 − 23.8 6.0
Aug 17.3 16.9 27.1 0.4 9.0 − 39.7 7.8 47.5 2.0 − 4.9 − 0.6 − 0.3 7.9
Sep 41.8 26.6 − 7.3 15.2 19.4 − 16.9 − 69.0 − 52.0 − 22.9 − 12.2 − 0.5 − 19.6 9.4
Oct 84.9 37.3 5.6 47.6 45.1 − 45.5 153.8 199.3 4.7 − 5.6 − 0.6 − 2.6 13.5
Nov 105.8 55.8 16.1 50.0 61.9 7.3 − 21.5 − 28.7 0.3 − 7.9 − 0.8 − 1.1 10.0
Dec − 58.2 − 50.9 − 8.3 − 7.3 − 0.6 36.3 − 154.3 − 190.6 − 12.9 0.1 − 1.0 − 13.7 1.8
2017 Jan 131.2 43.6 31.3 87.6 69.7 − 12.8 233.5 246.4 − 13.9 − 9.9 − 0.2 − 3.7 − 0.2
Feb 45.8 30.6 4.0 15.2 35.3 − 45.6 53.4 99.0 13.5 − 6.1 − 0.5 − 3.3 23.3
Mar 151.6 92.8 25.3 58.8 62.6 − 8.8 − 51.7 − 43.0 − 13.7 1.8 − 0.5 − 22.2 7.2
Apr 54.8 24.6 20.2 30.1 27.6 − 39.4 77.6 117.0 − 22.6 − 12.2 − 0.3 − 1.1 − 9.0
May 50.7 26.1 16.3 24.6 35.1 − 0.4 − 4.2 − 3.8 18.1 − 5.4 − 2.4 16.6 9.3
June 24.7 30.0 0.4 − 5.3 − 5.3 58.2 − 108.5 − 166.6 − 3.9 − 12.9 − 0.1 − 6.7 15.9
July 7.1 0.1 15.3 7.0 9.4 6.2 105.0 98.8 − 5.6 − 7.8 − 0.9 − 1.5 4.6
Aug 11.9 − 20.5 − 15.0 32.4 38.4 − 28.0 − 2.6 25.4 6.3 − 5.9 − 0.8 − 2.7 15.8
Sep 58.4 46.7 − 13.8 11.7 17.1 6.4 − 35.3 − 41.7 − 20.6 − 8.7 − 0.9 − 30.6 19.6
Oct 64.8 53.2 − 9.4 11.7 11.4 − 71.0 88.5 159.5 − 31.2 − 27.2 − 0.6 − 7.9 4.6
Nov 127.2 98.8 22.1 28.4 34.7 18.5 − 1.1 − 19.6 3.6 4.5 − 0.8 − 2.5 2.3
Dec − 106.5 − 88.1 − 8.7 − 18.4 − 8.8 13.9 − 153.3 − 167.2 − 1.8 11.7 − 0.6 − 5.7 − 7.2
2018 Jan 120.8 79.9 24.2 40.9 28.1 − 44.2 154.8 199.0 6.2 − 10.8 − 0.2 17.5 − 0.4
(b) German contribution
I Lending to non-banks (non-MFIs) II Net claims on III Monetary capital formation at monetaryin the euro area non-euro-area residents financial institutions (MFIs) in the euro area
Enterprises Generaland households government Debt
Deposits securitiesLiabil- with an Deposits with
Claims ities to agreed at agreed maturitieson non- non-euro- maturity notice of of over Capital
of which of which euro-area area of over over 2 years andPeriod Total Total Total Total residents residents Total 2 years 3 months (net) 2 Securities Securities reserves 3
2016 June 4.7 1.7 0.5 2.9 8.6 − 2.9 23.9 26.8 − 3.5 − 1.5 − 0.7 − 7.5 6.2
July 30.2 13.3 1.6 16.9 13.8 − 18.4 7.1 25.5 − 6.0 − 0.8 − 0.9 − 5.4 1.1
Aug 11.1 8.9 1.5 2.2 4.0 − 16.5 2.5 19.0 2.0 − 1.8 − 0.8 3.9 0.6
Sep 24.6 13.2 3.4 11.4 12.6 − 37.2 − 11.1 26.1 − 7.2 − 1.1 − 0.7 − 6.2 0.9
Oct 21.5 11.8 2.6 9.6 6.5 − 3.2 42.4 45.7 7.1 2.2 − 0.8 5.8 − 0.2
Nov 28.1 18.4 4.4 9.7 14.4 − 22.4 − 25.7 − 3.3 9.2 − 0.6 − 0.5 9.6 0.8
Dec − 10.1 − 8.1 0.4 − 2.1 8.4 19.6 − 9.5 − 29.1 − 2.6 − 2.0 − 0.4 − 2.9 2.7
2017 Jan 23.6 15.0 2.3 8.6 8.5 − 24.4 31.8 56.2 9.8 − 3.1 − 0.7 15.9 − 2.3
Feb 17.3 12.5 3.9 4.9 5.5 − 30.2 7.5 37.8 − 1.4 − 1.4 − 0.6 − 0.1 0.8
Mar 18.2 12.7 1.8 5.5 9.5 − 3.6 6.3 9.9 2.7 − 1.0 − 0.5 − 1.3 5.5
Apr 14.9 7.8 − 1.5 7.1 5.4 − 19.0 − 7.3 11.6 9.3 − 3.5 − 0.5 1.3 11.9
May 13.8 13.3 3.5 0.6 7.9 7.1 − 13.0 − 20.1 2.7 − 0.1 − 0.4 1.8 1.4
June 11.8 11.5 6.2 0.4 2.6 22.7 16.2 − 6.4 6.0 − 2.0 − 0.4 2.8 5.6
July 18.1 12.8 1.8 5.3 3.5 − 10.3 − 23.0 − 12.7 − 4.0 − 1.3 − 0.8 − 1.4 − 0.5
Aug 13.6 10.2 − 0.6 3.4 8.3 14.7 − 13.8 − 28.5 4.5 0.1 − 0.8 3.5 1.7
Sep 17.8 14.1 − 1.8 3.7 8.0 − 22.3 9.2 31.5 − 5.9 − 0.2 − 0.6 − 7.3 2.3
Oct 15.9 8.6 0.4 7.3 6.5 6.1 − 11.4 − 17.5 − 11.4 − 1.0 − 0.8 − 9.5 − 0.1
Nov 27.2 16.7 6.4 10.5 11.2 23.1 − 2.6 − 25.7 2.6 3.3 − 0.6 0.1 − 0.1
Dec − 5.4 − 3.5 4.3 − 1.8 1.0 − 48.9 − 8.1 40.8 2.6 − 0.3 − 0.6 − 1.9 5.3
2018 Jan 19.2 21.4 2.2 − 2.2 − 1.3 10.3 28.5 18.2 5.0 − 3.1 − 0.7 14.3 − 5.6
* The data in this table are based on the consolidated balance sheet of monetary MFIs’ portfolios. 3 After deduction of inter-MFI participations. 4 Including the counter-financial institutions (MFIs) (Table II.2); statistical breaks have been eliminated from parts of monetary liabilities of central governments. 5 Including the monetarythe flow figures (see also the “Notes on the figures“ in the “Explanatory notes“ in the liabilities of central governments (Post Office, Treasury). 6 In Germany, only savingsStatistical Supplement to the Monthly Report 1, p 30 ). 1 Source: ECB. 2 Excluding deposits. 7 Paper held by residents outside the euro area has been eliminated.

Deutsche Bundesbank
9
Monthly Report
March 2018
II Overall monetary survey in the euro area
(a) Euro area
V Other factors VI Money stock M3 (balance I plus II less III less IV less V)
Money stock M2 Debt secur-of which ities withIntra- Money stock M1 maturitiesEurosystem Deposits of up toliability/ with an Deposits Money 2 years
IV De- claim agreed at agreed market (incl moneyposits of related to Currency maturity notice of Repo fund market
banknote in circu- Overnight of up to up to 3 transac- shares paper) central gov-ernments Total 4 issue Total Total Total lation deposits 5 2 years 5 tions (net) 2,7 Period(net) 2,7,8 months 5,6
60.5 17.7 − 19.0 31.4 34.7 8.4 26.3 − 1.9 − 1.4 2.5 − 9.6 5.9 2016 June
− 29.0 − 72.4 − 96.5 73.5 66.9 10.1 56.9 6.1 0.5 − 22.7 15.6 5.0 July
− 54.7 41.2 − − 10.9 − 8.9 − 5.1 − 3.5 − 1.6 − 4.5 0.7 2.4 0.6 − 2.5 Aug
2.7 42.7 − 2.4 18.3 23.7 2.2 21.5 1.4 − 6.7 − 4.8 − 1.8 − 5.9 Sep
− 3.0 7.0 − 30.7 14.4 50.2 3.2 47.0 − 29.6 − 6.2 − 16.9 18.0 2.1 Oct
5.1 20.3 − 87.4 82.7 95.0 1.2 93.7 − 10.3 − 1.9 − 2.2 7.0 1.2 Nov
− 48.3 − 12.4 − 51.7 72.1 90.1 16.1 74.0 − 24.4 6.4 4.4 − 6.0 − 7.3 Dec
62.7 41.8 − 27.9 6.2 − 6.4 − 11.9 5.5 3.0 9.7 − 17.4 11.6 − 0.9 2017 Jan
− 17.4 − 25.6 − 29.7 30.8 31.3 3.0 28.3 − 2.1 1.6 − 8.6 − 4.2 6.5 Feb
24.2 25.6 − 106.8 92.4 92.8 4.3 88.5 − 5.6 5.2 14.8 12.0 − 0.6 Mar
− 5.4 − 9.5 − 52.8 72.3 101.8 6.8 95.0 − 31.2 1.7 − 5.9 − 4.3 − 16.9 Apr
13.4 − 13.1 − 32.0 30.1 42.0 0.5 41.6 − 21.0 9.1 − 11.7 − 4.7 5.2 May
20.4 21.5 − 44.8 74.0 82.1 9.5 72.6 − 10.5 2.3 − 16.6 − 20.6 − 0.2 June
− 7.7 − 17.4 − 44.0 31.6 36.0 5.7 30.4 − 6.2 1.8 − 24.1 13.6 − 3.1 July
− 18.3 − 59.9 − 55.8 45.9 31.4 − 2.0 33.4 8.1 6.4 2.6 9.1 − 5.5 Aug
41.2 23.9 − 20.3 23.3 47.6 0.6 47.0 − 21.3 − 3.0 7.0 − 4.1 10.3 Sep
− 43.5 54.8 − 13.7 13.3 23.6 2.9 20.7 − 7.6 − 2.8 19.8 8.9 − 10.6 Oct
− 8.8 72.5 − 78.4 73.1 81.7 1.0 80.8 − 7.7 − 0.9 17.2 − 3.8 1.2 Nov
− 21.5 − 88.8 − 19.5 61.1 63.6 16.1 47.5 − 6.6 4.1 − 31.6 − 26.5 − 7.2 Dec
41.3 20.2 − 9.0 4.5 − 15.2 − 15.2 − 0.0 8.2 11.5 − 10.7 18.4 − 14.9 2018 Jan
(b) German contribution
V Other factors VI Money stock M3 (balance I plus II less III less IV less V) 10
of which Components of the money stock
Intra- Debt securitiesEurosystem Deposits withliability/ with an Deposits Money maturities
IV De- claim agreed at agreed market of up to 2 yearsposits of related to Currency maturity notice of Repo fund (incl money
banknote in circu- Overnight of up to up to 3 transac- shares market central gov-ernments Total issue 9,11 lation Total deposits 2 years months 6 tions (net) 7,8 paper)(net) 7 Period
13.0 − 7.9 4.2 1.5 0.2 2.0 − 0.7 − 0.4 − 1.0 0.0 0.4 2016 June
− 31.8 25.0 3.7 2.1 24.5 12.3 4.0 − 0.1 0.9 − 0.2 7.6 July
8.8 − 22.3 2.3 − 0.8 6.2 11.3 − 1.6 0.1 − 0.2 − 0.1 − 3.4 Aug
8.6 − 21.2 4.7 − 0.6 7.2 3.0 5.5 − 0.6 − 0.3 0.0 − 0.5 Sep
− 8.8 18.6 3.2 − 0.5 1.4 12.0 − 10.2 0.2 0.3 − 0.1 − 0.8 Oct
6.9 − 48.2 1.9 0.3 37.8 36.2 3.3 0.1 − 0.2 0.0 − 1.7 Nov
− 13.6 30.4 3.3 2.4 − 4.8 − 4.9 − 1.5 2.7 − 0.9 − 0.0 − 0.1 Dec
− 12.6 − 27.2 1.1 − 2.7 29.2 16.9 8.9 0.7 2.6 − 0.1 0.2 2017 Jan
− 4.2 − 18.9 1.7 1.2 11.6 13.6 − 2.4 0.7 − 0.3 − 0.0 0.0 Feb
14.2 − 2.7 1.8 1.1 0.5 2.4 3.5 − 1.4 − 1.9 − 0.1 − 2.0 Mar
− 6.7 − 8.9 3.3 1.6 2.3 10.3 − 7.1 − 0.0 0.9 − 0.0 − 1.8 Apr
7.7 − 8.7 2.9 − 0.7 19.2 18.3 1.3 − 0.1 − 1.1 − 0.0 0.8 May
7.1 0.7 4.7 0.9 20.7 20.6 0.7 − 0.7 − 0.6 0.1 0.6 June
2.5 14.8 2.1 2.1 − 5.6 − 3.0 − 3.0 − 0.4 1.4 − 0.1 − 0.6 July
7.4 5.1 3.7 − 1.3 11.2 14.7 − 2.9 − 0.3 0.1 0.2 − 0.5 Aug
9.6 − 14.2 3.5 − 0.3 5.9 5.6 0.8 0.0 − 0.8 0.0 0.3 Sep
− 14.2 43.1 2.1 0.8 4.5 14.3 − 9.3 0.5 − 0.3 − 0.3 − 0.5 Oct
6.2 8.7 1.2 − 0.0 32.7 33.8 − 1.7 0.2 0.3 0.0 0.2 Nov
10.0 − 58.0 3.8 2.0 − 8.8 − 10.1 0.4 2.4 0.7 − 0.3 − 1.8 Dec
− 24.3 35.8 − 0.0 − 2.8 13.1 11.9 2.2 0.1 1.0 − 0.0 − 2.2 2018 Jan
8 Less German MFIs’ holdings of paper issued by euro-area MFIs. 9 Including money stocks M1, M2 or M3. 11 The difference between the volume of euronational banknotes still in circulation. 10 The German contributions to the Euro- banknotes actually issued by the Bundesbank and the amount disclosed insystem’s monetary aggregates should on no account be interpreted as national accordance with the accounting regime chosen by the Eurosystem (see also footnotemonetary aggregates and are therefore not comparable with the erstwhile German 2 on banknote circulation in Table III.2).

Deutsche Bundesbank
10
Monthly Report
March 2018
II Overall monetary survey in the euro area
2 Consolidated balance sheet of monetary financial institutions (MFIs) *
Assets
Lending to non-banks (non-MFIs) in the euro area
Enterprises and households General government
ClaimsTotal Shares and on non-
End of assets or Debt other Debt euro-area Otheryear/month liabilities Total Total Loans securities 2 equities Total Loans securities 3 residents assets
Euro area (€ billion) 1
2015 Dec 25,850.8 16,541.4 12,703.0 10,627.4 1,296.3 779.3 3,838.4 1,110.2 2,728.2 5,034.5 4,274.8
2016 Jan 26,414.7 16,689.5 12,731.3 10,656.8 1,307.0 767.5 3,958.2 1,127.1 2,831.2 5,149.6 4,575.6 Feb 26,749.7 16,774.6 12,771.6 10,700.6 1,313.1 757.8 4,003.0 1,118.6 2,884.4 5,228.2 4,746.9 Mar 26,407.2 16,825.5 12,776.4 10,709.9 1,312.1 754.4 4,049.1 1,117.9 2,931.3 5,030.7 4,551.1
Apr 26,557.8 16,909.0 12,815.8 10,721.4 1,325.7 768.7 4,093.2 1,127.9 2,965.3 5,173.9 4,474.8 May 26,807.3 16,993.9 12,842.6 10,733.4 1,341.4 767.8 4,151.4 1,121.7 3,029.6 5,270.0 4,543.4 June 27,073.1 17,041.4 12,829.3 10,732.4 1,344.2 752.7 4,212.1 1,110.6 3,101.4 5,278.2 4,753.5
July 27,135.2 17,093.7 12,852.6 10,737.7 1,359.7 755.3 4,241.1 1,111.6 3,129.5 5,326.7 4,714.8 Aug 27,038.0 17,105.7 12,866.5 10,723.2 1,365.1 778.2 4,239.1 1,102.9 3,136.2 5,321.4 4,610.8 Sep 26,973.5 17,147.5 12,892.6 10,756.8 1,359.3 776.5 4,255.0 1,098.8 3,156.2 5,266.4 4,559.5
Oct 27,051.8 17,202.6 12,923.2 10,785.2 1,363.1 775.0 4,279.4 1,101.0 3,178.4 5,422.4 4,426.7 Nov 27,160.7 17,295.1 12,983.5 10,830.2 1,383.3 770.0 4,311.6 1,088.9 3,222.7 5,451.6 4,414.0 Dec 26,678.8 17,235.9 12,926.7 10,773.3 1,372.2 781.2 4,309.2 1,079.4 3,229.7 5,208.1 4,234.9
2017 Jan 26,759.6 17,318.8 12,957.9 10,778.1 1,393.4 786.4 4,360.9 1,097.4 3,263.6 5,377.4 4,063.4 Feb 27,021.4 17,379.7 12,995.7 10,808.2 1,398.4 789.0 4,384.1 1,076.2 3,307.8 5,497.8 4,143.9 Mar 26,973.6 17,512.1 13,078.2 10,864.6 1,423.7 789.9 4,434.0 1,072.8 3,361.2 5,418.0 4,043.5
Apr 27,062.6 17,557.2 13,092.8 10,860.0 1,429.8 803.0 4,464.3 1,075.4 3,388.9 5,450.3 4,055.1 May 26,980.9 17,596.9 13,109.8 10,860.4 1,451.1 798.3 4,487.1 1,062.4 3,424.7 5,360.7 4,023.3 June 26,662.2 17,576.1 13,097.8 10,860.2 1,441.3 796.3 4,478.3 1,063.0 3,415.2 5,195.9 3,890.1
July 26,616.3 17,570.2 13,084.9 10,832.1 1,460.1 792.6 4,485.3 1,060.3 3,425.1 5,228.0 3,818.1 Aug 26,649.4 17,576.5 13,053.3 10,819.2 1,444.2 789.9 4,523.2 1,054.5 3,468.6 5,198.8 3,874.1 Sep 26,531.0 17,624.6 13,099.4 10,875.1 1,433.2 791.2 4,525.1 1,045.9 3,479.2 5,170.9 3,735.5
Oct 26,730.5 17,702.6 13,159.0 10,937.9 1,422.8 798.3 4,543.6 1,046.1 3,497.5 5,292.8 3,735.2 Nov 26,761.0 17,815.8 13,241.7 11,007.2 1,430.8 803.8 4,574.1 1,038.2 3,535.9 5,247.3 3,697.8 Dec 26,331.5 17,711.7 13,170.9 10,946.5 1,425.5 798.9 4,540.8 1,028.5 3,512.3 5,064.7 3,555.1
2018 Jan 26,341.6 17,819.9 13,242.3 10,993.3 1,445.9 803.1 4,577.5 1,040.7 3,536.9 5,254.5 3,267.2
German contribution (€ billion)
2015 Dec 5,925.1 3,840.1 3,003.6 2,586.5 155.7 261.3 836.5 358.3 478.2 1,166.4 918.6
2016 Jan 6,057.8 3,858.2 3,004.8 2,592.8 154.8 257.3 853.4 362.0 491.4 1,191.2 1,008.3 Feb 6,155.3 3,874.9 3,014.0 2,607.0 151.1 255.9 860.9 362.0 498.9 1,209.7 1,070.8 Mar 6,060.6 3,885.5 3,015.6 2,607.8 151.8 256.0 869.9 361.6 508.3 1,163.7 1,011.4
Apr 6,050.2 3,908.3 3,026.3 2,617.8 152.2 256.3 882.1 366.1 515.9 1,181.7 960.2 May 6,091.2 3,934.7 3,043.0 2,629.7 153.3 260.0 891.7 362.8 528.9 1,187.1 969.4 June 6,221.2 3,939.7 3,042.5 2,629.1 152.9 260.5 897.2 357.3 540.0 1,221.3 1,060.1
July 6,245.6 3,968.5 3,054.3 2,639.3 155.3 259.7 914.2 360.3 553.8 1,228.3 1,048.8 Aug 6,218.9 3,977.8 3,062.7 2,646.2 155.3 261.2 915.1 358.5 556.6 1,226.9 1,014.2 Sep 6,202.1 4,001.8 3,075.1 2,655.3 157.6 262.1 926.8 357.2 569.5 1,215.0 985.4
Oct 6,208.1 4,019.0 3,087.3 2,664.9 161.9 260.5 931.7 360.3 571.4 1,260.2 928.9 Nov 6,186.1 4,046.1 3,107.1 2,680.4 165.0 261.7 939.0 355.5 583.5 1,243.2 896.8 Dec 6,131.1 4,037.0 3,099.2 2,671.7 164.0 263.6 937.8 345.2 592.6 1,234.7 859.4
2017 Jan 6,131.6 4,054.1 3,112.0 2,682.7 165.0 264.3 942.1 345.2 596.8 1,260.2 817.4 Feb 6,196.5 4,075.7 3,124.9 2,691.3 168.1 265.5 950.8 344.6 606.2 1,281.9 839.0 Mar 6,176.3 4,089.6 3,136.8 2,701.2 169.6 266.0 952.8 340.6 612.3 1,281.0 805.7
Apr 6,174.4 4,103.1 3,143.3 2,709.1 170.4 263.9 959.8 342.3 617.5 1,264.2 807.1 May 6,160.2 4,114.5 3,157.3 2,719.6 172.6 265.0 957.2 332.2 624.9 1,234.6 811.2 June 6,106.3 4,120.6 3,165.9 2,722.5 173.2 270.2 954.7 330.8 623.9 1,238.6 747.1
July 6,069.0 4,135.9 3,176.7 2,731.5 175.2 269.9 959.2 332.6 626.7 1,201.4 731.7 Aug 6,084.5 4,152.3 3,186.3 2,741.6 174.3 270.3 966.1 327.8 638.3 1,185.1 747.2 Sep 6,076.7 4,167.7 3,200.9 2,757.6 174.3 269.1 966.8 323.2 643.6 1,194.6 714.3
Oct 6,082.0 4,185.9 3,210.4 2,766.1 174.6 269.8 975.4 324.0 651.4 1,188.5 707.7 Nov 6,088.7 4,211.0 3,227.4 2,777.0 178.7 271.6 983.6 321.5 662.1 1,177.2 700.5 Dec 6,051.1 4,202.2 3,222.8 2,768.6 180.4 273.8 979.4 318.5 660.9 1,163.4 685.4
2018 Jan 6,074.8 4,215.0 3,242.6 2,786.5 181.8 274.2 972.4 316.9 655.4 1,176.4 683.4
* Monetary financial institutions (MFIs) comprise banks (including building and loan enterprises. 3 Including Treasury bills and other money market paper issued byassociations), money market funds, and the European Central Bank and national general government. 4 Euro currency in circulation (see also footnote 8 on p 12 )central banks (the Eurosystem). 1 Source: ECB. 2 Including money market paper of Excluding MFIs‘ cash in hand (in euro). The German contribution includes the volume

Deutsche Bundesbank
11
Monthly Report
March 2018
II Overall monetary survey in the euro area
Liabilities
Deposits of non-banks (non-MFIs) in the euro area
Enterprises and households
With agreed At agreedmaturities of notice of 6
overCurrency 1 year andin of which up to up to over up to over End of
Total in euro 5 Total Overnight 1 year 2 years 2 years 3 months 3 months year/monthcirculation 4
Euro area (€ billion) 1
1,048.9 11,486.9 10,813.9 10,922.8 5,326.1 981.5 343.8 2,083.3 2,112.9 75.2 2015 Dec
1,037.7 11,611.8 10,852.4 10,953.3 5,365.2 973.3 344.1 2,074.6 2,121.8 74.3 2016 Jan 1,038.9 11,621.1 10,871.9 10,976.1 5,385.2 967.8 340.6 2,085.3 2,124.1 73.1 Feb 1,042.5 11,686.5 10,916.7 11,007.2 5,418.9 973.3 339.8 2,076.3 2,126.7 72.3 Mar
1,047.1 11,715.7 10,978.1 11,072.9 5,504.4 963.0 337.5 2,071.0 2,126.5 70.5 Apr 1,049.3 11,766.9 11,005.9 11,092.6 5,545.2 945.2 331.9 2,066.3 2,134.0 70.0 May1,057.7 11,829.3 11,001.4 11,089.4 5,565.3 944.9 330.2 2,046.5 2,133.1 69.3 June
1,067.8 11,849.6 11,053.7 11,133.7 5,615.1 952.1 325.6 2,039.3 2,132.9 68.8 July1,064.3 11,783.5 11,037.8 11,120.8 5,611.4 952.6 320.7 2,034.0 2,134.1 68.1 Aug 1,066.5 11,788.9 11,032.4 11,130.6 5,637.1 960.1 315.0 2,021.8 2,129.2 67.4 Sep
1,069.7 11,797.5 11,047.9 11,134.7 5,680.7 936.8 307.6 2,018.8 2,123.8 67.2 Oct 1,071.0 11,882.2 11,107.7 11,212.3 5,780.1 926.7 303.3 2,013.9 2,121.8 66.4 Nov 1,087.1 11,891.9 11,173.9 11,283.8 5,827.0 910.5 294.0 2,014.1 2,172.7 65.6 Dec
1,075.1 11,947.4 11,153.8 11,268.7 5,824.3 913.0 286.6 1,997.7 2,182.1 65.0 2017 Jan 1,078.1 11,956.1 11,172.6 11,292.2 5,849.4 918.0 284.5 1,992.1 2,183.6 64.6 Feb 1,082.4 12,065.8 11,242.1 11,384.8 5,945.3 909.4 285.3 1,992.4 2,188.3 64.1 Mar
1,089.2 12,103.6 11,285.5 11,418.7 6,022.5 885.3 278.6 1,978.6 2,190.1 63.7 Apr 1,089.7 12,116.2 11,303.3 11,408.6 6,044.7 859.4 272.9 1,970.5 2,199.0 62.0 May1,099.1 12,178.7 11,348.6 11,448.2 6,113.4 852.6 265.6 1,953.2 2,201.6 61.9 June
1,104.7 12,175.9 11,359.1 11,442.6 6,125.2 847.2 262.7 1,942.9 2,206.2 58.4 July1,102.7 12,193.0 11,388.9 11,471.3 6,148.3 856.1 260.6 1,936.0 2,212.6 57.7 Aug 1,103.3 12,241.1 11,401.7 11,489.2 6,198.4 841.5 256.2 1,926.2 2,210.0 56.8 Sep
1,106.2 12,186.7 11,389.8 11,476.9 6,218.9 844.8 250.8 1,899.0 2,207.3 56.2 Oct 1,107.1 12,218.8 11,441.1 11,514.2 6,293.1 830.5 246.2 1,882.2 2,206.7 55.5 Nov 1,123.2 12,284.3 11,541.7 11,616.4 6,349.5 833.1 242.5 1,925.2 2,211.3 54.9 Dec
1,108.1 12,318.6 11,528.3 11,610.6 6,343.3 841.7 237.0 1,911.9 2,220.8 55.8 2018 Jan
German contribution (€ billion)
244.2 3,379.0 3,293.1 3,168.8 1,711.8 176.9 34.4 649.6 534.1 61.9 2015 Dec
242.2 3,398.2 3,312.7 3,191.1 1,739.2 172.6 35.6 647.9 535.1 60.7 2016 Jan 242.7 3,412.8 3,319.7 3,197.4 1,747.9 172.1 35.8 645.5 536.7 59.4 Feb 243.3 3,428.4 3,315.7 3,188.8 1,735.7 176.5 37.5 644.9 535.9 58.3 Mar
244.2 3,429.1 3,334.3 3,208.5 1,759.1 178.5 38.3 640.3 535.1 57.2 Apr 243.7 3,469.8 3,356.2 3,222.9 1,779.2 175.2 37.3 640.6 534.4 56.2 May245.2 3,481.5 3,352.9 3,218.7 1,779.1 173.1 38.3 638.8 533.9 55.4 June
247.4 3,464.1 3,368.1 3,233.1 1,793.5 174.7 38.2 638.3 533.8 54.6 July246.5 3,480.0 3,376.0 3,238.3 1,803.0 173.4 38.2 636.2 533.8 53.8 Aug 245.9 3,494.5 3,380.7 3,247.0 1,807.9 179.4 38.3 635.0 533.3 53.1 Sep
245.4 3,489.6 3,386.4 3,254.0 1,821.1 172.1 37.8 637.3 533.5 52.3 Oct 245.7 3,536.5 3,424.0 3,288.1 1,857.7 171.0 37.4 636.6 533.7 51.7 Nov 248.1 3,517.1 3,419.8 3,284.1 1,851.0 171.5 38.4 635.6 536.3 51.3 Dec
245.4 3,526.3 3,439.3 3,306.3 1,873.8 174.0 38.7 632.1 537.1 50.6 2017 Jan 246.6 3,532.6 3,448.3 3,313.4 1,881.5 175.3 38.8 630.0 537.9 50.0 Feb 247.7 3,549.3 3,449.2 3,318.1 1,886.4 177.4 39.9 628.4 536.5 49.5 Mar
249.3 3,540.9 3,447.5 3,317.0 1,895.9 170.7 40.0 624.7 536.6 49.0 Apr 248.6 3,566.1 3,465.8 3,327.4 1,910.5 167.5 40.2 624.1 536.4 48.7 May249.5 3,590.5 3,482.0 3,339.9 1,928.7 165.5 40.3 621.4 535.7 48.3 June
251.6 3,583.1 3,472.8 3,333.0 1,927.8 162.6 40.3 619.5 537.9 44.9 July250.4 3,600.7 3,483.1 3,338.6 1,938.3 159.0 40.3 619.3 537.5 44.1 Aug 250.1 3,616.3 3,486.8 3,345.9 1,945.0 162.3 39.6 617.9 537.5 43.5 Sep
250.9 3,606.4 3,490.8 3,352.9 1,958.5 158.8 38.6 616.2 538.0 42.7 Oct 250.9 3,646.8 3,521.5 3,383.7 1,990.6 157.1 37.4 618.2 538.3 42.1 Nov 252.9 3,647.9 3,515.8 3,378.5 1,976.2 162.0 37.7 620.4 540.7 41.5 Dec
250.1 3,632.4 3,522.2 3,390.6 1,994.6 161.5 36.4 616.5 539.4 42.2 2018 Jan
of euro banknotes put into circulation by the Bundesbank in accordance with the Bundesbank can be calculated by adding to this total the item “Intra-Eurosystemaccounting regime chosen by the Eurosystem (see also footnote 2 on banknote liability/claim related to banknote issue“ (see “Other liability items“). 5 Excludingcirculation in Table III.2). The volume of currency actually put into circulation by the central governments’ deposits. 6 In Germany, only savings deposits.

Deutsche Bundesbank
12
Monthly Report
March 2018
II Overall monetary survey in the euro area
2 Consolidated balance sheet of monetary financial institutions (MFIs) (cont’d) *
Liabilities (cont’d)
Deposits of non-banks (non-MFIs) in the euro area (cont’d)
General government Repo transactions Debt securitieswith non-banks
Other general government in the euro area
With agreed At agreedmaturities of notice of 2
Moneyover of which market of which
Central 1 year and Enterprises fund denom-End of govern- up to up to over up to over and shares inatedyear/month ments Total Overnight 1 year 2 years 2 years 3 months 3 months Total households (net) 3 Total in euro
Euro area (€ billion) 1
2015 Dec 227.4 336.6 154.4 104.6 13.7 39.7 19.5 4.7 272.8 270.9 475.1 2,319.4 1,634.3
2016 Jan 315.1 343.4 160.9 102.3 14.3 39.7 21.0 5.2 294.5 292.9 485.5 2,301.4 1,615.0 Feb 301.0 344.0 162.6 98.1 14.4 39.9 24.0 5.1 339.1 335.1 484.2 2,288.0 1,597.6 Mar 333.3 345.9 159.5 102.0 15.1 40.8 23.6 5.0 332.3 329.1 471.7 2,271.4 1,590.3
Apr 297.6 345.2 161.9 97.2 15.4 42.2 23.5 4.9 327.9 323.1 489.1 2,275.8 1,586.3 May 317.7 356.6 167.0 102.1 15.5 43.1 24.0 4.9 318.7 312.8 489.2 2,284.5 1,575.9 June 378.3 361.6 171.3 102.4 15.9 43.7 23.5 4.8 321.3 318.0 479.7 2,281.8 1,569.3
July 349.2 366.7 174.1 101.6 18.2 43.8 24.2 4.8 298.6 297.4 494.8 2,258.2 1,543.7 Aug 294.6 368.1 175.7 100.8 18.7 44.3 23.8 4.9 301.0 299.9 495.5 2,253.2 1,534.5 Sep 297.4 361.0 170.5 99.5 19.4 44.4 22.3 5.0 286.5 285.7 493.7 2,227.1 1,517.1
Oct 295.3 367.4 182.2 94.3 19.9 44.5 21.3 5.3 266.4 265.7 511.7 2,226.0 1,503.3 Nov 300.4 369.6 178.7 98.8 21.1 44.2 21.6 5.2 264.5 263.8 518.8 2,244.1 1,506.1 Dec 253.0 355.1 168.6 93.9 21.5 43.3 22.6 5.1 268.9 268.2 512.8 2,230.4 1,502.6
2017 Jan 316.7 362.0 169.5 99.5 21.3 43.4 22.9 5.5 250.1 249.5 524.3 2,209.7 1,487.5 Feb 299.9 364.1 175.0 96.2 20.2 44.1 23.1 5.4 241.7 241.0 520.1 2,221.0 1,493.4 Mar 324.0 357.0 165.4 96.5 21.5 44.6 23.6 5.4 256.5 255.8 532.1 2,194.0 1,480.5
Apr 318.6 366.2 176.4 92.4 23.7 44.7 23.5 5.5 250.4 249.7 527.8 2,164.8 1,466.1 May 332.1 375.5 181.6 94.5 25.3 45.2 24.2 4.7 238.4 237.7 523.0 2,171.8 1,490.1 June 352.5 378.0 181.2 95.7 26.6 45.8 24.0 4.7 221.7 221.0 502.3 2,154.7 1,478.3
July 345.0 388.3 191.0 95.2 26.7 46.2 24.4 4.8 197.4 196.8 516.0 2,134.2 1,471.5 Aug 326.7 395.0 197.1 94.8 27.8 46.2 24.4 4.7 199.6 198.9 525.1 2,119.1 1,465.2 Sep 362.5 389.5 193.2 91.9 28.1 47.5 24.1 4.7 206.6 205.9 520.9 2,098.6 1,448.2
Oct 318.9 390.9 197.9 87.6 28.3 48.3 24.1 4.7 226.5 225.8 529.8 2,086.3 1,431.2 Nov 310.2 394.4 197.6 89.5 29.8 49.0 23.8 4.6 243.4 242.8 526.1 2,099.7 1,446.4 Dec 288.8 379.1 191.1 81.5 31.5 46.8 23.5 4.6 211.7 211.2 499.7 2,081.4 1,437.3
2018 Jan 330.0 378.0 186.2 84.2 31.1 47.5 24.1 5.0 200.7 200.2 518.1 2,069.1 1,438.9
German contribution (€ billion)
2015 Dec 22.6 187.6 54.3 86.0 10.2 33.4 3.1 0.5 2.5 2.0 3.4 533.4 254.9
2016 Jan 21.8 185.2 54.5 83.2 10.5 33.4 3.1 0.5 2.8 2.7 3.7 534.8 257.0 Feb 28.9 186.5 59.1 79.7 10.5 33.7 3.1 0.5 4.2 3.7 3.6 527.9 250.2 Mar 49.3 190.2 57.4 84.1 10.8 34.3 3.1 0.5 3.2 2.0 3.4 518.7 250.5
Apr 31.9 188.7 58.2 80.3 10.9 35.6 3.2 0.5 3.7 2.4 3.0 521.8 249.1 May 50.6 196.3 60.4 84.9 11.1 36.2 3.3 0.5 3.5 2.4 2.5 530.9 244.9 June 63.6 199.2 62.2 85.0 11.5 36.6 3.3 0.5 2.5 2.3 2.6 523.0 241.2
July 31.9 199.1 59.9 85.2 13.3 36.8 3.3 0.5 3.4 3.2 2.4 524.2 241.2 Aug 40.6 201.0 61.7 84.6 13.6 37.2 3.4 0.5 3.2 3.2 2.3 524.4 241.5 Sep 49.3 198.3 59.7 83.5 14.0 37.2 3.4 0.5 2.9 2.9 2.4 516.7 240.8
Oct 40.5 195.1 58.8 80.4 14.9 37.2 3.4 0.5 3.2 3.2 2.3 526.0 242.2 Nov 47.4 201.0 59.5 84.2 16.1 37.3 3.3 0.6 3.0 3.0 2.3 542.1 251.4 Dec 33.8 199.1 61.6 80.5 16.6 36.6 3.3 0.6 2.2 2.2 2.3 541.3 250.6
2017 Jan 21.2 198.8 55.1 86.6 16.4 36.9 3.2 0.6 4.8 4.8 2.2 553.4 261.4 Feb 17.5 201.8 61.5 83.2 15.7 37.7 3.1 0.6 4.5 4.5 2.2 556.7 262.6 Mar 31.6 199.5 58.7 82.5 16.5 38.2 3.1 0.6 2.6 2.6 2.1 551.8 263.6
Apr 25.0 198.9 59.0 79.4 18.8 38.2 3.0 0.6 3.5 3.5 2.1 546.7 264.9 May 32.7 206.1 61.6 81.6 20.6 38.7 3.1 0.6 2.4 2.4 2.1 542.6 263.2 June 39.8 210.9 63.4 82.6 22.0 39.3 3.0 0.6 1.8 1.8 2.1 542.7 266.0
July 42.3 207.8 60.3 81.5 22.6 39.8 3.0 0.7 3.3 3.3 2.1 534.5 264.9 Aug 49.7 212.4 64.0 81.0 23.6 40.1 3.0 0.7 3.4 3.4 2.3 534.4 267.8 Sep 59.5 210.9 63.2 78.5 24.3 41.2 3.0 0.7 2.6 2.6 2.3 529.1 264.0
Oct 45.3 208.2 64.4 73.5 24.7 41.9 3.0 0.7 2.3 2.3 2.0 521.8 252.3 Nov 51.7 211.4 65.5 73.0 26.2 43.1 2.9 0.7 2.6 2.6 2.0 518.3 251.1 Dec 61.7 207.7 69.3 66.3 27.8 40.6 2.9 0.7 3.3 3.3 1.7 512.7 256.4
2018 Jan 37.4 204.4 61.6 70.3 27.5 41.4 2.8 0.8 4.3 4.3 1.7 518.7 262.9
* Monetary financial institutions (MFIs) comprise banks (including building and loan paper. 5 Excluding liabilities arising from securities issued. 6 After deduction ofassociations), money market funds, and the European Central Bank and national inter-MFI participations. 7 The German contributions to the Eurosystem’s monetarycentral banks (the Eurosystem). 1 Source: ECB. 2 In Germany, only savings aggregates should on no account be interpreted as national monetary aggregatesdeposits. 3 Excluding holdings of MFIs; for the German contribution, excluding and are therefore not comparable with the erstwhile German money stocks M1, M2German MFIs’ portfolios of securities issued by MFIs in the euro area. 4 In Germany, or M3. 8 including DM banknotes still in circulation (see also footnote 4 onbank debt securities with maturities of up to one year are classed as money market p 10 ) 9 For the German contribution, the difference between the volume of

Deutsche Bundesbank
13
Monthly Report
March 2018
II Overall monetary survey in the euro area
Memo item
Other liability items Monetary aggregates 7 (From 2002, German contributionissued (net) 3 excludes currency in circulation)
With maturities ofof which MonetaryIntra- liabilitiesEurosystem- of centralliability/ govern-
over Liabilities Excess claim Monetary ments1 year and to non- Capital of related to capital (Post
up to up to over euro-area and inter-MFI banknote forma- Office, End of1 year 4 2 years 2 years residents 5 reserves 6 liabilities Total 8 issue 9 M1 10 M2 11 M3 12 tion 13 year/monthTreasury) 14
Euro area (€ billion) 1
22.9 47.8 2,248.7 3,652.6 2,549.2 − 50.0 4,095.9 − 6,631.8 10,228.4 10,840.9 7,000.7 123.0 2015 Dec
28.9 50.6 2,221.8 3,800.3 2,573.0 − 77.1 4,387.7 − 6,666.0 10,264.2 10,908.5 6,988.6 123.6 2016 Jan 33.4 54.2 2,200.4 3,912.2 2,609.9 − 98.5 4,554.8 − 6,688.4 10,278.4 10,942.5 7,013.7 122.8 Feb 37.2 51.9 2,182.3 3,724.8 2,592.4 − 94.3 4,379.8 − 6,721.6 10,322.7 10,968.4 6,969.1 121.3 Mar
41.7 50.0 2,184.2 3,912.4 2,604.3 − 99.6 4,285.0 − 6,815.4 10,399.2 11,070.5 6,977.2 122.7 Apr 39.9 49.2 2,195.4 4,018.4 2,600.8 − 84.0 4,363.4 − 6,867.6 10,440.8 11,110.7 6,980.5 126.6 May49.8 47.2 2,184.8 3,941.0 2,664.9 − 62.8 4,560.2 − 6,901.6 10,472.1 11,131.7 7,014.0 127.7 June
54.6 47.8 2,155.8 4,071.9 2,678.7 − 105.4 4,521.1 − 6,967.7 10,543.0 11,225.5 6,991.1 131.5 July53.9 46.2 2,153.1 4,113.9 2,676.2 − 85.1 4,435.5 − 6,962.0 10,533.4 11,214.3 6,980.4 131.4 Aug 48.7 46.1 2,132.3 4,069.0 2,698.3 − 45.1 4,388.5 − 6,984.6 10,550.9 11,216.3 6,969.1 131.3 Sep
53.5 43.6 2,129.0 4,278.6 2,683.3 − 28.3 4,246.7 − 7,043.6 10,568.0 11,250.0 6,948.0 131.8 Oct 54.6 42.9 2,146.6 4,317.8 2,662.6 − 55.5 4,255.3 − 7,145.6 10,659.4 11,345.5 6,939.0 136.4 Nov 48.1 42.0 2,140.3 4,039.0 2,654.2 − 41.8 4,036.3 − 7,194.0 10,733.4 11,398.9 6,922.5 135.4 Dec
44.2 45.8 2,119.7 4,244.7 2,646.4 − 14.7 3,876.6 − 7,183.6 10,733.4 11,421.1 6,877.7 139.1 2017 Jan 49.4 47.2 2,124.4 4,375.4 2,696.5 − 20.4 3,952.7 − 7,218.4 10,768.3 11,455.3 6,927.2 140.1 Feb 48.5 47.2 2,098.3 4,315.5 2,676.9 − 3.3 3,853.7 − 7,308.9 10,857.7 11,558.7 6,881.8 140.0 Mar
35.1 43.8 2,085.9 4,399.0 2,663.1 1.0 3,863.7 − 7,406.2 10,923.8 11,605.3 6,841.5 142.1 Apr 42.2 42.8 2,086.9 4,332.9 2,659.5 3.1 3,846.3 − 7,437.1 10,936.3 11,620.2 6,828.8 145.0 May42.5 42.1 2,070.2 4,134.0 2,631.3 10.0 3,730.4 − 7,515.3 11,005.2 11,659.3 6,767.1 145.5 June
39.6 40.5 2,054.1 4,179.2 2,616.3 9.6 3,683.0 − 7,545.0 11,031.3 11,696.6 6,722.8 148.0 July35.2 40.2 2,043.8 4,177.2 2,647.5 − 0.7 3,685.9 − 7,572.9 11,072.8 11,748.3 6,735.9 148.5 Aug 43.6 39.9 2,015.0 4,154.7 2,651.1 17.2 3,537.5 − 7,621.4 11,097.1 11,767.4 6,701.4 150.4 Sep
36.0 37.1 2,013.2 4,339.4 2,666.0 13.3 3,576.3 − 7,648.1 11,114.5 11,785.6 6,687.5 148.7 Oct 40.8 37.4 2,021.5 4,289.3 2,658.2 45.6 3,572.6 − 7,725.9 11,175.7 11,855.7 6,671.0 151.3 Nov 35.8 35.4 2,010.1 4,099.1 2,709.9 30.2 3,292.1 − 7,787.1 11,233.2 11,871.8 6,751.6 146.0 Dec
25.4 29.8 2,013.9 4,419.4 2,694.9 − 41.7 3,054.4 − 7,764.8 11,226.6 11,868.2 6,729.0 150.1 2018 Jan
German contribution (€ billion)
26.3 9.3 497.8 659.6 552.5 − 742.7 1,537.4 297.8 1,766.1 2,610.8 2,652.3 1,795.8 − 2015 Dec
25.2 11.2 498.4 702.8 560.8 − 766.0 1,620.7 297.1 1,793.6 2,633.8 2,676.6 1,801.7 − 2016 Jan 25.5 11.8 490.7 739.6 574.8 − 790.7 1,683.0 297.7 1,807.0 2,644.8 2,689.9 1,804.6 − Feb 24.0 10.9 483.8 699.0 569.9 − 784.5 1,622.4 299.8 1,793.1 2,641.1 2,682.7 1,791.6 − Mar
23.9 11.7 486.1 753.1 575.6 − 803.0 1,566.8 300.9 1,817.3 2,663.6 2,705.9 1,795.3 − Apr 22.8 12.3 495.8 758.5 571.4 − 823.1 1,577.5 303.9 1,839.6 2,685.7 2,726.9 1,800.7 − May23.8 11.8 487.5 783.3 592.6 − 834.3 1,670.0 308.0 1,841.3 2,686.4 2,727.1 1,811.5 − June
30.5 12.6 481.1 807.8 595.1 − 824.9 1,673.4 311.7 1,853.4 2,702.0 2,750.9 1,806.5 − July27.4 12.5 484.5 826.1 589.2 − 846.9 1,640.6 314.1 1,864.6 2,711.7 2,757.1 1,801.3 − Aug 26.4 12.9 477.4 851.2 594.2 − 876.5 1,616.7 318.8 1,867.6 2,719.5 2,764.2 1,797.3 − Sep
25.3 13.4 487.3 899.9 585.7 − 863.2 1,564.6 322.0 1,879.9 2,721.9 2,766.1 1,800.2 − Oct 22.7 14.6 504.7 905.9 578.4 − 918.6 1,536.5 323.9 1,917.2 2,762.9 2,805.6 1,809.3 − Nov 23.1 14.2 504.0 878.8 580.3 − 897.1 1,506.3 327.3 1,912.6 2,759.2 2,801.0 1,808.4 − Dec
22.8 14.4 516.2 930.2 575.5 − 926.5 1,465.7 328.3 1,928.9 2,784.9 2,829.2 1,811.9 − 2017 Jan 22.2 15.2 519.2 972.2 587.9 − 944.3 1,484.8 330.1 1,943.0 2,797.0 2,841.1 1,825.3 − Feb 19.5 15.9 516.4 979.6 586.5 − 957.7 1,462.2 331.9 1,945.1 2,801.0 2,841.1 1,819.5 − Mar
17.7 16.9 512.1 985.8 597.9 − 965.5 1,463.1 335.2 1,954.8 2,803.4 2,843.5 1,822.6 − Apr 18.4 16.8 507.4 957.7 595.0 − 967.6 1,461.9 338.1 1,972.1 2,821.5 2,861.2 1,814.4 − May19.3 16.4 507.0 946.6 591.5 − 981.1 1,412.1 342.8 1,992.1 2,841.2 2,880.9 1,808.1 − June
18.8 16.2 499.5 926.1 589.1 − 975.5 1,406.4 345.0 1,988.1 2,835.9 2,876.2 1,793.6 − July18.5 15.8 500.0 894.5 597.2 − 970.2 1,422.2 348.6 2,002.3 2,846.8 2,886.8 1,801.4 − Aug 19.3 15.4 494.4 927.7 594.2 − 982.9 1,387.5 352.1 2,008.2 2,853.5 2,893.0 1,792.0 − Sep
18.6 15.7 487.5 913.6 596.3 − 946.7 1,386.3 354.2 2,023.0 2,859.6 2,898.2 1,785.4 − Oct 18.5 15.8 484.0 883.4 593.7 − 940.3 1,382.0 355.5 2,056.1 2,890.9 2,929.9 1,781.9 − Nov 17.7 14.8 480.2 921.3 668.6 − 999.6 1,295.2 359.3 2,045.5 2,882.9 2,920.4 1,852.1 − Dec
15.9 14.1 488.6 931.8 656.8 − 974.8 1,303.8 359.3 2,056.2 2,894.1 2,930.1 1,846.3 − 2018 Jan
euro banknotes actually issued by the Bundesbank and the amount disclosed in years and at agreed notice of up to 3 months (excluding central governments’accordance with the accounting regime chosen by the Eurosystem (see also footnote deposits) and (for the euro area) central governments’ monetary liabilities with such2 on banknote circulation in Table III.2). 10 Overnight deposits (excluding central maturities. 12 M2 plus repo transactions, money market fund shares, money marketgovernments’ deposits), and (for the euro area) currency in circulation, central paper and debt securities up to 2 years. 13 Deposits with agreed maturities of over 2governments’ overnight monetary liabilities, which are not included in the years and at agreed notice of over 3 months, debt securities with maturities of over 2consolidated balance sheet. 11 M1 plus deposits with agreed maturities of up to 2 years, capital and reserves. 14 Non-existent in Germany.

Deutsche Bundesbank
14
Monthly Report
March 2018
II Overall monetary survey in the euro area
3 Banking system’s liquidity position *
Stocks
€ billion; period averages of daily positions
Liquidity-providing factors Liquidity-absorbing factors
Monetary policy operations of the EurosystemCreditinstitutions‘currentaccount
Net assets Longer- Other Other balancesReserve in gold Main term Marginal liquidity- liquidity- Banknotes Central Other (includingmaintenance and foreign refinancing refinancing lending providing Deposit absorbing in government factors minimum Baseperiod currency operations operations facility facility deposits (net) 6 reserves) 7 money 8 operations 3 operations 4 circulation 5 ending in 1
Eurosystem 2
2015 Oct 619.1 70.2 462.1 0.1 643.2 152.8 0.0 1 052.4 95.2 28.9 465.3 1 670.5 Nov . . . . . . . . . . . . Dec 612.2 66.1 459.3 0.0 730.7 173.1 0.0 1 056.5 93.5 51.5 493.8 1 723.4
2016 Jan 611.6 71.6 466.9 0.2 811.8 196.6 0.0 1 072.8 82.5 53.2 557.1 1 826.5 Feb . . . . . . . . . . . . Mar 607.8 62.9 461.7 0.1 907.6 230.5 0.0 1 063.4 115.6 73.9 556.5 1 850.4
Apr 627.3 58.1 460.8 0.2 1 000.1 262.0 0.0 1 069.3 147.4 97.7 570.0 1 901.3 May . . . . . . . . . . . . June 640.3 53.9 456.3 0.2 1 105.3 309.0 0.0 1 076.6 123.9 122.8 623.8 2 009.4
July 666.1 47.6 471.6 0.1 1 227.1 323.1 0.0 1 087.1 175.5 169.4 657.5 2 067.7 Aug . . . . . . . . . . . . Sep 685.0 43.5 483.7 0.0 1 339.7 355.1 0.0 1 096.2 137.8 214.0 748.8 2 200.2
Oct 687.8 37.4 503.5 0.1 1 447.0 387.3 0.0 1 094.7 168.3 248.0 777.4 2 259.4 Nov . . . . . . . . . . . . Dec 687.4 34.0 511.8 0.2 1 570.2 439.4 0.0 1 103.1 159.7 277.6 823.9 2 366.3
2017 Jan 674.7 34.6 548.9 0.2 1 670.8 434.4 0.0 1 119.1 143.1 313.6 919.0 2 472.6 Feb . . . . . . . . . . . . Mar 662.4 29.0 554.3 0.3 1 787.5 479.2 0.0 1 110.8 160.3 322.2 960.9 2 550.9
Apr . . . . . . . . . . . . May 678.6 18.5 707.4 0.3 1 905.3 550.0 0.0 1 118.4 182.0 378.8 1 081.1 2 749.4 June 683.1 13.7 767.4 0.2 1 995.0 593.7 0.0 1 126.0 163.6 397.4 1 178.7 2 898.5
July 656.9 9.4 767.4 0.2 2 076.1 595.3 0.0 1 136.3 229.8 379.4 1 169.2 2 900.8 Aug . . . . . . . . . . . . Sep 639.0 5.5 768.6 0.3 2 150.2 611.4 0.0 1 142.5 181.8 385.1 1 242.7 2 996.7
Oct 635.0 6.7 765.3 0.2 2 239.2 648.1 0.0 1 142.8 218.3 383.9 1 253.3 3 044.2 Nov . . . . . . . . . . . . Dec 634.5 3.0 763.7 0.2 2 333.5 682.5 0.0 1 146.6 188.5 407.6 1 309.7 3 138.8
2018 Jan 635.7 2.9 760.6 0.2 2 398.2 689.2 0.0 1 158.2 188.1 487.0 1 275.2 3 122.5 Feb . . . . . . . . . . . .
Deutsche Bundesbank
2015 Oct 148.4 2.8 40.8 0.0 138.2 40.8 0.0 248.8 5.2 − 115.9 151.2 440.9 Nov . . . . . . . . . . . . Dec 146.1 3.2 43.3 0.0 156.3 56.1 0.0 249.1 9.3 − 116.3 150.7 455.9
2016 Jan 144.8 3.6 48.4 0.1 174.0 50.0 0.0 252.4 18.0 − 124.0 174.4 476.8 Feb . . . . . . . . . . . . Mar 143.7 1.9 46.3 0.0 193.9 59.8 0.0 250.4 26.1 − 113.3 162.9 473.1
Apr 152.2 3.1 45.0 0.0 214.1 67.6 0.0 252.1 37.3 − 105.1 162.4 482.1 May . . . . . . . . . . . . June 156.4 3.3 45.3 0.0 237.2 87.3 0.0 254.7 41.1 − 127.2 186.5 528.4
July 163.3 2.7 44.7 0.0 263.4 89.8 0.0 257.4 47.2 − 117.0 196.6 543.9 Aug . . . . . . . . . . . . Sep 168.3 1.9 44.0 0.0 288.2 90.8 0.0 258.7 36.2 − 112.6 229.3 578.9
Oct 168.7 1.5 50.6 0.0 311.9 105.2 0.0 258.6 50.5 − 125.2 243.6 607.4 Nov . . . . . . . . . . . . Dec 167.7 0.9 54.0 0.0 339.2 129.7 0.0 260.3 43.7 − 141.9 270.0 660.0
2017 Jan 163.8 0.9 62.0 0.0 361.5 132.7 0.0 264.2 35.4 − 146.1 302.0 698.9 Feb . . . . . . . . . . . . Mar 159.4 0.8 63.5 0.0 386.6 153.7 0.0 262.3 23.1 − 169.8 341.0 757.0
Apr . . . . . . . . . . . . May 164.4 1.0 86.0 0.1 412.4 181.4 0.0 264.1 29.7 − 185.3 374.0 819.5 June 165.8 0.3 95.0 0.0 431.8 181.2 0.0 266.2 32.4 − 204.9 418.0 865.4
July 159.6 0.5 95.0 0.0 447.9 170.1 0.0 269.0 52.7 − 201.6 412.7 851.9 Aug . . . . . . . . . . . . Sep 155.2 0.3 94.9 0.0 463.2 165.5 0.0 269.9 52.4 − 192.6 418.5 853.9
Oct 154.8 0.3 94.9 0.0 481.5 171.0 0.0 269.4 65.9 − 197.6 422.7 863.2 Nov . . . . . . . . . . . . Dec 154.2 0.5 94.8 0.0 501.4 187.5 0.0 270.3 56.0 − 218.6 455.8 913.6
2018 Jan 155.5 0.9 93.3 0.0 514.7 204.4 0.0 272.8 54.9 − 192.2 424.5 901.7 Feb . . . . . . . . . . . .
Discrepancies may arise from rounding. * The banking system’s liquidity position is figures are available in such cases. 2 Source: ECB. 3 Includes liquidity provided underdefined as the current account holdings in euro of euro-area credit institutions with the Eurosystem’s securities purchase programmes. 4 From Aug. 2009, includesthe Eurosystem. Amounts are derived from the consolidated financial statement of liquidity absorbed as a result of the Eurosystem’s foreign exchange swap operations.the Eurosystem and the financial statement of the Bundesbank. 1 Figures are daily av- 5 From 2002, euro banknotes and other banknotes which have been issued by the na-erages for the reserve maintenance period ending in the month indicated. Following tional central banks of the Eurosystem and which are still in circulation. In ac-the changeover in the frequency of Governing Council monetary policy meetings to a cordance with the accounting procedure chosen by the Eurosystem for the issue ofsix-week cycle, a reserve maintenance period no longer ends in every month. No euro banknotes, 8% of the total value of the euro banknotes in circulation are

Deutsche Bundesbank
15
Monthly Report
March 2018
II Overall monetary survey in the euro area
Flows
Liquidity-providing factors Liquidity-absorbing factors
Monetary policy operations of the EurosystemCreditinstitutions‘currentaccount
Net assets Longer- Other Other balancesin gold Main term Marginal liquidity- liquidity- Banknotes Central Other (including Reserveand foreign refinancing refinancing lending providing Deposit absorbing in government factors minimum Base maintenancecurrency operations operations facility facility deposits (net) 6 reserves) 7 money 8 periodoperations 3 operations 4 circulation 5
ending in 1
Eurosystem 2
− 8.3 − 2.2 − 0.1 − 0.5 + 92.4 + 4.8 + 0.0 − 2.9 + 31.8 + 10.8 + 36.9 + 38.7 2015 Oct
. . . . . . . . . . . . Nov − 6.9 − 4.1 − 2.8 + 0.0 + 87.5 + 20.3 + 0.0 + 4.1 − 1.7 + 22.6 + 28.5 + 52.9 Dec
− 0.6 + 5.5 + 7.6 + 0.1 + 81.1 + 23.5 + 0.0 + 16.3 − 11.0 + 1.7 + 63.3 + 103.1 2016 Jan . . . . . . . . . . . . Feb
− 3.8 − 8.7 − 5.2 − 0.1 + 95.8 + 33.9 + 0.0 − 9.4 + 33.1 + 20.7 − 0.6 + 23.9 Mar
+ 19.5 − 4.8 − 0.9 + 0.1 + 92.5 + 31.5 + 0.0 + 5.9 + 31.8 + 23.8 + 13.5 + 50.9 Apr . . . . . . . . . . . . May
+ 13.0 − 4.2 − 4.5 + 0.0 + 105.2 + 47.0 + 0.0 + 7.3 − 23.5 + 25.1 + 53.8 + 108.1 June
+ 25.8 − 6.3 + 15.3 − 0.1 + 121.8 + 14.1 + 0.0 + 10.5 + 51.6 + 46.6 + 33.7 + 58.3 July. . . . . . . . . . . . Aug
+ 18.9 − 4.1 + 12.1 − 0.1 + 112.6 + 32.0 + 0.0 + 9.1 − 37.7 + 44.6 + 91.3 + 132.5 Sep
+ 2.8 − 6.1 + 19.8 + 0.1 + 107.3 + 32.2 + 0.0 − 1.5 + 30.5 + 34.0 + 28.6 + 59.2 Oct . . . . . . . . . . . . Nov
− 0.4 − 3.4 + 8.3 + 0.1 + 123.2 + 52.1 + 0.0 + 8.4 − 8.6 + 29.6 + 46.5 + 106.9 Dec
− 12.7 + 0.6 + 37.1 + 0.0 + 100.6 − 5.0 + 0.0 + 16.0 − 16.6 + 36.0 + 95.1 + 106.3 2017 Jan . . . . . . . . . . . . Feb
− 12.3 − 5.6 + 5.4 + 0.1 + 116.7 + 44.8 + 0.0 − 8.3 + 17.2 + 8.6 + 41.9 + 78.3 Mar
. . . . . . . . . . . . Apr + 16.2 − 10.5 + 153.1 + 0.0 + 117.8 + 70.8 + 0.0 + 7.6 + 21.7 + 56.6 + 120.2 + 198.5 May+ 4.5 − 4.8 + 60.0 − 0.1 + 89.7 + 43.7 + 0.0 + 7.6 − 18.4 + 18.6 + 97.6 + 149.1 June
− 26.2 − 4.3 + 0.0 + 0.0 + 81.1 + 1.6 + 0.0 + 10.3 + 66.2 − 18.0 − 9.5 + 2.3 July. . . . . . . . . . . . Aug
− 17.9 − 3.9 + 1.2 + 0.1 + 74.1 + 16.1 + 0.0 + 6.2 − 48.0 + 5.7 + 73.5 + 95.9 Sep
− 4.0 + 1.2 − 3.3 − 0.1 + 89.0 + 36.7 + 0.0 + 0.3 + 36.5 − 1.2 + 10.6 + 47.5 Oct . . . . . . . . . . . . Nov
− 0.5 − 3.7 − 1.6 + 0.0 + 94.3 + 34.4 + 0.0 + 3.8 − 29.8 + 23.7 + 56.4 + 94.6 Dec
+ 1.2 − 0.1 − 3.1 + 0.0 + 64.7 + 6.7 + 0.0 + 11.6 − 0.4 + 79.4 − 34.5 − 16.3 2018 Jan . . . . . . . . . . . . Feb
Deutsche Bundesbank
− 2.9 + 0.9 + 0.8 − 0.0 + 19.1 − 1.5 + 0.0 − 0.6 + 2.3 + 2.4 + 15.4 + 13.2 2015 Oct . . . . . . . . . . . . Nov
− 2.3 + 0.4 + 2.5 − 0.0 + 18.1 + 15.2 + 0.0 + 0.3 + 4.1 − 0.4 − 0.6 + 15.0 Dec
− 1.3 + 0.5 + 5.1 + 0.1 + 17.7 − 6.0 + 0.0 + 3.3 + 8.7 − 7.6 + 23.7 + 21.0 2016 Jan . . . . . . . . . . . . Feb
− 1.0 − 1.7 − 2.1 − 0.0 + 19.9 + 9.8 + 0.0 − 2.1 + 8.1 + 10.7 − 11.5 − 3.8 Mar
+ 8.4 + 1.1 − 1.3 + 0.0 + 20.3 + 7.8 + 0.0 + 1.7 + 11.3 + 8.2 − 0.4 + 9.0 Apr . . . . . . . . . . . . May
+ 4.3 + 0.3 + 0.4 − 0.0 + 23.1 + 19.7 + 0.0 + 2.6 + 3.8 − 22.1 + 24.1 + 46.3 June
+ 6.9 − 0.6 − 0.6 − 0.0 + 26.2 + 2.6 + 0.0 + 2.8 + 6.1 + 10.2 + 10.1 + 15.4 July. . . . . . . . . . . . Aug
+ 5.1 − 0.8 − 0.7 − 0.0 + 24.8 + 1.0 + 0.0 + 1.3 − 11.0 + 4.4 + 32.7 + 35.0 Sep
+ 0.4 − 0.5 + 6.6 + 0.0 + 23.7 + 14.4 + 0.0 − 0.1 + 14.3 − 12.6 + 14.2 + 28.5 Oct . . . . . . . . . . . . Nov
− 0.9 − 0.5 + 3.3 + 0.0 + 27.3 + 24.4 + 0.0 + 1.7 − 6.8 − 16.7 + 26.5 + 52.6 Dec
− 4.0 − 0.1 + 8.1 − 0.0 + 22.3 + 3.0 + 0.0 + 3.9 − 8.3 − 4.3 + 31.9 + 38.8 2017 Jan . . . . . . . . . . . . Feb
− 4.4 − 0.0 + 1.4 + 0.0 + 25.1 + 21.0 + 0.0 − 1.9 − 12.2 − 23.6 + 39.0 + 58.1 Mar
. . . . . . . . . . . . Apr + 4.9 + 0.1 + 22.6 + 0.0 + 25.9 + 27.7 + 0.0 + 1.8 + 6.6 − 15.6 + 33.0 + 62.5 May+ 1.5 − 0.7 + 9.0 − 0.1 + 19.4 − 0.2 + 0.0 + 2.1 + 2.6 − 19.6 + 44.0 + 45.9 June
− 6.2 + 0.2 + 0.0 + 0.0 + 16.1 − 11.1 + 0.0 + 2.8 + 20.3 + 3.3 − 5.3 − 13.6 July. . . . . . . . . . . . Aug
− 4.4 − 0.2 − 0.1 + 0.0 + 15.4 − 4.6 + 0.0 + 0.9 − 0.2 + 9.0 + 5.8 + 2.1 Sep
− 0.4 − 0.1 − 0.1 − 0.0 + 18.3 + 5.5 + 0.0 − 0.5 + 13.5 − 5.0 + 4.2 + 9.2 Oct . . . . . . . . . . . . Nov
− 0.6 + 0.2 − 0.0 − 0.0 + 19.9 + 16.5 + 0.0 + 0.9 − 9.9 − 21.0 + 33.1 + 50.4 Dec
+ 1.3 + 0.4 − 1.6 − 0.0 + 13.3 + 16.9 + 0.0 + 2.5 − 1.1 + 26.4 − 31.3 − 11.9 2018 Jan . . . . . . . . . . . . Feb
allocated on a monthly basis to the ECB. The counterpart of this adjustment is “Other factors”. From 2003 euro banknotes only. 6 Remaining items in theshown under “Other factors”. The remaining 92% of the value of the euro consolidated financial statement of the Eurosystem and the financial statement ofbanknotes in circulation is allocated, likewise on a monthly basis, to the NCBs, with the Bundesbank. 7 Equal to the difference between the sum of liquidity-providingeach NCB showing in its balance sheet the percentage of the euro banknotes in factors and the sum of liquidity-absorbing factors. 8 Calculated as the sum of thecirculation that corresponds to its paid-up share in the ECB’s capital. The difference “deposit facility”, “banknotes in circulation” and “credit institutions’ current accountbetween the value of the euro banknotes allocated to an NCB and the value of the holdings”. euro banknotes which that NCB has put into circulation is likewise shown under

Deutsche Bundesbank
16
Monthly Report
March 2018
III Consolidated financial statement of the Eurosystem
1 Assets *
€ billion
Claims on non-euro areaClaims on non-euro area residents denominatedin foreign currency residents denominated in euro
Balances withClaims onbanks, security
On investments, euro area Balances Claimsreporting external loans residents with banks, arising fromdate/ Gold and other denominated security the creditEnd of Total and gold Receivables external in foreign investments facility undermonth 1 assets receivables Total from the IMF assets currency Total and loans ERM II
Eurosystem 2
2017 June 30 4,209.5 379.1 304.8 74.4 230.4 31.2 18.0 18.0 −
July 7 4,214.7 379.1 303.5 74.6 228.9 30.5 17.2 17.2 − 14 4,229.3 379.1 302.9 74.2 228.7 31.6 17.2 17.2 − 21 4,235.8 379.1 300.7 74.3 226.4 33.4 15.9 15.9 − 28 4,248.3 379.1 302.0 74.3 227.7 33.9 16.7 16.7 −
Aug 4 4,246.5 379.1 299.2 74.4 224.8 36.9 16.4 16.4 − 11 4,256.0 379.1 301.2 74.5 226.8 35.3 15.9 15.9 − 18 4,265.7 379.1 300.1 74.5 225.6 35.2 16.5 16.5 − 25 4,278.9 379.1 299.2 74.5 224.7 35.6 16.2 16.2 −
Sep 1 4,283.7 379.1 298.8 74.5 224.3 34.2 16.4 16.4 − 8 4,299.8 379.1 302.0 74.5 227.4 33.7 15.1 15.1 − 15 4,308.9 379.1 302.9 74.5 228.4 31.0 16.6 16.6 − 22 4,328.2 379.1 302.5 74.5 228.0 33.4 16.8 16.8 − 29 4,318.6 379.0 296.9 73.0 223.8 30.8 17.7 17.7 −
Oct 6 4,337.7 379.0 295.9 73.0 222.8 33.4 16.9 16.9 − 13 4,371.6 379.0 297.2 73.0 224.2 32.1 16.7 16.7 − 20 4,363.4 379.0 297.4 73.0 224.4 32.8 17.3 17.3 − 27 4,371.2 379.0 295.5 72.9 222.5 34.6 15.5 15.5 −
Nov 3 4,373.2 379.0 296.4 72.9 223.5 33.9 15.0 15.0 − 10 4,387.7 379.0 297.4 72.7 224.6 32.4 14.8 14.8 − 17 4,411.9 379.0 297.6 72.2 225.3 34.6 15.7 15.7 − 24 4,427.5 379.0 298.3 72.2 226.1 33.0 15.8 15.8 −
2017 Dec 1 4,440.8 379.0 299.9 72.3 227.5 32.9 16.0 16.0 − 8 4,456.6 379.0 300.5 72.3 228.2 33.1 16.2 16.2 − 15 4,471.9 379.0 299.9 72.1 227.8 31.8 17.7 17.7 − 22 4,487.3 379.0 300.6 70.7 230.0 39.4 16.5 16.5 − 29 4,471.7 376.5 296.2 70.2 226.0 38.1 19.4 19.4 −
2018 Jan 5 4,466.0 376.3 294.6 70.2 224.4 38.6 16.1 16.1 − 12 4,472.7 376.3 295.5 70.2 225.3 28.9 14.5 14.5 − 19 4,484.0 376.3 297.6 70.2 227.4 29.9 15.8 15.8 − 26 4,493.1 376.3 296.4 70.1 226.3 29.1 15.7 15.7 −
Feb 2 4,491.2 376.3 295.9 70.0 225.9 32.7 16.1 16.1 − 9 4,493.7 376.3 297.1 69.9 227.3 32.5 16.8 16.8 − 16 4,504.8 376.3 296.8 69.9 226.9 34.7 17.4 17.4 − 23 4,511.5 376.3 296.2 69.9 226.3 35.4 17.4 17.4 −
Mar 2 4,519.4 376.3 297.1 69.9 227.2 34.5 16.6 16.6 −
Deutsche Bundesbank2016 Apr 1 112.7 117.8 54.1 21.5 32.7 0.0 0.0 0.0 − May 1 159.5 117.8 54.9 21.5 33.4 0.0 − − − June 1 214.0 129.0 55.7 21.5 34.1 0.7 − − −
July 1 209.4 129.0 56.0 21.5 34.5 0.2 − − − Aug 1 239.2 129.0 56.1 21.4 34.7 0.3 − − − Sep 1 305.3 128.8 55.0 21.3 33.7 2.3 0.4 0.4 −
Oct 1 312.2 128.8 54.9 21.3 33.6 − 0.0 0.3 0.3 − Nov 1 376.5 128.8 55.0 21.1 33.9 0.1 0.4 0.4 − Dec 1 392.7 119.3 56.5 21.5 35.0 1.8 0.4 0.4 −
2017 Jan 1 449.7 119.3 56.4 21.5 34.9 0.1 1.8 1.8 − Feb 1 484.8 119.3 56.2 21.2 35.0 0.1 1.5 1.5 − Mar 1 558.0 126.2 55.7 21.1 34.7 2.7 1.7 1.7 −
Apr 1 582.8 126.1 55.7 21.0 34.7 0.0 2.4 2.4 − May 1 608.2 126.1 55.7 21.0 34.7 0.0 2.0 2.0 − June 1 616.4 118.2 53.1 20.0 33.0 1.3 2.1 2.1 −
July 1 621.0 118.2 53.5 20.0 33.6 0.0 2.8 2.8 − Aug 1 625.1 118.2 52.6 19.9 32.7 0.0 2.8 2.8 − Sep 1 663.9 118.2 51.7 19.6 32.2 1.4 3.1 3.1 −
Oct 1 644.4 118.2 52.9 19.5 33.4 0.0 1.9 1.9 − Nov 1 665.0 118.2 52.6 19.3 33.4 0.0 2.0 2.0 − Dec 1 727.7 117.3 49.5 18.3 31.2 7.2 4.4 4.4 −
2018 Jan 1 699.8 117.3 49.4 18.2 31.2 0.1 2.1 2.1 − Feb 1 738.4 117.3 50.0 18.1 31.8 0.0 1.9 1.9 −
* The consolidated financial statement of the Eurosystem comprises the financial national central banks of the euro area member states (NCBs). The balance sheetstatement of the European Central Bank (ECB) and the financial statements of the items for foreign currency, securities, gold and financial instruments are valued at the

Deutsche Bundesbank
17
Monthly Report
March 2018
III Consolidated financial statement of the Eurosystem
Lending to euro area credit institutions related to monetary policy operations Securities of euro area residentsdenominated in euro in euro
Other claims on euro area
Longer- Fine- credit Securities General OnMain re- term re- tuning Structural Credits institutions held for government reportingfinancing financing reverse reverse Marginal related denomi- monetary debt deno- date/opera- opera- opera- opera- lending to margin nated in policy Other minated in Other End of
Total tions tions tions tions facility calls euro Total purposes securities euro assets month 1
Eurosystem 2
779.3 11.6 767.3 − − 0.3 − 70.9 2 358.6 2 064.4 294.2 25.8 241.9 2017 June 30
775.7 8.3 767.3 − − 0.1 − 69.5 2 374.4 2 081.3 293.1 25.7 239.0 July 7774.6 7.1 767.3 − − 0.2 − 69.0 2 390.4 2 097.5 292.9 25.7 238.8 14774.3 6.8 767.3 − − 0.2 − 67.7 2 400.0 2 108.3 291.7 25.7 239.0 21776.3 7.4 768.7 − − 0.2 − 63.3 2 411.3 2 119.2 292.1 25.7 240.0 28
773.1 4.3 768.7 − − 0.2 − 63.6 2 414.8 2 128.2 286.6 25.7 237.5 Aug 4773.5 4.6 768.7 − − 0.2 − 61.4 2 426.0 2 139.7 286.3 25.7 237.8 11773.7 4.8 768.7 − − 0.2 − 62.2 2 435.4 2 149.3 286.1 25.7 237.7 18776.3 7.3 768.7 − − 0.3 − 60.4 2 446.2 2 160.1 286.1 25.7 240.2 25
774.7 5.9 768.6 − − 0.2 − 59.2 2 456.1 2 170.4 285.8 25.7 239.4 Sep 1772.8 4.3 768.4 − − 0.1 − 61.0 2 471.7 2 185.9 285.8 25.7 238.6 8772.5 4.0 768.4 − − 0.1 − 61.5 2 484.1 2 200.0 284.2 25.7 235.3 15773.6 5.1 768.4 − − 0.1 − 59.4 2 498.5 2 214.1 284.3 25.7 239.1 22768.5 4.2 764.1 − − 0.2 − 53.3 2 504.4 2 221.3 283.1 25.7 242.3 29
767.5 3.2 764.1 − − 0.2 − 54.9 2 521.9 2 238.9 283.0 25.7 242.5 Oct 6785.5 21.3 764.1 − − 0.1 − 55.0 2 537.6 2 254.4 283.2 25.7 242.7 13768.2 3.8 764.1 − − 0.3 − 56.7 2 547.4 2 265.1 282.3 25.7 238.9 20769.4 5.3 763.7 − − 0.3 − 55.4 2 560.0 2 278.4 281.6 25.7 236.2 27
766.9 3.0 763.7 − − 0.2 − 52.6 2 568.1 2 287.7 280.4 25.7 235.7 Nov 3766.5 2.7 763.7 − − 0.1 − 52.7 2 583.9 2 303.2 280.7 25.1 235.9 10766.8 2.8 763.7 − − 0.2 − 56.7 2 599.0 2 318.3 280.7 25.1 237.4 17767.1 3.0 763.7 − − 0.4 − 55.6 2 614.0 2 333.4 280.6 25.1 239.6 24
768.9 5.0 763.7 − − 0.2 − 50.7 2 627.3 2 347.3 279.9 25.1 241.1 2017 Dec 1766.1 2.3 763.7 − − 0.1 − 52.2 2 643.1 2 364.8 278.3 25.1 241.3 8765.7 1.9 763.7 − − 0.1 − 54.9 2 655.8 2 380.3 275.5 25.1 241.9 15764.3 3.4 760.6 − − 0.3 − 43.1 2 668.3 2 393.3 275.0 25.1 250.9 22764.3 3.4 760.6 − − 0.3 − 37.6 2 660.7 2 386.0 274.7 25.0 254.0 29
763.6 2.9 760.6 − − 0.1 − 35.2 2 662.4 2 388.9 273.5 25.0 254.2 2018 Jan 5763.7 3.0 760.6 − − 0.1 − 46.2 2 672.9 2 399.0 273.9 25.0 249.7 12763.3 2.4 760.6 − − 0.2 − 47.7 2 679.3 2 406.6 272.7 25.0 249.1 19762.8 2.2 760.6 − − 0.1 − 49.5 2 688.7 2 415.3 273.4 25.0 249.5 26
762.6 1.9 760.7 − − 0.0 − 51.5 2 685.3 2 416.1 269.1 25.0 245.7 Feb 2762.2 1.6 760.7 − − 0.0 − 45.5 2 694.9 2 425.2 269.7 25.0 243.3 9762.1 1.3 760.7 − − 0.1 − 47.0 2 703.0 2 433.3 269.7 25.0 242.6 16762.2 1.5 760.7 − − 0.0 − 48.5 2 708.4 2 438.4 270.0 25.0 242.2 23
762.0 1.7 760.3 − − 0.0 − 49.1 2 715.6 2 445.2 270.4 25.0 243.1 Mar 2
Deutsche Bundesbank49.7 4.2 45.5 − − 0.0 − 4.3 227.3 227.3 − 4.4 655.0 2016 Apr 48.8 3.8 45.0 − − 0.0 − 4.3 244.8 244.8 − 4.4 684.4 May47.3 2.8 44.5 − − 0.0 − 5.2 261.8 261.8 − 4.4 710.0 June
46.4 2.3 44.1 − − 0.0 − 5.5 279.9 279.9 − 4.4 688.0 July46.3 2.3 44.1 − − 0.0 − 5.5 292.6 292.6 − 4.4 705.0 Aug 55.3 1.3 54.0 − − − − 5.7 309.3 309.3 − 4.4 744.1 Sep
55.5 0.9 53.9 − − 0.7 − 5.4 326.7 326.7 − 4.4 736.2 Oct 55.2 1.0 53.9 − − 0.3 − 4.8 345.4 345.4 − 4.4 782.3 Nov 65.5 1.8 63.5 − − 0.1 − 3.0 357.7 357.7 − 4.4 784.1 Dec
64.0 0.6 63.4 − − 0.0 − 4.1 375.7 375.7 − 4.4 823.9 2017 Jan 63.9 0.7 63.2 − − 0.0 − 4.5 392.6 392.6 − 4.4 842.4 Feb 95.6 0.4 95.0 − − 0.2 − 3.9 408.8 408.8 − 4.4 859.0 Mar
95.7 0.6 95.0 − − 0.1 − 4.2 421.4 421.4 − 4.4 872.8 Apr 95.3 0.3 95.0 − − 0.0 − 4.0 434.3 434.3 − 4.4 886.4 May96.4 1.2 95.0 − − 0.1 − 3.9 445.8 445.8 − 4.4 891.3 June
95.5 0.5 94.9 − − 0.1 − 4.4 457.2 457.2 − 4.4 884.8 July95.2 0.2 94.9 − − 0.1 − 4.4 467.1 467.1 − 4.4 880.4 Aug 95.1 0.2 94.8 − − 0.0 − 3.7 478.3 478.3 − 4.4 908.1 Sep
95.2 0.3 94.8 − − 0.0 − 3.8 490.5 490.5 − 4.4 877.5 Oct 96.3 1.4 94.8 − − 0.0 − 2.8 503.6 503.6 − 4.4 885.0 Nov 94.3 1.0 93.3 − − − − 0.5 512.1 512.1 − 4.4 937.9 Dec
93.9 0.6 93.3 − − 0.0 − 3.1 518.2 518.2 − 4.4 911.3 2018 Jan 94.2 0.8 93.4 − − 0.1 − 3.8 523.9 523.9 − 4.4 942.8 Feb
end of the quarter. 1 Source: ECB.

Deutsche Bundesbank
18
Monthly Report
March 2018
III Consolidated financial statement of the Eurosystem
2 Liabilities *
€ billion
Liabilities to euro area credit institutions related to Liabilities tomonetary policy operations denominated in euro other euro area residents
denominated in euro
OtherCurrent liabilitiesaccounts to euro-
On (covering Fine- area creditreporting the tuning Deposits institutions Debtdate/ Banknotes minimum Fixed- reverse deno- certifi- Generalrelated toEnd of Total in circu- reserve Deposit term opera- margin minated cates govern- Othermonth 1 liabilities lation 2 Total system) facility deposits tions calls in euro issued Total ment liabilities
Eurosystem 4
2017 June 30 4,209.5 1,136.9 1,723.1 1,106.1 617.0 − − 0.1 9.2 − 347.6 210.1 137.5
July 7 4,214.7 1,140.0 1,787.3 1,166.6 620.7 − − 0.0 9.8 − 340.1 209.1 131.0 14 4,229.3 1,141.2 1,792.1 1,197.8 594.2 − − 0.1 9.8 − 360.2 230.7 129.6 21 4,235.8 1,140.4 1,764.1 1,186.9 577.2 − − 0.0 9.2 − 380.8 254.1 126.7 28 4,248.3 1,142.3 1,784.2 1,200.7 583.5 − − 0.1 9.6 − 369.8 239.3 130.5
Aug 4 4,246.5 1,144.7 1,867.3 1,245.9 621.3 − − 0.0 10.4 − 273.7 147.1 126.6 11 4,256.0 1,145.9 1,870.4 1,240.9 629.4 − − 0.0 9.7 − 285.5 158.3 127.2 18 4,265.7 1,144.1 1,836.3 1,238.6 597.7 − − 0.0 9.0 − 321.6 194.8 126.8 25 4,278.9 1,139.9 1,824.0 1,230.8 593.2 − − 0.0 8.0 − 352.3 225.4 126.9
Sep 1 4,283.7 1,142.1 1,891.7 1,263.4 628.3 − − 0.0 8.4 − 286.7 158.8 128.0 8 4,299.8 1,142.7 1,900.0 1,264.2 635.8 − − 0.0 14.5 − 292.4 162.5 129.9 15 4,308.9 1,142.0 1,888.0 1,238.9 649.0 − − 0.0 6.7 − 324.3 198.1 126.2 22 4,328.2 1,140.2 1,865.2 1,217.6 647.6 − − 0.0 10.7 − 362.3 236.2 126.1 29 4,318.6 1,143.5 1,824.3 1,175.2 649.0 − − 0.1 9.7 − 351.9 229.6 122.3
Oct 6 4,337.7 1,144.9 1,920.2 1,257.3 662.9 − − 0.0 9.2 − 321.4 200.2 121.2 13 4,371.6 1,145.2 1,942.5 1,283.7 658.8 − − 0.0 8.1 − 333.7 210.4 123.3 20 4,363.4 1,143.0 1,913.7 1,261.7 652.0 − − 0.0 6.8 − 357.1 233.5 123.6 27 4,371.2 1,145.3 1,950.4 1,312.1 638.3 − − 0.0 8.3 − 327.6 205.1 122.5
Nov 3 4,373.2 1,147.3 1,982.6 1,312.0 670.6 − − 0.0 6.4 − 279.8 158.6 121.2 10 4,387.7 1,143.2 1,982.6 1,303.4 679.0 − − 0.2 8.6 − 296.3 174.6 121.7 17 4,411.9 1,141.3 1,972.6 1,274.8 697.8 − − 0.0 7.5 − 337.3 208.6 128.7 24 4,427.5 1,140.0 1,972.9 1,270.4 702.4 − − 0.0 6.5 − 360.2 232.0 128.1
2017 Dec 1 4,440.8 1,146.7 2,034.8 1,340.0 694.9 − − 0.0 6.5 − 292.9 170.3 122.5 8 4,456.6 1,153.6 2,029.1 1,334.8 694.3 − − 0.0 11.8 − 287.0 165.3 121.8 15 4,471.9 1,157.0 1,984.9 1,319.6 665.2 − − 0.0 12.9 − 321.3 197.1 124.2 22 4,487.3 1,168.2 1,942.8 1,266.5 676.2 − − 0.0 19.5 − 295.8 177.5 118.3 29 4,471.7 1,170.7 1,881.6 1,185.8 695.8 − − 0.0 21.0 − 287.6 168.5 119.2
2018 Jan 5 4,466.0 1,162.6 1,962.0 1,262.5 699.4 − − 0.0 11.8 − 280.1 163.7 116.4 12 4,472.7 1,154.9 1,995.2 1,291.5 703.5 − − 0.2 8.6 − 298.9 183.1 115.8 19 4,484.0 1,149.5 1,987.8 1,294.8 692.9 − − 0.1 11.7 − 317.0 198.7 118.3 26 4,493.1 1,146.4 1,998.1 1,316.7 681.2 − − 0.2 11.1 − 349.8 230.6 119.2
Feb 2 4,491.2 1,148.9 2,021.1 1,330.9 690.2 − − 0.0 12.0 − 296.1 173.1 123.0 9 4,493.7 1,149.5 2,023.5 1,329.4 694.0 − − 0.2 12.4 − 303.6 184.0 119.6 16 4,504.8 1,147.9 1,986.8 1,294.5 692.2 − − 0.0 12.3 − 342.2 219.5 122.6 23 4,511.5 1,146.0 1,958.5 1,280.8 677.6 − − 0.1 11.4 − 374.3 250.2 124.1
Mar 2 4,519.4 1,149.7 2,009.8 1,347.2 662.5 − − 0.1 12.2 − 316.2 190.4 125.8
Deutsche Bundesbank2016 Apr 1 112.7 252.5 272.4 180.8 91.6 − − − − − 96.3 24.2 72.1 May 1 159.5 253.4 293.2 200.0 93.2 − − − − − 121.2 41.8 79.4 June 1 214.0 255.6 299.7 214.4 85.3 − − 0.0 − − 130.6 56.5 74.1
July 1 209.4 258.0 320.7 235.4 85.4 − − 0.0 − − 101.4 25.3 76.1 Aug 1 239.2 257.1 334.5 242.3 92.2 − − 0.0 0.0 − 110.4 33.5 76.9 Sep 1 305.3 257.9 362.6 244.7 117.9 − − − 0.1 − 122.4 43.9 78.6
Oct 1 312.2 259.2 380.0 260.5 119.5 − − − 0.3 − 110.8 35.6 75.3 Nov 1 376.5 259.5 428.0 293.1 134.9 − − − 0.3 − 116.6 40.0 76.6 Dec 1 392.7 264.9 411.4 284.9 126.4 − − − 0.5 − 105.8 32.5 73.4
2017 Jan 1 449.7 260.9 499.0 348.3 150.7 − − − 2.2 − 92.9 17.1 75.8 Feb 1 484.8 261.3 507.1 347.0 160.1 − − − 1.7 − 97.3 12.4 84.9 Mar 1 558.0 262.1 543.2 353.8 189.3 − − − 1.7 − 115.4 26.8 88.6
Apr 1 582.8 264.7 591.2 402.7 188.5 − − − 4.1 − 88.9 20.0 68.9 May 1 608.2 264.9 607.1 433.6 173.5 − − − 2.5 − 102.9 27.8 75.1 June 1 616.4 267.4 586.1 418.6 167.5 − − − 3.4 − 112.9 40.0 72.9
July 1 621.0 268.8 597.0 422.3 174.7 − − 0.0 3.8 − 112.2 40.8 71.4 Aug 1 625.1 268.4 585.6 422.9 162.7 − − 0.0 4.1 − 114.7 47.0 67.7 Sep 1 663.9 269.0 613.2 411.1 202.1 − − 0.0 3.8 − 121.5 59.3 62.2
Oct 1 644.4 269.8 624.6 478.1 146.5 − − 0.0 3.6 − 100.7 45.1 55.6 Nov 1 665.0 269.3 665.2 458.0 207.2 − − 0.0 2.8 − 103.9 48.5 55.4 Dec 1 727.7 275.4 609.8 392.8 217.0 − − 0.0 2.7 − 118.8 67.0 51.8
2018 Jan 1 699.8 269.8 665.2 449.5 215.7 − − 0.0 5.0 − 92.7 38.5 54.2 Feb 1 738.4 269.9 672.8 463.4 209.4 − − 0.0 6.5 − 105.6 47.8 57.8
* The consolidated financial statement of the Eurosystem comprises the financial specific weekly dates; for the Bundesbank: end-of-month financial statements.statement of the European Central Bank (ECB) and the financial statements of the 2 According to the accounting regime chosen by the Eurosystem on the issue of euronational central banks of the euro area member states (NCBs). The balance sheet banknotes, a share of 8% of the total value of the euro banknotes in circulation isitems for foreign currency, securities, gold and financial instruments are valued at allocated to the ECB on a monthly basis. The counterpart of this adjustment ismarket rates at the end of the quarter. 1 For Eurosystem: financial statements for disclosed as an “Intra-Eurosystem liability related to euro banknote issue". The

Deutsche Bundesbank
19
Monthly Report
March 2018
III Consolidated financial statement of the Eurosystem
Liabilities to non-euro arearesidents denominated inforeign currency
Intra- Eurosystem
Liabilities Liabilities Liabilities Counterpart liability Onto non-euro to euro area Deposits, arising of special related to reportingarea residents residents balances from the drawing euro Capital date/denominated in foreign and other rights allocated Other banknote Revaluation and End ofcredit facilityin euro currency Total liabilities under ERM II by the IMF issue 2 accounts reserves month 1 liabilities 3
Eurosystem 4
222.5 4.1 10.8 10.8 − 56.7 224.4 − 371.9 102.3 2017 June 30
168.8 5.0 10.3 10.3 − 56.7 222.5 − 371.9 102.3 July 7156.4 5.0 11.2 11.2 − 56.7 222.5 − 371.9 102.3 14170.7 5.5 10.8 10.8 − 56.7 223.5 − 371.9 102.3 21169.3 6.2 12.7 12.7 − 56.7 223.2 − 371.9 102.3 28
175.8 8.9 10.5 10.5 − 56.7 224.2 − 371.9 102.3 Aug 4171.3 8.7 10.8 10.8 − 56.7 222.7 − 371.9 102.3 11182.2 7.5 10.9 10.9 − 56.7 223.3 − 371.9 102.3 18181.3 7.4 10.9 10.9 − 56.7 224.2 − 371.9 102.3 25
182.1 6.8 10.1 10.1 − 56.7 224.8 − 371.9 102.3 Sep 1175.2 8.5 11.0 11.0 − 56.7 224.7 − 371.9 102.3 8175.5 7.7 9.8 9.8 − 56.7 224.1 − 371.9 102.3 15173.6 8.7 10.8 10.8 − 56.7 225.9 − 371.9 102.3 22231.1 5.9 10.4 10.4 − 55.6 218.9 − 364.9 102.3 29
177.8 9.0 10.8 10.8 − 55.6 221.5 − 364.9 102.3 Oct 6176.5 8.6 11.4 11.4 − 55.6 222.7 − 364.9 102.3 13175.1 8.9 12.4 12.4 − 55.6 223.5 − 364.9 102.3 20171.6 9.5 11.3 11.3 − 55.6 224.3 − 364.9 102.3 27
186.8 9.8 10.9 10.9 − 55.6 226.5 − 364.9 102.3 Nov 3186.4 8.2 11.8 11.8 − 55.6 227.7 − 364.9 102.3 10174.4 10.1 11.6 11.6 − 55.6 234.3 − 364.9 102.3 17170.2 8.7 11.2 11.2 − 55.6 235.0 − 364.9 102.3 24
185.5 9.2 11.4 11.4 − 55.6 230.9 − 364.9 102.3 2017 Dec 1198.2 8.5 12.8 12.8 − 55.6 232.7 − 364.9 102.3 8219.5 7.5 12.0 12.0 − 55.6 233.9 − 364.9 102.3 15286.1 6.5 11.9 11.9 − 55.6 233.6 − 364.9 102.3 22354.6 3.8 11.3 11.3 − 55.2 225.5 − 358.0 102.3 29
291.1 3.9 11.4 11.4 − 55.2 227.7 − 357.9 102.3 2018 Jan 5253.3 5.3 11.2 11.2 − 55.2 230.2 − 357.9 102.1 12252.1 7.0 12.1 12.1 − 55.2 231.6 − 357.9 102.2 19220.8 5.4 11.5 11.5 − 55.2 234.6 − 357.9 102.2 26
239.1 8.4 11.9 11.9 − 55.2 237.9 − 357.9 102.7 Feb 2237.9 7.5 12.7 12.7 − 55.2 230.8 − 357.9 102.7 9245.8 8.6 12.9 12.9 − 55.2 232.7 − 357.9 102.6 16251.9 9.0 12.4 12.4 − 55.2 232.5 − 357.9 102.6 23
260.4 8.5 12.7 12.7 − 55.2 234.1 − 357.9 102.7 Mar 2
Deutsche Bundesbank30.7 0.0 0.8 0.8 − 14.9 22.9 300.9 116.2 5.0 2016 Apr 27.2 0.0 1.4 1.4 − 14.9 23.1 303.9 116.2 5.0 May47.0 0.0 1.0 1.0 − 15.2 23.4 308.0 128.5 5.0 June
43.8 0.0 1.4 1.4 − 15.2 23.6 311.7 128.5 5.0 July48.9 0.0 1.7 1.7 − 15.2 23.7 314.1 128.5 5.0 Aug 70.3 0.0 1.1 1.1 − 15.1 24.0 318.8 128.0 5.0 Sep
66.5 0.0 1.0 1.0 − 15.1 24.3 322.0 128.0 5.0 Oct 74.7 0.0 1.0 1.0 − 15.1 24.4 323.9 128.0 5.0 Nov
117.0 0.0 1.2 1.2 − 15.4 24.7 327.3 119.7 5.0 Dec
100.5 0.0 0.6 0.6 − 15.4 25.2 328.3 119.7 5.0 2017 Jan 121.3 0.0 0.9 0.9 − 15.4 24.5 330.1 119.7 5.6 Feb 131.3 0.0 0.5 0.5 − 15.3 25.1 331.9 126.0 5.6 Mar
125.9 0.0 0.7 0.7 − 15.3 25.3 335.2 126.0 5.6 Apr 119.4 0.0 0.7 0.7 − 15.3 25.8 338.1 126.0 5.6 May140.4 0.0 1.1 1.1 − 14.7 26.2 342.8 115.8 5.6 June
130.0 0.0 1.7 1.7 − 14.7 26.4 345.0 115.8 5.6 July139.9 0.0 1.1 1.1 − 14.7 26.6 348.6 115.8 5.6 Aug 140.9 0.0 1.7 1.7 − 14.4 27.1 352.1 114.6 5.6 Sep
127.4 0.0 2.2 2.2 − 14.4 27.3 354.2 114.6 5.6 Oct 103.8 0.0 2.2 2.2 − 14.4 27.7 355.5 114.6 5.6 Nov 199.8 0.0 1.0 1.0 − 14.3 27.9 359.3 113.1 5.6 Dec
145.6 0.0 1.1 1.1 − 14.3 28.1 359.3 113.1 5.6 2018 Jan 160.9 0.0 1.6 1.6 − 14.3 26.8 361.3 113.1 5.7 Feb
remaining 92 % of the value of the euro banknote in circulation is also allocated to according to the aforementioned accounting regime and the value of euro bank-the NCBs on a monthly basis, and each NCB shows in its balance sheet the share of notes put into circulation is also disclosed as an “Intra-Eurosystem claim/ liabilitythe euro banknotes issued which corresponds to its paid-up share in the ECB’s related to banknote issue“. 3 For the Deutsche Bundesbank: including DM banknotescapital. The difference between the value of the euro banknotes allocated to the NCB still in circulation. 4 Source: ECB.

Deutsche Bundesbank
20
Monthly Report
March 2018
IV Banks
1 Assets and liabilities of monetary financial institutions (excluding the Bundesbank) in Germany *
Assets
€ billion
Lending to banks (MFIs) in the euro area Lending to non-banks (non-MFIs) in the
to banks in the home country to banks in other member states to non-banks in the home country
Enterprises and house-holds
Secur- Secur-Balance ities itiessheet Cash issued issued
Period total 1 in hand Total Total Loans by banks Total Loans by banks Total Total Total Loans
End of year or month
2009 7,436.1 17.2 2,480.5 1,813.2 1,218.4 594.8 667.3 449.5 217.8 3,638.3 3,187.9 2,692.9 2,357.5
2010 8,304.8 16.5 2,361.6 1,787.8 1,276.9 510.9 573.9 372.8 201.0 3,724.5 3,303.0 2,669.2 2,354.72011 8,393.3 16.4 2,394.4 1,844.5 1,362.2 482.2 550.0 362.3 187.7 3,673.5 3,270.5 2,709.4 2,415.12012 8,226.6 19.2 2,309.0 1,813.2 1,363.8 449.4 495.9 322.2 173.7 3,688.6 3,289.4 2,695.5 2,435.72013 7,528.9 18.7 2,145.0 1,654.8 1,239.1 415.7 490.2 324.6 165.6 3,594.3 3,202.1 2,616.3 2,354.02014 7,802.3 19.2 2,022.8 1,530.5 1,147.2 383.3 492.3 333.9 158.4 3,654.5 3,239.4 2,661.2 2,384.8
2015 7,665.2 19.5 2,013.6 1,523.8 1,218.0 305.8 489.8 344.9 144.9 3,719.9 3,302.5 2,727.4 2,440.02016 7,792.6 26.0 2,101.4 1,670.9 1,384.2 286.7 430.5 295.0 135.5 3,762.9 3,344.5 2,805.6 2,512.02017 7,710.8 32.1 2,216.3 1,821.1 1,556.3 264.8 395.2 270.1 125.2 3,801.7 3,400.7 2,918.8 2,610.1
2016 Apr 7,806.5 17.2 2,089.1 1,594.3 1,291.0 303.3 494.8 352.8 142.0 3,747.3 3,329.8 2,753.3 2,467.1 May 7,817.2 18.7 2,070.3 1,587.2 1,284.7 302.4 483.1 342.8 140.4 3,759.2 3,334.1 2,762.8 2,476.2 June 7,920.6 19.3 2,072.8 1,592.2 1,292.9 299.3 480.6 338.2 142.4 3,745.9 3,321.4 2,759.7 2,473.7
July 7,942.1 19.7 2,086.0 1,604.7 1,308.1 296.6 481.2 341.4 139.8 3,758.8 3,333.6 2,766.6 2,479.7 Aug 7,908.5 19.7 2,086.1 1,611.7 1,317.0 294.7 474.4 336.0 138.5 3,758.4 3,335.4 2,774.3 2,486.3 Sep 7,863.9 21.0 2,074.5 1,636.4 1,343.9 292.5 438.2 300.7 137.5 3,766.0 3,343.0 2,785.6 2,497.3
Oct 7,868.7 22.8 2,079.5 1,641.2 1,349.4 291.8 438.3 301.6 136.7 3,773.0 3,349.9 2,793.6 2,502.5 Nov 7,911.6 22.9 2,154.7 1,712.1 1,421.7 290.5 442.6 306.3 136.2 3,785.7 3,361.6 2,810.0 2,518.4 Dec 7,792.6 26.0 2,101.4 1,670.9 1,384.2 286.7 430.5 295.0 135.5 3,762.9 3,344.5 2,805.6 2,512.0
2017 Jan 7,889.3 24.6 2,210.1 1,777.0 1,490.7 286.3 433.1 299.8 133.3 3,769.9 3,347.6 2,813.5 2,519.3 Feb 7,944.8 23.9 2,225.4 1,783.3 1,497.9 285.4 442.1 307.6 134.5 3,774.5 3,347.6 2,819.5 2,525.6 Mar 7,926.1 23.6 2,237.5 1,797.8 1,513.2 284.6 439.7 306.9 132.7 3,776.8 3,351.3 2,828.1 2,533.8
Apr 7,954.6 24.7 2,276.6 1,847.6 1,563.1 284.6 428.9 298.2 130.8 3,780.1 3,357.1 2,836.6 2,541.1 May 7,947.0 25.6 2,286.5 1,864.4 1,579.4 285.0 422.1 290.1 132.0 3,782.1 3,360.7 2,847.3 2,552.6 June 7,849.7 27.3 2,245.7 1,830.9 1,548.9 282.1 414.8 284.2 130.6 3,780.7 3,364.7 2,859.4 2,559.7
July 7,818.7 26.6 2,258.5 1,840.3 1,560.2 280.0 418.2 289.0 129.2 3,787.1 3,370.5 2,867.1 2,567.3 Aug 7,807.7 27.5 2,243.1 1,828.2 1,553.7 274.5 415.0 286.9 128.0 3,792.2 3,377.0 2,876.6 2,576.3 Sep 7,811.3 28.4 2,262.7 1,847.3 1,578.3 269.0 415.4 288.4 127.0 3,799.4 3,385.3 2,890.2 2,589.5
Oct 7,825.7 28.4 2,285.3 1,873.3 1,604.0 269.2 412.1 285.1 127.0 3,804.7 3,393.5 2,899.1 2,598.2 Nov 7,849.9 28.0 2,312.8 1,901.5 1,633.0 268.5 411.3 285.5 125.8 3,818.1 3,411.2 2,919.0 2,612.6 Dec 7,710.8 32.1 2,216.3 1,821.1 1,556.3 264.8 395.2 270.1 125.2 3,801.7 3,400.7 2,918.8 2,610.1
2018 Jan 7,818.6 29.2 2,297.6 1,892.5 1,626.0 266.5 405.0 280.3 124.8 3,814.0 3,407.4 2,930.5 2,622.5
Changes 3
2010 − 136.3 − 0.7 − 111.6 − 15.6 58.5 − 74.1 − 95.9 − 80.9 − 15.1 96.4 126.0 − 13.7 0.72011 54.1 − 0.1 32.6 58.7 91.7 − 33.0 − 26.0 − 12.1 − 13.9 − 51.8 − 35.3 38.7 56.72012 − 129.2 2.9 − 81.9 − 28.4 3.0 − 31.4 − 53.5 − 39.7 − 13.8 27.5 27.7 17.0 28.82013 − 703.6 − 0.5 − 257.1 − 249.2 − 216.5 − 32.7 − 7.9 1.6 − 9.5 13.6 16.6 23.6 21.62014 206.8 0.4 − 126.2 − 128.6 − 95.3 − 33.4 2.4 7.2 − 4.8 55.1 40.0 52.3 36.8
2015 − 191.4 0.3 − 18.2 − 12.1 66.1 − 78.2 − 6.1 6.6 − 12.8 64.8 64.1 68.1 56.62016 184.3 6.5 120.3 178.4 195.3 − 16.8 − 58.1 − 49.2 − 8.8 57.5 53.4 88.8 81.02017 8.0 6.1 135.9 165.0 182.6 − 17.6 − 29.1 − 19.6 − 9.5 51.3 63.5 114.8 101.1
2016 May 35.2 1.5 8.4 20.2 21.4 − 1.2 − 11.7 − 10.1 − 1.6 11.4 5.3 10.6 10.0 June 108.2 0.7 3.7 5.6 8.2 − 2.6 − 1.9 − 4.2 2.3 − 10.4 − 11.4 − 1.7 − 1.2
July 23.5 0.4 13.1 12.4 15.2 − 2.8 0.7 3.4 − 2.7 14.5 13.4 8.2 7.3 Aug − 31.5 − 0.0 0.4 7.1 9.0 − 1.9 − 6.7 − 5.3 − 1.4 0.2 2.1 8.0 6.8 Sep − 42.7 1.3 − 11.3 24.9 26.9 − 2.0 − 36.3 − 35.2 − 1.1 8.3 8.3 11.7 11.4
Oct − 0.5 1.8 4.8 5.2 5.6 − 0.4 − 0.3 0.5 − 0.9 6.5 7.1 7.9 5.2 Nov 25.9 0.1 72.2 69.4 71.4 − 2.0 2.8 3.4 − 0.5 11.6 11.3 15.8 15.2 Dec − 121.7 3.1 − 53.6 − 41.3 − 37.8 − 3.5 − 12.3 − 11.7 − 0.6 − 23.1 − 17.0 − 4.4 − 6.1
2017 Jan 108.8 − 1.4 110.7 107.1 107.1 0.0 3.5 5.7 − 2.2 9.4 4.6 9.3 8.5 Feb 47.4 − 0.7 14.0 5.6 6.8 − 1.2 8.4 7.1 1.2 4.3 0.3 6.3 6.5 Mar − 13.0 − 0.3 13.1 14.9 15.5 − 0.6 − 1.8 − 0.0 − 1.8 3.2 4.3 9.0 8.9
Apr 40.0 1.1 41.0 50.7 50.5 0.2 − 9.7 − 7.8 − 1.9 4.7 6.8 9.4 8.2 May 8.8 0.9 12.6 18.0 17.1 0.9 − 5.4 − 6.8 1.4 4.0 4.6 9.0 9.9 June − 85.4 1.7 − 38.0 − 31.5 − 29.2 − 2.3 − 6.5 − 5.2 − 1.4 0.5 5.3 13.2 8.0
July − 14.3 − 0.7 14.5 10.5 12.2 − 1.7 4.0 5.2 − 1.2 8.6 7.1 8.9 8.6 Aug − 4.7 0.9 − 14.3 − 11.6 − 6.3 − 5.3 − 2.8 − 1.6 − 1.2 5.6 6.8 9.9 9.3 Sep 4.8 0.9 21.8 21.5 26.0 − 4.5 0.3 1.2 − 0.9 6.9 7.1 12.0 13.5
Oct 8.6 0.1 21.9 25.5 25.4 0.1 − 3.7 − 3.7 0.1 4.6 8.0 8.6 8.6 Nov 33.4 − 0.4 28.9 28.8 29.4 − 0.6 0.0 1.2 − 1.1 14.8 18.7 19.0 13.5 Dec − 126.4 4.1 − 90.1 − 74.7 − 72.0 − 2.7 − 15.4 − 15.0 − 0.4 − 15.2 − 10.0 0.1 − 2.4
2018 Jan 109.3 − 2.9 81.1 71.2 69.2 1.9 9.9 10.2 − 0.3 13.5 7.5 11.7 12.2
* This table serves to supplement the “Overall monetary survey“ in section II. Unlike by banks (including building and loan associations) − data from money marketthe other tables in section IV, this table includes − in addition to the figures reported funds. 1 See footnote 1 in Table IV.2. 2 Including debt securities arising from the

Deutsche Bundesbank
21
Monthly Report
March 2018
IV Banks
euro area Claims onnon-euro-area
to non-banks in other member states residents
General Enterprises and General government households government
Secur- Secur- of which Secur- of which Otherities Total Loans ities 2 Total Total Loans Total Loans ities Total Loans assets 1 Period
End of year or month
335.4 495.0 335.1 160.0 450.4 322.2 162.9 128.2 23.5 104.7 1,062.6 821.1 237.5 2009
314.5 633.8 418.4 215.3 421.6 289.2 164.2 132.4 24.8 107.6 1,021.0 792.7 1,181.1 2010294.3 561.1 359.8 201.2 403.1 276.9 161.2 126.2 32.6 93.6 995.1 770.9 1,313.8 2011259.8 594.0 350.3 243.7 399.2 275.1 158.1 124.1 30.4 93.7 970.3 745.0 1,239.4 2012262.3 585.8 339.2 246.6 392.3 267.6 144.6 124.6 27.8 96.9 921.2 690.5 849.7 2013276.4 578.2 327.9 250.4 415.0 270.0 142.7 145.0 31.9 113.2 1,050.1 805.0 1,055.8 2014
287.4 575.1 324.5 250.6 417.5 276.0 146.4 141.5 29.4 112.1 1,006.5 746.3 905.6 2015293.6 538.9 312.2 226.7 418.4 281.7 159.5 136.7 28.5 108.2 1,058.2 802.3 844.1 2016308.7 481.9 284.3 197.6 401.0 271.8 158.3 129.1 29.8 99.3 991.9 745.3 668.9 2017
286.2 576.5 331.6 244.8 417.6 272.8 150.4 144.8 30.0 114.8 1,005.6 741.1 947.2 2016 Apr 286.6 571.3 329.5 241.9 425.1 280.0 153.3 145.1 28.9 116.2 1,012.9 750.5 956.2 May286.0 561.8 323.9 237.9 424.4 281.2 155.2 143.2 28.9 114.3 1,036.4 774.7 1,046.2 June
286.8 567.0 327.0 240.0 425.2 284.2 159.3 141.0 28.9 112.1 1,041.7 785.1 1,036.0 July288.0 561.0 324.9 236.1 423.1 283.3 159.7 139.8 29.1 110.7 1,042.6 786.2 1,001.7 Aug 288.3 557.5 323.0 234.5 422.9 282.2 157.8 140.7 29.8 110.9 1,030.5 774.4 971.9 Sep
291.0 556.4 326.3 230.0 423.0 284.6 162.1 138.5 29.5 108.9 1,077.9 823.1 915.5 Oct 291.6 551.6 321.9 229.7 424.1 285.9 161.9 138.3 29.2 109.1 1,065.1 811.1 883.2 Nov 293.6 538.9 312.2 226.7 418.4 281.7 159.5 136.7 28.5 108.2 1,058.2 802.3 844.1 Dec
294.2 534.1 312.2 221.9 422.4 284.6 163.1 137.7 28.6 109.2 1,080.8 826.0 803.9 2017 Jan 294.0 528.0 311.6 216.5 427.0 289.4 165.6 137.6 28.6 109.0 1,095.4 843.6 825.5 Feb 294.3 523.2 307.1 216.1 425.5 290.8 167.2 134.7 29.0 105.7 1,097.1 847.5 791.1 Mar
295.5 520.5 307.9 212.6 423.0 287.1 167.8 135.8 29.9 105.9 1,080.7 832.2 792.5 Apr 294.6 513.4 298.9 214.6 421.4 288.5 166.8 132.9 28.9 103.9 1,056.3 808.0 796.5 May299.7 505.4 296.4 208.9 416.0 283.4 162.6 132.6 29.9 102.6 1,064.9 817.0 731.1 June
299.8 503.4 298.3 205.1 416.6 285.0 164.1 131.7 29.9 101.8 1,028.5 780.9 717.9 July300.4 500.4 293.4 207.0 415.2 283.8 165.2 131.4 30.0 101.4 1,011.0 765.3 733.9 Aug 300.7 495.1 289.0 206.1 414.1 283.0 167.9 131.1 29.8 101.3 1,021.2 776.3 699.6 Sep
301.0 494.4 289.2 205.3 411.2 281.6 167.7 129.6 30.4 99.2 1,014.2 768.9 693.0 Oct 306.4 492.2 287.3 205.0 406.8 276.8 164.2 130.0 29.8 100.2 1,005.3 759.4 685.6 Nov 308.7 481.9 284.3 197.6 401.0 271.8 158.3 129.1 29.8 99.3 991.9 745.3 668.9 Dec
308.0 477.0 282.8 194.2 406.5 278.8 163.9 127.7 29.7 97.9 1,009.1 758.2 668.7 2018 Jan
Changes 3
− 14.3 139.7 83.4 56.3 − 29.6 − 36.4 0.2 6.8 3.1 3.7 − 74.1 − 61.9 − 46.3 2010− 18.0 − 74.0 − 59.1 − 14.9 − 16.6 − 13.8 − 5.5 − 2.7 8.0 − 10.7 − 39.5 − 34.9 112.9 2011− 11.8 10.7 − 10.5 21.2 − 0.2 − 0.7 − 1.5 0.5 − 2.2 2.7 − 15.5 − 17.7 − 62.2 2012
2.0 − 7.0 − 10.9 3.9 − 3.0 − 3.4 − 9.3 0.5 − 2.6 3.1 − 38.8 − 47.2 − 420.8 201315.5 − 12.3 − 15.1 2.9 15.1 0.4 − 4.0 14.6 0.9 13.8 83.6 72.0 194.0 2014
11.5 − 3.9 − 4.2 0.3 0.7 4.4 1.8 − 3.7 − 1.0 − 2.8 − 88.3 − 101.0 − 150.1 20157.8 − 35.4 − 12.1 − 23.3 4.0 8.2 14.6 − 4.2 − 0.9 − 3.3 51.4 55.0 − 51.4 2016
13.7 − 51.3 − 22.8 − 28.5 − 12.2 − 3.4 4.0 − 8.7 0.1 − 8.9 − 12.3 − 6.7 − 173.1 2017
0.6 − 5.2 − 2.3 − 2.9 6.1 5.7 1.4 0.4 − 1.0 1.4 0.9 3.7 13.0 2016 May− 0.5 − 9.7 − 5.7 − 4.0 1.0 2.0 2.4 − 1.0 0.0 − 1.0 24.7 25.5 89.5 June
0.8 5.3 3.1 2.2 1.0 3.2 4.4 − 2.2 − 0.0 − 2.1 6.7 11.9 − 11.1 July1.2 − 5.9 − 2.0 − 3.9 − 1.9 − 0.6 0.6 − 1.3 0.2 − 1.5 2.3 2.4 − 34.3 Aug 0.3 − 3.4 − 1.8 − 1.6 0.0 − 0.8 − 1.7 0.8 0.6 0.1 − 10.8 − 10.5 − 30.3 Sep
2.8 − 0.9 3.5 − 4.3 − 0.6 1.9 4.0 − 2.5 − 0.3 − 2.2 42.7 44.1 − 56.4 Oct 0.6 − 4.5 − 4.3 − 0.2 0.4 0.6 − 1.2 − 0.2 − 0.4 0.1 − 25.7 − 24.1 − 32.3 Nov 1.7 − 12.6 − 9.7 − 2.9 − 6.0 − 4.4 − 2.3 − 1.6 − 0.7 − 0.9 − 9.4 − 11.4 − 38.8 Dec
0.8 − 4.7 0.0 − 4.8 4.9 3.7 4.2 1.2 0.1 1.1 30.4 31.0 − 40.2 2017 Jan − 0.2 − 6.1 − 0.6 − 5.4 4.0 4.2 2.1 − 0.2 0.0 − 0.2 8.2 11.7 21.6 Feb
0.2 − 4.7 − 4.4 − 0.3 − 1.2 1.7 2.1 − 2.9 0.4 − 3.3 5.5 7.5 − 34.5 Mar
1.2 − 2.6 0.8 − 3.4 − 2.1 − 3.3 1.1 1.2 0.9 0.3 − 8.2 − 7.4 1.4 Apr − 0.8 − 4.4 − 6.4 2.0 − 0.6 2.3 − 0.1 − 3.0 − 1.0 − 2.0 − 12.7 − 13.1 4.0 May
5.2 − 7.9 − 2.3 − 5.6 − 4.8 − 3.5 − 2.7 − 1.3 0.1 − 1.3 15.6 15.3 − 65.2 June
0.3 − 1.7 2.0 − 3.7 1.4 2.4 2.4 − 1.0 − 0.2 − 0.8 − 24.4 − 24.9 − 12.3 July0.6 − 3.0 − 4.9 1.9 − 1.2 − 0.8 1.5 − 0.4 0.0 − 0.4 − 12.9 − 11.3 16.0 Aug
− 1.5 − 4.9 − 4.2 − 0.7 − 0.2 0.2 2.4 − 0.4 − 0.2 − 0.2 8.3 9.0 − 33.1 Sep
0.1 − 0.7 0.2 − 0.9 − 3.4 − 1.8 − 0.4 − 1.6 0.6 − 2.2 − 11.3 − 11.3 − 6.6 Oct 5.6 − 0.4 − 0.1 − 0.3 − 3.9 − 4.3 − 3.1 0.4 − 0.6 1.0 − 2.5 − 3.6 − 7.3 Nov 2.5 − 10.1 − 2.8 − 7.2 − 5.2 − 4.3 − 5.4 − 0.8 0.0 − 0.9 − 8.3 − 9.5 − 16.9 Dec
− 0.6 − 4.1 − 0.9 − 3.2 5.9 7.2 5.7 − 1.3 − 0.1 − 1.2 17.8 13.5 − 0.2 2018 Jan
exchange of equalisation claims. 3 Statistical breaks have been eliminated fromthe flow figures (see also footnote * in Table II.1).

Deutsche Bundesbank
22
Monthly Report
March 2018
IV Banks
1 Assets and liabilities of monetary financial institutions (excluding the Bundesbank) in Germany *
Liabilities
€ billion
Deposits of banks (MFIs) Deposits of non-banks (non-MFIs) in the euro areain the euro area
Deposits of non-banks in the home country Deposits of non-banks
With agreed At agreedof banks maturities notice
Balance in the in other of which of whichsheet home member Over- up to up to Over-
Period total 1 Total country states Total Total night Total 2 years Total 3 months Total night
End of year or month
2009 7,436.1 1,589.7 1,355.6 234.0 2,818.0 2,731.3 997.8 1,139.1 356.4 594.4 474.4 63.9 17.7
2010 8,304.8 1,495.8 1,240.1 255.7 2,925.8 2,817.6 1,089.1 1,110.3 304.6 618.2 512.5 68.4 19.32011 8,393.3 1,444.8 1,210.3 234.5 3,033.4 2,915.1 1,143.3 1,155.8 362.6 616.1 515.3 78.8 25.92012 8,226.6 1,371.0 1,135.9 235.1 3,091.4 2,985.2 1,294.9 1,072.8 320.0 617.6 528.4 77.3 31.22013 7,528.9 1,345.4 1,140.3 205.1 3,130.5 3,031.5 1,405.3 1,016.2 293.7 610.1 532.4 81.3 33.82014 7,802.3 1,324.0 1,112.3 211.7 3,197.7 3,107.4 1,514.3 985.4 298.1 607.7 531.3 79.7 34.4
2015 7,665.2 1,267.8 1,065.9 201.9 3,307.1 3,215.1 1,670.2 948.4 291.5 596.4 534.5 80.8 35.32016 7,792.6 1,205.2 1,033.2 172.0 3,411.3 3,318.5 1,794.8 935.3 291.2 588.5 537.0 84.2 37.22017 7,710.8 1,233.6 1,048.6 184.9 3,529.1 3,411.1 1,936.6 891.7 274.2 582.8 541.0 108.6 42.5
2016 Apr 7,806.5 1,258.6 1,060.8 197.8 3,332.8 3,240.8 1,704.9 943.2 291.0 592.7 535.6 82.4 38.4 May 7,817.2 1,230.3 1,027.5 202.8 3,348.6 3,253.7 1,717.2 945.3 292.6 591.1 535.0 84.9 41.7 June 7,920.6 1,241.7 1,039.1 202.6 3,350.9 3,250.2 1,718.1 942.1 290.9 590.0 534.5 89.4 44.9
July 7,942.1 1,226.7 1,023.7 203.0 3,362.7 3,267.1 1,733.1 945.0 295.2 589.1 534.5 85.5 40.7 Aug 7,908.5 1,211.5 1,016.5 195.0 3,369.5 3,274.0 1,744.5 941.2 292.8 588.4 534.6 85.5 40.4 Sep 7,863.9 1,194.8 1,029.1 165.7 3,372.1 3,274.9 1,743.8 944.0 297.4 587.1 534.0 88.0 41.4
Oct 7,868.7 1,186.8 1,025.4 161.3 3,378.8 3,286.5 1,763.9 936.0 288.5 586.6 534.3 83.7 37.1 Nov 7,911.6 1,205.6 1,042.2 163.4 3,420.0 3,320.5 1,795.0 939.3 292.8 586.1 534.4 89.8 43.4 Dec 7,792.6 1,205.2 1,033.2 172.0 3,411.3 3,318.5 1,794.8 935.3 291.2 588.5 537.0 84.2 37.2
2017 Jan 7,889.3 1,237.0 1,053.4 183.6 3,433.4 3,337.5 1,807.5 941.6 300.1 588.4 537.7 88.4 42.2 Feb 7,944.8 1,245.6 1,055.3 190.3 3,435.3 3,336.9 1,812.7 935.8 295.0 588.5 538.3 89.6 41.7 Mar 7,926.1 1,259.8 1,077.3 182.5 3,433.9 3,334.5 1,813.5 934.4 296.4 586.6 537.0 91.2 39.6
Apr 7,954.6 1,254.1 1,075.4 178.8 3,452.0 3,352.3 1,840.8 925.4 290.7 586.2 536.9 91.2 41.7 May 7,947.0 1,259.3 1,079.9 179.4 3,463.2 3,360.6 1,848.6 926.4 292.7 585.7 536.8 93.5 44.2 June 7,849.7 1,235.2 1,054.2 181.0 3,477.7 3,362.0 1,865.6 911.8 290.3 584.6 536.2 107.1 44.8
July 7,818.7 1,239.8 1,062.3 177.5 3,470.9 3,353.4 1,862.3 907.6 287.9 583.4 538.2 107.5 45.8 Aug 7,807.7 1,243.3 1,065.8 177.4 3,486.1 3,368.4 1,880.5 905.5 285.7 582.4 537.9 108.3 47.5 Sep 7,811.3 1,256.2 1,071.9 184.3 3,494.8 3,371.4 1,886.8 902.8 284.3 581.8 537.9 114.7 50.7
Oct 7,825.7 1,272.0 1,081.9 190.1 3,505.8 3,388.0 1,912.7 893.9 277.3 581.5 538.4 109.2 46.3 Nov 7,849.9 1,275.5 1,081.0 194.5 3,542.9 3,417.4 1,939.9 896.5 276.9 581.0 538.6 113.6 52.1 Dec 7,710.8 1,233.6 1,048.6 184.9 3,529.1 3,411.1 1,936.6 891.7 274.2 582.8 541.0 108.6 42.5
2018 Jan 7,818.6 1,250.9 1,062.2 188.7 3,539.7 3,419.0 1,944.6 892.2 276.7 582.3 539.6 110.6 46.4
Changes 4
2010 − 136.3 − 75.2 − 99.4 24.2 72.3 59.7 88.7 − 53.0 − 52.2 24.0 38.3 − 4.4 2.22011 54.1 − 48.4 − 28.8 − 19.6 102.1 97.4 52.4 47.6 58.8 − 2.6 1.3 4.8 6.52012 − 129.2 − 68.7 − 70.0 1.3 57.8 67.1 156.1 − 90.4 − 50.2 1.5 14.1 − 1.4 5.42013 − 703.6 − 106.2 − 73.9 − 32.3 39.1 47.8 111.5 − 56.3 − 26.6 − 7.3 4.0 2.6 3.32014 206.8 − 28.4 − 32.2 3.9 62.7 71.6 106.0 − 32.1 3.1 − 2.4 − 2.4 − 2.5 − 0.0
2015 − 191.4 − 62.1 − 50.3 − 11.9 104.1 104.8 153.2 − 37.0 − 10.1 − 11.3 4.2 − 0.4 − 0.32016 184.3 − 31.6 − 2.2 − 29.4 105.7 105.2 124.3 − 11.1 1.4 − 8.0 2.4 2.7 1.92017 8.0 30.6 14.8 15.8 124.2 107.7 145.8 − 32.5 − 15.3 − 5.6 1.5 16.4 5.8
2016 May 35.2 − 1.4 − 5.7 4.2 14.8 12.0 11.7 1.8 1.4 − 1.5 − 0.6 2.4 3.2 June 108.2 13.0 12.4 0.6 2.2 − 3.0 1.0 − 2.9 − 1.5 − 1.1 − 0.4 3.9 3.2
July 23.5 − 14.9 − 15.4 0.5 11.9 17.1 15.1 2.9 4.3 − 0.9 − 0.1 − 3.9 − 4.2 Aug − 31.5 − 15.0 − 7.1 − 7.9 7.0 7.0 11.5 − 3.8 − 2.4 − 0.7 0.1 0.1 − 0.3 Sep − 42.7 − 16.5 12.7 − 29.2 2.7 1.0 − 0.6 2.9 4.6 − 1.2 − 0.5 2.5 1.1
Oct − 0.5 − 8.4 − 3.7 − 4.7 6.2 11.2 19.8 − 8.1 − 8.9 − 0.6 0.2 − 4.3 − 4.4 Nov 25.9 17.3 15.9 1.4 39.7 32.7 30.1 3.0 4.0 − 0.4 0.1 5.8 6.1 Dec − 121.7 − 0.9 − 9.3 8.4 − 9.0 − 2.2 − 0.4 − 4.1 − 1.3 2.3 2.7 − 5.7 − 6.2
2017 Jan 108.8 32.8 20.7 12.1 23.0 19.7 13.3 6.4 9.1 − 0.0 0.7 4.4 5.1 Feb 47.4 7.6 1.6 6.1 1.2 − 0.7 4.7 − 5.5 − 4.8 0.1 0.7 1.1 − 0.5 Mar − 13.0 14.8 22.2 − 7.4 − 1.0 − 2.1 1.1 − 1.3 1.5 − 1.9 − 1.4 1.6 − 2.1
Apr 40.0 − 4.4 − 1.3 − 3.1 19.1 18.7 27.8 − 8.7 − 5.5 − 0.5 − 0.0 0.2 2.2 May 8.8 6.7 5.3 1.5 12.7 9.5 8.7 1.3 2.2 − 0.5 − 0.1 2.5 2.6 June − 85.4 − 22.2 − 24.3 2.1 15.3 11.1 17.5 − 5.4 − 2.3 − 1.0 − 0.7 4.7 0.7
July − 14.3 5.3 8.9 − 3.5 − 5.3 − 7.4 − 2.4 − 3.9 − 2.1 − 1.2 − 0.4 0.7 1.1 Aug − 4.7 4.1 3.8 0.3 15.8 15.5 18.5 − 1.9 − 2.1 − 1.1 − 0.3 0.9 1.7 Sep 4.8 3.0 − 3.8 6.7 8.4 2.9 6.1 − 2.6 − 1.5 − 0.6 0.0 6.4 3.2
Oct 8.6 15.2 9.8 5.5 10.3 16.0 25.5 − 9.1 − 7.1 − 0.3 0.5 − 5.6 − 4.4 Nov 33.4 4.6 − 0.3 4.9 37.9 30.2 27.9 2.8 − 0.2 − 0.5 0.2 4.6 5.9 Dec − 126.4 − 36.9 − 27.7 − 9.2 − 13.1 − 5.7 − 3.0 − 4.6 − 2.6 1.9 2.4 − 4.9 − 9.6
2018 Jan 109.3 17.3 13.5 3.8 10.6 8.0 8.1 0.5 2.5 − 0.6 0.1 2.0 3.9
* This table serves to supplement the “Overall monetary survey“ in section II. Unlike by banks (including building and loan associations) − data from money marketthe other tables in section IV, this table includes − in addition to the figures reported funds. 1 See footnote 1 in Table IV.2. 2 Excluding deposits of central

Deutsche Bundesbank
23
Monthly Report
March 2018
IV Banks
Debt securitiesissued 3
in other member states 2 Deposits ofcentral governments
With agreed At agreed Liabilitiesmaturities notice arising
of which from Money of which Liabilitiesdomestic market with to non-repos with
of which of which central non-banks fund euro- Capitalmaturitiesup to up to govern- in the shares of up to area and Other
Total 2 years Total 3 months Total ments euro area issued 3 Total reserves Period2 years 3 residents Liabilities 1
End of year or month
43.7 17.0 2.5 2.0 22.8 22.2 80.5 11.4 1,500.5 146.3 565.6 454.8 415.6 2009
46.4 16.1 2.8 2.2 39.8 38.7 86.7 9.8 1,407.8 82.3 636.0 452.6 1,290.2 201049.6 18.4 3.3 2.5 39.5 37.9 97.1 6.2 1,345.7 75.7 561.5 468.1 1,436.6 201142.3 14.7 3.8 2.8 28.9 25.9 80.4 7.3 1,233.1 56.9 611.4 487.3 1,344.7 201244.0 16.9 3.5 2.7 17.6 16.0 6.7 4.1 1,115.2 39.0 479.5 503.0 944.5 201342.0 15.9 3.3 2.7 10.6 10.5 3.4 3.5 1,077.6 39.6 535.3 535.4 1,125.6 2014
42.2 16.0 3.3 2.8 11.3 9.6 2.5 3.5 1,017.7 48.3 526.2 569.3 971.1 201543.9 15.8 3.1 2.6 8.6 7.9 2.2 2.4 1,030.3 47.2 643.4 591.5 906.3 201663.2 19.7 2.9 2.6 9.4 8.7 3.3 2.1 994.5 37.8 603.4 686.0 658.8 2017
40.7 17.0 3.2 2.7 9.6 7.9 3.7 3.1 1,019.3 50.3 606.6 583.6 998.9 2016 Apr 40.0 15.9 3.2 2.7 10.0 8.1 3.5 2.7 1,029.8 49.8 611.6 583.9 1,007.0 May41.3 17.1 3.2 2.7 11.3 8.8 2.5 2.7 1,023.9 50.0 618.1 587.3 1,093.4 June
41.6 16.2 3.2 2.7 10.1 8.1 3.4 2.5 1,021.8 56.6 656.1 578.1 1,090.9 July42.0 17.0 3.2 2.7 10.0 7.9 3.2 2.4 1,020.1 52.7 663.4 581.9 1,056.4 Aug 43.4 17.9 3.1 2.7 9.2 8.1 2.9 2.5 1,011.1 51.9 655.7 596.9 1,028.0 Sep
43.6 16.6 3.1 2.6 8.5 7.6 3.2 2.4 1,019.6 50.7 710.2 594.9 972.9 Oct 43.4 16.0 3.1 2.6 9.7 8.2 3.0 2.4 1,035.2 48.4 711.7 591.2 942.6 Nov 43.9 15.8 3.1 2.6 8.6 7.9 2.2 2.4 1,030.3 47.2 643.4 591.5 906.3 Dec
43.2 15.6 3.0 2.6 7.5 6.9 4.8 2.3 1,043.2 47.5 716.8 585.0 866.9 2017 Jan 44.8 18.0 3.0 2.6 8.8 7.7 4.5 2.3 1,050.8 48.0 734.1 588.5 883.7 Feb 48.6 19.9 3.0 2.6 8.3 7.9 2.6 2.2 1,045.7 45.9 730.2 594.1 857.6 Mar
46.6 18.3 3.0 2.6 8.5 7.6 3.5 2.2 1,042.1 43.9 749.0 598.3 853.4 Apr 46.4 17.2 3.0 2.6 9.1 7.8 2.4 2.1 1,042.5 44.6 724.9 603.2 849.4 May59.3 20.1 3.0 2.6 8.6 7.9 1.8 2.2 1,039.2 44.8 689.8 610.2 793.5 June
58.8 19.1 3.0 2.6 10.0 7.9 3.3 2.2 1,029.2 43.9 684.2 606.2 782.9 July57.8 18.3 3.0 2.6 9.4 7.9 3.4 2.4 1,024.7 42.6 643.1 608.1 796.7 Aug 61.0 20.5 2.9 2.6 8.7 8.0 2.6 2.4 1,015.2 42.2 669.5 612.4 758.2 Sep
59.9 18.3 2.9 2.6 8.6 7.9 2.3 2.2 1,008.9 40.7 667.9 612.7 753.9 Oct 58.6 16.7 2.9 2.6 11.8 8.3 2.6 2.2 1,004.7 40.1 664.4 609.8 747.9 Nov 63.2 19.7 2.9 2.6 9.4 8.7 3.3 2.1 994.5 37.8 603.4 686.0 658.8 Dec
61.3 18.9 2.9 2.6 10.0 8.9 4.3 2.1 1,002.4 35.2 682.4 666.7 670.1 2018 Jan
Changes 4
− 6.8 − 5.8 0.3 0.3 17.0 16.5 6.2 − 1.6 − 106.7 − 63.2 54.4 − 7.1 − 78.6 2010− 2.2 1.7 0.5 0.3 − 0.1 − 0.7 10.0 − 3.7 − 76.9 − 6.6 − 80.5 13.7 137.8 2011− 7.2 − 3.6 0.5 0.3 − 7.9 − 9.2 − 19.6 1.2 − 107.0 − 18.6 54.2 21.0 − 68.5 2012− 0.5 2.2 − 0.3 − 0.1 − 11.3 − 10.0 4.1 − 3.2 − 104.9 − 17.6 − 134.1 18.9 − 417.1 2013− 2.3 − 1.2 − 0.2 − 0.1 − 6.4 − 4.8 − 3.4 − 0.6 − 63.7 − 0.2 35.9 26.1 178.3 2014
− 0.1 0.0 0.0 0.1 − 0.4 − 1.9 − 1.0 − 0.0 − 86.8 7.7 − 30.3 28.0 − 143.2 20151.1 0.0 − 0.3 − 0.1 − 2.2 − 1.2 − 0.3 − 1.1 8.6 − 1.3 116.1 26.4 − 39.5 2016
10.8 4.2 − 0.1 − 0.0 − 0.0 − 0.0 1.1 − 0.3 − 3.3 − 8.5 − 16.1 34.1 − 162.3 2017
− 0.8 − 1.1 − 0.0 − 0.0 0.4 0.3 − 0.2 − 0.4 4.8 − 0.7 1.0 4.3 12.3 2016 May0.7 0.8 − 0.0 − 0.0 1.3 0.7 − 1.0 0.0 − 5.0 0.3 8.4 3.9 86.7 June
0.3 − 0.3 − 0.0 − 0.0 − 1.3 − 0.7 0.9 − 0.2 − 1.2 6.6 38.6 − 8.9 − 2.7 July0.4 0.8 − 0.0 − 0.0 − 0.1 − 0.2 − 0.2 − 0.1 − 1.1 − 3.8 7.9 6.6 − 36.6 Aug 1.5 0.8 − 0.0 − 0.0 − 0.8 0.1 − 0.3 0.0 − 8.1 − 0.8 − 7.0 12.0 − 25.5 Sep
0.1 − 1.3 − 0.1 − 0.0 − 0.7 − 0.5 0.3 − 0.1 5.3 − 1.3 52.6 − 2.9 − 53.5 Oct − 0.3 − 0.7 − 0.0 − 0.0 1.2 0.6 − 0.2 0.1 7.3 − 2.6 − 5.1 − 6.2 − 27.0 Nov
0.5 − 0.2 − 0.0 0.0 − 1.1 − 0.3 − 0.8 − 0.0 − 6.8 − 1.3 − 69.7 − 0.2 − 34.3 Dec
− 0.6 − 0.1 − 0.0 − 0.0 − 1.1 − 1.0 2.6 − 0.1 17.9 0.5 76.7 − 5.1 − 38.9 2017 Jan 1.6 2.3 0.0 0.0 0.8 0.3 − 0.3 − 0.1 3.4 0.3 14.4 2.4 18.7 Feb 3.7 2.0 − 0.0 − 0.0 − 0.6 0.3 − 1.9 − 0.1 − 2.8 − 2.0 − 2.2 6.2 − 26.1 Mar
− 1.9 − 1.6 − 0.0 0.0 0.2 − 0.3 0.9 − 0.0 1.4 − 1.8 22.7 5.6 − 5.3 Apr − 0.1 − 1.0 0.0 0.0 0.6 0.2 − 1.1 − 0.0 7.8 0.9 − 18.5 7.0 − 5.7 May
4.0 2.9 − 0.0 − 0.0 − 0.5 0.1 − 0.6 0.1 1.0 0.3 − 31.9 8.9 − 56.0 June
− 0.5 − 0.9 − 0.0 − 0.0 1.4 − 0.0 1.4 − 0.0 − 3.1 − 0.7 − 0.1 − 1.9 − 10.6 July− 0.9 − 0.8 − 0.0 − 0.0 − 0.6 − 0.1 0.1 0.2 − 1.7 − 1.2 − 39.0 2.7 13.0 Aug
3.2 2.2 − 0.0 − 0.0 − 0.8 0.0 − 0.7 0.0 − 10.2 − 0.5 25.3 4.7 − 25.6 Sep
− 1.2 − 2.2 − 0.0 0.0 − 0.1 − 0.2 − 0.3 − 0.3 − 9.6 − 1.6 − 3.8 − 0.5 − 2.6 Oct − 1.3 − 1.5 − 0.0 − 0.0 3.0 0.3 0.3 0.0 − 0.2 − 0.5 − 0.6 − 1.5 − 7.1 Nov
4.7 3.0 0.0 0.0 − 2.4 0.3 0.7 − 0.0 − 7.3 − 2.3 − 59.2 5.6 − 16.1 Dec
− 1.9 − 0.8 − 0.0 − 0.0 0.6 0.2 1.0 − 0.0 5.4 − 5.1 79.2 − 17.3 13.0 2018 Jan
governments. 3 In Germany, debt securities with maturities of up to one year are published together with money market fund shares. 4 Statistical breaks have beenclassed as money market paper; up to the January 2002 Monthly Report they were eliminated from the flow figures (see also footnote * in Table II.1).

Deutsche Bundesbank
24
Monthly Report
March 2018
IV Banks
2 Principal assets and liabilities of banks (MFIs) in Germany, by category of banks*
€ billion
Lending to banks (MFIs) Lending to non-banks (non-MFIs) of which of which
Loans Cash in hand and creditNumber of balances forreporting Balance with Balances up to and for Partici-Securities Securities
End of institu- sheet central and issued by including more than issued by pating Othermonth tions total 1 banks Total loans banks Total 1 year 1 year Bills non-banks interests assets 1
All categories of banks
2017 Aug 1,668 7,854.3 470.1 2,384.7 1,903.7 477.3 4,052.8 345.5 2,977.9 0.5 722.1 113.6 833.0 Sep 1,651 7,857.6 462.5 2,423.1 1,948.3 471.5 4,060.9 352.9 2,982.9 0.6 717.2 113.1 798.0
Oct 1,639 7,871.8 526.4 2,375.2 1,900.0 472.3 4,066.0 351.5 2,993.2 0.5 713.6 113.0 791.2 Nov 1,634 7,895.7 508.7 2,410.5 1,936.0 472.2 4,080.2 351.9 3,002.4 0.5 717.8 113.0 783.3 Dec 1,631 7,755.3 447.7 2,371.3 1,901.6 468.4 4,056.5 333.6 3,002.4 0.6 715.0 112.6 767.1
2018 Jan 1,627 7,861.8 500.8 2,407.2 1,934.1 470.6 4,074.4 353.8 3,001.5 0.6 712.2 112.5 766.8
Commercial banks 6
2017 Dec 263 3,129.6 291.3 999.6 923.1 76.2 1,236.8 185.0 822.6 0.5 227.8 50.9 551.02018 Jan 264 3,203.5 340.0 1,011.4 934.2 76.5 1,251.3 200.4 823.4 0.5 225.0 50.7 550.1
Big banks 7
2017 Dec 4 1,692.7 154.0 496.4 466.9 29.4 484.3 97.5 290.8 0.2 95.7 45.1 512.92018 Jan 4 1,724.3 158.8 513.3 483.6 29.7 495.8 109.0 292.2 0.1 93.4 44.9 511.4
Regional banks and other commercial banks
2017 Dec 153 1,030.0 70.4 260.8 216.8 43.8 664.0 62.7 479.4 0.2 121.2 5.1 29.82018 Jan 153 1,049.5 95.7 257.7 213.6 43.9 660.8 64.6 474.7 0.2 120.6 5.0 30.3
Branches of foreign banks
2017 Dec 106 406.9 67.0 242.4 239.4 3.0 88.5 24.7 52.5 0.1 10.9 0.7 8.32018 Jan 107 429.7 85.6 240.3 237.0 2.9 94.7 26.8 56.5 0.1 11.0 0.8 8.3
Landesbanken
2017 Dec 8 861.3 45.1 258.1 191.9 65.6 459.8 47.1 342.4 0.1 69.1 9.9 88.42018 Jan 8 893.6 58.0 275.7 207.8 67.0 460.3 49.3 339.8 0.1 69.9 9.9 89.7
Savings banks
2017 Dec 391 1,199.5 41.3 176.0 63.2 112.6 951.2 46.5 747.1 0.0 157.4 14.1 17.02018 Jan 386 1,196.4 37.9 173.9 60.6 113.2 953.1 48.2 746.9 0.0 157.8 14.1 17.5
Credit cooperatives
2017 Dec 917 890.1 19.1 168.4 62.7 105.2 666.9 31.9 525.7 0.0 109.2 16.8 18.92018 Jan 917 889.1 18.4 166.5 61.2 104.9 668.6 31.8 527.3 0.0 109.4 16.8 18.8
Mortgage banks
2017 Dec 13 228.7 4.6 32.0 21.4 10.6 185.5 3.2 157.6 − 24.8 0.1 6.32018 Jan 13 225.9 2.4 32.3 21.4 10.9 185.0 3.1 157.5 − 24.4 0.1 6.2
Building and loan associations
2017 Dec 20 229.2 1.0 56.6 40.8 15.8 166.7 1.1 140.4 . 25.1 0.3 4.62018 Jan 20 230.2 1.1 57.2 41.3 15.9 167.1 1.2 140.7 . 25.2 0.3 4.5
Banks with special, development and other central support tasks
2017 Dec 19 1,216.9 45.2 680.7 598.3 82.4 389.6 18.9 266.6 − 101.5 20.5 80.92018 Jan 19 1,223.0 43.2 690.2 607.6 82.2 389.2 19.8 266.0 − 100.4 20.5 80.0
Memo item: Foreign banks 8
2017 Dec 141 1,108.2 110.6 427.1 389.4 37.5 481.9 68.3 308.1 0.4 103.3 4.0 84.62018 Jan 142 1,149.0 147.8 421.5 382.6 38.3 489.4 75.9 308.1 0.4 103.1 4.1 86.3
of which: Banks majority-owned by foreign banks 9
2017 Dec 35 701.3 43.7 184.7 150.0 34.5 393.4 43.5 255.6 0.3 92.4 3.3 76.32018 Jan 35 719.3 62.2 181.2 145.6 35.4 394.7 49.1 251.6 0.3 92.1 3.3 77.9
* Assets and liabilities of monetary financial institutions (MFIs) in Germany. The assets meaning of section 340e (3) sentence 1 of the German Commercial Code (Handels-and liabilities of foreign branches, of money market funds (which are also classified gesetzbuch) read in conjunction with section 35 (1) No 1a of the Credit Institutionas MFIs) and of the Bundesbank are not included. For the definitions of the respective Accounting Regulation (Verordnung über die Rechnungslegung der Kreditinstitute)items, see the footnotes to Table IV.3. 1 Owing to the Act Modernising Accounting are classified under "Other assets and liabilities" as of the December 2010 reportingLaw (Gesetz zur Modernisierung des Bilanzrechts) of 25 May 2009, derivative date. Trading portfolio derivatives are listed separately in the Statistical Supplementfinancial instruments in the trading portfolio (trading portfolio derivatives) within the to the Monthly Report 1, Banking statistics, in Tables I.1 to I.3. 2 For building and

Deutsche Bundesbank
25
Monthly Report
March 2018
IV Banks
Deposits of banks (MFIs) Deposits of non-banks (non-MFIs) Capital including
of which of which publishedreserves,
Time deposits 2 Savings deposits 4 partici-pation
Memo rightsitem Bearer capital,
for for of which debtLiabilities funds forup to and more arising At three Bank general Othersecurities
Sight Time Sight including than from savings out- banking liabi- End ofmonths’Total deposits deposits Total deposits 1 year 1 year 2 repos 3 Total notice bonds risks lities 1 monthstanding 5
All categories of banks
1,713.2 510.4 1,202.8 3,662.5 2,017.4 305.8 695.7 83.6 590.0 544.6 53.6 1,120.5 512.0 846.1 2017 Aug 1,763.0 550.7 1,212.3 3,659.8 2,025.2 296.3 695.5 71.5 589.4 544.6 53.5 1,116.1 511.3 807.4 Sep
1,768.6 556.3 1,212.2 3,679.3 2,049.1 294.0 694.0 78.4 589.0 545.1 53.1 1,110.1 511.2 802.6 Oct 1,774.0 554.7 1,219.3 3,711.1 2,084.5 287.5 698.0 74.5 588.5 545.2 52.6 1,103.1 511.2 796.4 Nov 1,707.1 500.3 1,206.8 3,662.1 2,050.4 269.1 700.3 46.0 590.3 547.6 52.0 1,097.0 511.1 777.9 Dec
1,772.0 566.8 1,205.2 3,703.8 2,079.8 287.2 697.6 75.0 589.7 546.2 49.4 1,090.7 510.5 784.7 2018 Jan
Commercial banks 6
844.3 379.2 465.1 1,454.0 894.9 156.4 277.8 37.5 101.4 93.5 23.6 158.4 180.0 492.8 2017 Dec 882.4 412.7 469.7 1,492.6 926.1 166.9 277.0 58.9 101.1 93.5 21.5 158.6 179.4 490.4 2018 Jan
Big banks 7
406.5 157.7 248.8 612.7 359.3 94.5 91.3 37.4 61.6 60.4 6.0 120.3 103.8 449.3 2017 Dec 410.6 163.3 247.3 644.1 383.6 102.3 90.8 58.8 61.6 60.4 5.9 121.7 103.7 444.1 2018 Jan
Regional banks and other commercial banks
203.0 57.7 145.4 687.4 429.9 40.2 162.0 0.1 39.5 32.9 15.9 37.9 67.7 34.0 2017 Dec 220.7 73.8 146.9 688.6 431.8 41.1 160.8 0.1 39.3 32.9 15.6 36.7 67.6 36.0 2018 Jan
Branches of foreign banks
234.8 163.8 71.0 153.9 105.7 21.8 24.6 − 0.2 0.2 1.7 0.2 8.5 9.5 2017 Dec 251.1 175.5 75.5 159.9 110.7 23.5 25.4 − 0.2 0.2 0.0 0.2 8.2 10.3 2018 Jan
Landesbanken
238.8 35.9 202.9 284.8 128.2 50.2 93.2 7.5 12.5 12.0 0.7 196.2 50.9 90.6 2017 Dec 256.8 65.4 191.4 294.4 131.4 58.1 91.6 13.1 12.6 11.9 0.7 196.7 50.9 94.7 2018 Jan
Savings banks
128.6 5.0 123.5 905.5 565.5 14.5 15.0 − 290.3 265.9 20.3 14.5 108.2 42.8 2017 Dec 131.4 5.3 126.1 899.4 560.2 14.4 15.0 − 290.0 264.5 19.9 14.3 108.2 43.2 2018 Jan
Credit cooperatives
112.5 1.5 111.0 662.7 424.5 32.3 14.4 − 185.8 175.8 5.7 8.7 74.4 31.8 2017 Dec 114.7 2.1 112.6 659.5 421.3 32.6 14.4 − 185.6 175.9 5.6 8.7 74.4 31.8 2018 Jan
Mortgage banks
44.5 2.8 41.7 80.6 3.2 3.9 73.5 − − − . 87.1 8.9 7.6 2017 Dec 43.9 2.7 41.3 79.8 2.9 3.8 73.1 − − − . 85.4 8.9 7.9 2018 Jan
Building and loan associations
25.6 3.6 22.1 178.1 3.4 1.3 172.8 − 0.4 0.4 0.1 3.0 11.0 11.5 2017 Dec 26.4 3.9 22.5 178.5 3.4 1.4 173.1 − 0.4 0.4 0.1 3.0 11.0 11.3 2018 Jan
Banks with special, development and other central support tasks
312.9 72.4 240.5 96.3 30.6 10.5 53.7 1.0 − − . 629.2 77.7 100.8 2017 Dec 316.4 74.8 241.6 99.4 34.6 9.9 53.4 3.0 − − . 624.0 77.7 105.4 2018 Jan
Memo item: Foreign banks 8
396.9 229.6 167.3 549.9 381.8 53.7 84.2 8.9 21.1 20.6 9.0 22.7 49.8 89.0 2017 Dec 427.9 258.0 170.0 557.5 388.6 56.0 84.6 9.6 21.1 20.6 7.2 22.7 49.5 91.3 2018 Jan
of which: Banks majority-owned by foreign banks 9
162.1 65.8 96.3 395.9 276.2 31.9 59.7 8.9 20.9 20.4 7.3 22.5 41.4 79.4 2017 Dec 176.9 82.4 94.4 397.6 277.9 32.5 59.2 9.6 20.9 20.4 7.2 22.5 41.4 81.0 2018 Jan
loan associations: Including deposits under savings and loan contracts (see Table Nov. 2009), Commerzbank AG, UniCredit Bank AG (formerly Bayerische Hypo- undIV.12). 3 Included in time deposits. 4 Excluding deposits under savings and loan Vereinsbank AG) and Deutsche Postbank AG. 8 Sum of the banks majority-owned bycontracts (see also footnote 2). 5 Including subordinated negotiable bearer debt foreign banks and included in other categories of banks and the category ”Branchessecurities; excluding non-negotiable bearer debt securities. 6 Commercial banks (with dependent legal status) of foreign banks”. 9 Separate presentation of the bankscomprise the sub-groups ”Big banks”, ”Regional banks and other commercial banks” majority-owned by foreign banks included in other banking categories. and ”Branches of foreign banks”. 7 Deutsche Bank AG, Dresdner Bank AG (up to

Deutsche Bundesbank
26
Monthly Report
March 2018
IV Banks
3 Assets and liabilities of banks (MFIs) in Germany vis-à-vis residents *
€ billion
Lending to domestic banks (MFIs) Lending to domestic non-banks (non-MFIs)
TreasuryCash in Negotiable bills andhand Credit money negotiable
balances market Memo money mar-(euro-area Securitiesbanknotes with the Credit paper item ket paper issuedSecuritiesand Bundes- balances issued by issued by Fiduciary issued by by non-
Period coins) bank Total and loans Bills banks banks loans Total Loans Bills non-banks banks 1
End of year or month *
2008 17.4 102.6 1,861.7 1,298.1 0.0 55.7 507.8 2.0 3,071.1 2,698.9 1.2 3.1 367.92009 16.9 78.9 1,711.5 1,138.0 − 31.6 541.9 2.2 3,100.1 2,691.8 0.8 4.0 403.5
2010 16.0 79.6 1,686.3 1,195.4 − 7.5 483.5 1.8 3,220.9 2,770.4 0.8 27.9 421.82011 15.8 93.8 1,725.6 1,267.9 − 7.1 450.7 2.1 3,197.8 2,774.6 0.8 6.4 415.92012 18.5 134.3 1,655.0 1,229.1 − 2.4 423.5 2.4 3,220.4 2,785.5 0.6 2.2 432.12013 18.5 85.6 1,545.6 1,153.1 0.0 1.7 390.8 2.2 3,131.6 2,692.6 0.5 1.2 437.22014 18.9 81.3 1,425.9 1,065.6 0.0 2.1 358.2 1.7 3,167.3 2,712.2 0.4 0.7 454.0
2015 19.2 155.0 1,346.6 1,062.6 0.0 1.7 282.2 1.7 3,233.9 2,764.0 0.4 0.4 469.02016 25.8 284.0 1,364.9 1,099.8 0.0 0.8 264.3 2.0 3,274.3 2,823.8 0.3 0.4 449.82017 31.9 392.5 1,407.5 1,163.4 0.0 0.7 243.4 1.9 3,332.6 2,894.0 0.4 0.7 437.5
2016 Aug 19.4 240.9 1,348.1 1,075.2 0.0 1.2 271.7 1.7 3,265.9 2,810.9 0.3 1.3 453.5 Sep 20.7 246.0 1,368.1 1,097.3 0.0 1.2 269.5 1.7 3,274.2 2,819.9 0.3 1.6 452.4
Oct 22.6 258.7 1,360.3 1,090.2 0.0 1.4 268.7 1.7 3,281.0 2,828.6 0.2 1.6 450.6 Nov 22.6 291.7 1,397.6 1,128.8 0.0 1.1 267.6 1.7 3,293.1 2,840.0 0.2 1.3 451.6 Dec 25.8 284.0 1,364.9 1,099.8 0.0 0.8 264.3 2.0 3,274.3 2,823.8 0.3 0.4 449.8
2017 Jan 24.3 346.9 1,407.0 1,142.5 0.0 1.0 263.5 1.7 3,277.7 2,831.2 0.3 0.8 445.4 Feb 23.6 346.6 1,413.8 1,150.2 0.0 1.1 262.5 1.8 3,279.0 2,836.8 0.3 0.8 441.1 Mar 23.4 352.1 1,423.3 1,160.4 0.0 1.3 261.6 1.7 3,283.0 2,840.6 0.3 1.0 441.1
Apr 24.4 400.2 1,424.8 1,161.7 0.0 1.1 262.0 1.7 3,288.9 2,848.6 0.3 1.1 438.9 May 25.4 426.0 1,415.5 1,152.3 0.0 1.1 262.1 1.7 3,292.9 2,851.3 0.2 1.8 439.6 June 27.0 417.8 1,391.1 1,130.4 0.0 1.2 259.4 1.7 3,296.8 2,855.9 0.2 1.1 439.6
July 26.4 420.0 1,398.0 1,139.4 0.0 1.4 257.2 1.7 3,302.5 2,865.2 0.3 1.0 436.0 Aug 27.3 421.3 1,384.2 1,131.4 0.0 1.4 251.3 1.7 3,308.9 2,869.4 0.2 0.8 438.5 Sep 28.1 409.2 1,416.1 1,168.3 0.0 1.3 246.5 1.7 3,317.6 2,878.2 0.3 0.7 438.4
Oct 28.1 472.7 1,378.5 1,130.6 0.0 0.9 247.0 1.7 3,326.1 2,887.0 0.3 0.8 438.0 Nov 27.7 457.1 1,422.2 1,175.1 0.0 0.8 246.3 1.8 3,343.7 2,899.6 0.2 1.2 442.6 Dec 31.9 392.5 1,407.5 1,163.4 0.0 0.7 243.4 1.9 3,332.6 2,894.0 0.4 0.7 437.5
2018 Jan 29.0 448.1 1,421.8 1,176.0 0.0 0.7 245.1 2.5 3,339.3 2,904.9 0.3 1.0 433.1
Changes *
2009 − 0.5 − 23.6 − 147.2 − 157.3 − 0.0 − 24.1 + 34.3 + 0.2 + 25.7 − 11.2 − 0.4 + 1.4 + 35.9
2010 − 0.9 + 0.6 − 19.3 + 61.5 + 0.0 − 24.0 − 56.8 − 0.3 + 130.5 + 78.7 + 0.0 + 23.8 + 28.02011 − 0.2 + 14.2 + 47.3 + 80.5 − − 0.4 − 32.8 − 0.1 − 30.6 − 3.2 + 0.0 − 21.5 − 5.92012 + 2.7 + 40.5 − 68.6 − 37.5 − − 4.6 − 26.5 + 0.1 + 21.0 + 9.8 − 0.2 − 4.3 + 15.72013 + 0.0 − 48.8 − 204.1 − 170.6 + 0.0 − 0.7 − 32.7 − 0.2 + 4.4 + 0.3 − 0.1 − 0.6 + 4.82014 + 0.4 − 4.3 − 119.3 − 87.1 + 0.0 + 0.4 − 32.6 + 0.1 + 36.7 + 20.6 − 0.1 − 0.6 + 16.8
2015 + 0.3 + 73.7 − 80.7 − 4.3 − 0.0 − 0.4 − 75.9 − 0.1 + 68.9 + 54.1 − 0.0 − 0.3 + 15.12016 + 6.5 +129.1 + 48.1 + 66.9 − − 0.9 − 17.9 + 0.4 + 43.7 + 62.8 − 0.1 − 0.1 − 18.92017 + 6.1 +108.4 + 50.3 + 70.4 − 0.0 + 0.0 − 20.1 − 0.1 + 57.0 + 70.2 + 0.0 + 0.4 − 13.6
2016 Aug − 0.0 + 7.9 − 1.0 + 0.9 − − 0.1 − 1.8 + 0.0 + 1.5 + 4.6 + 0.0 − 0.4 − 2.6 Sep + 1.3 + 5.1 + 20.0 + 22.1 − + 0.0 − 2.1 − 0.0 + 8.2 + 9.1 − 0.0 + 0.3 − 1.1
Oct + 1.8 + 12.7 − 7.3 − 6.6 − + 0.1 − 0.8 − 0.0 + 7.0 + 8.6 − 0.0 + 0.0 − 1.7 Nov + 0.1 + 33.0 + 37.3 + 38.7 − − 0.3 − 1.1 + 0.0 + 12.1 + 11.4 − 0.0 − 0.3 + 1.0 Dec + 3.1 − 7.7 − 32.7 − 29.0 − − 0.3 − 3.3 + 0.3 − 19.0 − 16.4 + 0.1 − 0.9 − 1.8
2017 Jan − 1.4 + 62.9 + 42.1 + 42.6 − + 0.2 − 0.8 − 0.3 + 3.3 + 7.3 − 0.0 + 0.5 − 4.4 Feb − 0.7 − 0.3 + 6.8 + 7.7 − + 0.1 − 1.0 + 0.1 + 1.4 + 5.7 − 0.0 − 0.0 − 4.2 Mar − 0.3 + 5.5 + 9.5 + 10.2 − + 0.2 − 0.9 − 0.0 + 3.9 + 3.7 + 0.0 + 0.2 − 0.0
Apr + 1.1 + 48.1 + 1.7 + 1.3 − − + 0.4 − 0.0 + 5.9 + 8.1 + 0.0 + 0.1 − 2.3 May + 0.9 + 25.8 − 9.4 − 9.5 − − 0.0 + 0.1 − 0.0 + 3.9 + 2.6 − 0.1 + 0.7 + 0.7 June + 1.7 − 8.2 − 23.5 − 20.9 − + 0.1 − 2.7 − 0.0 + 4.0 + 4.6 + 0.0 − 0.6 − 0.0
July − 0.7 + 2.2 + 6.9 + 9.0 − + 0.2 − 2.2 − + 5.6 + 9.4 + 0.0 − 0.2 − 3.6 Aug + 0.9 + 1.3 − 13.8 − 8.0 − + 0.0 − 5.9 + 0.0 + 6.4 + 4.1 − 0.0 − 0.2 + 2.6 Sep + 0.8 − 12.1 + 34.1 + 38.3 − 0.0 − 0.1 − 4.1 − 0.0 + 7.3 + 8.8 + 0.1 − 0.0 − 1.5
Oct + 0.1 + 63.5 − 37.6 − 37.6 + 0.0 − 0.4 + 0.5 + 0.0 + 8.6 + 8.8 − 0.0 + 0.0 − 0.3 Nov − 0.4 − 15.6 + 43.7 + 44.4 − − 0.0 − 0.7 + 0.1 + 17.7 + 12.7 − 0.0 + 0.4 + 4.6 Dec + 4.1 − 64.6 − 10.3 − 7.3 − 0.0 − 0.2 − 2.9 + 0.1 − 11.1 − 5.6 + 0.1 − 0.5 − 5.1
2018 Jan − 2.9 + 55.6 + 13.8 + 12.1 − + 0.0 + 1.7 + 0.6 + 6.9 + 11.0 − 0.1 + 0.3 − 4.4
* See Table IV.2, footnote*; statistical breaks have been eliminated from the changes. (see also footnote 2). 2 Including debt securities arising from the exchange ofThe figures for the latest date are always to be regarded as provisional. Subsequent equalisation claims. 3 Including liabilities arising from registered debt securities,revisions which appear in the following Monthly Report, are not specially registered money market paper and non-negotiable bearer debt securities; includingmarked. 1 Excluding debt securities arising from the exchange of equalisation claims subordinated liabilities. 4 Including liabilities arising from monetary policy operations

Deutsche Bundesbank
27
Monthly Report
March 2018
IV Banks
Deposits of domestic banks (MFIs) 3 Deposits of domestic non-banks (non-MFIs)Partici-patinginterestsin
Memo domestic Memo Memoitem banks Sight Time Redis- item Sight Time Savings Bank itemEqualisa-
tion Fiduciary and deposits deposits counted Fiduciary de- deposits de- savings Fiduciaryclaims 2 loans Total 4 4 bills 5 loans Total posits 6 posits 7 bonds 8 loans Periodenterprises
End of year or month *
− 47.2 111.2 1,582.5 138.5 1,444.0 0.0 41.6 2,781.4 834.6 1,276.1 535.2 135.4 32.3 2008− 43.9 106.1 1,355.1 128.9 1,226.2 0.0 35.7 2,829.7 1,029.5 1,102.6 594.5 103.2 43.4 2009
− 33.7 96.8 1,238.3 135.3 1,102.6 0.0 13.8 2,935.2 1,104.4 1,117.1 618.2 95.4 37.5 2010− 36.3 94.6 1,210.5 114.8 1,095.3 0.0 36.1 3,045.5 1,168.3 1,156.2 616.1 104.8 36.5 2011− 34.8 90.0 1,135.5 132.9 1,002.6 0.0 36.3 3,090.2 1,306.5 1,072.5 617.6 93.6 34.9 2012− 31.6 92.3 1,140.3 125.6 1,014.7 0.0 33.2 3,048.7 1,409.9 952.0 610.1 76.6 32.9 2013− 26.5 94.3 1,111.9 127.8 984.0 0.0 11.7 3,118.2 1,517.8 926.7 607.8 66.0 30.9 2014
− 20.4 89.6 1,065.6 131.1 934.5 0.0 6.1 3,224.7 1,673.7 898.4 596.5 56.1 29.3 2015− 19.1 91.0 1,032.9 129.5 903.3 0.1 5.6 3,326.7 1,798.2 889.6 588.5 50.4 28.8 2016− 19.1 88.1 1,048.2 110.7 937.4 0.0 5.1 3,420.9 1,941.0 853.2 582.9 43.7 30.0 2017
− 19.4 90.3 1,015.7 137.3 878.3 0.0 5.9 3,282.1 1,748.5 893.1 588.4 52.2 28.7 2016 Aug − 19.3 89.8 1,028.7 132.1 896.6 0.0 5.8 3,283.7 1,748.1 896.6 587.2 51.8 28.6 Sep
− 19.1 89.7 1,025.1 137.1 887.9 0.0 5.7 3,294.7 1,768.0 888.8 586.6 51.3 28.6 Oct − 19.1 89.3 1,041.1 145.9 895.1 0.0 5.6 3,328.9 1,799.3 892.5 586.2 50.9 28.6 Nov − 19.1 91.0 1,032.9 129.5 903.3 0.1 5.6 3,326.7 1,798.2 889.6 588.5 50.4 28.8 Dec
− 20.3 90.8 1,052.6 136.9 915.6 0.1 5.5 3,346.3 1,812.5 895.8 588.5 49.5 30.6 2017 Jan − 20.3 89.4 1,054.6 141.4 913.1 0.0 5.6 3,345.5 1,816.6 891.4 588.5 49.0 30.5 Feb − 20.1 89.1 1,077.0 137.4 939.6 0.0 5.5 3,342.8 1,817.0 890.9 586.7 48.2 30.4 Mar
− 20.1 88.8 1,074.8 140.7 934.2 0.0 5.5 3,360.3 1,844.4 881.9 586.2 47.8 30.3 Apr − 20.0 88.7 1,079.5 142.0 937.5 − 5.5 3,368.4 1,852.2 883.4 585.7 47.0 30.4 May− 19.7 88.4 1,053.9 125.6 928.3 0.0 5.5 3,370.3 1,869.2 869.8 584.7 46.6 29.8 June
− 19.6 88.5 1,061.7 125.0 936.6 0.0 5.4 3,361.5 1,866.0 866.0 583.5 46.0 29.9 July− 19.6 88.9 1,065.1 121.2 943.9 0.0 5.4 3,376.5 1,884.2 864.4 582.4 45.4 30.0 Aug − 19.5 88.1 1,071.5 120.2 951.3 0.0 5.3 3,380.7 1,891.7 861.9 581.8 45.3 30.0 Sep
− 19.4 87.9 1,081.0 122.8 958.2 0.0 5.3 3,396.5 1,916.8 853.4 581.5 44.8 29.9 Oct − 19.4 88.1 1,079.8 125.9 953.9 0.0 5.3 3,426.8 1,944.0 857.5 581.0 44.3 30.1 Nov − 19.1 88.1 1,048.2 110.7 937.4 0.0 5.1 3,420.9 1,941.0 853.2 582.9 43.7 30.0 Dec
− 18.9 88.2 1,060.2 116.0 944.1 0.0 5.0 3,428.8 1,949.3 854.1 582.3 42.9 30.4 2018 Jan
Changes *
− − 4.2 + 0.7 − 225.4 − 9.7 − 215.7 − 0.0 − 5.7 + 59.7 + 211.4 − 179.3 + 59.3 − 31.6 − 0.9 2009
− − 2.1 − 9.2 − 96.5 + 22.3 − 119.1 − 0.0 − 0.2 + 77.8 + 76.0 − 18.9 + 24.0 − 3.3 − 1.7 2010− − 1.1 − 2.2 − 25.0 − 20.0 − 5.1 − 0.0 + 0.1 + 111.2 + 63.7 + 40.9 − 2.6 + 9.3 − 1.1 2011− − 1.3 − 4.1 − 70.8 + 21.5 − 91.9 − 0.0 + 0.2 + 42.2 + 138.7 − 86.7 + 1.5 − 11.2 − 1.6 2012− − 3.3 + 2.4 − 79.4 − 24.1 − 55.3 + 0.0 − 3.4 + 40.2 + 118.4 − 53.9 − 7.4 − 17.0 − 1.7 2013− − 1.9 + 2.0 − 29.0 + 2.2 − 31.2 − 0.0 − 0.6 + 69.7 + 107.9 − 25.3 − 2.4 − 10.6 − 2.0 2014
− − 2.1 − 4.3 − 46.6 + 3.3 − 50.0 + 0.0 − 1.3 + 106.5 + 156.2 − 28.3 − 11.3 − 10.1 − 1.6 2015− − 1.3 + 1.5 − 1.7 + 0.3 − 2.0 + 0.0 − 0.5 + 104.7 + 124.5 − 6.9 − 7.9 − 5.0 − 0.5 2016− − 0.0 − 1.6 + 11.0 − 18.4 + 29.4 − 0.0 − 0.5 + 103.1 + 142.8 − 27.5 − 5.6 − 6.7 + 0.4 2017
− − 0.1 + 0.2 − 7.1 − 2.7 − 4.4 − − 0.0 + 6.4 + 11.4 − 3.8 − 0.7 − 0.5 + 0.0 2016 Aug − − 0.1 − 0.5 + 13.0 − 5.3 + 18.3 − − 0.1 + 1.6 − 0.4 + 3.6 − 1.2 − 0.3 − 0.0 Sep
− − 0.2 + 0.1 − 3.2 + 1.5 − 4.7 + 0.0 − 0.1 + 11.0 + 20.0 − 7.9 − 0.6 − 0.5 − 0.0 Oct − − 0.0 − 0.4 + 16.0 + 8.8 + 7.3 − 0.0 − 0.0 + 34.2 + 31.3 + 3.7 − 0.4 − 0.4 − Nov − + 0.0 + 1.6 − 8.2 − 16.4 + 8.2 + 0.0 − 0.0 − 2.2 − 1.2 − 2.8 + 2.3 − 0.5 + 0.2 Dec
− + 1.2 − 0.2 + 19.7 + 7.4 + 12.3 − − 0.1 + 19.6 + 14.4 + 6.2 − 0.1 − 0.9 + 1.0 2017 Jan − − 0.1 − 1.4 + 2.0 + 4.6 − 2.5 − 0.0 + 0.1 − 0.8 + 4.1 − 4.5 + 0.1 − 0.5 − 0.1 Feb − − 0.1 − 0.3 + 22.4 − 4.1 + 26.5 − 0.0 − 0.1 − 2.7 + 0.4 − 0.5 − 1.9 − 0.7 − 0.1 Mar
− − 0.1 − 0.3 − 2.2 + 3.3 − 5.5 − 0.0 − 0.0 + 17.5 + 27.3 − 9.0 − 0.5 − 0.4 − 0.1 Apr − − 0.0 − 0.0 + 4.6 + 1.3 + 3.3 − 0.0 + 0.0 + 8.1 + 7.8 + 1.6 − 0.5 − 0.8 + 0.0 May− − 0.4 + 0.0 − 24.6 − 16.1 − 8.5 + 0.0 − 0.0 + 10.9 + 17.0 − 4.6 − 1.0 − 0.4 − 0.6 June
− − 0.0 + 0.1 + 7.8 − 0.5 + 8.3 − − 0.0 − 8.8 − 3.1 − 3.8 − 1.2 − 0.7 + 0.2 July− − 0.0 + 0.4 + 3.5 − 3.9 + 7.3 + 0.0 − 0.1 + 15.0 + 18.2 − 1.6 − 1.1 − 0.6 + 0.1 Aug − − 0.1 − 0.3 − 3.3 − 1.0 − 2.3 − − 0.1 + 4.3 + 7.5 − 2.5 − 0.6 − 0.1 − 0.1 Sep
− − 0.1 − 0.1 + 9.5 + 2.6 + 6.9 − + 0.0 + 15.7 + 25.1 − 8.5 − 0.3 − 0.5 − 0.0 Oct − − 0.0 + 0.1 − 1.0 + 3.1 − 4.2 − + 0.0 + 30.3 + 27.2 + 4.0 − 0.5 − 0.5 + 0.1 Nov − − 0.3 + 0.5 − 27.3 − 15.0 − 12.2 − 0.0 − 0.2 − 5.9 − 3.0 − 4.2 + 1.9 − 0.6 − 0.1 Dec
− − 0.1 − 0.0 + 11.9 + 5.2 + 6.7 + 0.0 − 0.1 + 7.5 + 8.0 + 0.9 − 0.6 − 0.8 + 0.4 2018 Jan
with the Bundesbank. 5 Own acceptances and promissory notes outstanding. 6 Since savings and loan contracts (see also footnote 8). 8 Including liabilities arising fromthe inclusion of building and loan associations in January 1999, including deposits non-negotiable bearer debt securities. under savings and loan contracts (see Table IV.12). 7 Excluding deposits under

Deutsche Bundesbank
28
Monthly Report
March 2018
IV Banks
4 Assets and liabilities of banks (MFIs) in Germany vis-à-vis non-residents *
€ billion
Lending to foreign banks (MFIs) Lending to foreign non-banks (non-MFIs)
TreasuryCash in bills andhand Loans and bills negotiableCredit balances and loans, bills Negotiable(non- money moneyeuro-area Medium market Memo Medium marketbanknotes and paper item and paper SecuritiesSecuritiesand Short- long- issued by issued by Fiduciary Short- long- issued by issued by
Period coins) Total Total term term banks banks loans Total Total term term non-banks non-banks
End of year or month *
2008 0.3 1,446.6 1,131.6 767.2 364.3 15.6 299.5 1.9 908.4 528.9 151.4 377.5 12.9 366.62009 0.3 1,277.4 986.1 643.5 342.6 6.2 285.0 2.9 815.7 469.6 116.9 352.7 9.8 336.3
2010 0.5 1,154.1 892.7 607.7 285.1 2.1 259.3 1.8 773.8 461.4 112.6 348.8 10.1 302.32011 0.6 1,117.6 871.0 566.3 304.8 4.6 241.9 2.6 744.4 455.8 102.0 353.8 8.5 280.12012 0.8 1,046.0 813.5 545.5 268.1 5.4 227.0 2.6 729.0 442.2 105.1 337.1 9.0 277.82013 0.2 1,019.7 782.4 546.6 235.8 7.2 230.1 2.5 701.0 404.9 100.3 304.6 8.2 287.82014 0.2 1,125.2 884.8 618.7 266.1 7.9 232.5 1.1 735.1 415.2 94.4 320.8 6.5 313.5
2015 0.3 1,066.9 830.7 555.9 274.7 1.2 235.0 1.0 751.5 424.3 83.8 340.5 7.5 319.72016 0.3 1,055.9 820.6 519.8 300.7 0.5 234.9 1.0 756.2 451.6 90.1 361.4 5.0 299.62017 0.3 963.8 738.2 441.0 297.2 0.7 225.0 2.3 723.9 442.2 93.3 348.9 4.2 277.5
2016 Aug 0.3 1,081.5 848.6 577.9 270.7 2.5 230.4 1.0 765.4 450.3 99.9 350.4 5.1 310.0 Sep 0.3 1,046.8 806.0 535.5 270.5 2.5 238.4 1.0 751.0 444.0 93.6 350.4 4.7 302.3
Oct 0.3 1,089.3 850.4 571.3 279.0 2.1 236.8 1.0 758.1 454.5 102.9 351.6 4.2 299.3 Nov 0.3 1,074.3 837.9 541.7 296.2 1.7 234.7 1.0 765.2 459.4 103.6 355.9 5.5 300.3 Dec 0.3 1,055.9 820.6 519.8 300.7 0.5 234.9 1.0 756.2 451.6 90.1 361.4 5.0 299.6
2017 Jan 0.3 1,069.4 836.4 537.3 299.0 0.8 232.2 1.7 772.9 468.4 109.0 359.4 5.3 299.1 Feb 0.3 1,088.4 854.7 552.1 302.6 1.3 232.5 1.7 782.0 474.4 110.6 363.8 6.2 301.3 Mar 0.3 1,086.7 854.7 548.7 306.0 1.9 230.0 1.7 777.5 475.7 110.9 364.9 4.1 297.7
Apr 0.3 1,063.7 833.7 529.7 304.0 1.9 228.0 1.7 774.4 477.4 114.5 362.9 4.8 292.2 May 0.3 1,037.5 804.3 506.9 297.4 2.2 231.0 1.9 771.7 475.9 112.3 363.6 5.1 290.8 June 0.3 1,043.5 812.2 515.4 296.8 2.3 229.0 1.9 756.2 461.8 102.5 359.3 6.3 288.1
July 0.3 1,018.5 788.2 493.2 295.0 2.3 227.9 2.1 751.5 458.0 102.6 355.4 6.1 287.4 Aug 0.2 1,000.5 772.3 478.4 293.9 2.2 226.0 2.1 743.9 454.3 104.0 350.3 6.0 283.6 Sep 0.3 1,007.0 780.1 484.7 295.4 1.9 225.1 2.1 743.3 457.8 107.9 349.9 6.7 278.8
Oct 0.3 996.7 769.4 473.5 295.9 1.9 225.3 2.1 739.9 457.9 104.8 353.1 6.5 275.6 Nov 0.3 988.3 761.0 467.6 293.4 1.4 225.9 2.2 736.5 454.9 105.5 349.3 6.4 275.2 Dec 0.3 963.8 738.2 441.0 297.2 0.7 225.0 2.3 723.9 442.2 93.3 348.9 4.2 277.5
2018 Jan 0.3 985.4 758.1 466.7 291.4 1.8 225.5 2.2 735.1 450.6 105.6 345.0 5.5 279.1
Changes *
2009 − 0.0 − 170.0 − 141.3 − 122.5 − 18.8 − 10.3 − 18.4 − 0.2 − 72.8 − 43.8 − 31.7 − 12.1 − 3.3 − 25.7
2010 + 0.1 − 141.5 − 116.2 − 47.3 − 68.9 − 4.8 − 20.4 − 0.2 − 62.0 − 24.5 − 12.6 − 11.9 + 0.4 − 38.02011 + 0.1 − 48.4 − 32.6 − 45.3 + 12.7 + 2.5 − 18.4 + 0.0 − 38.9 − 13.6 − 12.8 − 0.9 − 1.6 − 23.62012 + 0.1 − 70.1 − 56.8 − 23.1 − 33.7 + 0.9 − 14.1 − 0.1 − 9.4 − 7.5 + 8.3 − 15.9 + 0.6 − 2.52013 − 0.5 − 22.7 − 26.9 − 1.3 − 25.6 + 1.8 + 2.4 − 0.0 − 21.2 − 33.1 − 5.8 − 27.2 − 0.7 + 12.62014 − 0.0 + 86.1 + 80.1 + 63.2 + 16.8 + 0.7 + 5.3 − 0.6 + 5.7 − 10.2 − 12.8 + 2.7 − 1.8 + 17.7
2015 + 0.1 − 91.8 − 86.0 − 82.2 − 3.8 − 6.7 + 0.8 − 0.1 − 6.1 − 9.2 − 6.5 − 2.7 + 1.1 + 2.02016 + 0.0 − 25.5 − 14.5 − 38.2 + 23.7 − 0.7 − 10.3 − 0.0 + 17.4 + 28.9 + 10.1 + 18.8 − 3.0 − 8.52017 + 0.0 − 57.2 − 48.7 − 61.5 + 12.8 + 0.0 − 8.5 + 0.6 − 4.7 + 13.0 + 8.6 + 4.4 + 0.7 − 18.4
2016 Aug + 0.0 − 6.7 − 5.0 − 8.1 + 3.0 − 0.2 − 1.5 + 0.0 − 0.2 + 2.2 − 0.1 + 2.3 + 1.0 − 3.3 Sep − 0.0 − 44.3 − 42.2 − 42.1 − 0.1 − 0.0 − 2.1 + 0.0 − 3.2 − 5.3 − 6.1 + 0.8 − 0.4 + 2.5
Oct − 0.0 + 38.4 + 40.6 + 34.1 + 6.5 − 0.3 − 1.8 − 0.0 + 5.4 + 9.0 + 9.1 − 0.1 − 0.5 − 3.1 Nov + 0.0 − 25.6 − 22.6 − 35.0 + 12.3 − 0.5 − 2.5 + 0.0 + 0.9 − 0.4 − 0.5 + 0.1 + 1.2 + 0.1 Dec + 0.0 − 20.7 − 19.9 − 23.1 + 3.2 − 1.2 + 0.4 − 0.0 − 10.7 − 9.1 − 13.4 + 4.3 − 0.5 − 1.2
2017 Jan + 0.0 + 18.9 + 21.1 + 19.8 + 1.3 + 0.3 − 2.5 + 0.0 + 19.9 + 19.5 + 19.3 + 0.2 + 0.3 + 0.1 Feb − 0.0 + 14.0 + 13.5 + 12.3 + 1.2 + 0.4 + 0.1 + 0.0 + 6.2 + 3.5 + 1.0 + 2.5 + 0.9 + 1.8 Mar − 0.0 + 1.3 + 3.0 − 1.8 + 4.8 + 0.4 − 2.1 − 0.0 − 2.7 + 2.7 + 0.6 + 2.1 − 0.7 − 4.7
Apr + 0.0 − 16.1 − 14.2 − 15.4 + 1.2 + 0.0 − 1.9 + 0.0 − 0.1 + 4.2 + 3.8 + 0.4 + 0.6 − 4.9 May − 0.0 − 17.3 − 20.9 − 18.6 − 2.3 + 0.3 + 3.3 + 0.2 + 2.8 + 3.0 − 0.3 + 3.4 + 0.4 − 0.6 June − 0.0 + 11.0 + 12.7 + 10.9 + 1.9 + 0.1 − 1.9 + 0.0 − 12.8 − 11.8 − 9.3 − 2.5 + 1.2 − 2.2
July − 0.0 − 16.8 − 16.1 − 18.2 + 2.1 + 0.0 − 0.7 + 0.1 + 0.1 + 0.2 + 0.7 − 0.6 − 0.2 + 0.1 Aug − 0.0 − 19.5 − 17.7 − 15.3 − 2.4 − 0.1 − 1.8 + 0.0 − 0.5 + 3.0 + 3.8 − 0.7 − 0.0 − 3.5 Sep + 0.1 + 5.0 + 6.5 + 5.6 + 0.8 − 0.4 − 1.1 − 0.0 − 0.8 + 2.1 + 3.4 − 1.4 + 0.7 − 3.5
Oct + 0.0 − 13.4 − 13.6 − 12.3 − 1.3 + 0.1 + 0.2 + 0.0 − 5.3 − 1.5 − 3.4 + 2.0 − 0.2 − 3.6 Nov − 0.0 − 3.2 − 3.4 − 3.4 − 0.1 − 0.5 + 0.7 + 0.0 − 0.8 − 0.9 + 1.0 − 1.9 − 0.0 + 0.1 Dec − 0.0 − 21.1 − 19.6 − 25.1 + 5.5 − 0.7 − 0.8 + 0.1 − 10.7 − 11.1 − 11.9 + 0.8 − 2.2 + 2.5
2018 Jan + 0.0 + 30.6 + 28.8 + 29.7 − 0.9 + 1.1 + 0.7 − 0.1 + 15.8 + 12.3 + 12.8 − 0.6 + 1.3 + 2.3
* See Table IV.2, footnote*; statistical breaks have been eliminated from the changes. The figures for the latest date are always to be regarded as provisional. Subsequent revisions, which appear in the following Monthly Report, are not specially marked.

Deutsche Bundesbank
29
Monthly Report
March 2018
IV Banks
Deposits of foreign banks (MFIs) Deposits of foreign non-banks (non-MFIs)
Partici- Time deposits (includingpating Time deposits (including bank savings deposits and bankinterests savings bonds) savings bonds)in foreign
Memo banks Medium Memo Medium Memoitem and and item and itemFiduciary enter- Sight Short- long- Fiduciary Sight Short- long- Fiduciaryloans prises Total deposits Total term term loans Total deposits Total term term loans Period
End of year or month *
25.5 45.1 703.3 218.1 485.1 362.3 122.9 0.3 286.1 92.2 193.9 95.1 98.8 2.5 200832.1 45.4 652.6 213.6 439.0 307.4 131.6 0.2 216.3 78.1 138.2 73.7 64.5 1.9 2009
15.6 48.8 741.7 258.7 483.0 349.3 133.6 0.1 227.6 84.8 142.7 76.7 66.0 1.5 201032.9 45.0 655.7 242.6 413.1 289.4 123.7 0.1 225.9 92.3 133.6 66.9 66.6 1.3 201132.6 46.4 691.1 289.4 401.7 284.6 117.0 0.1 237.6 107.2 130.3 69.1 61.2 1.2 201230.8 39.0 515.7 222.6 293.2 196.0 97.2 0.1 257.8 118.1 139.7 76.8 62.9 1.0 201314.0 35.6 609.2 277.1 332.1 242.7 89.4 0.1 221.0 113.0 107.9 47.8 60.1 0.7 2014
13.1 30.5 611.9 323.4 288.5 203.8 84.7 0.1 201.1 102.6 98.5 49.3 49.2 0.7 201513.1 28.7 696.1 374.4 321.6 234.2 87.5 0.0 206.2 100.3 105.9 55.2 50.8 0.7 201612.1 24.3 659.0 389.6 269.4 182.4 87.0 0.0 241.2 109.4 131.8 68.1 63.8 0.3 2017
13.1 29.4 701.3 398.5 302.8 220.1 82.7 0.0 248.3 127.3 121.0 74.9 46.1 0.7 2016 Aug 13.1 29.4 679.5 366.0 313.5 231.3 82.2 0.0 233.3 124.6 108.7 62.0 46.7 0.7 Sep
13.2 28.8 692.7 398.6 294.1 211.9 82.2 0.0 266.3 146.2 120.1 72.0 48.1 0.7 Oct 13.2 28.9 703.9 416.7 287.2 203.2 84.0 0.0 266.2 138.3 128.0 79.1 48.9 0.7 Nov 13.1 28.7 696.1 374.4 321.6 234.2 87.5 0.0 206.2 100.3 105.9 55.2 50.8 0.7 Dec
13.0 28.4 746.1 452.6 293.5 206.4 87.1 0.0 246.7 125.6 121.1 71.1 50.0 0.7 2017 Jan 13.0 24.8 765.2 480.7 284.5 197.4 87.1 0.0 254.0 129.5 124.5 74.8 49.7 0.7 Feb 12.9 24.7 768.8 488.1 280.7 192.1 88.6 0.0 237.6 113.7 124.0 72.2 51.8 0.7 Mar
12.9 24.8 751.4 429.4 322.0 234.2 87.7 0.0 271.9 132.3 139.7 89.0 50.6 0.7 Apr 12.8 24.6 732.4 464.0 268.4 181.8 86.5 0.0 269.4 134.1 135.3 85.0 50.3 0.6 May12.5 24.4 720.3 463.2 257.1 170.1 87.0 0.0 259.9 123.7 136.1 75.7 60.4 0.6 June
12.5 24.4 692.4 441.0 251.4 165.5 85.9 0.0 282.5 137.7 144.8 84.4 60.5 0.6 July12.4 24.4 648.0 389.2 258.9 174.0 84.9 0.0 286.0 133.1 152.9 92.5 60.4 0.5 Aug 12.4 24.8 691.5 430.5 261.0 176.6 84.3 0.0 279.1 133.5 145.7 84.3 61.4 0.5 Sep
12.3 24.8 687.6 433.6 254.0 169.4 84.7 0.0 282.8 132.3 150.5 87.9 62.6 0.4 Oct 12.4 24.7 694.2 428.8 265.4 179.7 85.7 0.0 284.4 140.6 143.8 81.7 62.1 0.4 Nov 12.1 24.3 659.0 389.6 269.4 182.4 87.0 0.0 241.2 109.4 131.8 68.1 63.8 0.3 Dec
12.0 24.2 711.8 450.8 261.0 172.7 88.3 0.0 275.0 130.5 144.6 82.2 62.3 0.3 2018 Jan
Changes *
− 3.2 + 0.1 − 81.4 − 2.1 − 79.3 − 57.5 − 21.7 − 0.2 − 33.5 − 13.3 − 20.1 − 17.0 − 3.1 − 0.6 2009
+ 0.2 + 1.4 + 895.4 + 42.0 + 542.4 + 38.1 + 136.8 − 0.1 − 1.6 + 6.0 − 7.6 − 3.3 − 4.4 − 0.4 2010− 0.1 − 3.9 − 88.8 − 13.8 − 75.0 − 61.8 − 13.1 − 0.0 − 9.3 + 6.4 − 15.7 − 10.4 − 5.3 − 0.2 2011− 0.3 + 1.5 + 38.2 + 51.7 − 13.5 − 7.5 − 6.0 − 0.0 + 12.6 + 15.2 − 2.6 + 2.5 − 5.1 − 0.1 2012− 1.8 − 7.2 − 174.0 − 75.6 − 98.4 − 83.1 − 15.4 − 0.0 + 13.5 + 9.6 + 3.9 + 6.9 − 3.0 − 0.2 2013+ 0.1 − 3.8 + 76.3 + 47.8 + 28.5 + 39.0 − 10.5 − 0.0 − 43.6 − 8.3 − 35.3 − 30.7 − 4.6 + 0.2 2014
− 0.6 − 6.1 − 15.4 + 40.6 − 56.0 − 48.6 − 7.4 − 0.0 − 26.5 − 13.9 − 12.6 + 0.3 − 13.0 − 0.0 2015− 0.1 − 1.5 + 82.7 + 51.0 + 31.7 + 27.0 + 4.7 − 0.0 + 3.5 − 3.1 + 6.7 + 5.9 + 0.8 − 0.0 2016− 1.0 − 4.1 − 15.5 + 25.3 − 40.8 − 43.2 + 2.4 + 0.0 + 31.8 + 11.0 + 20.8 + 15.6 + 5.2 − 0.4 2017
+ 0.0 + 0.0 − 4.3 − 9.5 + 5.2 + 2.4 + 2.8 − + 4.5 − 1.7 + 6.2 + 6.7 − 0.5 − 0.1 2016 Aug + 0.0 − 0.0 − 21.2 − 32.3 + 11.1 + 11.6 − 0.5 − 0.0 − 14.8 − 2.7 − 12.1 − 12.7 + 0.7 − 0.0 Sep
+ 0.1 − 0.6 + 11.1 + 31.7 − 20.5 − 20.1 − 0.4 − 0.0 + 32.5 + 21.4 + 11.2 + 9.8 + 1.3 + 0.1 Oct + 0.0 + 0.0 + 4.9 + 15.8 − 10.9 − 12.0 + 1.1 − 0.0 − 2.2 − 9.0 + 6.9 + 6.4 + 0.4 + 0.0 Nov − 0.1 − 0.3 − 9.2 − 42.7 + 33.5 + 30.2 + 3.3 − 0.0 − 60.5 − 38.2 − 22.3 − 24.1 + 1.8 + 0.0 Dec
− 0.0 − 0.2 + 52.9 + 79.0 − 26.1 − 26.2 + 0.1 − + 41.2 + 25.6 + 15.6 + 16.2 − 0.6 − 0.0 2017 Jan − 0.1 − 3.6 + 15.9 + 26.6 − 10.7 − 10.3 − 0.4 − + 6.6 + 3.7 + 2.9 + 3.4 − 0.4 + 0.0 Feb − 0.0 − 0.0 + 5.5 + 8.3 − 2.8 − 4.5 + 1.7 − − 15.9 − 15.7 − 0.2 − 2.4 + 2.2 − 0.0 Mar
− 0.0 + 0.1 − 12.8 − 56.2 + 43.4 + 43.7 − 0.4 − + 34.4 + 18.2 + 16.2 + 17.1 − 0.9 − Apr − 0.1 − 0.1 − 13.8 + 36.5 − 50.3 − 49.8 − 0.5 − − 0.9 + 2.4 − 3.3 − 3.3 − 0.0 − 0.0 May− 0.3 − 0.2 − 9.0 + 0.6 − 9.6 − 10.5 + 0.9 − − 17.8 − 10.0 − 7.8 − 9.0 + 1.2 − 0.0 June
− 0.0 + 0.0 − 23.9 − 19.7 − 4.2 − 3.7 − 0.5 + 0.0 + 24.0 + 14.4 + 9.6 + 9.3 + 0.3 − 0.0 July− 0.1 + 0.0 − 42.9 − 51.2 + 8.3 + 9.1 − 0.8 − 0.0 + 4.6 − 4.0 + 8.6 + 8.5 + 0.0 − 0.1 Aug − 0.0 + 0.4 + 42.4 + 41.0 + 1.5 + 2.1 − 0.7 − − 7.2 + 0.2 − 7.4 − 8.4 + 0.9 + 0.0 Sep
− 0.1 − 0.0 − 5.9 + 2.4 − 8.3 − 8.3 + 0.0 − + 3.0 − 1.4 + 4.4 + 3.4 + 1.1 − 0.1 Oct + 0.1 − 0.0 + 9.4 − 3.6 + 13.0 + 11.6 + 1.4 − + 2.3 + 8.6 − 6.2 − 5.9 − 0.4 − 0.0 Nov − 0.3 − 0.4 − 33.3 − 38.4 + 5.1 + 3.5 + 1.5 − − 42.5 − 31.0 − 11.6 − 13.4 + 1.8 − 0.1 Dec
− 0.1 − 0.0 + 57.4 + 63.5 − 6.1 − 5.0 − 1.1 − + 35.0 + 21.4 + 13.6 + 14.4 − 0.8 − 0.0 2018 Jan

Deutsche Bundesbank
30
Monthly Report
March 2018
IV Banks
5 Lending by banks (MFIs) in Germany to domestic non-banks (non-MFIs) *
€ billion
Lending to domestic Short-term lending Medium and long-termnon-banks, total
to enterprises and households to general government to enter-
including excluding Negoti-negotiable money ablemarket paper, Loans money
Period securities, and market Treasuryequalisation claims Total Total bills paper Total Loans bills Total Total
End of year or month *
2008 3,071.1 2,700.1 373.0 337.5 335.3 2.2 35.5 34.5 1.0 2,698.1 2,257.82009 3,100.1 2,692.6 347.3 306.3 306.2 0.1 41.0 37.1 3.9 2,752.8 2,299.7
2010 3,220.9 2,771.3 428.0 283.0 282.8 0.2 145.0 117.2 27.7 2,793.0 2,305.62011 3,197.8 2,775.4 383.3 316.5 316.1 0.4 66.8 60.7 6.0 2,814.5 2,321.92012 3,220.4 2,786.1 376.1 316.8 316.3 0.5 59.3 57.6 1.7 2,844.3 2,310.92013 3,131.6 2,693.2 269.1 217.7 217.0 0.6 51.4 50.8 0.6 2,862.6 2,328.62014 3,167.3 2,712.6 257.5 212.7 212.1 0.6 44.8 44.7 0.1 2,909.8 2,376.8
2015 3,233.9 2,764.4 255.5 207.8 207.6 0.2 47.8 47.5 0.2 2,978.3 2,451.42016 3,274.3 2,824.2 248.6 205.7 205.4 0.3 42.9 42.8 0.1 3,025.8 2,530.02017 3,332.6 2,894.4 241.7 210.9 210.6 0.3 30.7 30.3 0.4 3,090.9 2,640.0
2016 Aug 3,265.9 2,811.2 262.2 208.1 207.5 0.6 54.1 53.4 0.7 3,003.8 2,497.1 Sep 3,274.2 2,820.2 268.7 214.2 213.7 0.5 54.5 53.4 1.1 3,005.4 2,502.7
Oct 3,281.0 2,828.8 269.7 212.6 212.0 0.6 57.1 56.1 1.0 3,011.3 2,512.3 Nov 3,293.1 2,840.2 268.0 216.3 215.8 0.5 51.7 51.0 0.8 3,025.0 2,525.5 Dec 3,274.3 2,824.2 248.6 205.7 205.4 0.3 42.9 42.8 0.1 3,025.8 2,530.0
2017 Jan 3,277.7 2,831.5 252.1 208.6 208.0 0.6 43.5 43.3 0.2 3,025.6 2,535.3 Feb 3,279.0 2,837.1 252.8 209.7 209.1 0.7 43.1 42.9 0.1 3,026.2 2,541.5 Mar 3,283.0 2,840.9 252.7 212.6 211.8 0.8 40.0 39.8 0.2 3,030.4 2,547.5
Apr 3,288.9 2,849.0 253.7 210.6 209.8 0.8 43.1 42.8 0.3 3,035.2 2,558.1 May 3,292.9 2,851.5 249.3 211.0 210.0 0.9 38.4 37.5 0.8 3,043.5 2,568.8 June 3,296.8 2,856.1 251.1 214.1 213.5 0.6 37.0 36.5 0.5 3,045.7 2,577.7
July 3,302.5 2,865.5 249.4 210.2 209.5 0.7 39.2 38.8 0.3 3,053.1 2,589.2 Aug 3,308.9 2,869.6 242.8 207.6 207.0 0.6 35.2 35.0 0.2 3,066.1 2,601.2 Sep 3,317.6 2,878.5 246.2 214.1 213.5 0.6 32.2 32.0 0.2 3,071.3 2,608.7
Oct 3,326.1 2,887.3 248.0 215.3 214.7 0.6 32.7 32.6 0.2 3,078.1 2,616.7 Nov 3,343.7 2,899.8 248.0 215.4 214.9 0.5 32.6 31.9 0.7 3,095.6 2,636.3 Dec 3,332.6 2,894.4 241.7 210.9 210.6 0.3 30.7 30.3 0.4 3,090.9 2,640.0
2018 Jan 3,339.3 2,905.2 249.7 217.4 216.8 0.6 32.3 31.9 0.4 3,089.6 2,645.2
Changes *
2009 + 25.7 − 11.6 − 26.1 − 31.5 − 30.0 − 1.5 + 5.5 + 2.5 + 2.9 + 51.8 + 36.6
2010 + 130.5 + 78.7 + 80.4 − 23.4 − 23.5 + 0.1 + 103.8 + 80.1 + 23.7 + 50.1 + 14.92011 − 30.6 − 3.2 − 45.2 + 33.6 + 33.3 + 0.2 − 78.7 − 57.0 − 21.7 + 14.6 + 9.42012 + 21.0 + 9.6 − 9.7 − 1.6 − 1.7 + 0.1 − 8.2 − 3.8 − 4.3 + 30.7 + 10.92013 + 4.4 + 0.1 − 13.8 − 5.8 − 6.3 + 0.5 − 8.0 − 7.0 − 1.1 + 18.2 + 17.62014 + 36.7 + 20.5 − 11.6 − 4.5 − 4.5 − 0.0 − 7.1 − 6.5 − 0.6 + 48.3 + 52.5
2015 + 68.9 + 54.1 + 1.6 − 1.3 − 0.9 − 0.4 + 2.9 + 2.8 + 0.1 + 67.2 + 73.92016 + 43.7 + 62.7 − 5.2 − 0.3 − 0.4 + 0.1 − 4.9 − 4.8 − 0.2 + 48.9 + 79.82017 + 57.0 + 70.2 − 6.5 + 5.6 + 5.6 + 0.0 − 12.1 − 12.4 + 0.3 + 63.5 + 103.4
2016 Aug + 1.5 + 4.6 − 6.7 − 5.8 − 5.4 − 0.4 − 0.9 − 0.8 − 0.1 + 8.2 + 13.2 Sep + 8.2 + 9.0 + 6.6 + 6.2 + 6.3 − 0.1 + 0.4 − 0.0 + 0.4 + 1.6 + 5.5
Oct + 7.0 + 8.6 + 1.1 − 1.5 − 1.6 + 0.1 + 2.6 + 2.7 − 0.1 + 5.8 + 9.4 Nov + 12.1 + 11.4 − 1.7 + 3.7 + 3.8 − 0.1 − 5.4 − 5.2 − 0.2 + 13.7 + 13.0 Dec − 19.0 − 16.2 − 19.0 − 10.1 − 9.9 − 0.2 − 8.9 − 8.2 − 0.7 + 0.0 + 3.8
2017 Jan + 3.3 + 7.3 + 3.5 + 2.9 + 2.5 + 0.3 + 0.6 + 0.5 + 0.1 − 0.2 + 5.3 Feb + 1.4 + 5.6 + 0.7 + 1.2 + 1.1 + 0.1 − 0.4 − 0.3 − 0.1 + 0.6 + 6.2 Mar + 3.9 + 3.7 − 0.2 + 2.8 + 2.7 + 0.1 − 3.0 − 3.1 + 0.1 + 4.1 + 5.9
Apr + 5.9 + 8.1 + 1.0 − 2.0 − 2.0 − 0.0 + 3.0 + 2.9 + 0.1 + 4.9 + 10.6 May + 3.9 + 2.5 − 4.0 + 0.7 + 0.5 + 0.1 − 4.7 − 5.2 + 0.5 + 8.0 + 7.8 June + 4.0 + 4.6 + 1.9 + 3.3 + 3.6 − 0.3 − 1.4 − 1.1 − 0.3 + 2.1 + 8.8
July + 5.6 + 9.4 − 1.8 − 3.9 − 4.0 + 0.1 + 2.2 + 2.4 − 0.2 + 7.4 + 11.4 Aug + 6.4 + 4.1 − 6.6 − 2.6 − 2.5 − 0.1 − 4.0 − 3.8 − 0.1 + 13.0 + 12.0 Sep + 7.3 + 8.9 + 3.5 + 6.5 + 6.5 − 0.0 − 3.0 − 3.0 − 0.0 + 3.9 + 5.8
Oct + 8.6 + 8.8 + 1.8 + 1.2 + 1.2 + 0.0 + 0.6 + 0.6 + 0.0 + 6.8 + 8.0 Nov + 17.7 + 12.6 + 0.1 + 0.2 + 0.3 − 0.1 − 0.1 − 0.6 + 0.5 + 17.6 + 17.8 Dec − 11.1 − 5.5 − 6.4 − 4.5 − 4.3 − 0.2 − 1.9 − 1.6 − 0.3 − 4.7 + 3.6
2018 Jan + 6.9 + 11.0 + 8.0 + 6.4 + 6.1 + 0.3 + 1.6 + 1.6 − 0.0 − 1.2 + 4.7
* See Table IV.2, footnote*; statistical breaks have been eliminated from the changes. marked. 1 Excluding debt securities arising from the exchange of equalisation claimsThe figures for the latest date are always to be regarded as provisional. Subsequent (see also footnote 2). 2 Including debt securities arising from the exchange ofrevisions, which appear in the following Monthly Report, are not specially equalisation claims.

Deutsche Bundesbank
31
Monthly Report
March 2018
IV Banks
lending
prises and households to general government
Loans Loans
Memo Memoitem Equal- item
Medium- Long- Fiduciary Medium- Long- Secur- isation FiduciaryTotal term term loans Total Total term term ities 1 claims 2 loans PeriodSecurities
End of year or month *
2,022.0 222.0 1,800.0 235.8 42.8 440.3 308.2 29.7 278.5 132.1 − 4.5 20082,051.3 242.7 1,808.6 248.4 39.6 453.1 298.0 32.2 265.8 155.1 − 4.3 2009
2,070.0 238.1 1,831.8 235.7 30.7 487.3 301.2 36.1 265.1 186.1 − 3.1 20102,099.5 247.9 1,851.7 222.4 32.7 492.6 299.1 41.1 258.0 193.5 − 3.6 20112,119.5 249.7 1,869.8 191.4 31.4 533.4 292.7 39.4 253.3 240.7 − 3.5 20122,136.9 248.0 1,888.9 191.7 28.9 534.0 288.4 38.8 249.7 245.6 − 2.7 20132,172.7 251.7 1,921.0 204.2 24.4 532.9 283.1 33.5 249.6 249.8 − 2.1 2014
2,232.4 256.0 1,976.3 219.0 18.3 527.0 277.0 27.9 249.0 250.0 − 2.1 20152,306.5 264.1 2,042.4 223.4 17.3 495.8 269.4 23.9 245.5 226.4 − 1.8 20162,399.5 273.5 2,125.9 240.6 17.4 450.9 254.0 22.5 231.5 196.9 − 1.7 2017
2,278.8 260.6 2,018.1 218.4 17.6 506.6 271.5 25.9 245.6 235.1 − 1.8 2016 Aug 2,283.5 261.0 2,022.5 219.3 17.5 502.7 269.6 25.4 244.2 233.1 − 1.8 Sep
2,290.5 261.5 2,029.0 221.8 17.3 498.9 270.2 24.4 245.7 228.8 − 1.8 Oct 2,302.5 264.0 2,038.5 223.0 17.3 499.5 270.9 24.3 246.6 228.6 − 1.8 Nov 2,306.5 264.1 2,042.4 223.4 17.3 495.8 269.4 23.9 245.5 226.4 − 1.8 Dec
2,311.3 264.5 2,046.8 224.0 18.6 490.3 268.9 24.2 244.7 221.4 − 1.7 2017 Jan 2,316.5 263.2 2,053.3 225.1 18.5 484.7 268.6 25.0 243.7 216.1 − 1.7 Feb 2,322.0 264.4 2,057.6 225.5 18.4 482.9 267.3 24.6 242.7 215.6 − 1.7 Mar
2,331.2 265.4 2,065.9 226.8 18.4 477.2 265.1 23.6 241.5 212.0 − 1.7 Apr 2,342.6 266.2 2,076.4 226.2 18.3 474.8 261.3 23.4 238.0 213.4 − 1.7 May2,346.1 267.4 2,078.7 231.6 18.0 468.0 260.0 23.0 237.0 208.1 − 1.6 June
2,357.7 268.3 2,089.4 231.5 18.0 463.9 259.4 23.1 236.3 204.5 − 1.6 July2,369.2 269.4 2,099.8 232.0 18.0 464.9 258.4 22.9 235.5 206.5 − 1.6 Aug 2,376.0 269.6 2,106.3 232.7 17.9 462.7 257.0 22.4 234.6 205.7 − 1.6 Sep
2,383.4 270.9 2,112.5 233.2 17.8 461.4 256.6 22.7 234.0 204.8 − 1.6 Oct 2,397.7 274.4 2,123.3 238.6 17.8 459.3 255.4 22.8 232.6 204.0 − 1.6 Nov 2,399.5 273.5 2,125.9 240.6 17.4 450.9 254.0 22.5 231.5 196.9 − 1.7 Dec
2,405.7 274.8 2,130.9 239.5 17.4 444.4 250.8 22.0 228.8 193.6 − 1.5 2018 Jan
Changes *
+ 23.5 + 17.3 + 6.3 + 13.1 − 3.9 + 15.2 − 7.6 + 2.5 − 10.2 + 22.8 − − 0.2 2009
+ 18.6 − 4.0 + 22.6 − 3.8 − 1.7 + 35.2 + 3.5 + 3.5 − 0.0 + 31.7 − − 0.3 2010+ 22.6 + 2.2 + 20.4 − 13.2 − 1.0 + 5.2 − 2.1 + 4.9 − 7.0 + 7.3 − − 0.2 2011+ 21.6 + 1.5 + 20.1 − 10.7 − 1.1 + 19.8 − 6.6 − 1.9 − 4.7 + 26.4 − − 0.2 2012+ 17.7 − 0.1 + 17.8 − 0.1 − 2.5 + 0.6 − 4.3 − 0.7 − 3.6 + 4.9 − − 0.8 2013+ 39.9 + 5.6 + 34.3 + 12.5 − 1.8 − 4.1 − 8.5 − 5.1 − 3.4 + 4.3 − − 0.2 2014
+ 59.0 + 4.5 + 54.6 + 14.8 − 2.1 − 6.6 − 6.9 − 4.8 − 2.0 + 0.2 − + 0.0 2015+ 75.1 + 9.7 + 65.4 + 4.7 − 0.9 − 30.9 − 7.3 − 4.0 − 3.3 − 23.6 − − 0.4 2016+ 87.6 + 9.4 + 78.2 + 15.8 + 0.1 − 39.9 − 10.6 − 1.3 − 9.3 − 29.4 − − 0.1 2017
+ 12.0 + 2.1 + 9.9 + 1.3 − 0.1 − 5.1 − 1.2 − 0.0 − 1.2 − 3.9 − − 0.0 2016 Aug + 4.6 + 0.3 + 4.2 + 0.9 − 0.1 − 3.8 − 1.8 − 0.5 − 1.3 − 2.0 − − 0.0 Sep
+ 6.8 + 0.5 + 6.2 + 2.7 − 0.2 − 3.6 + 0.7 − 0.9 + 1.7 − 4.3 − − 0.0 Oct + 11.9 + 2.4 + 9.4 + 1.1 − 0.1 + 0.7 + 0.9 − 0.1 + 1.0 − 0.1 − + 0.0 Nov + 3.4 − 0.5 + 3.9 + 0.5 + 0.0 − 3.8 − 1.5 − 0.4 − 1.1 − 2.3 − − 0.0 Dec
+ 4.8 + 0.3 + 4.5 + 0.5 + 1.3 − 5.5 − 0.5 + 0.3 − 0.8 − 5.0 − − 0.0 2017 Jan + 5.1 − 1.3 + 6.4 + 1.1 − 0.1 − 5.6 − 0.2 + 0.8 − 1.0 − 5.3 − − 0.0 Feb + 5.5 + 1.2 + 4.3 + 0.4 − 0.1 − 1.8 − 1.4 − 0.3 − 1.0 − 0.4 − − 0.0 Mar
+ 9.3 + 1.0 + 8.3 + 1.3 − 0.1 − 5.7 − 2.2 − 1.0 − 1.1 − 3.6 − − 0.0 Apr + 8.5 + 0.8 + 7.7 − 0.7 − 0.0 + 0.1 − 1.3 − 0.2 − 1.1 + 1.4 − − 0.0 May+ 3.4 + 1.2 + 2.2 + 5.4 − 0.3 − 6.7 − 1.3 − 0.3 − 1.0 − 5.4 − − 0.1 June
+ 11.4 + 1.0 + 10.4 − 0.1 − 0.0 − 4.0 − 0.4 + 0.1 − 0.5 − 3.6 − + 0.0 July+ 11.5 + 1.1 + 10.4 + 0.5 − 0.0 + 1.0 − 1.1 − 0.3 − 0.8 + 2.0 − − 0.0 Aug + 6.6 + 0.2 + 6.4 − 0.8 − 0.1 − 2.0 − 1.2 − 0.4 − 0.8 − 0.8 − − 0.0 Sep
+ 7.4 + 1.3 + 6.1 + 0.6 − 0.1 − 1.2 − 0.3 + 0.2 − 0.5 − 0.9 − − 0.0 Oct + 12.4 + 3.5 + 9.0 + 5.4 − 0.0 − 0.3 + 0.5 + 0.1 + 0.4 − 0.8 − − Nov + 1.7 − 0.9 + 2.5 + 2.0 − 0.4 − 8.3 − 1.3 − 0.3 − 1.0 − 7.1 − + 0.1 Dec
+ 5.7 + 1.6 + 4.2 − 1.0 − 0.0 − 5.9 − 2.5 − 0.5 − 2.0 − 3.4 − − 0.1 2018 Jan

Deutsche Bundesbank
32
Monthly Report
March 2018
IV Banks
6 Lending by banks (MFIs) in Germany to domestic enterprises and households, housing loans,sectors of economic activity *
€ billion
Lending to domestic enterprises and households (excluding holdings of negotiable money market paper and excluding securities portfolios) 1
of which
Housing loans Lending to enterprises and self-employed persons
Whole-sale andElectricity,
gas and retail FinancialMortgage water trade; Agri- Transport- intermedi-loans supply; repair of culture, ation and ationsecured refuse motor forestry, storage; (excludingby disposal, vehicles fishing post and MFIs) and
Mortgage residen- Other of which mining and and telecom- insuranceloans, tial real housing Housing Manufac- and Construc- motor- aqua- munica- com-
Period Total total Total estate loans Total loans turing quarrying tion cycles culture tions panies
Lending, total End of year or quarter *
2015 2,440.0 1,253.3 1,230.2 1,010.4 219.8 1,314.2 339.6 127.4 100.9 60.5 125.2 50.0 65.3 130.5
2016 Dec 2,512.0 1,259.7 1,276.6 1,016.5 260.1 1,347.5 354.1 125.1 104.7 62.2 128.2 50.6 57.0 139.7
2017 Mar 2,533.8 1,267.0 1,283.2 1,022.4 260.8 1,364.4 356.6 129.4 105.2 66.9 131.5 50.5 55.9 141.0 June 2,559.7 1,280.1 1,297.8 1,033.7 264.1 1,377.8 360.9 131.5 108.3 65.7 130.8 51.0 54.7 141.5 Sep 2,589.5 1,296.7 1,315.7 1,046.9 268.8 1,392.7 366.5 131.8 109.7 67.1 133.3 50.9 53.0 146.0 Dec 2,610.1 1,304.3 1,326.6 1,053.0 273.6 1,403.1 368.5 131.3 112.6 67.3 133.3 50.2 51.5 147.9
Short-term lending
2015 207.6 − 8.5 − 8.5 173.8 4.3 33.7 4.7 11.5 42.0 3.9 5.3 24.1
2016 Dec 205.5 − 6.9 − 6.9 174.3 3.7 29.7 4.4 11.8 43.2 3.6 4.4 29.3
2017 Mar 211.8 − 6.9 − 6.9 181.3 3.7 33.6 4.5 13.6 44.8 3.8 4.2 28.6 June 213.6 − 6.7 − 6.7 183.3 3.5 34.7 4.7 13.7 43.3 4.0 4.6 28.1 Sep 213.5 − 6.5 − 6.5 183.5 3.6 33.8 4.0 14.0 45.2 3.9 4.3 28.1 Dec 210.6 − 6.5 − 6.5 180.8 3.6 32.3 4.0 13.6 45.2 3.4 4.0 27.4
Medium-term lending
2015 256.0 − 35.2 − 35.2 181.3 13.3 23.8 5.1 10.4 16.4 4.4 11.7 41.1
2016 Dec 264.1 − 34.5 − 34.5 186.4 13.5 23.6 5.5 10.5 17.2 4.5 11.2 41.8
2017 Mar 264.4 − 34.0 − 34.0 186.8 13.4 23.3 4.9 11.4 17.9 4.4 10.8 43.0 June 267.4 − 33.8 − 33.8 188.7 13.3 23.3 5.0 10.9 18.2 4.4 10.7 44.3 Sep 269.6 − 33.9 − 33.9 190.2 13.6 23.1 5.1 11.2 18.2 4.4 10.4 45.6 Dec 273.5 − 34.0 − 34.0 193.1 14.0 23.6 5.1 11.3 18.2 4.3 10.3 46.7
Long-term lending
2015 1,976.3 1,253.3 1,186.4 1,010.4 176.0 959.1 322.0 70.0 91.2 38.5 66.9 41.7 48.3 65.3
2016 Dec 2,042.4 1,259.7 1,235.1 1,016.5 218.6 986.8 336.9 71.8 94.8 39.9 67.7 42.5 41.4 68.6
2017 Mar 2,057.6 1,267.0 1,242.4 1,022.4 220.0 996.2 339.6 72.5 95.8 41.9 68.7 42.3 40.9 69.4 June 2,078.7 1,280.1 1,257.3 1,033.7 223.6 1,005.8 344.0 73.5 98.6 41.1 69.3 42.6 39.4 69.2 Sep 2,106.3 1,296.7 1,275.3 1,046.9 228.3 1,018.9 349.3 74.9 100.5 41.9 69.9 42.6 38.3 72.2 Dec 2,125.9 1,304.3 1,286.1 1,053.0 233.1 1,029.2 351.0 75.4 103.5 42.4 70.0 42.4 37.2 73.8
Lending, total Change during quarter *
2016 Q4 + 14.4 + 9.1 + 12.4 + 8.4 + 4.0 + 6.0 + 3.8 − 5.2 + 1.4 − 1.0 + 1.3 − 0.6 − 0.3 + 3.2
2017 Q1 + 21.7 + 7.3 + 6.6 + 5.8 + 0.7 + 16.8 + 2.6 + 4.3 + 0.5 + 2.0 + 3.3 − 0.1 − 1.1 + 1.2 Q2 + 23.3 + 12.7 + 13.8 + 11.2 + 2.6 + 11.1 + 4.1 + 2.1 + 0.4 − 1.1 − 0.6 + 0.7 − 1.3 + 0.4 Q3 + 29.5 + 15.3 + 17.8 + 12.6 + 5.2 + 14.5 + 5.7 + 0.1 + 1.1 + 1.2 + 2.4 + 0.4 − 1.7 + 2.0 Q4 + 18.7 + 9.7 + 12.7 + 7.8 + 4.9 + 8.9 + 4.1 − 0.4 + 1.0 + 0.2 + 0.2 − 0.6 − 1.5 + 1.5
Short-term lending
2016 Q4 − 7.6 − − 0.7 − − 0.7 − 6.6 − 0.5 − 4.6 − 0.2 − 1.2 + 0.7 − 0.5 − 0.3 + 0.9
2017 Q1 + 6.3 − − 0.0 − − 0.0 + 7.0 + 0.0 + 4.0 + 0.1 + 1.0 + 1.6 + 0.2 − 0.2 − 0.7 Q2 + 2.1 − − 0.1 − − 0.1 + 2.3 − 0.1 + 1.1 + 0.2 + 0.1 − 1.4 + 0.3 + 0.3 − 0.4 Q3 − 0.1 − − 0.2 − − 0.2 + 0.2 + 0.0 − 0.9 − 0.7 + 0.3 + 1.8 − 0.2 − 0.3 + 0.0 Q4 − 2.8 − − 0.0 − − 0.0 − 2.6 + 0.0 − 1.4 − 0.0 − 0.4 − 0.0 − 0.4 − 0.3 − 0.8
Medium-term lending
2016 Q4 + 2.4 − − 0.3 − − 0.3 + 2.3 + 0.0 − 0.6 − 0.3 − 0.0 + 0.7 − 0.0 + 0.2 + 0.7
2017 Q1 + 0.2 − − 0.6 − − 0.6 + 0.4 − 0.1 − 0.4 − 0.5 + 0.5 + 0.7 − 0.1 − 0.4 + 1.1 Q2 + 3.0 − − 0.1 − − 0.1 + 1.9 − 0.0 − + 0.0 − 0.4 + 0.2 − 0.1 − 0.1 + 1.3 Q3 + 2.4 − + 0.2 − + 0.2 + 1.5 + 0.3 − 0.2 + 0.2 + 0.3 + 0.0 + 0.1 − 0.3 + 1.3 Q4 + 3.9 − + 0.1 − + 0.1 + 2.8 + 0.3 + 0.5 − 0.1 + 0.1 − 0.0 − 0.1 − 0.1 + 1.1
Long-term lending
2016 Q4 + 19.6 + 9.1 + 13.3 + 8.4 + 4.9 + 10.4 + 4.3 + 0.1 + 1.8 + 0.2 − 0.1 + 0.0 − 0.2 + 1.6
2017 Q1 + 15.1 + 7.3 + 7.2 + 5.8 + 1.4 + 9.4 + 2.6 + 0.7 + 0.9 + 0.5 + 0.9 − 0.2 − 0.5 + 0.8 Q2 + 18.2 + 12.7 + 14.0 + 11.2 + 2.9 + 6.9 + 4.2 + 1.0 + 0.2 − 0.8 + 0.6 + 0.5 − 1.5 − 0.5 Q3 + 27.2 + 15.3 + 17.8 + 12.6 + 5.2 + 12.8 + 5.4 + 1.3 + 1.7 + 0.7 + 0.5 + 0.4 − 1.2 + 0.7 Q4 + 17.6 + 9.7 + 12.6 + 7.8 + 4.8 + 8.7 + 3.8 + 0.5 + 1.1 + 0.5 + 0.3 − 0.1 − 1.1 + 1.1
* Excluding lending by foreign branches. Breakdown of lending by building and loan from the changes. The figures for the latest date are always to be regarded as pro-associations by areas and sectors estimated. Statistical alterations have been eliminated visional; subsequent alterations, which will appear in the following Monthly Report,

Deutsche Bundesbank
33
Monthly Report
March 2018
IV Banks
Lending to Lending to employees and other individuals non-profit institutions
Memo items Other lendingServices sector (including the professions)
of which of which
Debitbalanceson wage,
Other Lending salaryreal to self- Lending and of which
Housing Holding estate employed to craft Housing pension HousingInstalmentTotal companies Total loans Total loans 3 accounts Total loans Periodenterprises activities persons 2 enterprises
End of year or quarter * Lending, total
654.3 193.4 32.4 176.5 395.6 46.8 1,111.6 887.1 224.6 154.4 10.1 14.2 3.5 2015
680.0 204.7 36.3 181.6 401.3 46.0 1,150.1 919.0 231.2 163.3 9.2 14.4 3.6 2016 Dec
684.0 206.2 38.8 179.7 403.8 46.3 1,154.8 922.9 231.9 165.5 9.2 14.6 3.7 2017 Mar 694.3 209.8 39.6 183.6 408.2 48.5 1,167.3 933.2 234.2 168.0 8.9 14.5 3.8 June700.9 211.2 41.1 185.7 410.4 48.3 1,182.2 945.4 236.7 170.4 8.9 14.6 3.7 Sep 709.0 214.9 42.3 186.4 411.2 47.7 1,192.3 954.3 237.9 171.6 8.6 14.8 3.7 Dec
Short-term lending
48.7 8.7 4.9 10.7 25.4 5.6 33.2 4.2 29.0 1.7 10.1 0.5 0.0 2015
47.9 8.4 5.7 10.2 23.9 5.1 30.6 3.2 27.4 1.8 9.2 0.6 0.0 2016 Dec
48.2 8.4 6.6 9.1 24.5 5.7 29.8 3.2 26.7 1.8 9.2 0.6 0.0 2017 Mar 50.1 9.0 6.5 9.7 24.5 5.7 29.7 3.1 26.6 1.8 8.9 0.5 0.0 June50.2 9.6 6.7 10.0 23.7 5.5 29.4 2.9 26.5 1.7 8.9 0.5 0.0 Sep 50.9 10.1 6.8 10.3 23.3 5.0 29.3 2.9 26.4 1.6 8.6 0.5 0.0 Dec
Medium-term lending
68.4 10.1 7.3 19.3 32.4 3.5 74.2 21.9 52.3 47.4 − 0.6 0.0 2015
72.1 11.1 8.2 19.3 32.9 3.6 77.3 21.1 56.2 51.0 − 0.5 0.0 2016 Dec
71.1 11.3 8.6 17.8 32.7 3.6 77.1 20.6 56.5 51.7 − 0.5 0.0 2017 Mar 72.1 11.5 8.8 18.6 32.8 3.6 78.1 20.5 57.7 52.9 − 0.5 0.0 June72.2 11.9 9.1 18.3 32.9 3.6 78.9 20.2 58.6 54.0 − 0.5 0.0 Sep 73.5 12.1 9.3 18.3 32.7 3.6 79.9 20.0 59.9 55.2 − 0.6 0.0 Dec
Long-term lending
537.3 174.6 20.2 146.5 337.8 37.7 1,004.2 861.0 143.3 105.3 − 13.0 3.5 2015
560.0 185.2 22.4 152.2 344.5 37.3 1,042.3 894.7 147.6 110.5 − 13.3 3.5 2016 Dec
564.7 186.5 23.6 152.7 346.5 37.1 1,047.9 899.2 148.8 112.1 − 13.4 3.7 2017 Mar 572.2 189.2 24.3 155.3 350.8 39.2 1,059.4 909.6 149.9 113.3 − 13.5 3.7 June578.5 189.8 25.3 157.4 353.8 39.3 1,073.8 922.3 151.6 114.8 − 13.6 3.7 Sep 584.6 192.6 26.2 157.8 355.3 39.2 1,083.1 931.4 151.6 114.8 − 13.7 3.7 Dec
Change during quarter * Lending, total
+ 7.1 + 3.3 + 1.5 + 0.8 + 0.2 − 0.8 + 8.2 + 8.5 − 0.4 + 1.1 − 0.6 + 0.2 + 0.0 2016 Q4
+ 6.8 + 1.4 + 2.3 + 0.8 + 2.3 + 0.3 + 4.9 + 4.1 + 0.8 + 2.3 − 0.0 + 0.1 − 0.0 2017 Q1+ 10.5 + 3.5 + 0.8 + 4.0 + 3.4 + 0.1 + 12.2 + 9.7 + 2.6 + 2.8 − 0.3 − 0.1 + 0.1 Q2+ 8.9 + 3.0 + 1.7 + 2.7 + 2.2 − 0.1 + 14.9 + 12.1 + 2.8 + 2.5 − 0.0 + 0.1 − 0.0 Q3+ 8.5 + 3.7 + 1.2 + 1.0 + 0.8 − 0.6 + 9.8 + 8.6 + 1.1 + 1.1 − 0.3 + 0.1 − 0.0 Q4
Short-term lending
− 1.4 + 0.1 − 0.3 − 0.5 − 0.8 − 0.6 − 1.1 − 0.2 − 0.9 + 0.1 − 0.6 + 0.0 + 0.0 2016 Q4
+ 1.0 + 0.0 + 0.9 − 0.2 + 0.7 + 0.6 − 0.7 − 0.0 − 0.7 + 0.0 − 0.0 + 0.1 − 0.0 2017 Q1+ 2.2 + 0.6 − 0.0 + 0.8 − − 0.0 − 0.1 − 0.1 − 0.0 − 0.0 − 0.3 − 0.1 + 0.0 Q2+ 0.1 + 0.6 + 0.2 + 0.3 − 0.9 − 0.2 − 0.3 − 0.2 − 0.1 − 0.1 − 0.0 − 0.0 − 0.0 Q3+ 0.7 + 0.5 + 0.1 + 0.4 − 0.4 − 0.5 − 0.2 − 0.1 − 0.1 − 0.1 − 0.3 + 0.0 + 0.0 Q4
Medium-term lending
+ 1.7 + 0.2 + 1.0 − 0.0 − 0.1 − 0.1 + 0.2 − 0.3 + 0.5 + 0.6 − − 0.0 − 0.0 2016 Q4
− 0.5 + 0.2 + 0.2 − 0.9 − 0.1 − 0.0 − 0.2 − 0.5 + 0.3 + 0.7 − + 0.0 − 0.0 2017 Q1+ 1.0 + 0.2 + 0.1 + 0.8 + 0.1 + 0.0 + 1.1 − 0.1 + 1.2 + 1.3 − + 0.0 + 0.0 Q2+ 0.1 + 0.3 + 0.3 − 0.3 + 0.1 − 0.0 + 0.9 − 0.1 + 1.0 + 1.0 − + 0.0 + 0.0 Q3+ 1.4 + 0.3 + 0.2 − 0.0 − 0.3 + 0.0 + 1.0 − 0.2 + 1.2 + 1.2 − + 0.0 − 0.0 Q4
Long-term lending
+ 6.8 + 3.1 + 0.8 + 1.3 + 1.1 − 0.1 + 9.1 + 9.0 + 0.0 + 0.4 − + 0.1 + 0.0 2016 Q4
+ 6.2 + 1.2 + 1.1 + 2.0 + 1.8 − 0.2 + 5.8 + 4.6 + 1.2 + 1.6 − − 0.0 − 0.0 2017 Q1+ 7.4 + 2.7 + 0.7 + 2.4 + 3.3 + 0.0 + 11.3 + 9.8 + 1.4 + 1.6 − + 0.0 + 0.0 Q2+ 8.6 + 2.0 + 1.2 + 2.7 + 3.0 + 0.1 + 14.3 + 12.4 + 1.9 + 1.6 − + 0.2 − 0.0 Q3+ 6.5 + 2.9 + 0.9 + 0.7 + 1.5 − 0.1 + 8.9 + 8.9 − 0.0 − 0.1 − + 0.0 − 0.0 Q4
are not specially marked. 1 Excluding fiduciary loans. 2 Including sole proprietors. 3 Excluding mortgage loans and housing loans, even in the form of instalment credit.

Deutsche Bundesbank
34
Monthly Report
March 2018
IV Banks
7 Deposits of domestic non-banks (non-MFIs) at banks (MFIs) in Germany*
€ billion
Time deposits 1,2 Memo item
for more than 1 year 2 Subordinated liabilities
for up for up (excludingto and to and for more Bank negotiable Liabilities
Deposits, Sight including including than Savings savings Fiduciary debt arisingPeriod total deposits Total 1 year Total 2 years 2 years bonds 4 loans securities) from reposdeposits 3
Domestic non-banks, total End of year or month*
2015 3,224.7 1,673.7 898.4 243.0 655.4 37.3 618.1 596.5 56.1 29.3 20.5 0.52016 3,326.7 1,798.2 889.6 232.4 657.3 47.2 610.1 588.5 50.4 28.8 18.3 0.92017 3,420.9 1,941.0 853.2 207.6 645.6 57.3 588.3 582.9 43.7 30.0 16.3 1.6
2017 Feb 3,345.5 1,816.6 891.4 237.3 654.1 46.5 607.6 588.5 49.0 30.5 17.6 1.5 Mar 3,342.8 1,817.0 890.9 237.8 653.1 47.8 605.3 586.7 48.2 30.4 17.2 0.9
Apr 3,360.3 1,844.4 881.9 229.2 652.6 50.3 602.3 586.2 47.8 30.3 17.3 0.8 May 3,368.4 1,852.2 883.4 229.3 654.1 52.3 601.8 585.7 47.0 30.4 17.1 0.4 June 3,370.3 1,869.2 869.8 226.4 643.4 53.5 589.9 584.7 46.6 29.8 16.9 0.9
July 3,361.5 1,866.0 866.0 223.2 642.8 54.1 588.6 583.5 46.0 29.9 16.7 0.7 Aug 3,376.5 1,884.2 864.4 220.0 644.4 55.2 589.2 582.4 45.4 30.0 16.7 0.7 Sep 3,380.7 1,891.7 861.9 218.7 643.2 55.3 587.9 581.8 45.3 30.0 15.8 1.8
Oct 3,396.5 1,916.8 853.4 212.7 640.7 54.5 586.2 581.5 44.8 29.9 15.7 1.1 Nov 3,426.8 1,944.0 857.5 212.4 645.0 55.3 589.7 581.0 44.3 30.1 15.1 1.6 Dec 3,420.9 1,941.0 853.2 207.6 645.6 57.3 588.3 582.9 43.7 30.0 16.3 1.6
2018 Jan 3,428.8 1,949.3 854.1 211.5 642.6 55.8 586.8 582.3 42.9 30.4 16.1 1.4
Changes*
2016 + 104.7 + 124.5 − 6.9 − 8.9 + 2.0 + 10.2 − 8.2 − 7.9 − 5.0 − 0.5 − 2.1 + 0.32017 + 103.1 + 142.8 − 27.5 − 24.7 − 2.8 + 10.1 − 12.8 − 5.6 − 6.7 + 0.4 − 2.0 + 0.8
2017 Feb − 0.8 + 4.1 − 4.5 − 3.7 − 0.8 − 0.4 − 0.4 + 0.1 − 0.5 − 0.1 − 0.5 − 1.1 Mar − 2.7 + 0.4 − 0.5 + 0.5 − 1.0 + 1.3 − 2.3 − 1.9 − 0.7 − 0.1 − 0.4 − 0.6
Apr + 17.5 + 27.3 − 9.0 − 8.5 − 0.5 + 2.5 − 3.0 − 0.5 − 0.4 − 0.1 + 0.0 − 0.1 May + 8.1 + 7.8 + 1.6 + 0.1 + 1.5 + 2.0 − 0.5 − 0.5 − 0.8 + 0.0 − 0.2 − 0.4 June + 10.9 + 17.0 − 4.6 − 2.9 − 1.7 + 1.2 − 2.9 − 1.0 − 0.4 − 0.6 − 0.1 + 0.4
July − 8.8 − 3.1 − 3.8 − 3.2 − 0.6 + 0.7 − 1.3 − 1.2 − 0.7 + 0.2 − 0.2 − 0.1 Aug + 15.0 + 18.2 − 1.6 − 3.2 + 1.6 + 1.1 + 0.6 − 1.1 − 0.6 + 0.1 − 0.1 − 0.0 Sep + 4.3 + 7.5 − 2.5 − 1.3 − 1.2 + 0.1 − 1.3 − 0.6 − 0.1 − 0.1 − 0.9 + 1.1
Oct + 15.7 + 25.1 − 8.5 − 6.0 − 2.5 − 0.8 − 1.8 − 0.3 − 0.5 − 0.0 − 0.1 − 0.6 Nov + 30.3 + 27.2 + 4.0 − 0.3 + 4.2 + 0.8 + 3.4 − 0.5 − 0.5 + 0.1 − 0.6 + 0.4 Dec − 5.9 − 3.0 − 4.2 − 4.8 + 0.6 + 2.0 − 1.4 + 1.9 − 0.6 − 0.1 + 1.2 + 0.0
2018 Jan + 7.5 + 8.0 + 0.9 + 3.9 − 3.0 − 1.3 − 1.7 − 0.6 − 0.8 + 0.4 − 0.2 − 0.2
Domestic government End of year or month*
2015 197.4 57.6 132.6 87.7 44.9 10.2 34.7 3.7 3.5 27.9 2.7 0.52016 199.8 57.9 133.5 79.5 54.0 16.6 37.4 3.9 4.5 27.1 2.5 −2017 201.7 58.9 134.7 65.8 69.0 27.4 41.5 3.6 4.4 25.7 2.3 −
2017 Feb 205.7 61.4 136.0 81.8 54.2 15.8 38.4 3.7 4.6 26.8 2.5 − Mar 204.0 58.9 136.8 81.4 55.4 16.5 38.9 3.7 4.7 26.7 2.5 −
Apr 203.1 59.1 135.6 77.9 57.7 18.7 39.0 3.6 4.7 26.7 2.5 − May 209.7 61.1 140.3 80.4 59.9 20.4 39.5 3.7 4.6 26.4 2.5 − June 209.9 58.1 143.5 81.8 61.8 21.8 40.0 3.7 4.7 25.8 2.4 −
July 207.2 55.6 143.2 80.4 62.8 22.4 40.4 3.7 4.7 25.8 2.4 − Aug 213.6 61.2 144.2 79.9 64.3 23.4 40.8 3.7 4.5 25.9 2.5 − Sep 210.5 58.8 143.4 77.5 66.0 24.1 41.9 3.7 4.5 25.9 2.3 −
Oct 207.6 60.0 139.5 72.6 67.0 24.4 42.6 3.7 4.4 25.8 2.3 0.0 Nov 211.1 61.1 142.2 72.3 69.9 25.8 44.1 3.6 4.2 25.8 2.3 0.0 Dec 201.7 58.9 134.7 65.8 69.0 27.4 41.5 3.6 4.4 25.7 2.3 −
2018 Jan 202.1 55.1 139.0 69.6 69.4 27.0 42.4 3.7 4.4 26.1 2.4 −
Changes*
2016 + 3.1 + 0.3 + 2.0 − 6.7 + 8.7 + 6.4 + 2.3 + 0.1 + 0.7 − 0.8 − 0.2 − 0.52017 − 1.0 + 1.6 − 2.4 − 14.1 + 11.7 + 10.7 + 0.9 − 0.3 + 0.1 − 1.1 − 0.3 + 0.0
2017 Feb + 3.5 + 6.3 − 2.8 − 2.9 + 0.2 − 0.6 + 0.8 − 0.1 + 0.1 + 0.0 + 0.0 − Mar − 1.7 − 2.5 + 0.8 − 0.3 + 1.1 + 0.6 + 0.5 − 0.0 + 0.1 − 0.1 − 0.0 −
Apr − 1.0 + 0.3 − 1.2 − 3.5 + 2.4 + 2.3 + 0.1 − 0.1 + 0.1 − 0.0 + 0.0 − May + 6.7 + 1.9 + 4.7 + 2.5 + 2.2 + 1.7 + 0.5 + 0.1 − 0.1 − 0.1 + 0.0 − June − 0.1 − 3.0 + 2.9 + 1.3 + 1.5 + 1.4 + 0.2 − 0.0 + 0.0 − 0.4 − 0.0 −
July − 2.8 − 2.5 − 0.4 − 1.3 + 0.9 + 0.5 + 0.4 − + 0.0 − 0.0 + 0.0 − Aug + 6.4 + 5.6 + 0.9 − 0.5 + 1.4 + 1.1 + 0.3 + 0.1 − 0.2 + 0.1 + 0.0 − Sep − 3.8 − 2.4 − 1.5 − 2.7 + 1.2 + 0.6 + 0.6 + 0.0 + 0.0 − 0.0 − 0.2 −
Oct − 3.5 + 1.1 − 4.5 − 5.0 + 0.4 + 0.2 + 0.2 − 0.1 − 0.1 − 0.1 − 0.0 + 0.0 Nov + 4.1 + 1.6 + 2.6 − 0.2 + 2.9 + 1.5 + 1.4 − 0.1 − 0.0 + 0.0 − 0.0 − Dec − 11.1 − 2.1 − 9.2 − 6.5 − 2.7 + 1.6 − 4.3 + 0.1 + 0.2 − 0.2 − 0.0 − 0.0
2018 Jan + 0.4 − 3.8 + 4.3 + 3.8 + 0.5 − 0.4 + 0.8 + 0.0 − 0.0 + 0.4 + 0.0 −
* See Table IV.2, footnote *; statistical breaks have been eliminated from the specially marked. 1 Including subordinated liabilities and liabilities arising fromchanges. The figures for the latest date are always to be regarded as provisional. registered debt securities. 2 Including deposits under savings and loan contracts (seeSubsequent revisions, which appear in the following Monthly Report, are not

Deutsche Bundesbank
35
Monthly Report
March 2018
IV Banks
7 Deposits of domestic non-banks (non-MFIs) at banks (MFIs) in Germany * (cont’d)
€ billion
Time deposits 1,2 Memo item
for more than 1 year 2 Subordinated liabilities
for up for up (excludingto and to and for more Bank negotiable Liabilities
Deposits, Sight including including than Savings savings Fiduciary debt arisingPeriod total deposits Total 1 year Total 2 years 2 years bonds 4 loans securities) from reposdeposits 3
Domestic enterprises and households End of year or month*
2015 3,027.3 1,616.1 765.8 155.3 610.5 27.1 583.5 592.7 52.6 1.4 17.8 −2016 3,127.0 1,740.3 756.2 152.8 603.3 30.6 572.7 584.6 45.9 1.7 15.8 0.92017 3,219.2 1,882.1 718.5 141.9 576.6 29.9 546.8 579.3 39.3 4.3 14.0 1.6
2017 Feb 3,139.8 1,755.2 755.4 155.5 599.9 30.6 569.2 584.8 44.4 3.7 15.1 1.5 Mar 3,138.8 1,758.1 754.1 156.3 597.8 31.3 566.4 583.0 43.6 3.7 14.8 0.9
Apr 3,157.2 1,785.2 746.3 151.4 594.9 31.6 563.3 582.6 43.1 3.7 14.8 0.8 May 3,158.7 1,791.1 743.1 148.9 594.2 31.9 562.4 582.0 42.4 4.0 14.6 0.4 June 3,160.3 1,811.1 726.2 144.6 581.6 31.7 549.9 581.0 41.9 3.9 14.5 0.9
July 3,154.3 1,810.5 722.7 142.8 580.0 31.8 548.2 579.8 41.3 4.1 14.3 0.7 Aug 3,162.8 1,823.0 720.2 140.1 580.1 31.8 548.3 578.7 40.9 4.1 14.2 0.7 Sep 3,170.2 1,832.9 718.5 141.2 577.2 31.2 546.1 578.1 40.8 4.1 13.5 1.8
Oct 3,188.8 1,856.9 713.8 140.1 573.7 30.1 543.5 577.8 40.3 4.1 13.4 1.1 Nov 3,215.7 1,882.9 715.3 140.1 575.2 29.5 545.6 577.5 40.1 4.3 12.8 1.6 Dec 3,219.2 1,882.1 718.5 141.9 576.6 29.9 546.8 579.3 39.3 4.3 14.0 1.6
2018 Jan 3,226.7 1,894.3 715.1 142.0 573.2 28.7 544.5 578.7 38.6 4.4 13.8 1.4
Changes*
2016 + 101.7 + 124.2 − 8.9 − 2.2 − 6.7 + 3.8 − 10.5 − 8.0 − 5.7 + 0.3 − 1.9 + 0.92017 + 104.1 + 141.3 − 25.1 − 10.6 − 14.4 − 0.7 − 13.8 − 5.3 − 6.7 + 1.6 − 1.7 + 0.8
2017 Feb − 4.3 − 2.2 − 1.7 − 0.8 − 0.9 + 0.2 − 1.1 + 0.2 − 0.6 − 0.1 − 0.5 − 1.1 Mar − 1.0 + 2.9 − 1.3 + 0.8 − 2.1 + 0.7 − 2.8 − 1.9 − 0.8 + 0.0 − 0.3 − 0.6
Apr + 18.4 + 27.0 − 7.8 − 5.0 − 2.8 + 0.2 − 3.1 − 0.4 − 0.5 − 0.0 + 0.0 − 0.1 May + 1.4 + 5.9 − 3.2 − 2.5 − 0.7 + 0.3 − 0.9 − 0.6 − 0.7 + 0.1 − 0.2 − 0.4 June + 11.0 + 19.9 − 7.5 − 4.2 − 3.3 − 0.2 − 3.1 − 1.0 − 0.4 − 0.2 − 0.1 + 0.4
July − 5.9 − 0.7 − 3.4 − 1.9 − 1.5 + 0.1 − 1.6 − 1.2 − 0.7 + 0.2 − 0.2 − 0.1 Aug + 8.6 + 12.6 − 2.5 − 2.7 + 0.2 − 0.0 + 0.2 − 1.1 − 0.3 + 0.0 − 0.1 − 0.0 Sep + 8.1 + 9.9 − 1.0 + 1.4 − 2.4 − 0.6 − 1.9 − 0.6 − 0.2 − 0.0 − 0.7 + 1.1
Oct + 19.2 + 23.9 − 4.0 − 1.0 − 3.0 − 1.0 − 2.0 − 0.2 − 0.4 + 0.0 − 0.1 − 0.7 Nov + 26.2 + 25.6 + 1.4 − 0.0 + 1.4 − 0.6 + 2.0 − 0.4 − 0.4 + 0.1 − 0.6 + 0.4 Dec + 5.2 − 0.9 + 5.0 + 1.8 + 3.3 + 0.4 + 2.9 + 1.8 − 0.7 + 0.1 + 1.3 + 0.1
2018 Jan + 7.1 + 11.9 − 3.4 + 0.1 − 3.5 − 0.9 − 2.6 − 0.6 − 0.8 + 0.0 − 0.2 − 0.2
of which: Domestic enterprises End of year or month*
2015 1,029.8 502.8 506.5 99.8 406.7 14.4 392.3 7.1 13.3 1.3 14.0 −2016 1,032.4 518.3 494.1 98.3 395.8 17.4 378.4 6.9 13.2 1.6 13.0 0.92017 1,039.6 558.9 461.0 92.9 368.2 17.2 351.0 6.8 12.8 2.7 11.6 1.6
2017 Feb 1,033.8 520.4 493.6 100.5 393.1 18.0 375.1 6.8 13.0 2.8 12.4 1.5 Mar 1,034.5 522.7 492.1 101.3 390.8 18.4 372.4 6.8 12.9 2.8 12.1 0.9
Apr 1,035.4 530.1 485.4 97.5 387.9 18.6 369.2 6.9 13.0 2.8 12.1 0.8 May 1,033.4 531.1 482.6 95.8 386.8 18.8 368.1 6.8 12.9 2.9 12.0 0.4 June 1,032.3 545.0 467.6 92.9 374.7 18.8 355.9 6.8 12.9 2.8 11.9 0.9
July 1,022.6 537.7 465.4 91.5 373.9 19.1 354.8 6.8 12.8 2.8 11.8 0.7 Aug 1,026.6 543.9 463.2 89.1 374.1 19.2 354.8 6.8 12.7 2.8 11.7 0.7 Sep 1,028.0 546.3 462.0 90.9 371.1 18.7 352.4 6.9 12.9 2.8 11.0 1.8
Oct 1,038.4 561.0 457.7 90.0 367.7 17.8 349.8 6.9 12.9 2.8 10.9 1.1 Nov 1,047.0 567.1 459.8 90.6 369.3 17.3 352.0 6.9 13.1 2.9 10.4 1.6 Dec 1,039.6 558.9 461.0 92.9 368.2 17.2 351.0 6.8 12.8 2.7 11.6 1.6
2018 Jan 1,051.4 573.9 458.0 93.6 364.4 16.0 348.4 6.9 12.6 2.6 11.4 1.4
Changes*
2016 + 4.6 + 15.9 − 11.2 − 1.2 − 10.1 + 3.2 − 13.2 − 0.2 + 0.1 + 0.2 − 0.9 + 0.92017 + 19.5 + 40.2 − 20.0 − 4.7 − 15.4 − 0.2 − 15.2 − 0.0 − 0.6 + 0.8 − 1.3 + 0.8
2017 Feb − 14.2 − 12.6 − 1.6 − 1.1 − 0.5 + 0.4 − 0.9 − 0.0 − 0.0 − 0.1 − 0.5 − 1.1 Mar + 0.7 + 2.4 − 1.5 + 0.8 − 2.3 + 0.4 − 2.7 − 0.1 − 0.2 − 0.0 − 0.3 − 0.6
Apr + 0.9 + 7.3 − 6.6 − 3.8 − 2.8 + 0.2 − 3.1 + 0.1 + 0.2 − 0.0 + 0.1 − 0.1 May − 2.0 + 1.0 − 2.7 − 1.7 − 1.0 + 0.1 − 1.2 − 0.1 − 0.1 − − 0.1 − 0.4 June + 8.3 + 14.0 − 5.7 − 2.9 − 2.8 − 0.0 − 2.8 + 0.0 − 0.0 − 0.2 − 0.1 + 0.4
July − 9.7 − 7.4 − 2.2 − 1.5 − 0.7 + 0.4 − 1.1 − 0.0 − 0.1 − − 0.2 − 0.1 Aug + 4.2 + 6.2 − 2.0 − 2.4 + 0.3 + 0.1 + 0.2 + 0.1 − 0.1 − 0.0 − 0.0 − 0.0 Sep + 2.1 + 2.4 − 0.6 + 2.0 − 2.6 − 0.5 − 2.1 + 0.1 + 0.2 − 0.0 − 0.7 + 1.1
Oct + 11.0 + 14.7 − 3.7 − 0.8 − 2.9 − 0.8 − 2.0 − 0.0 − 0.0 − − 0.1 − 0.7 Nov + 7.9 + 5.7 + 2.1 + 0.5 + 1.5 − 0.5 + 2.1 + 0.1 + 0.1 + 0.1 − 0.5 + 0.4 Dec − 5.7 − 8.2 + 3.0 + 2.3 + 0.7 − 0.1 + 0.7 − 0.1 − 0.3 − 0.2 + 1.3 + 0.1
2018 Jan + 11.5 + 14.6 − 3.0 + 0.7 − 3.8 − 0.9 − 2.9 + 0.1 − 0.2 − 0.1 − 0.2 − 0.2
Table IV.12). 3 Excluding deposits under savings and loan contracts (see also foot- note 2). 4 Including liabilities arising from non-negotiable bearer debt securities.

Deutsche Bundesbank
36
Monthly Report
March 2018
IV Banks
8 Deposits of domestic households and non-profit institutions at banks (MFIs) in Germany*
€ billion
Sight deposits Time deposits 1,2
by creditor group by creditor group
Deposits of Domestic households Domestic householdsdomestichouseholdsand Domesticnon-profit Self- non-profit Self-
employed Other institu- employed Otherinstitutions,Period total Total Total persons Employees tions Total Total persons Employeesindividuals individuals
End of year or month*
2015 1,997.5 1,113.3 1,081.2 188.9 748.6 143.7 32.1 259.3 246.2 24.9 179.8 41.62016 2,094.5 1,222.0 1,186.9 206.0 828.6 152.3 35.1 262.1 248.6 25.0 182.0 41.52017 2,179.7 1,323.1 1,286.6 223.4 907.6 155.7 36.5 257.5 243.5 23.4 182.9 37.1
2017 Aug 2,136.3 1,279.2 1,243.6 219.1 871.3 153.3 35.5 257.0 242.2 23.8 181.5 36.9 Sep 2,142.2 1,286.6 1,250.8 216.0 880.5 154.3 35.8 256.5 241.8 23.7 181.4 36.7
Oct 2,150.4 1,295.9 1,260.1 221.4 884.8 153.9 35.7 256.1 241.6 23.6 181.4 36.6 Nov 2,168.7 1,315.8 1,280.3 222.9 902.2 155.2 35.5 255.4 241.4 23.4 181.4 36.7 Dec 2,179.7 1,323.1 1,286.6 223.4 907.6 155.7 36.5 257.5 243.5 23.4 182.9 37.1
2018 Jan 2,175.3 1,320.4 1,284.1 226.0 903.3 154.8 36.3 257.1 243.3 22.9 183.3 37.1
Changes*
2016 + 97.1 + 108.4 + 105.3 + 17.5 + 78.7 + 9.0 + 3.0 + 2.4 + 1.8 + 0.1 + 1.9 − 0.32017 + 84.7 + 101.1 + 99.8 + 17.5 + 77.8 + 4.5 + 1.3 − 5.0 − 5.1 − 1.8 − 2.1 − 1.3
2017 Aug + 4.4 + 6.4 + 5.9 + 2.9 + 2.6 + 0.5 + 0.4 − 0.4 − 0.6 − 0.0 − 0.4 − 0.1 Sep + 6.0 + 7.5 + 7.2 − 3.0 + 9.2 + 1.0 + 0.3 − 0.5 − 0.3 − 0.1 − 0.0 − 0.3
Oct + 8.3 + 9.2 + 9.4 + 5.4 + 4.3 − 0.3 − 0.1 − 0.3 − 0.3 − 0.2 − 0.1 − 0.1 Nov + 18.3 + 19.9 + 20.2 + 1.5 + 17.4 + 1.3 − 0.2 − 0.7 − 0.1 − 0.2 + 0.0 + 0.1 Dec + 10.9 + 7.4 + 6.3 + 0.5 + 5.2 + 0.6 + 1.0 + 2.1 + 2.1 + 0.0 + 1.5 + 0.5
2018 Jan − 4.4 − 2.7 − 2.6 + 2.6 − 4.2 − 0.9 − 0.2 − 0.4 − 0.2 − 0.5 + 0.4 − 0.1
* See Table IV.2, footnote*; statistical breaks have been eliminated from the changes. revisions, which appear in the following Monthly Report, are not speciallyThe figures for the latest date are always to be regarded as provisional. Subsequent marked. 1 Including subordinated liabilities and liabilities arising from registered debt
9 Deposits of domestic government at banks (MFIs) in Germany, by creditor group*
€ billion
Deposits
Federal Government and its special funds 1 State governments
Time deposits Time depositsSavings Savings
for up deposits Memo for up deposits MemoDomestic to and for more and bank item to and for more and bank itemgovernment, Sight including than savings Fiduciary Sight including than savings Fiduciary
Period total Total deposits 1 year 1 year bonds 2 loans Total deposits 1 year 1 year bonds 2 loans
End of year or month*
2015 197.4 9.6 3.1 3.9 2.6 0.1 14.1 44.3 13.2 13.7 16.5 0.9 13.52016 199.8 7.9 3.6 2.0 2.2 0.1 13.5 42.3 13.4 11.2 16.6 1.1 13.22017 201.7 8.7 4.3 1.5 2.8 0.1 12.9 37.5 11.9 9.9 14.5 1.3 12.7
2017 Aug 213.6 7.9 3.9 1.4 2.6 0.1 13.2 49.9 11.1 19.8 17.9 1.2 12.7 Sep 210.5 8.0 4.1 1.3 2.6 0.1 13.2 49.8 11.7 19.2 17.7 1.2 12.7
Oct 207.6 7.9 4.0 1.3 2.4 0.1 13.2 46.9 11.8 16.1 17.7 1.2 12.6 Nov 211.1 8.3 4.2 1.3 2.7 0.1 13.2 44.8 12.0 13.9 17.7 1.3 12.6 Dec 201.7 8.7 4.3 1.5 2.8 0.1 12.9 37.5 11.9 9.9 14.5 1.3 12.7
2018 Jan 202.1 8.9 4.6 1.2 2.9 0.1 12.9 40.1 10.3 13.9 14.6 1.3 13.1
Changes*
2016 + 3.1 − 1.2 + 0.5 − 1.4 − 0.3 + 0.0 − 0.5 − 1.8 + 0.1 − 1.8 − 0.3 + 0.1 − 0.32017 − 1.0 − 0.0 + 0.7 − 1.0 + 0.2 − 0.0 − 0.6 − 5.1 − 1.4 − 1.4 − 2.5 + 0.2 − 0.5
2017 Aug + 6.4 − 0.1 + 0.0 − 0.3 + 0.2 + 0.0 + 0.0 − 0.1 − 0.2 + 0.2 − 0.1 − 0.0 + 0.1 Sep − 3.8 + 0.0 + 0.2 − 0.1 − 0.1 + 0.0 − 0.0 − 0.2 + 0.6 − 0.7 − 0.1 + 0.0 − 0.0
Oct − 3.5 − 0.2 − 0.1 + 0.0 − 0.1 + 0.0 + 0.0 − 3.0 + 0.1 − 3.0 − 0.0 + 0.0 − 0.1 Nov + 4.1 + 0.3 + 0.2 + 0.0 + 0.1 − 0.0 + 0.0 − 1.9 + 0.2 − 2.2 + 0.1 + 0.1 − 0.0 Dec − 11.1 + 0.3 + 0.1 + 0.1 + 0.1 + 0.0 − 0.3 − 7.5 − 0.1 − 4.0 − 3.4 + 0.1 + 0.1
2018 Jan + 0.4 + 0.2 + 0.3 − 0.2 + 0.0 + 0.0 − 0.0 + 2.6 − 1.6 + 4.0 + 0.1 + 0.0 + 0.4
* See Table IV.2, footnote *; excluding deposits of the Treuhand agency and its Telekom AG, and of publicly owned enterprises, which are included in ”Enterprises”.successor organisations, of the Federal Railways, east German Railways and Federal Statistical breaks have been eliminated from the changes. The figures for the latestPost Office, and, from 1995, of Deutsche Bahn AG, Deutsche Post AG and Deutsche date are always to be regarded as provisional. Subsequent revisions, which appear in

Deutsche Bundesbank
37
Monthly Report
March 2018
IV Banks
Savings deposits 3 Memo item
by maturity
more than 1 year 2 Subordinated
of which liabilitiesDomestic Domestic (excluding
up to and up to and Bank negotiable Liabilitiesnon-profit non-profitinstitu- including including more than Domestic institu- savings Fiduciary debt arisingtions 1 year Total 2 years 2 years Total tions bonds 4 loans from repos Periodhouseholds securities) 5
End of year or month*
13.1 55.5 203.9 12.7 191.1 585.6 576.6 9.0 39.2 0.0 3.8 − 201513.5 54.5 207.5 13.3 194.3 577.7 569.3 8.4 32.7 0.1 2.9 − 201614.0 49.0 208.5 12.7 195.8 572.4 564.6 7.9 26.6 1.7 2.4 − 2017
14.8 51.0 206.0 12.5 193.5 571.8 563.8 8.0 28.2 1.3 2.5 − 2017 Aug 14.7 50.3 206.2 12.5 193.7 571.2 563.1 8.0 27.9 1.3 2.5 − Sep
14.6 50.1 206.0 12.3 193.7 571.0 563.0 8.0 27.5 1.3 2.5 − Oct 14.0 49.5 205.9 12.2 193.6 570.5 562.8 7.8 27.0 1.4 2.4 − Nov 14.0 49.0 208.5 12.7 195.8 572.4 564.6 7.9 26.6 1.7 2.4 − Dec
13.8 48.3 208.8 12.7 196.1 571.8 563.9 7.8 26.0 1.8 2.4 − 2018 Jan
Changes*
+ 0.6 − 1.0 + 3.4 + 0.7 + 2.7 − 7.9 − 7.3 − 0.5 − 5.8 + 0.1 − 0.9 − 2016+ 0.1 − 5.9 + 0.9 − 0.5 + 1.4 − 5.3 − 4.7 − 0.6 − 6.1 + 0.8 − 0.4 − 2017
+ 0.2 − 0.3 − 0.1 − 0.1 + 0.0 − 1.2 − 1.2 − 0.0 − 0.3 + 0.0 − 0.0 − 2017 Aug − 0.1 − 0.6 + 0.2 − 0.0 + 0.2 − 0.7 − 0.7 − 0.0 − 0.3 − 0.0 − 0.0 − Sep
− 0.0 − 0.2 − 0.1 − 0.1 + 0.0 − 0.2 − 0.2 − 0.0 − 0.4 + 0.0 − 0.0 − Oct − 0.6 − 0.6 − 0.2 − 0.1 − 0.1 − 0.4 − 0.2 − 0.2 − 0.5 + 0.1 − 0.0 − Nov − 0.0 − 0.5 + 2.6 + 0.5 + 2.1 + 1.9 + 1.8 + 0.1 − 0.4 + 0.3 − 0.0 − Dec
− 0.2 − 0.7 + 0.3 + 0.0 + 0.3 − 0.7 − 0.6 − 0.0 − 0.6 + 0.1 − 0.0 − 2018 Jan
securities. 2 Including deposits under savings and loan contracts (see Table 2). 4 Including liabilities arising from non-negotiable bearer debtIV.12). 3 Excluding deposits under savings and loan contracts (see also foot-note securities. 5 Included in time deposits.
Local government and local government associations(including municipal special-purpose associations) Social security funds
Time deposits 3 Time depositsSavings Savings
for up deposits Memo for up deposits Memoto and for more and bank item to and for more and bank item
Sight including than savings Fiduciary Sight including than savings FiduciaryTotal deposits 1 year 1 year bonds 2,4 loans Total deposits 1 year 1 year bonds 2 loans Period
End of year or month*
52.4 29.2 9.6 8.3 5.2 0.4 91.2 12.1 60.5 17.5 1.1 − 201556.0 31.5 8.7 10.1 5.7 0.4 93.6 9.4 57.6 25.1 1.5 − 201661.6 33.2 8.8 14.1 5.5 0.0 93.8 9.5 45.6 37.6 1.1 − 2017
57.7 31.2 8.8 11.9 5.8 0.0 98.2 15.1 50.0 31.9 1.2 − 2017 Aug 55.5 28.0 9.0 12.7 5.8 0.0 97.1 15.0 48.0 33.0 1.2 − Sep
54.1 27.0 8.7 12.8 5.7 0.0 98.8 17.2 46.4 34.1 1.1 − Oct 57.0 30.0 9.1 12.5 5.4 0.0 101.0 14.9 47.9 37.0 1.0 − Nov 61.6 33.2 8.8 14.1 5.5 0.0 93.8 9.5 45.6 37.6 1.1 − Dec
54.0 26.2 8.3 14.0 5.5 0.0 99.2 14.0 46.1 38.0 1.1 − 2018 Jan
Changes*
+ 3.7 + 2.4 − 0.8 + 1.6 + 0.5 − 0.0 + 2.4 − 2.6 − 2.8 + 7.7 + 0.2 − 2016+ 4.5 + 2.1 + 0.1 + 2.3 − 0.0 − 0.0 − 0.3 + 0.2 − 11.8 +11.6 − 0.4 − 2017
+ 6.3 + 5.2 + 0.7 + 0.3 + 0.0 − + 0.3 + 0.5 − 1.1 + 1.0 − 0.2 − 2017 Aug − 2.5 − 3.2 + 0.2 + 0.4 + 0.0 − − 1.2 − 0.1 − 2.2 + 1.0 + 0.0 − Sep
− 1.4 − 1.1 − 0.3 + 0.0 − 0.1 − + 1.1 + 2.2 − 1.6 + 0.5 − 0.0 − Oct + 3.5 + 3.4 + 0.4 − 0.2 − 0.1 − + 2.1 − 2.2 + 1.5 + 2.9 − 0.1 − Nov + 3.2 + 3.3 − 0.3 + 0.1 + 0.1 + 0.0 − 7.1 − 5.4 − 2.3 + 0.6 + 0.0 − Dec
− 7.6 − 7.0 − 0.5 − 0.1 − 0.0 − 0.0 + 5.3 + 4.5 + 0.5 + 0.4 − 0.0 − 2018 Jan
the following Monthly Report, are not specially marked. 1 Federal Railways Fund, non-negotiable bearer debt securities. 3 Including deposits under savings and loanIndemnification Fund, Redemption Fund for Inherited Liabilities, ERP Special Fund, contracts. 4 Excluding deposits under savings and loan contracts (see also footnote 3). German Unity Fund, Equalisation of Burdens Fund. 2 Including liabilities arising from

Deutsche Bundesbank
38
Monthly Report
March 2018
IV Banks
10 Savings deposits and bank savings bonds of banks (MFIs) in Germany sold to non-banks (non-MFIs)*
€ billion
Savings deposits 1 Bank savings bonds 3 , sold to
of residents of non-residents domestic non-banks
at three months’ at more than three Memonotice months’ notice item of which
Interest Withof which of which of which credited maturitiesSpecial Special At three on of moresavings savings savings non-banks, than foreignmonths’
Period Total Total Total Total Total notice deposits total Total 2 yearsfacilities 2 facilities 2 non-banks
End of year or month*
2015 605.4 596.5 534.6 379.7 61.9 48.0 8.9 7.4 4.4 64.9 56.1 41.0 8.72016 596.5 588.5 537.1 361.6 51.5 37.7 8.0 6.9 3.3 59.1 50.4 35.8 8.72017 590.3 582.9 541.0 348.3 41.9 30.3 7.4 6.5 2.7 52.0 43.7 31.4 8.2
2017 Sep 589.4 581.8 538.0 350.7 43.9 32.6 7.6 6.6 0.1 53.5 45.3 32.5 8.2
Oct 589.0 581.5 538.5 349.7 43.0 31.9 7.5 6.6 0.1 53.1 44.8 32.2 8.3 Nov 588.5 581.0 538.6 349.8 42.4 31.2 7.5 6.5 0.2 52.6 44.3 31.9 8.3 Dec 590.3 582.9 541.0 348.3 41.9 30.3 7.4 6.5 1.2 52.0 43.7 31.4 8.2
2018 Jan 589.7 582.3 539.7 346.2 42.7 31.2 7.4 6.5 0.2 49.4 42.9 30.9 6.5
Changes*
2016 − 8.8 − 7.9 + 2.5 − 18.4 − 10.4 − 10.3 − 0.9 − 0.5 . − 5.0 − 5.0 − 4.7 − 0.02017 − 6.2 − 5.6 + 1.5 − 13.1 − 7.1 − 7.4 − 0.6 − 0.4 . − 7.2 − 6.7 − 4.4 − 0.5
2017 Sep − 0.6 − 0.6 + 0.0 − 2.0 − 0.6 − 0.6 − 0.1 − 0.0 . − 0.1 − 0.1 − 0.0 + 0.0
Oct − 0.4 − 0.3 + 0.5 − 0.9 − 0.8 − 0.8 − 0.1 − 0.0 . − 0.4 − 0.5 − 0.3 + 0.1 Nov − 0.5 − 0.5 + 0.2 + 0.1 − 0.6 − 0.7 − 0.1 − 0.0 . − 0.5 − 0.5 − 0.3 − 0.0 Dec + 1.8 + 1.9 + 2.4 − 1.5 − 0.5 − 0.9 − 0.0 − 0.0 . − 0.6 − 0.6 − 0.5 − 0.1
2018 Jan − 0.6 − 0.6 + 0.1 − 2.1 − 0.7 + 0.9 − 0.0 − 0.0 . − 0.9 − 0.8 − 0.5 − 0.1
* See Table IV.2, footnote*; statistical breaks have been eliminated from the changes. as time deposits. 2 Savings deposits bearing interest at a rate which exceeds theThe figures for the latest date are always to be regarded as provisional. Subsequent minimum or basic rate of interest. 3 Including liabilities arising from non-negotiablerevisions, which appear in the following Monthly Report, are not specially bearer debt securities. marked. 1 Excluding deposits under savings and loan contracts, which are classified
11 Debt securities and money market paper outstanding of banks (MFIs) in Germany*
€ billion
Negotiable bearer debt securities and money market paper Non-negotiablebearer debt
of which securities andmoney market
with maturities of paper 6 Subordinated
up to more than 1 year up toand including 1 year of whichand including 2 years
withCertifi- of which of which non-maturities
Floating Zero Foreign cates without without more of more negotiable negotiablerate coupon currency of a nominal a nominal than than debt debt
Total bonds 1 deposit Total Total 2 years Total 2 years securities securitiesbonds 1,2 bonds 3,4 guarantee 5 guarantee 5 Period
End of year or month*
2015 1,075.7 189.2 30.2 384.1 88.7 109.8 2.1 28.4 5.7 937.5 0.3 0.2 31.9 0.52016 1,098.1 177.0 28.1 407.1 90.9 111.3 4.1 37.4 5.8 949.4 0.6 0.2 33.8 0.52017 1,066.5 147.2 26.0 370.4 89.8 107.4 4.1 32.9 6.4 926.2 0.4 0.2 30.5 0.5
2017 Sep 1,084.0 161.5 28.2 378.8 84.4 106.0 5.0 37.0 6.5 941.0 0.3 0.2 32.1 0.5
Oct 1,079.1 149.6 28.0 383.2 86.6 106.4 5.1 35.5 6.5 937.1 0.3 0.2 31.1 0.5 Nov 1,072.3 148.0 25.9 377.3 84.9 103.4 5.0 35.1 6.7 933.8 0.3 0.2 30.7 0.5 Dec 1,066.5 147.2 26.0 370.4 89.8 107.4 4.1 32.9 6.4 926.2 0.4 0.2 30.5 0.5
2018 Jan 1,060.2 143.6 24.4 355.1 76.5 92.3 4.2 31.2 6.8 936.7 0.4 0.2 30.5 0.5
Changes*
2016 + 22.1 − 12.0 − 2.1 + 23.0 + 2.2 + 1.6 + 2.0 + 8.8 + 0.1 + 11.7 + 0.3 − 0.1 + 1.9 − 0.02017 − 30.8 − 29.7 − 2.1 − 36.7 − 0.5 − 3.9 − 0.0 − 4.6 + 0.6 − 22.3 − 0.2 + 0.0 − 3.2 − 0.0
2017 Sep − 3.6 − 5.0 + 0.4 + 3.3 + 5.5 + 5.5 − 0.1 − 0.9 + 0.0 − 8.2 − 0.1 + 0.0 − 0.1 −
Oct − 4.9 − 11.9 − 0.1 + 4.4 + 2.1 + 0.5 + 0.1 − 1.5 + 0.0 − 3.9 − 0.0 + 0.0 − 1.0 − Nov − 6.7 − 1.6 − 2.1 − 5.9 − 1.2 − 3.1 − 0.1 − 0.3 + 0.2 − 3.3 − 0.0 − 0.0 − 0.3 − Dec − 5.8 − 0.8 + 0.1 − 6.9 + 5.0 + 4.0 − 0.9 − 2.3 − 0.2 − 7.6 + 0.1 − 0.0 − 0.2 − 0.0
2018 Jan − 6.3 − 3.6 − 1.7 − 15.2 − 13.3 − 15.1 + 0.2 − 1.7 + 0.4 + 10.4 + 0.0 + 0.0 + 0.0 − 0.0
* See Table IV.2, footnote*; statistical breaks have been eliminated from the coupon bonds denominated in foreign currencies. 4 Bonds denominated inchanges. The figures for the latest date are always to be regarded as provisional. non-euro-area currencies. 5 Negotiable bearer debt securities respectively moneySubsequent revisions, which appear in the following Monthly Report, are not market paper with a nominal guarantee of less than 100%. 6 Non-negotiablespecially marked. 1 Including debt securities denominated in foreign bearer debt securities are classified among bank savings bonds (see also Table IV.10,currencies. 2 Issue value when floated. 3 Including floating rate notes and zero footnote 2).
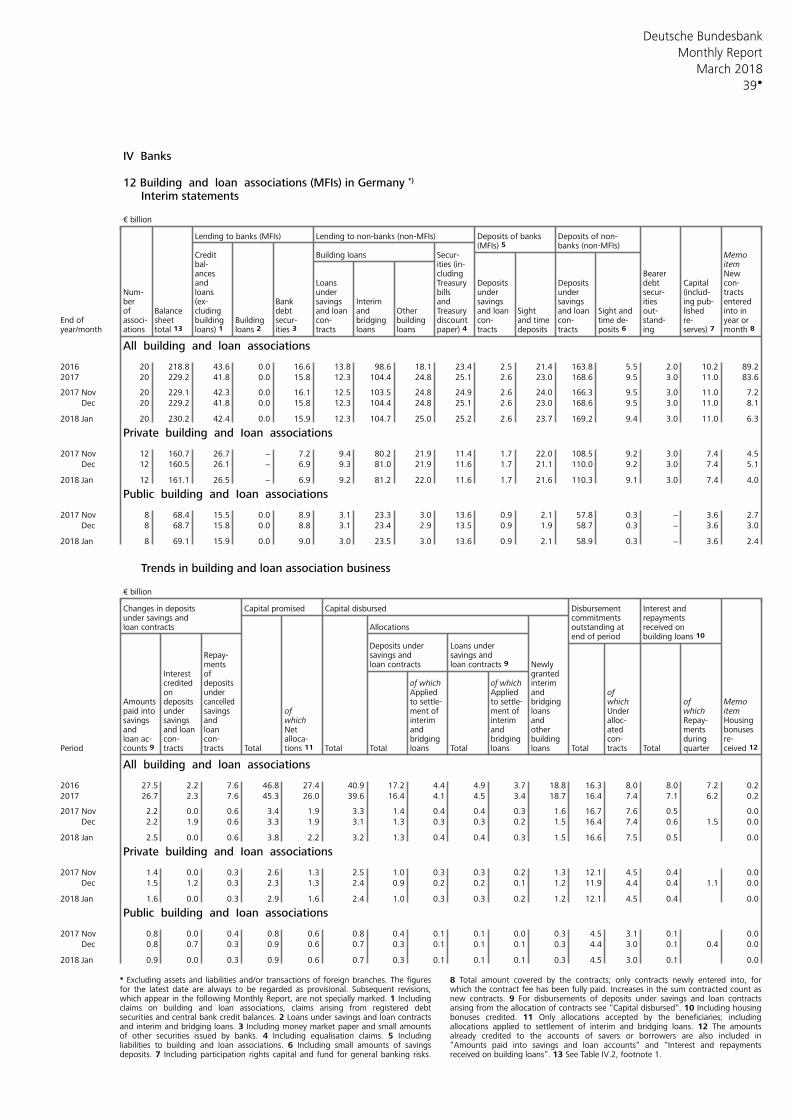
Deutsche Bundesbank
39
Monthly Report
March 2018
IV Banks 12 Building and loan associations (MFIs) in Germany *)
Interim statements € billion
Lending to banks (MFIs) Lending to non-banks (non-MFIs) Deposits of banks Deposits of non-(MFIs) 5 banks (non-MFIs)
Credit Building loans Secur- Memobal- itemities (in-ances cluding Bearer Newand Loans Treasury Deposits Deposits debt Capital con-
Num- loans under bills under under secur- (includ- tractsber (ex- Bank savings Interim and savings savings ities ing pub- enteredof Balance cluding debt and loan and Other Treasury and loan Sight and loan Sight and out- lished into in
End of sheet building Building secur- con- bridging building discount con- and time con- time de- stand- re- year orassoci-year/month ations loans 2 ities 3 tracts loans loans tracts deposits tracts posits 6 ing month 8 total 13 loans) 1 paper) 4 serves) 7
All building and loan associations
2016 20 218.8 43.6 0.0 16.6 13.8 98.6 18.1 23.4 2.5 21.4 163.8 5.5 2.0 10.2 89.2
2017 20 229.2 41.8 0.0 15.8 12.3 104.4 24.8 25.1 2.6 23.0 168.6 9.5 3.0 11.0 83.6
2017 Nov 20 229.1 42.3 0.0 16.1 12.5 103.5 24.8 24.9 2.6 24.0 166.3 9.5 3.0 11.0 7.2
Dec 20 229.2 41.8 0.0 15.8 12.3 104.4 24.8 25.1 2.6 23.0 168.6 9.5 3.0 11.0 8.1
2018 Jan 20 230.2 42.4 0.0 15.9 12.3 104.7 25.0 25.2 2.6 23.7 169.2 9.4 3.0 11.0 6.3
Private building and Ioan associations
2017 Nov 12 160.7 26.7 − 7.2 9.4 80.2 21.9 11.4 1.7 22.0 108.5 9.2 3.0 7.4 4.5
Dec 12 160.5 26.1 − 6.9 9.3 81.0 21.9 11.6 1.7 21.1 110.0 9.2 3.0 7.4 5.1
2018 Jan 12 161.1 26.5 − 6.9 9.2 81.2 22.0 11.6 1.7 21.6 110.3 9.1 3.0 7.4 4.0
Public building and Ioan associations
2017 Nov 8 68.4 15.5 0.0 8.9 3.1 23.3 3.0 13.6 0.9 2.1 57.8 0.3 − 3.6 2.7
Dec 8 68.7 15.8 0.0 8.8 3.1 23.4 2.9 13.5 0.9 1.9 58.7 0.3 − 3.6 3.0
2018 Jan 8 69.1 15.9 0.0 9.0 3.0 23.5 3.0 13.6 0.9 2.1 58.9 0.3 − 3.6 2.4
Trends in building and loan association business
€ billion
Changes in deposits Capital promised Capital disbursed Disbursement Interest andunder savings and commitments repaymentsloan contracts Allocations outstanding at received on
end of period building loans 10 Deposits under Loans under
Repay- savings and savings andments loan contracts loan contracts 9 Newly
Interest of grantedcredited interimdeposits of which of whichon under Applied Applied and of
which of MemoAmounts deposits cancelled to settle- to settle- bridgingunder savings of ment of ment of loans Under which itempaid into
savings savings and which interim interim and alloc- Repay- Housingand and loan loan Net and and other ated ments bonusesloan ac- con- con- alloca- bridging bridging building con- during re-
Period tracts tracts Total Total Total loans Total loans loans Total tracts Total quartercounts 9 tions 11 ceived 12
All building and loan associations
2016 27.5 2.2 7.6 46.8 27.4 40.9 17.2 4.4 4.9 3.7 18.8 16.3 8.0 8.0 7.2 0.2
2017 26.7 2.3 7.6 45.3 26.0 39.6 16.4 4.1 4.5 3.4 18.7 16.4 7.4 7.1 6.2 0.2
2017 Nov 2.2 0.0 0.6 3.4 1.9 3.3 1.4 0.4 0.4 0.3 1.6 16.7 7.6 0.5 0.0
Dec 2.2 1.9 0.6 3.3 1.9 3.1 1.3 0.3 0.3 0.2 1.5 16.4 7.4 0.6 1.5 0.0
2018 Jan 2.5 0.0 0.6 3.8 2.2 3.2 1.3 0.4 0.4 0.3 1.5 16.6 7.5 0.5 0.0
Private building and Ioan associations
2017 Nov 1.4 0.0 0.3 2.6 1.3 2.5 1.0 0.3 0.3 0.2 1.3 12.1 4.5 0.4 0.0
Dec 1.5 1.2 0.3 2.3 1.3 2.4 0.9 0.2 0.2 0.1 1.2 11.9 4.4 0.4 1.1 0.0
2018 Jan 1.6 0.0 0.3 2.9 1.6 2.4 1.0 0.3 0.3 0.2 1.2 12.1 4.5 0.4 0.0
Public building and Ioan associations
2017 Nov 0.8 0.0 0.4 0.8 0.6 0.8 0.4 0.1 0.1 0.0 0.3 4.5 3.1 0.1 0.0
Dec 0.8 0.7 0.3 0.9 0.6 0.7 0.3 0.1 0.1 0.1 0.3 4.4 3.0 0.1 0.4 0.0
2018 Jan 0.9 0.0 0.3 0.9 0.6 0.7 0.3 0.1 0.1 0.1 0.3 4.5 3.0 0.1 0.0
* Excluding assets and liabilities and/or transactions of foreign branches. The figures 8 Total amount covered by the contracts; only contracts newly entered into, forfor the latest date are always to be regarded as provisional. Subsequent revisions, which the contract fee has been fully paid. Increases in the sum contracted count aswhich appear in the following Monthly Report, are not specially marked. 1 Including new contracts. 9 For disbursements of deposits under savings and loan contractsclaims on building and loan associations, claims arising from registered debt arising from the allocation of contracts see “Capital disbursed“. 10 Including housingsecurities and central bank credit balances. 2 Loans under savings and loan contracts bonuses credited. 11 Only allocations accepted by the beneficiaries; includingand interim and bridging loans. 3 Including money market paper and small amounts allocations applied to settlement of interim and bridging loans. 12 The amountsof other securities issued by banks. 4 Including equalisation claims. 5 Including already credited to the accounts of savers or borrowers are also included inliabilities to building and loan associations. 6 Including small amounts of savings “Amounts paid into savings and loan accounts“ and “Interest and repaymentsdeposits. 7 Including participation rights capital and fund for general banking risks. received on building loans“. 13 See Table IV.2, footnote 1.

Deutsche Bundesbank
40
Monthly Report
March 2018
IV Banks
13 Assets and liabilities of the foreign branches and foreign subsidiaries of German banks (MFIs) *
€ billion
Number of Lending to banks (MFIs) Lending to non-banks (non-MFIs) Other assets 7
LoansCredit balances and loansGerman banks(MFIs) with of whichforeign foreign Derivativebranches Money Money financialbranches 1 and/or and/or market to to market instrumentsforeign foreign Balance paper, German foreign paper, in thesubsi- subsi- sheet German Foreign secur- non- non- secur- trading
Period diaries diaries total 7 Total Total banks banks Total Total banks banks ities 2 Total portfolioities 2,3
Foreign branches End of year or month *
2015 51 198 1,842.9 526.0 508.7 161.3 347.5 17.3 635.1 511.6 14.0 497.6 123.6 681.8 499.02016 51 191 1,873.3 584.2 570.5 205.0 365.5 13.8 580.5 489.8 14.5 475.3 90.8 708.5 485.32017 52 187 1,647.8 493.9 484.1 197.1 287.0 9.8 528.8 443.2 13.1 430.1 85.6 625.1 402.9
2017 Mar 51 193 1,918.1 616.1 602.7 228.2 374.5 13.4 609.0 513.0 14.1 499.0 95.9 693.0 452.2
Apr 51 192 1,931.5 631.8 618.6 224.4 394.2 13.3 597.8 503.9 13.7 490.3 93.9 701.8 460.3 May 51 192 1,894.2 629.7 616.8 215.1 401.8 12.8 565.5 478.3 13.2 465.1 87.2 699.0 459.0 June 51 192 1,828.5 589.4 576.9 212.5 364.4 12.5 565.1 475.9 13.3 462.5 89.2 674.1 434.1
July 51 192 1,787.7 564.8 552.6 199.5 353.1 12.1 546.9 463.7 13.3 450.4 83.1 676.1 438.4 Aug 51 191 1,752.1 537.7 526.1 171.1 355.0 11.6 545.3 461.7 13.2 448.5 83.7 669.1 432.2 Sep 51 190 1,746.8 549.5 537.6 176.8 360.8 11.9 568.1 481.8 13.5 468.3 86.3 629.2 408.3
Oct 51 187 1,788.9 579.0 567.0 185.8 381.1 12.1 558.7 477.1 13.5 463.6 81.5 651.2 418.3 Nov 51 187 1,712.1 516.9 505.0 187.2 317.9 11.9 562.5 481.7 13.6 468.1 80.9 632.7 416.0 Dec 52 187 1,647.8 493.9 484.1 197.1 287.0 9.8 528.8 443.2 13.1 430.1 85.6 625.1 402.9
Changes *
2016 + 0 − 7 + 29.1 + 49.3 + 52.9 + 43.7 + 9.2 − 3.5 − 56.4 − 24.6 + 0.5 − 25.1 − 31.8 + 24.9 − 14.82017 + 1 − 4 − 216.7 − 52.5 − 49.4 − 7.9 − 41.5 − 3.1 − 10.9 − 10.0 − 1.4 − 8.6 − 0.9 − 74.6 − 60.4
2017 Apr − − 1 + 14.9 + 22.0 + 22.0 − 3.8 + 25.8 + 0.1 − 4.5 − 3.1 − 0.4 − 2.6 − 1.4 + 10.3 + 11.7 May − − − 35.2 + 6.6 + 6.8 − 9.3 + 16.1 − 0.2 − 22.3 − 16.9 − 0.5 − 16.4 − 5.4 − 0.8 + 4.0 June − − − 64.4 − 34.7 − 34.4 − 2.5 − 31.9 − 0.2 + 5.1 + 2.5 + 0.1 + 2.3 + 2.6 − 23.6 − 21.9
July − − − 39.1 − 16.8 − 16.7 − 13.0 − 3.7 − 0.1 − 9.6 − 4.5 − 0.0 − 4.5 − 5.1 + 3.7 + 8.9 Aug − − 1 − 34.9 − 24.2 − 23.7 − 28.4 + 4.7 − 0.5 + 2.3 + 1.1 − 0.2 + 1.3 + 1.2 − 6.3 − 4.3 Sep − − 1 − 5.5 + 10.6 + 10.3 + 5.6 + 4.6 + 0.3 + 20.5 + 18.6 + 0.3 + 18.3 + 1.9 − 40.0 − 25.1
Oct − − 3 + 41.1 + 25.6 + 25.5 + 9.1 + 16.5 + 0.1 − 13.6 − 8.4 + 0.0 − 8.4 − 5.2 + 21.0 + 7.9 Nov − − − 75.5 − 56.8 − 56.7 + 1.3 − 58.0 − 0.1 + 9.1 + 9.3 + 0.1 + 9.2 − 0.2 − 17.3 + 0.3 Dec + 1 − − 63.5 − 20.0 − 18.0 + 9.9 − 27.9 − 2.0 − 29.8 − 35.0 − 0.5 − 34.5 + 5.2 − 6.7 − 11.1
Foreign subsidiaries End of year or month *
2015 24 58 376.0 126.5 113.5 50.1 63.4 13.0 184.3 152.5 22.2 130.3 31.8 65.1 −2016 20 53 320.5 82.1 72.2 21.4 50.8 9.9 161.4 130.3 22.6 107.7 31.2 76.9 −2017 20 50 276.6 70.4 63.9 25.0 39.0 6.5 149.5 122.2 22.2 99.9 27.4 56.7 −
2017 Mar 20 53 309.8 79.8 70.7 31.1 39.7 9.1 162.7 131.5 23.0 108.5 31.2 67.2 −
Apr 20 53 303.2 73.1 64.1 24.8 39.3 9.0 160.8 130.9 22.8 108.0 29.9 69.3 − May 20 53 295.9 72.1 64.6 26.7 38.0 7.5 157.0 128.3 23.0 105.3 28.7 66.8 − June 20 51 285.2 72.4 65.2 27.0 38.2 7.2 155.5 126.6 22.9 103.7 28.9 57.2 −
July 20 53 280.7 79.2 72.5 26.6 45.9 6.8 147.0 119.2 22.7 96.5 27.8 54.5 − Aug 20 52 279.0 74.8 67.8 28.8 39.0 6.9 153.1 125.7 23.0 102.7 27.5 51.1 − Sep 20 52 284.6 77.0 70.2 30.2 39.9 6.8 155.2 127.1 23.0 104.1 28.1 52.4 −
Oct 20 50 276.9 73.1 66.7 27.8 38.9 6.4 145.5 118.2 22.9 95.3 27.3 58.3 − Nov 20 50 277.3 74.1 67.5 27.8 39.7 6.6 145.5 117.9 22.6 95.3 27.6 57.7 − Dec 20 50 276.6 70.4 63.9 25.0 39.0 6.5 149.5 122.2 22.2 99.9 27.4 56.7 −
Changes *
2016 − 4 − 5 − 56.8 − 45.9 − 42.6 − 28.7 − 13.9 − 3.3 − 22.7 − 22.1 + 0.4 − 22.4 − 0.6 + 11.8 −2017 − − 3 − 33.3 − 4.9 − 2.4 + 3.5 − 6.0 − 2.5 − 8.2 − 4.4 − 0.4 − 4.0 − 3.8 − 20.2 −
2017 Apr − − − 4.9 − 5.7 − 5.7 − 6.3 + 0.5 + 0.1 − 1.3 − 0.0 − 0.2 + 0.1 − 1.3 + 2.1 − May − − − 4.9 + 0.5 + 1.7 + 1.9 − 0.1 − 1.3 − 2.9 − 1.7 + 0.2 − 1.9 − 1.2 − 2.5 − June − − 2 − 9.4 + 1.1 + 1.2 + 0.3 + 0.9 − 0.1 − 0.9 − 1.2 − 0.1 − 1.1 + 0.2 − 9.6 −
July − + 2 − 2.0 + 8.3 + 8.5 − 0.4 + 8.9 − 0.2 − 7.6 − 6.5 − 0.2 − 6.3 − 1.1 − 2.7 − Aug − − 1 − 0.9 − 4.0 − 4.2 + 2.3 − 6.4 + 0.2 + 6.4 + 6.7 + 0.2 + 6.5 − 0.3 − 3.4 − Sep − − + 5.2 + 2.0 + 2.2 + 1.4 + 0.8 − 0.2 + 1.9 + 1.3 + 0.1 + 1.2 + 0.6 + 1.4 −
Oct − − 2 − 8.4 − 4.3 − 3.8 − 2.4 − 1.4 − 0.5 − 10.0 − 9.2 − 0.1 − 9.1 − 0.8 + 5.9 − Nov − − + 1.5 + 1.9 + 1.6 + 0.0 + 1.5 + 0.3 + 0.3 + 0.1 − 0.3 + 0.4 + 0.3 − 0.7 − Dec − − + 0.1 − 3.1 − 3.1 − 2.8 − 0.3 − 0.0 + 4.3 + 4.5 − 0.4 + 4.8 − 0.2 − 1.0 −
* In this table “foreign“ also includes the country of domicile of the foreign branches the flow figures for the foreign subsidiaries.) The figures for the latest date areand foreign subsidiaries. Statistical revisions have been eliminated from the changes. always to be regarded as provisional; subsequent revisions, which appear in the(Breaks owing to changes in the reporting population have not been eliminated from following Monthly Report, are not specially marked. 1 Several branches in a given

Deutsche Bundesbank
41
Monthly Report
March 2018
IV Banks
Deposits Other liabilities 6,7
of banks (MFIs) of non-banks (non-MFIs)
German non-banks 4 Moneymarket of whichpaper Derivativeand debt financial
Medium Working instrumentssecuritiesand out- capital in the
German Foreign Short- long- Foreign stand- and own tradingTotal Total banks Total Total term term ing 5 funds Total portfolio Periodbanks non-banks
End of year or month * Foreign branches
1,060.9 715.3 359.3 356.0 345.6 21.1 16.2 4.9 324.6 128.9 49.9 603.1 497.4 20151,136.5 800.9 424.9 376.0 335.6 15.4 11.8 3.6 320.2 100.6 51.2 585.1 481.0 20161,000.3 682.5 372.8 309.7 317.8 16.0 14.1 1.9 301.8 97.0 51.9 498.6 399.2 2017
1,197.9 825.3 436.0 389.3 372.6 15.2 11.8 3.4 357.4 106.9 51.6 561.7 448.3 2017 Mar
1,210.4 846.5 422.0 424.5 363.9 15.3 12.0 3.3 348.7 104.7 51.3 565.0 455.4 Apr 1,178.6 830.8 406.4 424.4 347.8 15.5 12.3 3.2 332.2 100.5 50.7 564.3 458.6 May1,151.2 801.4 424.5 377.0 349.7 14.9 11.6 3.3 334.9 93.4 50.3 533.6 429.5 June
1,105.0 780.2 399.6 380.6 324.7 14.4 11.6 2.8 310.4 97.0 49.8 536.0 434.9 July1,075.3 739.6 372.0 367.5 335.7 13.8 11.1 2.8 321.8 98.3 49.7 528.9 431.3 Aug 1,094.2 760.6 385.6 375.0 333.6 14.3 11.4 2.9 319.3 95.6 49.2 507.7 401.6 Sep
1,127.3 768.4 379.7 388.7 358.9 14.1 11.4 2.7 344.8 98.4 49.8 513.3 412.8 Oct 1,051.4 695.8 352.4 343.4 355.6 16.0 13.1 2.8 339.6 95.1 49.4 516.2 412.2 Nov 1,000.3 682.5 372.8 309.7 317.8 16.0 14.1 1.9 301.8 97.0 51.9 498.6 399.2 Dec
Changes *
+ 66.8 + 76.8 + 65.6 + 11.2 − 10.1 − 5.7 − 4.4 − 1.2 − 4.4 − 29.6 + 1.2 − 18.1 − 17.3 2016− 97.3 − 80.7 − 52.1 − 28.6 − 16.7 + 0.6 + 2.3 − 1.7 − 17.3 + 5.2 + 0.8 − 86.5 − 58.1 2017
+ 19.0 + 27.4 − 14.1 + 41.5 − 8.5 + 0.1 + 0.2 − 0.1 − 8.6 − 0.7 − 0.3 + 3.4 + 11.1 2017 Apr − 22.7 − 6.8 − 15.5 + 8.7 − 15.9 + 0.3 + 0.3 − 0.1 − 16.2 − 2.1 − 0.6 − 0.8 + 8.7 May− 21.7 − 23.8 + 18.1 − 41.8 + 2.1 − 0.7 − 0.7 + 0.0 + 2.8 − 5.9 − 0.4 − 30.6 − 25.8 June
− 38.5 − 13.8 − 24.8 + 11.1 − 24.8 − 0.5 − 0.0 − 0.5 − 24.3 + 5.3 − 0.5 + 2.3 + 10.2 July− 26.8 − 37.9 − 27.6 − 10.2 + 11.0 − 0.5 − 0.5 − 0.0 + 11.6 + 2.0 − 0.1 − 7.1 − 1.7 Aug + 18.1 + 20.2 + 13.6 + 6.6 − 2.1 + 0.5 + 0.3 + 0.2 − 2.6 − 2.8 − 0.5 − 21.2 − 30.7 Sep
+ 29.1 + 3.9 − 6.0 + 9.8 + 25.2 − 0.2 − 0.0 − 0.2 + 25.4 + 1.9 + 0.5 + 5.6 + 9.0 Oct − 70.5 − 67.4 − 27.3 − 40.1 − 3.1 + 1.9 + 1.8 + 0.1 − 5.0 − 2.2 − 0.3 + 2.9 + 2.2 Nov − 47.9 − 10.3 + 20.4 − 30.6 − 37.7 + 0.1 + 1.0 − 0.9 − 37.7 + 2.8 + 2.5 − 17.6 − 10.8 Dec
End of year or month * Foreign subsidiaries
292.3 166.7 99.6 67.1 125.7 13.1 10.5 2.6 112.6 14.4 26.3 42.9 − 2015247.0 134.3 71.8 62.5 112.7 12.2 6.7 5.5 100.5 13.6 23.8 36.0 − 2016207.1 96.3 49.8 46.5 110.8 12.0 6.2 5.8 98.8 13.0 24.2 32.3 − 2017
237.1 126.8 68.1 58.6 110.3 13.8 8.4 5.4 96.5 13.8 23.7 35.2 − 2017 Mar
229.6 116.9 57.7 59.1 112.7 12.9 7.2 5.7 99.8 13.8 23.6 36.2 − Apr 224.9 114.1 55.8 58.3 110.8 13.4 7.7 5.7 97.4 13.7 23.5 33.7 − May216.3 105.1 53.8 51.3 111.2 13.4 7.6 5.8 97.8 13.1 23.0 32.8 − June
213.2 104.2 55.0 49.2 109.0 13.9 8.0 5.9 95.1 13.0 23.0 31.5 − July211.8 103.9 56.6 47.3 108.0 13.4 7.7 5.7 94.6 13.0 23.1 31.1 − Aug 217.0 105.9 58.1 47.9 111.1 12.6 7.1 5.6 98.5 12.9 23.2 31.5 − Sep
208.6 99.9 53.3 46.7 108.7 11.7 5.9 5.8 97.0 12.9 23.1 32.3 − Oct 207.8 98.1 53.3 44.8 109.7 11.9 6.1 5.8 97.8 12.9 23.1 33.6 − Nov 207.1 96.3 49.8 46.5 110.8 12.0 6.2 5.8 98.8 13.0 24.2 32.3 − Dec
Changes *
− 46.2 − 33.5 − 27.8 − 5.7 − 12.7 − 0.9 − 3.8 + 2.9 − 11.9 − 0.8 − 2.5 − 7.3 − 2016− 32.8 − 33.7 − 22.0 − 11.8 + 0.9 − 0.2 − 0.5 + 0.3 + 1.1 − 0.6 + 0.3 − 0.3 − 2017
− 6.3 − 9.1 − 10.4 + 1.3 + 2.8 − 0.9 − 1.2 + 0.3 + 3.7 + 0.0 − 0.1 + 1.5 − 2017 Apr − 3.0 − 1.8 − 2.0 + 0.2 − 1.2 + 0.5 + 0.5 + 0.0 − 1.6 − 0.1 − 0.1 − 1.8 − May− 7.7 − 8.4 − 2.0 − 6.4 + 0.7 − 0.0 − 0.1 + 0.1 + 0.7 − 0.6 − 0.5 − 0.6 − June
− 1.7 − 0.2 + 1.1 − 1.3 − 1.5 + 0.5 + 0.4 + 0.1 − 2.0 − 0.1 + 0.0 − 0.3 − July− 0.8 + 0.0 + 1.6 − 1.6 − 0.8 − 0.5 − 0.3 − 0.2 − 0.3 − 0.0 + 0.0 − 0.1 − Aug + 4.9 + 1.9 + 1.5 + 0.4 + 3.0 − 0.7 − 0.6 − 0.1 + 3.7 − 0.1 + 0.2 + 0.3 − Sep
− 9.0 − 6.4 − 4.8 − 1.6 − 2.7 − 1.0 − 1.2 + 0.2 − 1.7 − 0.0 − 0.1 + 0.7 − Oct − 0.0 − 1.4 + 0.0 − 1.4 + 1.4 + 0.3 + 0.3 − 0.0 + 1.1 + 0.0 − 0.1 + 1.6 − Nov − 0.1 − 1.4 − 3.5 + 2.0 + 1.3 + 0.0 + 0.1 − 0.0 + 1.3 + 0.1 + 1.1 − 1.1 − Dec
country of domicile are regarded as a single branch. 2 Treasury bills, Treasury securities. 5 Issues of negotiable and non-negotiable debt securities and moneydiscount paper and other money market paper, debt securities. 3 Including own debt market paper. 6 Including subordinated liabilities. 7 See also Table IV.2, footnote 1. securities. 4 Excluding subordinated liabilities and non-negotiable debt

Deutsche Bundesbank
42
Monthly Report
March 2018
V Minimum reserves
1 Reserve maintenance in the euro area
€ billion
Maintenance Required reserves Required reservesperiod before deduction of after deduction of
Reserve base 2 lump-sum allowance 3 lump-sum allowance 4 Current accounts 5 Excess reserves 6 Deficiencies 7 beginning in 1
2010 10,559.5 211.2 210.7 212.4 1.7 0.02011 10,376.3 207.5 207.0 212.3 5.3 0.02012 10,648.6 106.5 106.0 489.0 383.0 0.02013 10,385.9 103.9 103.4 248.1 144.8 0.02014 10,677.3 106.8 106.3 236.3 130.1 0.02015 11,375.0 113.8 113.3 557.1 443.8 0.02016 11,918.5 119.2 118.8 919.0 800.3 0.0
2017 Nov 12,326.7 123.3 122.9 1,309.7 1,186.8 0.0 Dec p 12,415.8 124.2 123.8 1,275.2 1,151.4 ...
2018 Jan p ... ... 123.9 ... ... ...
2 Reserve maintenance in Germany
€ million
Maintenance German share of Required reserves Required reservesperiod before deduction of after deduction ofeuro-area reserve base
Reserve base 2 in per cent Current accounts 5 Excess reserves 6 Deficiencies 7 beginning in 1 lump-sum allowance 3 lump-sum allowance 4
2010 2,530,997 24.0 50,620 50,435 51,336 901 02011 2,666,422 25.7 53,328 53,145 54,460 1,315 12012 2,874,716 27.0 28,747 28,567 158,174 129,607 12013 2,743,933 26.4 27,439 27,262 75,062 47,800 22014 2,876,931 26.9 28,769 28,595 75,339 46,744 42015 3,137,353 27.6 31,374 31,202 174,361 143,159 02016 3,371,095 28.3 33,711 33,546 301,989 268,443 0
2017 Nov 3,457,522 28.0 34,575 34,417 455,804 421,387 0 Dec 3,456,192 27.8 34,562 34,404 424,547 390,143 2
2018 Jan p 3,488,989 ... 34,890 34,732 ... ... ...
(a) Required reserves of individual categories of banks
€ million
Banks with special,Maintenance Regional banks development andperiod and other Branches of Landesbanken and other central
Big banks commercial banks foreign banks savings banks Credit cooperatives Mortgage banks support tasksbeginning in 1
2010 10,633 7,949 1,845 18,128 9,153 556 2,1702011 10,459 8,992 3,078 18,253 9,437 601 2,3242012 3 5,388 4,696 2,477 9,626 4,886 248 1,2472013 5,189 4,705 1,437 9,306 5,123 239 1,2632014 5,593 4,966 1,507 9,626 5,375 216 1,3122015 6,105 5,199 2,012 10,432 5,649 226 1,5782016 6,384 5,390 2,812 10,905 5,960 236 1,859
2017 Nov 6,227 5,666 3,352 11,088 6,210 138 1,737 Dec 6,366 5,678 3,110 11,163 6,256 132 1,699
2018 Jan 6,461 5,717 3,164 11,261 6,314 127 1,688
(b) Reserve base by subcategories of liabilities
€ million
Liabilities arising from bearer debtLiabilities (excluding repos and securities issued with agreed matu-deposits with building and loanLiabilities (excluding savings rities of up to 2 years and bearer
deposits, deposits with build- associations) with agreed maturities Liabilities (excluding repos and money market paper after deductioning and loan associations of up to 2 years to MFIs that are deposits with building and loan of a standard amount for bearer debt
Maintenance associations) with agreedand repos) to non-MFIs with resident in euro-area countries but Savings deposits with agreed certificates or deduction of suchperiod not subject to minimum reserve periods of notice of up paper held by the reportingagreed maturities of up to 2 maturities of up to 2 years to
years requirements to 2 years institutionbeginning in 1 banks in non-euro-area countries
2010 1,484,334 2,376 344,440 594,119 105,7282011 1,609,904 3,298 354,235 596,833 102,1532012 1,734,716 2,451 440,306 602,834 94,4532013 1,795,844 2,213 255,006 600,702 90,1592014 1,904,200 1,795 282,843 601,390 86,7402015 2,063,317 1,879 375,891 592,110 104,1462016 2,203,100 1,595 447,524 585,099 133,776
2017 Nov 2,324,352 1,102 428,683 581,651 121,741 Dec 2,338,161 628 415,084 581,416 120,894
2018 Jan 2,371,175 681 418,244 580,982 117,899
1 The reserve maintenance period starts on the settlement day of the main 2% between 1 January 1999 and 17 January 2012. Since 18 January 2012, it wasrefinancing operation immediately following the meeting of the Governing Council of stood at 1%. 4 Article 5 (2) of the Regulation of the European Central Bank on thethe ECB for which the discussion on the monetary policy stance is scheduled. application of minimum reserves. 5 Average credit balances of credit institutions at2 Article 3 of the Regulation of the European Central Bank on the application of national central banks. 6 Average credit balances less required reserves afterminimum reserves (excluding liabilities to which a reserve ratio of 0% applies, deduction of the lump-sum allowance. 7 Required reserves after deduction of thepursuant to Article 4 (1)). 3 Amount after applying the reserve ratio to the reserve lump-sum allowance. base. The reserve ratio for liabilities with agreed maturities of up to two years was

Deutsche Bundesbank
43
Monthly Report
March 2018
VI Interest rates
1 ECB interest rates 2 Base rates
% per annum % per annum
Main refinancing Main refinancingoperations operations Base Base
Mar- Mar- rate rateginal ginal as per as perMinimum Minimum
Applicable Deposit Fixed bid lending Applicable Deposit Fixed bid lending Applicable Civil Applicable Civilfrom facility rate rate facility from facility rate rate facility from Code 1 from Code 1
2005 Dec 6 1.25 − 2.25 3.25 2011 Apr 13 0.50 1.25 − 2.00 2002 Jan 1 2.57 2009 Jan 1 1.62 July 13 0.75 1.50 − 2.25 July 1 2.47 July 1 0.12
2006 Mar 8 1.50 − 2.50 3.50 Nov 9 0.50 1.25 − 2.00 June 15 1.75 − 2.75 3.75 Dez 14 0.25 1.00 − 1.75 2003 Jan 1 1.97 2011 July 1 0.37 Aug 9 2.00 − 3.00 4.00 July 1 1.22 Oct 11 2.25 − 3.25 4.25 2012 July 11 0.00 0.75 − 1.50 2012 Jan 1 0.12 Dec 13 2.50 − 3.50 4.50 2004 Jan 1 1.14
2013 May 8 0.00 0.50 − 1.00 July 1 1.13 2013 Jan 1 −0.132007 Mar 14 2.75 − 3.75 4.75 Nov 13 0.00 0.25 − 0.75 July 1 −0.38 June 13 3.00 − 4.00 5.00 2005 Jan 1 1.21
2014 June 11 −0.10 0.15 − 0.40 July 1 1.17 2014 Jan 1 −0.632008 July 9 3.25 − 4.25 5.25 Sep 10 −0.20 0.05 − 0.30 July 1 −0.73 Oct 8 2.75 − 3.75 4.75 2006 Jan 1 1.37 Oct 9 3.25 3.75 − 4.25 2015 Dec 9 −0.30 0.05 − 0.30 July 1 1.95 2015 Jan 1 −0.83 Nov 12 2.75 3.25 − 3.75 Dec 10 2.00 2.50 − 3.00 2016 Mar 16 −0.40 0.00 − 0.25 2007 Jan 1 2.70 2016 July 1 −0.88
July 1 3.192009 Jan 21 1.00 2.00 − 3.00 Mar 11 0.50 1.50 − 2.50 2008 Jan 1 3.32 Apr 8 0.25 1.25 − 2.25 July 1 3.19 May 13 0.25 1.00 − 1.75
1 Pursuant to section 247 of the Civil Code.
3 Eurosystem monetary policy operations allotted through tenders *
Fixed rate tenders Variable rate tenders
Bid Allotment Minimum Weightedamount amount Fixed rate bid rate Marginal rate 1 average rate
Date of Running forsettlement € million % per annum ... days
Main refinancing operations2018 Feb 7 1,553 1,553 0.00 − − − 7 Feb 14 1,332 1,332 0.00 − − − 7 Feb 21 1,542 1,542 0.00 − − − 7 Feb 28 1,719 1,719 0.00 − − − 7
Mar 7 1,146 1,146 0.00 − − − 7 Mar 14 1,021 1,021 0.00 − − − 7
Long-term refinancing operations2017 Dec 21 2,367 2,367 2 ... − − − 98
2018 Feb 1 2,518 2,518 2 ... − − − 94
Mar 14 2,810 2,810 2 ... − − − 91
* Source: ECB. 1 Lowest or highest interest rate at which funds were allotted or average minimum bid rate of the main refinancing operations over the life of thiscollected. 2 Interest payment on the maturity date; the rate will be fixed at the operation.
4 Money market rates, by month *
% per annum
EURIBOR 2 Monthlyaverage EONIA 1 One-week funds One-month funds Three-month funds Six-month funds Nine-month funds Twelve-month funds
2017 Aug − 0.36 − 0.38 − 0.37 − 0.33 − 0.27 − 0.21 − 0.16 Sep − 0.36 − 0.38 − 0.37 − 0.33 − 0.27 − 0.22 − 0.17
Oct − 0.36 − 0.38 − 0.37 − 0.33 − 0.27 − 0.22 − 0.18 Nov − 0.35 − 0.38 − 0.37 − 0.33 − 0.27 − 0.22 − 0.19 Dec − 0.34 − 0.38 − 0.37 − 0.33 − 0.27 − 0.22 − 0.19
2018 Jan − 0.36 − 0.38 − 0.37 − 0.33 − 0.27 − 0.22 − 0.19 Feb − 0.36 − 0.38 − 0.37 − 0.33 − 0.27 − 0.22 − 0.19
* Averages are Bundesbank calculations. Neither the Deutsche Bundesbank nor 4 January 1999 on the basis of real turnover according to the act/360 method andanyone else can be held liable for any irregularity or inaccuracy of the EONIA rate published via Reuters. 2 Euro Interbank Offered Rate: unweighted average rateand the EURIBOR rate. 1 Euro OverNight Index Average: weighted average overnight calculated by Reuters since 30 December 1998 according to the act/360 method. rate for interbank operations calculated by the European Central Bank since

Deutsche Bundesbank
44
Monthly Report
March 2018
VI Interest rates
5 Interest rates and volumes for outstanding amounts and new business of German banks (MFIs) *
(a) Outstanding amounts o
Households’ deposits Non-financial corporations’ deposits
with an agreed maturity of
up to 2 years over 2 years up to 2 years over 2 years
Effective Effective Effective EffectiveEnd of interest rate 1 Volume 2 interest rate 1 Volume 2 interest rate 1 Volume 2 interest rate 1 Volume 2 month % pa € million % pa € million % pa € million % pa € million
2017 Jan 0.37 73,435 1.46 219,585 0.10 82,672 1.53 19,293 Feb 0.35 73,708 1.45 219,045 0.10 83,514 1.52 19,144 Mar 0.34 73,460 1.44 218,575 0.09 84,520 1.49 19,649
Apr 0.33 72,221 1.42 218,122 0.09 82,082 1.44 20,074 May 0.33 71,503 1.41 217,847 0.08 82,646 1.41 20,471 June 0.33 69,952 1.40 217,154 0.08 80,018 1.35 20,770
July 0.32 69,365 1.39 216,115 0.08 78,396 1.31 21,529 Aug 0.31 69,014 1.37 215,909 0.09 78,517 1.30 22,146 Sep 0.31 67,904 1.36 215,817 0.08 77,405 1.25 22,356
Oct 0.30 67,393 1.35 215,503 0.08 76,092 1.18 23,093 Nov 0.30 66,679 1.34 215,034 0.08 77,669 1.12 24,421 Dec 0.29 66,585 1.34 216,841 0.06 78,428 1.07 25,136
2018 Jan 0.29 66,589 1.32 216,681 0.05 78,113 1.05 26,052
Housing loans to households 3 Loans for consumption and other purposes to households 4, 5
with a maturity of
over 1 year and over 1 year andup to 1 year 6 up to 5 years over 5 years up to 1 year 6 up to 5 years over 5 years
Effective Effective Effective Effective Effective EffectiveEnd of Volume 2 Volume 2 Volume 2 Volume 2 Volume 2 Volume 2 interest rate 1 interest rate 1 interest rate 1 interest rate 1 interest rate 1 interest rate 1 month % pa % pa % pa % pa % pa % pa€ million € million € million € million € million € million
2017 Jan 2.43 4,407 2.10 26,401 2.96 1,093,203 7.21 49,738 4.04 83,556 4.13 309,932 Feb 2.41 4,256 2.09 26,274 2.94 1,095,552 7.24 49,472 4.02 83,530 4.11 310,467 Mar 2.47 4,286 2.07 26,208 2.91 1,099,530 7.32 50,294 4.01 83,834 4.09 310,342
Apr 2.45 4,241 2.05 26,175 2.88 1,104,580 7.10 49,177 3.99 84,077 4.08 309,887 May 2.44 4,304 2.04 26,188 2.85 1,108,805 7.13 49,165 3.96 84,813 4.06 311,334 June 2.44 4,200 2.03 26,206 2.83 1,115,307 7.17 50,307 3.95 85,111 4.04 310,769
July 2.46 4,076 2.01 26,017 2.80 1,120,699 7.15 49,247 3.93 85,513 4.03 311,617 Aug 2.45 4,035 2.00 25,937 2.77 1,125,823 7.17 48,525 3.92 85,972 4.01 313,025 Sep 2.42 3,934 2.00 25,996 2.75 1,131,500 7.12 49,521 3.91 86,239 4.00 312,467
Oct 2.38 4,208 1.99 25,925 2.73 1,135,284 7.14 48,762 3.89 86,683 3.98 312,869 Nov 2.44 3,898 1.98 25,924 2.71 1,139,714 7.00 48,352 3.87 87,393 3.96 312,973 Dec 2.44 3,851 1.97 25,850 2.68 1,143,333 6.98 48,885 3.87 87,210 3.95 311,861
2018 Jan 2.33 3,905 1.96 25,562 2.66 1,143,949 7.07 48,462 3.85 87,637 3.93 312,421
Loans to non-financial corporations with a maturity of
up to 1 year 6 over 1 year and up to 5 years over 5 years
End of Volume 2 Volume 2 Volume 2 Effective interest rate 1 Effective interest rate 1 Effective interest rate 1 month % pa € million % pa € million % pa € million
2017 Jan 2.52 129,099 2.00 133,125 2.42 633,662 Feb 2.55 130,095 1.99 132,565 2.41 637,765 Mar 2.54 130,479 1.98 133,300 2.39 638,362
Apr 2.51 130,949 1.98 133,720 2.37 642,920 May 2.45 131,174 1.97 134,474 2.35 649,087 June 2.51 132,255 1.95 134,974 2.33 645,396
July 2.45 131,691 1.95 135,710 2.31 650,498 Aug 2.44 130,333 1.94 136,527 2.30 654,312 Sep 2.45 135,493 1.93 135,872 2.28 654,806
Oct 2.39 136,523 1.92 136,647 2.26 657,911 Nov 2.42 137,523 1.91 138,041 2.25 664,018 Dec 2.47 133,105 1.90 137,708 2.22 664,374
2018 Jan 2.34 141,376 1.88 138,332 2.20 668,313
* The interest rate statistics gathered on a harmonised basis in the euro area from calculated either as annualised agreed interest rates or as narrowly defined effectiveJanuary 2003 are collected in Germany on a sample basis. The MFI interest rate rates. Both calculation methods cover all interest payments on deposits and loans butstatistics are based on the interest rates applied by MFIs and the related volumes of not any other related charges which may occur for enquiries, administration,euro-denominated deposits and loans to households and nonfinancial corporations preparation of the documents, guarantees and credit insurance. 2 Data based ondomiciled in the euro area. The household sector comprises individuals (including sole monthly balance sheet statistics. 3 Secured and unsecured loans for home purchase,proprietors) and non-profit institutions serving households. Non-financial including building and home improvements; including loans granted by building andcorporations include all enterprises other than insurance companies, banks and other loan associations and interim credits as well as transmitted loans granted by thefinancial institutions. The most recent figures are in all cases to be regarded as provi- reporting agents in their own name and for their own account. 4 Loans forsional. Subsequent revisions appearing in the following Monthly Report are not consumption are defined as loans granted for the purpose of personal use in thespecially marked. Further information on the MFI interest rate statistics can be found consumption of goods and services. 5 For the purpose of these statistics, other loanson the Bundesbank’s website (Statistics / Money and capital markets / Interest rates are loans granted for other purposes such as business, debt consolidation, educationand yields / Interest rates on deposits and loans). o The statistics on outstanding etc. 6 Including overdrafts (see also footnotes 12 to 14 p 47 ). amounts are collected at the end of the month. 1 The effective interest rates are

Deutsche Bundesbank
45
Monthly Report
March 2018
VI Interest rates
5 Interest rates and volumes for outstanding amounts and new business of German banks (MFIs) * (cont’d)(b) New business +
Households’ deposits
with an agreed maturity of redeemable at notice of 8
Overnight up to 1 year over 2 years up to 3 months over 3 monthsover 1 year and up to 2 years
Effective Effective Effective Effective Effective Effectiveinterest interest interest interest interest interest
Reporting rate 1 Volume 2 rate 1 Volume 7 rate 1 Volume 7 rate 1 Volume 7 rate 1 Volume 2 rate 1 Volume 2 period % pa % pa % pa % pa % pa % pa€ million € million € million € million € million € million
2017 Jan 0.07 1,222,852 0.28 6,002 0.59 715 0.61 999 0.23 536,834 0.31 50,563 Feb 0.06 1,233,193 0.31 4,688 0.47 617 0.70 773 0.22 537,566 0.31 49,971 Mar 0.05 1,233,631 0.26 4,918 0.51 676 0.69 820 0.21 536,136 0.31 49,493
Apr 0.05 1,253,497 0.19 4,926 0.37 729 0.63 741 0.21 536,260 0.31 49,013 May 0.05 1,258,521 0.20 4,724 0.43 719 0.87 726 0.21 536,046 0.30 48,646 June 0.04 1,264,791 0.22 4,078 0.27 947 0.73 633 0.21 535,416 0.30 48,253
July 0.04 1,271,823 0.17 5,276 0.31 653 0.70 617 0.20 537,553 0.31 44,902 Aug 0.03 1,278,289 0.14 5,198 0.41 492 0.65 716 0.19 537,173 0.30 44,119 Sep 0.03 1,285,601 0.15 3,992 0.31 598 0.65 636 0.19 537,108 0.30 43,509
Oct 0.03 1,294,797 0.18 3,750 0.28 800 0.65 696 0.19 537,700 0.28 42,721 Nov 0.03 1,314,663 0.17 4,022 0.39 696 0.72 747 0.18 537,935 0.27 42,074 Dec 0.03 1,322,096 0.13 4,043 0.35 880 0.59 627 0.18 540,332 0.28 41,475
2018 Jan 0.03 1,319,369 0.19 4,348 0.31 866 0.71 780 0.17 539,037 0.28 42,193
Non-financial corporations’ deposits
with an agreed maturity of
Overnight up to 1 year over 1 year and up to 2 years over 2 years
Effective Effective Effective EffectiveReporting interest rate 1 Volume 2 interest rate 1 Volume 7 interest rate 1 Volume 7 interest rate 1 Volume 7 period % pa € million % pa € million % pa € million % pa € million
2017 Jan − 0.00 400,475 − 0.05 11,356 0.22 754 0.40 314 Feb − 0.00 397,363 − 0.07 10,802 0.13 631 0.54 336 Mar − 0.01 395,640 − 0.09 12,614 0.19 450 0.79 309
Apr − 0.01 397,203 − 0.07 9,275 0.08 899 0.33 1,039 May − 0.01 401,652 − 0.05 10,212 0.13 912 0.30 837 June − 0.02 415,078 − 0.14 14,661 0.07 525 0.24 586
July − 0.01 402,113 − 0.09 11,516 0.19 859 0.26 1,382 Aug − 0.02 409,698 − 0.04 9,710 0.21 185 0.52 666 Sep − 0.02 414,461 − 0.08 10,040 0.09 351 0.37 704
Oct − 0.02 425,806 − 0.10 9,134 0.04 412 0.26 1,456 Nov − 0.02 428,784 − 0.08 9,337 0.09 897 0.22 1,237 Dec − 0.02 425,477 − 0.07 13,102 0.09 351 0.28 1,477
2018 Jan − 0.02 429,587 − 0.07 11,368 0.01 520 0.30 1,271
Loans to households
Loans for consumption with an initial rate fixation of 4
Total of which floating rate or over 1 year andTotal renegotiated loans 9 up to 1 year 9 up to 5 years over 5 yearsincluding charges)
Effective Effective Effective Effective EffectiveAnnual percentageReporting Volume 7 Volume 7 Volume 7 Volume 7 Volume 7 rate of charge 10 interest rate 1 interest rate 1 interest rate 1 interest rate 1 interest rate 1 period % pa % pa € million % pa € million % pa % pa % pa€ million € million € million
2017 Jan 6.06 6.04 8,603 7.16 1,886 6.15 330 4.59 3,242 6.97 5,031 Feb 5.82 5.80 8,187 6.92 1,619 6.15 273 4.37 3,094 6.69 4,820 Mar 5.62 5.60 9,849 6.88 1,761 6.12 341 4.15 4,041 6.64 5,467
Apr 5.66 5.65 8,222 6.91 1,544 6.17 287 4.32 3,415 6.61 4,520 May 5.89 5.87 9,372 7.22 1,814 6.41 337 4.49 3,846 6.87 5,189 June 5.90 5.88 8,683 7.24 1,685 6.28 308 4.49 3,574 6.89 4,801
July 5.99 5.97 8,940 7.32 1,872 6.22 299 4.57 3,561 6.95 5,080 Aug 5.88 5.86 8,827 7.20 1,724 6.51 312 4.54 3,703 6.84 4,812 Sep 5.67 5.65 8,212 7.11 1,465 6.09 305 4.31 3,579 6.72 4,328
Oct 5.67 5.65 8,338 7.07 1,495 6.06 302 4.30 3,758 6.81 4,278 Nov 5.63 5.61 8,216 7.10 1,410 6.09 306 4.31 3,827 6.80 4,083 Dec 5.39 5.37 6,701 6.83 1,004 5.81 297 4.15 3,315 6.63 3,089
2018 Jan 5.85 5.83 9,289 7.26 1,729 6.04 328 4.32 3,861 6.96 5,100
For footnotes * and 1 to 6, see p 44 . + In the case of deposits with an agreed business at the end of the month has to be incorporated in the calculation of averagematurity and all loans excluding revolving loans and overdrafts, credit card debt, new rates of interest. 7 Estimated. The volume of new business is extrapolated to formbusiness covers all new agreements between households or non-financial corpor- the underlying total using a grossing-up procedure. 8 Including non-financial corpor-ations and the bank. The interest rates are calculated as volume-weighted average ations’ deposits; including fidelity and growth premia. 9 Excluding overdrafts. 10 An-rates of all new agreements concluded during the reporting month. In the case of nual percentage rate of charge, which contains other related charges which mayovernight deposits, deposits redeemable at notice, revolving loans and overdrafts, occur for enquiries, administration, preparation of the documents, guarantees andcredit card debt, new business is collected in the same way as outstanding amounts credit insurance. for the sake of simplicity. This means that all outstanding deposit and lending

Deutsche Bundesbank
46
Monthly Report
March 2018
VI Interest rates
5 Interest rates and volumes for outstanding amounts and new business of German banks (MFIs) * (cont’d)(b) New business +
Loans to households (cont’d)
Loans for other purposes to households with an initial rate fxation of 5
of which floating rate or over 1 year andTotal renegotiated loans 9 up to 1 year 9 up to 5 years over 5 years
Effective Effective Effective Effective EffectiveReporting Volume 7 Volume 7 Volume 7 Volume 7 Volume 7 interest rate 1 interest rate 1 interest rate 1 interest rate 1 interest rate 1 period % pa € million % pa € million % pa € million % pa € million % pa € million
Loans to households2017 Jan 1.94 6,698 1.84 2,651 1.78 3,024 2.52 915 1.92 2,759 Feb 1.94 5,484 1.86 1,916 1.69 2,540 2.56 803 1.99 2,141 Mar 2.01 7,097 1.88 2,130 1.80 3,237 2.72 1,032 1.99 2,828
Apr 2.00 6,030 1.86 2,229 1.75 2,826 2.67 853 2.05 2,351 May 2.02 5,890 1.81 1,930 1.83 2,535 2.61 941 1.99 2,414 June 2.06 5,933 1.89 1,852 1.95 2,722 2.73 859 1.93 2,352
July 1.96 6,388 1.75 2,282 1.76 2,873 2.48 964 1.99 2,551 Aug 1.99 5,667 1.74 1,625 1.81 2,171 2.66 814 1.92 2,682 Sep 1.99 5,275 1.80 1,455 1.79 2,341 2.60 804 1.99 2,130
Oct 2.08 5,682 1.91 1,915 1.91 2,646 2.64 854 2.07 2,182 Nov 1.98 5,587 1.84 1,569 1.76 2,471 2.63 873 1.96 2,243 Dec 2.00 6,193 1.80 1,624 1.80 2,705 2.76 958 1.92 2,530
2018 Jan 2.01 6,017 1.94 2,035 1.85 2,693 2.62 888 1.97 2,436
of which: loans to sole proprietors2017 Jan 1.99 4,694 . . 1.92 2,084 2.61 712 1.83 1,898 Feb 2.07 3,613 . . 1.95 1,579 2.75 568 1.93 1,466 Mar 2.11 4,783 . . 2.01 2,120 2.84 767 1.93 1,896
Apr 2.09 4,280 . . 1.95 1,931 2.77 670 1.97 1,679 May 2.12 4,033 . . 2.04 1,667 2.84 689 1.92 1,677 June 2.15 4,197 . . 2.13 1,964 2.84 681 1.88 1,552
July 2.06 4,142 . . 1.89 1,917 2.82 688 1.94 1,537 Aug 2.08 3,640 . . 1.95 1,445 2.79 629 1.92 1,566 Sep 2.04 3,411 . . 1.84 1,436 2.81 598 1.90 1,377
Oct 2.13 3,707 . . 1.98 1,694 2.82 628 2.00 1,385 Nov 2.07 3,725 . . 1.94 1,592 2.80 662 1.88 1,471 Dec 2.09 4,266 . . 2.00 1,822 2.83 753 1.85 1,691
2018 Jan 2.07 4,146 . . 1.99 1,817 2.72 679 1.89 1,650
Loans to households (cont’d)
Housing loans with an initial rate fixation of 3
of which floating rate or over 1 year and over 5 years andTotalTotal up to 1 year 9 up to 5 years up to 10 years over 10 years(including charges) renegotiated loans 9
Effective Effective Effective Effective Effective EffectiveAnnual percentageReporting Volume 7 Volume 7 rate of charge 10 interest rate 1 interest rate 1 interest rate 1 Volume 7 interest rate 1 Volume 7 interest rate 1 Volume 7 interest rate 1 Volume 7 period % pa % pa % pa % pa % pa % pa % pa€ million € million € million € million € million € million
Total loans2017 Jan 1.82 1.77 19,804 1.84 5,711 2.08 2,283 1.66 1,780 1.59 7,454 1.86 8,287 Feb 1.87 1.81 17,838 1.89 4,291 2.17 1,784 1.65 1,567 1.64 6,556 1.90 7,931 Mar 1.87 1.82 22,196 1.86 4,945 2.08 2,428 1.69 1,932 1.67 7,609 1.89 10,227
Apr 1.91 1.85 18,087 1.89 4,620 2.10 2,001 1.73 1,672 1.71 6,456 1.92 7,958 May 1.88 1.83 20,484 1.92 4,136 2.17 2,288 1.77 1,731 1.66 7,308 1.88 9,157 June 1.87 1.82 19,294 1.92 3,767 2.02 2,265 1.70 1,541 1.68 6,573 1.89 8,915
July 1.88 1.82 20,405 1.88 4,612 2.04 2,389 1.68 1,726 1.66 7,420 1.92 8,870 Aug 1.94 1.87 20,228 2.00 3,743 2.05 2,340 1.89 1,888 1.67 7,199 1.98 8,801 Sep 1.92 1.86 17,363 1.91 3,289 2.04 2,025 1.71 1,571 1.71 5,950 1.96 7,817
Oct 1.90 1.85 18,128 1.90 3,955 2.08 2,134 1.70 1,634 1.68 6,611 1.96 7,749 Nov 1.90 1.84 18,793 1.89 3,525 2.04 2,170 1.72 1,640 1.68 6,550 1.94 8,433 Dec 1.86 1.79 17,473 1.87 3,242 2.04 2,150 1.69 1,553 1.65 6,084 1.86 7,686
2018 Jan 1.88 1.82 19,642 1.90 4,529 2.03 2,354 1.69 1,797 1.65 6,864 1.92 8,627
of which: collateralised loans 11
2017 Jan . 1.67 8,932 . . 1.90 835 1.50 925 1.52 3,632 1.81 3,540 Feb . 1.71 7,964 . . 2.06 643 1.50 796 1.57 3,181 1.82 3,344 Mar . 1.72 9,905 . . 1.96 855 1.53 939 1.59 3,565 1.82 4,546
Apr . 1.75 8,413 . . 1.98 795 1.53 838 1.60 3,204 1.89 3,576 May . 1.73 9,110 . . 2.09 843 1.59 900 1.58 3,370 1.81 3,997 June . 1.72 8,374 . . 1.87 865 1.53 726 1.61 3,030 1.82 3,753
July . 1.72 9,062 . . 1.84 896 1.53 891 1.60 3,529 1.84 3,746 Aug . 1.79 8,461 . . 1.96 821 1.87 996 1.59 3,204 1.92 3,440 Sep . 1.78 7,701 . . 1.97 711 1.53 797 1.63 2,707 1.92 3,486
Oct . 1.77 8,217 . . 1.97 780 1.53 782 1.62 3,095 1.92 3,560 Nov . 1.76 8,464 . . 1.93 771 1.53 796 1.60 3,031 1.90 3,866 Dec . 1.69 7,644 . . 1.97 685 1.51 740 1.57 2,733 1.77 3,486
2018 Jan . 1.75 9,069 . . 2.00 837 1.57 946 1.59 3,283 1.88 4,003
For footnotes * and 1 to 6, see p 44 . For footnotes +, 7 to 10, see p 45 . For footnote 11, see p 47 .

Deutsche Bundesbank
47
Monthly Report
March 2018
VI Interest rates
5 Interest rates and volumes for outstanding amounts and new business of German banks (MFIs) * (cont’d)(b) New business +
Loans to households (cont’d) Loans to non-financial corporations
of which of whichRevolving loans 12 Revolving loans 12 and overdrafts 13 Revolving loans 12 Extended and overdrafts 13 Revolving loans 12 credit card debt 14 and overdrafts 13 credit card debt credit card debt 14 and overdrafts 13
Effective Effective Effective Effective EffectiveReporting Volume 2 Volume 2 Volume 2 Volume 2 Volume 2 interest rate 1 interest rate 1 interest rate 1 interest rate 1 interest rate 1 period % pa € million % pa € million % pa € million % pa € million % pa € million
2017 Jan 8.55 39,784 8.54 32,190 15.12 4,309 3.61 64,182 3.63 63,925 Feb 8.65 39,345 8.62 31,953 15.14 4,291 3.68 65,697 3.70 65,431 Mar 8.66 40,215 8.61 32,949 15.13 4,273 3.67 65,990 3.68 65,698
Apr 8.50 38,972 8.49 31,353 15.13 4,295 3.64 65,154 3.66 64,865 May 8.46 39,394 8.50 31,647 15.13 4,259 3.53 65,353 3.54 65,067 June 8.44 40,606 8.47 32,739 15.13 4,328 3.59 67,282 3.61 66,992
July 8.45 39,300 8.46 31,374 15.11 4,423 3.52 65,979 3.54 65,695 Aug 8.48 38,663 8.47 30,914 15.12 4,364 3.48 66,012 3.49 65,718 Sep 8.44 39,630 8.48 31,635 15.09 4,393 3.52 67,886 3.54 67,559
Oct 8.47 39,133 8.48 31,101 15.10 4,493 3.41 67,481 3.42 67,162 Nov 8.30 38,672 8.35 30,489 15.11 4,386 3.45 67,793 3.46 67,457 Dec 8.21 39,538 8.35 31,187 14.94 4,303 3.47 65,936 3.49 65,625
2018 Jan 8.33 39,136 8.38 31,128 14.92 4,369 3.36 68,734 3.37 68,419
Loans to non-financial corporations (cont’d)
of which Loans up to €1 million with an initial rate fixation of 15 Loans over €1 million with an initial rate fixation of 15
renegotiated floating rate or over 1 year and floating rate or over 1 year andTotal loans 9 up to 1 year 9 up to 5 years over 5 years up to 1 year 9 up to 5 years over 5 years
Effective Effective Effective Effective Effective Effective Effective Effectiveinterest interest interest interest interest interest interest interest
Reporting rate 1 rate 1 rate 1 rate 1 rate 1 rate 1 rate 1 rate 1 Volume 7 Volume 7 Volume 7 Volume 7 Volume 7 Volume 7 Volume 7 Volume 7 period % pa % pa % pa % pa % pa % pa % pa % pa€ million € million € million € million € million € million € million € million
Total loans
2017 Jan 1.33 64,819 1.54 18,857 2.42 8,119 2.60 1,328 1.86 1,423 1.01 43,339 1.40 2,830 1.57 7,780 Feb 1.33 56,958 1.55 13,746 2.55 7,309 2.58 1,326 1.83 1,209 0.99 37,140 1.29 2,001 1.54 7,973 Mar 1.50 71,530 1.60 22,647 2.51 9,245 2.59 1,733 1.85 1,665 1.20 45,163 1.41 2,977 1.67 10,747
Apr 1.43 57,323 1.46 19,903 2.44 7,699 2.54 1,493 1.81 1,371 1.14 38,649 1.41 2,188 1.67 5,923 May 1.35 65,177 1.53 18,706 2.54 8,000 2.58 1,661 1.82 1,423 0.99 41,638 1.55 3,072 1.58 9,383 June 1.41 71,950 1.50 21,083 2.51 8,904 2.57 1,681 1.84 1,442 1.13 46,903 1.08 3,655 1.61 9,365
July 1.39 67,430 1.48 20,770 2.42 8,497 2.57 1,583 1.87 1,403 1.08 43,495 1.28 3,021 1.61 9,431 Aug 1.38 59,046 1.52 13,769 2.39 7,401 2.58 1,441 1.82 1,335 1.08 37,547 1.38 2,627 1.57 8,695 Sep 1.38 66,182 1.52 19,843 2.50 8,124 2.60 1,446 1.86 1,236 1.08 43,731 1.24 2,419 1.63 9,226
Oct 1.35 66,679 1.47 19,173 2.48 8,209 2.59 1,490 1.81 1,214 1.05 45,005 1.25 2,354 1.59 8,407 Nov 1.40 63,110 1.49 16,676 2.50 8,257 2.57 1,582 1.87 1,423 1.09 41,581 1.32 2,565 1.58 7,702 Dec 1.43 78,501 1.52 21,693 2.45 8,207 2.55 1,862 1.82 1,628 1.15 49,208 1.51 5,166 1.63 12,430
2018 Jan 1.22 69,693 1.49 18,190 2.48 8,322 2.53 1,607 1.92 1,361 0.89 50,612 1.72 2,239 1.54 5,552
of which: collateralised loans 11
2017 Jan 1.57 8,742 . . 1.80 692 2.24 141 1.81 505 1.41 4,626 2.05 518 1.60 2,260 Feb 1.46 8,259 . . 2.07 464 2.44 158 1.78 399 1.33 4,051 1.73 512 1.40 2,675 Mar 1.48 11,857 . . 1.87 643 2.52 166 1.72 493 1.37 7,040 1.30 519 1.60 2,996
Apr 1.42 8,360 . . 1.81 570 2.23 164 1.69 413 1.29 5,640 1.59 299 1.62 1,274 May 1.61 8,671 . . 2.06 545 2.54 191 1.70 401 1.45 4,558 2.04 646 1.63 2,330 June 1.55 11,011 . . 1.85 632 2.60 150 1.75 444 1.44 6,484 1.64 625 1.66 2,676
July 1.52 9,023 . . 1.78 661 2.46 155 1.77 415 1.34 5,050 1.74 464 1.68 2,278 Aug 1.47 9,188 . . 1.99 480 2.39 153 1.69 431 1.30 4,961 1.94 560 1.50 2,603 Sep 1.52 9,811 . . 1.83 535 2.50 132 1.77 351 1.41 5,743 1.64 370 1.62 2,680
Oct 1.46 9,398 . . 1.90 557 2.61 131 1.77 349 1.25 5,480 2.19 304 1.64 2,577 Nov 1.60 8,531 . . 1.95 545 2.41 147 1.74 414 1.40 5,212 2.68 423 1.74 1,790 Dec 1.59 13,235 . . 1.92 627 2.65 167 1.75 426 1.44 7,644 2.33 1,098 1.56 3,273
2018 Jan 1.53 7,387 . . 1.92 627 2.36 148 1.90 426 1.32 4,529 1.93 357 1.73 1,300
For footnotes * and 1 to 6, see p 44 . For footnotes + and 7 to 10, see p 45 . 11 For (d) there is no obligation of regular repayment of funds. 13 Overdrafts are defined asthe purposes of the interest rate statistis, a loan is considered to be secured if debit balances on current accounts. They include all bank overdrafts regardless ofcollateral (among others financial collateral, real estate collateral, debt securities) in whether they are within or beyond the limits agreed between customers and theat leat the same value as the loan amount has been posted, pledged or bank. 14 Including convenience and extended credit card debt. Convenience credit isassigned. 12 Including revolving loans which have all the following features: (a) the defined as the credit granted at an interest rate of 0% in the period betweenborrower may use or withdraw the funds to a pre-approved credit limit without payment transactions effectuated with the card during one billing cycle and the dategiving prior notice to the lender; (b) the amount of available credit can increase and at which the debt balances from this specific billing cycle become due. 15 Thedecrease as funds are borrowed and repaid; (c) the loan may be used repeatedly; amount category refers to the single loan transaction considered as new business.

Deutsche Bundesbank
48
Monthly Report
March 2018
VII Insurance corporations and pension funds
1 Assets € billion
Currency Investment InsuranceEnd of and Debt Shares and funds Financial technical Non-financial Remainingyear/quarter Total deposits 2 securities Loans 3 other equity shares/units derivatives reserves assets assets
Insurance corporations
2012 1,694.4 405.1 240.1 251.7 211.4 425.1 6.1 59.0 43.3 52.72013 1,742.1 386.3 262.0 257.1 211.1 462.3 6.0 59.8 46.4 51.02014 1,892.0 371.6 321.0 271.4 215.9 542.3 6.4 63.9 49.3 50.22015 1,954.1 344.4 344.7 278.9 228.7 578.3 4.5 71.9 51.8 50.8
2016 Q1 2,007.8 343.6 374.1 280.2 230.0 596.3 5.2 73.7 53.1 51.7 Q2 2,034.6 336.1 395.8 281.9 229.6 607.7 4.8 73.5 53.2 52.0
2016 Q3 1 2,219.7 383.4 396.9 389.6 280.7 604.9 5.3 47.3 31.8 79.7 Q4 2,186.1 361.5 370.9 374.6 308.6 620.1 3.3 44.1 32.4 70.6
2017 Q1 2,189.3 347.1 391.8 364.9 298.6 631.6 2.8 50.4 32.5 69.7 Q2 2,177.9 335.5 392.3 362.3 302.3 641.2 3.1 49.1 32.6 59.6 Q3 2,190.5 322.2 398.9 367.8 308.2 649.9 3.1 49.5 32.7 58.3
Life insurance2012 927.6 261.4 120.0 148.0 31.7 299.2 3.0 18.0 26.1 20.12013 956.9 247.8 131.4 148.7 31.5 329.1 3.0 17.7 28.3 19.52014 1,044.1 237.2 161.2 153.4 32.3 390.3 3.2 17.8 29.7 19.12015 1,063.7 219.7 169.8 158.0 34.9 414.6 2.2 16.3 30.7 17.4
2016 Q1 1,095.7 219.1 187.0 159.2 35.3 428.0 2.5 15.6 31.9 17.2 Q2 1,116.7 214.5 201.7 160.7 35.6 438.0 2.4 14.9 32.0 16.9
2016 Q3 1 1,246.9 246.5 204.2 243.1 47.5 437.2 4.1 11.3 19.1 33.8 Q4 1,194.2 231.3 182.7 223.0 50.7 453.8 2.1 9.6 19.1 21.9
2017 Q1 1,170.4 217.6 196.1 215.1 38.6 458.6 1.8 8.2 19.1 15.3 Q2 1,172.7 209.4 199.6 215.3 39.3 464.7 2.0 8.0 19.1 15.3 Q3 1,178.6 201.0 203.3 218.0 40.5 471.0 1.9 7.9 19.1 16.0
Non-life insurance2012 427.3 130.4 59.9 48.9 40.3 97.7 1.5 24.8 12.3 11.42013 448.1 126.0 70.9 51.1 42.8 105.9 1.6 25.1 12.7 12.02014 486.4 122.8 89.4 53.9 44.3 122.5 1.8 26.5 13.7 11.52015 511.0 113.9 97.6 55.6 48.5 134.8 1.3 32.9 14.5 11.9
2016 Q1 527.6 113.2 108.2 55.5 49.6 140.6 1.5 32.8 14.5 11.8 Q2 532.8 109.4 113.6 55.8 49.3 144.5 1.4 32.8 14.4 11.7
2016 Q3 1 592.2 125.0 101.7 94.0 50.9 153.9 0.5 28.7 8.7 29.0 Q4 583.3 118.9 98.5 91.8 56.8 152.0 0.5 26.8 9.0 29.0
2017 Q1 606.5 118.0 105.8 91.4 56.9 156.8 0.3 34.0 9.1 34.2 Q2 603.4 114.5 107.1 90.6 58.5 159.9 0.4 33.2 9.1 30.1 Q3 603.8 109.5 109.3 92.3 59.6 162.7 0.4 32.5 9.2 28.4
Reinsurance 4
2012 339.5 13.2 60.2 54.7 139.4 28.2 1.6 16.2 4.8 21.22013 337.1 13.3 59.0 57.4 136.8 27.2 1.4 17.1 5.4 19.52014 361.4 12.4 69.7 64.1 139.2 29.5 1.4 19.6 5.9 19.62015 379.4 10.8 77.3 65.3 145.4 28.9 1.1 22.7 6.5 21.4
2016 Q1 376.0 11.2 78.5 64.0 145.1 27.3 1.1 20.4 6.4 21.9 Q2 373.7 11.9 79.8 62.8 144.8 25.8 1.0 18.8 6.4 22.4
2016 Q3 1 380.6 12.0 91.0 52.5 182.3 13.8 0.8 7.3 4.0 16.9 Q4 408.6 11.3 89.7 59.7 201.0 14.3 0.7 7.7 4.3 19.7
2017 Q1 412.5 11.5 89.9 58.4 203.0 16.2 0.8 8.1 4.3 20.2 Q2 401.9 11.6 85.6 56.4 204.4 16.6 0.8 7.9 4.4 14.2 Q3 408.1 11.7 86.3 57.4 208.1 16.2 0.9 9.2 4.4 13.9
Pension funds 5
2012 468.4 155.1 40.9 26.2 12.4 194.4 − 4.1 23.8 11.52013 494.6 154.3 42.5 27.6 13.0 216.2 − 4.4 25.1 11.72014 552.5 151.7 57.1 29.1 16.7 247.8 − 4.9 27.8 17.42015 579.5 145.5 60.2 28.8 19.1 268.5 − 5.4 31.5 20.4
2016 Q1 588.8 143.1 66.0 29.0 19.4 273.4 − 5.5 31.9 20.5 Q2 601.7 142.7 69.1 29.2 20.0 281.9 − 5.5 32.5 20.7 Q3 611.6 144.4 69.2 29.3 20.1 289.0 − 5.6 33.2 20.9 Q4 613.5 144.7 67.8 29.8 20.6 288.9 − 5.7 34.5 21.4
2017 Q1 619.9 146.2 66.1 30.3 21.2 293.9 − 5.8 34.9 21.6 Q2 623.7 143.7 69.0 30.7 21.4 295.3 − 6.8 35.3 21.5 Q3 631.6 142.9 71.0 30.8 21.8 301.1 − 6.9 35.5 21.7
1 Data as of 2016 Q3 are based on Solvency II supervisory data, valuation of listed se- ed on assumed reinsurance as well as registered bonds, borrowers’ note loans andcurities at the corresponding consistent price from the ESCB’s securities database. Up registered Pfandbriefe. 4 Not including the reinsurance business conducted by pri-to and including 2016 Q2 data are based on Solvency I supervisory data from the Fed- mary insurers, which is included there. 5 The term “pension funds“ refers to the insti-eral Financial Supervisory Authority (BaFin), supplemented by estimates and own calcu- tutional sector “pension funds“ of the European System of Accounts. Pension fundslations. 2 Accounts receivable to monetary financial institutions, including registered thus comprise company pension schemes and occupational pension schemes for thebonds, borrowers’ note loans and registered Pfandbriefe. 3 Including deposits retain- self-employed. Social security funds are not included.

Deutsche Bundesbank
49
Monthly Report
March 2018
VII Insurance corporations and pension funds
2 Liabilities € billion
Insurance technical reserves
Life /Debt Claims on
End of securities Shares and pension funds Financial Remainingyear/quarter Total issued Loans 2 other equity Total reserves 3 Non-life 4 derivatives liabilities Net worth 7
Insurance corporations
2012 1,694.4 22.4 73.1 152.0 1,280.0 1,009.2 270.8 0.0 69.5 97.42013 1,742.1 16.9 77.7 188.7 1,340.7 1,061.4 279.3 0.0 68.8 49.22014 1,892.0 17.3 84.3 193.0 1,411.6 1,113.8 297.8 0.0 70.5 115.32015 1,954.1 18.3 91.7 214.8 1,474.7 1,160.6 314.1 0.0 70.2 84.4
2016 Q1 2,007.8 17.7 92.9 220.4 1,501.0 1,179.8 321.2 0.0 71.5 104.3 Q2 2,034.6 17.6 93.0 191.1 1,508.4 1,188.4 320.1 0.0 71.6 152.9
2016 Q3 1 2,219.7 30.7 73.7 383.0 1,579.3 1,396.7 182.5 1.5 151.4 − Q4 2,186.1 30.7 70.3 441.0 1,494.4 1,313.3 181.1 2.3 147.5 −
2017 Q1 2,189.3 30.5 57.2 448.5 1,511.7 1,309.5 202.3 1.8 139.5 − Q2 2,177.9 28.6 57.0 450.7 1,505.2 1,308.3 196.9 2.1 134.3 − Q3 2,190.5 28.5 58.4 455.4 1,512.8 1,317.0 195.7 2.3 133.2 −
Life insurance2012 927.6 0.0 23.1 16.3 814.9 801.2 13.7 0.0 34.9 38.52013 956.9 0.0 23.8 20.2 853.2 839.4 13.8 0.0 34.1 25.62014 1,044.1 0.0 24.7 21.6 891.8 877.4 14.4 0.0 32.8 73.32015 1,063.7 0.0 24.5 24.6 926.0 911.0 15.0 0.0 30.9 57.7
2016 Q1 1,095.7 0.0 26.0 23.6 938.7 923.4 15.2 0.0 30.7 76.8 Q2 1,116.7 0.0 27.8 22.3 943.1 927.8 15.3 0.0 30.2 93.3
2016 Q3 1 1,246.9 3.8 25.9 96.0 1,066.1 1,066.1 − 0.7 54.4 − Q4 1,194.2 4.1 25.0 116.3 993.7 993.7 − 1.2 53.9 −
2017 Q1 1,170.4 4.1 12.5 116.3 991.7 991.7 − 0.9 44.8 − Q2 1,172.7 4.0 12.1 119.8 989.5 989.5 − 1.0 46.2 − Q3 1,178.6 4.1 12.3 121.5 993.9 993.9 − 1.1 45.8 −
Non-life insurance2012 427.3 0.0 11.5 44.4 329.9 208.0 122.0 0.0 14.9 26.62013 448.1 0.0 9.2 55.9 351.6 222.0 129.6 0.0 15.3 16.12014 486.4 0.0 10.5 58.2 369.8 236.5 133.4 0.0 15.6 32.32015 511.0 0.0 14.2 63.7 390.5 249.6 140.9 0.0 17.1 25.5
2016 Q1 527.6 0.0 14.6 62.0 399.6 253.8 145.9 0.0 17.5 33.9 Q2 532.8 0.0 14.5 57.7 401.6 256.8 144.9 0.0 17.2 41.9
2016 Q3 1 592.2 0.9 6.6 120.0 407.4 310.1 97.3 0.0 57.3 − Q4 583.3 1.1 6.3 130.4 390.1 300.4 89.7 0.2 55.3 −
2017 Q1 606.5 1.1 7.3 134.0 408.9 300.7 108.2 0.1 55.0 − Q2 603.4 1.1 6.8 135.6 406.7 302.4 104.3 0.1 53.0 − Q3 603.8 1.1 6.9 137.3 406.6 305.7 100.9 0.1 51.9 −
Reinsurance 5
2012 339.5 22.4 38.5 91.3 135.1 − 135.1 0.0 19.8 32.42013 337.1 16.9 44.7 112.7 135.9 − 135.9 0.0 19.4 7.52014 361.4 17.3 49.1 113.3 150.0 − 150.0 0.0 22.1 9.62015 379.4 18.3 53.0 124.8 158.2 − 158.2 0.0 22.2 2.8
2016 Q1 376.0 17.7 52.5 118.3 157.3 − 157.3 0.0 22.5 7.7 Q2 373.7 17.6 51.7 111.2 156.6 − 156.6 0.0 22.9 13.6
2016 Q3 1 380.6 26.0 41.3 167.0 105.8 20.5 85.3 0.8 39.8 − Q4 408.6 25.5 39.0 194.3 110.5 19.1 91.4 0.9 38.3 −
2017 Q1 412.5 25.3 37.4 198.2 111.1 17.0 94.1 0.8 39.7 − Q2 401.9 23.5 38.1 195.2 109.1 16.4 92.6 1.1 35.0 − Q3 408.1 23.3 39.3 196.6 112.3 17.5 94.8 1.1 35.6 −
Pension funds 6
2012 468.4 − 4.1 6.9 428.3 427.9 0.4 − 1.8 27.32013 494.6 − 4.2 8.9 453.4 452.9 0.5 − 2.9 25.32014 552.5 − 4.7 9.7 492.1 491.6 0.5 − 1.8 44.22015 579.5 − 4.9 11.3 518.3 517.9 0.4 − 6.1 38.9
2016 Q1 588.8 − 5.0 11.4 522.7 522.2 0.5 − 5.8 44.1 Q2 601.7 − 5.0 10.0 529.6 529.1 0.5 − 5.8 51.3 Q3 611.6 − 5.1 10.3 535.2 535.2 − − 5.8 55.3 Q4 613.5 − 5.2 11.3 544.7 544.7 − − 6.0 46.4
2017 Q1 619.9 − 5.2 11.9 552.4 552.4 − − 6.0 44.3 Q2 623.7 − 6.1 11.6 554.3 554.3 − − 6.2 45.5 Q3 631.6 − 6.1 12.0 559.9 559.9 − − 6.2 47.4
1 Data as of 2016 Q3 are based on Solvency II supervisory data. Up to and including ESA 1995. 4 As of 2016 Q3 insurance technical reserves “non-life“ pursuant to Solven-2016 Q2 data are based on Solvency I supervisory data from the Federal Financial Su- cy II. Up to and including 2016 Q2 unearned premiums and reserves for outstandingpervisory Authority (BaFin), supplemented by estimates and own calculations. 2 Includ- claims pursuant to ESA 1995. 5 Not including the reinsurance business conducted bying deposits retained on ceded business as well as registered bonds, borrowers’ note primary insurers, which is included there. 6 The term “pension funds“ refers to the in-loans and registered Pfandbriefe. 3 As of 2016 Q3 insurance technical reserves “life“ stitutional sector “pension funds“ of the European System of Accounts. Pensionpursuant to Solvency II taking account of transitional measures. Up to and including funds thus comprise company pension schemes and occupational pension schemes2016 Q2: Long-term net equity of households in life insurance (including ageing provi- for the self-employed. Social security funds are not included. 7 Own funds corre-sions of health insurance schemes and premium reserves of accident insurance spond to the sum of net worth and the liability item „Shares and other equity“. schemes with guaranteed premium refund) and pension fund reserves pursuant to

Deutsche Bundesbank
50
Monthly Report
March 2018
VIII Capital market
1 Sales and purchases of debt securities and shares in Germany
€ million
Debt securities
Sales Purchases
Domestic debt securities 1 Residents
Credit in-Sales stitutions= Public Foreign includingtotal Bank Corporate debt debt buildingpur- debt bonds secur- secur- and loan Deutsche Other Non-
Period chases Total securities ities ities 3 Total 4 Bundesbank sectors 6 residents 7 (non-MFIs) 2 associations 5
2006 242,006 102,379 40,995 8,943 52,446 139,627 125,423 68,893 . 56,530 116,5832007 217,798 90,270 42,034 20,123 28,111 127,528 − 26,762 96,476 . − 123,238 244,5602008 76,490 66,139 − 45,712 86,527 25,322 10,351 18,236 68,049 . − 49,813 58,2542009 70,208 − 538 − 114,902 22,709 91,655 70,747 90,154 12,973 8,645 77,181 − 19,945
2010 146,620 − 1,212 − 7,621 24,044 − 17,635 147,831 92,682 − 103,271 22,967 172,986 53,9382011 33,649 13,575 − 46,796 850 59,521 20,075 − 23,876 − 94,793 36,805 34,112 57,5262012 51,813 − 21,419 − 98,820 − 8,701 86,103 73,231 − 3,767 − 42,017 − 3,573 41,823 55,5802013 − 15,969 − 101,616 − 117,187 153 15,415 85,646 16,409 − 25,778 − 12,708 54,895 − 32,3802014 64,774 − 31,962 − 47,404 − 1,330 16,776 96,737 50,409 − 12,124 − 11,951 74,484 14,366
2015 32,609 − 36,010 − 65,778 26,762 3,006 68,620 119,379 − 66,330 121,164 64,546 − 86,7702016 72,270 27,429 19,177 18,265 − 10,012 44,840 174,162 − 58,012 187,500 44,674 − 101,8942017 54,930 11,563 1,096 7,112 3,356 43,368 145,410 − 71,454 161,012 55,852 − 90,477
2017 Mar 9,081 8,713 1,179 − 131 7,665 368 17,675 − 8,293 17,769 8,199 − 8,593
Apr − 12,740 − 15,170 − 5,909 − 276 − 8,985 2,430 3,482 − 5,737 12,817 − 3,598 − 16,221 May 39,221 28,463 10,800 1,096 16,567 10,759 14,678 3,906 12,751 − 1,979 24,543 June 3,424 − 1,090 2,876 − 5,769 1,802 4,514 10,686 − 11,745 12,871 9,560 − 7,262
July − 7,748 − 17,251 − 7,196 8,174 − 18,228 9,503 9,578 − 6,471 11,565 4,484 − 17,325 Aug 13,342 12,771 − 1,814 − 1,581 16,166 571 6,897 − 8,730 9,902 5,725 6,445 Sep − 13,756 − 18,254 − 8,577 − 3,456 − 6,221 4,497 1,838 − 8,357 12,865 − 2,670 − 15,594
Oct − 12,129 − 10,152 − 9,775 − 2,760 2,383 − 1,977 9,642 − 4,841 12,199 2,284 − 21,771 Nov 28,537 22,066 893 6,338 14,835 6,471 25,664 3,359 13,355 8,950 2,873 Dec − 20,490 − 18,944 − 5,802 − 952 − 12,190 − 1,546 3,495 − 12,058 10,057 5,496 − 23,985
2018 Jan 14,151 − 2,330 1,183 530 − 4,043 16,481 − 1,976 1,164 6,138 − 9,278 16,127
€ million
Shares
Sales Purchases
Sales Residents=total Domestic Foreign Credit insti- Non-
Period purchases shares 8 shares 9 Total 10 tutions 5 Other sectors 11 residents 12
2006 26,276 9,061 17,214 7,528 11,323 − 3,795 18,7482007 − 5,009 10,053 − 15,062 − 62,308 − 6,702 − 55,606 57,2992008 − 29,452 11,326 − 40,778 2,743 − 23,079 25,822 − 32,1942009 35,980 23,962 12,018 30,496 − 8,335 38,831 5,484
2010 37,767 20,049 17,719 36,406 7,340 29,066 1,3612011 25,833 21,713 4,120 40,804 670 40,134 − 14,9712012 15,061 5,120 9,941 14,405 10,259 4,146 6562013 20,187 10,106 10,081 17,336 11,991 5,345 2,8512014 43,501 18,778 24,723 43,950 17,203 26,747 − 449
2015 40,488 7,668 32,820 30,568 − 5,421 35,989 9,9202016 33,491 4,409 29,082 31,261 − 5,143 36,404 2,2302017 48,645 15,570 33,075 47,482 7,031 40,451 1,163
2017 Mar 14,552 10,136 4,416 11,898 506 11,392 2,654
Apr − 1,276 95 − 1,371 − 4,520 − 2,589 − 1,931 3,244 May 3,715 107 3,608 2,423 475 1,948 1,292 June − 5,765 920 − 6,685 − 1,372 5,220 − 6,592 − 4,393
July 2,889 509 2,380 4,140 − 690 4,830 − 1,251 Aug 2,276 155 2,121 4,782 − 603 5,385 − 2,506 Sep 5,766 1,482 4,284 4,296 − 1,738 6,034 1,470
Oct 2,242 572 1,670 − 535 735 − 1,270 2,777 Nov 3,310 110 3,200 4,121 1,198 2,923 − 811 Dec 13,617 484 13,133 15,596 2,898 12,698 − 1,979
2018 Jan 7,620 153 7,467 8,979 867 8,112 − 1,359
1 Net sales at market values plus/minus changes in issuers’ portfolios of their own 9 Net purchases or net sales (−) of foreign shares (including direct investment) by debt securities. 2 Including cross-border financing within groups from January 2011. residents; transaction values. 10 Domestic and foreign shares. 11 Residual; also3 Net purchases or net sales (−) of foreign debt securities by residents; transaction including purchases of domestic and foreign securities by domestic mutual funds.values. 4 Domestic and foreign debt securities. 5 Book values; statistically adjusted. 12 Net purchases or net sales (−) of domestic shares (including direct investment) by6 Residual; also including purchases of domestic and foreign securities by domestic non-residents; transaction values. — Some of the data from 2013 until 2017 havemutual funds. Up to end-2008, data comprise Deutsche Bundesbank. 7 Net pur- been revised by changes in the balance of payment statistics. The figures for thechases or net sales (−) of domestic debt securities by non-residents; transaction most recent date are provisional; revisions are not specially marked. values. 8 Excluding shares of public limited investment companies; at issue prices.

Deutsche Bundesbank
51
Monthly Report
March 2018
VIII Capital market
2 Sales of debt securities issued by residents *
€ million nominal value
Bank debt securities 1
Debt securitiesCorporateissued by special
Mortgage Public purpose credit Other bank bonds PublicPeriod Total Total Pfandbriefe Pfandbriefe institutions debt securities (non-MFIs) 2 debt securities
Gross sales 3
2006 925,863 622,055 24,483 99,628 139,193 358,750 29,975 273,8342007 1,021,533 743,616 19,211 82,720 195,722 445,963 15,043 262,8722008 1,337,337 961,271 51,259 70,520 382,814 456,676 95,093 280,9742009 1,533,616 1,058,815 40,421 37,615 331,566 649,215 76,379 398,423
2010 1,375,138 757,754 36,226 33,539 363,828 324,160 53,654 563,7312011 1,337,772 658,781 31,431 24,295 376,876 226,180 86,615 592,3762012 1,340,568 702,781 36,593 11,413 446,153 208,623 63,259 574,5292013 1,433,628 908,107 25,775 12,963 692,611 176,758 66,630 458,8912014 1,362,056 829,864 24,202 13,016 620,409 172,236 79,873 452,321
2015 1,359,422 852,045 35,840 13,376 581,410 221,417 106,676 400,7002016 4 1,206,483 717,002 29,059 7,621 511,222 169,103 73,370 416,1102017 4 1,047,822 619,199 30,339 8,933 438,463 141,466 66,289 362,333
2017 June 73,438 42,842 5,005 364 25,324 12,148 4,284 26,312
July 81,160 47,165 292 562 38,013 8,298 11,105 22,889 Aug 83,236 47,675 2,476 20 36,804 8,374 1,462 34,100 Sep 80,958 48,059 1,940 76 34,328 11,716 3,712 29,186
Oct 91,104 50,410 2,420 1,150 34,514 12,326 5,299 35,396 Nov 84,080 37,055 1,823 340 22,871 12,021 11,681 35,345 Dec 4 59,026 33,899 1,727 1,727 17,999 12,446 6,113 19,014
2018 Jan 92,293 59,191 3,459 1,002 42,821 11,910 3,144 29,958
of which: Debt securities with maturities of more than four years 5
2006 337,969 190,836 17,267 47,814 47,000 78,756 14,422 132,7112007 315,418 183,660 10,183 31,331 50,563 91,586 13,100 118,6592008 387,516 190,698 13,186 31,393 54,834 91,289 84,410 112,4072009 361,999 185,575 20,235 20,490 59,809 85,043 55,240 121,185
2010 381,687 169,174 15,469 15,139 72,796 65,769 34,649 177,8632011 368,039 153,309 13,142 8,500 72,985 58,684 41,299 173,4312012 421,018 177,086 23,374 6,482 74,386 72,845 44,042 199,8882013 372,805 151,797 16,482 10,007 60,662 64,646 45,244 175,7652014 420,006 157,720 17,678 8,904 61,674 69,462 56,249 206,037
2015 414,593 179,150 25,337 9,199 62,237 82,379 68,704 166,7422016 4 375,859 173,900 24,741 5,841 78,859 64,460 47,818 154,1442017 4 357,506 170,357 22,395 6,447 94,852 46,663 44,891 142,257
2017 June 24,255 10,611 3,011 54 3,390 4,156 1,784 11,860
July 31,503 12,687 111 62 9,523 2,991 7,388 11,428 Aug 24,629 10,217 2,245 20 5,283 2,670 521 13,890 Sep 26,426 13,324 1,395 24 8,649 3,256 2,765 10,337
Oct 31,980 14,680 2,129 1,145 7,480 3,926 2,837 14,463 Nov 35,497 12,555 1,528 320 6,294 4,413 8,990 13,952 Dec 4 18,711 8,098 420 1,607 2,704 3,368 4,821 5,791
2018 Jan 37,248 26,777 2,697 967 19,026 4,087 1,626 8,845
Net sales 6
2006 129,423 58,336 − 12,811 − 20,150 44,890 46,410 15,605 55,4822007 86,579 58,168 − 10,896 − 46,629 42,567 73,127 − 3,683 32,0932008 119,472 8,517 15,052 − 65,773 25,165 34,074 82,653 28,3022009 76,441 − 75,554 858 − 80,646 25,579 − 21,345 48,508 103,482
2010 21,566 − 87,646 − 3,754 − 63,368 28,296 − 48,822 23,748 85,4642011 22,518 − 54,582 1,657 − 44,290 32,904 − 44,852 − 3,189 80,2892012 − 85,298 − 100,198 − 4,177 − 41,660 − 3,259 − 51,099 − 6,401 21,2982013 − 140,017 − 125,932 − 17,364 − 37,778 − 4,027 − 66,760 1,394 − 15,4792014 − 34,020 − 56,899 − 6,313 − 23,856 − 862 − 25,869 10,497 12,383
2015 − 65,147 − 77,273 9,271 − 9,754 − 2,758 − 74,028 25,300 − 13,1742016 4 21,951 10,792 2,176 − 12,979 16,266 5,327 18,177 − 7,0202017 4 2,669 5,954 6,389 − 4,697 18,788 − 14,525 6,828 − 10,114
2017 June − 6,370 1,035 2,036 − 245 4,667 − 5,423 − 2,704 − 4,701
July − 12,190 − 6,664 − 2,176 209 − 1,958 − 2,738 8,539 − 14,065 Aug 13,424 − 1,646 975 − 94 2,334 − 4,861 − 934 16,004 Sep − 11,050 − 6,065 − 749 − 1,959 779 − 4,137 − 1,796 − 3,189
Oct − 1,501 179 1,342 229 − 1,165 − 227 − 1,952 272 Nov 22,681 − 24 444 123 − 1,471 880 6,842 15,863 Dec 4 − 28,202 − 16,824 − 1,367 − 329 − 7,519 − 7,609 − 469 − 10,909
2018 Jan − 8,981 3,064 1,643 − 998 3,302 − 883 21 − 12,067
* For definitions, see the explanatory notes in the Statistical Supplement 2 Capital initial sales of newly issued securities. 4 Sectoral reclassification of debtmarket statistics on p 21 ff. 1 Excluding registered bank debt securities. 2 Including securities. 5 Maximum maturity according to the terms of issue. 6 Gross sales lesscross-border financing within groups from January 2011. 3 Gross sales means only redemptions.

Deutsche Bundesbank
52
Monthly Report
March 2018
VIII Capital market 3 Amounts outstanding of debt securities issued by residents *
€ million nominal value
Bank debt securities End of year Debt securitiesor month/ issued by CorporateMaturity Mortgage Public special purpose Other bank bonds Publicin years Total Total Pfandbriefe Pfandbriefe credit institutions debt securities (non-MFIs) debt securities
2006 3,044,145 1,809,899 144,397 499,525 368,476 797,502 99,545 1,134,7012007 3,130,723 1,868,066 133,501 452,896 411,041 870,629 95,863 1,166,7942008 3,250,195 1,876,583 150,302 377,091 490,641 858,550 178,515 1,195,0972009 3,326,635 1,801,029 151,160 296,445 516,221 837,203 227,024 1,298,581
2010 3,348,201 1 1,570,490 147,529 232,954 544,517 1 645,491 250,774 1 1,526,9372011 3,370,721 1,515,911 149,185 188,663 577,423 600,640 247,585 1,607,2262012 3,285,422 1 1,414,349 145,007 147,070 574,163 1 548,109 1 220,456 1 1,650,6172013 3,145,329 1,288,340 127,641 109,290 570,136 481,273 221,851 1,635,1382014 3,111,308 1,231,445 121,328 85,434 569,409 455,274 232,342 1,647,520
2015 3,046,162 1,154,173 130,598 75,679 566,811 381,085 257,612 1,634,3772016 1 3,068,111 1,164,965 132,775 62,701 633,578 335,910 275,789 1,627,3582017 1 3,090,708 1,170,920 141,273 58,004 651,211 320,432 302,543 1,617,244
2017 July 3,075,428 1,195,300 140,628 60,033 659,861 334,777 280,925 1,599,203 Aug 3,088,852 1,193,654 141,603 59,939 662,196 329,917 279,992 1,615,207 Sep 3,097,730 1,187,589 140,854 57,980 662,975 325,780 2 298,123 1,612,018
Oct 3,096,229 1,187,768 142,196 58,210 661,809 325,553 296,171 1,612,290 Nov 3,118,910 1,187,744 142,640 58,333 660,338 326,433 303,012 1,628,153 Dec 3,090,708 1,170,920 141,273 58,004 1 651,211 1 320,432 302,543 1,617,244
2018 Jan 3,081,726 1,173,984 142,916 57,006 654,514 319,549 302,565 1,605,177
Breakdown by remaining period to maturity 3 Position at end-January 2018
985,450 436,873 40,513 22,811 264,993 108,555 59,536 489,041 less than 2647,591 272,191 35,459 12,349 153,804 70,579 53,224 322,1772 to less than 4443,049 174,013 27,312 8,073 92,570 46,057 36,726 232,3114 to less than 6316,206 116,054 19,702 6,075 63,199 27,079 32,974 167,1786 to less than 8247,246 82,780 15,257 4,173 41,027 22,325 15,142 149,3238 to less than 10137,821 40,813 3,664 1,926 20,182 15,041 21,521 75,48710 to less than 1582,473 17,910 264 1,151 12,509 3,987 8,299 56,26415 to less than 20
221,893 33,351 743 450 6,230 25,928 75,144 113,39720 and more
* Including debt securities temporarily held in the issuers’ portfolios. 1 Sectoral securities falling due en bloc and until mean maturity of the residual amountreclassification of debt securities. 2 Increase due to change in issuers’ country of outstanding for debt securities not falling due en bloc. residence. 3 Calculated from month under review until final maturity for debt
4 Shares in circulation issued by residents *
€ million nominal value
Change in domestic public limited companies’ capital due to
Memo itemShare circulationat market values(market capita-cash payments
Share capital = Net increase or and ex- contribution contribution merger reduction lisation)circulation at net decrease (−) change of of claims of shares, and of capital level at endend of period during period convertible issue of and other GmbH shares, transfer change of and of period
Period under review under review bonds 1 bonus shares real assets etc of assets legal form liquidation under review 2
2006 163,764 695 2,670 3,347 604 954 − 1,868 − 1,256 − 3,761 1,279,6382007 164,560 799 3,164 1,322 200 269 − 682 − 1,847 − 1,636 1,481,9302008 168,701 4,142 5,006 1,319 152 0 − 428 − 608 − 1,306 830,6222009 175,691 6,989 12,476 398 97 − − 3,741 − 1,269 − 974 927,256
2010 174,596 − 1,096 3,265 497 178 10 − 486 − 993 − 3,569 1,091,2202011 177,167 2,570 6,390 552 462 9 − 552 − 762 − 3,532 924,2142012 178,617 1,449 3,046 129 570 − − 478 594 − 2,411 1,150,1882013 171,741 − 6,879 2,971 718 476 − − 1,432 − 619 − 8,992 1,432,6582014 177,097 5,356 5,332 1,265 1,714 − − 465 − 1,044 − 1,446 1,478,063
2015 177,416 319 4,634 397 599 − − 1,394 − 1,385 − 2,535 1,614,4422016 176,355 − 1,062 3,272 319 337 − − 953 − 2,165 − 1,865 1,676,3972017 178,828 2,471 3,894 776 533 − − 457 − 661 − 1,615 1,933,733
2017 July 179,467 847 493 485 8 − 3 − 18 − 125 1,800,324 Aug 179,207 − 260 155 2 6 − − 167 − 173 − 83 1,787,670 Sep 179,448 241 165 18 119 − − 13 − 7 − 41 1,888,218
Oct 179,294 − 154 230 0 121 − − 1 − 1 − 504 1,957,699 Nov 179,426 132 109 − − − 0 58 − 35 1,947,204 Dec 178,828 − 598 128 − 1 − − 140 − 363 − 224 1,933,733
2018 Jan 178,752 − 75 102 − 1 − 0 − 118 − 61 1,981,815
* Excluding shares of public limited investment companies. 1 Including shares issued on data of the Herausgebergemeinschaft Wertpapier-Mitteilungen and the Deutscheout of company profits. 2 All marketplaces. Source: Bundesbank calculations based Börse AG.

Deutsche Bundesbank
53
Monthly Report
March 2018
VIII Capital market
5 Yields and indices on German securities
Yields on debt securities outstanding issued by residents 1 Price indices 2,3
Public debt securities Bank debt securities Debt securities Shares
ListedFederal securities
With a residualWith a residualmaturity of maturity of Corporate German German9 and more than 9 bonds bond iBoxx CDAX share
including and including (non- index share price index€ GermanyTotal Total Total 10 years 4 Total 10 years MFIs) (REX) price index index (DAX)
Average End-1998 End-1987 End-1987Period % per annum daily rate = 100 = 100 = 1000
2005 3.1 3.2 3.2 3.4 3.1 3.5 3.7 120.92 101.09 335.59 5,408.262006 3.8 3.7 3.7 3.8 3.8 4.0 4.2 116.78 96.69 407.16 6,596.922007 4.3 4.3 4.2 4.2 4.4 4.5 5.0 114.85 94.62 478.65 8,067.322008 4.2 4.0 4.0 4.0 4.5 4.7 6.3 121.68 102.06 266.33 4,810.202009 3.2 3.1 3.0 3.2 3.5 4.0 5.5 123.62 100.12 320.32 5,957.43
2010 2.5 2.4 2.4 2.7 2.7 3.3 4.0 124.96 102.95 368.72 6,914.192011 2.6 2.4 2.4 2.6 2.9 3.5 4.3 131.48 109.53 304.60 5,898.352012 1.4 1.3 1.3 1.5 1.6 2.1 3.7 135.11 111.18 380.03 7,612.392013 1.4 1.3 1.3 1.6 1.3 2.1 3.4 132.11 105.92 466.53 9,552.162014 1.0 1.0 1.0 1.2 0.9 1.7 3.0 139.68 114.37 468.39 9,805.55
2015 0.5 0.4 0.4 0.5 0.5 1.2 2.4 139.52 112.42 508.80 10,743.012016 0.1 0.0 0.0 0.1 0.3 1.0 2.1 142.50 112.72 526.55 11,481.062017 0.3 0.2 0.2 0.3 0.4 0.9 1.7 140.53 109.03 595.45 12,917.64
2017 Sep 0.3 0.2 0.2 0.4 0.4 0.9 1.7 141.21 109.06 585.63 12,828.86
Oct 0.3 0.3 0.2 0.4 0.4 0.9 1.6 141.63 109.70 603.37 13,229.57 Nov 0.3 0.2 0.2 0.3 0.4 0.8 1.6 141.23 109.62 597.74 13,023.98 Dec 0.3 0.2 0.2 0.3 0.4 0.8 1.7 140.53 109.03 595.45 12,917.64
2018 Jan 0.5 0.4 0.4 0.5 0.6 0.9 1.8 139.19 107.24 608.72 13,189.48 Feb 0.6 0.5 0.5 0.7 0.7 1.2 2.1 139.24 107.33 577.02 12,435.85
1 Bearer debt securities with maximum maturities according to the terms of issue of ding of the debt securities included in the calculation. Monthly figures are calculatedover 4 years if their mean residual maturities exceed 3 years. Convertible debt on the basis of the yields on all the business days in a month. The annual figures aresecurities, etc. debt securities with unscheduled redemption, zero-coupon bonds, the unweighted means of the monthly figures. 2 End of year or month. 3 Source:floating-rate notes and bonds not denominated in euro are not included. Group Deutsche Börse AG. 4 Only debt securities eligible as underlying instruments foryields for the various categories of securities are weighted by the amounts outstan- futures contracts; calculated as unweighted averages.
6 Sales and purchases of mutual fund shares in Germany
€ million
Sales Purchases
Open-end domestic mutual funds 1 (sales receipts) Residents
Mutual funds open to the Credit institutionsgeneral public including building
Other sectors 3 and loan associations 2 of which
Sales of which of which= Secur- Foreign Foreigntotal Money ities- Real Special- mutual mutualpur- market based estate ised Foreign fund fund Non-resi-
Period chases Total Total funds funds funds funds funds 4 Total Total shares Total shares dents 5
2007 55,778 13,436 − 7,872 − 4,839 − 12,848 6,840 21,307 42,342 51,309 − 229 4,240 51,538 38,102 4,4692008 2,598 − 7,911 − 14,409 − 12,171 − 11,149 799 6,498 10,509 11,315 − 16,625 − 9,252 27,940 19,761 − 8,717
2009 49,929 43,747 10,966 − 5,047 11,749 2,686 32,780 6,182 38,132 − 14,995 − 8,178 53,127 14,361 11,7962010 106,190 84,906 13,381 − 148 8,683 1,897 71,345 21,284 102,591 3,873 6,290 98,718 14,994 3,5982011 46,512 45,221 − 1,340 − 379 − 2,037 1,562 46,561 1,291 39,474 − 7,576 − 694 47,050 1,984 7,0362012 111,236 89,942 2,084 − 1,036 97 3,450 87,859 21,293 114,676 − 3,062 − 1,562 117,738 22,855 − 3,4382013 123,736 91,337 9,184 − 574 5,596 3,376 82,153 32,400 117,028 771 100 116,257 32,300 6,709
2014 140,233 97,711 3,998 − 473 862 1,000 93,713 42,522 144,075 819 − 1,745 143,256 44,266 − 3,8412015 181,888 146,136 30,420 318 22,345 3,636 115,716 35,750 174,529 7,362 494 167,167 35,257 7,3572016 155,511 119,369 21,301 − 342 11,131 7,384 98,068 36,142 162,429 2,877 − 3,172 159,552 39,315 − 6,9192017 142,669 94,921 29,560 − 235 21,970 4,406 65,361 47,747 146,108 4,938 1,048 141,170 46,700 − 3,441
2017 July 14,114 9,699 4,537 − 35 4,033 353 5,162 4,415 13,211 545 230 12,666 4,185 903 Aug 9,863 6,458 408 238 1,450 − 1,493 6,050 3,405 9,885 517 − 47 9,368 3,452 − 22 Sep 6,145 3,246 3,996 31 2,849 709 − 750 2,899 6,370 102 − 224 6,268 3,123 − 225
Oct 18,187 10,973 906 − 285 501 322 10,068 7,213 17,170 414 − 176 16,756 7,389 1,016 Nov 10,536 8,591 2,614 11 2,316 256 5,978 1,945 15,290 − 43 − 285 15,333 2,230 − 4,755 Dec 15,285 9,757 1,665 − 7 585 774 8,092 5,528 14,441 − 656 53 15,097 5,475 844
2018 Jan 24,788 15,003 6,014 − 5 4,152 756 8,989 9,785 23,883 876 713 23,007 9,072 905
1 Including public limited investment companies. 2 Book values. 3 Residual. 4 Net transaction values. — Some of the data from 2013 until 2017 have been revised bypurchases or net sales (−) of foreign fund shares by residents; transaction values. changes in the balance of payment statistics. The figures for the most recent date are5 Net purchases or net sales (−) of domestic fund shares by non-residents; provisional; revisions are not specially marked.

Deutsche Bundesbank
54
Monthly Report
March 2018
IX Financial accounts
1 Acquisition of financial assets and external financing of non-financial corporations (non-consolidated) € billion
2016 2017
Item 2014 2015 2016 Q2 Q3 Q4 Q1 Q2 Q3
Acquisition of financial assets
Currency and deposits − 1.62 30.58 40.13 8.80 23.65 − 1.11 6.81 19.49 2.89
Debt securities − 5.38 − 0.93 − 3.22 − 3.32 0.17 − 0.94 − 0.89 − 0.76 − 1.08short-term debt securities 1.62 − 0.77 − 0.57 − 0.70 − 0.02 − 0.82 0.23 − 1.89 − 0.26long-term debt securities − 7.00 − 0.15 − 2.65 − 2.62 0.19 − 0.11 − 1.13 1.13 − 0.81
Memo itemDebt securities of domestic sectors − 1.88 0.73 − 2.60 − 2.54 − 0.04 − 0.52 − 0.52 − 0.06 − 1.08
Non-financial corporations − 0.05 − 0.79 0.69 − 0.12 0.01 0.15 0.85 − 0.71 − 0.59Financial corporations − 1.26 1.93 − 2.49 − 1.80 − 0.53 − 0.47 − 0.34 0.64 − 0.11General government − 0.57 − 0.41 − 0.81 − 0.62 0.47 − 0.20 − 1.03 0.01 − 0.37
Debt securities of the rest of the world − 3.50 − 1.66 − 0.62 − 0.78 0.21 − 0.41 − 0.38 − 0.71 − 0.00
Loans 18.48 27.12 12.62 − 6.83 0.18 13.86 28.72 4.64 2.13short-term loans 33.19 25.81 8.63 − 1.52 − 3.94 13.62 17.82 − 0.63 − 0.49long-term loans − 14.71 1.31 3.99 − 5.31 4.11 0.24 10.90 5.27 2.62
Memo itemto domestic sectors 14.11 8.90 − 1.44 − 5.36 − 2.10 1.40 10.74 − 1.20 − 2.48
Non-financial corporations − 0.42 0.84 − 6.06 − 11.07 − 1.74 0.57 2.75 2.51 − 0.52Financial corporations 14.46 7.88 4.47 5.67 − 0.40 0.78 7.99 − 3.71 − 1.96General government 0.08 0.18 0.15 0.04 0.04 0.04 0.00 0.00 0.00
to the rest of the world 4.37 18.22 14.06 − 1.47 2.28 12.47 17.98 5.84 4.61
Equity and investment fund shares − 1.85 44.57 60.08 3.70 12.11 34.87 16.26 − 2.42 19.00
Equity 8.53 28.23 54.26 4.45 8.03 32.83 17.51 − 0.24 16.70
Listed shares of domestic sectors − 1.62 − 10.41 20.66 − 0.77 6.72 20.70 − 5.54 − 2.10 1.85Non-financial corporations − 5.39 − 8.04 20.34 − 0.94 6.83 20.62 − 5.45 − 2.26 1.89Financial corporations 3.78 − 2.37 0.31 0.17 − 0.11 0.08 − 0.09 0.16 − 0.04
Listed shares of the rest of the world − 4.85 12.45 10.13 − 0.59 1.37 8.69 3.23 11.72 − 6.00
Other equity 1 14.99 26.19 23.47 5.81 − 0.07 3.44 19.83 − 9.86 20.85
Investment fund shares − 10.38 16.35 5.82 − 0.75 4.08 2.04 − 1.25 − 2.18 2.29Money market fund shares 0.23 0.21 0.36 − 0.10 − 0.03 0.79 − 0.28 0.00 − 1.07Non-MMF investment fund shares − 10.61 16.13 5.46 − 0.65 4.11 1.25 − 0.97 − 2.18 3.37
Insurance technical reserves − 0.06 2.97 1.09 0.35 0.29 0.29 0.06 0.52 0.45
Financial derivatives − 1.23 0.56 4.93 0.84 − 1.08 7.25 0.08 2.35 3.30
Other accounts receivable − 78.98 28.63 − 1.44 − 4.03 − 3.39 − 3.56 79.72 − 22.21 23.80
Total − 70.63 133.50 114.18 − 0.50 31.92 50.67 130.75 1.61 50.49
External financing
Debt securities 1.26 7.78 23.71 4.60 2.88 5.82 7.57 − 0.52 0.96
short-term securities − 11.63 1.96 − 0.15 0.18 − 0.57 − 1.79 5.47 − 0.42 − 2.62long-term securities 12.89 5.82 23.85 4.43 3.45 7.61 2.11 − 0.10 3.58
Memo itemDebt securities of domestic sectors 4.27 1.77 10.93 1.27 1.59 3.10 3.35 1.28 0.57
Non-financial corporations − 0.05 − 0.79 0.69 − 0.12 0.01 0.15 0.85 − 0.71 − 0.59Financial corporations 4.12 2.08 10.11 1.96 1.56 3.00 3.19 2.10 1.43General government 0.00 0.02 0.01 0.00 0.01 0.00 − 0.01 0.02 0.00Households 0.20 0.46 0.12 − 0.57 0.01 − 0.05 − 0.69 − 0.13 − 0.28
Debt securities of the rest of the world − 3.01 6.02 12.78 3.33 1.29 2.73 4.23 − 1.80 0.39
Loans − 7.50 46.98 43.32 7.74 17.29 − 12.09 46.99 13.76 18.39short-term loans 0.60 29.81 14.68 − 1.69 3.27 − 2.34 7.72 2.93 7.89long-term loans − 8.10 17.17 28.65 9.43 14.02 − 9.75 39.27 10.83 10.50
Memo itemfrom domestic sectors 10.66 20.12 19.91 − 6.44 11.38 − 11.24 28.01 8.98 9.25
Non-financial corporations − 0.42 0.84 − 6.06 − 11.07 − 1.74 0.57 2.75 2.51 − 0.52Financial corporations 22.22 26.12 25.58 3.78 15.41 − 5.54 18.81 5.15 12.26General government − 11.15 − 6.83 0.39 0.85 − 2.29 − 6.28 6.46 1.32 − 2.48
from the rest of the world − 18.16 26.86 23.41 14.18 5.91 − 0.85 18.98 4.78 9.13
Equity 31.11 16.63 8.95 2.05 2.18 1.12 2.83 3.52 5.11
Listed shares of domestic sectors − 0.34 7.36 21.96 3.30 4.33 17.00 − 6.70 2.68 3.73Non-financial corporations − 5.39 − 8.04 20.34 − 0.94 6.83 20.62 − 5.45 − 2.26 1.89Financial corporations 2.22 11.75 − 2.31 3.22 − 2.25 − 2.13 − 0.88 6.21 0.63General government 0.03 0.11 0.07 0.05 0.01 − 0.02 0.07 0.13 0.16Households 2.80 3.55 3.85 0.98 − 0.26 − 1.47 − 0.44 − 1.40 1.04
Quoted shares of the rest of the world 9.09 − 1.34 − 20.44 − 2.89 − 4.10 − 16.16 7.03 − 1.28 − 1.77
Other equity 1 22.37 10.61 7.43 1.64 1.95 0.29 2.51 2.12 3.16
Insurance technical reserves 6.41 5.60 3.60 0.90 0.90 0.90 0.90 0.90 0.90
Financial derivatives and employeestock options − 0.21 − 10.81 − 0.13 − 5.71 8.05 − 7.81 2.60 2.23 3.14
Other accounts payable − 1.73 15.92 28.53 0.20 − 1.61 23.79 28.73 − 24.82 − 8.08
Total 29.33 82.09 107.97 9.77 29.69 11.73 89.62 − 4.94 20.41
1 Including unlisted shares.

Deutsche Bundesbank
55
Monthly Report
March 2018
IX Financial accounts
2 Financial assets and liabilities of non-financial corporations (non-consolidated) End-of-year level, end-of-quarter level; € billion
2016 2017
Item 2014 2015 2016 Q2 Q3 Q4 Q1 Q2 Q3
Financial assets
Currency and deposits 407.0 464.5 516.2 467.8 504.3 516.2 517.9 526.5 534.9
Debt securities 49.6 47.8 44.8 45.7 46.0 44.8 43.9 42.8 41.9short-term debt securities 6.8 6.0 5.5 6.3 6.3 5.5 5.8 3.9 3.6long-term debt securities 42.9 41.7 39.3 39.3 39.6 39.3 38.1 39.0 38.3
Memo itemDebt securities of domestic sectors 22.9 23.3 20.8 21.4 21.4 20.8 20.3 20.2 19.3
Non-financial corporations 4.6 3.6 4.4 4.2 4.3 4.4 5.3 4.6 4.1Financial corporations 12.7 14.5 12.0 13.0 12.5 12.0 11.6 12.3 12.3General government 5.7 5.2 4.4 4.2 4.6 4.4 3.4 3.3 3.0
Debt securities of the rest of the world 26.7 24.4 24.0 24.3 24.5 24.0 23.6 22.7 22.6
Loans 455.3 485.3 496.8 481.8 480.9 496.8 526.2 527.4 530.4short-term loans 356.2 383.7 392.4 381.9 377.6 392.4 410.8 408.4 406.9long-term loans 99.1 101.5 104.4 99.9 103.3 104.4 115.3 119.0 123.5
Memo itemto domestic sectors 303.6 312.5 311.1 311.8 309.7 311.1 321.8 320.6 318.2
Non-financial corporations 212.4 213.3 207.2 208.4 206.7 207.2 210.0 212.5 212.0Financial corporations 84.9 92.8 97.2 96.8 96.4 97.2 105.2 101.5 99.5General government 6.3 6.5 6.6 6.6 6.6 6.6 6.6 6.6 6.6
to the rest of the world 151.7 172.7 185.7 170.0 171.2 185.7 204.3 206.8 212.2
Equity and investment fund shares 1,698.6 1,872.9 1,914.9 1,746.9 1,804.2 1,914.9 1,995.7 1,982.0 2,012.9
Equity 1,563.1 1,720.9 1,755.0 1,595.2 1,646.0 1,755.0 1,834.9 1,823.8 1,851.5
Listed shares of domestic sectors 262.2 273.0 292.3 239.4 265.1 292.3 304.1 304.1 322.7Non-financial corporations 252.2 266.6 286.2 233.7 259.3 286.2 298.6 297.9 315.9Financial corporations 10.0 6.3 6.1 5.7 5.8 6.1 5.5 6.2 6.9
Listed shares of the rest of the world 50.0 62.5 73.9 62.1 64.5 73.9 79.7 89.3 80.1
Other equity 1 1,250.8 1,385.4 1,388.8 1,293.6 1,316.3 1,388.8 1,451.2 1,430.4 1,448.7
Investment fund shares 135.5 151.9 159.9 151.7 158.2 159.9 160.8 158.2 161.4Money market fund shares 1.2 1.4 1.9 1.1 1.0 1.9 1.7 1.7 0.6Non-MMF investment fund shares 134.4 150.6 158.0 150.6 157.2 158.0 159.1 156.4 160.7
Insurance technical reserves 46.1 48.8 50.2 49.4 49.7 50.2 50.5 50.8 51.1
Financial derivatives 22.8 24.1 27.3 25.3 22.0 27.3 23.6 22.7 22.8
Other accounts receivable 883.4 913.5 946.1 910.5 913.8 946.1 1,031.3 980.5 1,029.6
Total 3,562.8 3,856.8 3,996.4 3,727.3 3,820.8 3,996.4 4,189.0 4,132.6 4,223.5
Liabilities
Debt securities 150.9 156.8 183.8 179.0 183.0 183.8 189.7 188.1 210.2
short-term securities 1.8 3.0 2.9 5.3 4.7 2.9 8.3 7.9 5.3long-term securities 149.1 153.7 180.9 173.7 178.3 180.9 181.4 180.2 205.0
Memo itemDebt securities of domestic sectors 60.2 58.7 72.2 68.2 71.3 72.2 74.8 75.4 80.0
Non-financial corporations 4.6 3.6 4.4 4.2 4.3 4.4 5.3 4.6 4.1Financial corporations 39.8 40.0 51.9 49.1 50.9 51.9 54.4 55.9 61.0General government 0.1 0.1 0.1 0.1 0.1 0.1 0.1 0.1 0.1Households 15.8 15.0 15.7 14.9 15.9 15.7 15.0 14.8 14.8
Debt securities of the rest of the world 90.7 98.1 111.7 110.8 111.8 111.7 114.9 112.7 130.2
Loans 1,390.6 1,438.8 1,476.6 1,467.8 1,486.1 1,476.6 1,523.0 1,532.3 1,546.4short-term loans 486.5 515.5 528.7 527.5 531.9 528.7 536.5 536.3 542.8long-term loans 904.2 923.3 947.9 940.3 954.2 947.9 986.5 996.0 1,003.6
Memo itemfrom domestic sectors 1,093.9 1,110.7 1,124.3 1,123.2 1,134.7 1,124.3 1,151.6 1,159.4 1,166.6
Non-financial corporations 212.4 213.3 207.2 208.4 206.7 207.2 210.0 212.5 212.0Financial corporations 822.2 845.7 863.9 856.3 870.5 863.9 882.7 886.1 895.6General government 59.2 51.7 53.2 58.6 57.5 53.2 58.8 60.8 59.0
from the rest of the world 296.7 328.0 352.4 344.6 351.4 352.4 371.4 372.8 379.8
Equity 2,543.6 2,673.9 2,749.3 2,490.5 2,665.4 2,749.3 2,870.5 2,889.4 2,973.8
Listed shares of domestic sectors 570.8 626.4 664.0 569.6 616.9 664.0 696.5 697.8 737.6Non-financial corporations 252.2 266.6 286.2 233.7 259.3 286.2 298.6 297.9 315.9Financial corporations 134.7 150.1 154.7 139.2 147.8 154.7 161.3 166.4 173.4General government 35.2 43.4 44.4 40.4 40.8 44.4 47.0 46.7 51.0Households 148.7 166.2 178.7 156.3 168.9 178.7 189.7 186.8 197.4
Quoted shares of the rest of the world 719.1 756.3 803.7 684.7 782.2 803.7 865.4 879.1 906.1
Other equity 1 1,253.7 1,291.2 1,281.6 1,236.2 1,266.4 1,281.6 1,308.5 1,312.4 1,330.1
Insurance technical reserves 250.3 255.9 259.5 257.7 258.6 259.5 260.4 261.3 262.2
Financial derivatives and employeestock options 51.8 42.0 38.2 46.5 50.4 38.2 35.4 32.7 31.3
Other accounts payable 981.3 1,004.1 1,035.2 988.2 995.2 1,035.2 1,060.7 1,009.6 1,044.8
Total 5,368.5 5,571.4 5,742.6 5,429.7 5,638.7 5,742.6 5,939.7 5,913.3 6,068.7
1 Including unlisted shares.

Deutsche Bundesbank
56
Monthly Report
March 2018
IX Financial accounts
3 Acquisition of financial assets and external financing of households (non-consolidated) € billion
2016 2017
Item 2014 2015 2016 Q2 Q3 Q4 Q1 Q2 Q3
Acquisition of financial assets
Currency and deposits 85.82 96.67 114.98 29.09 24.75 52.40 12.35 30.16 18.03
Currency 15.64 25.51 21.30 4.83 7.11 6.32 3.63 5.57 2.46
Deposits 70.18 71.16 93.68 24.26 17.63 46.09 8.72 24.59 15.57
Transferable deposits 73.84 100.96 105.26 28.09 23.41 46.52 13.26 29.95 20.65
Time deposits 8.74 − 9.22 1.28 2.16 − 1.73 0.02 − 1.59 − 2.32 − 2.47
Savings deposits(including savings certifikates) − 12.41 − 20.58 − 12.87 − 5.99 − 4.05 − 0.45 − 2.96 − 3.04 − 2.61
Debt securities − 18.00 − 17.40 − 12.20 − 4.10 − 3.16 − 3.18 − 1.19 − 1.57 − 2.42
short-term debt securities − 0.67 0.75 − 0.10 − 0.62 0.10 0.33 0.38 0.20 − 0.33long-term debt securities − 17.33 − 18.16 − 12.10 − 3.48 − 3.26 − 3.50 − 1.57 − 1.77 − 2.09
Memo itemDebt securities of domestic sectors − 15.08 − 9.34 − 3.81 − 1.57 − 1.74 − 1.58 0.11 − 0.72 − 1.92
Non-financial corporations 0.02 0.39 0.02 − 0.59 0.03 − 0.09 − 0.65 − 0.20 − 0.25Financial corporations − 12.52 − 6.80 − 2.22 − 0.36 − 1.29 − 1.31 1.08 − 0.23 − 1.49General government − 2.58 − 2.93 − 1.61 − 0.63 − 0.48 − 0.18 − 0.33 − 0.28 − 0.18
Debt securities of the rest of the world − 2.93 − 8.06 − 8.39 − 2.53 − 1.42 − 1.60 − 1.30 − 0.86 − 0.50
Equity and investment fund shares 36.87 46.39 42.23 11.57 10.20 4.79 10.62 12.07 14.56
Equity 12.17 15.03 18.16 5.22 3.35 − 0.67 1.86 1.96 5.53
Listed Shares of domestic sectors 4.61 4.06 6.49 2.69 0.25 − 3.03 − 0.70 − 0.67 1.54
Non-financial corporations 2.69 3.77 3.22 0.69 − 0.30 − 1.69 − 0.36 − 1.43 1.00Financial corporations 1.93 0.28 3.28 2.00 0.55 − 1.33 − 0.33 0.76 0.54
Quoted shares of the rest of the world 3.70 6.75 6.83 1.21 2.08 1.88 1.78 1.96 2.65
Other equity 1 3.86 4.22 4.83 1.32 1.02 0.47 0.77 0.66 1.34
Investment fund shares 24.70 31.36 24.07 6.35 6.86 5.46 8.76 10.12 9.03
Money market fund shares − 0.34 − 0.57 − 0.52 − 0.15 0.10 − 0.17 − 0.22 0.04 − 0.16Non-MMF investment fund shares 25.04 31.93 24.60 6.50 6.76 5.63 8.98 10.08 9.19
Non-life insurance technical reservesand provision for calls under standardisedguarantees 22.85 20.09 19.58 3.65 3.79 8.01 2.85 2.87 2.82
Life insurance and annuityentitlements 31.89 31.36 24.63 5.26 5.60 5.60 13.44 10.82 5.37
Pension entitlement, claims ofpension funds on pension managers,entitlements to non-pension benefits 36.84 30.85 20.63 5.14 5.40 1.63 7.64 4.32 6.73
Financial derivatives and employeestock options 0.00 0.00 0.00 0.00 0.00 0.00 0.00 0.00 0.00
Other accounts receivable 2 − 34.45 − 16.59 − 9.32 − 1.20 − 3.26 − 22.50 16.16 − 6.24 1.94
Total 161.81 191.36 200.53 49.42 43.31 46.75 61.87 52.43 47.04
External financing
Loans 20.59 38.20 47.23 15.82 15.98 9.44 7.86 16.60 18.52
short-term loans − 1.98 − 3.17 − 4.31 − 0.91 − 0.93 − 2.05 − 0.35 − 0.34 − 1.09long-term loans 22.57 41.36 51.53 16.73 16.92 11.49 8.22 16.94 19.62
Memo itemMortage loans 24.87 35.63 41.69 12.13 14.30 11.00 6.08 13.28 15.80Consumer loans 1.21 5.44 9.78 3.93 2.86 0.88 2.41 3.25 3.40Entrepreneurial loans − 5.49 − 2.88 − 4.24 − 0.24 − 1.17 − 2.44 − 0.62 0.07 − 0.68
Memo itemLoans from monetary financial institutions 18.87 39.35 42.87 13.81 15.74 8.08 7.10 15.54 16.93Loans from other financial institutions 1.72 − 1.16 4.36 2.01 0.25 1.37 0.77 1.06 1.59Loans from general government and restof the world 0.00 0.00 0.00 0.00 0.00 0.00 0.00 0.00 0.00
Financial derivatives 0.00 0.00 0.00 0.00 0.00 0.00 0.00 0.00 0.00
Other accounts payable 0.78 − 1.14 − 0.72 − 0.13 − 0.13 − 0.44 0.11 0.07 0.02
Total 21.37 37.06 46.51 15.69 15.85 9.01 7.97 16.67 18.54
1 Including unlisted shares. 2 Including accumulated interest-bearing surplus shares with insurance corporations.

Deutsche Bundesbank
57
Monthly Report
March 2018
IX Financial accounts
4 Financial assets and liabilities of households (non-consolidated) End-of-year level, end-of-quarter level; € billion
2016 2017
Item 2014 2015 2016 Q2 Q3 Q4 Q1 Q2 Q3
Financial assets
Currency and deposits 1,998.1 2,094.8 2,208.9 2,132.7 2,157.6 2,208.9 2,221.9 2,252.1 2,270.1
Currency 127.7 153.2 174.5 161.1 168.2 174.5 178.1 183.7 186.2
Deposits 1,870.4 1,941.6 2,034.4 1,971.6 1,989.5 2,034.4 2,043.8 2,068.4 2,084.0
Transferable deposits 981.4 1,082.4 1,188.0 1,117.9 1,141.5 1,188.0 1,201.2 1,231.2 1,251.8
Time deposits 256.4 246.8 248.7 250.4 248.7 248.7 247.9 245.6 243.1
Savings deposits(including savings certifikates) 632.7 612.4 597.7 603.4 599.3 597.7 594.7 591.7 589.1
Debt securities 162.2 139.8 127.4 133.5 130.6 127.4 126.7 125.4 123.6
short-term debt securities 2.1 2.9 2.7 2.3 2.4 2.7 3.1 3.2 2.9long-term debt securities 160.1 136.9 124.7 131.2 128.3 124.7 123.6 122.2 120.7
Memo itemDebt securities of domestic sectors 102.4 89.4 85.6 87.8 87.1 85.6 86.1 86.2 85.1
Non-financial corporations 14.1 13.4 13.9 13.1 14.1 13.9 13.3 13.0 12.9Financial corporations 78.7 69.5 66.7 69.0 67.8 66.7 68.2 68.9 68.1General government 9.6 6.5 5.0 5.7 5.2 5.0 4.6 4.3 4.1
Debt securities of the rest of the world 59.8 50.3 41.8 45.7 43.5 41.8 40.6 39.3 38.5
Equity and investment fund shares 951.4 1,040.7 1,107.7 1,028.6 1,068.8 1,107.7 1,155.5 1,158.1 1,192.9
Equity 508.9 555.9 589.9 540.8 563.7 589.9 614.6 610.9 632.2
Listed Shares of domestic sectors 169.7 188.9 200.8 174.6 187.9 200.8 213.0 211.1 223.7
Non-financial corporations 142.1 158.7 169.8 148.6 160.6 169.8 180.4 177.5 188.4Financial corporations 27.6 30.3 31.0 26.0 27.3 31.0 32.6 33.6 35.4
Quoted shares of the rest of the world 64.0 74.8 86.8 76.8 80.7 86.8 93.1 92.7 96.5
Other equity 1 275.3 292.2 302.4 289.4 295.1 302.4 308.5 307.1 311.9
Investment fund shares 442.5 484.8 517.8 487.8 505.1 517.8 540.9 547.2 560.7
Money market fund shares 4.0 3.4 2.8 3.0 3.0 2.8 2.7 2.8 2.6Non-MMF investment fund shares 438.5 481.4 515.0 484.7 502.1 515.0 538.2 544.4 558.1
Non-life insurance technical reservesand provision for calls under standardisedguarantees 307.2 324.3 339.9 329.9 332.8 339.9 342.7 345.6 348.4
Life insurance and annuityentitlements 885.6 919.5 947.8 935.0 941.4 947.8 961.3 972.1 977.5
Pension entitlement, claims ofpension funds on pension managers,entitlements to non-pension benefits 752.1 786.6 811.3 795.3 800.4 811.3 818.9 823.2 830.0
Financial derivatives and employeestock options 0.0 0.0 0.0 0.0 0.0 0.0 0.0 0.0 0.0
Other accounts receivable 2 35.8 37.1 35.6 36.6 36.2 35.6 35.8 36.2 36.2
Total 5,092.5 5,342.8 5,578.5 5,391.5 5,467.9 5,578.5 5,662.8 5,712.6 5,778.6
Liabilities
Loans 1,570.5 1,606.6 1,654.5 1,628.8 1,645.0 1,654.5 1,662.3 1,680.2 1,698.7
short-term loans 64.6 60.9 56.6 59.6 58.6 56.6 56.3 55.9 54.8long-term loans 1,505.9 1,545.8 1,597.8 1,569.2 1,586.3 1,597.8 1,606.1 1,624.3 1,643.9
Memo itemMortage loans 1,118.0 1,153.8 1,195.6 1,170.3 1,184.6 1,195.6 1,201.7 1,218.0 1,234.4Consumer loans 188.9 191.9 201.8 197.8 200.9 201.8 204.2 207.4 210.6Entrepreneurial loans 263.6 260.9 257.0 260.7 259.5 257.0 256.4 254.8 253.8
Memo itemLoans from monetary financial institutions 1,477.6 1,514.9 1,558.3 1,534.3 1,550.2 1,558.3 1,565.4 1,582.3 1,599.2Loans from other financial institutions 92.9 91.8 96.1 94.5 94.8 96.1 96.9 98.0 99.6Loans from general government and restof the world 0.0 0.0 0.0 0.0 0.0 0.0 0.0 0.0 0.0
Financial derivatives 0.0 0.0 0.0 0.0 0.0 0.0 0.0 0.0 0.0
Other accounts payable 16.5 15.1 14.9 15.8 16.0 14.9 16.0 15.6 15.9
Total 1,587.0 1,621.7 1,669.4 1,644.6 1,661.0 1,669.4 1,678.3 1,695.8 1,714.6
1 Including unlisted shares. 2 Including accumulated interest-bearing surplus shares with insurance corporations.

Deutsche Bundesbank
58
Monthly Report
March 2018
X Public finances in Germany 1 General government: deficit/surplus and debt level as defined in the Maastricht Treaty
Social SocialGeneral Central State Local security General Central State Local securitygovernment government government government funds government government government government funds
Period € billion as a percentage of GDP
Deficit/surplus1
2011 − 25.9 − 29.4 − 11.4 − 0.3 + 15.3 − 1.0 − 1.1 − 0.4 − 0.0 + 0.62012 − 0.9 − 16.1 − 5.5 + 2.2 + 18.4 − 0.0 − 0.6 − 0.2 + 0.1 + 0.72013 − 4.0 − 7.4 − 2.5 + 0.5 + 5.4 − 0.1 − 0.3 − 0.1 + 0.0 + 0.22014 p + 9.5 + 8.7 − 1.1 − 1.2 + 3.2 + 0.3 + 0.3 − 0.0 − 0.0 + 0.1
2015 p + 19.4 + 9.7 + 3.8 + 3.1 + 2.7 + 0.6 + 0.3 + 0.1 + 0.1 + 0.12016 p + 25.7 + 7.4 + 4.9 + 5.2 + 8.2 + 0.8 + 0.2 + 0.2 + 0.2 + 0.32017 pe + 36.6 + 1.1 + 16.2 + 8.8 + 10.5 + 1.1 + 0.0 + 0.5 + 0.3 + 0.3
2016 H1 p + 17.5 + 5.0 + 4.1 + 1.9 + 6.6 + 1.1 + 0.3 + 0.3 + 0.1 + 0.4 H2 p + 8.1 + 2.4 + 0.8 + 3.3 + 1.6 + 0.5 + 0.2 + 0.0 + 0.2 + 0.1
2017 H1 pe + 19.6 − 1.4 + 8.2 + 5.8 + 7.0 + 1.2 − 0.1 + 0.5 + 0.4 + 0.4 H2 pe + 17.0 + 2.5 + 8.0 + 2.9 + 3.6 + 1.0 + 0.2 + 0.5 + 0.2 + 0.2
Debt level2 End of year or quarter
2011 2,125.0 1,344.1 653.8 143.5 1.3 78.6 49.7 24.2 5.3 0.02012 2,202.2 1,387.9 683.5 147.5 1.2 79.8 50.3 24.8 5.3 0.02013 2,186.6 1,390.4 661.7 150.6 1.3 77.4 49.2 23.4 5.3 0.02014 p 2,187.0 1,396.5 655.0 152.0 1.4 74.6 47.6 22.3 5.2 0.0
2015 p 2,156.6 1,372.6 651.3 152.2 1.4 70.9 45.1 21.4 5.0 0.02016 p 2,140.0 1,366.8 634.0 153.4 1.1 68.1 43.5 20.2 4.9 0.0
2016 Q1 p 2,164.8 1,382.5 644.2 154.4 1.2 70.6 45.1 21.0 5.0 0.0 Q2 p 2,168.1 1,391.1 640.6 154.0 1.1 69.9 44.8 20.7 5.0 0.0 Q3 p 2,161.3 1,381.1 640.8 154.8 1.0 69.2 44.2 20.5 5.0 0.0 Q4 p 2,140.0 1,366.8 634.0 153.4 1.1 68.1 43.5 20.2 4.9 0.0
2017 Q1 p 2,113.2 1,350.9 624.0 152.1 1.2 66.5 42.5 19.6 4.8 0.0 Q2 p 2,108.0 1,353.5 617.8 151.5 0.9 65.9 42.3 19.3 4.7 0.0 Q3 p 2,102.1 1,352.8 616.7 149.8 0.8 65.1 41.9 19.1 4.6 0.0
Sources: Federal Statistical Office and Bundesbank calculations. 1 The deficit/surplus GDP ratios are based on the national output of the four preceding quarters. in accordance with ESA 2010 corresponds to the Maastricht definition. 2 Quarterly
2 General government: revenue, expenditure and deficit/surplus as shown in the national accounts*
Revenue Expenditure
of which of which
Compen- Inter- Gross Memo itemSocial con- Social sation of mediate capital Deficit/ Total tax
Period Total Taxes tributions Other Total benefits employees formation Interest Other surplus burden 1 consumption
€ billion2011 1,182.7 598.8 442.3 141.7 1,208.6 633.9 208.6 124.1 61.4 67.5 113.1 − 25.9 1,045.62012 1,220.9 624.9 454.3 141.7 1,221.8 645.5 212.3 126.5 61.5 63.1 112.8 − 0.9 1,083.72013 1,259.0 651.0 465.0 143.0 1,263.0 666.4 217.8 133.0 60.1 55.5 130.2 − 4.0 1,120.32014 p 1,308.3 674.1 482.0 152.3 1,298.8 691.0 224.0 137.4 60.0 51.2 135.2 + 9.5 1,160.7
2015 p 1,354.3 704.3 500.8 149.2 1,334.9 722.3 229.2 142.2 64.2 46.4 130.6 + 19.4 1,212.22016 p 1,414.2 739.0 523.8 151.5 1,388.6 754.9 236.5 150.0 66.8 41.6 138.8 + 25.7 1,269.62017 pe 1,474.6 773.3 548.1 153.2 1,438.0 783.5 246.5 155.3 70.3 38.9 143.5 + 36.6 1,328.3
as a percentage of GDP2011 43.8 22.2 16.4 5.2 44.7 23.4 7.7 4.6 2.3 2.5 4.2 − 1.0 38.72012 44.3 22.7 16.5 5.1 44.3 23.4 7.7 4.6 2.2 2.3 4.1 − 0.0 39.32013 44.5 23.0 16.5 5.1 44.7 23.6 7.7 4.7 2.1 2.0 4.6 − 0.1 39.62014 p 44.6 23.0 16.4 5.2 44.3 23.6 7.6 4.7 2.0 1.7 4.6 + 0.3 39.6
2015 p 44.5 23.1 16.5 4.9 43.9 23.7 7.5 4.7 2.1 1.5 4.3 + 0.6 39.82016 p 45.0 23.5 16.7 4.8 44.2 24.0 7.5 4.8 2.1 1.3 4.4 + 0.8 40.42017 pe 45.2 23.7 16.8 4.7 44.1 24.0 7.6 4.8 2.2 1.2 4.4 + 1.1 40.7
Percentage growth rates2011 + 6.5 + 7.7 + 3.8 + 10.7 − 0.9 − 0.1 + 2.5 + 5.1 + 3.3 + 5.7 − 19.2 . + 6.02012 + 3.2 + 4.4 + 2.7 + 0.0 + 1.1 + 1.8 + 1.8 + 2.0 + 0.2 − 6.5 − 0.3 . + 3.62013 + 3.1 + 4.2 + 2.4 + 1.0 + 3.4 + 3.2 + 2.6 + 5.1 − 2.2 − 12.0 + 15.4 . + 3.42014 p + 3.9 + 3.6 + 3.6 + 6.4 + 2.8 + 3.7 + 2.9 + 3.3 − 0.3 − 7.7 + 3.9 . + 3.6
2015 p + 3.5 + 4.5 + 3.9 − 2.0 + 2.8 + 4.5 + 2.3 + 3.5 + 7.0 − 9.3 − 3.4 . + 4.42016 p + 4.4 + 4.9 + 4.6 + 1.6 + 4.0 + 4.5 + 3.2 + 5.5 + 4.1 − 10.4 + 6.2 . + 4.72017 pe + 4.3 + 4.7 + 4.6 + 1.1 + 3.6 + 3.8 + 4.2 + 3.6 + 5.1 − 6.4 + 3.4 . + 4.6
Source: Federal Statistical Office. * Figures in accordance with ESA 2010. 1 Taxes and lution Fund established at the European level. social contributions plus customs duties and levies from banks to the Single Reso-

Deutsche Bundesbank
59
Monthly Report
March 2018
X Public finances in Germany 3 General government: budgetary development (as per government’s financial statistics) € billion
Central, state and local government 1 Social security funds 2 General government, total
Revenue Expenditure
of which of which 3
Finan- Person- Fixed Finan-cial nel asset cialtransac- expend- Current forma- transac- Deficit / Rev- Expend- Deficit / Rev- Expend- Deficit /
Period Total 4 Taxes tions 5 Total 4 iture grants Interest tion tions 5 surplus enue 6 iture surplus enue iture surplus
2011 689.6 573.4 22.8 711.6 194.3 301.3 56.8 38.5 13.7 − 22.0 526.3 511.2 + 15.1 1,104.2 1,111.1 − 6.9
2012 p 745.0 600.0 14.7 770.2 218.8 285.2 69.9 42.6 25.5 − 25.2 536.2 518.8 + 17.4 1,171.1 1,178.8 − 7.8
2013 p 761.8 619.7 14.7 773.6 225.3 286.9 65.7 42.8 23.5 − 11.8 536.7 531.9 + 4.9 1,198.1 1,205.0 − 6.9
2014 p 791.8 643.6 11.3 786.7 236.0 292.9 57.1 45.9 17.6 + 5.1 554.5 551.1 + 3.5 1,245.3 1,236.7 + 8.6
2015 p 829.5 673.3 10.4 804.1 244.1 302.6 49.8 46.4 12.5 + 25.5 575.0 573.1 + 1.9 1,300.8 1,273.4 + 27.4
2016 p 862.1 705.8 9.0 843.3 251.3 320.5 43.4 49.0 11.8 + 18.8 601.5 594.6 + 6.9 1,354.7 1,329.0 + 25.7
2015 Q1 p 196.0 160.9 2.4 198.8 58.5 80.5 18.4 7.7 2.5 − 2.8 137.3 142.8 − 5.4 307.6 315.8 − 8.2
Q2 p 208.4 167.7 1.5 185.2 59.5 72.8 7.2 9.1 3.0 + 23.1 142.4 142.3 + 0.1 325.0 301.8 + 23.2
Q3 p 202.8 166.5 3.8 198.0 62.3 71.3 16.6 11.6 3.4 + 4.7 141.2 143.4 − 2.1 318.1 315.5 + 2.6
Q4 p 221.5 178.2 2.6 219.3 63.4 77.4 7.3 17.3 3.5 + 2.2 152.7 145.3 + 7.4 348.4 338.8 + 9.6
2016 Q1 p 205.7 169.9 1.4 206.5 60.2 81.5 17.7 8.4 2.2 − 0.8 143.0 146.6 − 3.6 321.8 326.2 − 4.5
Q2 p 216.7 176.6 2.4 194.1 60.7 77.7 5.4 10.4 2.4 + 22.7 148.7 147.0 + 1.7 338.5 314.2 + 24.3
Q3 p 207.1 169.3 2.9 210.9 62.0 79.3 14.5 12.3 2.4 − 3.8 148.3 149.7 − 1.4 328.2 333.4 − 5.2
Q4 p 233.1 189.2 2.1 232.3 68.0 82.3 7.7 17.2 4.8 + 0.9 160.1 152.2 + 7.8 365.8 357.1 + 8.7
2017 Q1 p 215.6 180.4 0.9 200.9 63.1 80.9 13.8 10.2 1.9 + 14.6 150.3 155.1 − 4.8 337.5 327.7 + 9.8
Q2 p 217.9 177.3 1.2 206.7 63.9 83.6 6.6 8.8 3.6 + 11.3 156.4 154.3 + 2.1 346.1 332.8 + 13.4
Q3 p 292.6 180.4 3.5 221.0 64.4 78.6 14.5 13.4 4.2 + 71.6 154.8 155.7 − 0.9 419.1 348.4 + 70.6
Source: Bundesbank calculations based on Federal Statistical Office data. 1 Annual fig- latter are all provisional. The quarterly figures for some insurance sectors are esti-ures based on the calculations of the Federal Statistical Office. Bundesbank supple- mated. 3 The development of the types of expenditure recorded here is influenced inmentary estimations for the reporting years after 2011 that are not yet available. The part by statistical changeovers. 4 Including discrepancies in clearing transactions be-quarterly figures contain numerous off-budget entities which are assigned to the tween central, state and local government. 5 On the revenue side, this contains pro-general government sector as defined in the national accounts but are not yet in- ceeds booked as disposals of equity interests and as loan repayments. On the expend-cluded in the annual calculations. From 2012, also including the bad bank iture side, this contains the acquisition of equity interests and loans granted. 6 In-FMSW. 2 The annual figures do not tally with the sum of the quarterly figures, as the cluding central government liquidity assistance to the Federal Employment Agency.
4 Central, state and local government: budgetary development (as per government’s financial statistics) € billion
Central government State government 2,3 Local government 3
Period Revenue 1 Expenditure Deficit / surplus Revenue Expenditure Deficit / surplus Revenue Expenditure Deficit / surplus
2011 307.1 324.9 − 17.7 286.5 295.9 − 9.4 183.9 184.9 − 1.0
2012 p 312.5 335.3 − 22.8 311.0 316.1 − 5.1 200.0 198.5 + 1.5
2013 p 313.2 335.6 − 22.4 324.3 323.9 + 0.4 207.6 206.3 + 1.3
2014 p 322.9 323.3 − 0.3 338.3 336.1 + 2.1 218.7 218.7 − 0.1
2015 p 338.3 326.5 + 11.8 355.1 350.6 + 4.5 232.7 229.1 + 3.6
2016 p 344.7 338.4 + 6.2 381.1 372.4 + 8.8 248.9 243.1 + 5.8
2015 Q1 p 74.4 81.6 − 7.1 84.2 84.5 − 0.3 46.3 52.1 − 5.8
Q2 p 86.5 72.6 + 13.9 87.0 83.6 + 3.4 58.1 53.4 + 4.7
Q3 p 85.9 89.0 − 3.2 87.8 84.2 + 3.6 57.5 56.3 + 1.2
Q4 p 91.5 83.4 + 8.1 94.1 96.8 − 2.8 69.0 65.9 + 3.0
2016 Q1 p 81.1 83.6 − 2.5 90.5 88.2 + 2.4 49.0 55.1 − 6.1
Q2 p 87.5 73.6 + 13.8 92.7 88.2 + 4.4 61.1 57.9 + 3.2
Q3 p 85.2 88.6 − 3.5 91.5 90.0 + 1.5 60.7 60.7 + 0.1
Q4 p 90.9 92.5 − 1.6 104.3 104.4 − 0.0 76.3 68.0 + 8.3
2017 Q1 p 88.2 84.6 + 3.5 95.6 90.0 + 5.6 52.7 57.7 − 4.9
Q2 p 81.5 80.1 + 1.4 96.3 93.6 + 2.7 65.0 59.5 + 5.5
Q3 p 88.6 93.6 − 5.0 98.9 91.4 + 7.5 136.4 66.6 + 69.7
Source: Bundesbank calculations based on Federal Statistical Office data. 1 Any assigned to the general government sector. Annual figures up to and including 2011:amounts of the Bundesbank’s profit distribution exceeding the reference value that excluding off-budget entities, but including special accounts and special purposewere used to repay parts of the debt of central government’s special funds are not in- associations based on the calculations of the Federal Statistical Office. For the follow-cluded here. 2 Including the local authority level of the city-states Berlin, Bremen and ing years, Bundesbank supplementary estimations. Hamburg. 3 Quarterly data of core budgets and off-budget entities which are

Deutsche Bundesbank
60
Monthly Report
March 2018
X Public finances in Germany 5 Central, state and local government: tax revenue € million
Central and state government and European Union
Memo itemBalance of Amounts deducted
Central State Local untransferred in the federalPeriod Total Total government 1 government 1 European Union 2 government 3 tax shares 4 budget 5
2011 573,352 496,738 276,598 195,676 24,464 76,570 + 43 28,615
2012 600,046 518,963 284,801 207,846 26,316 81,184 − 101 28,498
2013 619,708 535,173 287,641 216,430 31,101 84,274 + 262 27,775
2014 643,624 556,008 298,518 226,504 30,986 87,418 + 198 27,772
2015 673,276 580,485 308,849 240,698 30,938 93,003 − 212 27,241
2016 705,791 606,965 316,854 260,837 29,273 98,679 + 148 27,836
2017 ... 629,458 336,730 271,046 21,682 ... ... 27,390
2016 Q1 170,358 144,841 74,113 61,972 8,755 17,121 + 8,396 6,488
Q2 176,879 152,042 82,184 64,684 5,175 25,205 − 368 6,512
Q3 169,374 145,700 76,638 61,573 7,489 23,839 − 165 7,584
Q4 189,180 164,382 83,919 72,608 7,855 32,513 − 7,715 7,253
2017 Q1 181,506 154,154 85,256 66,704 2,194 17,950 + 9,403 6,606
Q2 177,090 149,915 76,391 66,605 6,918 27,631 − 456 6,825
Q3 180,407 155,250 82,576 66,718 5,957 25,517 − 361 7,467
Q4 ... 170,139 92,507 71,019 6,613 ... ... 6,493
2017 Jan . 43,321 26,142 19,611 − 2,431 . . 2,202
2018 Jan . 44,363 23,285 20,388 691 . . p 2,136
Sources: Federal Ministry of Finance, Federal Statistical Office and Bundesbank calcu- government tax revenue. 3 Including local government taxes in the city-states Berlin,lations. 1 Before deducting or adding supplementary central government grants, Bremen and Hamburg. Including revenue from offshore wind farms. 4 Difference be-regionalisation funds (local public transport), compensation for the transfer of motor tween local government’s share in the joint taxes received by the state governmentvehicle tax to central government and consolidation assistance, which central govern- cash offices in the period in question (see Table X. 6) and the amounts passed on toment remits to state government. See the last column for the volume of these local government in the same period. 5 Volume of the positions mentioned underamounts which are deducted from tax revenue in the federal budget. 2 Custom footnote 1. duties and shares in VAT and gross national income accruing to the EU from central
6 Central and state government and European Union: tax revenue, by type € million
Joint taxesMemo
Income taxes 2 Turnover taxes 5 itemLocal
Local govern-Invest- business Central State ment
Assessed ment Turnover tax govern- govern- EU share inWage income Corpora- income Turnover tax on trans- ment ment customs joint
Period Total 1 Total tax 3 tax tion tax tax 4 Total tax imports fers 6 taxes 7 taxes 7 duties taxes
2011 527,255 213,534 139,749 31,996 15,634 26,155 190,033 138,957 51,076 6,888 99,133 13,095 4,571 30,517
2012 551,785 231,555 149,065 37,262 16,934 28,294 194,635 142,439 52,196 7,137 99,794 14,201 4,462 32,822
2013 570,213 245,909 158,198 42,280 19,508 25,923 196,843 148,315 48,528 7,053 100,454 15,723 4,231 35,040
2014 593,039 258,875 167,983 45,613 20,044 25,236 203,110 154,228 48,883 7,142 101,804 17,556 4,552 37,031
2015 620,287 273,258 178,891 48,580 19,583 26,204 209,921 159,015 50,905 7,407 104,204 20,339 5,159 39,802
2016 648,309 291,492 184,826 53,833 27,442 25,391 217,090 165,932 51,157 7,831 104,441 22,342 5,113 41,345
2017 674,598 312,462 195,524 59,428 29,259 28,251 226,355 170,498 55,856 8,580 99,934 22,205 5,063 45,141
2016 Q1 154,892 70,790 42,583 14,569 8,433 5,204 54,408 42,268 12,141 173 22,553 5,673 1,294 10,051
Q2 162,096 74,489 45,311 12,943 7,329 8,905 52,705 40,195 12,510 1,957 25,783 5,952 1,210 10,054
Q3 155,524 68,137 44,656 11,898 5,546 6,037 53,906 40,877 13,029 2,046 24,857 5,263 1,316 9,824
Q4 175,797 78,076 52,275 14,422 6,134 5,245 56,071 42,593 13,478 3,656 31,247 5,454 1,293 11,415
2017 Q1 165,352 76,990 45,309 17,009 8,511 6,161 57,502 44,196 13,306 438 23,364 5,834 1,224 11,198
Q2 161,036 78,178 48,256 14,825 7,872 7,225 54,243 39,885 14,358 2,059 19,868 5,407 1,281 11,121
Q3 165,923 75,218 47,253 12,720 6,034 9,211 56,481 42,571 13,911 2,214 25,114 5,580 1,315 10,673
Q4 182,288 82,077 54,707 14,873 6,843 5,654 58,128 43,846 14,282 3,868 31,587 5,384 1,243 12,149
2017 Jan 46,576 20,360 16,435 977 318 2,629 18,771 14,599 4,172 207 4,984 1,892 362 3,255
2018 Jan 47,874 21,863 17,305 985 773 2,800 19,073 14,865 4,207 85 4,552 1,959 343 3,511
Source: Federal Ministry of Finance and Bundesbank calculations. 1 This total, unlike deducting child benefit and subsidies for supplementary private pensionthat in Table X. 5, does not include the receipts from the equalisation of burdens plans. 4 Final withholding tax on interest income and capital gains, non-assessedlevies, local business tax (less local business tax transfers to central and state govern- taxes on earnings. 5 The allocation of revenue to central, state and local govern-ment), real property taxes and other local government taxes, or the balance of un- ment, which is adjusted at more regular intervals, is regulated in section 1 of the Rev-transferred tax shares. 2 Respective percentage share of central, state and local enue Adjustment Act. Respective percentage share of central, state and local govern-government in revenue: wage tax and assessed income tax 42.5:42.5:15, corpor- ment in revenue for 2017: 50.7:46.6:2.7. The EU share is deducted from centralation tax and non-assessed taxes on earnings 50:50:-, final withholding tax on inter- government’s share. 6 Respective percentage share of central and state governmentest income and capital gains, non-assessed taxes on earnings 44:44:12. 3 After for 2017: 22.6:77.4. 7 For the breakdown, see Table X. 7.

Deutsche Bundesbank
61
Monthly Report
March 2018
X Public finances in Germany 7 Central, state and local government: individual taxes € million
Central government taxes 1 State government taxes 1 Local government taxes
Tax on of whichthe acqui- Betting
Soli- Motor sition of Inherit- and Local RealEnergy darity Tobacco Insurance vehicle Electri- Alcohol land and ance lottery business property
Period tax surcharge tax tax tax city tax tax Other buildings tax tax Other Total tax 2 taxes
2011 40,036 12,781 14,414 10,755 8,422 7,247 2,149 3,329 6,366 4,246 1,420 1,064 52,984 40,424 11,674
2012 39,305 13,624 14,143 11,138 8,443 6,973 2,121 4,047 7,389 4,305 1,432 1,076 55,398 42,345 12,017
2013 39,364 14,378 13,820 11,553 8,490 7,009 2,102 3,737 8,394 4,633 1,635 1,060 56,549 43,027 12,377
2014 39,758 15,047 14,612 12,046 8,501 6,638 2,060 3,143 9,339 5,452 1,673 1,091 57,728 43,763 12,691
2015 39,594 15,930 14,921 12,419 8,805 6,593 2,070 3,872 11,249 6,290 1,712 1,088 60,396 45,752 13,215
2016 40,091 16,855 14,186 12,763 8,952 6,569 2,070 2,955 12,408 7,006 1,809 1,119 65,313 50,097 13,654
2017 41,022 17,953 14,399 13,269 8,948 6,944 2,094 − 4,695 13,139 6,114 1,837 1,115 ... ... ...
2016 Q1 4,620 3,979 2,722 5,946 2,489 1,685 565 547 3,217 1,668 451 336 15,639 12,090 3,121
Q2 9,860 4,470 4,139 2,269 2,366 1,515 473 691 2,952 2,283 451 267 16,740 12,635 3,715
Q3 10,149 3,938 3,010 2,510 2,198 1,641 499 911 3,050 1,501 446 266 15,896 11,699 3,794
Q4 15,461 4,468 4,315 2,038 1,899 1,728 532 806 3,189 1,554 460 251 17,039 13,673 3,024
2017 Q1 4,812 4,324 2,637 6,178 2,536 1,746 578 553 3,359 1,641 490 343 16,593 12,905 3,228
Q2 10,091 4,809 3,634 2,353 2,374 1,784 476 − 5,652 3,129 1,538 474 265 18,113 13,881 3,832
Q3 10,497 4,144 3,867 2,669 2,132 1,628 502 −324 3,394 1,497 417 273 16,698 12,443 3,824
Q4 15,622 4,677 4,261 2,070 1,906 1,786 538 727 3,257 1,438 456 233 ... ... ...
2017 Jan 277 1,129 432 1,361 883 526 214 163 1,106 521 192 75 . . .
2018 Jan 279 1,222 332 834 905 586 221 174 1,223 486 174 76 . . .
Sources: Federal Ministry of Finance, Federal Statistical Office and Bundesbank calcu-lations. 1 For the sum total, see Table X. 6. 2 Including revenue from offshore wind farms.
8 German pension insurance scheme: budgetary development and assets*
€ million
Revenue 1,2 Expenditure 1,2 Assets 1,4
of which of whichEquity
Payments interests, Memofrom Pen- mort- itemcentral sioners’ gages Adminis-
Contri- govern- Pension health Deficit/ and other Real trativePeriod Total butions 3 ment Total payments insurance surplus Total Deposits 5 Securities loans 6 estate assets
2011 254,968 177,424 76,200 250,241 212,602 15,015 + 4,727 24,965 22,241 2,519 88 117 4,379
2012 259,700 181,262 77,193 254,604 216,450 15,283 + 5,096 30,481 28,519 1,756 104 102 4,315
2013 260,166 181,991 77,067 258,268 219,560 15,528 + 1,898 33,114 29,193 3,701 119 100 4,250
2014 269,115 189,080 78,940 265,949 226,204 15,978 + 3,166 36,462 32,905 3,317 146 94 4,263
2015 276,129 194,486 80,464 277,717 236,634 16,705 − 1,588 35,556 32,795 2,506 167 88 4,228
2016 286,399 202,249 83,154 288,641 246,118 17,387 − 2,242 34,094 31,524 2,315 203 52 4,147
2017 p 299,134 211,411 86,875 298,927 255,601 18,022 + 207 35,362 33,750 1,335 224 53 4,045
2015 Q1 65,923 45,653 20,025 68,435 58,671 4,125 − 2,512 34,084 31,583 2,262 148 92 4,255
Q2 68,700 48,483 19,945 68,443 58,390 4,113 + 257 34,319 31,797 2,276 152 93 4,254
Q3 67,538 47,280 20,006 70,165 59,931 4,228 − 2,627 32,246 29,722 2,276 156 92 4,259
Q4 73,393 53,096 19,971 70,326 59,963 4,233 + 3,067 35,574 32,794 2,506 158 117 4,242
2016 Q1 68,182 47,397 20,665 70,076 60,143 4,239 − 1,894 33,865 31,194 2,406 179 86 4,223
Q2 71,291 50,372 20,548 70,418 60,097 4,238 + 873 34,427 31,892 2,265 183 87 4,220
Q3 70,218 49,333 20,670 73,782 63,081 4,453 − 3,564 31,412 28,776 2,365 187 84 4,213
Q4 76,136 55,171 20,733 74,016 63,117 4,450 + 2,120 34,088 31,529 2,315 192 53 4,161
2017 Q1 71,301 49,388 21,715 73,731 63,263 4,460 − 2,430 31,660 29,133 2,270 205 52 4,140
Q2 74,581 52,739 21,632 73,785 63,016 4,440 + 796 32,535 30,372 1,901 210 52 4,136
Q3 73,295 51,374 21,738 75,569 64,628 4,560 − 2,274 30,801 28,831 1,701 214 54 4,115
Q4 79,956 57,910 21,790 75,842 64,694 4,562 + 4,114 35,362 33,750 1,335 224 53 4,045
Sources: Federal Ministry of Labour and Social Affairs and German pension insurance sequently. 2 Including financial compensation payments. Excluding investment spend-scheme. * Excluding the German pension insurance scheme for the mining, railway ing and proceeds. 3 Including contributions for recipients of government cash bene-and maritime industries. 1 The final annual figures generally differ from the total of fits. 4 Largely corresponds to the sustainability reserves. End of year or quarter. 5 In-the reported provisional quarterly figures as the latter are not revised sub- cluding cash. 6 Excluding loans to other social security funds.

Deutsche Bundesbank
62
Monthly Report
March 2018
X Public finances in Germany 9 Federal Employment Agency: budgetary development*
€ million
Revenue ExpenditureDeficit
of which of which offsettinggrant or
Adminis- loan fromInsolvency Central Unemploy- Short-time Re- Insolvency trative central
Contri- compen- government ment working Job integration benefit expend- Deficit/ govern-Period Total 1 butions sation levy subscriptions Total benefit 2 benefits 3 promotion 4 payment 5 payment iture 6 surplus ment
2011 37,563 25,433 37 8,046 37,524 13,776 1,324 8,369 4,510 683 5,090 + 40 −
2012 37,429 26,570 314 7,238 34,842 13,823 828 6,699 3,822 982 5,117 + 2,587 −
2013 32,636 27,594 1,224 245 32,574 15,411 1,082 6,040 . 912 5,349 + 61 −
2014 33,725 28,714 1,296 − 32,147 15,368 710 6,264 . 694 5,493 + 1,578 −
2015 35,159 29,941 1,333 − 31,439 14,846 771 6,295 . 654 5,597 + 3,720 −
2016 36,352 31,186 1,114 − 30,889 14,435 749 7,035 . 595 5,314 + 5,463 −
2017 37,819 32,501 882 − 31,867 14,055 769 7,043 . 687 6,444 + 5,952 −
2015 Q1 8,209 6,969 310 − 8,599 4,267 387 1,586 . 165 1,287 − 390 −
Q2 8,758 7,467 326 − 7,856 3,758 214 1,591 . 172 1,318 + 902 −
Q3 8,573 7,285 329 − 7,319 3,501 82 1,455 . 164 1,368 + 1,254 −
Q4 9,619 8,220 367 − 7,665 3,320 87 1,662 . 152 1,624 + 1,954 −
2016 Q1 8,376 7,271 261 − 7,984 4,083 395 1,739 . 150 984 + 393 −
Q2 8,991 7,737 278 − 7,807 3,648 203 1,847 . 147 1,288 + 1,184 −
Q3 8,877 7,609 276 − 7,349 3,428 74 1,608 . 165 1,399 + 1,529 −
Q4 10,108 8,569 299 − 7,750 3,276 77 1,841 . 134 1,642 + 2,358 −
2017 Q1 8,859 7,564 204 − 8,834 3,973 478 1,772 . 146 1,749 + 26 −
Q2 9,355 8,112 227 − 7,964 3,529 173 1,802 . 155 1,577 + 1,391 −
Q3 9,159 7,897 210 − 7,281 3,360 63 1,646 . 171 1,402 + 1,878 −
Q4 10,446 8,929 241 − 7,789 3,193 55 1,823 . 215 1,717 + 2,657 −
Source: Federal Employment Agency. * Including transfers to the civil servants’ pen- encourage job take-up, rehabilitation, compensation top-up payments and promo-sion fund. 1 Excluding central government deficit offsetting grant or loan. 2 Un- tion of business start-ups. 5 Until 2012. From 2005 to 2007: compensatoryemployment benefit in case of unemployment. 3 Including seasonal short-time amount. 6 Including collection charges to other statutory social security funds, ex-working benefits and restructuring short-time working benefits, restructuring mea- cluding administrative expenditure within the framework of the basic allowance forsures and refunds of social security contributions. 4 Vocational training, measures to job seekers.
10 Statutory health insurance scheme: budgetary development € million
Revenue 1 Expenditure 1
of which of which
Central Thera- Adminis-govern- peutical trative
Contri- ment Hospital Pharma- Medical Dental treatment Sickness expend- Deficit/Period Total butions 2 funds 3 Total treatment ceuticals treatment treatment 4 and aids benefits iture 5 surplus
2011 189,049 170,875 15,300 179,599 58,501 28,939 29,056 11,651 11,193 8,529 9,488 + 9,450
2012 193,314 176,388 14,000 184,289 60,157 29,156 29,682 11,749 11,477 9,171 9,711 + 9,025
2013 196,405 182,179 11,500 194,537 62,886 30,052 32,799 12,619 12,087 9,758 9,979 + 1,867
2014 203,143 189,089 10,500 205,589 65,711 33,093 34,202 13,028 13,083 10,619 10,063 − 2,445
2015 210,147 195,774 11,500 213,727 67,979 34,576 35,712 13,488 13,674 11,227 10,482 − 3,580
2016 223,692 206,830 14,000 222,936 70,450 35,981 37,300 13,790 14,256 11,677 11,032 + 757
2017 p 233,618 216,221 14,500 230,947 72,285 37,411 38,970 14,113 14,736 12,276 10,929 + 2,671
2015 Q1 50,407 46,846 2,875 53,255 17,532 8,554 8,961 3,379 3,216 2,935 2,360 − 2,848
Q2 51,850 48,371 2,875 53,351 17,157 8,661 8,976 3,385 3,376 2,730 2,433 − 1,501
Q3 51,888 48,472 2,875 52,884 16,899 8,621 8,808 3,262 3,398 2,732 2,508 − 996
Q4 55,872 52,085 2,875 54,124 16,553 8,773 8,998 3,449 3,618 2,834 3,102 + 1,747
2016 Q1 53,320 49,292 3,500 55,424 18,044 8,879 9,374 3,470 3,419 2,955 2,458 − 2,104
Q2 54,988 51,009 3,500 55,603 17,686 9,005 9,362 3,478 3,528 2,963 2,599 − 615
Q3 55,632 51,377 3,500 55,114 17,421 8,929 9,166 3,399 3,585 2,842 2,628 + 517
Q4 59,552 55,146 3,500 56,832 17,342 9,194 9,351 3,526 3,698 2,912 3,291 + 2,720
2017 Q1 55,809 51,632 3,625 57,716 18,632 9,215 9,807 3,559 3,516 3,173 2,514 − 1,907
Q2 57,801 53,621 3,625 57,502 17,973 9,239 9,822 3,614 3,748 3,043 2,589 + 298
Q3 57,617 53,442 3,625 57,202 17,802 9,330 9,629 3,374 3,679 2,980 2,731 + 415
Q4 62,391 57,526 3,625 58,527 17,878 9,627 9,712 3,566 3,792 3,080 3,095 + 3,865
Source: Federal Ministry of Health. 1 The final annual figures generally differ from ment. 3 Federal grant and liquidity assistance. 4 Including dentures. 5 Net, ie afterthe total of the reported provisional quarterly figures as the latter are not revised sub- deducting reimbursements for expenses for levying contributions incurred by othersequently. Excluding revenue and expenditure as part of the risk structure compen- social insurance funds. sation scheme. 2 Including contributions from subsidised low-paid part-time employ-
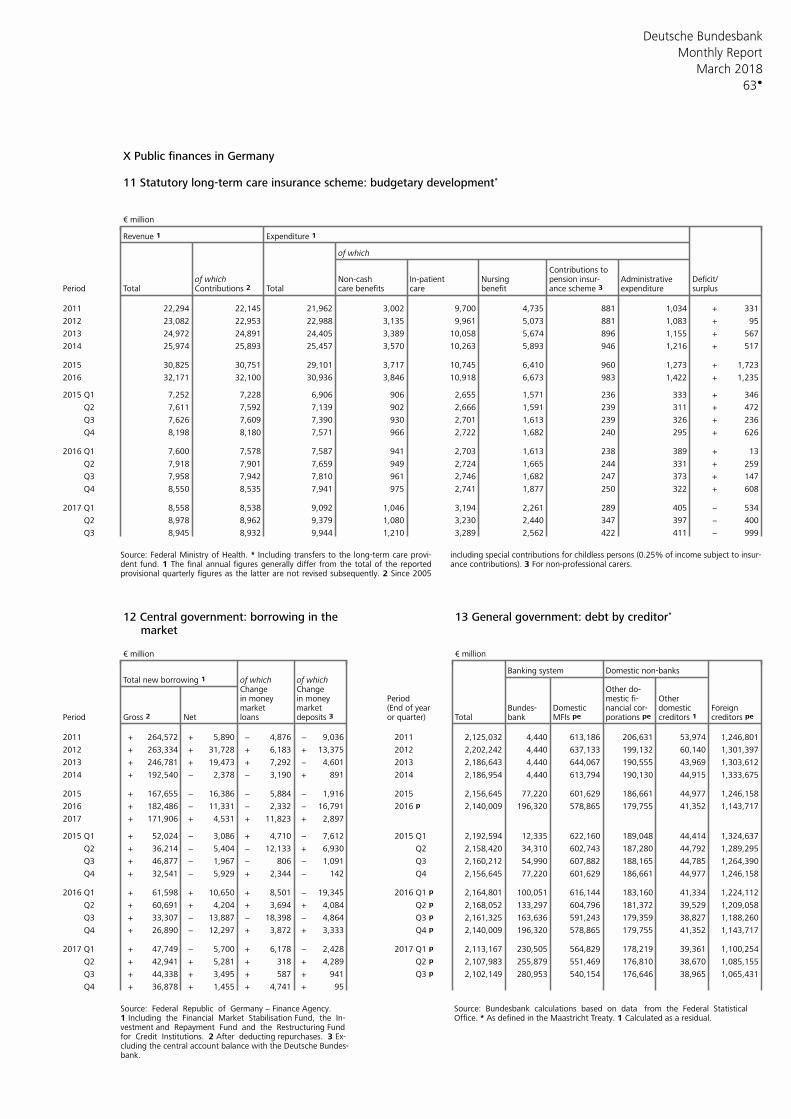
Deutsche Bundesbank
63
Monthly Report
March 2018
X Public finances in Germany 11 Statutory long-term care insurance scheme: budgetary development*
€ million
Revenue 1 Expenditure 1
of which
Contributions toof which Non-cash In-patient Nursing pension insur- Administrative Deficit/
Period Total Contributions 2 Total care benefits care benefit ance scheme 3 expenditure surplus
2011 22,294 22,145 21,962 3,002 9,700 4,735 881 1,034 + 331
2012 23,082 22,953 22,988 3,135 9,961 5,073 881 1,083 + 95
2013 24,972 24,891 24,405 3,389 10,058 5,674 896 1,155 + 567
2014 25,974 25,893 25,457 3,570 10,263 5,893 946 1,216 + 517
2015 30,825 30,751 29,101 3,717 10,745 6,410 960 1,273 + 1,723
2016 32,171 32,100 30,936 3,846 10,918 6,673 983 1,422 + 1,235
2015 Q1 7,252 7,228 6,906 906 2,655 1,571 236 333 + 346
Q2 7,611 7,592 7,139 902 2,666 1,591 239 311 + 472
Q3 7,626 7,609 7,390 930 2,701 1,613 239 326 + 236
Q4 8,198 8,180 7,571 966 2,722 1,682 240 295 + 626
2016 Q1 7,600 7,578 7,587 941 2,703 1,613 238 389 + 13
Q2 7,918 7,901 7,659 949 2,724 1,665 244 331 + 259
Q3 7,958 7,942 7,810 961 2,746 1,682 247 373 + 147
Q4 8,550 8,535 7,941 975 2,741 1,877 250 322 + 608
2017 Q1 8,558 8,538 9,092 1,046 3,194 2,261 289 405 − 534
Q2 8,978 8,962 9,379 1,080 3,230 2,440 347 397 − 400
Q3 8,945 8,932 9,944 1,210 3,289 2,562 422 411 − 999
Source: Federal Ministry of Health. * Including transfers to the long-term care provi- including special contributions for childless persons (0.25% of income subject to insur-dent fund. 1 The final annual figures generally differ from the total of the reported ance contributions). 3 For non-professional carers. provisional quarterly figures as the latter are not revised subsequently. 2 Since 2005
12 Central government: borrowing in the 13 General government: debt by creditor*
market € million € million
Banking system Domestic non-banksTotal new borrowing 1 of which of which
Change Change Other do-in money in money Period mestic fi- Othermarket market (End of year Bundes- Domestic nancial cor- domestic Foreign
Period Gross 2 Net loans deposits 3 or quarter) Total bank MFIs pe porations pe creditors 1 creditors pe
2011 + 264,572 + 5,890 − 4,876 − 9,036 2011 2,125,032 4,440 613,186 206,631 53,974 1,246,801
2012 + 263,334 + 31,728 + 6,183 + 13,375 2012 2,202,242 4,440 637,133 199,132 60,140 1,301,397
2013 + 246,781 + 19,473 + 7,292 − 4,601 2013 2,186,643 4,440 644,067 190,555 43,969 1,303,612
2014 + 192,540 − 2,378 − 3,190 + 891 2014 2,186,954 4,440 613,794 190,130 44,915 1,333,675
2015 + 167,655 − 16,386 − 5,884 − 1,916 2015 2,156,645 77,220 601,629 186,661 44,977 1,246,158
2016 + 182,486 − 11,331 − 2,332 − 16,791 2016 p 2,140,009 196,320 578,865 179,755 41,352 1,143,717
2017 + 171,906 + 4,531 + 11,823 + 2,897
2015 Q1 + 52,024 − 3,086 + 4,710 − 7,612 2015 Q1 2,192,594 12,335 622,160 189,048 44,414 1,324,637
Q2 + 36,214 − 5,404 − 12,133 + 6,930 Q2 2,158,420 34,310 602,743 187,280 44,792 1,289,295
Q3 + 46,877 − 1,967 − 806 − 1,091 Q3 2,160,212 54,990 607,882 188,165 44,785 1,264,390
Q4 + 32,541 − 5,929 + 2,344 − 142 Q4 2,156,645 77,220 601,629 186,661 44,977 1,246,158
2016 Q1 + 61,598 + 10,650 + 8,501 − 19,345 2016 Q1 p 2,164,801 100,051 616,144 183,160 41,334 1,224,112
Q2 + 60,691 + 4,204 + 3,694 + 4,084 Q2 p 2,168,052 133,297 604,796 181,372 39,529 1,209,058
Q3 + 33,307 − 13,887 − 18,398 − 4,864 Q3 p 2,161,325 163,636 591,243 179,359 38,827 1,188,260
Q4 + 26,890 − 12,297 + 3,872 + 3,333 Q4 p 2,140,009 196,320 578,865 179,755 41,352 1,143,717
2017 Q1 + 47,749 − 5,700 + 6,178 − 2,428 2017 Q1 p 2,113,167 230,505 564,829 178,219 39,361 1,100,254
Q2 + 42,941 + 5,281 + 318 + 4,289 Q2 p 2,107,983 255,879 551,469 176,810 38,670 1,085,155
Q3 + 44,338 + 3,495 + 587 + 941 Q3 p 2,102,149 280,953 540,154 176,646 38,965 1,065,431
Q4 + 36,878 + 1,455 + 4,741 + 95
Source: Federal Republic of Germany − Finance Agency. Source: Bundesbank calculations based on data from the Federal Statistical 1 Including the Financial Market Stabilisation Fund, the In- Office. * As defined in the Maastricht Treaty. 1 Calculated as a residual. vestment and Repayment Fund and the Restructuring Fund for Credit Institutions. 2 After deducting repurchases. 3 Ex- cluding the central account balance with the Deutsche Bundes- bank.

Deutsche Bundesbank
64
Monthly Report
March 2018
X Public finances in Germany 14 Central, state and local government: debt by category*
€ million
Loans from non-banks Old debtDirect
Treasury Five-year lendingPeriod discount Federal Federal Federal by credit Social Equal-(End of year paper Treasury notes savings bonds institu- security isationor quarter) Total (Bubills) 1 notes 2,3 (Bobls) 2 notes (Bunds) 2 Day-bond tions 4 funds Other 4 claims 5 Other 5,6
Central, state and local government
2011 1,751,730 60,272 414,250 214,211 8,208 644,894 2,154 289,426 102 113,773 4,440 22012 1,791,656 57,172 417,470 234,355 6,818 667,198 1,725 288,133 70 114,272 4,440 22013 1,815,991 50,129 423,442 245,372 4,488 684,951 1,397 289,725 41 112,005 4,440 22014 1,817,244 27,951 429,633 259,186 2,375 703,812 1,187 275,582 42 113,035 4,440 2
2015 Q1 1,821,383 28,317 425,257 250,432 2,271 707,905 1,155 289,247 42 112,315 4,440 2 Q2 1,806,631 29,575 421,582 243,299 2,031 722,562 1,133 269,992 42 111,974 4,440 2 Q3 1,810,827 26,213 424,534 256,613 1,677 715,763 1,106 268,390 42 112,046 4,440 2 Q4 1,804,522 19,431 429,818 246,940 1,305 725,285 1,070 261,189 59 114,983 4,440 2
2016 Q1 1,813,655 21,804 427,090 240,281 1,205 730,533 1,051 275,378 100 111,771 4,440 2 Q2 1,812,131 29,543 427,813 235,389 1,108 727,922 1,033 275,038 40 109,804 4,440 2 Q3 1,804,296 31,237 433,493 245,945 922 717,358 1,021 260,003 39 109,835 4,440 2 Q4 1,786,609 24,509 430,701 236,136 737 724,528 1,010 254,273 21 110,251 4,440 2
2017 Q1 p 1,771,555 16,098 424,930 227,906 619 730,531 995 257,179 25 108,830 4,440 2 Q2 p 1,771,333 15,759 422,682 219,668 487 745,792 986 252,719 32 108,766 4,440 2 Q3 p 1,771,735 13,206 420,721 229,519 398 743,727 977 249,827 27 108,892 4,440 2
Central government7,8
2011 1,081,304 58,297 130,648 214,211 8,208 644,513 2,154 9,382 − 9,450 4,440 22012 1,113,032 56,222 117,719 234,355 6,818 666,775 1,725 16,193 − 8,784 4,440 22013 1,132,505 50,004 110,029 245,372 4,488 684,305 1,397 23,817 − 8,652 4,440 22014 1,130,128 27,951 103,445 259,186 2,375 702,515 1,187 20,509 − 8,518 4,440 2
2015 Q1 1,127,042 26,495 102,203 250,432 2,271 706,308 1,155 25,289 − 8,448 4,440 2 Q2 1,121,637 27,535 101,090 243,299 2,031 720,715 1,133 13,021 − 8,373 4,440 2 Q3 1,119,670 24,157 98,087 256,613 1,677 713,766 1,106 11,776 − 8,046 4,440 2 Q4 1,113,741 18,536 96,389 246,940 1,305 723,238 1,070 13,825 − 7,996 4,440 2
2016 Q1 1,124,391 20,526 98,232 240,281 1,205 728,457 1,051 22,533 − 7,664 4,440 2 Q2 1,128,595 28,369 99,417 235,389 1,108 725,469 1,033 26,236 − 7,133 4,440 2 Q3 1,114,708 30,626 102,053 245,945 922 714,903 1,021 7,794 − 7,002 4,440 2 Q4 1,102,410 23,609 95,727 236,136 737 722,124 1,010 11,761 − 6,866 4,440 2
2017 Q1 1,096,711 14,910 95,148 227,906 619 727,887 995 17,829 − 6,976 4,440 2 Q2 1,101,991 14,431 93,795 219,668 487 743,120 986 18,076 − 6,986 4,440 2 Q3 1,105,486 11,851 91,893 229,519 398 741,039 977 18,420 − 6,949 4,440 2 Q4 1,106,941 10,037 91,013 218,389 289 752,052 966 22,988 − 6,767 4,440 2
State government
2011 536,696 1,975 283,601 . . . . 150,631 62 100,426 . 12012 541,237 950 299,751 . . . . 137,068 51 103,416 . 12013 545,788 125 313,412 . . . . 131,302 30 100,918 . 12014 544,612 0 326,188 . . . . 117,451 5 100,967 . 1
2015 Q1 546,975 1,821 323,055 . . . . 121,130 5 100,964 . 1 Q2 537,947 2,040 320,492 . . . . 114,816 5 100,593 . 1 Q3 543,477 2,056 326,447 . . . . 114,081 5 100,887 . 1 Q4 543,003 895 333,429 . . . . 106,720 5 101,953 . 1
2016 Q1 541,653 1,278 328,858 . . . . 113,286 5 98,225 . 1 Q2 536,101 1,173 328,397 . . . . 109,680 6 96,845 . 1 Q3 541,288 611 331,441 . . . . 112,558 6 96,672 . 1 Q4 537,009 900 334,975 . . . . 103,071 6 98,056 . 1
2017 Q1 p 529,520 1,188 329,782 . . . . 101,940 3 96,607 . 1 Q2 p 524,502 1,327 328,887 . . . . 97,768 3 96,516 . 1 Q3 p 523,024 1,355 328,828 . . . . 96,031 3 96,806 . 1
Local government9
2011 133,730 . − . . 381 . 129,412 40 3,897 . .2012 137,386 . − . . 423 . 134,872 18 2,073 . .2013 137,698 . − . . 646 . 134,606 11 2,435 . .2014 142,505 . − . . 1,297 . 137,622 37 3,549 . .
2015 Q1 147,366 . − . . 1,597 . 142,829 37 2,903 . . Q2 147,047 . − . . 1,847 . 142,155 37 3,008 . . Q3 147,680 . − . . 1,997 . 142,534 37 3,112 . . Q4 147,778 . − . . 2,047 . 140,644 54 5,033 . .
2016 Q1 147,611 . − . . 2,076 . 139,559 94 5,882 . . Q2 147,435 . − . . 2,453 . 139,122 34 5,826 . . Q3 148,300 . − . . 2,455 . 139,651 33 6,161 . . Q4 147,190 . − . . 2,404 . 139,441 15 5,330 . .
2017 Q1 p 145,325 . − . . 2,645 . 137,410 23 5,247 . . Q2 p 144,840 . − . . 2,672 . 136,875 29 5,265 . . Q3 p 143,225 . − . . 2,687 . 135,376 24 5,138 . .
Source: Bundesbank calculations based on data from the Federal Statistical ities arising from housing construction by the former GDR’s armed forces and fromOffice. * Excluding direct intergovernmental borrowing. 1 Including Treasury finan- housing construction in connection with the return of the troops of the former USSRcing paper. 2 Excluding issuers’ holdings of their own securities. 3 Treasury notes stationed in eastern Germany to their home country; excluding debt securities in ownissued by state government include long-term notes. 4 Mainly loans against bor- portfolios. 7 In contrast to the capital market statistics, the debt incurred through therowers’ notes and cash advances. Including loans raised abroad. Other loans from joint issuance of Federal securities is recorded here under central government and itsnon-banks, including loans from public supplementary pension funds and liabilities special funds in accordance with the agreed allocation ratios. 8 Including the Finan-arising from the investment assistance levy. 5 Excluding offsets against outstanding cial Market Stabilisation Fund, the Investment and Repayment Fund and the Re-claims. 6 Old debt mainly denominated in foreign currency, in accordance with the structuring Fund for Credit Institutions. 9 Including debt of municipal special purposeLondon Debts Agreement, old liabilities arising from housing construction and liabil- associations. Data other than year-end figures have been estimated.

Deutsche Bundesbank
65
Monthly Report
March 2018
XI Economic conditions in Germany
1 Origin and use of domestic product, distribution of national income
2016 2017
2015 2016 2017 2015 2016 2017 Q2 Q3 Q4 Q1 Q2 Q3 Q4
Item Index 2010=100 Annual percentage change
At constant prices, chained
I Origin of domestic productProduction sector(excluding construction) 112.8 114.9 117.9 2.2 1.9 2.7 4.5 1.2 0.6 4.5 − 0.3 2.8 3.9Construction 102.9 104.9 107.1 0.0 1.9 2.1 5.3 1.7 − 0.4 5.7 0.1 1.6 1.6Wholesale/retail trade, transportand storage, hotel and restaurantservices 108.5 111.1 114.3 0.7 2.4 2.9 4.2 1.6 2.5 4.7 2.0 2.9 2.1Information and communication 128.5 132.0 137.2 2.6 2.7 3.9 2.7 3.5 1.6 4.4 3.5 3.7 4.2Financial and insuranceactivities 104.3 107.4 107.2 − 0.7 3.0 − 0.3 3.7 4.1 2.3 0.5 − 0.7 − 0.7 − 0.1Real estate activities 103.3 103.9 105.2 0.2 0.6 1.3 0.9 0.4 0.5 1.4 0.6 1.5 1.6Business services 1 108.1 110.0 112.9 1.9 1.8 2.6 3.1 1.7 1.5 3.7 0.7 2.9 2.9Public services, education andhealth 105.3 107.7 109.9 2.2 2.2 2.1 2.6 2.3 2.4 2.6 1.9 2.2 1.7Other services 99.3 100.2 101.3 0.7 0.9 1.1 1.9 1.2 1.0 2.5 − 0.0 1.0 0.7
Gross value added 108.3 110.4 112.9 1.5 1.9 2.3 3.3 1.7 1.4 3.5 0.8 2.4 2.5
Gross domestic product 2 108.6 110.7 113.1 1.7 1.9 2.2 3.3 1.7 1.3 3.4 1.0 2.2 2.3
II Use of domestic productPrivate consumption 3 106.1 108.3 110.4 1.7 2.1 1.9 2.9 1.7 1.7 2.3 2.1 2.0 1.2Government consumption 108.0 111.9 113.7 2.9 3.7 1.6 4.3 3.4 3.0 1.7 1.4 1.6 1.6Machinery and equipment 111.1 113.4 118.0 3.9 2.2 4.0 6.4 1.4 − 2.6 3.6 1.7 4.5 6.0Premises 108.3 111.3 114.2 − 1.4 2.7 2.7 5.4 2.1 0.4 5.6 1.4 2.8 1.3Other investment 4 117.3 123.8 128.0 5.5 5.5 3.5 6.8 6.1 2.6 3.9 3.4 3.2 3.4Changes in inventories 5, 6 . . . − 0.3 − 0.2 0.1 − 0.7 0.2 0.4 − 0.1 0.4 0.2 − 0.1
Domestic demand 106.1 108.7 111.1 1.6 2.4 2.2 3.2 2.4 1.9 2.5 2.3 2.4 1.7Net exports 6 . . . 0.2 − 0.3 0.2 0.4 − 0.5 − 0.5 1.1 − 1.1 0.0 0.8
Exports 124.7 128.0 133.9 5.2 2.6 4.7 4.9 1.3 2.6 7.0 1.3 4.9 5.6Imports 120.5 125.2 131.6 5.6 3.9 5.1 5.1 2.8 4.3 5.4 4.5 5.8 4.8
Gross domestic product 2 108.6 110.7 113.1 1.7 1.9 2.2 3.3 1.7 1.3 3.4 1.0 2.2 2.3
At current prices (€ billion)
III Use of domestic productPrivate consumption 3 1,630.5 1,674.4 1,735.0 2.3 2.7 3.6 3.2 2.2 2.8 4.2 3.8 3.7 2.9Government consumption 587.1 615.4 638.7 4.1 4.8 3.8 5.4 4.5 4.1 3.5 3.4 3.9 4.2Machinery and equipment 200.8 205.8 214.6 4.7 2.5 4.3 6.7 1.7 − 2.3 3.8 2.0 4.8 6.3Premises 291.0 304.5 322.7 0.4 4.6 6.0 7.3 4.1 2.5 8.4 4.5 6.2 5.1Other investment 4 112.5 119.7 125.4 7.0 6.4 4.8 7.4 6.9 3.7 4.9 4.8 4.7 4.7Changes in inventories 5 − 21.5 − 26.4 − 21.3 . . . . . . . . . .
Domestic use 2,800.3 2,893.4 3,015.0 2.6 3.3 4.2 3.9 3.2 3.2 4.3 4.4 4.5 3.6Net exports 243.3 250.6 248.3 . . . . . . . . . .
Exports 1,426.7 1,450.0 1,542.1 6.4 1.6 6.3 3.1 − 0.0 2.3 8.7 3.5 6.4 6.9Imports 1,183.4 1,199.4 1,293.7 4.1 1.4 7.9 1.0 0.2 3.9 9.6 8.0 7.5 6.5
Gross domestic product 2 3,043.7 3,144.1 3,263.4 3.8 3.3 3.8 4.7 2.9 2.5 4.3 2.6 4.3 4.0
IV Prices (2010=100)Private consumption 106.2 106.9 108.7 0.6 0.6 1.7 0.3 0.5 1.1 1.8 1.6 1.7 1.6Gross domestic product 108.7 110.1 111.8 2.0 1.3 1.5 1.3 1.2 1.2 0.9 1.6 2.0 1.7Terms of trade 102.1 103.7 102.7 2.7 1.5 − 1.0 2.2 1.3 0.2 − 2.3 − 1.2 − 0.0 − 0.4
V Distribution of national incomeCompensation of employees 1,542.3 1,600.3 1,669.9 3.9 3.8 4.3 3.4 3.7 3.9 4.3 4.4 4.5 4.2Entrepreneurial and propertyincome 722.6 737.7 764.5 3.8 2.1 3.6 9.5 − 0.2 − 1.2 4.0 − 1.0 6.3 5.1
National income 2,264.9 2,338.0 2,434.4 3.8 3.2 4.1 5.2 2.3 2.5 4.2 2.7 5.1 4.5
Memo item: Gross nationalincome 3,099.8 3,197.2 3,323.5 3.7 3.1 3.9 4.7 2.4 2.5 4.1 2.9 4.6 4.2
Source: Federal Statistical Office; figures computed in February 2018. 1 Professional, stitutions serving households. 4 Intellectual property rights (inter alia, computer soft-scientific, technical, administration and support service activities. 2 Gross value added ware and entertainment, literary or artistic originals) and cultivated assets. 5 Includ-plus taxes on products (netted with subsidies on products). 3 Including non-profit in- ing net increase in valuables. 6 Contribution of growth to GDP.

Deutsche Bundesbank
66
Monthly Report
March 2018
XI Economic conditions in Germany
2 Output in the production sector*
Adjusted for working-day variations o
of which:
Industry
of which: by main industrial grouping of which: by economic sector
Manu-Manu- facture offacture of computers,basic metals Motorelectronicand vehicles,and optical
Production Inter- Non- fabricated products Machinery trailerssector, Construc- mediate Capital Durable durable metal and and semi-and electricaltotal tion Energy Total goods goods goods goods products equipment equipment trailers
2015=100
% of total 1 100.00 14.04 6.37 79.60 29.44 36.96 2.28 10.92 10.27 9.95 12.73 14.14
Period
2014 98.8 101.9 95.2 99.3 99.9 98.8 97.5 100.1 99.7 99.0 100.0 99.8
2015 99.8 99.7 100.1 99.7 99.8 99.7 99.7 99.8 99.8 99.7 99.7 99.72016 101.6 105.3 98.7 101.2 100.9 101.3 102.7 101.0 101.6 101.0 99.6 102.12017 x 104.9 108.7 98.8 104.8 104.9 105.0 107.0 103.2 106.2 106.9 104.2 105.3
2016 Q4 105.1 118.6 104.4 102.8 98.5 105.7 106.4 103.8 101.0 104.0 108.2 99.3
2017 Q1 98.8 84.8 104.5 100.8 102.1 99.9 106.1 99.4 103.2 102.3 95.8 105.1 Q2 104.5 111.2 93.8 104.2 105.5 104.1 105.8 100.4 107.1 104.7 101.8 106.1 Q3 106.4 116.6 92.5 105.7 107.3 104.6 106.2 105.2 107.7 109.4 103.0 105.1 Q4 x 110.1 122.3 104.5 108.4 104.8 111.5 109.7 107.6 106.9 111.2 116.1 105.0
2017 Jan 90.2 64.5 111.1 93.1 97.5 88.4 99.0 96.1 96.7 95.9 83.2 94.3 Feb 96.7 84.1 99.8 98.7 99.0 99.1 104.9 95.3 100.7 99.1 94.8 105.8 Mar 109.4 105.8 102.7 110.6 109.8 112.2 114.4 106.8 112.2 111.8 109.5 115.1
Apr 103.2 109.2 95.4 102.7 105.2 101.7 105.9 98.7 105.6 103.1 97.6 107.0 May 103.0 109.5 94.8 102.5 104.3 101.6 103.2 100.4 106.4 101.9 98.6 104.5 June 107.3 114.8 91.3 107.3 107.0 109.0 108.3 102.2 109.3 109.2 109.3 106.7
July 2 106.4 118.9 91.3 105.5 108.3 103.9 101.4 104.5 108.4 109.0 101.7 103.7 Aug 2 101.3 112.7 93.0 99.9 103.5 96.3 98.3 102.7 102.2 104.3 94.9 95.6 Sep 111.4 118.3 93.1 111.7 110.1 113.6 119.0 108.4 112.4 115.0 112.5 116.1
Oct x 109.7 121.2 102.8 108.2 109.8 106.4 113.9 109.0 112.0 109.0 102.9 108.1 Nov x 116.5 124.2 104.0 116.1 112.0 119.9 118.1 113.7 115.4 117.3 116.4 123.2 Dec x 104.2 121.5 106.8 101.0 92.5 108.3 97.0 100.0 93.2 107.4 128.9 83.8
2018 Jan x,p 95.2 67.9 106.2 99.1 102.4 95.4 101.2 102.5 100.8 103.4 92.9 97.1
Annual percentage change
2014 + 1.5 + 2.9 − 3.8 + 2.0 + 1.8 + 2.3 + 0.4 + 1.5 + 2.9 + 2.5 + 1.2 + 4.1
2015 + 1.0 − 2.2 + 5.1 + 0.4 − 0.1 + 0.9 + 2.3 − 0.3 + 0.1 + 0.7 − 0.3 − 0.12016 + 1.8 + 5.6 − 1.4 + 1.5 + 1.1 + 1.6 + 3.0 + 1.2 + 1.8 + 1.3 − 0.1 + 2.42017 x + 3.2 + 3.2 + 0.1 + 3.6 + 4.0 + 3.7 + 4.2 + 2.2 + 4.5 + 5.8 + 4.6 + 3.1
2016 Q4 + 2.1 + 5.1 + 0.8 + 1.6 + 1.4 + 1.6 + 3.9 + 1.8 + 2.3 + 2.8 + 1.5 + 1.1
2017 Q1 + 0.9 + 0.9 − 0.3 + 1.0 + 1.2 + 0.9 + 2.8 + 0.4 + 1.9 + 3.6 + 1.5 + 0.1 Q2 + 3.4 + 5.1 + 2.7 + 3.1 + 3.4 + 3.3 + 4.8 + 1.4 + 4.0 + 6.0 + 4.3 + 2.1 Q3 + 4.1 + 3.3 − 1.7 + 4.7 + 5.1 + 4.7 + 6.1 + 3.0 + 6.3 + 6.7 + 4.8 + 4.9 Q4 x + 4.8 + 3.1 + 0.2 + 5.4 + 6.3 + 5.5 + 3.0 + 3.6 + 5.8 + 6.9 + 7.3 + 5.7
2017 Jan − 0.4 − 4.2 + 1.0 − 0.1 + 1.0 − 0.7 + 3.1 − 1.7 + 1.2 + 4.1 + 1.3 − 2.4 Feb + 1.2 + 1.9 + 0.2 + 1.1 + 0.4 + 1.6 + 2.5 + 0.8 + 1.9 + 2.5 + 3.4 + 0.9 Mar + 1.8 + 3.4 − 2.0 + 1.8 + 2.0 + 1.5 + 2.9 + 2.1 + 2.7 + 4.1 + 0.1 + 1.4
Apr + 3.0 + 6.1 + 1.9 + 2.4 + 3.5 + 1.9 + 4.2 + 0.3 + 3.0 + 6.7 + 3.3 − 0.3 May + 4.7 + 5.2 + 2.9 + 4.7 + 3.4 + 6.4 + 9.8 + 1.9 + 5.8 + 7.2 + 6.4 + 7.7 June + 2.7 + 4.2 + 3.3 + 2.4 + 3.3 + 2.0 + 0.9 + 1.9 + 3.2 + 4.2 + 3.4 − 0.7
July 2 + 3.8 + 2.9 − 2.7 + 4.6 + 5.4 + 4.2 + 5.3 + 3.7 + 6.7 + 8.0 + 5.5 + 1.8 Aug 2 + 4.5 + 3.2 + 0.0 + 5.0 + 5.2 + 5.6 + 7.5 + 2.3 + 6.0 + 6.8 + 3.3 + 9.1 Sep + 3.9 + 3.9 − 2.5 + 4.4 + 4.9 + 4.4 + 5.6 + 2.9 + 6.1 + 5.4 + 5.4 + 4.5
Oct x + 2.3 + 3.8 + 0.7 + 2.2 + 4.5 + 0.7 + 2.3 + 1.6 + 5.1 + 3.0 + 3.7 − 2.6 Nov x + 5.8 + 3.8 − 1.0 + 6.6 + 6.8 + 7.1 + 4.6 + 4.3 + 4.8 + 7.1 + 5.1 + 11.8 Dec x + 6.2 + 1.8 + 0.8 + 7.8 + 8.1 + 8.7 + 2.0 + 5.0 + 8.1 + 11.0 + 12.4 + 9.1
2018 Jan x,p + 5.5 + 5.3 − 4.4 + 6.4 + 5.0 + 7.9 + 2.2 + 6.7 + 4.2 + 7.8 + 11.7 + 3.0
Source of the unadjusted figures: Federal Statistical Office. * For explanatory notes, a change in holiday dates. x Provisional; estimated and adjusted in advance by thesee Statistical Supplement Seasonally adjusted business statistics, Tables II.10 to Federal Statistical Office to the results of the Quarterly Production Survey and theII.12. o Using the Census X-12-ARIMA method, version 0.2.8. 1 Share of gross value Quarterly Survey in the specialised construction industry, respectively. added at factor cost of the production sector in the base year 2015. 2 Influenced by

Deutsche Bundesbank
67
Monthly Report
March 2018
XI Economic conditions in Germany 3 Orders received by industry *
Adjusted for working-day variations o
of which:
of which:
Industry Intermediate goods Capital goods Consumer goods Durable goods Non-durable goods
Annual Annual Annual Annual Annual Annualpercent- percent- percent- percent- percent- percent-age age age age age age
Period 2015=100 change 2015=100 change 2015=100 change 2015=100 change 2015=100 change 2015=100 change
Total
2013 95.2 + 2.4 100.0 − 0.9 92.6 + 4.6 92.5 + 2.0 95.2 + 2.4 91.7 + 2.02014 97.8 + 2.7 100.6 + 0.6 96.2 + 3.9 96.8 + 4.6 95.8 + 0.6 97.1 + 5.9
2015 99.8 + 2.0 99.8 − 0.8 99.8 + 3.7 99.8 + 3.1 99.8 + 4.2 99.9 + 2.92016 100.8 + 1.0 98.9 − 0.9 101.9 + 2.1 100.6 + 0.8 105.3 + 5.5 99.1 − 0.82017 108.1 + 7.2 109.2 + 10.4 107.7 + 5.7 106.3 + 5.7 117.1 + 11.2 102.7 + 3.6
2017 Jan 100.5 + 1.3 103.7 + 2.7 98.4 + 1.2 102.4 − 3.8 107.9 − 1.3 100.6 − 4.6 Feb 104.0 + 6.3 108.3 + 10.4 100.9 + 4.1 106.9 + 4.2 109.2 + 12.2 106.1 + 1.7 Mar 116.5 + 5.2 115.9 + 10.1 117.2 + 2.2 113.9 + 7.7 125.8 + 14.2 110.0 + 5.4
Apr 104.2 + 5.5 107.6 + 5.9 102.3 + 5.0 103.1 + 7.6 113.7 + 3.1 99.7 + 9.6 May 103.1 + 5.7 105.8 + 7.6 101.6 + 4.7 101.3 + 4.4 111.0 + 18.0 98.2 + 0.3 June 110.6 + 7.2 110.8 + 10.8 111.3 + 5.3 105.3 + 6.0 121.4 + 17.2 100.1 + 2.1
July 106.0 + 6.5 108.7 + 9.9 104.1 + 4.7 107.9 + 5.1 109.6 + 6.3 107.4 + 4.8 Aug 99.1 + 9.9 105.3 + 17.0 94.0 + 5.5 109.0 + 9.2 113.2 + 19.0 107.6 + 6.2 Sep 110.4 + 11.2 109.0 + 11.9 111.7 + 11.3 108.0 + 7.2 125.9 + 13.0 102.1 + 4.9
Oct 112.8 + 9.0 113.5 + 11.6 112.7 + 7.7 110.3 + 7.0 127.8 + 5.3 104.5 + 7.5 Nov 114.8 + 10.6 117.6 + 12.8 113.4 + 9.5 112.3 + 8.5 131.4 + 18.1 106.0 + 5.1 Dec 115.1 + 9.0 103.9 + 14.6 124.7 + 6.9 94.8 + 4.6 108.7 + 12.4 90.2 + 1.8
2018 Jan p 110.1 + 9.6 115.9 + 11.8 106.4 + 8.1 111.1 + 8.5 114.0 + 5.7 110.2 + 9.5
From the domestic market
2013 97.0 + 0.5 102.8 − 1.3 92.3 + 2.1 95.2 + 1.2 100.4 + 0.9 93.4 + 1.32014 98.1 + 1.1 101.7 − 1.1 95.2 + 3.1 97.1 + 2.0 100.4 + 0.0 96.0 + 2.8
2015 99.8 + 1.7 99.8 − 1.9 99.8 + 4.8 99.8 + 2.8 99.7 − 0.7 99.9 + 4.12016 99.8 + 0.0 97.6 − 2.2 101.9 + 2.1 98.1 − 1.7 103.1 + 3.4 96.4 − 3.52017 105.9 + 6.1 107.1 + 9.7 105.4 + 3.4 102.2 + 4.2 108.9 + 5.6 100.0 + 3.7
2017 Jan 98.5 + 0.3 101.5 + 2.0 95.9 − 1.2 98.3 + 0.1 102.0 + 1.0 97.1 − 0.2 Feb 105.4 + 7.7 109.3 + 14.1 102.3 + 3.3 104.5 + 2.0 102.0 + 4.2 105.4 + 1.2 Mar 113.7 + 4.7 112.5 + 9.2 115.9 + 1.6 105.4 + 1.9 114.5 + 0.5 102.3 + 2.5
Apr 104.0 + 3.4 105.8 + 2.7 103.9 + 4.4 94.8 + 0.7 104.4 + 0.8 91.6 + 0.8 May 100.0 + 2.7 103.4 + 7.2 97.6 − 0.6 96.2 − 0.9 99.9 + 7.7 95.0 − 3.6 June 108.3 + 7.3 105.6 + 7.5 112.0 + 7.7 99.4 + 4.1 104.3 + 5.5 97.8 + 3.6
July 107.0 + 9.2 108.0 + 9.9 106.4 + 9.1 105.1 + 5.2 103.9 + 3.3 105.5 + 5.8 Aug 101.3 + 9.5 107.4 + 17.0 95.0 + 2.8 108.1 + 10.6 109.6 + 11.0 107.6 + 10.5 Sep 107.6 + 10.9 106.2 + 13.3 109.1 + 9.5 106.0 + 7.4 121.0 + 7.0 100.9 + 7.6
Oct 110.6 + 7.3 112.3 + 10.9 109.4 + 4.3 109.0 + 7.5 128.6 + 9.0 102.3 + 6.8 Nov 112.8 + 9.0 114.0 + 10.4 111.7 + 7.6 112.8 + 10.6 127.5 + 13.9 107.8 + 9.3 Dec 101.6 + 1.8 98.9 + 13.3 106.1 − 5.6 87.1 + 0.9 89.3 + 2.8 86.3 + 0.2
2018 Jan p 106.9 + 8.5 112.5 + 10.8 103.0 + 7.4 101.4 + 3.2 103.2 + 1.2 100.8 + 3.8
From abroad
2013 93.9 + 3.9 97.1 − 0.4 92.8 + 6.2 90.5 + 2.7 91.0 + 3.6 90.4 + 2.52014 97.5 + 3.8 99.5 + 2.5 96.7 + 4.2 96.5 + 6.6 92.0 + 1.1 97.9 + 8.3
2015 99.8 + 2.4 99.8 + 0.3 99.8 + 3.2 99.8 + 3.4 99.8 + 8.5 99.8 + 1.92016 101.5 + 1.7 100.4 + 0.6 101.9 + 2.1 102.6 + 2.8 107.1 + 7.3 101.1 + 1.32017 109.8 + 8.2 111.4 + 11.0 109.0 + 7.0 109.4 + 6.6 123.8 + 15.6 104.8 + 3.7
2017 Jan 102.1 + 2.1 106.0 + 3.2 99.9 + 2.8 105.6 − 6.3 112.7 − 2.8 103.3 − 7.5 Feb 102.9 + 5.3 107.3 + 6.8 100.1 + 4.6 108.7 + 5.9 115.0 + 18.8 106.7 + 2.1 Mar 118.6 + 5.6 119.5 + 10.9 118.0 + 2.6 120.5 + 11.9 134.9 + 25.8 115.9 + 7.4
Apr 104.3 + 7.1 109.6 + 9.5 101.3 + 5.4 109.6 + 12.9 121.2 + 4.8 105.9 + 16.4 May 105.4 + 8.1 108.3 + 8.0 104.0 + 8.1 105.3 + 8.7 120.0 + 26.1 100.6 + 3.2 June 112.4 + 7.0 116.5 + 14.2 110.8 + 3.7 109.9 + 7.4 135.2 + 26.0 101.8 + 1.1
July 105.3 + 4.7 109.5 + 10.1 102.7 + 2.1 110.1 + 5.1 114.1 + 8.5 108.8 + 3.9 Aug 97.5 + 10.3 103.0 + 16.9 93.4 + 7.2 109.7 + 8.2 116.1 + 25.9 107.6 + 3.2 Sep 112.6 + 11.4 112.0 + 10.3 113.2 + 12.2 109.6 + 7.1 129.8 + 18.0 103.0 + 3.1
Oct 114.5 + 10.3 114.8 + 12.3 114.7 + 9.9 111.3 + 6.5 127.2 + 2.4 106.1 + 8.0 Nov 116.4 + 11.8 121.5 + 15.3 114.4 + 10.6 111.9 + 6.9 134.6 + 21.5 104.6 + 1.9 Dec 125.4 + 14.0 109.3 + 15.8 135.9 + 13.9 100.7 + 7.1 124.4 + 18.9 93.1 + 2.8
2018 Jan p 112.5 + 10.2 119.6 + 12.8 108.4 + 8.5 118.7 + 12.4 122.6 + 8.8 117.4 + 13.6
Source of the unadjusted figures: Federal Statistical Office. * At current prices; for ex- Tables II.14 to II.16. o Using the Census X-12-ARIMA method, version 0.2.8. planatory notes, see Statistical Supplement Seasonally adjusted business statistics,

Deutsche Bundesbank
68
Monthly Report
March 2018
XI Economic conditions in Germany 4 Orders received by construction * Adjusted for working-day variations o
Breakdown by type of construction Breakdown by client 1
Building
Housing Industrial Public sector Civil PublicTotal Total construction construction construction engineering Industry sector 2
Annual Annual Annual Annual Annual Annual Annual Annualpercent- percent- percent- percent- percent- percent- percent- percent-age age age age age age age age
Period change change change change change change change change2010 = 100 2010 = 100 2010 = 100 2010 = 100 2010 = 100 2010 = 100 2010 = 100 2010 = 100
2014 118.5 − 0.6 127.2 + 0.6 146.6 + 4.3 126.8 − 0.9 90.6 − 3.5 109.9 − 1.8 121.8 − 0.1 104.0 − 3.4
2015 124.2 + 4.8 133.6 + 5.0 165.4 + 12.8 124.3 − 2.0 98.5 + 8.7 114.8 + 4.5 122.6 + 0.7 109.2 + 5.02016 142.2 + 14.5 153.7 + 15.0 193.4 + 16.9 143.0 + 15.0 107.5 + 9.1 130.7 + 13.9 137.1 + 11.8 126.9 + 16.22017 152.2 + 7.0 164.6 + 7.1 204.0 + 5.5 153.5 + 7.3 120.3 + 11.9 139.8 + 7.0 147.1 + 7.3 136.7 + 7.7
2016 Dec 131.1 + 6.2 149.9 + 10.9 171.8 + 2.8 153.8 + 22.6 95.4 − 5.7 112.2 + 0.4 141.0 + 22.8 104.5 − 8.8
2017 Jan 113.5 + 4.7 125.0 + 6.2 154.5 + 4.7 122.5 + 15.0 74.4 − 19.1 102.1 + 2.9 124.5 + 11.8 85.9 − 4.1 Feb 130.3 + 8.0 144.3 + 14.6 176.0 + 11.6 139.1 + 20.5 97.4 + 2.9 116.2 + 0.7 127.4 + 16.3 114.8 − 2.0 Mar 179.0 + 8.7 190.4 + 13.1 243.7 + 7.2 172.2 + 17.5 139.7 + 19.4 167.7 + 4.2 165.1 + 10.1 167.3 + 8.3
Apr 165.2 + 9.4 170.4 + 9.7 204.4 + 4.4 166.7 + 17.1 114.7 + 0.6 160.0 + 9.0 154.0 + 9.7 160.9 + 11.8 May 155.5 − 1.2 162.5 − 7.7 202.3 − 3.5 143.0 − 17.7 142.1 + 20.8 148.5 + 7.1 138.5 − 11.2 154.1 + 11.7 June 173.2 + 4.8 188.1 + 3.9 238.5 + 6.9 164.4 − 5.9 159.2 + 36.3 158.4 + 6.1 156.1 − 3.3 164.6 + 13.0
July 164.0 + 7.5 167.7 + 2.5 203.9 + 4.6 159.6 + 0.7 120.4 + 2.6 160.4 + 13.2 155.1 + 7.6 157.1 + 8.8 Aug 145.3 + 4.6 152.9 + 2.9 184.9 + 0.4 142.3 + 0.5 121.5 + 22.0 137.7 + 6.6 138.9 + 4.9 135.9 + 6.7 Sep 151.8 + 5.1 163.7 + 1.3 200.0 − 11.3 148.2 + 11.3 138.2 + 14.9 140.0 + 9.9 144.9 + 11.7 139.5 + 9.8
Oct 141.2 − 2.8 152.7 − 2.7 203.3 + 4.6 131.0 − 11.5 117.8 + 6.8 129.7 − 2.9 132.5 − 8.5 125.3 − 0.6 Nov 140.7 + 10.7 158.1 + 13.2 188.6 − 0.4 157.1 + 29.0 101.3 + 6.5 123.3 + 7.7 152.9 + 22.9 108.9 + 3.9 Dec 166.7 + 27.2 199.6 + 33.2 247.3 + 43.9 196.0 + 27.4 116.3 + 21.9 134.0 + 19.4 174.7 + 23.9 126.3 + 20.9
Source of the unadjusted figures: Federal Statistical Office. * At current prices; values method, version 0.2.8. 1 Excluding housing construction orders. 2 Including roadexclusive of value-added tax; for explanatory notes, see Statistical Supplement construction. Seasonally adjusted business statistics, Table II.21. o Using the Census X-12-ARIMA
5 Retail trade turnover * Adjusted for calendar variations o
of which
in stores by enterprises main product range
Construction Retail sale ofand flooring pharmaceutical Retail sale via
Textiles, Information materials, and medical mail order housesclothing, and household goods, cosmetic or via internet
Food, beverages, foodwear and communications appliances, and toilet as well asTotal tobacco 1 leather goods equipment furniture articles other retail sale 2
At current At prices inprices year 2010 3) At current prices
Annual Annual Annual Annual Annual Annual Annual Annualpercent- percent- percent- percent- percent- percent- percent- percent-age age age age age age age age
Period change change change change change change change change2015 = 100 2010 = 100 2015 = 100 2015 = 100 2015 = 100 2015 = 100 2015 = 100 2015 = 100
2014 96.5 + 1.6 96.4 + 1.2 97.3 + 2.1 99.9 + 1.8 99.2 − 0.8 97.7 − 0.3 95.0 + 7.1 83.3 + 1.8
2015 4 100.1 + 3.7 4 100.1 + 3.8 100.2 + 3.0 100.2 + 0.3 100.2 + 1.0 100.3 + 2.7 100.0 + 5.3 4 100.0 + 20.02016 102.5 + 2.4 102.1 + 2.0 101.7 + 1.5 101.0 + 0.8 99.9 − 0.3 101.6 + 1.3 103.9 + 3.9 109.8 + 9.82017 5 107.6 + 5.0 105.2 + 3.0 105.9 + 4.1 108.2 + 7.1 106.2 + 6.3 102.9 + 1.3 107.7 + 3.7 120.4 + 9.7
2017 Jan 5 96.5 + 3.1 95.4 + 0.8 95.2 + 1.5 88.1 + 2.1 112.2 + 9.9 87.2 − 1.6 101.7 + 2.9 114.4 + 10.7 Feb 94.3 + 4.5 92.8 + 2.1 94.9 + 3.5 80.5 + 6.6 92.5 + 3.7 89.2 − 0.6 99.4 + 2.8 107.2 + 6.5 Mar 109.5 + 6.8 107.0 + 4.6 106.6 + 4.9 109.2 + 17.8 103.2 + 8.5 112.3 + 4.2 109.2 + 3.1 119.2 + 5.8
Apr 107.1 + 5.4 104.5 + 3.6 107.9 + 6.4 109.0 + 2.7 93.5 + 8.6 108.2 + 1.0 105.9 + 4.1 114.5 + 16.5 May 106.9 + 4.9 104.4 + 3.2 106.8 + 4.1 105.7 + 2.8 89.0 + 7.1 106.2 + 1.0 106.5 + 5.1 114.3 + 10.8 June 105.4 + 6.0 103.4 + 4.2 105.2 + 4.4 105.3 + 8.4 95.0 + 6.4 102.0 + 3.0 105.9 + 5.7 111.7 + 11.3
July 107.3 + 4.5 105.9 + 2.9 107.6 + 4.1 105.2 + 2.8 102.2 + 10.2 103.8 + 2.2 109.2 + 2.7 112.4 + 13.4 Aug 103.1 + 4.1 101.4 + 2.2 103.8 + 3.1 99.1 + 6.7 97.7 + 9.8 97.5 + 0.4 104.5 + 3.6 110.8 + 9.5 Sep 106.2 + 7.5 103.4 + 5.4 102.9 + 5.4 125.2 + 27.9 101.9 + 10.2 99.1 + 2.8 105.4 + 2.9 116.5 + 11.9
Oct 110.7 + 2.7 107.4 + 1.0 106.3 + 2.9 122.3 − 3.5 110.7 + 3.8 109.1 + 1.1 108.5 + 1.9 121.8 + 2.5 Nov 115.1 + 6.1 111.5 + 4.3 108.6 + 5.2 117.8 + 10.0 121.2 + 5.5 110.0 + 2.3 112.9 + 4.0 149.3 + 12.5 Dec 129.0 + 4.0 125.0 + 2.3 125.4 + 4.6 130.9 + 5.6 155.8 − 1.7 109.8 − 1.2 122.7 + 4.3 153.1 + 7.0
2018 Jan 6 100.1 + 3.7 97.6 + 2.3 98.6 + 3.6 91.8 + 4.2 108.7 − 3.1 91.0 + 4.4 105.6 + 3.8 118.6 + 3.7
Source of the unadjusted figures: Federal Statistical Office. * Excluding value-added integration of a larger online retail sales based enterprise that founded a businesstax; For explanatory notes, see Statistical Supplement Seasonally adjusted business establishment in Germany in May 2015. 5 As of January 2017, figures are provision-statistics, Table II.24. o Using the Census X-12-ARIMA method, version 0.2.8. al, and particularly uncertain in recent months due to estimates for missing reports.1 Including stalls and markets. 2 Not in stores, stalls or markets. 3 Values at current 6 Unadjusted figures partially estimated by the Federal Statistical Office. prices deflated with retail price indices in 2010 weights. 4 As of May 2015,

Deutsche Bundesbank
69
Monthly Report
March 2018
XI Economic conditions in Germany 6 Labour market *
Employment 1 Employment subject to social contributions 2 Short time workers 3 Unemployment 4
Total of which: of which: of which:
Solelyjobs
Services exempt Recipientsexcluding from of insured
Produc- temporary social unem- Unem-Temporarytion employ- employ- contri- Cyclically ployment ploy- Vacan-
Annual Annual sector ment ment butions 2 Total induced Total benefits ment cies, 4,6 Thou- percentage Thou- rate 4,5 thou-percentage
Period sands change sands change Thousands in % sands
2013 42,319 + 0.6 29,713 + 1.3 8,783 19,958 743 5,017 191 77 2,950 970 6.9 4572014 42,672 + 0.8 30,197 + 1.6 8,860 20,332 770 5,029 134 49 2,898 933 6.7 490
2015 43,069 + 0.9 30,823 + 2.1 8,938 20,840 806 4,856 130 44 2,795 859 6.4 5692016 43,638 + 1.3 31,508 + 2.2 9,028 21,407 834 4,804 128 42 2,691 822 6.1 6552017 7 44,291 7 + 1.5 8 32,228 8 + 2.3 8 9,146 8 21,975 8 868 8 4,742 ... 8 25 2,533 9 855 5.7 731
2014 Q4 42,965 + 0.8 30,614 + 1.6 8,956 20,625 796 5,018 110 46 2,738 846 6.3 510
2015 Q1 42,517 + 0.7 30,360 + 1.8 8,833 20,551 756 4,863 310 51 2,993 1,011 6.9 515 Q2 42,998 + 0.8 30,671 + 2.0 8,895 20,740 792 4,863 61 47 2,772 822 6.3 560 Q3 43,286 + 1.0 30,928 + 2.1 8,974 20,865 840 4,868 47 33 2,759 827 6.3 595 Q4 43,476 + 1.2 31,333 + 2.3 9,049 21,204 837 4,829 101 46 2,655 775 6.0 604
2016 Q1 43,096 + 1.4 31,077 + 2.4 8,929 21,131 793 4,785 312 50 2,892 932 6.6 610 Q2 43,557 + 1.3 31,350 + 2.2 8,988 21,298 820 4,823 59 47 2,674 782 6.1 653 Q3 43,832 + 1.3 31,593 + 2.1 9,056 21,431 858 4,827 46 35 2,651 808 6.0 682 Q4 44,066 + 1.4 32,014 + 2.2 9,137 21,770 866 4,781 93 36 2,547 766 5.8 677
2017 Q1 43,740 + 1.5 31,790 + 2.3 9,040 21,697 830 4,728 307 41 2,734 9 987 6.2 671 Q2 44,207 + 1.5 32,064 + 2.3 9,110 21,857 852 4,762 36 25 2,513 822 10 5.6 717 Q3 44,507 + 1.5 8 32,324 8 + 2.3 8 9,172 8 22,010 8 892 8 4,764 ... 8 17 2,504 833 5.6 763 Q4 7 44,708 7 + 1.5 8 32,736 8 + 2.3 8 9,261 8 22,335 8 899 8 4,714 ... 8 17 2,381 780 5.3 771
2014 Oct 43,065 + 0.8 30,676 + 1.6 8,980 20,645 808 5,021 61 49 2,733 836 6.3 517 Nov 43,017 + 0.7 30,636 + 1.6 8,960 20,645 798 5,020 63 52 2,717 834 6.3 515 Dec 42,813 + 0.8 30,398 + 1.7 8,864 20,565 753 5,012 204 39 2,764 867 6.4 498
2015 Jan 42,444 + 0.7 30,276 + 1.8 8,815 20,498 747 4,846 327 50 3,032 1,043 7.0 485 Feb 42,470 + 0.7 30,342 + 1.9 8,818 20,546 756 4,821 352 52 3,017 1,034 6.9 519 Mar 42,638 + 0.8 30,528 + 2.0 8,865 20,651 777 4,829 251 50 2,932 955 6.8 542 Apr 42,832 + 0.8 30,645 + 1.9 8,895 20,723 784 4,850 67 54 2,843 868 6.5 552 May 43,013 + 0.8 30,718 + 2.0 8,901 20,776 794 4,875 57 44 2,762 815 6.3 557 June 43,150 + 0.9 30,771 + 2.0 8,915 20,788 819 4,902 59 45 2,711 782 6.2 572 July 43,190 + 0.9 30,744 + 2.1 8,934 20,724 840 4,908 49 35 2,773 830 6.3 589 Aug 43,245 + 1.0 30,988 + 2.2 8,993 20,901 846 4,841 40 26 2,796 851 6.4 597 Sep 43,422 + 1.0 31,333 + 2.2 9,076 21,153 850 4,810 51 39 2,708 799 6.2 600 Oct 43,508 + 1.0 31,368 + 2.3 9,068 21,206 846 4,814 61 47 2,649 764 6.0 612 Nov 43,545 + 1.2 31,389 + 2.5 9,060 21,247 842 4,846 66 52 2,633 764 6.0 610 Dec 43,374 + 1.3 31,150 + 2.5 8,964 21,167 798 4,843 177 39 2,681 798 6.1 591
2016 Jan 43,005 + 1.3 30,983 + 2.3 8,906 21,073 784 4,774 343 48 2,920 961 6.7 581 Feb 43,059 + 1.4 31,069 + 2.4 8,923 21,127 793 4,769 343 50 2,911 947 6.6 614 Mar 43,224 + 1.4 31,209 + 2.2 8,954 21,217 804 4,782 252 52 2,845 888 6.5 635 Apr 43,388 + 1.3 31,314 + 2.2 8,983 21,279 809 4,806 67 55 2,744 817 6.3 640 May 43,577 + 1.3 31,410 + 2.3 9,000 21,337 826 4,838 57 45 2,664 774 6.0 655 June 43,707 + 1.3 31,443 + 2.2 9,010 21,339 846 4,865 54 42 2,614 754 5.9 665 July 43,689 + 1.2 31,378 + 2.1 9,007 21,273 853 4,863 43 31 2,661 805 6.0 674 Aug 43,807 + 1.3 31,675 + 2.2 9,076 21,486 865 4,802 50 38 2,684 830 6.1 685 Sep 43,999 + 1.3 32,007 + 2.2 9,157 21,729 869 4,768 46 35 2,608 787 5.9 687 Oct 44,086 + 1.3 32,045 + 2.2 9,154 21,773 871 4,767 50 39 2,540 756 5.8 691 Nov 44,131 + 1.3 32,069 + 2.2 9,147 21,807 876 4,794 52 40 2,532 756 5.7 681 Dec 43,982 + 1.4 31,848 + 2.2 9,063 21,731 835 4,794 178 30 2,568 785 5.8 658
2017 Jan 43,656 + 1.5 31,707 + 2.3 9,017 21,648 825 4,719 370 43 2,777 9 1,010 6.3 647 Feb 43,704 + 1.5 31,774 + 2.3 9,032 21,690 828 4,706 335 42 2,762 1,014 6.3 675 Mar 43,861 + 1.5 31,930 + 2.3 9,078 21,777 838 4,722 216 40 2,662 935 6.0 692 Apr 44,035 + 1.5 32,013 + 2.2 9,101 21,831 838 4,748 39 27 2,569 861 5.8 706 May 44,216 + 1.5 32,131 + 2.3 9,124 21,900 859 4,775 36 25 2,498 810 10 5.6 714 June 44,369 + 1.5 32,165 + 2.3 9,135 21,902 878 4,802 33 22 2,473 796 5.5 731 July 44,388 + 1.6 32,128 + 2.4 9,123 21,869 890 4,803 30 18 2,518 842 5.6 750 Aug 44,477 + 1.5 32,396 + 2.3 9,189 22,060 896 4,739 28 15 2,545 855 5.7 765 Sep 44,657 + 1.5 8 32,730 8 + 2.3 8 9,274 8 22,302 8 901 8 4,700 ... 8 17 2,449 800 5.5 773 Oct 44,730 + 1.5 8 32,773 8 + 2.3 8 9,276 8 22,350 8 901 8 4,701 ... 8 21 2,389 772 5.4 780 Nov 44,770 + 1.4 8 32,791 8 + 2.3 8 9,273 8 22,364 8 915 8 4,724 ... 8 15 2,368 772 5.3 772 Dec 7 44,623 7 + 1.5 8 32,559 8 + 2.2 8 9,195 8 22,278 8 866 8 4,731 ... 8 15 2,385 796 5.3 761
2018 Jan 7 44,281 7 + 1.4 ... ... ... ... ... ... ... ... 2,570 941 5.8 736 Feb ... ... ... ... ... ... ... ... ... ... 2,546 927 5.7 764
Sources: Federal Statistical Office; Federal Employment Agency. * Annual and the final data by a maximum of 1.1 % for employees subject to social contributions,quarterly figures: averages; calculated by the Bundesbank; deviations from the offi- by a maximum of 0.5 % for persons solely in jobs exempt from social contributions,cial figures are due to rounding. 1 Workplace concept; averages. 2 Monthly figures: and by a maximum of 33.9 % for cyclically induced short-time work. 9 From Januaryend of month. 3 Number within a given month. 4 Mid-month level. 5 Relative to the 2017, persons receiving additional income assistance (unemployment benefit andtotal civilian labour force. 6 Excluding government-assisted forms of employment unemployment benefit II at the same time) shall be assigned to the legal category ofand seasonal jobs, including jobs located abroad. 7 Initial preliminary estimate by the Third Book of the Social Security Code (SGB III). 10 From May 2017 calculatedthe Federal Statistical Office. 8 Unadjusted figures estimated by the Federal Employ- on the basis of new labour force figures. ment Agency. In 2015 and 2016, the estimated values for Germany deviated from

Deutsche Bundesbank
70
Monthly Report
March 2018
XI Economic conditions in Germany
7 Prices
Harmonised Index of Consumer Prices HWWIIndex of Indices of Index of World Market
of which 1 producer foreign trade prices Prices of Raw Materials 6 prices ofindustrialof whichproducts Index ofMemo item:
Non- Consumer Con- producer-sold onenergy struction the pricesprice index
(national price domestic Other rawagriculturalindustrial HousingTotal Food 2 Energy 3 Services rents 4 concept) index market 5 Exports Imports Energy 7 products 5 goods materials 8
Period 2015 = 100 2010 = 100 2015 = 100
Index level
2013 99.1 97.4 98.7 109.8 97.4 97.3 105.7 107.9 106.9 120.7 104.3 105.9 160.2 117.62014 99.9 98.8 99.2 107.5 98.8 98.8 106.6 109.7 105.8 111.1 104.0 103.6 142.8 108.3
2015 100.0 100.0 100.0 100.0 100.0 100.0 106.9 111.3 103.9 106.9 104.9 100.9 100.0 100.02016 100.4 101.3 101.0 94.6 101.2 101.2 107.4 113.4 102.1 106.7 104.0 97.8 83.2 98.42017 102.1 104.0 102.3 97.5 102.5 102.9 109.3 117.0 104.8 9 115.5 105.9 101.5 99.6 107.1
2016 Apr 99.8 101.6 101.5 93.6 99.7 100.9 106.9 101.3 105.9 103.5 96.4 75.1 95.5 May 100.2 101.3 101.4 95.0 100.5 101.0 107.2 113.1 101.7 106.0 103.7 97.3 82.6 97.2 June 100.3 101.0 100.7 96.2 100.9 101.1 107.3 102.1 106.4 103.9 97.8 87.9 98.9
July 100.7 101.3 100.0 95.1 102.2 101.2 107.6 102.3 110.0 104.1 97.9 84.4 100.2 Aug 100.6 100.9 100.3 94.3 102.3 101.4 107.6 113.7 102.2 106.7 104.0 97.7 83.9 98.6 Sep 100.6 101.2 101.5 94.9 101.4 101.5 107.7 102.0 104.8 104.0 97.8 83.9 97.0
Oct 100.8 101.2 102.0 96.2 101.2 101.7 107.9 102.7 108.9 104.3 98.7 96.2 99.8 Nov 100.8 102.0 102.0 95.2 101.1 101.8 108.0 114.1 103.0 111.4 104.8 99.4 95.4 108.5 Dec 101.8 102.6 101.6 97.3 102.8 102.0 108.8 103.4 113.2 105.2 101.3 106.6 114.0
2017 Jan 101.0 103.2 100.7 98.2 101.0 102.2 108.1 104.1 9 114.9 105.8 102.2 108.9 115.9 Feb 101.7 104.6 101.0 98.4 101.9 102.3 108.8 115.5 104.3 116.3 106.0 102.9 110.2 118.9 Mar 101.8 103.4 102.6 97.5 102.0 102.4 109.0 104.3 117.7 106.0 102.4 99.7 116.4
Apr 101.8 103.4 102.7 98.3 101.5 102.6 109.0 104.7 120.0 106.2 102.3 100.4 110.1 May 101.6 103.5 102.7 96.9 101.5 102.8 108.8 116.6 104.5 121.0 106.0 101.3 93.1 104.2 June 101.8 103.6 102.0 96.1 102.5 102.9 109.0 104.5 121.4 105.8 100.2 85.7 100.4
July 102.2 103.8 101.4 95.9 103.8 103.0 109.4 104.7 120.3 105.7 99.8 86.5 102.9 Aug 102.4 103.8 101.8 96.3 103.8 103.1 109.5 117.5 104.9 121.3 105.6 99.8 90.1 103.3 Sep 102.4 104.1 102.9 97.5 102.8 103.2 109.6 105.2 116.3 105.8 100.7 96.3 102.8
Oct 102.3 104.8 103.2 97.4 102.2 103.3 109.6 105.5 114.6 105.9 101.3 101.6 102.7 Nov 102.6 104.8 103.2 98.7 102.6 103.5 109.9 118.4 105.6 115.1 106.1 102.1 110.3 103.8 Dec 103.4 105.5 102.8 98.5 104.2 103.6 110.6 105.8 114.6 106.2 102.4 113.7 103.6
2018 Jan 102.4 106.2 101.8 98.9 102.4 103.9 109.8 106.3 110.9 106.5 102.9 115.9 105.4 Feb 102.9 106.2 102.2 98.5 103.3 104.0 110.3 ... ... ... ... ... 108.7 106.0
Annual percentage change
2013 + 1.6 + 3.4 + 0.7 + 1.8 + 1.5 + 1.3 + 1.5 + 2.1 − 0.1 + 1.1 − 0.6 − 2.6 − 4.0 − 8.62014 + 0.8 + 1.5 + 0.5 − 2.1 + 1.4 + 1.6 + 0.9 + 1.7 − 1.0 − 8.0 − 0.3 − 2.2 − 10.9 − 7.9
2015 + 0.1 + 1.2 + 0.8 − 7.0 + 1.2 + 1.2 + 0.3 + 1.5 − 1.8 − 3.8 + 0.9 − 2.6 − 30.0 − 7.72016 + 0.4 + 1.3 + 1.0 − 5.4 + 1.2 + 1.2 + 0.5 + 1.9 − 1.7 − 0.2 − 0.9 − 3.1 − 16.8 − 1.62017 + 1.7 + 2.7 + 1.3 + 3.1 + 1.3 + 1.7 + 1.8 + 3.2 + 2.6 9 + 8.2 + 1.8 + 3.8 + 19.7 + 8.8
2016 Apr − 0.3 + 1.2 + 1.1 − 8.5 + 0.5 + 1.1 − 0.1 − 3.1 − 0.1 − 2.0 − 6.6 − 35.0 − 9.6 May + 0.0 + 0.9 + 1.2 − 8.0 + 1.1 + 1.1 + 0.1 + 1.8 − 2.7 + 1.1 − 1.6 − 5.5 − 29.3 − 7.2 June + 0.2 + 0.9 + 0.9 − 6.4 + 1.4 + 1.1 + 0.3 − 2.2 + 0.9 − 1.3 − 4.6 − 22.4 − 4.4
July + 0.4 + 1.5 + 0.9 − 7.0 + 1.4 + 1.1 + 0.4 − 2.0 + 5.3 − 1.2 − 3.8 − 20.4 − 1.4 Aug + 0.3 + 1.2 + 0.7 − 5.9 + 1.3 + 1.3 + 0.4 + 2.0 − 1.6 + 4.5 − 0.9 − 2.6 − 8.3 + 2.7 Sep + 0.5 + 1.2 + 0.8 − 3.6 + 1.3 + 1.3 + 0.7 − 1.4 − 2.4 − 0.6 − 1.8 − 7.6 + 3.1
Oct + 0.7 + 0.8 + 0.8 − 1.4 + 1.2 + 1.4 + 0.8 − 0.4 + 0.0 − 0.1 − 0.6 + 5.0 + 6.9 Nov + 0.7 + 1.5 + 1.0 − 2.6 + 1.0 + 1.4 + 0.8 + 2.1 + 0.1 + 3.5 + 0.3 + 0.3 + 6.5 + 17.0 Dec + 1.7 + 2.4 + 1.2 + 2.4 + 1.6 + 1.6 + 1.7 + 1.0 + 5.5 + 1.1 + 3.5 + 37.5 + 27.5
2017 Jan + 1.9 + 2.8 + 1.0 + 5.9 + 1.1 + 1.6 + 1.9 + 2.4 9 + 7.6 + 1.8 + 6.0 + 68.8 + 31.4 Feb + 2.2 + 3.8 + 1.1 + 7.2 + 1.3 + 1.6 + 2.2 + 2.7 + 3.1 + 9.7 + 2.5 + 7.4 + 72.2 + 34.2 Mar + 1.5 + 2.2 + 1.6 + 5.2 + 0.5 + 1.6 + 1.6 + 3.1 + 10.4 + 2.3 + 6.1 + 37.9 + 24.4
Apr + 2.0 + 1.8 + 1.2 + 5.0 + 1.8 + 1.7 + 2.0 + 3.4 + 13.3 + 2.6 + 6.1 + 33.7 + 15.3 May + 1.4 + 2.2 + 1.3 + 2.0 + 1.0 + 1.8 + 1.5 + 3.1 + 2.8 + 14.2 + 2.2 + 4.1 + 12.7 + 7.2 June + 1.5 + 2.6 + 1.3 − 0.1 + 1.6 + 1.8 + 1.6 + 2.4 + 14.1 + 1.8 + 2.5 − 2.5 + 1.5
July + 1.5 + 2.5 + 1.4 + 0.8 + 1.6 + 1.8 + 1.7 + 2.3 + 9.4 + 1.5 + 1.9 + 2.5 + 2.7 Aug + 1.8 + 2.9 + 1.5 + 2.1 + 1.5 + 1.7 + 1.8 + 3.3 + 2.6 + 13.7 + 1.5 + 2.1 + 7.4 + 4.8 Sep + 1.8 + 2.9 + 1.4 + 2.7 + 1.4 + 1.7 + 1.8 + 3.1 + 11.0 + 1.7 + 3.0 + 14.8 + 6.0
Oct + 1.5 + 3.6 + 1.2 + 1.2 + 1.0 + 1.6 + 1.6 + 2.7 + 5.2 + 1.5 + 2.6 + 5.6 + 2.9 Nov + 1.8 + 2.7 + 1.2 + 3.7 + 1.5 + 1.7 + 1.8 + 3.8 + 2.5 + 3.3 + 1.2 + 2.7 + 15.6 − 4.3 Dec + 1.6 + 2.8 + 1.2 + 1.2 + 1.4 + 1.6 + 1.7 + 2.3 + 1.2 + 1.0 + 1.1 + 6.7 − 9.1
2018 Jan + 1.4 + 2.9 + 1.1 + 0.7 + 1.4 + 1.7 + 1.6 + 2.1 − 3.5 + 0.7 + 0.7 + 6.4 − 9.1 Feb + 1.2 + 1.5 + 1.2 + 0.1 + 1.4 + 1.7 + 1.4 ... ... ... ... ... − 1.4 − 10.8
Sources: Eurostat; Federal Statistical Office and Bundesbank calculation based on transport fuels and lubricants. 4 Net rents. 5 Excluding value-added tax. 6 For thedata from the Federal Statistical Office; for the Index of World Market Prices of Raw euro area, in euro. 7 Coal, crude oil (Brent) and natural gas. 8 Food, beverages and to-Materials: HWWI. 1 Differences from the official figures are due to rounding. 2 Inclu- bacco as well as industrial raw materials. 9 From January 2017 onwards, provisional fi-ding alcoholic beverages and tobacco. 3 Electricity, gas and other fuels as well as gures.

Deutsche Bundesbank
71
Monthly Report
March 2018
XI Economic conditions in Germany
8 Households’ income *
Gross wages and Net wages and Monetary social Savingsalaries 1 salaries 2 Mass income 4 Saving 6 ratio 7 benefits received 3 Disposable income 5
Annual Annual Annual Annual Annual Annualpercent- percent- percent- percent- percent- percent- Asage age age age age age percent-
Period change change change change change change age€ billion € billion € billion € billion € billion € billion
2010 1,039.0 2.9 702.2 4.4 385.3 1.2 1,087.5 3.2 1,606.4 2.4 160.1 2.5 10.0
2011 1,088.6 4.8 729.4 3.9 380.4 − 1.3 1,109.8 2.0 1,653.7 2.9 158.2 − 1.2 9.6
2012 1,133.0 4.1 756.8 3.8 387.6 1.9 1,144.5 3.1 1,695.6 2.5 157.6 − 0.4 9.3
2013 1,167.4 3.0 778.3 2.8 388.1 0.1 1,166.4 1.9 1,717.2 1.3 153.7 − 2.5 8.9
2014 1,212.7 3.9 806.9 3.7 398.4 2.6 1,205.2 3.3 1,759.8 2.5 166.6 8.4 9.5
2015 1,260.8 4.0 836.6 3.7 417.0 4.7 1,253.7 4.0 1,804.0 2.5 173.5 4.2 9.6
2016 1,311.5 4.0 869.1 3.9 430.1 3.1 1,299.2 3.6 1,854.1 2.8 179.7 3.5 9.7
2017 1,370.3 4.5 905.9 4.2 444.1 3.2 1,349.9 3.9 1,924.8 3.8 189.8 5.6 9.9
2016 Q3 323.3 3.9 218.6 3.6 108.8 4.2 327.4 3.8 461.8 2.2 37.7 2.0 8.2
Q4 363.1 4.1 240.4 3.8 106.9 3.0 347.4 3.6 472.4 2.9 39.9 4.4 8.5
2017 Q1 319.3 4.5 211.7 4.6 112.9 4.2 324.6 4.4 477.5 4.5 62.4 6.7 13.1
Q2 333.9 4.5 215.9 4.0 109.9 3.7 325.8 3.9 479.9 3.7 44.8 2.9 9.3
Q3 338.5 4.7 228.9 4.7 111.7 2.6 340.6 4.0 480.2 4.0 40.2 6.7 8.4
Q4 378.6 4.3 249.3 3.7 109.6 2.4 358.9 3.3 487.2 3.1 42.3 6.0 8.7
Source: Federal Statistical Office; figures computed in February 2018. * Households in- salaries plus monetary social benefits received. 5 Mass income plus operating surplus,cluding non-profit institutions serving households. 1 Residence concept. 2 After mixed income, property income (net), other current transfers received, income ofdeducting the wage tax payable on gross wages and salaries and employees’ non-profit institutions serving households, less taxes (excluding wage tax andcontributions to the social security funds. 3 Social security benefits in cash from the consumption-related taxes) and other current transfers paid. Including the increase insocial security funds, central, state and local government and foreign countries, claims on company pension funds. 6 Including the increase in claims on company pen-pension payments (net), private funded social benefits, less social contributions on sion funds. 7 Saving as a percentage of disposable income. social benefits, consumption-related taxes and public charges. 4 Net wages and
9 Negotiated pay rates (overall economy)
Index of negotiated wages 1
On a monthly basisMemo item:
Total excluding Wages and salariesOn an hourly basis Total one-off payments Basic pay rates 2 per employee 3
Annual Annual Annual Annual AnnualPeriod percentage percentage percentage percentage percentage
2010=100 change 2010=100 change 2010=100 change 2010=100 change 2010=100 change
2010 100.0 1.6 100.0 1.7 100.0 1.7 100.0 1.8 100.0 2.5
2011 101.7 1.7 101.8 1.8 101.8 1.8 101.8 1.8 103.4 3.4
2012 104.4 2.7 104.4 2.6 104.7 2.8 104.7 2.9 106.2 2.7
2013 107.0 2.4 106.9 2.4 107.3 2.5 107.2 2.4 108.4 2.1
2014 110.1 2.9 109.9 2.8 110.1 2.7 110.1 2.7 111.4 2.8
2015 112.6 2.3 112.4 2.2 112.6 2.3 112.7 2.3 114.5 2.8
2016 114.9 2.1 114.7 2.1 115.0 2.1 115.2 2.2 117.3 2.4
2017 117.4 2.1 117.1 2.1 117.5 2.2 117.8 2.3 120.5 2.7
2016 Q3 117.6 2.1 117.3 2.1 117.7 2.2 115.8 2.2 115.4 2.4
Q4 128.0 2.2 127.8 2.2 128.2 2.2 116.1 2.3 128.4 2.5
2017 Q1 109.1 2.6 108.8 2.5 109.1 2.5 116.8 2.5 113.7 2.8
Q2 110.1 2.1 109.9 2.1 110.2 2.4 117.6 2.4 117.8 2.8
Q3 120.0 2.1 119.7 2.0 120.1 2.0 118.3 2.1 118.7 2.9
Q4 130.4 1.9 130.1 1.8 130.5 1.8 118.6 2.1 131.7 2.5
2017 July 139.1 2.0 138.8 2.0 139.2 1.9 118.1 2.1 . .
Aug 110.4 2.1 110.1 2.1 110.5 2.1 118.3 2.2 . .
Sep 110.5 2.1 110.2 2.1 110.6 2.1 118.4 2.1 . .
Oct 111.0 2.1 110.7 2.0 111.1 2.0 118.5 2.1 . .
Nov 167.8 1.6 167.4 1.6 168.0 1.6 118.7 2.2 . .
Dec 112.5 2.0 112.2 2.0 112.6 2.1 118.6 2.1 . .
2018 Jan 111.2 2.0 110.9 2.0 111.3 2.2 119.2 2.2 . .
1 Current data are normally revised on account of additional reports. 2 Excluding and retirement provisions). 3 Source: Federal Statistical Office; figures computed inone-off payments and covenants (capital formation benefits, special payments, such February 2018. as annual bonuses, holiday pay, Christmas bonuses (13th monthly salary payment)

Deutsche Bundesbank
72
Monthly Report
March 2018
XI Economic conditions in Germany 10 Assets, equity and liabilities of listed non-financial groups *
End-of-year/end-of-half data
Assets Equity and liabilities
of which of which Liabilities
Long-term Short-term
of which
Non- Trade of whichTotal current Intangible Tangible Financial Current Inven- receiv- Financial Financial Trade
Period assets assets assets assets assets assets tories ables Cash 1 Equity Total Total debt Total debt payables
Total (€ billion)
2013 1,902.1 1,171.1 385.0 485.2 232.4 731.0 187.5 175.8 136.5 569.5 1,332.6 706.0 379.8 626.6 191.0 163.02014 2,078.8 1,284.1 431.0 520.3 249.6 794.7 203.1 187.3 132.4 582.9 1,495.9 812.0 426.8 683.9 207.2 175.82015 2,225.6 1,394.0 470.7 564.7 273.1 831.6 215.5 190.5 136.0 633.3 1,592.3 860.4 465.3 731.9 222.7 180.32016 2,370.4 1,479.3 493.0 594.9 289.7 891.1 226.8 218.0 151.9 675.5 1,694.8 888.5 481.9 806.3 249.0 192.8
2015 H2 2,225.6 1,394.0 470.7 564.7 273.1 831.6 215.5 190.5 136.0 633.3 1,592.3 860.4 465.3 731.9 222.7 180.3
2016 H1 2,255.6 1,380.4 462.4 549.3 272.0 875.2 226.6 195.1 140.4 607.1 1,648.5 894.8 464.6 753.7 243.8 174.9 H2 2,370.4 1,479.3 493.0 594.9 289.7 891.1 226.8 218.0 151.9 675.5 1,694.8 888.5 481.9 806.3 249.0 192.8
2017 H1 p 2,387.4 1,472.0 501.7 582.8 289.4 915.4 238.2 220.7 151.8 705.0 1,682.4 886.8 497.2 795.6 246.2 194.9
as a percentage of total assets
2013 100.0 61.6 20.2 25.5 12.2 38.4 9.9 9.2 7.2 29.9 70.1 37.1 20.0 32.9 10.0 8.62014 100.0 61.8 20.7 25.0 12.0 38.2 9.8 9.0 6.4 28.0 72.0 39.1 20.5 32.9 10.0 8.52015 100.0 62.6 21.2 25.4 12.3 37.4 9.7 8.6 6.1 28.5 71.5 38.7 20.9 32.9 10.0 8.12016 100.0 62.4 20.8 25.1 12.2 37.6 9.6 9.2 6.4 28.5 71.5 37.5 20.3 34.0 10.5 8.1
2015 H2 100.0 62.6 21.2 25.4 12.3 37.4 9.7 8.6 6.1 28.5 71.5 38.7 20.9 32.9 10.0 8.1
2016 H1 100.0 61.2 20.5 24.4 12.1 38.8 10.0 8.7 6.2 26.9 73.1 39.7 20.6 33.4 10.8 7.8 H2 100.0 62.4 20.8 25.1 12.2 37.6 9.6 9.2 6.4 28.5 71.5 37.5 20.3 34.0 10.5 8.1
2017 H1 p 100.0 61.7 21.0 24.4 12.1 38.3 10.0 9.2 6.4 29.5 70.5 37.2 20.8 33.3 10.3 8.2
Groups with a focus on the production sector (€ billion) 2
2013 1,523.6 908.2 257.2 384.6 215.6 615.4 171.2 136.1 104.1 450.9 1,072.6 560.4 282.8 512.2 170.2 114.92014 1,655.6 989.4 276.5 411.9 236.0 666.2 185.7 140.3 98.9 451.4 1,204.2 644.0 318.6 560.2 185.6 122.42015 1,781.1 1,076.8 304.0 446.3 259.0 704.3 198.8 147.0 104.3 485.0 1,296.1 689.4 353.1 606.7 198.3 127.52016 1,908.6 1,145.8 322.1 472.9 270.8 762.8 209.7 169.9 115.4 514.1 1,394.5 714.8 369.4 679.7 223.1 140.9
2015 H2 1,781.1 1,076.8 304.0 446.3 259.0 704.3 198.8 147.0 104.3 485.0 1,296.1 689.4 353.1 606.7 198.3 127.5
2016 H1 1,817.3 1,058.7 296.6 432.0 254.2 758.6 210.0 149.8 112.2 465.7 1,351.6 717.4 350.9 634.3 219.2 129.9 H2 1,908.6 1,145.8 322.1 472.9 270.8 762.8 209.7 169.9 115.4 514.1 1,394.5 714.8 369.4 679.7 223.1 140.9
2017 H1 p 1,921.2 1,136.9 324.7 463.5 273.1 784.3 224.2 171.9 125.3 550.0 1,371.2 708.2 378.1 663.0 224.3 153.1
as a percentage of total assets
2013 100.0 59.6 16.9 25.2 14.2 40.4 11.2 8.9 6.8 29.6 70.4 36.8 18.6 33.6 11.2 7.52014 100.0 59.8 16.7 24.9 14.3 40.2 11.2 8.5 6.0 27.3 72.7 38.9 19.2 33.8 11.2 7.42015 100.0 60.5 17.1 25.1 14.5 39.6 11.2 8.3 5.9 27.2 72.8 38.7 19.8 34.1 11.1 7.22016 100.0 60.0 16.9 24.8 14.2 40.0 11.0 8.9 6.1 26.9 73.1 37.5 19.4 35.6 11.7 7.4
2015 H2 100.0 60.5 17.1 25.1 14.5 39.6 11.2 8.3 5.9 27.2 72.8 38.7 19.8 34.1 11.1 7.2
2016 H1 100.0 58.3 16.3 23.8 14.0 41.7 11.6 8.3 6.2 25.6 74.4 39.5 19.3 34.9 12.1 7.2 H2 100.0 60.0 16.9 24.8 14.2 40.0 11.0 8.9 6.1 26.9 73.1 37.5 19.4 35.6 11.7 7.4
2017 H1 p 100.0 59.2 16.9 24.1 14.2 40.8 11.7 9.0 6.5 28.6 71.4 36.9 19.7 34.5 11.7 8.0
Groups with a focus on the services sector (€ billion)
2013 378.5 262.9 127.8 100.6 16.8 115.6 16.3 39.7 32.3 118.6 260.0 145.6 97.0 114.3 20.8 48.12014 423.2 294.7 154.6 108.4 13.6 128.6 17.4 47.0 33.5 131.5 291.7 168.0 108.3 123.7 21.6 53.42015 444.5 317.3 166.7 118.3 14.1 127.2 16.7 43.5 31.6 148.3 296.2 171.0 112.2 125.2 24.4 52.72016 461.8 333.5 170.9 122.0 18.9 128.3 17.1 48.1 36.5 161.4 300.4 173.7 112.6 126.6 26.0 51.9
2015 H2 444.5 317.3 166.7 118.3 14.1 127.2 16.7 43.5 31.6 148.3 296.2 171.0 112.2 125.2 24.4 52.7
2016 H1 438.3 321.7 165.8 117.3 17.8 116.6 16.6 45.3 28.2 141.4 296.9 177.4 113.6 119.4 24.7 45.0 H2 461.8 333.5 170.9 122.0 18.9 128.3 17.1 48.1 36.5 161.4 300.4 173.7 112.6 126.6 26.0 51.9
2017 H1 p 466.2 335.1 177.0 119.3 16.3 131.1 14.0 48.8 26.6 155.1 311.1 178.6 119.2 132.6 21.9 41.8
as a percentage of total assets
2013 100.0 69.5 33.8 26.6 4.5 30.5 4.3 10.5 8.5 31.3 68.7 38.5 25.6 30.2 5.5 12.72014 100.0 69.6 36.5 25.6 3.2 30.4 4.1 11.1 7.9 31.1 68.9 39.7 25.6 29.2 5.1 12.62015 100.0 71.4 37.5 26.6 3.2 28.6 3.8 9.8 7.1 33.4 66.6 38.5 25.3 28.2 5.5 11.92016 100.0 72.2 37.0 26.4 4.1 27.8 3.7 10.4 7.9 35.0 65.0 37.6 24.4 27.4 5.6 11.2
2015 H2 100.0 71.4 37.5 26.6 3.2 28.6 3.8 9.8 7.1 33.4 66.6 38.5 25.3 28.2 5.5 11.9
2016 H1 100.0 73.4 37.8 26.8 4.1 26.6 3.8 10.3 6.4 32.3 67.7 40.5 25.9 27.3 5.6 10.3 H2 100.0 72.2 37.0 26.4 4.1 27.8 3.7 10.4 7.9 35.0 65.0 37.6 24.4 27.4 5.6 11.2
2017 H1 p 100.0 71.9 38.0 25.6 3.5 28.1 3.0 10.5 5.7 33.3 66.7 38.3 25.6 28.4 4.7 9.0
* Non-financial groups admitted to the Prime Standard segment of the Frankfurt In some cases revised. Excluding groups engaged in real estate activities. 1 IncludingStock Exchange which publish IFRS consolidated financial statements on a quarterly cash equivalents. 2 Including groups in agriculture and forestry. or half-yearly basis and make a noteworthy contribution to value added in Germany.

Deutsche Bundesbank
73
Monthly Report
March 2018
XI Economic conditions in Germany 11 Revenues and operating income of listed non-financial groups *
Operating income before depreciation and amorti-sation (EBITDA 1 ) as a percentage of revenues Operating income (EBIT) as a percentage of revenues
Operating income Distribution 2 Distribution 2 before depreciationand amortisation Weighted First Third Operating Weighted First Third
Revenues (EBITDA 1 ) average quartile Median quartile income (EBIT) average quartile Median quartile
Annual Annualchange in change in
Annual Annual per- Annual per-change change centage change centage
Period in % 4 in % 4 % points 4 % % % in % 4 % points 4 % % %€ billion 3 € billion 3 € billion 3
Total
2009 1,158.5 − 10.7 135.6 − 16.9 11.7 − 0.9 3.9 9.4 15.7 55.9 − 29.3 4.8 − 1.3 − 0.2 4.9 9.3
2010 1,320.9 13.3 181.4 30.6 13.7 1.8 6.6 11.4 18.6 98.3 66.6 7.4 2.4 3.2 6.9 12.12011 1,414.3 8.5 175.9 0.5 12.4 − 1.0 5.5 11.0 17.4 93.8 − 4.1 6.6 − 0.9 2.7 6.6 12.02012 1,532.9 6.6 188.8 3.2 12.3 − 0.4 5.2 10.2 17.5 95.7 − 7.7 6.2 − 0.9 1.9 6.1 11.02013 1,541.0 − 0.6 187.1 − 2.8 12.1 − 0.3 5.1 10.3 18.3 99.5 5.5 6.5 0.4 1.9 5.9 10.92014 1,565.6 1.0 198.7 4.9 12.7 0.5 5.7 10.3 17.2 109.3 8.5 7.0 0.5 1.9 6.1 11.1
2015 1,635.3 6.9 196.1 − 1.0 12.0 − 1.0 6.1 10.6 17.8 91.6 − 16.3 5.6 − 1.5 1.7 6.6 11.32016 1,626.0 − 0.4 214.8 8.0 13.2 1.0 6.6 11.4 17.9 112.0 9.2 6.9 0.5 2.5 6.7 12.0
2012 H2 782.1 5.2 95.4 2.6 12.2 − 0.3 4.8 11.1 18.0 39.9 − 19.2 5.1 − 1.4 1.4 6.9 11.9
2013 H1 762.7 − 0.2 93.4 − 3.6 12.2 − 0.4 3.4 9.3 16.5 53.8 − 7.6 7.1 − 0.6 0.6 4.9 10.7 H2 780.0 − 1.1 93.8 − 2.0 12.0 − 0.1 5.4 10.8 19.2 45.7 25.5 5.9 1.3 1.7 6.2 12.1
2014 H1 757.2 − 0.9 97.2 4.6 12.8 0.7 4.7 9.5 16.0 57.8 9.4 7.6 0.7 1.0 5.2 10.5 H2 808.7 2.9 101.5 5.2 12.6 0.3 5.4 10.8 19.1 51.5 7.6 6.4 0.3 1.7 7.1 12.0
2015 H1 815.2 8.7 102.9 5.7 12.6 − 0.4 4.8 10.2 17.6 59.1 1.3 7.2 − 0.5 1.1 5.8 10.9 H2 831.3 5.1 93.5 − 7.6 11.3 − 1.5 6.3 11.5 18.1 32.7 − 36.7 3.9 − 2.5 2.3 7.1 11.7
2016 H1 782.7 − 1.9 111.8 6.3 14.3 1.1 5.9 10.4 17.7 65.6 2.9 8.4 0.4 1.6 6.4 11.3 H2 843.3 1.1 103.0 9.9 12.2 1.0 6.7 11.9 19.0 46.3 21.0 5.5 0.8 2.9 7.5 12.5
2017 H1 p 844.9 7.1 125.8 14.3 14.9 0.9 5.7 10.1 17.2 78.6 29.2 9.3 1.6 1.8 5.8 11.6
Groups with a focus on the production sector 5
2009 837.7 − 11.8 94.9 − 20.6 11.3 − 1.3 2.5 9.0 14.0 40.0 − 32.6 4.8 − 1.5 − 1.4 4.3 8.8
2010 980.7 15.8 136.2 38.7 13.9 2.3 6.6 11.4 16.3 75.7 72.4 7.7 2.6 3.0 7.3 12.02011 1,079.0 10.6 130.0 − 1.7 12.1 − 1.5 5.5 11.3 16.4 74.1 − 4.9 6.9 − 1.1 2.1 6.8 11.52012 1,173.8 7.7 140.8 5.3 12.0 − 0.3 5.4 10.2 16.1 81.7 2.2 7.0 − 0.4 1.8 6.1 9.82013 1,179.0 − 0.8 138.7 − 2.6 11.8 − 0.2 4.4 10.3 15.5 74.5 − 5.8 6.3 − 0.3 1.3 5.7 10.02014 1,197.3 1.0 147.9 5.8 12.4 0.6 5.1 9.6 15.3 82.0 9.3 6.9 0.5 1.4 5.9 10.2
2015 1,282.4 7.0 143.9 − 2.7 11.2 − 1.1 6.1 10.4 15.5 65.1 − 20.3 5.1 − 1.8 1.8 6.5 10.02016 1,267.1 − 1.0 156.4 6.0 12.4 0.8 6.5 10.5 16.0 80.5 4.4 6.4 0.3 2.7 6.3 10.4
2012 H2 593.9 6.1 67.5 5.3 11.4 − 0.1 4.4 10.5 15.9 34.9 0.2 5.9 − 0.3 0.6 6.2 10.2
2013 H1 588.8 − 0.1 71.7 − 4.8 12.2 − 0.6 3.1 9.3 15.0 43.1 − 10.9 7.3 − 0.9 0.6 5.3 9.7 H2 591.7 − 1.4 67.1 − 0.3 11.3 0.1 4.0 10.4 15.8 31.4 1.7 5.3 0.2 0.6 5.8 10.9
2014 H1 584.4 − 1.1 74.2 3.8 12.7 0.6 4.7 9.6 15.0 46.2 8.9 7.9 0.7 1.4 5.4 9.6 H2 613.1 3.0 73.7 7.8 12.0 0.5 4.4 9.8 15.8 35.8 9.8 5.8 0.4 0.7 6.3 10.7
2015 H1 636.4 8.7 80.1 7.8 12.6 − 0.1 5.1 10.0 15.4 48.7 4.8 7.7 − 0.3 2.1 6.1 10.0 H2 646.6 5.3 63.8 − 13.4 9.9 − 2.1 5.3 11.1 15.5 16.4 − 52.4 2.5 − 3.3 1.8 6.9 10.3
2016 H1 611.2 − 2.6 83.9 1.3 13.7 0.5 6.6 10.5 15.7 50.7 − 6.5 8.3 − 0.3 2.8 6.4 9.9 H2 655.9 0.5 72.5 11.9 11.1 1.1 6.1 11.2 16.0 29.8 34.8 4.6 0.9 2.4 6.3 10.5
2017 H1 p 678.6 7.4 98.4 18.4 14.5 1.4 5.9 9.9 16.0 63.9 36.9 9.4 2.0 2.2 5.8 10.5
Groups with a focus on the services sector
2009 320.8 − 7.4 40.7 − 4.9 12.7 0.3 4.6 10.7 20.6 16.0 − 16.5 5.0 − 0.5 1.7 5.7 12.6
2010 340.2 5.8 45.1 9.0 13.3 0.4 6.0 11.2 19.7 22.6 47.0 6.7 1.8 3.4 6.0 12.82011 335.3 1.7 45.9 7.6 13.7 0.8 6.0 10.4 20.7 19.7 − 0.7 5.9 − 0.1 3.2 6.2 13.82012 359.1 2.8 48.0 − 3.3 13.4 − 0.8 5.1 10.1 23.0 14.0 − 47.2 3.9 − 3.0 2.1 5.7 14.22013 362.0 − 0.1 48.4 − 3.4 13.4 − 0.5 5.2 10.5 21.6 25.0 84.4 6.9 3.0 2.4 5.9 12.52014 368.3 1.1 50.8 2.2 13.8 0.1 6.0 12.7 22.6 27.3 5.7 7.4 0.3 2.9 6.5 13.7
2015 352.9 6.4 52.2 4.8 14.8 − 0.2 6.1 11.4 22.1 26.4 − 1.6 7.5 − 0.6 1.4 6.7 14.12016 358.9 2.4 58.3 14.6 16.3 1.8 6.8 13.5 25.1 31.5 24.7 8.8 1.5 2.3 8.2 15.3
2012 H2 188.3 2.3 27.9 − 4.0 14.8 − 1.0 5.3 11.4 24.2 5.1 − 73.2 2.7 − 5.2 3.2 7.7 15.3
2013 H1 173.9 − 0.5 21.7 1.1 12.5 0.2 3.9 8.1 19.2 10.7 12.8 6.2 0.7 0.9 4.6 12.8 H2 188.2 0.2 26.7 − 6.7 14.2 − 1.1 5.6 11.4 21.8 14.3 241.4 7.6 5.2 2.2 7.4 13.5
2014 H1 172.9 − 0.5 23.0 7.7 13.3 1.0 4.8 9.3 20.4 11.6 11.7 6.7 0.7 1.0 5.1 13.5 H2 195.6 2.5 27.8 − 2.2 14.2 − 0.7 6.4 13.5 23.8 15.7 1.5 8.1 − 0.1 3.6 8.1 18.0
2015 H1 178.9 8.4 22.8 − 2.2 12.7 − 1.5 4.4 10.9 21.5 10.3 − 15.7 5.8 − 1.6 − 0.5 4.5 14.2 H2 184.7 4.6 29.7 10.8 16.1 0.9 7.0 12.1 23.5 16.3 9.3 8.8 0.4 2.5 7.7 15.0
2016 H1 171.5 1.2 27.8 27.7 16.2 3.5 5.1 10.3 23.8 15.0 62.1 8.7 3.3 1.0 6.4 14.9 H2 187.5 3.6 30.5 4.6 16.3 0.2 7.4 13.5 24.3 16.5 2.7 8.8 − 0.1 4.0 8.9 17.1
2017 H1 p 166.3 5.8 27.5 0.3 16.5 − 0.8 5.4 11.0 21.3 14.7 − 0.1 8.8 − 0.5 1.4 5.8 14.7
* Non-financial groups admitted to the Prime Standard segment of the Frankfurt sum of the two half-year figures. See Quality report on consolidated financial state-Stock Exchange which publish IFRS consolidated financial statements on a quarterly ment statistics, p 3. 4 Adjusted for substantial changes in the basis of consolidationor half-yearly basis and make a noteworthy contribution to value added in Germany. of large groups and in the reporting sample. See the explanatory notes in the Statis-In some cases revised. Excluding groups engaged in real estate activities. 1 Earnings tical Supplement Seasonally adjusted business statistics. 5 Including groups in agricul-before interest, taxes, depreciation and amortisation. 2 Quantile data are based on ture and forestry. the groups’ unweighted return on sales. 3 Annual figures do not always match the

Deutsche Bundesbank
74
Monthly Report
March 2018
XII External sector 1 Major items of the balance of payments of the euro area *
€ million
2017
Item 2015 2016 2017 p Q2 Q3 Q4 p Oct Nov Dec p
Current account + 335,017 + 368,856 + 391,620 + 70,768 + 129,043 + 121,378 + 35,474 + 40,093 + 45,811A
1 Goods
Exports 2,138,897 2,130,214 2,272,144 565,780 563,019 584,548 193,705 205,564 185,279
Imports 1,780,137 1,754,551 1,925,064 476,505 467,720 492,639 166,329 171,114 155,196
Balance + 358,760 + 375,661 + 347,078 + 89,274 + 95,298 + 91,908 + 27,376 + 34,450 + 30,082
2 Services
Receipts 769,235 783,880 836,013 208,178 220,249 216,368 70,005 67,920 78,443
Expenditure 707,420 745,957 754,687 188,284 188,657 198,451 63,547 64,412 70,492
Balance + 61,817 + 37,921 + 81,323 + 19,894 + 31,590 + 17,916 + 6,457 + 3,508 + 7,951
3 Primary income
Receipts 666,059 662,031 676,324 173,660 166,187 177,132 50,505 52,917 73,710
Expenditure 614,175 567,874 567,080 175,256 130,744 130,165 37,410 38,388 54,367
Balance + 51,882 + 94,156 + 109,244 − 1,596 + 35,442 + 46,968 + 13,096 + 14,529 + 19,343
4 Secondary income
Receipts 109,468 109,909 107,253 28,936 25,118 27,506 7,749 7,918 11,839
Expenditure 246,910 248,791 253,281 65,741 58,407 62,920 19,203 20,312 23,405
Balance − 137,442 − 138,884 − 146,026 − 36,805 − 33,287 − 35,414 − 11,455 − 12,393 − 11,566
Capital account − 12,466 − 814 − 18,437 − 10,204 − 1,824 + 3,892 + 1,376 + 1,003 + 1,513B
Financial account (Increase: +) + 283,782 + 310,245 + 412,549 + 62,387 + 162,237 + 118,489 + 37,307 + 35,583 + 45,599C
1 Direct investment + 241,686 + 222,811 + 511 + 8,795 + 15,904 − 22,305 + 28,312 − 17,158 − 33,459
By resident units abroad + 976,478 + 411,941 + 89,353 + 27,242 − 139,883 − 2,786 + 33,192 − 403 − 35,575
By non-resident units in the euro area + 734,796 + 189,129 + 88,843 + 18,448 − 155,788 + 19,519 + 4,881 + 16,754 − 2,116
2 Portfolio investment + 96,384 + 416,553 + 384,921 + 25,986 + 148,379 + 111,309 + 46,626 + 32,745 + 31,938
By resident units abroad + 392,290 + 392,236 + 622,275 + 171,362 + 190,906 + 85,247 + 22,874 + 50,893 + 11,480
Equity and
Investment fund shares + 10,920 + 22,568 + 175,876 + 55,787 + 56,747 + 32,586 + 24,961 + 10,296 − 2,671
Long-term debt securities + 368,619 + 366,925 + 388,692 + 128,250 + 115,816 + 47,627 + 11,040 + 41,660 − 5,073
Short-term debt securities + 12,750 + 2,745 + 57,709 − 12,674 + 18,344 + 5,035 − 13,127 − 1,063 + 19,225
By non-resident units in the euro area + 295,905 − 24,317 + 237,355 + 145,377 + 42,527 − 26,062 − 23,752 + 18,148 − 20,458
Equity and
Investment fund shares + 238,775 + 83,573 + 449,462 + 164,308 + 116,043 + 78,592 + 43,291 + 15,948 + 19,353
Long-term debt securities + 91,835 − 157,034 − 203,917 − 21,865 − 71,572 − 47,064 − 45,483 + 13,086 − 14,667
Short-term debt securities − 34,707 + 49,145 − 8,187 + 2,935 − 1,943 − 57,591 − 21,560 − 10,887 − 25,144
3 Financial derivatives and
employee stock options + 87,196 + 18,505 + 9,045 − 2,345 − 10,654 − 1,130 − 232 + 543 − 1,441
4 Other investment − 152,049 − 363,335 + 19,334 + 31,524 + 8,063 + 28,568 − 34,746 + 13,131 + 50,183
Eurosystem − 25,391 − 151,295 − 172,099 − 8,922 − 10,058 − 123,337 + 32,994 + 3,531 − 159,862
General government + 19,293 + 1,807 + 9,416 − 4,087 − 4,142 + 15,634 − 113 + 999 + 14,748
MFIs (excluding the Eurosystem) − 120,298 − 151,020 + 131,756 + 18,795 + 20,567 + 109,306 − 81,481 + 1,343 + 189,444
Enterprises and households − 25,656 − 62,827 + 50,257 + 25,736 + 1,696 + 26,963 + 13,853 + 7,258 + 5,852
5 Reserve assets + 10,565 + 15,712 − 1,261 − 1,572 + 545 + 2,046 − 2,653 + 6,322 − 1,623
Net errors and omissions − 38,765 − 57,797 + 39,368 + 1,823 + 35,020 − 6,781 + 457 − 5,513 − 1,725D
* Source: ECB, according to the international standards of the Balance of Payments Manual in the 6th edition of the International Monetary Fund.

Deutsche Bundesbank
75
Monthly Report
March 2018
XII External sector 2 Major items of the balance of payments of the Federal Republic of Germany
(balances) € million
Current account Financial account (Net lending: + / net borrowing: -)
Goods (fob/fob) 1
of whichSupple-mentary Balance of of which Errorstrade Secondary capital Reserve and
Period Total Total items 2 Services 3 Primary income income account 4 Total assets omissions 5
2003 + 31,347 + 130,021 − 2,105 − 48,708 − 18,920 − 31,047 + 5,920 + 47,559 − 445 + 10,292
2004 + 101,205 + 153,166 − 6,859 − 38,713 + 16,860 − 30,109 − 119 + 112,834 − 1,470 + 11,748
2005 + 105,730 + 157,010 − 6,068 − 40,600 + 20,905 − 31,585 − 2,334 + 96,436 − 2,182 − 6,960
2006 + 135,959 + 161,447 − 4,205 − 34,641 + 41,453 − 32,300 − 1,328 + 157,142 − 2,934 + 22,511
2007 + 169,636 + 201,989 − 922 − 34,881 + 36,332 − 33,804 − 1,597 + 183,169 + 953 + 15,130
2008 + 143,318 + 184,521 − 3,586 − 31,467 + 24,724 − 34,461 − 893 + 121,336 + 2,008 − 21,088
2009 + 141,233 + 141,167 − 6,064 − 19,648 + 54,757 − 35,043 − 1,858 + 129,693 + 8,648 − 9,683
2010 + 144,890 + 161,146 − 5,892 − 27,041 + 50,665 − 39,880 + 1,219 + 92,757 + 1,613 − 53,351
2011 + 165,078 + 163,426 − 8,900 − 31,574 + 68,235 − 35,010 + 419 + 120,857 + 2,836 − 44,639
2012 + 193,590 + 200,401 − 10,518 − 32,775 + 64,858 − 38,894 − 413 + 151,417 + 1,297 − 41,759
2013 r + 190,092 + 212,662 − 3,663 − 41,376 + 62,444 − 43,639 − 563 + 225,360 + 838 + 35,831
2014 r + 218,959 + 228,185 − 5,741 − 24,491 + 56,549 − 41,283 + 2,936 + 240,116 − 2,564 + 18,221
2015 r + 271,394 + 261,135 − 2,565 − 16,918 + 67,222 − 40,044 + 534 + 239,418 − 2,213 − 32,511
2016 r + 268,811 + 267,999 − 1,845 − 19,948 + 60,639 − 39,879 + 3,468 + 257,693 + 1,686 − 14,586
2017 r + 262,669 + 265,554 + 1,256 − 16,123 + 67,357 − 54,120 − 254 + 275,748 − 1,269 + 13,333
2015 Q1 r + 61,139 + 60,343 − 1,419 − 1,734 + 19,668 − 17,138 + 353 + 31,118 − 21 − 30,375
Q2 r + 60,960 + 68,693 − 1,742 − 2,547 + 825 − 6,011 + 1,407 + 70,734 − 465 + 8,366
Q3 r + 71,126 + 67,467 + 1,030 − 10,243 + 20,490 − 6,587 + 778 + 68,865 − 1,455 − 3,039
Q4 r + 78,169 + 64,632 − 435 − 2,394 + 26,238 − 10,307 − 2,004 + 68,701 − 272 − 7,464
2016 Q1 r + 66,588 + 63,353 + 566 − 3,043 + 19,599 − 13,320 − 205 + 40,617 + 1,228 − 25,766
Q2 r + 69,819 + 76,770 − 54 − 3,707 + 125 − 3,370 + 1,009 + 62,621 + 761 − 8,207
Q3 r + 61,051 + 66,795 − 346 − 11,309 + 16,175 − 10,610 + 307 + 59,558 − 261 − 1,801
Q4 r + 71,353 + 61,082 − 2,012 − 1,889 + 24,740 − 12,579 + 2,356 + 94,897 − 43 + 21,188
2017 Q1 r + 67,955 + 65,985 + 2,402 − 2,545 + 21,296 − 16,781 + 616 + 67,316 − 360 − 1,255
Q2 r + 55,069 + 67,142 − 187 − 3,290 + 3,058 − 11,841 − 727 + 72,061 + 385 + 17,720
Q3 r + 64,203 + 68,052 − 113 − 10,737 + 17,922 − 11,035 + 904 + 54,979 + 152 − 10,127
Q4 r + 75,443 + 64,376 − 846 + 448 + 25,082 − 14,463 − 1,047 + 81,392 − 1,446 + 6,996
2015 Aug r + 16,123 + 16,881 + 680 − 4,505 + 6,479 − 2,732 + 66 + 21,646 − 180 + 5,458
Sep r + 27,883 + 25,460 + 1,234 − 2,801 + 6,781 − 1,557 + 233 + 24,264 − 105 − 3,851
Oct r + 23,432 + 23,888 + 154 − 4,576 + 7,177 − 3,058 − 57 + 23,304 + 154 − 71
Nov r + 26,547 + 22,480 − 11 − 555 + 7,448 − 2,826 + 214 + 22,559 − 548 − 4,203
Dec r + 28,190 + 18,264 − 578 + 2,736 + 11,613 − 4,423 − 2,161 + 22,839 + 123 − 3,190
2016 Jan r + 15,865 + 14,208 + 71 − 1,413 + 5,307 − 2,238 − 19 − 1,987 − 186 − 17,833
Feb r + 20,854 + 21,911 + 619 − 84 + 6,519 − 7,491 + 545 + 21,103 + 1,478 − 296
Mar r + 29,869 + 27,234 − 124 − 1,546 + 7,772 − 3,591 − 731 + 21,501 − 64 − 7,638
Apr r + 28,952 + 27,797 − 179 − 661 + 3,533 − 1,718 + 1,303 + 26,217 + 696 − 4,039
May r + 17,745 + 23,050 + 409 − 838 − 3,921 − 546 + 277 + 14,290 + 776 − 3,733
June r + 23,122 + 25,923 − 284 − 2,209 + 513 − 1,106 − 571 + 22,115 − 711 − 435
July r + 18,927 + 20,453 + 413 − 3,461 + 5,372 − 3,437 − 103 + 17,363 + 342 − 1,460
Aug r + 17,632 + 20,933 − 435 − 4,807 + 6,016 − 4,510 − 101 + 17,217 + 93 − 314
Sep r + 24,492 + 25,409 − 324 − 3,042 + 4,788 − 2,662 + 511 + 24,977 − 695 − 26
Oct r + 19,777 + 20,598 + 294 − 3,425 + 6,117 − 3,513 − 117 + 28,457 − 145 + 8,797
Nov r + 25,394 + 23,647 − 347 − 255 + 6,949 − 4,948 − 69 + 22,295 + 140 − 3,031
Dec r + 26,182 + 16,837 − 1,959 + 1,790 + 11,675 − 4,119 + 2,541 + 44,145 − 38 + 15,422
2017 Jan r + 11,873 + 15,705 + 171 − 989 + 6,851 − 9,693 − 145 + 7,119 − 124 − 4,610
Feb r + 23,363 + 22,275 + 1,022 − 559 + 6,280 − 4,634 + 291 + 14,387 − 216 − 9,267
Mar r + 32,718 + 28,004 + 1,209 − 997 + 8,165 − 2,453 + 470 + 45,810 − 21 + 12,621
Apr r + 16,680 + 19,682 + 21 − 518 + 5,852 − 8,336 − 321 + 21,216 − 2 + 4,858
May r + 15,378 + 22,995 − 968 − 1,449 − 5,295 − 872 + 85 + 11,773 − 47 − 3,690
June r + 23,010 + 24,465 + 760 − 1,323 + 2,501 − 2,632 − 491 + 39,072 + 434 + 16,552
July r + 19,191 + 21,047 + 679 − 3,594 + 6,159 − 4,420 + 525 + 14,479 + 463 − 5,237
Aug r + 18,477 + 21,530 − 765 − 4,736 + 5,158 − 3,476 + 174 + 8,062 − 912 − 10,589
Sep r + 26,535 + 25,475 − 27 − 2,407 + 6,605 − 3,139 + 204 + 32,438 + 602 + 5,699
Oct r + 19,639 + 20,765 + 393 − 3,429 + 6,527 − 4,224 − 206 + 14,393 + 1,176 − 5,040
Nov r + 26,990 + 25,158 − 587 + 225 + 6,868 − 5,260 − 536 + 28,218 − 270 + 1,764
Dec r + 28,814 + 18,453 − 652 + 3,652 + 11,687 − 4,979 − 305 + 38,781 − 2,353 + 10,272
2018 Jan p + 21,950 + 19,573 − 105 − 391 + 7,647 − 4,879 + 481 + 5,588 − 121 − 16,844
1 Excluding freight and insurance costs of foreign trade. 2 For example, warehouse acquisition/disposal of non-produced non-financial assets. 5 Statistical errors andtransactions for the account of residents, deductions of goods returned and omissions, resulting from the difference between the balance on the financialdeductions of exports and imports in connection with goods for processing. account and the balances on the current account and the capital account. 3 Including freight and insurance costs of foreign trade. 4 Including net
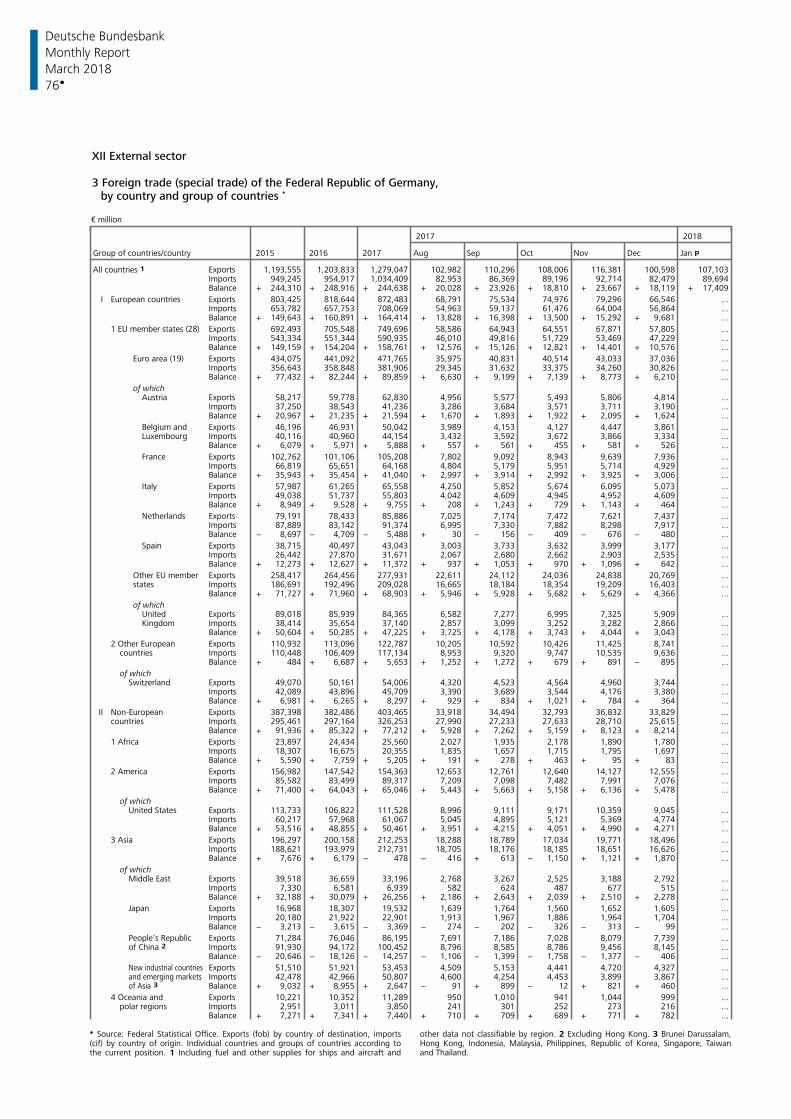
Deutsche Bundesbank
76
Monthly Report
March 2018
XII External sector 3 Foreign trade (special trade) of the Federal Republic of Germany,
by country and group of countries *
€ million
2017 2018
Group of countries/country 2015 2016 2017 Aug Sep Oct Nov Dec Jan p
All countries 1 Exports 1,193,555 1,203,833 1,279,047 102,982 110,296 108,006 116,381 100,598 107,103Imports 949,245 954,917 1,034,409 82,953 86,369 89,196 92,714 82,479 89,694Balance + 244,310 + 248,916 + 244,638 + 20,028 + 23,926 + 18,810 + 23,667 + 18,119 + 17,409
I Exports 803,425 818,644 872,483 68,791 75,534 74,976 79,296 66,546 ...European countriesImports 653,782 657,753 708,069 54,963 59,137 61,476 64,004 56,864 ...Balance + 149,643 + 160,891 + 164,414 + 13,828 + 16,398 + 13,500 + 15,292 + 9,681 ...
Exports 692,493 705,548 749,696 58,586 64,943 64,551 67,871 57,805 ...1 EU member states (28)Imports 543,334 551,344 590,935 46,010 49,816 51,729 53,469 47,229 ...Balance + 149,159 + 154,204 + 158,761 + 12,576 + 15,126 + 12,821 + 14,401 + 10,576 ...
Euro area (19) Exports 434,075 441,092 471,765 35,975 40,831 40,514 43,033 37,036 ...Imports 356,643 358,848 381,906 29,345 31,632 33,375 34,260 30,826 ...Balance + 77,432 + 82,244 + 89,859 + 6,630 + 9,199 + 7,139 + 8,773 + 6,210 ...
of whichAustria Exports 58,217 59,778 62,830 4,956 5,577 5,493 5,806 4,814 ...
Imports 37,250 38,543 41,236 3,286 3,684 3,571 3,711 3,190 ...Balance + 20,967 + 21,235 + 21,594 + 1,670 + 1,893 + 1,922 + 2,095 + 1,624 ...
Belgium and Exports 46,196 46,931 50,042 3,989 4,153 4,127 4,447 3,861 ...Luxembourg Imports 40,116 40,960 44,154 3,432 3,592 3,672 3,866 3,334 ...
Balance + 6,079 + 5,971 + 5,888 + 557 + 561 + 455 + 581 + 526 ...
France Exports 102,762 101,106 105,208 7,802 9,092 8,943 9,639 7,936 ...Imports 66,819 65,651 64,168 4,804 5,179 5,951 5,714 4,929 ...Balance + 35,943 + 35,454 + 41,040 + 2,997 + 3,914 + 2,992 + 3,925 + 3,006 ...
Italy Exports 57,987 61,265 65,558 4,250 5,852 5,674 6,095 5,073 ...Imports 49,038 51,737 55,803 4,042 4,609 4,945 4,952 4,609 ...Balance + 8,949 + 9,528 + 9,755 + 208 + 1,243 + 729 + 1,143 + 464 ...
Netherlands Exports 79,191 78,433 85,886 7,025 7,174 7,472 7,621 7,437 ...Imports 87,889 83,142 91,374 6,995 7,330 7,882 8,298 7,917 ...Balance − 8,697 − 4,709 − 5,488 + 30 − 156 − 409 − 676 − 480 ...
Spain Exports 38,715 40,497 43,043 3,003 3,733 3,632 3,999 3,177 ...Imports 26,442 27,870 31,671 2,067 2,680 2,662 2,903 2,535 ...Balance + 12,273 + 12,627 + 11,372 + 937 + 1,053 + 970 + 1,096 + 642 ...
Other EU member Exports 258,417 264,456 277,931 22,611 24,112 24,036 24,838 20,769 ...states Imports 186,691 192,496 209,028 16,665 18,184 18,354 19,209 16,403 ...
Balance + 71,727 + 71,960 + 68,903 + 5,946 + 5,928 + 5,682 + 5,629 + 4,366 ...
of whichUnited Exports 89,018 85,939 84,365 6,582 7,277 6,995 7,325 5,909 ...Kingdom Imports 38,414 35,654 37,140 2,857 3,099 3,252 3,282 2,866 ...
Balance + 50,604 + 50,285 + 47,225 + 3,725 + 4,178 + 3,743 + 4,044 + 3,043 ...
Exports 110,932 113,096 122,787 10,205 10,592 10,426 11,425 8,741 ...2 Other EuropeanImports 110,448 106,409 117,134 8,953 9,320 9,747 10,535 9,636 ...countriesBalance + 484 + 6,687 + 5,653 + 1,252 + 1,272 + 679 + 891 − 895 ...
of whichSwitzerland Exports 49,070 50,161 54,006 4,320 4,523 4,564 4,960 3,744 ...
Imports 42,089 43,896 45,709 3,390 3,689 3,544 4,176 3,380 ...Balance + 6,981 + 6,265 + 8,297 + 929 + 834 + 1,021 + 784 + 364 ...
II Exports 387,398 382,486 403,465 33,918 34,494 32,793 36,832 33,829 ...Non-EuropeanImports 295,461 297,164 326,253 27,990 27,233 27,633 28,710 25,615 ...countriesBalance + 91,936 + 85,322 + 77,212 + 5,928 + 7,262 + 5,159 + 8,123 + 8,214 ...
Exports 23,897 24,434 25,560 2,027 1,935 2,178 1,890 1,780 ...1 AfricaImports 18,307 16,675 20,355 1,835 1,657 1,715 1,795 1,697 ...Balance + 5,590 + 7,759 + 5,205 + 191 + 278 + 463 + 95 + 83 ...
Exports 156,982 147,542 154,363 12,653 12,761 12,640 14,127 12,555 ...2 AmericaImports 85,582 83,499 89,317 7,209 7,098 7,482 7,991 7,076 ...Balance + 71,400 + 64,043 + 65,046 + 5,443 + 5,663 + 5,158 + 6,136 + 5,478 ...
of whichExports 113,733 106,822 111,528 8,996 9,111 9,171 10,359 9,045 ...United StatesImports 60,217 57,968 61,067 5,045 4,895 5,121 5,369 4,774 ...Balance + 53,516 + 48,855 + 50,461 + 3,951 + 4,215 + 4,051 + 4,990 + 4,271 ...
Exports 196,297 200,158 212,253 18,288 18,789 17,034 19,771 18,496 ...3 AsiaImports 188,621 193,979 212,731 18,705 18,176 18,185 18,651 16,626 ...Balance + 7,676 + 6,179 − 478 − 416 + 613 − 1,150 + 1,121 + 1,870 ...
of whichMiddle East Exports 39,518 36,659 33,196 2,768 3,267 2,525 3,188 2,792 ...
Imports 7,330 6,581 6,939 582 624 487 677 515 ...Balance + 32,188 + 30,079 + 26,256 + 2,186 + 2,643 + 2,039 + 2,510 + 2,278 ...
Japan Exports 16,968 18,307 19,532 1,639 1,764 1,560 1,652 1,605 ...Imports 20,180 21,922 22,901 1,913 1,967 1,886 1,964 1,704 ...Balance − 3,213 − 3,615 − 3,369 − 274 − 202 − 326 − 313 − 99 ...
Exports 71,284 76,046 86,195 7,691 7,186 7,028 8,079 7,739 ...People‘s RepublicImports 91,930 94,172 100,452 8,796 8,585 8,786 9,456 8,145 ...of China 2 Balance − 20,646 − 18,126 − 14,257 − 1,106 − 1,399 − 1,758 − 1,377 − 406 ...
Exports 51,510 51,921 53,453 4,509 5,153 4,441 4,720 4,327 ...New industrial countriesImports 42,478 42,966 50,807 4,600 4,254 4,453 3,899 3,867 ...and emerging marketsBalance + 9,032 + 8,955 + 2,647 − 91 + 899 − 12 + 821 + 460 ...of Asia 3
Exports 10,221 10,352 11,289 950 1,010 941 1,044 999 ...4 Oceania andImports 2,951 3,011 3,850 241 301 252 273 216 ...polar regionsBalance + 7,271 + 7,341 + 7,440 + 710 + 709 + 689 + 771 + 782 ...
* Source: Federal Statistical Office. Exports (fob) by country of destination, imports other data not classifiable by region. 2 Excluding Hong Kong. 3 Brunei Darussalam,(cif) by country of origin. Individual countries and groups of countries according to Hong Kong, Indonesia, Malaysia, Philippines, Republic of Korea, Singapore, Taiwanthe current position. 1 Including fuel and other supplies for ships and aircraft and and Thailand.

Deutsche Bundesbank
77
Monthly Report
March 2018
XII External sector 4 Services and Primary income of the Federal Republic of Germany (balances) € million
Services 1 Primary income
of which
Tele-communi-
Charges for cations,the use of Other Government Othercomputer and
Financial information business goods and Investment primaryintellectual CompensationPeriod Total Transport Travel 2 services property services services services 3 income income 4 of employees
2013 − 41,376 − 9,881 − 37,713 + 8,056 + 3,656 − 870 − 5,518 + 3,073 + 541 + 60,681 + 1,2232014 − 24,491 − 6,902 − 37,653 + 7,002 + 3,549 + 2,666 − 702 + 2,971 + 1,184 + 54,473 + 8912015 − 16,918 − 5,258 − 36,595 + 9,583 + 4,831 + 4,052 − 2,483 + 3,160 + 1,521 + 66,048 − 3472016 − 19,948 − 6,185 − 38,247 + 9,856 + 6,203 + 3,224 − 3,004 + 3,094 + 750 + 60,943 − 1,0542017 − 16,123 − 4,047 − 38,832 + 10,683 + 6,494 + 3,252 − 1,686 + 2,092 − 36 + 68,622 − 1,229
2016 Q2 − 3,707 − 1,116 − 8,631 + 2,343 + 1,110 + 1,235 − 694 + 827 + 70 + 2,350 − 2,294 Q3 − 11,309 − 1,449 − 15,946 + 2,038 + 1,554 + 523 − 25 + 828 − 469 + 17,826 − 1,182 Q4 − 1,889 − 1,888 − 7,385 + 3,241 + 2,366 + 1,236 − 1,605 + 596 + 307 + 21,418 + 3,015
2017 Q1 − 2,545 − 1,257 − 5,956 + 2,207 + 1,029 + 377 − 855 + 551 + 589 + 21,868 − 1,162 Q2 − 3,290 − 407 − 9,179 + 2,655 + 1,538 + 893 − 608 + 625 − 203 + 5,303 − 2,042 Q3 − 10,737 − 1,134 − 16,110 + 2,746 + 1,433 + 512 + 54 + 545 − 620 + 19,690 − 1,148 Q4 + 448 − 1,249 − 7,587 + 3,076 + 2,494 + 1,470 − 277 + 370 + 197 + 21,761 + 3,123
2017 Mar − 997 − 483 − 2,921 + 806 + 412 + 625 − 112 + 103 + 169 + 8,385 − 389
Apr − 518 − 109 − 1,760 + 908 + 690 − 390 − 388 + 248 − 77 + 6,373 − 444 May − 1,449 − 144 − 3,049 + 958 + 261 + 225 − 393 + 238 − 67 − 3,572 − 1,657 June − 1,323 − 154 − 4,371 + 789 + 587 + 1,058 + 172 + 139 − 59 + 2,501 + 58
July − 3,594 − 214 − 4,879 + 892 + 730 − 106 − 576 + 172 − 219 + 6,747 − 369 Aug − 4,736 − 473 − 6,429 + 1,193 + 435 + 70 − 224 + 244 − 203 + 5,773 − 412 Sep − 2,407 − 447 − 4,801 + 661 + 268 + 548 + 853 + 129 − 199 + 7,170 − 366
Oct − 3,429 − 453 − 5,365 + 775 + 1,240 − 5 − 272 + 231 + 52 + 6,979 − 504 Nov + 225 − 400 − 1,641 + 1,353 + 586 + 162 − 367 + 174 + 57 + 7,151 − 340 Dec + 3,652 − 396 − 582 + 948 + 668 + 1,312 + 362 − 35 + 88 + 7,632 + 3,968
2018 Jan p − 391 − 274 − 1,649 + 787 + 239 − 269 + 66 + 191 + 182 + 7,867 − 401
1 Including freight and insurance costs of foreign trade. 2 Since 2001, the sample including the receipts from foreign military bases. 4 Includes, inter alia, taxes onresults of a household survey have been used on the expenditure side. 3 Domestic leasing, production and imports transferred to the EU as well as subsidies receivedpublic authorities’ receipts from and expenditure on services, not included elsewhere; from the EU.
5 Secondary income of the Federal Republic of Germany 6 Capital account of the Federal(balances) Republic of Germany
(balances)
€ million € million
General government All sectors excluding general government 2
of which of which
Personal transfersCurrent between
Current taxes on of whichresident and Non-producedinternational nonresident Workers’ Capitalincome, wealth non-financial
Period Total Total etc. Total remittances Total assets transferscooperation 1 households 3
2013 − 43,639 − 28,923 − 4,733 + 6,174 − 14,715 − 3,250 − 3,229 − 563 + 1,105 − 1,6682014 − 41,283 − 28,146 − 6,419 + 8,105 − 13,137 − 3,477 − 3,451 + 2,936 + 2,841 + 952015 − 40,044 − 23,965 − 6,805 + 10,638 − 16,079 − 3,540 − 3,523 + 534 + 2,366 − 1,8322016 − 39,879 − 24,870 − 11,523 + 10,994 − 15,009 − 4,214 − 4,196 + 3,468 + 3,372 + 962017 − 54,120 − 23,689 − 11,496 + 10,584 − 30,431 − 4,632 − 4,613 − 254 + 3,021 − 3,275
2016 Q2 − 3,370 + 296 − 2,070 + 6,570 − 3,666 − 1,053 − 1,049 + 1,009 + 2,216 − 1,206 Q3 − 10,610 − 6,813 − 2,583 + 1,782 − 3,797 − 1,053 − 1,049 + 307 + 887 − 579 Q4 − 12,579 − 8,362 − 3,186 + 1,325 − 4,217 − 1,055 − 1,049 + 2,356 + 791 + 1,565
2017 Q1 − 16,781 − 7,604 − 2,995 + 1,796 − 9,176 − 1,158 − 1,153 + 616 + 734 − 118 Q2 − 11,841 − 1,706 − 1,500 + 6,239 − 10,135 − 1,159 − 1,153 − 727 + 384 − 1,111 Q3 − 11,035 − 5,432 − 1,557 + 1,755 − 5,603 − 1,157 − 1,153 + 904 + 1,531 − 627 Q4 − 14,463 − 8,946 − 5,444 + 794 − 5,517 − 1,159 − 1,153 − 1,047 + 372 − 1,419
2017 Mar − 2,453 − 1,321 − 358 + 880 − 1,132 − 386 − 384 + 470 + 715 − 245
Apr − 8,336 − 1,796 − 423 + 824 − 6,540 − 385 − 384 − 321 − 68 − 253 May − 872 + 895 − 199 + 3,236 − 1,768 − 387 − 384 + 85 + 202 − 117 June − 2,632 − 805 − 878 + 2,178 − 1,827 − 387 − 384 − 491 + 250 − 741
July − 4,420 − 2,562 − 933 + 492 − 1,859 − 386 − 384 + 525 + 703 − 178 Aug − 3,476 − 1,441 − 395 + 465 − 2,035 − 386 − 384 + 174 + 334 − 160 Sep − 3,139 − 1,430 − 229 + 799 − 1,709 − 386 − 384 + 204 + 494 − 290
Oct − 4,224 − 2,939 − 1,036 + 108 − 1,285 − 387 − 384 − 206 − 6 − 200 Nov − 5,260 − 2,807 − 1,685 + 70 − 2,453 − 386 − 384 − 536 + 78 − 614 Dec − 4,979 − 3,201 − 2,723 + 615 − 1,778 − 386 − 384 − 305 + 300 − 605
2018 Jan p − 4,879 − 3,362 − 1,174 + 228 − 1,518 − 431 − 429 + 481 + 130 + 352
1 Excluding capital transfers, where identifiable. Includes current international (excluding life insurance policies). 3 Transfers between resident and non-residentcooperation and other current transfers. 2 Includes insurance premiums and claims households.

Deutsche Bundesbank
78
Monthly Report
March 2018
XII External sector 7 Financial account of the Federal Republic of Germany
(net)
€ million
2017 2018
Item 2015 2016 2017 Q2 Q3 Q4 Nov Dec Jan p
I Net domestic investment abroad(Increase: +) + 270,235 + 397,043 + 358,805 + 41,375 + 56,779 + 32,754 + 31,912 + 24,917 + 69,751
1 Direct investment + 116,141 + 82,985 + 111,797 + 19,250 + 20,572 + 27,372 + 7,310 + 7,973 + 11,386
Equity + 75,292 + 70,623 + 71,205 + 13,586 + 16,953 + 22,786 + 5,670 + 10,668 + 10,730of whichReinvestment of earnings 1 + 16,804 + 10,867 + 23,779 + 6,006 + 8,291 + 3,009 + 1,896 − 3,673 + 2,750
Debt instruments + 40,849 + 12,362 + 40,592 + 5,664 + 3,620 + 4,585 + 1,640 − 2,695 + 656
2 Portfolio investment + 124,062 + 98,236 + 105,157 + 20,014 + 30,407 + 23,329 + 9,591 + 7,106 + 32,472
Shares 2 + 19,692 + 17,254 + 14,042 − 2,388 + 5,116 + 5,695 + 1,176 + 3,124 + 6,206Investment fund shares 3 + 35,750 + 36,142 + 47,747 + 4,699 + 10,718 + 14,687 + 1,945 + 5,528 + 9,785Long-termdebt securities 4 + 74,342 + 51,037 + 47,101 + 19,249 + 15,231 + 7,636 + 6,493 + 1,577 + 14,235Short-termdebt securities 5 − 5,723 − 6,196 − 3,733 − 1,546 − 658 − 4,689 − 22 − 3,123 + 2,246
3. Financial derivatives andemployee stock options 6 + 26,026 + 32,535 + 8,937 + 2,623 + 2,064 + 4,038 + 2,537 + 118 + 154
4. Other investment 7 + 6,219 + 181,602 + 134,183 − 897 + 3,584 − 20,539 + 12,744 + 12,072 + 25,861
Monetary financial institutions 8 − 90,288 + 18,627 − 21,008 − 26,653 − 16,029 − 50,588 − 5,692 − 30,091 + 42,030Long-term − 2,804 + 44,980 + 19,619 + 2,603 − 1,400 + 5,438 − 1,886 + 6,610 − 1,342Short-term − 87,484 − 26,353 − 40,627 − 29,255 − 14,629 − 56,026 − 3,806 − 36,701 + 43,372
Enterprises andhouseholds 9 − 14,618 − 6,248 + 3,708 − 3,300 + 3,174 − 267 + 8,567 − 10,580 + 8,476
Long-term + 19,127 + 1,725 − 3,372 − 1,022 − 818 − 1,290 − 701 − 830 + 459Short-term − 33,744 − 7,974 + 7,080 − 2,277 + 3,991 + 1,023 + 9,268 − 9,750 + 8,017
General government − 12,239 − 1,268 − 5,154 − 2,365 − 2,690 + 991 + 2,654 − 1,034 + 2,594Long-term − 7,591 − 7,595 − 3,730 − 1,040 − 425 − 489 − 122 − 342 + 115Short-term − 4,648 + 6,327 − 1,424 − 1,325 − 2,265 + 1,480 + 2,776 − 692 + 2,479
Bundesbank + 123,364 + 170,491 + 156,637 + 31,420 + 19,129 + 29,324 + 7,215 + 53,777 − 27,240
5. Reserve assets − 2,213 + 1,686 − 1,269 + 385 + 152 − 1,446 − 270 − 2,353 − 121
II Net foreign investmentin the reporting country(Increase: +) + 30,817 + 139,350 + 83,057 − 30,686 + 1,799 − 48,638 + 3,694 − 13,865 + 64,163
1 Direct investment + 48,606 + 51,816 + 69,548 + 6,752 + 21,377 + 12,040 + 12,318 − 2,776 + 4,973
Equity + 10,567 + 11,894 + 24,077 + 1,362 + 6,047 + 10,118 + 3,372 + 4,509 + 101of whichReinvestment of earnings 1 − 1,524 + 3,935 + 9,216 + 574 + 3,331 + 2,107 + 579 − 145 + 347
Debt instruments + 38,039 + 39,921 + 45,471 + 5,390 + 15,330 + 1,922 + 8,946 − 7,285 + 4,872
2 Portfolio investment − 68,808 − 108,471 − 95,045 − 140 − 28,130 − 46,598 − 2,725 − 25,813 + 15,666
Shares 2) + 10,605 + 342 − 1,126 + 108 − 2,311 − 821 − 844 − 2,671 − 1,366Investment fund shares 3 + 7,357 − 6,919 − 3,441 − 1,308 + 656 − 2,894 − 4,755 + 844 + 905Long-termdebt securities 4 − 96,048 − 97,281 − 70,559 + 3,057 − 21,125 − 40,436 + 4,927 − 23,105 + 32,603Short-termdebt securities 5 + 9,278 − 4,613 − 19,919 − 1,997 − 5,349 − 2,447 − 2,053 − 880 − 16,476
3. Other investment 7 + 51,019 + 196,006 + 108,554 − 37,298 + 8,552 − 14,080 − 5,899 + 14,724 + 43,524
Monetary financial institutions 8 − 41,165 + 86,742 + 17,476 − 19,099 − 3,551 − 67,367 + 11,643 − 75,626 + 92,805Long-term − 19,535 + 5,774 + 7,541 + 180 − 1,325 + 5,550 + 1,071 + 3,387 − 1,827Short-term − 21,630 + 80,968 + 9,935 − 19,279 − 2,226 − 72,917 + 10,572 − 79,013 + 94,632
Enterprises andhouseholds 9 + 18,920 + 3,716 + 17,557 − 17,944 + 6,933 + 16,752 + 6,575 + 9,609 − 4,611
Long-term + 23,006 + 8,579 + 3,339 − 698 + 3,252 − 328 − 659 − 2,730 + 1,813Short-term − 4,085 − 4,863 + 14,218 − 17,246 + 3,681 + 17,079 + 7,234 + 12,339 − 6,425
General government − 11,105 − 5,309 − 6,313 − 1,304 + 6,057 − 12,219 + 133 − 10,944 + 3,663Long-term − 3,941 − 4,682 − 3,290 − 847 + 244 + 170 + 0 + 52 + 39Short-term − 7,164 − 626 − 3,023 − 457 + 5,813 − 12,389 + 133 − 10,995 + 3,624
Bundesbank + 84,369 + 110,857 + 79,834 + 1,048 − 886 + 48,754 − 24,251 + 91,685 − 48,333
III Net financial account(Net lending: + / net borrowing: -) + 239,418 + 257,693 + 275,748 + 72,061 + 54,979 + 81,392 + 28,218 + 38,781 + 5,588
1 Estimate based on data on direct investment stocks abroad and in the Federal arising from options and financial futures contracts as well as employee stockRepublic of Germany (see Special Statistical Publication 10). 2 Including participation options. 7 Includes in particular loans, trade credits as well as currency and deposits.certificates. 3 Including reinvestment of earnings. 4 Up to and including 2012, 8 Excluding Bundesbank. 9 Includes the following sectors: financial corporationswithout accrued interest. Long-term: original maturity of more than one year or (excluding monetary financial institutions) as well as non-financial corporations,unlimited. 5 Short-term: original maturity up to one year. 6 Balance of transactions households and non-profit institutions serving households.

Deutsche Bundesbank
79
Monthly Report
March 2018
XII. External sector
8. External position of the Bundesbank o
€ million
External assets
Reserve assets Other investment
of which NetClearing external
Special Reserve Currency, accounts positiondrawing within the Portfolio External-Gold and gold position in deposits and (col 1 minusEnd of reporting
period Total Total rights the IMF securities Total ESCB 1 col 10)receivables investment 2 liabilities 3,4
1 2 3 4 5 6 7 8 9 10 11
1999 Jan 5 95,316 93,940 29,312 1,598 6,863 56,167 1,376 − − 9,628 85,688
1999 141,958 93,039 32,287 1,948 6,383 52,420 48,919 26,275 − 7,830 134,128
2000 100,762 93,815 32,676 1,894 5,868 53,377 6,947 − 6,851 − 8,287 92,475
2001 76,147 93,215 35,005 2,032 6,689 49,489 − 17,068 − 30,857 − 10,477 65,670
2002 103,948 85,002 36,208 1,888 6,384 40,522 18,780 4,995 166 66,278 37,670
2003 95,394 76,680 36,533 1,540 6,069 32,538 18,259 4,474 454 83,329 12,065
2004 93,110 71,335 35,495 1,512 5,036 29,292 21,110 7,851 665 95,014 − 1,904
2005 130,268 86,181 47,924 1,601 2,948 33,708 43,184 29,886 902 115,377 14,891
2006 104,389 84,765 53,114 1,525 1,486 28,640 18,696 5,399 928 134,697 − 30,308
2007 179,492 92,545 62,433 1,469 949 27,694 84,420 71,046 2,527 176,569 2,923
2008 230,775 99,185 68,194 1,576 1,709 27,705 129,020 115,650 2,570 237,893 − 7,118
2009 323,286 125,541 83,939 13,263 2,705 25,634 190,288 177,935 7,458 247,645 75,641
2010 524,695 162,100 115,403 14,104 4,636 27,957 337,921 325,553 24,674 273,241 251,454
2011 714,662 184,603 132,874 14,118 8,178 29,433 475,994 463,311 54,065 333,730 380,932
2012 921,002 188,630 137,513 13,583 8,760 28,774 668,672 655,670 63,700 424,999 496,003
2013 721,741 143,753 94,876 12,837 7,961 28,080 523,153 510,201 54,834 401,524 320,217
2014 678,804 158,745 107,475 14,261 6,364 30,646 473,274 460,846 46,784 396,314 282,490
2015 800,709 159,532 105,792 15,185 5,132 33,423 596,638 584,210 44,539 481,787 318,921
2016 990,450 175,765 119,253 14,938 6,581 34,993 767,128 754,263 47,557 592,731 397,719
2017 1,142,845 166,842 117,347 13,987 4,294 31,215 923,765 906,941 52,238 675,253 467,592
2015 June 756,263 168,299 113,838 15,000 5,617 33,844 543,502 531,074 44,461 439,896 316,366
July 763,247 163,071 108,872 15,172 4,919 34,107 555,013 542,585 45,162 444,698 318,549
Aug 781,286 162,917 110,012 14,934 5,164 32,807 573,712 561,284 44,657 440,941 340,345
Sep 774,428 161,922 108,959 14,941 5,191 32,831 567,602 555,174 44,903 462,513 311,915
Oct 786,694 166,664 112,836 15,126 5,199 33,503 575,246 562,818 44,784 468,506 318,187
Nov 813,320 163,816 108,820 15,475 5,217 34,303 604,946 592,518 44,558 482,764 330,555
Dec 800,709 159,532 105,792 15,185 5,132 33,423 596,638 584,210 44,539 481,787 318,921
2016 Jan 807,971 164,656 111,126 15,055 5,197 33,278 599,427 587,000 43,888 473,104 334,867
Feb 839,336 177,917 122,535 15,109 6,899 33,374 617,434 605,006 43,985 489,464 349,871
Mar 837,375 171,266 117,844 14,730 6,730 31,962 621,617 609,190 44,491 492,119 345,256
Apr 856,266 175,738 121,562 14,793 6,759 32,623 638,201 625,774 42,327 495,580 360,687
May 884,887 173,927 118,133 14,970 6,839 33,984 667,972 655,544 42,988 501,620 383,267
June 922,232 184,628 128,963 14,746 6,780 34,139 693,498 681,070 44,106 518,491 403,741
July 904,044 186,300 130,417 14,698 6,736 34,449 672,748 660,320 44,996 518,946 385,099
Aug 918,692 183,951 128,171 14,685 6,642 34,452 689,906 677,479 44,834 525,347 393,345
Sep 957,860 183,796 128,795 14,657 6,605 33,738 728,554 715,738 45,510 549,909 407,951
Oct 947,718 181,623 126,245 14,708 6,631 34,039 720,795 708,029 45,300 543,001 404,717
Nov 991,108 177,348 121,032 14,917 6,572 34,826 766,905 754,057 46,855 552,565 438,543
Dec 990,450 175,765 119,253 14,938 6,581 34,993 767,128 754,263 47,557 592,731 397,719
2017 Jan 1,034,804 177,256 121,656 14,806 6,523 34,270 809,862 795,621 47,687 577,969 456,835
Feb 1,060,894 184,666 128,507 14,976 6,248 34,935 828,264 814,375 47,964 609,255 451,639
Mar 1,075,039 181,898 126,158 14,886 6,183 34,671 843,892 829,751 49,249 623,579 451,460
Apr 1,089,144 180,726 126,011 14,697 6,055 33,963 858,281 843,439 50,137 601,538 487,606
May 1,098,879 175,958 122,486 14,459 5,907 33,107 871,724 857,272 51,197 601,130 497,749
June 1,098,880 171,295 118,235 14,349 5,695 33,016 875,312 860,764 52,273 623,941 474,939
July 1,092,769 169,735 117,330 14,124 5,531 32,750 871,752 856,510 51,282 614,300 478,469
Aug 1,089,883 171,044 119,770 14,071 5,530 31,673 867,696 852,511 51,143 623,104 466,780
Sep 1,115,200 169,937 118,208 14,089 5,471 32,169 894,441 878,888 50,821 622,729 492,470
Oct 1,085,916 172,047 118,569 14,208 5,446 33,824 862,772 848,443 51,097 605,438 480,477
Nov 1,091,832 169,539 117,208 14,069 5,168 33,094 869,988 855,548 52,305 582,362 509,470
Dec 1,142,845 166,842 117,347 13,987 4,294 31,215 923,765 906,941 52,238 675,253 467,592
2018 Jan 1,114,634 164,944 117,008 13,776 4,166 29,994 896,525 882,043 53,165 622,756 491,878
Feb 1,147,979 166,370 117,138 13,949 4,138 31,146 928,275 913,989 53,333 645,473 502,506
o Assets and liabilities vis-à-vis all countries within and outside the euro area. Up to the respektive country designation), since November 2000 also balances withDecember 2000, the levels at the end of each quarter are shown, owing to revalua- non-euro area central banks within the ESCB. 2 Mainly long-term debt securities fromtions, at market prices; within each quarter, however, the levels are computed on the issuers within the euro area. 3 Including estimates of currency in circulation abroad.basis of cumulative transaction values. From January 2001, all end-of-month levels 4 See Deutsche Bundesbank, Monthly Report, October 2014, p 22. 5 Euro openingare valued at market prices. 1 Mainly net claims on TARGET2 balances (according to balance sheet of the Bundesbank as at 1 January 1999.

Deutsche Bundesbank
80
Monthly Report
March 2018
XII External sector 9 Assets and liabilities of enterprises in Germany (other than banks)
vis-à-vis non-residents *
€ million
Claims on non-residents Liabilities vis-à-vis non-residents
Claims on foreign non-banks Liabilities vis-à-vis foreign non-banks
from trade credits from trade credits
Balances Loanswith from Credit Advance from from Credit Advance
End of year foreign financial terms payments foreign financial terms paymentsor month Total banks Total Total granted effected Total banks Total Total used receivedoperations operations
All countries
2014 835,476 280,176 555,301 365,738 189,562 174,764 14,798 963,495 154,960 808,534 639,186 169,348 102,535 66,8132015 875,758 264,291 611,467 415,697 195,770 181,271 14,499 1,018,333 152,109 866,224 681,923 184,301 112,677 71,6252016 r 870,375 243,728 626,646 416,534 210,112 195,934 14,179 1,045,869 131,535 914,333 717,688 196,646 124,059 72,5872017 r 879,462 216,300 663,162 438,824 224,338 210,673 13,666 1,073,004 136,001 937,003 738,896 198,107 129,693 68,413
2017 Aug 860,509 213,449 647,061 441,151 205,910 192,346 13,564 1,055,848 117,739 938,109 750,790 187,320 113,160 74,160 Sep 878,860 218,617 660,243 442,823 217,419 203,673 13,746 1,053,405 122,642 930,763 734,568 196,195 123,425 72,771
Oct 887,915 219,737 668,178 450,974 217,204 203,124 14,080 1,056,509 121,789 934,721 738,113 196,608 122,555 74,053 Nov 895,596 225,367 670,229 448,628 221,601 207,354 14,247 1,071,330 127,385 943,945 746,594 197,351 124,782 72,569 Dec 879,462 216,300 663,162 438,824 224,338 210,673 13,666 1,073,004 136,001 937,003 738,896 198,107 129,693 68,413
2018 Jan 884,392 224,932 659,461 437,265 222,195 208,372 13,824 1,071,467 130,617 940,850 745,795 195,056 125,546 69,509
Industrial countries 1 2014 735,152 275,277 459,876 330,740 129,136 116,037 13,099 872,950 153,807 719,142 598,249 120,894 85,432 35,4612015 767,018 260,389 506,629 373,705 132,924 119,877 13,047 918,524 147,252 771,272 644,228 127,044 91,130 35,9142016 r 754,210 239,866 514,344 374,776 139,568 126,889 12,679 943,314 127,540 815,774 682,238 133,536 96,378 37,1582017 r 761,078 212,247 548,830 396,409 152,422 140,229 12,193 969,214 129,153 840,060 701,848 138,212 104,583 33,629
2017 Aug 747,060 209,554 537,506 398,813 138,693 126,794 11,899 961,471 113,127 848,344 718,194 130,149 93,098 37,051 Sep 763,512 214,609 548,904 401,208 147,696 135,578 12,118 952,105 113,255 838,849 701,999 136,850 100,555 36,295
Oct 771,712 215,632 556,080 408,804 147,276 134,761 12,515 954,526 112,546 841,980 705,013 136,967 100,178 36,790 Nov 780,165 221,397 558,768 406,516 152,252 139,657 12,594 968,879 118,802 850,077 710,547 139,530 103,354 36,176 Dec 761,078 212,247 548,830 396,409 152,422 140,229 12,193 969,214 129,153 840,060 701,848 138,212 104,583 33,629
2018 Jan 766,634 220,858 545,776 394,405 151,371 139,174 12,198 967,080 121,889 845,191 708,526 136,665 102,209 34,456
EU member states 1 2014 618,804 260,133 358,671 266,920 91,752 81,141 10,611 727,491 139,209 588,282 504,292 83,989 56,842 27,1472015 630,450 242,362 388,088 293,629 94,459 83,964 10,495 751,636 136,375 615,261 530,824 84,437 58,686 25,7512016 r 611,322 221,947 389,375 292,074 97,300 87,283 10,017 767,040 117,466 649,573 561,444 88,129 61,234 26,8952017 r 605,152 192,336 412,815 305,890 106,925 97,037 9,889 796,346 112,898 683,448 587,325 96,123 71,906 24,217
2017 Aug 591,391 190,339 401,052 302,770 98,282 88,728 9,554 789,693 100,965 688,727 598,900 89,828 63,581 26,246 Sep 604,502 194,643 409,859 305,823 104,036 94,232 9,804 778,826 101,304 677,522 582,791 94,732 68,693 26,039
Oct 609,634 194,952 414,683 310,322 104,360 94,203 10,158 779,998 100,721 679,277 584,608 94,669 68,381 26,288 Nov 619,085 200,916 418,169 310,296 107,873 97,628 10,245 790,066 103,019 687,047 589,805 97,242 71,016 26,226 Dec 605,152 192,336 412,815 305,890 106,925 97,037 9,889 796,346 112,898 683,448 587,325 96,123 71,906 24,217
2018 Jan 612,204 200,772 411,432 304,465 106,967 97,003 9,964 796,082 106,207 689,875 594,441 95,434 70,716 24,718
of which: Euro-area 2 2014 457,077 204,589 252,488 194,201 58,288 52,067 6,221 607,716 107,561 500,155 445,643 54,513 37,580 16,9332015 468,303 195,218 273,085 211,614 61,471 54,892 6,579 605,579 94,369 511,210 458,386 52,824 38,178 14,6462016 r 449,741 169,681 280,060 215,560 64,500 57,774 6,726 614,469 77,067 537,402 481,462 55,940 41,076 14,8642017 r 451,112 148,460 302,652 230,442 72,211 64,753 7,458 634,898 74,496 560,402 495,566 64,836 50,038 14,798
2017 Aug 433,513 144,124 289,388 224,215 65,174 57,979 7,195 641,346 65,092 576,254 516,173 60,081 44,730 15,351 Sep 442,554 147,862 294,693 226,364 68,328 60,954 7,374 626,455 64,238 562,217 500,236 61,981 46,863 15,118
Oct 449,504 150,417 299,087 230,136 68,952 61,349 7,603 630,901 65,760 565,141 502,337 62,804 47,417 15,386 Nov 456,305 152,788 303,518 231,960 71,557 63,876 7,681 638,867 67,515 571,352 506,294 65,058 49,685 15,374 Dec 451,112 148,460 302,652 230,442 72,211 64,753 7,458 634,898 74,496 560,402 495,566 64,836 50,038 14,798
2018 Jan 452,966 155,461 297,504 226,319 71,185 63,663 7,522 635,538 68,010 567,528 505,273 62,255 47,060 15,194
Emerging economies and developing countries 3 2014 100,274 4,849 95,425 34,998 60,427 58,728 1,699 90,545 1,153 89,392 40,937 48,455 17,103 31,3522015 107,753 3,094 104,659 41,992 62,667 61,215 1,452 95,639 886 94,752 37,495 57,257 21,547 35,7112016 r 114,754 2,616 112,138 41,742 70,396 68,896 1,500 99,412 1,069 98,342 35,250 63,093 27,681 35,4122017 r 116,755 2,619 114,136 42,373 71,764 70,291 1,472 97,759 1,110 96,650 36,848 59,802 25,110 34,692
2017 Aug 111,917 2,585 109,332 42,295 67,037 65,372 1,664 90,605 1,161 89,444 32,395 57,048 20,022 37,026 Sep 113,812 2,699 111,113 41,573 69,540 67,913 1,628 92,774 1,181 91,593 32,369 59,224 22,831 36,393
Oct 114,564 2,695 111,869 42,126 69,743 68,178 1,565 93,578 1,136 92,441 32,900 59,541 22,340 37,201 Nov 113,812 2,553 111,259 42,069 69,190 67,537 1,652 94,707 1,138 93,568 35,847 57,721 21,390 36,331 Dec 116,755 2,619 114,136 42,373 71,764 70,291 1,472 97,759 1,110 96,650 36,848 59,802 25,110 34,692
2018 Jan 116,018 2,539 113,479 42,794 70,686 69,059 1,626 96,432 1,091 95,341 37,069 58,272 23,307 34,965
* The assets and liabilities vis-à-vis non-residents of banks (MFIs) in Germany are including Latvia; from January 2015 including Lithuania. 3 All countries that are notshown in Table 4 of Section IV, “Banks”. Statistical increases and decreases have not regarded as industrial countries. Up to June 2013 including Croatia. r The revisionsbeen eliminated; to this extent, the changes in totals are not comparable with the fi- include late and correction reports. gures shown in Table XI.7. 1 From July 2013 including Croatia. 2 From January 2014

Deutsche Bundesbank
81
Monthly Report
March 2018
XII External sector
10 ECB’s euro foreign exchange reference rates of selected currencies *
EUR 1 = currency units ...
Yearly Australia Canada China Denmark Japan Norway Sweden Switzerland United StatesUnited Kingdomor monthly average AUD CAD CNY 1 DKK JPY NOK SEK CHF GBP USD
2000 1.5889 1.3706 2 7.6168 7.4538 99.47 8.1129 8.4452 1.5579 0.60948 0.92362001 1.7319 1.3864 7.4131 7.4521 108.68 8.0484 9.2551 1.5105 0.62187 0.89562002 1.7376 1.4838 7.8265 7.4305 118.06 7.5086 9.1611 1.4670 0.62883 0.94562003 1.7379 1.5817 9.3626 7.4307 130.97 8.0033 9.1242 1.5212 0.69199 1.13122004 1.6905 1.6167 10.2967 7.4399 134.44 8.3697 9.1243 1.5438 0.67866 1.2439
2005 1.6320 1.5087 10.1955 7.4518 136.85 8.0092 9.2822 1.5483 0.68380 1.24412006 1.6668 1.4237 10.0096 7.4591 146.02 8.0472 9.2544 1.5729 0.68173 1.25562007 1.6348 1.4678 10.4178 7.4506 161.25 8.0165 9.2501 1.6427 0.68434 1.37052008 1.7416 1.5594 10.2236 7.4560 152.45 8.2237 9.6152 1.5874 0.79628 1.47082009 1.7727 1.5850 9.5277 7.4462 130.34 8.7278 10.6191 1.5100 0.89094 1.3948
2010 1.4423 1.3651 8.9712 7.4473 116.24 8.0043 9.5373 1.3803 0.85784 1.32572011 1.3484 1.3761 8.9960 7.4506 110.96 7.7934 9.0298 1.2326 0.86788 1.39202012 1.2407 1.2842 8.1052 7.4437 102.49 7.4751 8.7041 1.2053 0.81087 1.28482013 1.3777 1.3684 8.1646 7.4579 129.66 7.8067 8.6515 1.2311 0.84926 1.32812014 1.4719 1.4661 8.1857 7.4548 140.31 8.3544 9.0985 1.2146 0.80612 1.3285
2015 1.4777 1.4186 6.9733 7.4587 134.31 8.9496 9.3535 1.0679 0.72584 1.10952016 1.4883 1.4659 7.3522 7.4452 120.20 9.2906 9.4689 1.0902 0.81948 1.10692017 1.4732 1.4647 7.6290 7.4386 126.71 9.3270 9.6351 1.1117 0.87667 1.1297
2017 Mar 1.4018 1.4306 7.3692 7.4356 120.68 9.0919 9.5279 1.0706 0.86560 1.0685
Apr 1.4241 1.4408 7.3892 7.4376 118.29 9.1993 9.5941 1.0727 0.84824 1.0723 May 1.4878 1.5041 7.6130 7.4400 124.09 9.4001 9.7097 1.0904 0.85554 1.1058 June 1.4861 1.4941 7.6459 7.4376 124.58 9.4992 9.7538 1.0874 0.87724 1.1229
July 1.4772 1.4641 7.7965 7.4366 129.48 9.3988 9.5892 1.1059 0.88617 1.1511 Aug 1.4919 1.4889 7.8760 7.4379 129.70 9.3201 9.5485 1.1398 0.91121 1.1807 Sep 1.4946 1.4639 7.8257 7.4401 131.92 9.3275 9.5334 1.1470 0.89470 1.1915
Oct 1.5099 1.4801 7.7890 7.4429 132.76 9.3976 9.6138 1.1546 0.89071 1.1756 Nov 1.5395 1.4978 7.7723 7.4420 132.39 9.6082 9.8479 1.1640 0.88795 1.1738 Dec 1.5486 1.5108 7.8073 7.4433 133.64 9.8412 9.9370 1.1689 0.88265 1.1836
2018 Jan 1.5340 1.5167 7.8398 7.4455 135.25 9.6464 9.8200 1.1723 0.88331 1.2200 Feb 1.5684 1.5526 7.8068 7.4457 133.29 9.6712 9.9384 1.1542 0.88396 1.2348
* Averages: Bundesbank calculations based on the daily euro foreign exchange rates, see Statistical Supplement 5, Exchange rate statistics. 1 Up to March 2005, ECBreference rates published by the ECB; for additional euro foreign exchange reference indicative rates. 2 Average from 13 January to 29 December 2000.
11 Euro area countries and irrevocable euro conversion rates in the third stageof European Economic and Monetary Union
From Country Currency ISO currency code EUR 1 = currency units ...
1999 January 1 Austria Austrian schilling ATS 13.7603
Belgium Belgian franc BEF 40.3399
Finland Finnish markka FIM 5.94573
France French franc FRF 6.55957
Germany Deutsche Mark DEM 1.95583
Ireland Irish pound IEP 0.787564
Italy Italian lira ITL 1,936.27
Luxembourg Luxembourg franc LUF 40.3399
Netherlands Dutch guilder NLG 2.20371
Portugal Portuguese escudo PTE 200.482
Spain Spanish peseta ESP 166.386
2001 January 1 Greece Greek drachma GRD 340.750
2007 January 1 Slovenia Slovenian tolar SIT 239.640
2008 January 1 Cyprus Cyprus pound CYP 0.585274
Malta Maltese lira MTL 0.429300
2009 January 1 Slovakia Slovak koruna SKK 30.1260
2011 January 1 Estonia Estonian kroon EEK 15.6466
2014 January 1 Latvia Latvian lats LVL 0.702804
2015 January 1 Lithuania Lithuanian litas LTL 3.45280

Deutsche Bundesbank
82
Monthly Report
March 2018
XII External sector
12 Effective exchange rates of the Euro and indicators of the German economy’s price competitiveness *
1999 Q1=100
Effective exchange rate of the Euro Indicators of the German economy’s price competitiveness
EER-19 1 EER-38 2 Based on the deflators of total sales 3 Based on consumer price indices
26 selected industrial countries 5 In real termsIn real terms based on
In real based on unit In real26terms the deflators labour terms
based on of gross costs of based on Non- selected37 37 56consumer domestic national consumer Euro area euro area industrial
Period Nominal price indices product 3 economy 3 Nominal price indices 4 Total countries countries countries 6 countries 5 countries 6 countries 7
1999 96.3 96.1 96.1 96.0 96.5 95.8 97.9 99.5 95.8 97.6 98.2 98.0 97.7
2000 87.2 86.7 86.1 85.3 88.0 85.9 91.8 97.3 85.2 90.8 93.0 92.0 90.92001 87.8 87.1 86.5 86.0 90.6 86.9 91.6 96.4 86.0 90.1 93.0 91.4 90.82002 90.1 90.2 89.5 89.3 95.2 90.5 92.2 95.4 88.4 90.6 93.5 91.9 91.72003 100.7 101.2 100.4 100.4 107.1 101.4 95.5 94.5 97.4 94.7 97.0 96.5 96.72004 104.6 104.9 103.2 103.7 111.7 105.0 95.8 93.2 99.8 94.9 98.4 98.0 98.3
2005 102.9 103.4 100.9 101.7 109.6 102.4 94.6 91.9 98.9 92.8 98.4 96.9 96.52006 102.8 103.3 100.1 100.4 109.6 101.7 93.3 90.3 98.2 91.0 98.5 96.4 95.82007 106.1 106.0 101.9 102.5 113.0 103.6 94.2 89.5 102.0 91.2 100.7 97.8 96.92008 109.3 108.1 103.2 105.7 117.1 105.5 94.3 88.0 105.1 90.3 102.1 97.7 97.02009 110.7 108.8 104.1 110.6 120.2 106.5 94.6 88.8 104.3 90.8 101.7 97.9 97.4
2010 103.6 101.1 95.8 102.5 111.6 97.6 92.1 88.5 98.0 87.0 98.7 93.6 91.92011 103.3 100.1 93.6 101.0 112.3 97.0 91.7 88.3 97.3 86.2 98.1 92.7 91.32012 97.7 94.8 88.2 94.9 107.2 92.2 89.8 88.2 92.3 83.5 95.8 89.7 88.22013 101.0 97.7 90.9 97.5 111.8 95.0 92.1 88.7 97.6 85.4 98.1 91.4 90.12014 101.4 97.2 90.9 98.4 114.1 95.4 92.8 89.6 97.9 86.2 98.1 91.6 90.7
2015 91.7 87.6 82.8 88.3 105.7 p 86.9 90.0 90.5 89.2 82.5 94.1 86.4 p 85.82016 94.4 89.5 84.9 p 89.5 109.7 p 89.2 90.9 91.0 90.7 83.9 94.7 87.4 p 87.02017 96.6 91.4 ... ... 112.0 p 90.5 p 92.1 p 91.2 93.5 p 84.7 96.0 88.6 p 87.8
2015 Apr 89.1 85.3 101.6 83.9 93.4 85.2 84.0 May 91.0 87.0 81.5 87.1 103.9 85.7 89.6 90.4 88.3 81.9 94.0 86.2 85.1 June 91.7 87.7 105.2 86.7 94.1 86.4 85.6
July 90.7 86.6 104.2 85.7 93.7 85.8 85.0 Aug 92.4 88.0 83.1 88.3 107.1 87.9 90.1 90.5 89.5 82.8 94.3 86.7 86.4 Sep 93.2 88.9 108.7 89.2 94.5 87.1 87.0
Oct 93.0 88.8 108.1 88.7 94.5 87.1 86.8 Nov 90.5 86.3 83.1 88.0 105.0 p 86.0 90.2 90.8 89.4 82.9 93.5 85.8 p 85.3 Dec 91.9 87.5 107.1 p 87.5 93.7 86.2 p 85.9
2016 Jan 93.0 88.4 108.9 p 88.6 93.9 86.7 p 86.7 Feb 94.2 89.3 84.7 p 89.3 110.3 p 89.8 90.8 91.1 90.3 83.8 94.4 87.2 p 87.1 Mar 93.6 88.8 109.0 p 88.9 94.5 87.0 p 86.7
Apr 94.4 89.5 109.8 p 89.4 94.9 87.6 p 87.1 May 94.6 89.9 85.1 p 89.8 110.2 p 89.9 90.9 91.1 90.6 84.1 94.7 87.7 p 87.4 June 94.4 89.7 109.8 p 89.5 94.5 87.5 p 87.1
July 94.6 89.8 109.5 p 89.1 94.8 87.6 p 86.9 Aug 94.9 90.0 85.3 p 89.7 110.0 p 89.4 91.1 91.0 91.1 84.1 95.0 87.6 p 87.0 Sep 95.1 90.1 110.2 p 89.6 95.1 87.8 p 87.2
Oct 95.1 90.3 110.0 p 89.4 95.4 87.9 p 87.1 Nov 94.6 89.6 84.6 p 89.3 109.6 p 89.0 90.8 90.9 90.7 83.8 94.8 87.5 p 86.8 Dec 93.7 88.9 108.6 p 88.2 94.7 87.3 p 86.6
2017 Jan 93.9 89.1 109.0 p 88.4 94.5 87.1 p 86.4 Feb 93.4 88.8 83.4 p 88.3 108.1 p 87.8 90.5 90.8 90.0 83.2 94.5 87.1 p 86.2 Mar 94.0 89.2 108.5 p 87.9 94.7 87.2 p 86.2
Apr 93.7 89.0 108.2 p 87.7 94.5 87.1 p 86.0 May 95.6 90.5 84.7 p 89.3 110.5 p 89.3 91.6 91.4 91.8 84.2 95.4 88.0 p 87.1 June 96.3 91.2 111.4 p 90.0 95.9 88.5 p 87.6
July 97.6 92.4 113.3 p 91.5 96.6 89.2 p 88.6 Aug 99.0 93.6 87.7 p 92.1 115.0 p 92.8 93.2 91.4 95.9 85.8 97.2 89.8 p 89.2 Sep 99.0 93.6 115.0 p 92.7 97.3 89.8 p 89.3
Oct 98.6 93.1 114.8 p 92.4 97.1 89.5 p 89.0 Nov 98.5 93.0 ... ... 115.0 p 92.5 p 93.2 p 91.2 96.4 p 85.6 97.2 89.5 p 89.1 Dec 98.8 93.3 115.3 p 92.6 97.5 89.8 p 89.3
2018 Jan 99.4 p 93.9 116.1 p 93.2 p 97.6 p 89.8 p 89.4 Feb 99.6 p 93.9 ... ... 117.3 p 94.1 ... ... ... ... p 97.6 p 89.8 p 89.5
* The effective exchange rate corresponds to the weighted external value of the Iceland, India, Indonesia, Israel, Malaysia, Mexico, Morocco, New Zealand,currency concerned. The method of calculating the indicators of the German Philippines, Russian Federation, South Africa, Taiwan, Thailand, Turkey andeconomy’s price competitiveness is consistent with the procedure used by the ECB to Venezuela. 3 Annual and quarterly averages. 4 Data for Argentina are currently notcompute the effective exchange rates of the euro (see Monthly Report, November available due to the state of emergency in the national statistical system declared by2001, pp 50-53, May 2007, pp 31-35 and August 2017, pp 41-43). For more the government of Argentina on 7 January 2016. As a consequence, Argentina is notdetailed information on methodology see the ECB’s Occasional Paper No 134 included in the calculation of the EER-38 CPI deflated series from February 2016. The(www.ecb.eu). A decline in the figures implies an increase in competitiveness. 1 ECB policy regarding the inclusion of Argentina will be reconsidered in the future de-calculations are based on the weighted averages of the changes in the bilateral pending on further developments. 5 Euro area countries (from 2001 includingexchange rates of the euro against the currencies of the following countries: Austra- Greece, from 2007 including Slovenia, from 2008 including Cyprus and Malta, fromlia, Bulgaria, Canada, China, Croatia, Czechia, Denmark, Hong Kong, Hungary, Japan, 2009 including Slovakia, from 2011 including Estonia, from 2014 including Latvia,Norway, Poland, Romania, Singapore, South Korea, Sweden, Switzerland, the United from 2015 including Lithuania) as well as Canada, Denmark, Japan, Norway, Sweden,Kingdom and the United States. Where current price and wage indices were not avai- Switzerland, the United Kingdom and the United States. 6 Euro area countries (seelable, estimates were used. 2 ECB calculations. Includes countries belonging to the footnote 5) and countries belonging to the EER-19 group. 7 Euro area countries andEER-19 group (see footnote 1) and additional Algeria, Argentina, Brazil, Chile, countries belonging to the EER-38 group (see footnote 2).

Overview of publications by the Deutsche Bundesbank
This overview provides information about selected recent economic and statistical publica-
tions by the Deutsche Bundesbank. Unless otherwise indicated, these publications are avail-
able in both English and German, in printed form and on the Bundesbank’s website.
The publications are available free of charge from the External Communication Division.
Up-to-date figures for some statistical datasets are also available on the Bundesbank’s web-
site.
Annual Report
Financial Stability Review
Monthly Report
For information on the articles published be-
tween 2000 and 2017 see the index attached
to the January 2018 Monthly Report.
Monthly Report articles
April 2017– The role of banks, non- banks and the central
bank in the money creation process
– Demographic change, immigration and the
potential output of the German economy
May 2017– The current economic situation in Germany
June 2017– Outlook for the German economy – macro-
economic projections for 2017 and 2018
and an outlook for 2019
– Design and implementation of the European
fiscal rules
July 2017– The market for corporate bonds in the low-
interest- rate environment
– The development of government interest ex-
penditure in Germany and other euro area
countries
– Return on private financial assets taking into
account inflation and taxes
– The danger posed to the global economy by
protectionist tendencies
– Changes to the MFI interest rate statistics
August 2017– The current economic situation in Germany
September 2017– Monetary policy indicators at the lower
bound based on term structure models
– Distributed ledger technologies in payments
and securities settlement: potential and risks
– The performance of German credit institu-
tions in 2016
– Changes to the investment funds statistics:
scope enhancements, results and outlook
October 2017– Global liquidity, foreign exchange reserves
and exchange rates of emerging market
economies
– The natural rate of interest
Deutsche Bundesbank Monthly Report
March 2018 83•

– The supervisory review and evaluation pro-
cess for smaller institutions and proportion-
ality considerations
– The Eurosystem’s new money market statis-
tical reporting – initial results for Germany
– The new ESCB insurance statistics – inte-
grated reporting flow and initial results
November 2017– The current economic situation in Germany
December 2017– Outlook for the German economy – macro-
economic projections for 2018 and 2019
and an outlook for 2020
– German enterprises’ profitability and finan-
cing in 2016
– Mark-ups of firms in selected European
countries
– The Eurosystem’s financial market infrastruc-
ture – origin and future set- up
January 2018– The impact of the internationalisation of
German firms on domestic investment
– The importance of bank profitability and
bank capital for monetary policy
– Developments in corporate financing in the
euro area since the financial and economic
crisis
– Finalising Basel III
February 2018– The current economic situation in Germany
March 2018– German balance of payments in 2017
– The demand for euro banknotes at the Bun-
desbank
– Contingent convertible bonds: design, regu-
lation, usefulness
Statistical Supplements to the Monthly Report
1 Banking statistics1, 2
2 Capital market statistics1, 2
3 Balance of payments statistics1, 2
4 Seasonally adjusted business statistics1, 2
5 Exchange rate statistics2
Special Publications
Makro-ökonometrisches Mehr-Länder-Modell,
November 1996 3
Europäische Organisationen und Gremien im
Bereich von Währung und Wirtschaft, May
19973
Die Zahlungsbilanz der ehemaligen DDR 1975
bis 1989, August 19993
The market for German Federal securities,
May 2000
Macro-Econometric Multi-Country Model:
MEMMOD, June 2000
Bundesbank Act, September 2002
Weltweite Organisationen und Gremien im
Bereich von Währung und Wirtschaft, March
20133
Die Europäische Union: Grundlagen und Politik-
bereiche außerhalb der Wirtschafts- und Wäh-
rungsunion, April 20053
Die Deutsche Bundesbank – Aufgabenfelder,
rechtlicher Rahmen, Geschichte, April 20063
European economic and monetary union, April
2008
For footnotes, see p 86•.
Deutsche Bundesbank Monthly Report March 2018 84•

Special Statistical Publications
1 Banking statistics guidelines,
July 20172, 4
2 Banking statistics customer classification,
July 20172
3 Aufbau der bankstatistischen Tabellen,
July 20132, 3
4 Financial accounts for Germany 2011 to
2016, May 20172
5 Extrapolated results from financial state-
ments of German enterprises 1997 to 2015,
December 20162
6 Verhältniszahlen aus Jahresabschlüssen
deutscher Unternehmen von 2013 bis 2014,
May 20172, 3
7 Notes on the coding list for the balance of
payments statistics, September 20132
8 The balance of payments statistics of the
Federal Republic of Germany, 2nd edition,
February 1991o
9 Securities deposits, August 2005
10 Foreign direct investment stock statistics,
April 20171, 2
11 Balance of payments by region,
July 2013
12 Technologische Dienstleistungen in der
Zahlungsbilanz, June 20113
Discussion Papers*
33/ 2017
Moral suasion in regional government bond
markets
34/ 2017
A severity function approach to scenario selec-
tion
35/ 2017
Why do banks bear interest rate risk?
36/2017
Liquidity provision as a monetary policy tool:
the ECB’s non-standard measures after the
financial crisis
37/2017
A stress test framework for the German resi-
dential mortgage market – methodology and
application
38/2017
Changes in education, wage inequality and
working hours over time
39/2017
Appropriate monetary policy and forecast dis-
agreement at the FOMC
01/ 2018
An analysis of non- traditional activities at Ger-
man savings banks – Does the type of fee and
commission income matter?
02/ 2018
Mixed frequency models with MA components
03/ 2018
On the cyclical properties of Hamilton‘s regres-
sion filter
o Not available on the website.* As of 2000 these publications have been made available on the Bundesbank’s website in German and English. Since the beginning of 2012, no longer subdivided into series 1 and series 2.For footnotes, see p 86•.
Deutsche Bundesbank Monthly Report
March 2018 85•

Banking legislation
1 Bundesbank Act, July 2013, and Statute
of the European System of Central Banks
and of the European Central Bank, June
1998
2 Banking Act, July 20142
2a Solvency Regulation, December 20062
Liquidity Regulation, December 20062
1 Only the headings and explanatory notes to the data con-tained in the German originals are available in English.2 Available on the website only.3 Available in German only.4 Only some parts of the Special Statistical Publications are provided in English. The date refers to the German issue, which may be of a more recent date than the English one.
Deutsche Bundesbank Monthly Report March 2018 86•


