The Vectra ® Polaris ™ Automated Quantitative Pathology Imaging System is a new class of tissue imager which provides unparalleled speed, performance, and versatility for visualizing, analyzing, quantifying, and phenotyping immune cells in situ in Formalin Fixed Paraffin Embedded (FFPE) tissue sections and TMAs to advance disease research. Vectra Polaris goes beyond basic functions, like whole-slide, brightfield (BF), and fluorescence (FL) imaging. It integrates the power of multispectral imaging in a simplified workflow, and is part of our Phenoptics ™ translational solution. With our proprietary and proven multispectral imaging, you can capture the multiple interactions occurring between cells without the interference of autofluorescence as the signals are unmixed from one another. That means you can have confidence in accurately quantifying the interactions that are really occurring in the biology. Multispectral imaging on the Vectra Polaris can now be applied across a whole slide of up to 7 colors unmixed in less than 6 minutes with our state-of-the-art MOTiF ™ technology, enabling the biology to be explored at multiple scales, from cell-to-cell interactions to the macroscopic tissue architecture. The whole slide multispectral imaging capability creates a simpler and more robust workflow as fields of view do not need to be selected so there's no selection bias and you have a whole slide record so that you can easily re-analyze imagery as new understanding emerges. With the Vectra Polaris, you can also generate unmixed annotated regions of interests of up to 9 colors using our renowned liquid crystal tunable filter (LCTF) technology. More Accurately Quantify Cellular Interactions in Tissue Samples Quantitative Pathology Imaging and Analysis PRODUCT NOTE Vectra ® Polaris ™ Automated Quantitative Pathology Imaging System Key Features: • State of the art multispectral imaging to easily detect and measure multiple overlapping biomarkers within a single tissue section • High speed digital whole-slide scanning at 10x - 40x in brightfield or fluorescence • Enclosed system with built-in touchless automation allows users to safely visualize, analyze, quantify, and phenotype immune cells in situ with maximum reliability • Trainable machine-learning algorithms using inForm ® software allowing for automatic identification of specific cell and tissue types • Supports PerkinElmer's Phenoptics ™ workflow solution For research use only. Not for use in diagnostic procedures.
Transcript
The Vectra® Polaris™ Automated Quantitative Pathology Imaging System is a new class of tissue imager which provides unparalleled speed, performance, and versatility for visualizing, analyzing, quantifying, and phenotyping immune cells in situ in Formalin Fixed Paraffin
Embedded (FFPE) tissue sections and TMAs to advance disease research. Vectra Polaris goes beyond basic functions, like whole-slide, brightfield (BF), and fluorescence (FL) imaging. It integrates the power of multispectral imaging in a simplified workflow, and is part of our Phenoptics™ translational solution.
With our proprietary and proven multispectral imaging, you can capture the multiple interactions occurring between cells without the interference of autofluorescence as the signals are unmixed from one another. That means you can have confidence in accurately quantifying the interactions that are really occurring in the biology.
Multispectral imaging on the Vectra Polaris can now be applied across a whole slide of up to 7 colors unmixed in less than 6 minutes with our state-of-the-art MOTiF™ technology, enabling the biology to be explored at multiple scales, from cell-to-cell interactions to the macroscopic tissue architecture. The whole slide multispectral imaging capability creates a simpler and more robust workflow as fields of view do not need to be selected so there's no selection bias and you have a whole slide record so that you can easily re-analyze imagery as new understanding emerges. With the Vectra Polaris, you can also generate unmixed annotated regions of interests of up to 9 colors using our renowned liquid crystal tunable filter (LCTF) technology.
More Accurately Quantify Cellular Interactions in Tissue Samples
Quantitative Pathology Imaging and Analysis
P R O D U C T N O T EVectra® Polaris™ Automated Quantitative Pathology Imaging System
Key Features:
• State of the art multispectral imaging to easily detect and measure multiple overlapping biomarkers within a single tissue section
• High speed digital whole-slide scanning at 10x - 40x in brightfield or fluorescence
• Enclosed system with built-in touchless automation allows users to safely visualize, analyze, quantify, and phenotype immune cells in situ with maximum reliability
• Trainable machine-learning algorithms using inForm® software allowing for automatic identification of specific cell and tissue types
For research use only. Not for use in diagnostic procedures.
2
Figure 1. Unmixed 9-color multispectral image of human lung cancer tissue stained against CD20 (Opal 480, red), PD-L1 (Opal 520, green), CD8 (Opal 540, yellow), FoxP3 (Opal 570, orange), CD68 (Opal 620, magenta), PD-1 (Opal 650, pink), Ki67 (Opal 690, white), and PanCK (Opal 780, cyan).
Figure 2. (A) Spectrally unmixed composite image, (B) Cell Phenotyping, (C) Tissue Segmentation, and (D) Cell Segmentation. Colon Cancer stained with the following: Marker (False Color, Opal used), DAPI (Dark Blue), CD68 (Green, Opal 520), CD4 (Yellow, Opal 540), CD8 (Orange, Opal 570), CK (Light Blue, Opal 620), PD-L1 (Purple, Opal 650), and FoxP3 (Red, Opal 690).
Combined with inForm® software analysis and Opal™ IHC staining, you can identify and quantify multiple targets and reveal spatial relationships within a digital workflow for faster, easier and more informative studies.
Understand Biological Interactions Across Many Applications
The Vectra Polaris Automated Quantitative Pathology Imaging System is a cutting-edge tool for revealing the cell-to-cell biology driving tumor progression, immune interactions and response to therapeutic interventions. By combining tissue imaging with multiplexing, the Vectra Polaris system can capture this biology with a workflow that supports the volume and high-throughput demands of clinical research studies.
Example Applications
• Phenotyping immune cells for cancer immunology research
For researchers seeking to understand cellular interactions within an intact tissue sample, the Vectra Polaris analyzes, quantifies and phenotypes cells in situ, in FFPE tissue sections and TMAs. The Vectra Polaris system's multispectral technology enables the removal of autofluorescence, improving the signal-to-noise ratio substantially. This allows for a more sensitive and accurate analysis of samples, and enables true cell-to-cell interaction to be revealed, coupled with multicolor IHC reagents designed for best signal isolation. Researchers can see up to 9 colors in a tissue section (Figure 1), revealing cell types, spatial context, quantification of multiple biomarkers and cell-to-cell interactions (Figure 2). Vectra Polaris seamlessly integrates this data into a digital pathology workflow and can provide whole section context, in brightfield (BF) and fluorescence (FL) modes.
Get Accurate and Reliable Results, Fast
Vectra Polaris utilizes intelligent automation and patented technology for hands-off, error-free scanning, and an optical configuration designed specifically for accurate signal measurements and unparalleled sample protection. Coupled with advanced machine-learning based approaches to analyze images, this produces quantitative data that accurately captures the biology of interest.
Multispectral Imaging Technologies for Highest Quality Data
• Renowned liquid crystal tunable filter (LCTF) technology generates unmixed, annotated regions of interest of up to 9-colors for deeper interrogation of biology
• MOTiF™ technology generate unmixed whole slide scans of up to 7 colors in less than 6 minutes for analysis of biology across the entire slide in a streamlined workflow and without selection bias
• Height sensing optics allow for consistent and reliable image focusing, regardless of slide or sample condition
• Perfect registration from one FL band to another
Unparalleled Slide Protection Technology
• Ultra-bright pulsed LED excitation minimizes photobleaching
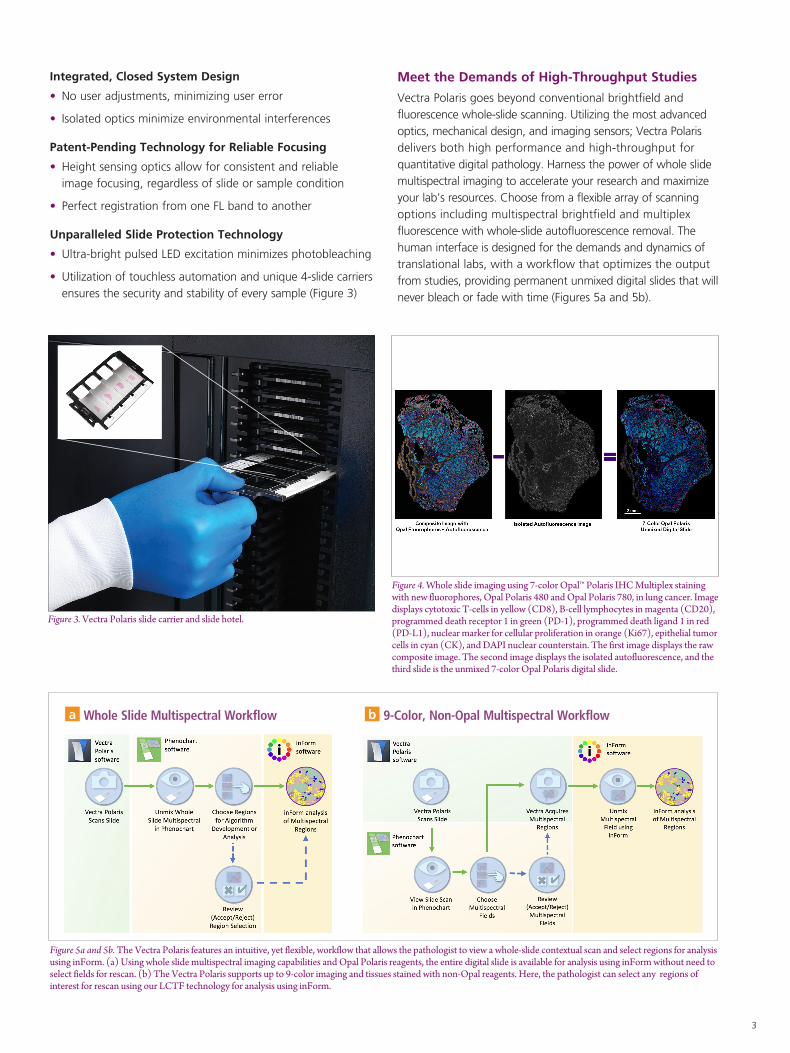
• Utilization of touchless automation and unique 4-slide carriers ensures the security and stability of every sample (Figure 3)
Figure 4. Whole slide imaging using 7-color Opal™ Polaris IHC Multiplex staining with new fluorophores, Opal Polaris 480 and Opal Polaris 780, in lung cancer. Image displays cytotoxic T-cells in yellow (CD8), B-cell lymphocytes in magenta (CD20), programmed death receptor 1 in green (PD-1), programmed death ligand 1 in red (PD-L1), nuclear marker for cellular proliferation in orange (Ki67), epithelial tumor cells in cyan (CK), and DAPI nuclear counterstain. The first image displays the raw composite image. The second image displays the isolated autofluorescence, and the third slide is the unmixed 7-color Opal Polaris digital slide.
Figure 3. Vectra Polaris slide carrier and slide hotel.
Meet the Demands of High-Throughput Studies
Vectra Polaris goes beyond conventional brightfield and fluorescence whole-slide scanning. Utilizing the most advanced optics, mechanical design, and imaging sensors; Vectra Polaris delivers both high performance and high-throughput for quantitative digital pathology. Harness the power of whole slide multispectral imaging to accelerate your research and maximize your lab's resources. Choose from a flexible array of scanning options including multispectral brightfield and multiplex fluorescence with whole-slide autofluorescence removal. The human interface is designed for the demands and dynamics of translational labs, with a workflow that optimizes the output from studies, providing permanent unmixed digital slides that will never bleach or fade with time (Figures 5a and 5b).
Figure 5a and 5b. The Vectra Polaris features an intuitive, yet flexible, workflow that allows the pathologist to view a whole-slide contextual scan and select regions for analysis using inForm. (a) Using whole slide multispectral imaging capabilities and Opal Polaris reagents, the entire digital slide is available for analysis using inForm without need to select fields for rescan. (b) The Vectra Polaris supports up to 9-color imaging and tissues stained with non-Opal reagents. Here, the pathologist can select any regions of interest for rescan using our LCTF technology for analysis using inForm.
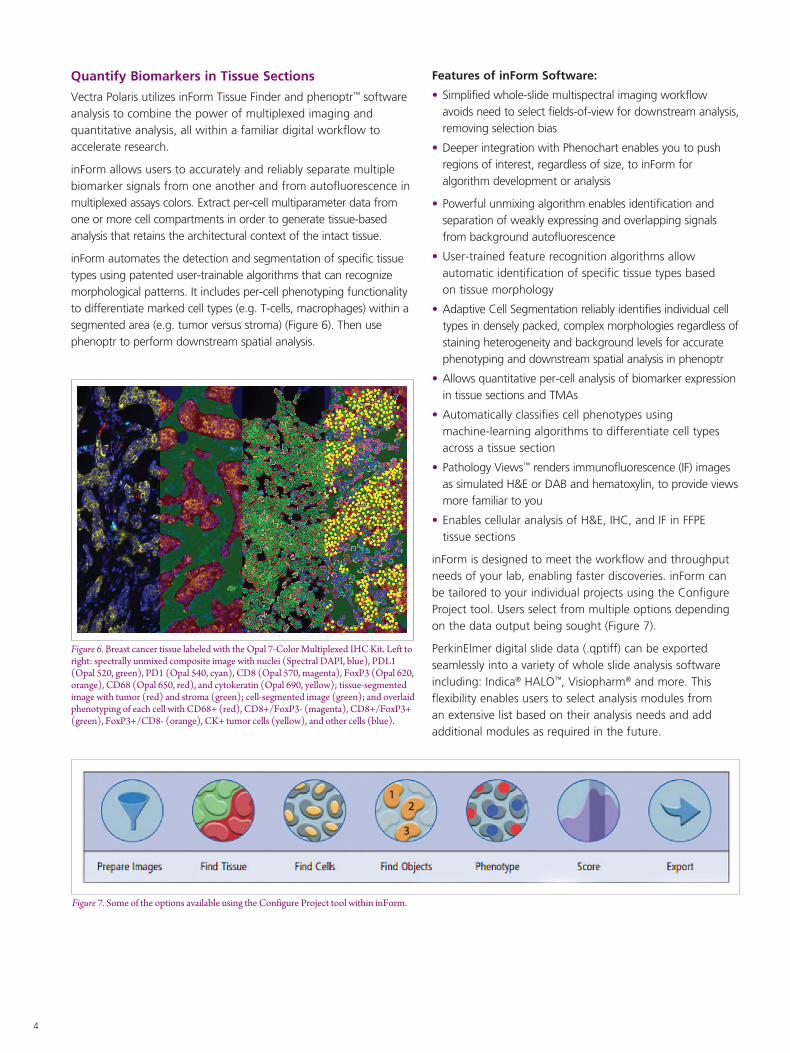
Figure 7. Some of the options available using the Configure Project tool within inForm.
Quantify Biomarkers in Tissue Sections
Vectra Polaris utilizes inForm Tissue Finder and phenoptr™ software analysis to combine the power of multiplexed imaging and quantitative analysis, all within a familiar digital workflow to accelerate research.
inForm allows users to accurately and reliably separate multiple biomarker signals from one another and from autofluorescence in multiplexed assays colors. Extract per-cell multiparameter data from one or more cell compartments in order to generate tissue-based analysis that retains the architectural context of the intact tissue.
inForm automates the detection and segmentation of specific tissue types using patented user-trainable algorithms that can recognize morphological patterns. It includes per-cell phenotyping functionality to differentiate marked cell types (e.g. T-cells, macrophages) within a segmented area (e.g. tumor versus stroma) (Figure 6). Then use phenoptr to perform downstream spatial analysis.
Figure 6. Breast cancer tissue labeled with the Opal 7-Color Multiplexed IHC Kit. Left to right: spectrally unmixed composite image with nuclei (Spectral DAPI, blue), PDL1 (Opal 520, green), PD1 (Opal 540, cyan), CD8 (Opal 570, magenta), FoxP3 (Opal 620, orange), CD68 (Opal 650, red), and cytokeratin (Opal 690, yellow); tissue-segmented image with tumor (red) and stroma (green); cell-segmented image (green); and overlaid phenotyping of each cell with CD68+ (red), CD8+/FoxP3- (magenta), CD8+/FoxP3+ (green), FoxP3+/CD8- (orange), CK+ tumor cells (yellow), and other cells (blue).
Features of inForm Software:
• Simplified whole-slide multispectral imaging workflow avoids need to select fields-of-view for downstream analysis, removing selection bias
• Deeper integration with Phenochart enables you to push regions of interest, regardless of size, to inForm for algorithm development or analysis
• Powerful unmixing algorithm enables identification and separation of weakly expressing and overlapping signals from background autofluorescence
• User-trained feature recognition algorithms allow automatic identification of specific tissue types based on tissue morphology
• Adaptive Cell Segmentation reliably identifies individual cell types in densely packed, complex morphologies regardless of staining heterogeneity and background levels for accurate phenotyping and downstream spatial analysis in phenoptr
• Allows quantitative per-cell analysis of biomarker expression in tissue sections and TMAs
• Automatically classifies cell phenotypes using machine-learning algorithms to differentiate cell types across a tissue section
• Pathology Views™ renders immunofluorescence (IF) images as simulated H&E or DAB and hematoxylin, to provide views more familiar to you
• Enables cellular analysis of H&E, IHC, and IF in FFPE tissue sections
inForm is designed to meet the workflow and throughput needs of your lab, enabling faster discoveries. inForm can be tailored to your individual projects using the Configure Project tool. Users select from multiple options depending on the data output being sought (Figure 7).
PerkinElmer digital slide data (.qptiff) can be exported seamlessly into a variety of whole slide analysis software including: Indica® HALO™, Visiopharm® and more. This flexibility enables users to select analysis modules from an extensive list based on their analysis needs and add additional modules as required in the future.
5
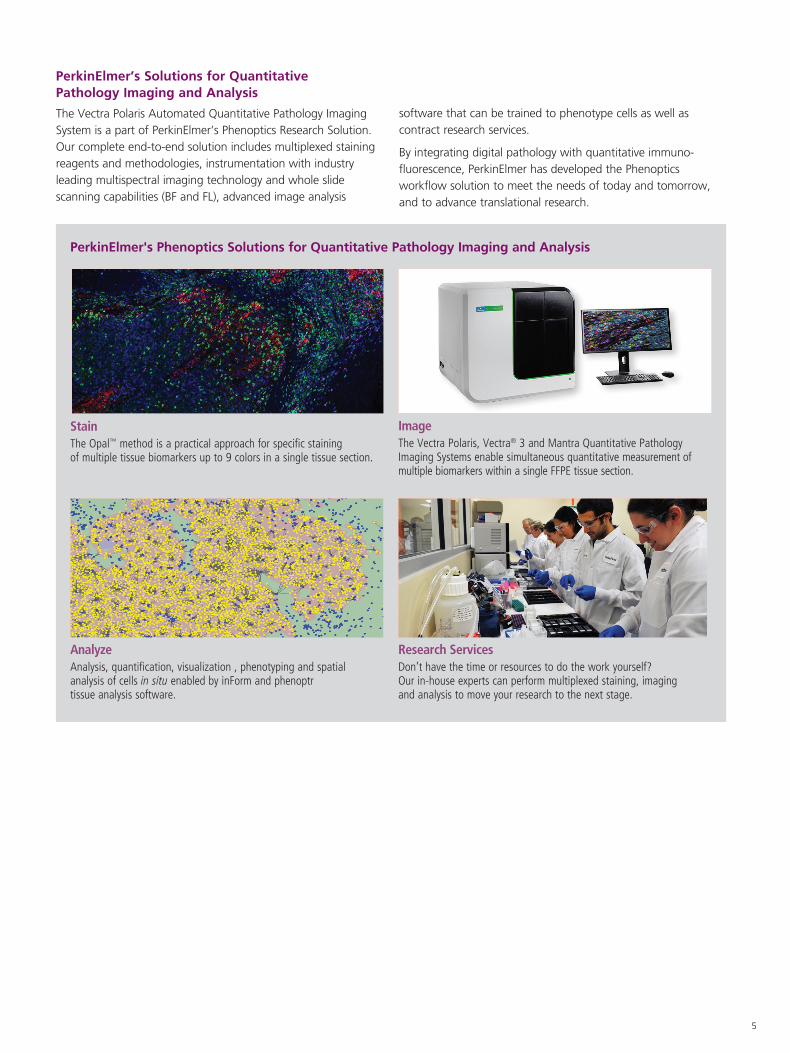
PerkinElmer's Phenoptics Solutions for Quantitative Pathology Imaging and Analysis
Stain The Opal™ method is a practical approach for specific staining of multiple tissue biomarkers up to 9 colors in a single tissue section.
AnalyzeAnalysis, quantification, visualization , phenotyping and spatial analysis of cells in situ enabled by inForm and phenoptr tissue analysis software.
Research ServicesDon’t have the time or resources to do the work yourself? Our in-house experts can perform multiplexed staining, imaging and analysis to move your research to the next stage.
Image The Vectra Polaris, Vectra® 3 and Mantra Quantitative Pathology Imaging Systems enable simultaneous quantitative measurement of multiple biomarkers within a single FFPE tissue section.
software that can be trained to phenotype cells as well as contract research services.
By integrating digital pathology with quantitative immuno-fluorescence, PerkinElmer has developed the Phenoptics workflow solution to meet the needs of today and tomorrow, and to advance translational research.
PerkinElmer’s Solutions for Quantitative Pathology Imaging and Analysis
The Vectra Polaris Automated Quantitative Pathology Imaging System is a part of PerkinElmer’s Phenoptics Research Solution. Our complete end-to-end solution includes multiplexed staining reagents and methodologies, instrumentation with industry leading multispectral imaging technology and whole slide scanning capabilities (BF and FL), advanced image analysis
For a complete listing of our global offices, visit www.perkinelmer.com/ContactUs