176
Annual Report 2010 - 11 Gain a Better Understanding of a Financial Technology Powerhouse MORE EFFICIENT FINANCIAL TECHNOLOGY

Annual Report2010 - 11
Gain a Better Understanding of a Financial Technology Powerhouse
MORE EFFICIENTFINANCIAL TECHNOLOGY

Financial Technology Leadership
Banking | Insurance

Accountability
Transformationrole in key sectors
Sustaining the trustof financial institutions
Superior financialtechnology architecture
Exemplarydelivery
Strong andenduringrelationships

© Copyright Polaris Software Lab Ltd., 2011.No reproduction without permission. All rights reserved.
A complete version of this book is available at the site www.polarisFT.com
ii
Annual Report2010 - 11

Deep Abiding Purpose
By nurturing sharp, deep understanding of the lifecycle of money in thelives of individuals, communities, banks and financial institutions, we
simplify and make technology work for business with a personal touch.
iii

This page has been intentionally left blank
v
REGISTERED OFFICE
BUSINESS SOLUTION CENTRES
POLARIS SOFTWARE LAB LIMITED‘Polaris House’, 244 Anna Salai,Chennai - 600006. INDIA.Ph: 91-44-39874000
Corporate HeadquartersPOLARIS SOFTWARE LAB LIMITED‘Foundation’, 34, Rajiv Gandhi Salai,Chennai - 603103. INDIA.Phone: 91-44-27435001 / 91-44-39873000
POLARIS SOFTWARE LAB LIMITEDShakthi Towers, 178, Anna Salai,Chennai - 600002. INDIA.Phone: 91-44-28525507
POLARIS SOFTWARE LAB LIMITED203 Manikonda IT Park,Gachibowli, Hyderabad- 500019. INDIA.Phone: 91-40-66923000
POLARIS SOFTWARE LAB LIMITED249, Udyog Vihar Phase IV,Gurgaon - 122001. INDIA.Phone: 91-124-2844000
POLARIS SOFTWARE LAB LIMITEDSEEPZ, SDF V, Andheri East,Mumbai - 400096. INDIA.Phone: 91-22-28290019
POLARIS SOFTWARE LAB LIMITEDSDF VI, SEEPZ, Andheri EastMumbai - 400096. INDIA.Phone: 91-22-39815300
POLARIS SOFTWARE LAB LIMITEDSilver Metropolis,CTS No. 213 /A/2 & 214, Jay Coach,Western Express HighwayGoregaon East, Mumbai - 400063. INDIA.Phone: 91-22-67801500
POLARIS SOFTWARE LAB LIMITEDKharadi Knowledge Park,77, MIDC Kharadi, Pune - 411014. INDIA.Phone: 91-20-40734000
Foundation – Insurance & Testing Centre
Retail Banking Centre
The Capital – Investment Banking Centre
Polaris Towers-Enterprise Solutions Centre
Corporate Banking Centre
Corporate Heights-Corporate Banking Centre
POLARIS SOFTWARE LAB LIMITEDMaruthi Chambers, Hosur Main Road,Rupana Agrahara, Bangalore - 560065. INDIA.Phone: 91-80-33275000
POLARIS SOFTWARE LAB LIMITEDGhodbunder Road, Wadhavli,Thane - 400601. INDIA.Phone: 91-22-41218000
POLARIS SOFTWARE PTY LIMITEDABN 12 095 031 897,Level 9, 31, Market Street,Sydney NSW2000. AUSTRALIA.Phone: 61-2-92671955.
POLARIS SOFTWARE LAB CANADA INC.5090, Explorer Drive,Mississauga, Ontario - L4W 4T9. CANADA.Phone: 1-905-2121170
POLARIS SOFTWARE LAB LIMITED UKBuilding 1, The Concourse Northern Ireland SciencePark, Belfast, BT3 9DT.UNITED KINGDOM.Phone: 44-28-90737834
POLARIS SOFTWARE LAB PTE LIMITEDNo.10, Ubi CrescentUbi Techpark. SINGAPORE.Phone: 65-67490119
POLARIS SOFTWARE LAB INDIA LIMITEDWoodbridge Place, 517Route 1 South, Suite 2103, Iselin,NJ - 08830. USA.Phone: 1-732-5908100
POLARIS SOFTWARE LAB INDIA LIMITED111, Town Square Place,Jersey city , NJ-07310. USA.Phone: 1-732-590-8151
POLARIS SOFTWARE LAB INC.2730, Sidney Street,Pittsburgh. PA-15203.Phone: 412-297-0046
GLOBAL NEARSHORE CENTRES
RELATIONSHIP OFFICES
Americas
Headquarters
East Coast

vi
West coast
Mid West
Canada
Chile
Headquarters
Vietnam
Japan
Asia Pacific
POLARIS SOFTWARE LAB INDIA LIMITED38750, Paseo Padre Parkway,Fremont, CA 94536. USA.Phone: 1-510-745-9986
POLARIS SOFTWARE LAB INDIA LIMITED3333, Warrenville Road,Lisle, IL 60532. USA.Phone: 1-630-527-8115
POLARIS SOFTWARE LAB CANADA INC,The Exchange Tower130, King Street, W Toronto,M5X 1E3. CANADAPhone: 1- 416-865-3365
POLARIS SOFTWARE LAB CANADA INC.5090 Explorer Drive,Mississauga, Ontario, L4W 4T9. CANADA.Phone: 1-905-212-1170
POLARIS SOFTWARE LAB CHILE LIMITADAAvd. Andrés Bello 2711, Piso 18Las Condes, Santiago De CHILE.Phone: 56-2-3695681
POLARIS SOFTWARE LAB PTE LIMITEDCR No. 199701040RNo.10, Ubi Crescent,Ubi Techpark. SINGAPORE.Phone: 68482880
POLARIS SOFTWARE LAB VIETNAM CO. LIMITEDNo.2, Ngo Duc Ke, Ben Nghe ward,District 1, Ho Chi Minh City.(Melinh Point Tower). VIETNAM.Phone: 84-83823785
POLARIS SOFTWARE LAB JAPAN K KNishi Shinbashi JK Building 4F,3-15-12 Nishi Shinbashi, Minato-ku,Tokyo 105-0003. JAPAN.Phone: 81-03-5405-9410
65-
China
Korea
Hong Kong
Malaysia
Australia & New Zealand
Headquarters
Switzerland
Europe, Middle East & Africa
POLARIS SOFTWARE (SHANGHAI)COMPANY LIMITED15F 1 Corporate Avenue,No 222 Hubin Road,Luwan District. Shanghai. CHINAPhone: 86-21-6122-1056
POLARIS SOFTWARE LAB LIMITED27 & 30, Trade Tower,159-1,Samsung - Dong,Gangnam-gu,Seoul, 135-729. KOREA.Phone: 82-2-60072630
POLARIS SOFTWARE LAB LIMITED15/F, 100 QRC, Central. HONG KONG.Phone: 852-31017400
POLARIS SOFTWARE LAB SDN BHDWisma Lim Foo Yong,86 Jalan Raja Chulan 50200.Kuala Lumpur. MALAYSIAPhone: 60321684226
POLARIS SOFTWARE PTY LIMITEDABN -12 095 031 897,Level 22, HWT Tower,South Gate. VIC 3006. NEW ZEALAND.Phone: 61-3-96740419
POLARIS SOFTWARE PTY LIMITED31 Market street,Sydney NSW 2000. AUSTRALIA.Phone: 61-2-92671955
POLARIS SOFTWARE LAB LIMITED1, Harbour exchange square,London, E14 9GE. UNITED KINGDOM.Phone: 44-20-75315500
POLARIS SOFTWARE LAB S.A,Avenue de la Gare, Case Postale 2067CH 2001, Neuchatel. SWITZERLAND.Phone: 41-32-722-19-90
Annual Report2010 - 11

Germany
Ireland
France – Registered Office 1
France – Relationship Office
Netherlands
Spain
POLARIS SOFTWARE LAB GmbH,Lyoner Str. 15, D-60528,Frankfurt am Main. GERMANY.Phone: 49-69-69-86-16-0
POLARIS SOFTWARE LAB IRELAND LIMITEDWatson & Johnson Centre,Mill Road, Greystones Co. Wicklow. IRELAND.Phone: 353 1 287 6745
30, Bis Rue de Veil Abreuvoir,78100, St Germain En Laye. FRANCE.
18, Rue Pasquier 75008, Paris. FRANCE.Phone: 33-1-78-41-40-00
POLARIS SOFTWARE LAB B.VNewtonlaan 115,3584 BHUltrecht, THE NETHERLANDS.Phone: 31-30-2106099
POLARIS SOFTWARE LAB SUCURSALEN ESPANAFernando El Santo 15-228010 Madrid. SPAIN.Phone: 34-91-5625152
vii
Middle East
Saudi Arabia
Bahrain
UAE
POLARIS SOFTWARE LAB LIMITEDP.O. Box 59205, Riyadh 11525.KINGDOM OF SAUDI ARABIA.Phone: 966-1 4645373
POLARIS SOFTWARE LAB LIMITEDDiplomatic Tower, Building 315,Road 1705, Block 317, Manama. BAHRAIN.P.O. Box No.: 10358Phone: 973-175 30437
POLARIS SOFTWARE LAB LIMITED118, Building -13, Dubai Internet City,Dubai. UAE.Phone: 971-4-3694610
Polaris Presence Through PartnersKenya Malawi Tanzania Ethiopia Uganda Seychelles Egypt
Kenya Turkey Lithuania Hungary Oman Qatar Lebanon Sri LankaNepal Bangladesh Malaysia Philippines Thailand
• • • • • •
• • • • • • • •
• • • • •

This page has been intentionally left blank
CONTENTS
Financial Highlights
Preface
Chairman’s Statements
Chapter 1: Polaris Offerings
Chapter 2: Polaris Culture
Chapter 3: Global Presence
Chapter 4: Inclusive CSR
Financial Report
xi
xiii
• Hard Questions To Which You Need Direct Answers xiv
• Retail Banking xxii
• Capital Markets xxiii
• Corporate Banking xxiv
• Risk and Treasury xxv
• Insurance xxvi
• Testing xxvii
• PESL xxviii
• Optimus xxix
• Intellect Product Group xxx
• Endorsement and Recognition xxxii
• Associate Connect Activities xxxv
• Polaris Participation in Key Global Industry Events xxxvii
• The Spirit of Inclusion xxxix
1-124
ix

Total Revenue
Rs.1,586 Crores
Net Worth of the Company
Cash & Cash Equivalents
Earning Per Share (EPS)
Total Employee Strength
Rs.1,033 Crores
Rs.514 Crores
Rs.20.43
10,974
Polaris in numbers
x
Annual Report2010 - 11

xi
Financial Higlightsas on March 31, 2011
FINANCIAL YEAR
07-08 08-09 09-10 10-11
400
350
300
250
200
150
100
50
1,800
1,600
1,400
1,200
1000
800
600
400
200
0 0
100100
PR
OFI
TA
FTER
TAX
(Rup
ees
in C
rore
s)
INC
OM
E(R
upee
s in
Cro
res)
Income Profit after Tax (PAT)
Financial Highlights
Excluding other income)
Rupees in Crores except per share data
Financial year 07-08 08-09 09-10 10-11
Income ( 1,099.28 1,377.94 1,353.75 1,586.33
Profit after Tax (PAT) 73.20 130.71 152.84 202.46
Fixed Assets 213.33 228.90 227.14 293.66
Cash and cash equivalents 155.05 340.04 504.22 514.06
Shareholders' Equity (Net worth) 657.48 772.66 872.46 1,032.54
Earnings Per Share - Basic 7.42 13.25 15.48 20.43
Dividend paid (%) 30% 55% 70% 90%
At the Year end

This page has been intentionally left blank

Building Trust
Spirit of Enquiry
Polaris Offerings
Polaris Culture
Global Presence
Inclusive CSR,
Over the last two decades, Polaris has implemented solutions across 250 of the world'sleading financial institutions, making us a leading provider of BFSI Financial Technologysolutions as acknowledged by business and consulting analysts.
The following chapters take us through our journey in the past year, a milestone year that sawPolaris being rated 'Leader' in the Gartner Magic Quadrant (Retail Core Banking) 2010, thatsaw us bag two awards at the Asian Banker Technology Awards, that saw us winning at theXCelentAwards 2010 for Best In Breadth Of Functionality In Payments , that saw our inclusiveprogramme SAMPADA being recognized as the best CSR Practice at the national level.
Exemplifying the , our Founder, Chairman & CEO Arun Jain has tackled somehard questions that help stakeholders get an insight into the role Polaris plays in the globalBFSI segment.
Chapter 1: highlights our product platforms and the impact these offeringshave made in our clients' growth journey.
Chapter 2: showcases the different events and activities that are unique toPolaris,and go a long way in making associates feel the real sense of belonging.
Chapter 3: talks about how Polaris has systematically made its presence feltin all the key global industry events, causing the sales funnel to more than double in a matterof months!
Chapter 4: an activity close to the heart of every Polarite, focuses on the Spiritof Inclusion that has transcended the act of charity and translated into a successful businessmodel for us.
' '
PREFACE
xiii

Chairman’s Statement
HARD QUESTIONS TO WHICHYOU NEED DIRECT ANSWERSGain A Better Understanding Of A Financial Technology Powerhouse
xiv
Annual Report2010 - 11

THE SPIRIT OF ENQUIRY
The importance of asking the rightquestions has never been more relevant.Getting this right enables a deeperunderstanding of customer needs. Itensures a more rigorous appreciation of ourchosen domains, and their many nuances. Itpowerfully positions our capacity to addresscustomer challenges. The rigour of enquirybuilds and nurtures an environment inwhich innovation thrives. From an investorperspective, asking the right questions willhelp stakeholders gain insights into whyleading financial institutions around theworld rely on Polaris, and how wecontinually stake our claim on FinancialTechnology Leadership!
We
Financial Technology infrastructure forbanks, financial institutions and insurancecompanies using most efficienttechnologies, methodologies and prebuiltsolutions (products).
for organisation-wide
transformation driven by the 7 dimensionCOPARIS efficiency and innovationframework. This includes Business ProcessMapping, Application Rationalisation,Enterprise Service Bus consulting, ChannelOptimisation Strategy, Data Managementconsulting, Cloud consulting and SOAconsulting.
build, maintain, expand and extend
FT Consulting
Q1.
Q2.
Why do customers pay
Polaris?
What are the Polaris key
offerings?
FT Sourcing
FT Products
FT Practices
drives Global Sourcing and
Managed Services. IP-driven sourcing isdelivered by the Polaris Global AccountManagement Group aligned around fivedistinct business clusters. Seven GlobalCentres of Excellence dynamically enhancecollective competencies. Chennai housesIntellect Court, home to our Product Group, theSpeciality Centre for Retail Banking and theSpeciality Centre for Insurance and Testing;Mumbai houses our two Centres of Excellencefor Risk and Treasury and Corporate Banking;Gurgaon is home to Polaris EnterpriseSolutions Ltd, and Hyderabad is where ourSpeciality Centre for Investment Banking is.All these Centres are supported with leadingedge and proven Frameworks, Tools andMethodologies.
encompass the formidable
Intellect™ GUB M180 Enterprise Solutionsthat provide lifecycle assurance and theefficiency of SOA architecture. Hubs, Role-based workstations, and CBX technology haveprovided never before efficiency in buildingextendable solutions closely aligned withcustomer business imperatives and anevolving economic and regulatoryenvironment. These products include CoreBanking, Credit Cards, Wealth, Brokerage,Asset Management, Cash Management,Liquidity, Trade Finance, Treasury, RiskManagement, among others.
leverage domain expertise,
maximising ROI, with aggressive solutiondelivery. Our Speciality Testing Centres ofExcellence offer the most comprehensiveenterprise testing solutions. Our Testrepository across core, lending and cardscover over 750 business scenarios and over2500 test data patterns, with superior GUBdriven test alignment and COPARIS basedexecution to deliver assured applicationthroughput and reliability.
xv

FT Practices also span functionalimplementation of FT CRM, FT Operations,
FT Performance, FT Data, FT Risk, FTIntegration, FT Security, FT PCM and FT SelfService across industry protocols andenhancing performance efficiency.
harnesses the power of aggregated
efficiencies. With the outsourcing oftechnology infrastructure related capitalexpenses, this presents a compellingbusiness advantage for smaller banks andfinancial institutions early in their growthlifecycle. The offering extends to RemoteData Centre Management (RDCMS),Complete Application Management, andHosting. The Cloud is finally moving fromhype to reality and Polaris has engineeredsolution architecture to be private, hybridand public-cloud ready.
was well received as an SOA
compliant platform which is both easy toimplement and highly efficient. Claims CBX,our peerless technology based deliveryenabler connects to the legacy systems,providing seamless integration and straightthrough processing for critical businessprocesses.
The Polaris proprietary Banking KnowledgeShelving and Wiring framework (L0) scansthe many facets in banking and insurance.Our comprehensive enterprise solutionsaddress each of the delivery facets. It isarchitected to drive efficiency at everyprocess and sub process stage of ourcustomer’s operations.
FT Infra
Intellect SEEC
Q3. What proprietary
knowledge ensures relevant
differentiation and customer
value?
HUBs
Role-based Workstations
CBXs
harness business intelligence in one
place. They mitigate risk and provide betterregulatory control and intelligence.Documents, Rules and Services are driven bythe Hubs.
enable common
front ends and drive efficiency with emphasison customer-facing operations. Claims andNew Business are given new life throughRole-based Workstation in the PCM InsuranceSolution Stack.
are next generation exchanges that
allow customer direct access in a manner thatpromises to transform the industry and setnew standards in customer experience. CBXsare the ultimate end-to-end real timeapplication standards through four keyfunctions that work in perfect harmony toproduce a superior multi-dimensional view.These are: i) Information ii)Analyticsiii) Decisioning Support and iv) Action
Financial institutions continue to grapple withthe challenge of legacy modernisation. Theolder and more established the enterprise, thegreater the challenge in migration to newsolutions. Costs are significant as are the risksassociated with business innovationprotection. There is gradual realisation that‘legacy modernisation’ is an issue that cannotbe addressed at one go and just once in thelifetime of an enterprise. Dealing with thephenomenon of ‘continuous migration’ for realtime or near real time enterprise (as relevantfor customers) requires a fundamentally newapproach to solution architecture. We areheartened by the trend of customers investing
Q4. To what extent does Polaris
make a discernible and positive
impact on its customers’
operations?
xvi
Annual Report2010 - 11
more time to get under the hood ofarchitecture design, instead of beingtypically diverted with easily replicatedfunctionality claims of solution vendors!
Polaris has critical relevance in thesustainability of financial institutions. Oursolutions enable business outcome-baseddecision making. We proactively addressemerging digital security threats andleverage Financial Technology to drivebusiness and application efficiency.
We continued to build on strongpartnerships with existing customers, andbegan a transformational journey with newcustomers. Today, 9 of the top 10 banks and7 of the top 10 insurance companies fromaround the world rely on us for businessapplication efficiency solutions. Customersrecognise the comprehensiveness of oursolutions and see relevance in dealing withus for services, products, or both. The depthof our Services business is well recognised.Polaris’ well-researched proprietaryframeworks and methodologies haverepeatedly demonstrated value delivered tocustomers.
The revolutionary Intellect™ GUB M180was premiered at the prestigious FinancialServices Club of London to an audience of50 leading transaction banking andpayments experts.
Engineered to provide 15 years in-builtsolution longevity with concurrent andsubsequent technology upgrades, the
Q5. What have we done in the
last year to consolidate our
Financial Technology
leadership position?
enterprise solution delivers superiortechnology, functionality and real timemanageability, without compromising onperformance and profitability, directly cuttinginto the inefficiencies spawned by 4 – 5generations of legacy technology.
Intellect™ CBX was launched at Payments2011, NACHA’s (National Automated ClearingHouse Association) annual event on paymentsconvergence and next generation solutions.The multi-channel offering focuses onexpanding financial institutions ability togenerate more transaction fee based income.
Intellect SEEC™ Insurance CBX was launchedat the Acord Loma Insurance signature event.Showcasing demonstrated results ofrenovated Claims business process within 120days, New Business and AutomatedUnderwriting Systems in 180 days, and a 360degree customer view through a portal based,intuitive user interface. One of the largestInsurance carriers in Australia has since gonelive on the Intellect™ Insurance platform.
Through the year numerous solutions wentlive, from Customer On Boarding at the Bankof Montreal (Capital Markets), to ApplicationData Management in North America, and DataWarehousing in APAC, to Testing in EMEA andIntellect™ Business Process studio enabledcentralisation of country-wide operationsin Tanzania.
The Intellect™ Payment Services Hub powerstransformational change for superiorpayments governance and high qualitymanagement of payment operations.Augmentation of payments servicescapabilities is made possible by the mainfeatures of the Intellect™ Payment ServicesHub: ERP Integration, Orchestration,Exception Management and Business ActivityMonitoring with comprehensive plug-on
xvii

modules for AML Services and FraudMonitoring. Polaris has proven deploymentsof the two largest Payment Solution Hubs inthe world.
Intellect™ GUB went live at the MekongHousing Bank (MHB), Vietnam, enabling thecountry’s fastest growing bank maintain itscompetitive advantage. The SOA basedmodular design facilitates the combinationof different banking components into anintegrated solution, providing agility in newproducts and services design, whilemanaging cost efficiencies.
The Intellect™ Quantum Core BankingSolution implementation at the Saigon HanoiBank (SHB) resulted in powerful businessoutcomes within a few months,emphasising the rigour of need-gapidentification and a robust solution thatenabled between 26% through 89% growthin number of customers, deposits, loans, atoptimised costs and within significantlyimproved turnaround time!
Multi-country single-instance applicationthat integrates front to back-end operations,and provides actionable information forRelationship Managers at the SAMBAFinancial Group. The Polaris Intellect™Wealth implementation leveraged thefunctionalities of customer risk profiling,financial planning, retirement planning,insurance planning, global portfoliomanagement and analytics. The deploymentwon industry recognition receiving the BestBanking Application Award at the recentAsian Bankers Awards ceremony inHong Kong.
During this period Intellect™ Quantum CoreBanking went live within 7 months at theCentral Bank of Seychelles, and at a majorbank in Japan. This solution has also gone
live in five Indian banks across private, publicand co-operative sectors.
The year witnessed improvement in globalsourcing traction, especially in Europe where3 of the top 4 banks in UK chose Polaris tomanage their applications. During the year, allglobal G10 accounts showed quarter-on-quarter growth.
We are winning and living up to the trustreposed in us. Our solutions are uniquelycomprehensive and functionally superior. Wehave demonstrated business outcomes forcustomers and their powerful testimony isfurther enhanced by analyst commendationsand industry recognition.
There has been a lot of comment on the likelysuccess of a product and services company.The solution architecture of Polaris necessarilyrequires a mix of the two. Simplisticcomparisons with other organisations that doone or the other do not do justice to oursignificant achievements in influencingcustomer perceptions and behaviour relatedto Financial Technology adoption in bankingand insurance.
Polaris is consolidating its position as the pre-eminent driver of efficiency in banking andinsurance. Financial achievements this yearvalidate the progress we have made. The totalnumber of customers reached 199 during theyear with 26 new additions. Intellect dealsizes, which were in the range ofUSD 1 million-USD 3 million two years back,have grown to USD 5 million and in the lastquarter of the financial year, the company
Q6. What are the significant
financial highlights investors
should be aware of?
xviii
Annual Report2010 - 11

closed two deals of more than USD 10million.
On a key value metric, the annualisedEarnings Per Share has grown from 2.17 in2005, through 7.42 in 2007, 15.48 in 2009,and 20.43 in 2010-11. We havestrengthened our presence in severalcountries, and the revenue mix now readsAmericas 44%, Europe 24%, IMEA (India,Middle East & Africa)14% and APAC 18%.
Later in this report, a summary of analystand industry recognition is featured.Winning industry awards for architecturedesign, functionality and implementation areparticularly heartening because the successis co-authored with the customer. Teamswho have worked on the particular solutionsare buoyed, and others are motivated toensure their efforts do not go unrecognised!
Analysts have the benefit of reviewingsolutions from the perspective of customersand solution vendors. Polaris solutions haveconsistently won critical acclaim. Movinginto more prominent positions in MagicQuadrants, domain-specific Frameworks,winning ‘best functionality’ and variousspecialist solutions accolades. This year,Polaris was featured in an astounding 43reports from leading analysts that includeGartner, Forrester, Tower, Aite, Celent,among others. This number is testimony tothe breadth of our offerings as ourcompetitors’ whose limited offerings werefeatured in less than 20 such reports.Recognition of this nature gives customerscomfort that the vendors they work with,are rated well in their chosen areas ofspecialisation.
Q7. How has Polaris fared in
terms of industry recognition?
Q8.
Q9.
Have recent acquisitions
added value to Polaris?
The smooth integration of acquiredbusinesses has been the most formidableM&A challenge. The very complimentarynature of the offerings mix and the sharedvalue systems of Laser Soft and IndigoTX,made their transitioning into Polaris a naturalprogression, where in planned stages,technologists and customers alike havegained from the mergers. Our solution set isstronger than ever and has allowed us topresent differentiated offerings to meetgeographical and customer lifecycle stagerequirements, through multiple componentand delivery models.
At Polaris, we pride ourselves in ‘InclusiveCSR’ activities where every associate isinvolved in contributing by way of mentoringor volunteering time and sharing knowledge.
The Ullas Trust held its 13 Annual Workshopthis year. This initiative ‘shapes young minds’by reaching out to less privileged students instandards 9 through 12, enhancing theirregular schooling with guidance onpersonality development, communication andtechnology skills. The structured programmeis supported by Polaris associates, andprovides children with mentorship, publicspeaking opportunities, guided peer groupengagement, corporate exposure, and prizemoney.
The Higher Education programmeincorporates modules on personalitydevelopment, responsibility,team work,placement preparedness, business
th
Are CSR initiatives relevant
in creating value for the brand
and the shareholder?
xix

communication, grooming, mentoring bysuccessful professionals, and merit basedfinancial support.
The Ullas Trust now operates acrossChennai and in all districts of Tamil Nadu, inHyderabad, and in seven districts of AndhraPradesh, and in Mumbai and Delhi. Over30,000 students have benefited from theprogramme.
Active involvement in the Ullas initiativeprovides perspective on what it takes toshape and realise dreams to all teammembers involved. It strengthens our valuesystem, and our belief that we can, and will,make a powerful and positive impact,through direct and personal intervention.Customers have been visibly moved by theway in which the initiative has opened upnew vistas for deserving students and insome cases have volunteered theirparticipation in our endeavour.
It was an honour to win the ‘Best CorporateSocial Responsibility Practice’ Award at the
6 Bombay Stock Exchange (BSE) Social &Corporate Governance Awards Function inMumbai this year. The Polaris SAMPADA(Special Appreciation & Mentoring ProgramAcknowledging Differently Abled) initiativecontinues to be inspiring in its ability toharness a very special potential forunimpaired productivity.
With 9 of the top 10 global banks, and 7 ofthe top 10 global insurance companies
th
Q10. Are there specific target
milestones against
performance that should be
tracked in the coming
financial year?
already on our customer list, we haveadequately demonstrated our ability to buildbusiness together. Our focus this year must beon expanding our presence in these accountsin a structured manner, establishingreferenceable relationships on the basis ofsuccessful delivery of customer businessoutcomes.
The products business gives us tremendousgrowth possibilities with license revenues thatare in the range of millions of dollars. Theacknowledged depth of our Services businesswill continue to drive Global Sourcing andManaged Services. The Service pipelinemoved from USD 120 million to USD 200million while product pipeline moved toalmost USD 600 million. Our robustFrameworks and Methodologies will be furtherstrengthened with technology and processinnovation.
Financial Institutions around the world areacutely conscious of the criticality of theirCore Banking Systems, to the efficiency oftheir enterprise. Analysts suggest staggeringvolumes and immediacy of change in CoreBanking Systems. This poses unprecedentedopportunity as well as demands on theflexibility of the new age systems, that mustseamlessly integrate in constantly changingenvironments.
Intellect™ Quantum Core Banking Solutionsfrom Polaris are the most efficientcomprehensive frameworks for all manner ofbanks, ranging from commercial, co-operativebanks, community and NBFCs, to the central /federal banks of countries. This financial yearwill register significant strides in establishingour authority in Core Banking Re-invention.
As Continuous Migration is recognised as aconstant phenomenon across banking andinsurance, we will further strengthen our
xx
Annual Report2010 - 11
narrative and offer distinct solutionarchitecture relevant for near and real timeenterprise.
Backed by referenceable deployments, wewill see new impetus in specific functionareas including Payments, Liquidity, AMLand Fraud Monitoring, and Claims and NewBusiness in Insurance.
The year to come will see furtheracquisitions to strengthen capabilities forexponential leaps in solution offering, withdirect relevance to customers at any growthlifecycle stage, always conscious ofemerging technologies and their adoptiontrends, and more efficient delivery models.
Polaris will be increasingly present and willplay an active role in the industry ecosystem, where banking and insurancetransformation is being conceptualised. Thecompany will continue its aggressivebusiness outcome-driven focus on customerimperatives of business decisioning, digitalsecurity, speed of deployment, costmanagement, and regulatory compliance.
In the coming year, the distinctly superiorPolaris Architecture design will dominateFinancial Technology conversations.
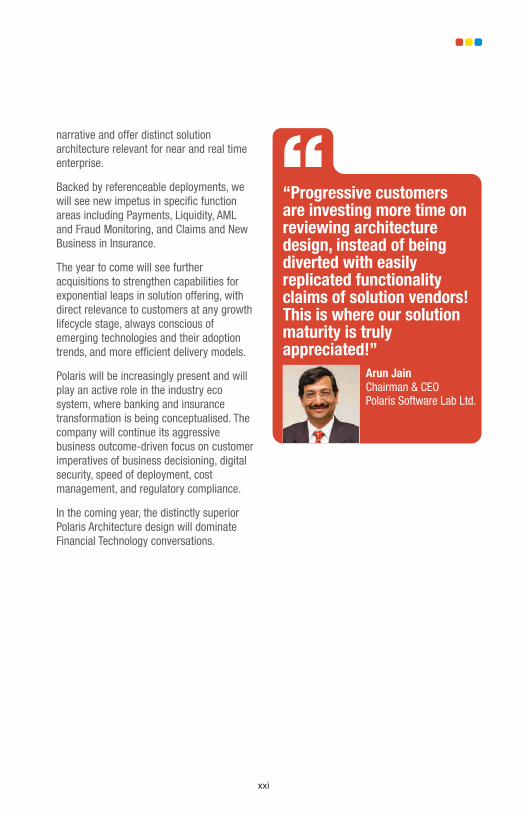
“Progressive customersare investing more time onreviewing architecturedesign, instead of beingdiverted with easilyreplicated functionalityclaims of solution vendors!This is where our solutionmaturity is trulyappreciated!”
Arun Jain
Chairman & CEOPolaris Software Lab Ltd.
xxi
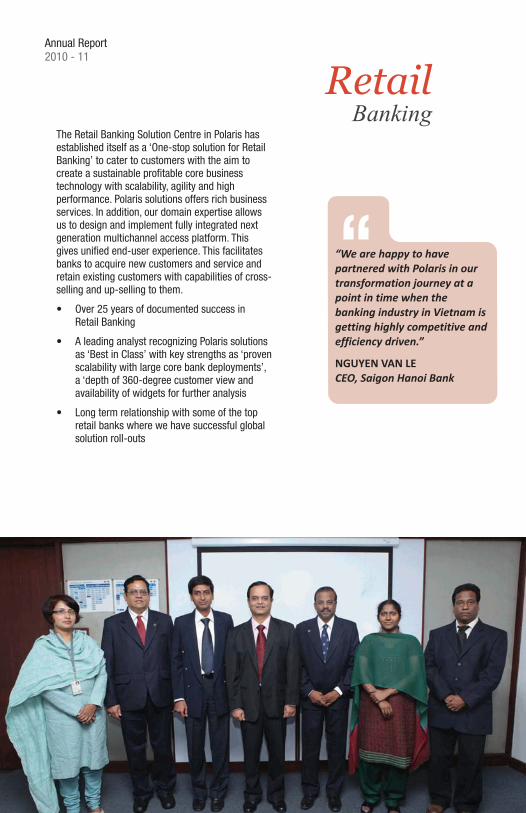
RetailBanking
The Retail Banking Solution Centre in Polaris hasestablished itself as a ‘One-stop solution for RetailBanking’ to cater to customers with the aim tocreate a sustainable profitable core businesstechnology with scalability, agility and highperformance. Polaris solutions offers rich businessservices. In addition, our domain expertise allowsus to design and implement fully integrated nextgeneration multichannel access platform. Thisgives unified end-user experience. This facilitatesbanks to acquire new customers and service andretain existing customers with capabilities of cross-selling and up-selling to them.
• Over 25 years of documented success inRetail Banking
• A leading analyst recognizing Polaris solutionsas ‘Best in Class’ with key strengths as ‘provenscalability with large core bank deployments’,a ‘depth of 360-degree customer view andavailability of widgets for further analysis
• Long term relationship with some of the topretail banks where we have successful globalsolution roll-outs
“We are happy to have
partnered with Polaris in our
transformation journey at a
point in time when the
banking industry in Vietnam is
getting highly competitive and
efficiency driven.”
CEO, Saigon Hanoi Bank
NGUYEN VAN LE
Annual Report2010 - 11
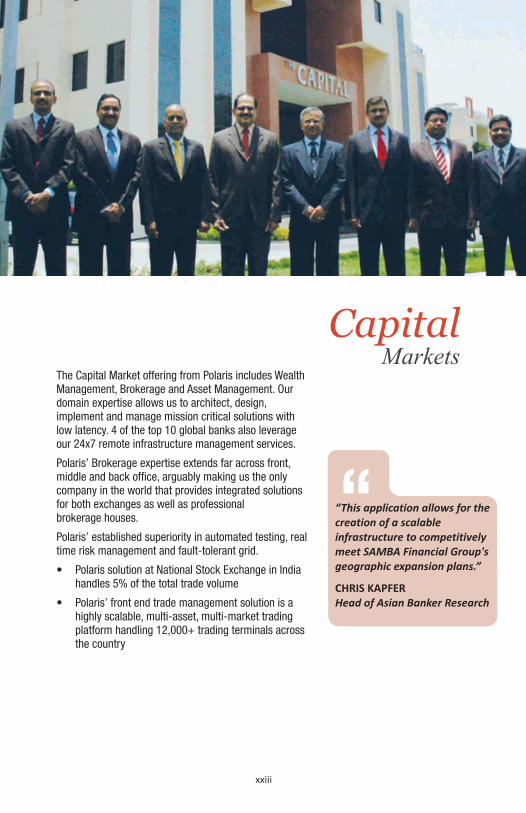
CapitalMarkets
The Capital Market offering from Polaris includes WealthManagement, Brokerage and Asset Management. Ourdomain expertise allows us to architect, design,implement and manage mission critical solutions withlow latency. 4 of the top 10 global banks also leverageour 24x7 remote infrastructure management services.
Polaris’ Brokerage expertise extends far across front,middle and back office, arguably making us the onlycompany in the world that provides integrated solutionsfor both exchanges as well as professionalbrokerage houses.
Polaris’ established superiority in automated testing, realtime risk management and fault-tolerant grid.
• Polaris solution at National Stock Exchange in Indiahandles 5% of the total trade volume
• Polaris’ front end trade management solution is ahighly scalable, multi-asset, multi-market tradingplatform handling 12,000+ trading terminals acrossthe country
xxiii
“This application allows for the
creation of a scalable
infrastructure to competitively
meet SAMBA Financial Group's
geographic expansion plans.”
Head of Asian Banker Research
CHRIS KAPFER
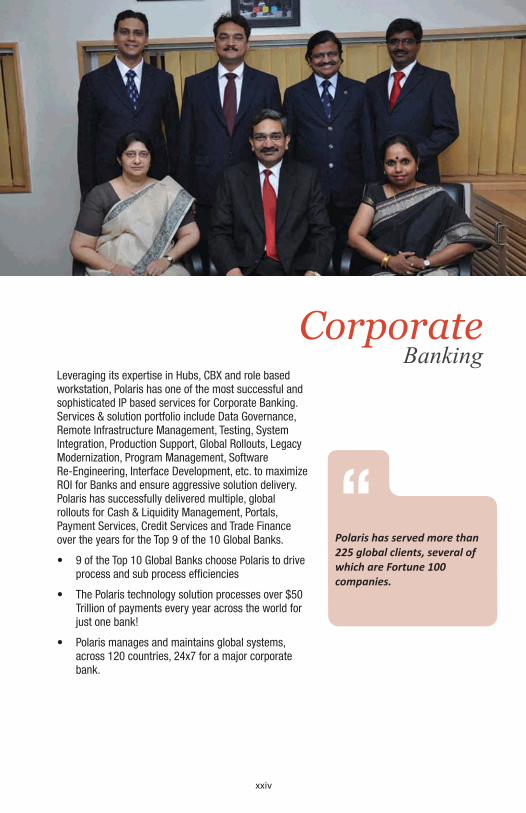
CorporateBanking
Leveraging its expertise in Hubs, CBX and role basedworkstation, Polaris has one of the most successful andsophisticated IP based services for Corporate Banking.Services & solution portfolio include Data Governance,Remote Infrastructure Management, Testing, SystemIntegration, Production Support, Global Rollouts, LegacyModernization, Program Management, SoftwareRe-Engineering, Interface Development, etc. to maximizeROI for Banks and ensure aggressive solution delivery.Polaris has successfully delivered multiple, globalrollouts for Cash & Liquidity Management, Portals,Payment Services, Credit Services and Trade Financeover the years for the Top 9 of the 10 Global Banks.
• 9 of the Top 10 Global Banks choose Polaris to driveprocess and sub process efficiencies
• The Polaris technology solution processes over $50Trillion of payments every year across the world forjust one bank!
• Polaris manages and maintains global systems,across 120 countries, 24x7 for a major corporatebank.
xxiv
Polaris has served more than
225 global clients, several of
which are Fortune 100
companies.

Risk & Treasury
The Risk and Treasury practice in a bank is one of themost complex processes due to the ever changingmarket dynamics and regulatory frameworks. Polaris’Center of Excellence for Risk and Treasury is run bysome of the very best banking and risk practitioners,who understand the importance of sophisticated riskmanagement systems for real time analysis and controlof financial exposures. Set of solutions include Basel IIand Basel III.
• FX Matching & Confirmation Solutions: Processes1000 tps to cater to the high volume of FX businessfrom new channels and settles it within the cut-offtime on a daily basis
• Preventive Credit Risk Management: Unique solutionto minimize the probability of default in the highlyprofitable Commercial business
• Polaris’ Intraday Liquidity Risk Management solutionis live in one of the largest treasuries in the world inMiddle East
Our Credit Risk Hub solution not only allowsreal time analysis but also timely action to the financialinstitutions that use disparate systems across multiplelines of business by real time consolidation ofinformation using common interfaces.
“... Replacing a 20+ year old
mature trading and risk
management application
across 27 European branches
in just under 2 years is no
mean feat"
Head of Technology of One of
Europe’s largest treasuries

InsurancePolaris has sophisticated solutions powered by anadvanced library of 300 SOA components spanning over70 business services in the Insurance domain. Polaris’comprehensive solution incorporates a 3X EfficiencyMultiplier that runs on Polaris Continuous Migration(PCM) Architecture. Our offerings enable insurancecarriers enhance customer centricity, reduce claimprocessing costs and help drive their claim philosophy.Polaris’ superior capability to create a customer-centricinsurance model allows for rapid assembly of solutionsthat allows insurance companies to adapt quickly to newbusiness requirements, product introductions andsupport new sales channels. This has resulted in:
• 5 new account wins during the year
Delivery of multiple projects over a week ahead ofschedule in full (D-7 OTIF)
MICROSOFT INDUSTRY SOLUTION UNIVERSITY STARAWARD for the Portal Solution implemented in aleading financial institution
Celent Model Insurer Asia Award for Claims Solutiondeveloped for ICICI Prudential Life Insurance
•
•
•
xxvi
“We have achieved significant
benefits through the
implementation of claims and
sales solutions using Polaris’
technology including instances
of productivity improvements
of over 50%. The PCM suite
provides a solid framework for
any organization looking to
derive benefits from a business
and architecturally driven
approach to IT.”
STEVE COLES,
Chief Information Officer,
Allianz Australia

Focusing on unbiased domain based testing since 1996;Polaris Application Certification Enterprise (PACE) has ateam of 1500+ professional testers. PACE offersfunctional testing across the Software Development LifeCycle (SDLC) to help organizations manage and rolloutdefect free applications cost effectively with minimal riskand maximum confidence. Our testing services coverfunctional testing, performance engineering and testprocess consulting. Being a domain led testing practice,we have 100% test coverage for banking segment andhave delivered 40% Reduction in Cost of Quality and60% Test Effort Reduction via Automation. Our Insurancetesting expertise includes 10,000+ Insurance SpecificReusable test cases that result in Execution cycle timereduction of up to 85% and early defect detectionthrough Integrated Testing Approach.
PACE carries out various testing activities through itsglobal engineering centers in Canada, Ireland, Australiaand India.
A key account in the US witnessed meteoric growthduring this Financial Year with revenues tripling toUSD 2 Mn
Our clients, two large global banks based in the UShave grown more than 100% in 2010-11afterimplementing Polaris offerings
•
•
Testing
xxvii
PACE registered Revenue
Growth of 81% Year-on-Year
for FY 2010-11

Polaris Enterprise Solutions Limited (PESL) has acomprehensive portfolio of consulting, sourcing andproducts with rich domain knowledge and technologyexpertise spanning across multiple platforms, includingleading ERP products. PESL offers solutions that deliverquantifiable value in the form of revenue growth, betterrisk management, increased savings and improvedstakeholder loyalty. PESL focuses on key business areassuch as CRM, SCM, Logistics & DistributionManagement, Financial Management, Human CapitalManagement and Business Intelligence.
One of the first SAP IS-Retail implementation in Indiafor a leading agriculture based products companywith an end-to end solution
PESL re-engineered the processes, managed changeand successfully implemented ERP for a leadingmanufacturer of chemicals resulting in clientdoubling its business volume with the sameresources in a year’s time
PESL took over the complete performancemonitoring and diagnostics for the core applicationsof a leading US provider of High-Speed Data, DigitalPhone, Internet and HD TV, which resulted inenhanced customer satisfaction & about 50% costreduction for application maintenance & monitoring
•
•
•
xxviii
Polaris EnterpriseSolutions
PESL Solutions for Retail,
Maufacturing, Telecom, Media
and Travel with an aim to raise
the industry benchmark and
help create competitive
advantage for sustainable
growth.

Optimus
Optimus empowers businesses to meet the modern daychallenges with its portfolio of Cross Sell and Up Sellsolutions that effectively offer the right product at theright time to end customers. From data mining andcustomer profiling to effective selling and centralizedback office management, Optimus offers businesses thegamut of support required for successful CRM.
Unique BPO that focuses on servicing clients in thebanking, financial services and insurance domain
We leverage our domain expertise and proventechnology to offer an integrated service portfolio
All our service offerings work on a global modethrough centralization to enable cost reduction andincreased efficiency
•
•
•
xxix
With its keen understanding of
the market, Optimus offers a
result-oriented portfolio of
customer service programmes
that effectively harnesses the
skills of its expert service
personnel and robust
infrastructure

IntellectProduct Group
Polaris has over the past 5 years, invested more thanUS$100M in developing Intellect™ suite of products forboth banking and insurance markets. The IntellectBanking suite is an end-to-end solution coveringproducts under Retail Banking which include CoreBanking, Lending, Credit Cards, Private Banking; WealthManagement, Brokerage and Securities platform;Corporate Banking requirements for Cash, Liquidity,Trade Finance and Treasury Management.
In addition, the 7 Hubs, 3 Portals and the proprietary FTMessage Interface Bus creates the ability to deployeither as across line of business integration solutionsitting on top of existing solution from multiple vendorsor the bank’s own solution. Intellect suite ismulti-country, multi-currency global platform that canrun 70+ regional flavors meeting individual country’sregulatory requirements, yet maintaining ease ofimplementation and management by using a singlecentral instance.
On our 32nd Anniversary, it is
rather fitting to announce the
implementation of Polaris’
Intellect™ Core Banking System
(CBS) for Central Banks. This will
usher a new chapter in the
transformation journey of our
banking, monetary and financial
system in the country…
Mr. Pierre Laporte,
Governor and Chairman,
Central Bank of Seychelles
Annual Report2010 - 11
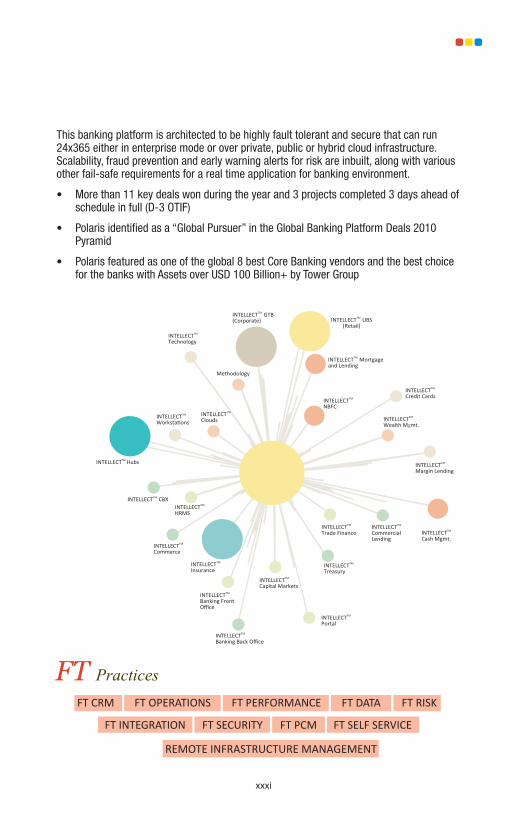
This banking platform is architected to be highly fault tolerant and secure that can run24x365 either in enterprise mode or over private, public or hybrid cloud infrastructure.Scalability, fraud prevention and early warning alerts for risk are inbuilt, along with variousother fail-safe requirements for a real time application for banking environment.
•
•
•
More than 11 key deals won during the year and 3 projects completed 3 days ahead ofschedule in full (D-3 OTIF)
Polaris identified as a “Global Pursuer” in the Global Banking Platform Deals 2010Pyramid
Polaris featured as one of the global 8 best Core Banking vendors and the best choicefor the banks with Assets over USD 100 Billion+ by Tower Group
FT Practices
REMOTE INFRASTRUCTURE MANAGEMENT
xxxi

Endorsementand Recognition
Misys
Clear2pay
Dovetail
Polaris
Breadth of Functionality
Celent ABCD Vendor View
Ad
van
ced
Te
chn
olo
gy
Polaris received an “XCelent Award” and thehighest score in the breadth of functionalitydimension for Intellect Payment ServicesHub (PSH). In a report titled ‘Evaluating thePayment Services Hub Vendors - The VisionIs Getting Closer’, Celent describedIntellect PSH as: “Its solution has animpressive connectivity layer… it also hasready adapters to directly connect to theclient’s ERP systems and has sophisticatedcapabilities to handle mixed files.”
Gartner positioned Polaris in the Leader’sQuadrant in their report on Gartner’s MagicQuadrant for International Retail CoreBanking for 2010, saying Polaris was“identified as a vendor to demonstratestrong development methodologies and
™
™
have a measurable strategy for disaggregatingcore banking functionality..”
Intellect Core Banking platform won Polaristhe “Vendor to Watch” award by Aite Group intheir report ‘Evaluating the Vendors of GlobalCore Banking Systems: Seeking NewOpportunities in Emerging Countries’. “Polarisis growing its core customer base at a fasterrate factoring in its product suite, larger dealsizes, and some recent wins in NorthAmerica…” says Aite in their report.
Polaris’ client for Intellect Claims Solution,ICICI Prudential Life Insurance won the Celent“Model Insurer Award”. The company waschosen for Model Insurer Asia because of itsbest practices in automation, STP and systemintegration.
The Polaris Banking Platform was featured inForrester Research, Inc. in their December 17,2010 independent report ‘The ForresterWave™: Global Banking Platforms, Q4 2010’which stated, “Polaris emerges as ‘StrongPerformer’ with good first-time performances.”The report added: “Intellect offers one of thetwo highest levels of SOA readiness. Inaddition, Intellect’s scores show cross-channelsupport for a broad range of channels as wellas a sound degree of platform agility.”
Intellect Core Banking was recognized by theTowerGroup in its report on ‘Wholesale
™
™
™
™
xxxii
Annual Report2010 - 11

Banking: Top 10 Technology Initiatives for2011’ which stated: “Polaris as one of thetop global core banking vendors slated to bea leader among the technology partners ofchoice for 2011.”
Polaris Global Sourcing was recognized byCelent in its report titled ‘IT ServicesVendors Solutions Spectrum, EMEA Version,2010’. The report says, “Polaris has amature to emerging presence in CustomDevelopment / Maintenance / DomainConsulting / Testing / Architecturaldesign….”
Polaris received two prestigious ‘TechnologyImplementation Awards’ at the 5th AsianBanker Awards. The company won the ‘BestCore Banking Implementation for Small-Sized Banks’ for its implementation atSaigon Hanoi Bank (SHB) for competentlymanaging the risks during the projectimplementation stage, enabling the bank toscale up its operations. Polaris also won the‘Best Banking Application’ award fordeveloping a multi-country single-instanceapplication that integrated front to back-endoperations and provided actionableinformation for relationship managers atSAMBA Financial Group
Polaris’ inclusive CSR initiative SAMPADA(Special Appreciation & Mentoring ProgramAcknowledging Differently Abled) was awardedthe Best CSR Practice Award, at the 6th BSESocial and Corporate Governance Awards heldin Mumbai, India in 2011.
Polaris has been certified by American Societyfor Training & Development (ASTD), the world’slargest association dedicated to workplacelearning and performance professionals as a‘Champion of Learning’ for its contributiontowards imparting learning programs amongemployees throughout the organization
Forrester in their report ‘Right And WrongReasons To Work with Tier Two OffshoreProviders’ stated: “Polaris is an industryvertical/business-side specialist with teams ofbusiness analysts who track industry trendsand can proactively build solutions..”
TowerGroup’s report on Outsourcing forInnovation in Financial Services said: “Polarisis one of the top vendors who has introducedlots of Innovation in Financial ServicesOutsourcing.”
Vendor System
CSC Celeriti
FIS Profile
Infosys Finacle
Oracle Financial Services Software Flexcube
SAP SAP for Banking
TCS BaNCS
Temenos T-24
Polaris Intellect
xxxiii
SOURCE: “Core Modernization for Large Banks: Start with the Customer Information System” Robert Hunt,Tower Group,March 2011.


AssociateConnectThis year saw Polaris’ Associate Connect activities
being taken to a new level with new initiatives to
bring Polarites together. The thrust is now on
facilitating associates to connect with other
associates across locations.
is the most elaborate of our four
festivals at Polaris. Hitherto, Polaris Day culminated
in a performance by an external performer. However,
this time around, the Polaris Day programme was
brought to a rousing finale by the regional prelims of
Polaris Idol, a solo singing competition. The All India
Finals of Polaris Idol was held in December 2010 in
Chennai, which saw Abhishek Kumar from our
Mumbai Office being crowned as “Polaris Idol 2010”.
also took on an all India avatar. The Polaris
Associate Cricket Tournament – PACT 2011 saw over
90 teams from the 4 centres battling it out. After
over 120 matches and the all India semi-finals in
Hyderabad and Mumbai Avatar (Mumbai) defeated
Capital Kings (Hyderabad) to become the champions.
At present, we are going through the regional rounds
of PIVOT 2011 – Polaris India Volleyball Tournament.
The highlight of both these tournaments was the
active participation of lady associates in every team.
are the cornerstone of Polaris as an
organisation and thus, provide not only the present
leadership, but also the impetus for our growth. In
keeping the all India flavour of our Associate
Connect, we had the first combined outing for
Konarks from Hyderabad and Mumbai offices
to Aurangabad.
Over 100 Konarks and their families converged in
Aurangabad for two days of fun and sightseeing in
September 2010.
Polaris Day
Sports
Konarks
xxxv


IndustryPresence
Polaris firmly established its expertise as a FinancialTechnology leader in the global BFSI market by participatingin over 40 high profile events all through the year whichhelped increase the sales funnel exponentially. The companywas recognised and acknowledged as a thought leader withseveral members of our senior management participating asspeakers. They shared the company's rich domainknowledge on a global platform.
The NASSCOM Leadership Forum was held from 8 to 10February 2011 in Mumbai. Polaris was the Gold Sponsor thisyear. The theme of the forum was 'Drivers of the Decade'.Polaris headed a panel discussion on 'Smart FT Sourcing -Critical Dimensions for Sustained Competitive Advantage'.
Polaris participated in Sibos 2010 at Amsterdam from 25 to29 October 2010. The highlight of Polaris’ participation inSibos was the grand launch of Intellect™ Global TransactionBanking (GTB) M180 for Corporate banks.
On 16 September 2010 Polaris hosted the FinancialTechnology Leadership Forum - London Convergence 2010during which it launched a new version of the flagshipproduct Intellect™ GUB M180.
Polaris participated at MEFTEC for the 3 consecutive yearto share its experience in connecting technology with theBanking & Financial Services industry. During the eventPolaris showcased select products from its Intellect™Global Universal Banking portfolio.
Polaris participated in the ACORD LOMA Forum 2010 held atLas Vegas, USA. During the event Polaris was awarded 'TheEarly Adopter - XML Transactions Award' and the 'MostCompelling Case Study Award'.
Polaris was the ‘Financial Technology Partner’ at Banknet'sAnnual Conference on Payment Systems held on 19January 2011 in Mumbai. This year the theme was ‘Movingto next generation payment systems & solutions’ whichfocused on initiatives to take payments in India to thenext level.
NASSCOM LEADERSHIP FORUM
SIBOS 2010
LONDON CONVERGENCE
MEFTEC 2010
ACORD LOMA FORUM 2010
BANKNET
th th
th
th
th
rd
th
xxxvii


Celebratingthe Can Do Spirit
As an integral part of the society, Polaris believes that it
owes much in return. In fact, the organisation’s Corporate
Social Responsibility initiative is not an extension of its
functions, but an integral part of the corporate fabric. It is
based on this thought that Polaris started the Ullas Trust
and Sampada.
Ullas Trust was started in 1997 by Polaris with the aim of
integrating Polaris with a larger community and with the
primary motive to recognise academic excellence in
students from economically challenged sections of the
society and to encourage the “Can do” spirit in them. To
achieve these, Ullas offers annual merit scholarships and
conducts annual workshops to recognise young achievers.
It conducts a self-enrichment weekend programme called
SUMMIT where computer and soft skills training are
provided. It also offers higher education scholarships and
conducts special mentoring programmes where Senior
Ullas students mentor their juniors. Ullas plans to reach
out to 3500 students this year, ably mentored by Polaris
employees. Ullas has reached out to 30,000 children since
its inception.
Sampada stands for Special Appreciation and Mentoring
Program Acknowledging Differently Abled. Infact, Polaris
refers to Sampada colleagues as "distinctly-abled" rather
than differently-abled! Sampada was initiated with the idea
of employing differently-abled people in the company’s
mainstream. The management believes that ‘Inclusion’
enables everyone fulfill their potential, and supports in
broadening people’s perspectives to appreciate, resulting
in maximum contribution. Thus, this initiative is not in the
organisation's periphery, but is linked to our business
model. Almost 18% of the associates of the Intellect
products BSC are our Sampada colleagues. This unit
designs and implements high performance banking
solutions to over 52 global banks.
Polaris will continue to recruit distinctly-abled people and
specially train them in product development. Our
campuses across India have been designed in an inclusive
manner, sensitive to the needs of such associates.
ULLAS TRUST
SAMPADA
xxxix

Board ofDirectors
xxxx
Annual Report2010 - 11

Satya PalFormer Secretary (Telecom),Chairman, MTNL & Telecom Expert
Arvind KumarSenior LawyerSupreme Court of India
Raju VenkatramanManaging Director & CEOMEDall Medical Services (P) Ltd
Abhay AgarwalPracticing CharteredAccountant
Dr. Ashok JhunjhunwalaProfessorDept. of ElectricalEngineering, IIT Chennai
R C BhargavaChairmanMaruti Suzuki India Ltd
Arun JainChairman &Managing Director
xxxxi

ManagementCommittee
Suresh KamathHead - Intellect Retail
Ravindra Koka
Head - Intellect Insurance
Arun JainChairman & CEO
Govind Singhal
Chief Operating Officer
Ramaswami S RHead-StrategyDevelopment & Corporate
Jaideep Billa
Head - On Demand Banking
Manish Maakan
Head - Intellect Solutions
Kedarnath Udiyavar
Head - Banking Practices
Sanjeev Gulati
Head - Americas Business
Bikash Mathur
Head - Europe Business
Supriyo Sircar
Head - Asia Pacific Business
Srikanth RChief Financial Officer
xxxxii
Annual Report2010 - 11

Shashi Mohan
Chief Technology OfficerRama SivaramanHead - Process Excellence
Govindarajan K
Head - Administration
T V SinhaHead - Special Projects
Vikas Misra
Head - Polaris EnterpriseSolutions Ltd.
Venkatesh Srinivasan
Head - Risk & TreasuryManoj Saxena
Head - Corporate Banking
Uppili Srinivasan
Head - Intellect GlobalTransaction Banking
Venkatesh Chillara
Head - Testing
Ed Khatuka
Head - Marketing
K Srinivasan
Head - India, Middle East &Africa Business
Wayne LiHead - Australia &New Zealand Business
xxxxiii

Pankaj Modi
Head - Capital Markets &Asset Management
Mohit OberoiHead - Retail Business
Sunil Vasantrao
Head - Key Account Delivery
Pradeep Nevatia
Chief Operating OfficerOptimus Global Services
Raj Parameswaran
Head - RetailBanking Services
Amit Gupta
Head - Insurance Services
xxxxiv
Annual Report2010 - 11


Polaris Annual Report 2010‐11 1 Directors' Report
POLARIS SOFTWARE LAB LIMITED Abridged Annual Report for the year ended March 31, 2011
‘Polaris House’, No.244, Anna Salai, Chennai – 600 006. INDIA.

2
This page has been intentionally left blank

Polaris Annual Report 2010‐11 3 Directors' Report
FINANCIAL REPORT
Directors' Report ‐‐‐‐‐‐‐‐‐‐‐‐‐‐‐‐‐‐‐‐‐‐‐‐‐‐‐‐‐‐‐‐‐‐‐ 1
Report on Corporate Governance ‐‐‐‐‐‐‐‐‐‐‐‐‐‐‐‐‐‐‐‐‐‐‐‐‐‐‐‐‐‐‐‐‐‐‐ 13
Consolidated Financial Statements ‐‐‐‐‐‐‐‐‐‐‐‐‐‐‐‐‐‐‐‐‐‐‐‐‐‐‐‐‐‐‐‐‐‐‐ 39
Report on Subsidiaries ‐‐‐‐‐‐‐‐‐‐‐‐‐‐‐‐‐‐‐‐‐‐‐‐‐‐‐‐‐‐‐‐‐‐‐ 79
Management Discussion and Analysis ‐‐‐‐‐‐‐‐‐‐‐‐‐‐‐‐‐‐‐‐‐‐‐‐‐‐‐‐‐‐‐‐‐‐‐ 81
Abridged Financial Statements ‐‐‐‐‐‐‐‐‐‐‐‐‐‐‐‐‐‐‐‐‐‐‐‐‐‐‐‐‐‐‐‐‐‐‐ 99
Notice of AGM, Attendance Slip & Proxy form ‐‐‐‐‐‐‐‐‐‐‐‐‐‐‐‐‐‐‐‐‐‐‐‐‐‐‐‐‐‐‐‐‐‐‐ 117
Bankers Citibank N.A
ICICI Bank Ltd HDFC Bank Ltd JP Morgan Chase Bank HSBC Ltd Bank of America, N.A. New Jersey
Auditors M/s. S.R.Batliboi & Associates TPL House, Second Floor, No.3 Cenotaph Road, Teynampet, Chennai ‐ 600 018.

4
This page has been intentionally left blank

Polaris Annual Report 2010‐11 1 Directors' Report
DIRECTORS' REPORT
Polaris Annual Report 2010‐11

2
This page has been intentionally left blank

Polaris Annual Report 2010‐11 3 Directors' Report
DIRECTORS' REPORT
To the Members,
We are delighted to present the report on our business and operations for the year ended March 31, 2011.
1. Results of operations (Rs. in Lacs, except per share data)
STANDALONE FINANCIALS March 31, 2011 March 31, 2010Revenue Income from Software Services & Products 137,596.45 114,347.69 Other Income 6,267.17 (378.36)Total Income 143,863.62 113,969.33Expenditure Software Development & Other Operating Expenditures
119,567.98 96,366.50
Finance charges & Depreciation 2,677.87 2,592.01Total Expenditure 122,245.85 98,958.51 Profit Before Tax (PBT) 21,617.77 15,010.82Less: Income Taxes 2,914.99 1,946.50 Profit After Tax (PAT) 18,702.78 13,064.32
Surplus brought forward 36,019.06 28,312.27 Profit available for appropriation 54,721.84 41,376.59Appropriations Total Dividend 4,465.02 3,462.63 Dividend Tax 717.65 588.47 Transferred to General Reserve 1,900.00 1,306.43 Balance carried to Balance Sheet 47,639.17 36,019.06
Earnings Per Share (EPS)
Basic Rs. 18.87 13.23Diluted Rs. 18.74 13.11CONSOLIDATED FINANCIALS March 31, 2011 March 31, 2010Total Income Total Expenditure Profit Before, Interest, Depreciation & Tax (EBIDTA)
164,540.09137,243.45 27,296.64
134,645.54113,173.80 21,471.74
Finance Charges & Depreciation 3,480.73 3,592.62Profit Before Tax (PBT) 23,815.91 17,879.12Profit After Tax (PAT) 20,245.97 15,284.24 Earnings Per Share (EPS)
Basic Rs. 20.43 15.48Diluted Rs. 20.28 15.34
4
2. Business performance
The consolidated revenue of Polaris Software Lab Ltd from Software development services, products and Business Process Management for the year ended March 31, 2011 stood at Rs.158,633 Lacs, as against the previous year’s revenue of Rs.135,376 Lacs. The consolidated Net Profit for the fiscal year ended March 31, 2011 stood at Rs.20,246 Lacs as against the previous year’s consolidated Net Profit of Rs.15,284 Lacs. The reserves and surplus increased to 98,295 Lacs (2010‐11) from Rs.82,299 Lacs (2009‐10).
Our software services engagements are driven with business benefits & long‐term relationship vision. We have nurtured strong relationships through sustained delivery of value and it is with considerable pride that we would like to share that we are celebrating 26 years our continued relationship with Citibank, one that is based on sustained and growing value.
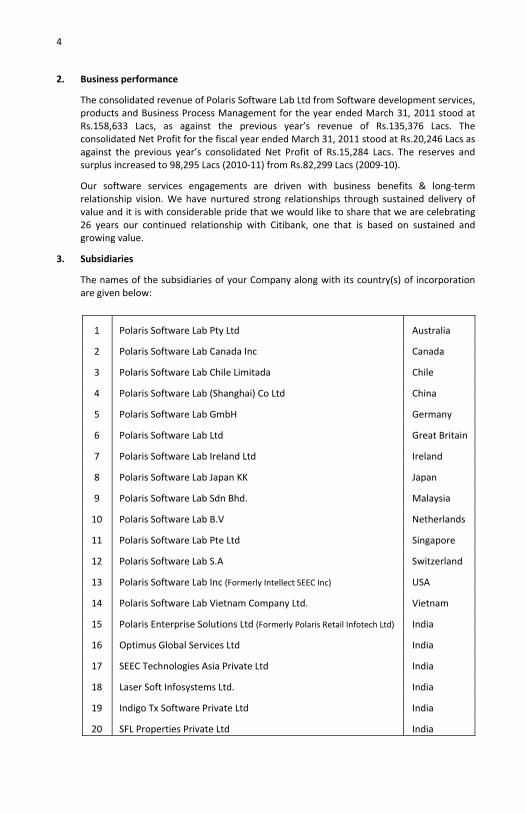
3. Subsidiaries
The names of the subsidiaries of your Company along with its country(s) of incorporation are given below:
1 Polaris Software Lab Pty Ltd Australia
2 Polaris Software Lab Canada Inc Canada
3 Polaris Software Lab Chile Limitada Chile
4 Polaris Software Lab (Shanghai) Co Ltd China
5 Polaris Software Lab GmbH Germany
6 Polaris Software Lab Ltd Great Britain
7 Polaris Software Lab Ireland Ltd Ireland
8 Polaris Software Lab Japan KK Japan
9 Polaris Software Lab Sdn Bhd. Malaysia
10 Polaris Software Lab B.V Netherlands
11 Polaris Software Lab Pte Ltd Singapore
12 Polaris Software Lab S.A Switzerland
13 Polaris Software Lab Inc (Formerly Intellect SEEC Inc) USA
14 Polaris Software Lab Vietnam Company Ltd. Vietnam
15 Polaris Enterprise Solutions Ltd (Formerly Polaris Retail Infotech Ltd) India
16 Optimus Global Services Ltd India
17 SEEC Technologies Asia Private Ltd India
18 Laser Soft Infosystems Ltd. India
19 Indigo Tx Software Private Ltd India
20 SFL Properties Private Ltd India

Polaris Annual Report 2010‐11 5 Directors' Report
The financial statements of subsidiaries have to be published in the Annual Report, pursuant to the provisions of Section 212 of the Companies Act, 1956.
The Ministry of Corporate Affairs, Government of India, issued a General Circular No.2/2011 dated February 8, 2011 and granted a general exemption for complying with the provisions of Section 212 of the Companies Act, 1956 subject to certain conditions. Accordingly, the Board of Directors of the Company at its meeting held on April 28, 2011 decided to comply with the conditions as stipulated in the said circular. A brief of the conditions are given hereunder for reference:
(i) The annual accounts of the subsidiary(s) and other related information shall be made available to shareholders of the holding and subsidiary Companies and on demand the copies of the same shall also be furnished to the shareholders.
(ii) The annual accounts of the subsidiary(s) shall be kept for inspection to the shareholders in the Registered office of the Company and or the subsidiaries concerned;
(iii) The statement of financials of the subsidiaries will form part of the abridged Annual Report.
4. Cash & Cash equivalents
Polaris liquidity remains healthy with zero‐debt and a cash reserve of over Rs.51,406 Lacs. The DSO is at an impressive 45 days.
5. Share Capital
During the year, under ASOP 2003 Scheme the company has allotted 2,34,450 equity shares of Rs.5/‐ each to 121 Associates / Directors. As a result of the above allotments the issued, subscribed and paid‐up equity share capital of the company was increased from Rs.494,805,735/‐ comprising of 98,961,147 equity shares of Rs.5/‐ each as on March 31, 2010 to Rs.495,977,985/‐ comprising of 99,195,597 number of equity shares of Rs.5/‐ each as on March 31, 2011. Further your company during this year, under ASOP 2004 Scheme transferred 72,900 equity shares of Rs.5/‐ each to 22 associates of Orbitech Employees Welfare Trust, on exercise of the options granted under the said scheme.
6. Dividend
We propose a dividend of Rs.4.50 per share (90%) upon approval of the shareholders at the 18th Annual General Meeting; this dividend will be paid out of the profits of the company.
The transfer books and register of members of the company will be closed w.e.f July 11 to July 20, 2011 (both days inclusive).
7. Corporate Governance
Your company has been complying with the conditions of Corporate Governance as stipulated in Clause 49 of the Listing Agreement. A separate report on Corporate Governance along with Auditors’ certificate on compliance with of the Corporate Governance norms as stipulated in Clause 49 of the Listing Agreement and Management Discussions & Analysis forming part of this report are provided elsewhere in this Annual Report.
8. Conservation of energy, technology absorption, foreign exchange earnings and outgo.
The particulars, as prescribed under clause (e) of sub‐section (1) of Section 217 of the Companies Act, 1956 read with the Companies (Disclosure of Particulars in the Report of Board of Directors) Rules, 1988 are set out in the Annexure to the Directors’ report section.

6
9. Particulars of employees
As required under the provisions of Section 217(2A) of the Companies Act, 1956 read with Companies (Particulars of Employees) Rules, 1975 as amended, a statement showing the names and other particulars of employees are set out in the Annexure to the Directors’ Report, forming part of the complete version of the Annual Report for the year 2010‐11. Pursuant to the exemption given under the Section 219(1)(b)(iv) of the Companies Act, 1956 the said annexure has not been enclosed with the Directors' Report forming part of the abridged version of the Annual Report 2010‐11.
10. Directors’ responsibility statement as required under section 217(2AA) of the Companies Act, 1956
Pursuant to the provisions of Section 217(2AA) of the Companies Act, 1956 the Directors of your company confirm that:
(i) In the preparation of the Annual Accounts, the applicable accounting standards had been followed along with proper explanation relating to material departures;
(ii) The Directors had selected such accounting policies and applied them consistently and made judgments and estimates that are reasonable and prudent so as to give a true and fair view of the state of affairs of the company at the end of the financial year and of the profit or loss of the company for that period;
(iii) The Directors had taken proper and sufficient care for the maintenance of adequate accounting records in accordance with the provisions of this Act for safeguarding the assets of the company and for preventing and detecting fraud and other irregularities.
(iv) The Directors had prepared the Annual Accounts on a “Going concern basis”.
11. Directors
Messrs Dr.Ashok Jhunjhunwala and Mr.R.C.Bhargava, Directors of the company are retiring by rotation at the forthcoming Annual General Meeting of the company and being eligible offer themselves for re‐appointment.
Mr.Anil Khanna and Mr.Anil Nagu, Directors of the company resigned from the directorship of the Company w.e.f July 12, 2010 & August 02, 2010 respectively.
12. Associate (Employee) Stock Option Schemes (ASOP)
ASOP 2003 & 2004 (Details of options during the year 2010‐11)
Particulars ASOP 2003 ASOP 2004
Options outstanding as on April 01, 2010 2,880,300 609,500
The pricing formula Market value Market value
Options granted during the year 735,000 165,000
Options exercised during the year 234,450 72,900
Total number of shares arising as a result of exercise of Options
234,450 72,900
Money realized by exercise of Options (in Rs. Crores) 2.02 0.30
Total number of Options in force 2,981,850 627,700

Polaris Annual Report 2010‐11 7 Directors' Report
Particulars/information under ASOP 2003 scheme March 31, 2011 March 31, 2010
Weighted average exercise price (Rs.) 185.57 143.51Weighted average fair value (Rs.) 97.56 75.29 (i) Details of number of options granted to Senior Management
Personnel: ASOP 2003 ASOP 2004
(ii) Employee receiving 5% or more of the total number of Options granted during the year
(iii) Employees granted Option equal to or exceeding 1% of the issued capital
162,000 40,000
Nil
Nil
Diluted Earnings Per Share (EPS) pursuant to issue of shares on exercise of Options (i) Employee compensation cost using intrinsic method of
accounting. (ii) Employee compensation cost using fair value method of
accounting. Difference between (i) & (ii) Impact for the accounting period had the fair value method been used on the following:
Net results decreased by Basic EPS will reduce by
Rs. Nil Rs.14,058,968 Rs.14,058,968 Rs.14,058,968 Rs.0.14
Method and significant assumptions used to estimate the fair value of Options under Black & Scholes methods, significant assumptions are:
Date of grant
Share price (Rs.)
Exercise price (Rs.)
(a) Risk free rate of interest – 7.99% 22.04.2010 186.00 185.95 (b) Expected life of Options 2.5 to 6.5
years 15.07.2010 207.40 207.40
(c) Expected volatility 63.06% 19.10.2010 173.85 173.85 (d) Expected dividend yield 1.37% 21.01.2011 178.15 183.85(e) Price of the underlying share in
market at the time of grant under ASOP 2003
Share price on the date of grant
Your company has granted options to the eligible associates under the Associate Stock Option Plans 2003 & 2004 as per SEBI Guidelines on ESOP.
13. Auditors
M/s S.R.Batliboi & Associates, Chennai Chartered Accountants who are the Statutory Auditors of the company retire at the forthcoming Annual General Meeting and are eligible for re‐appointment. The retiring auditors have furnished a certificate of their eligibility for re‐appointment with the provisions of Section 224(1B) of the Companies Act, 1956 and have indicated their willingness to be re‐appointed.
14. Fixed deposits
Your company has not accepted any deposits during the financial year and as such, no amount of principal or interest was outstanding on the date of the Balance Sheet.

8
15. Social connect
Ullas Trust
A humble initiative which started in 1997 with just 32 children has today turned into a revolution of sorts. So far, Ullas Trust has awarded 25,000 scholarships to students in schools across Chennai and all districts of Tamil Nadu, seven districts of Andhra Pradesh including Hyderabad and cities of Mumbai and Delhi. Polaris associates plan to take this to the grassroot level so that the Trust can achieve its goal of One Student One Mentor.
Ullas Annual Workshop ‐ Chennai
Ullas Trust celebrated its 13th Annual Workshop on August 21, 2010 in Chennai where over 2,000 Ullas Achievers from Tamil Nadu participated in the “Can Do It” workshop and were awarded Ullas Young Achievers Scholarships. Continuing its unrelenting endeavor of recognizing academic excellence in students from Corporation, Government and Government aided schools, the Ullas Trust awarded scholarships to students from across 176 schools in Chennai and 65 schools from all 32 districts headquarters of Tamil Nadu. In addition to that, 200 students were awarded Higher Education Scholarships for pursuing professional courses.
Ullas Annual Workshop ‐ Mumbai
Around 350 students from 9 schools were awarded scholarships in the Mumbai workshop held on December 11, 2010. The Diary of Dreams session was very interactive making the students participate by penning down their dreams. The teamwork of around 45 associates who volunteered to travel to different zones in Mumbai kick started the Summit classes with a new methodology of going to schools and conducting the classes there during the weekends. This was the first time a new procedure was adapted which was later followed in other chapters also.
Ullas Annual Workshop ‐ Hyderabad
In Hyderabad, 487 students from 96 schools eagerly participated in the Hyderabad Annual workshop on February 5, 2011 which was held at the Hyderabad office premises. The Young Achievers entertained everyone with a few cultural performances. The Diary of Dreams workshop was very interactive and enabled students to share their dreams. Weekend Program Summits were a great hit at Hyderabad which saw the participation of not only the Ullas children but also their friends who attended the classes in order to improve their communication skills. The Hyderabad Team took the initiative of ‘Touch the Soil’ Programme where the scholarships were given to 256 students from 35 schools across 6 districts. Associates travelled to the villages and distributed scholarship cheques.
Ullas Annual Workshop ‐ Delhi
The Delhi chapter of Ullas conducted their Annual Workshop on February 12, 2011 where 267 Young Achievers from 8 schools participated. The Diary of Dreams Workshop conducted went very well at Delhi with children interacting cheerfully with the Ullas volunteers. In Delhi also the volunteers travelled to schools to take the weekend classes in the schools. Ullas plans to expand its reach to Noida very soon.
SAMPADA
SAMPADA ‐ Special Appreciation and Mentoring Program Acknowledging Differently Abled is the inclusion programme at Polaris where our SAMPADA colleagues are referred to as "Distinctly abled" rather than differently abled. Around 18% of associates at the Intellect Products Group business solution centre are SAMPADA colleagues. This unit designs and

Polaris Annual Report 2010‐11 9 Directors' Report
implements high performance banking solutions to over 52 banks across the globe and offers the best Price to Performance ratio for their solutions.
The SAMPADA initiative was awarded the Best CSR Practise Award at the 6th BSE Social and Corporate Governance Awards in 2010.
16. Impending litigations
Details of impending litigations are furnished in Notes to accounts C2 (iii) & (iv) of significant accounting policies and notes to accounts provided as an annexure to the complete and full Balance Sheet and Profit and Loss account of the company for the FY 2010‐11.
17. Acknowledgement
Your Directors take this opportunity to thank all investors, clients, vendors, banks, regulatory and Government authorities and Stock Exchanges for their continued support. Your Directors also wish to place on record their appreciation for the contribution made by the Associates at all levels.
By Order of the Board For Polaris Software Lab Limited
Place: Chennai Date: April 28, 2011
Arun JainChairman & Managing Director

10
Annexure to the Directors’ Report
The Particulars as prescribed under sub‐section (1) (a) of Section 217 of the Companies Act, 1956 read with the Companies (Disclosure of particulars in the Report of Board of Directors) Rules, 1988.
1. Details of the Conversation of Energy
Virtualization of servers: By virtualization technology, multiple virtual servers can be accommodated in to one physical server. This reduces the number of physical servers in data center, thus reducing the space and in turn improving the cooling while reducing the power consumption.
(a) New sites have one physical server that holds virtual slices of domain, antivirus, patch, DHCP, DNS & File servers, etc. Thus 10 servers can be made available in one physical server and effective power savings would be around 4250 KVA. This is implemented at new sites Pune & Thane, and future sites will also have similar configuration. Further, there would be power saving on usage of Air Conditioner in Data Center due to reduction in number of physical servers.
(b) Server consolidation: Existing multiple physical servers are getting consolidated into very few large physical servers. For instance, existing ten Sun servers got consolidated in to one large Physical server.
(c) Introduction of Low power desktops: All‐in‐one PC‐ Lenovo will be provided in place of regular desktops. This has a power saving of around 80W than a normal desktop.
(d) Replacement of CRT monitors with LCD: Replacement of around 1200 monitors over one year, which can provide a power saving of 90W per desktop.
2. Research & Development
Your company is associated with global leaders in Banking, Financial Services & Insurance (BFSI) vertical space, which propels the demand on continuous research and development in all pervasive areas of information technology like User Interface & Business Analytics, High Performant and secure applications, Development Productivity & Quality, Testing, Deployment and Upgrades. Your company is constantly evolving and improving the framework for R&D.
We have continued to invest in some fundamental research with small budget from long term perspective. Our emphasis is more in the area of Applied Research to build IPR with clear revenue generating potential. Both fundamental & applied research is done under the supervision and management of the Chief Technology Officer.
One area that we focused last year was UI standards & Analytics design practices for enhanced user experience of Intellect suite of products. Continuing with the motto of providing ultimate user experience, one of the significant areas of R&D at the company has been in the area of mobile / tablet development. With the current trend in Mobile Technology, we initially adopted Mobile Application development for iPAD, iPhone devices. We are continuously focused on advanced aspects of Mobile Technology development with native development for most popular Mobile devices i.e. iPhone, Blackberry, Android along with Tablet devices (like iPad). We are also continuously enhancing our capabilities by researching in area of development of cross platform mobile applications with write once run on multiple device capability and also researching "mobile web" as an alternative means to achieve the same. A mobile CoE focuses exclusively on technologies related to

Polaris Annual Report 2010‐11 11 Directors' Report
mobile. In addition to mobile, various help tools were researched to standardize on RoboHelp ‐ an advanced tool to have very professional help module for Intellect. These will go a long way in improved customer experience to differentiate Intellect from its competitors.
Security was another major focus area to ensure security vulnerability and major security attacks are addressed in the development cycle, to provide a more secure solution to our customer. As part of security CoE some areas where research was intensified included latest web vulnerability research and exploration of OWASP top ten, Secure communication, cryptography & digital signatures, public key infrastructure, evaluating security products and establishing best practices to minimize security flaws in application. A comprehensive vulnerability and mitigation plan has been worked out to support projects in Polaris.
We are continually focused on advanced aspects of infrastructure products like Oracle database, Oracle Weblogic, IBM Websphere, JBOSS Application Server, JBOSS SOA Stack and Oracle Fusion middleware. An SOA enterprise blueprints is being prepared using these technologies.
Defect reduction, developer productivity and performance of code has been a key focus area for Polaris. The existing tool set used during development was enriched by extensive research, evaluation, standardization & procurement of more tools to be used for code quality, productivity, continuous integration and performance analysis on client‐side, server side and database side. This resulted in new tools being introduced ‐ SQL Optimizer, Ajax DynaTrace, TPTP, PMD, MyEclipse.
3. Technology Absorption, Adaptation, and innovation
Technology upgrades:
Polaris Domain was migrated to Windows 2008 across Network to be compatible with current applications and Software Internet links and MPLS links were upgraded across location for better performance and Business support.
Canada and EMEA (Citi) locations were implemented with MPLS connectivity and brought under MPLS cloud for better connectivity and performance.
Infrastructure expansion along with Business Growth:
As part of Business expansion and growth, Multiple ODCs with various Technology & Domain capabilities serving specific customers were set‐up across Polaris development facilities in India, as per Customer requirements.
Following Locations across Geographies added in to Polaris Network and brought under IT Governance:
Chennai – Laser Soft (Ambattur) & Mafoi facilities, Hyderabad – SEEC, Mumbai Region – Polaris facilities at Pune, Thane & Nirlon. Overseas – Polaris Inc.(SEEC), Polaris facilities at Pittsburgh & Chile
As an excellent illustration of technology absorption, brilliant customer experience and innovative use of technology for its own use, we developed and launched an iPad application called "iSales". This is an iPad app for marketing, sales, pre‐sales and executives

12
with Polaris offerings at finger tips and an intuitive easy‐2‐use interface that leverages Apple iPad touch effects.
Last year also saw extensive adoption of "ExtJS" and "Fusion Charts" which were standardized earlier for RIA development. This is now being increasingly used for developing widgetized UI for new generation Intellect. Adobe Flex was also adopted as the RIA technology for certain customer projects
4. Foreign Exchange Earnings and outgo
(a) Export Initiatives:
Your Company is registered as an export oriented unit with Software Technology Park of India and has a network of international offices across Globe. In the year 2010‐11 the revenue derived out of Software Exports stood at Rs.124,066.02 Lacs which is 90% of the total revenue from operations generated by the Company.
(b) Foreign Exchange Earned and Used:
(Rs. In Lacs) For the year ended March 31 2011 2010
Foreign Exchange earnings 124,066.02 105,445.35
Foreign Exchange outgo (including capital goods) 61,520.64 51,238.26
By Order of the Board
For Polaris Software Lab Limited Place: Chennai Date: April 28, 2011
Arun Jain Chairman & Managing Director

Polaris Annual Report 2010‐11 13 Report on Corporate Governance
REPORT ON CORPORATE GOVERNANCE
Polaris Annual Report 2010‐11

14
This page has been intentionally left blank
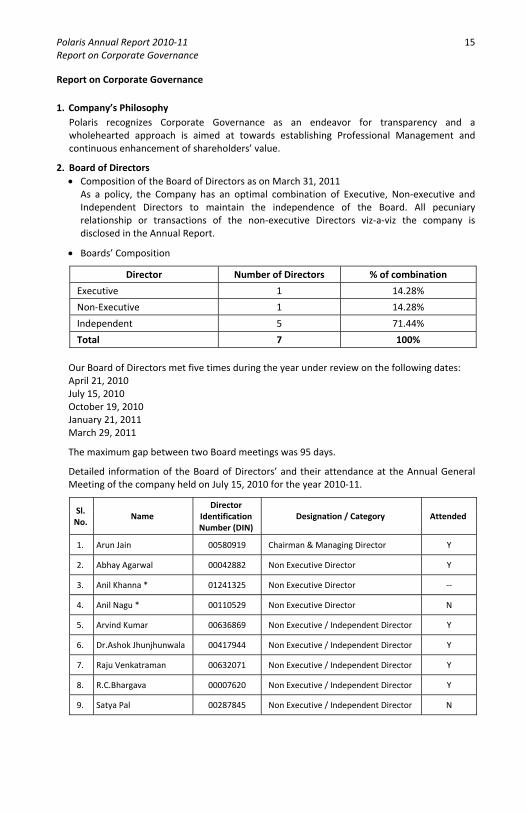
Polaris Annual Report 2010‐11 15 Report on Corporate Governance Report on Corporate Governance
1. Company’s Philosophy Polaris recognizes Corporate Governance as an endeavor for transparency and a wholehearted approach is aimed at towards establishing Professional Management and continuous enhancement of shareholders’ value.
2. Board of Directors • Composition of the Board of Directors as on March 31, 2011
As a policy, the Company has an optimal combination of Executive, Non‐executive and Independent Directors to maintain the independence of the Board. All pecuniary relationship or transactions of the non‐executive Directors viz‐a‐viz the company is disclosed in the Annual Report.
• Boards’ Composition
Director Number of Directors % of combination
Executive 1 14.28%
Non‐Executive 1 14.28%
Independent 5 71.44%
Total 7 100%
Our Board of Directors met five times during the year under review on the following dates: April 21, 2010 July 15, 2010 October 19, 2010 January 21, 2011 March 29, 2011
The maximum gap between two Board meetings was 95 days.
Detailed information of the Board of Directors’ and their attendance at the Annual General Meeting of the company held on July 15, 2010 for the year 2010‐11.
Sl. No.
Name Director
Identification Number (DIN)
Designation / Category Attended
1. Arun Jain 00580919 Chairman & Managing Director Y
2. Abhay Agarwal 00042882 Non Executive Director Y
3. Anil Khanna * 01241325 Non Executive Director ‐‐
4. Anil Nagu * 00110529 Non Executive Director N
5. Arvind Kumar 00636869 Non Executive / Independent Director Y
6. Dr.Ashok Jhunjhunwala 00417944 Non Executive / Independent Director Y
7. Raju Venkatraman 00632071 Non Executive / Independent Director Y
8. R.C.Bhargava 00007620 Non Executive / Independent Director Y
9. Satya Pal 00287845 Non Executive / Independent Director N
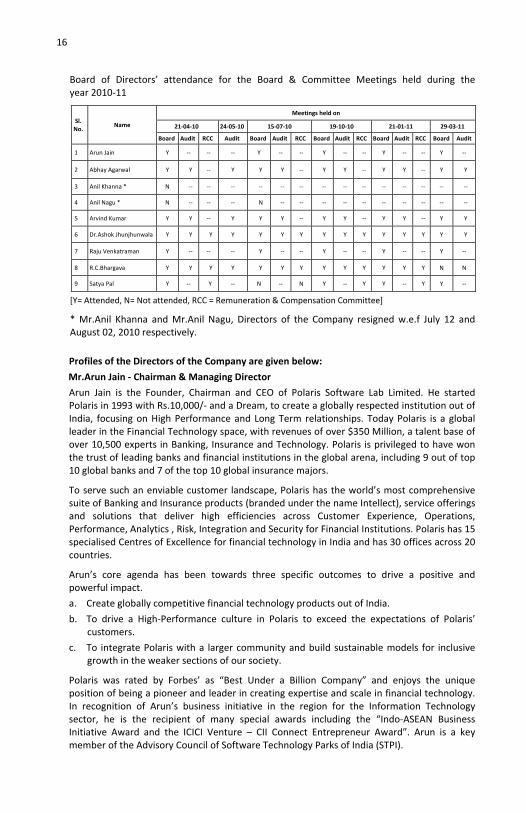
16
Board of Directors’ attendance for the Board & Committee Meetings held during the year 2010‐11
Sl. No.
Name
Meetings held on
21‐04‐10 24‐05‐10 15‐07‐10 19‐10‐10 21‐01‐11 29‐03‐11
Board Audit RCC Audit Board Audit RCC Board Audit RCC Board Audit RCC Board Audit
1 Arun Jain Y ‐‐ ‐‐ ‐‐ Y ‐‐ ‐‐ Y ‐‐ ‐‐ Y ‐‐ ‐‐ Y ‐‐
2 Abhay Agarwal Y Y ‐‐ Y Y Y ‐‐ Y Y ‐‐ Y Y ‐‐ Y Y
3 Anil Khanna * N ‐‐ ‐‐ ‐‐ ‐‐ ‐‐ ‐‐ ‐‐ ‐‐ ‐‐ ‐‐ ‐‐ ‐‐ ‐‐ ‐‐
4 Anil Nagu * N ‐‐ ‐‐ ‐‐ N ‐‐ ‐‐ ‐‐ ‐‐ ‐‐ ‐‐ ‐‐ ‐‐ ‐‐ ‐‐
5 Arvind Kumar Y Y ‐‐ Y Y Y ‐‐ Y Y ‐‐ Y Y ‐‐ Y Y
6 Dr.Ashok Jhunjhunwala Y Y Y Y Y Y Y Y Y Y Y Y Y Y Y
7 Raju Venkatraman Y ‐‐ ‐‐ ‐‐ Y ‐‐ ‐‐ Y ‐‐ ‐‐ Y ‐‐ ‐‐ Y ‐‐
8 R.C.Bhargava Y Y Y Y Y Y Y Y Y Y Y Y Y N N
9 Satya Pal Y ‐‐ Y ‐‐ N ‐‐ N Y ‐‐ Y Y ‐‐ Y Y ‐‐
[Y= Attended, N= Not attended, RCC = Remuneration & Compensation Committee]
* Mr.Anil Khanna and Mr.Anil Nagu, Directors of the Company resigned w.e.f July 12 and August 02, 2010 respectively.
Profiles of the Directors of the Company are given below:
Mr.Arun Jain ‐ Chairman & Managing Director
Arun Jain is the Founder, Chairman and CEO of Polaris Software Lab Limited. He started Polaris in 1993 with Rs.10,000/‐ and a Dream, to create a globally respected institution out of India, focusing on High Performance and Long Term relationships. Today Polaris is a global leader in the Financial Technology space, with revenues of over $350 Million, a talent base of over 10,500 experts in Banking, Insurance and Technology. Polaris is privileged to have won the trust of leading banks and financial institutions in the global arena, including 9 out of top 10 global banks and 7 of the top 10 global insurance majors.
To serve such an enviable customer landscape, Polaris has the world’s most comprehensive suite of Banking and Insurance products (branded under the name Intellect), service offerings and solutions that deliver high efficiencies across Customer Experience, Operations, Performance, Analytics , Risk, Integration and Security for Financial Institutions. Polaris has 15 specialised Centres of Excellence for financial technology in India and has 30 offices across 20 countries.
Arun’s core agenda has been towards three specific outcomes to drive a positive and powerful impact.
a. Create globally competitive financial technology products out of India.
b. To drive a High‐Performance culture in Polaris to exceed the expectations of Polaris’ customers.
c. To integrate Polaris with a larger community and build sustainable models for inclusive growth in the weaker sections of our society.
Polaris was rated by Forbes’ as “Best Under a Billion Company” and enjoys the unique position of being a pioneer and leader in creating expertise and scale in financial technology. In recognition of Arun’s business initiative in the region for the Information Technology sector, he is the recipient of many special awards including the “Indo‐ASEAN Business Initiative Award and the ICICI Venture – CII Connect Entrepreneur Award”. Arun is a key member of the Advisory Council of Software Technology Parks of India (STPI).

Polaris Annual Report 2010‐11 17 Report on Corporate Governance
Mr.Abhay Agarwal ‐ Practising Chartered Accountant
Mr.Abhay Agarwal is a practising Chartered Accountant based at Delhi. He is well experienced in the areas of accounting, finance, management and corporate advisory and his proficiency and competency in the said areas are asset to the Company.
Mr.Abhay Agarwal joined the Board of Polaris in May 1995. He is a member of Audit Committee and Shareholders' Committee of the Company. He is also a Director in Sunshine India (P) Ltd., Dabur Securities (P) Ltd., British Health Products (India) Ltd., Sahiwal Investment & Trading Company, Upvan Farms & Services (P) Ltd., Weltime Investment (P) Ltd., Param Investments (P) Ltd., Northern Herbal Farms (P) Ltd., Intelligent Information Systems (P) Ltd., Burman Resorts (P) Ltd., Newage Capital Services (P) Ltd., Betteroption Estates (P) Ltd., Elephant India Advisors (P) Ltd., Green Valley Products (P) Ltd., Natures Bounty Wines & Allied Products (P) Ltd., Vansh Holdings (P) Ltd., Maneswari Trading Company, H&B Stores Ltd., Dr.Fresh Property Development (P) Ltd., Dr.Fresh Health Care (P) Ltd. as an alternate Director, Lite Eat Out Foods (P) Ltd., Super Hoze Industries (P) Ltd., Dr.Fresh Buildcon (P) Ltd., IMB Infrastructure (P) Ltd., KBC India (P) Ltd., Shree Investment (P) Ltd., Elephant India Finance (P) Ltd., and Dr.Fresh SEZ Phase I (P) Ltd., as an alternate Director, Kullu Valley Leisure Resorts (P) Ltd., B.R.Bee Products (P) Ltd.
Mr.Arvind Kumar ‐ Senior Lawyer ‐ Supreme Court
Mr.Arvind Kumar, who is an M.A. L.L.B., enrolled as an Advocate in November 1963 in the Uttar Pradesh Bar Council. He practiced in the High Court of Judicature at Allahabad from 1966 to 1972 and later in the year 1972 he shifted to the Supreme Court of India at New Delhi and started practicing there. He is a Senior Lawyer having 47 years of professional standing at Bar and has gained enough global experience by participating in civil and corporate cases around the world.
Mr.Arvind Kumar is a Life Member of the Supreme Court Bar Association and Bar Association of India. Presently practising as a Senior Advocate in the Supreme Court, he is a reputed corporate legal expert and advises Polaris on issues relating to Corporate Governance, Legal and other statutory compliance issues.
Mr.Arvind Kumar joined the Board of Polaris in May 1995 and Chairs the Audit Committee of the Company. He is also a Director in Nucsoft Limited, Associated Legal Advisors (P) Limited, Second Innings India (P) Limited and Inckah Infrastructure Technologies (P) Ltd.
Dr.Ashok Jhunjhunwala ‐ Professor ‐ Department of Electrical Engineering, IIT Madras
Dr.Ashok Jhunjhunwala received his B.Tech degree from IIT, Kanpur and his MS and Ph.D degrees from the University of Maine. From 1979 to 1981, he was with Washington State University as Assistant Professor. Since 1981, he has been teaching at IIT, Madras, where he leads the Telecommunications and Computer Networks group (TeNeT). This group works with industry in the development of technologies relevant to India. It has incubated over 35 companies in the last twenty years. He chairs Rural Technology and Business Incubator (RTBI) at IIT Madras and Mobile Payment Forum of India (MPFI).
Dr.Ashok Jhunjhunwala has been awarded Padma Shri in the year 2002. He has been awarded Shanti Swarup Bhatnagar Award in 1998, Dr.Vikram Sarabhai Research Award for the year 1997, Millennium Medal at Indian Science Congress in the year 2000 and H.K.Firodia for "Excellence in Science & Technology" for the year 2002, Shri Om Prakash Bhasin Foundation Award for Science & Technology for the year 2004, awarded Jawaharlal Nehru Birth Centenary Lecture Award by INSA for the year 2006, IBM Innovation and Leadership Forum Award by IBM for the year 2006, awarded Bernard Low Humanitarian

18
Award in 2009, awarded “Bharat Asmita Vigyaan–Tantragyaan Shresththa Award” for the best use of Science & Technology through Innovation in 2010 and awarded Honorary Doctorates by the Institute of Blekinge Institute of Technology, Sweden in 2008 and University of Maine, USA in 2010. In 2010, he was also awarded JC Bose Fellowship in 2010 by DST, Government of India. He is a Fellow of World Wireless Research Forum, IEEE and Indian academies including INAE, IAS, INSA and NAS.
Dr.Ashok Jhunjhunwala joined the Board of Polaris in June 2001. He is also a Director in the Board of State Bank of India, Tata Teleservices (Maharashtra) Ltd, 3i Infotech Ltd, Sasken Communication Technologies Ltd, Tejas Networks Ltd, Tata Communications Ltd and Exicom Tele‐Systems Ltd. He is member of Prime Minister's Scientific Advisory Committee.
Mr.R.C.Bhargava ‐ Former Chairman & Managing Director of Maruti Udyog Ltd.
Mr.R.C.Bhargava is a postgraduate in Mathematics from Allahabad University, India. He joined the Indian Administrative Service (I.A.S.) in 1956 and stood First in the batch and was allotted to the U.P. cadre. He is also a postgraduate in Development Economics from Williams College, Williamstown (Mass), USA.
From 1968 to 1973, he was the Agricultural Production Commissioner and Secretary to the Government of the State of Jammu and Kashmir for the Departments of Agriculture, Horticulture, Animal Husbandry, Forests and Co‐operation. He was a Special Assistant to the Union Minister of Energy, Government of India from 1973 to 74, and between 1974 & 78; he served as the Joint Secretary to the Government of India, Ministry of Energy and the Cabinet Secretariat. Thereafter he moved to Bharat Heavy Electricals Limited as Director (Commercial).
From 1981 to 1997 he was working in Maruti Udyog Limited, initially on deputation from the I.A.S. as Director (Marketing), in 1985 he was appointed as its Managing Director and as its Chairman cum Managing Director in 1990. In 1992, when Suzuki acquired 50% equity in Maruti, he continued as Managing Director as Suzuki’s nominee. While in Maruti, he was on the National Committee of the Confederation of Indian Industry (CII), a member of the Steering Committee of CII as well as Chairman of the Economic Affairs Committee of CII for four years.
Mr.Bhargava joined the Board of Polaris in March 1999. He Chairs the Remuneration & Compensation Committee and is a member of the Audit Committee.
Mr.Bhargava is also a Director in ILFS Ltd, Taj Asia Limited, Grasim Industries Ltd, Optimus Global Services Ltd, Maruti Suzuki India Ltd, Thomson Press Ltd, UltraTech Cement Company Ltd, Dabur India Ltd, Idea Cellular Ltd., Aditya Birla Sun Life Asset Management Company Ltd. Eros Energy Ltd and RCB Consulting Private Ltd. Further he chairs the Audit Committee of ILFS Ltd., Thomson Press Ltd., Ultra Tech Cement Company Ltd., and Optimus Global Services Ltd. He is a member of the Audit Committee of Grasim Industries Ltd. & Dabur India Ltd., and is also a member of the Shareholders Grievance Committees of Maruti Suzuki India Ltd. and Ultra Tech Cement Company Ltd. Mr.Bhargava has been conferred the Economic Times – “Life Time Achievement Award 2010”.
Mr.Raju Venkatraman ‐ Managing Director & CEO of MEDall Healthcare Pvt Ltd.
Mr.Raju Venkatraman is an Entrepreneur and has successfully started and sold businesses like Vetri Systems, Inc., Rev IT & Sherpa Business Solutions. He has served as an executive in Companies like EDS, President Data Management Services of the Lason System Inc. and managed over 10,000 employees.
Till recently, Mr.Raju was the Joint Managing Director of Firstsource where he helped to scale the business to over $400 million and over 23,000 people.
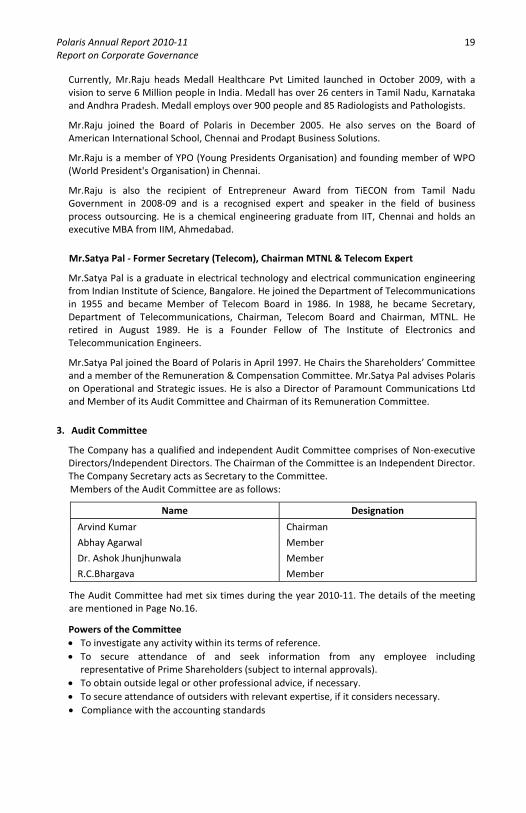
Polaris Annual Report 2010‐11 19 Report on Corporate Governance
Currently, Mr.Raju heads Medall Healthcare Pvt Limited launched in October 2009, with a vision to serve 6 Million people in India. Medall has over 26 centers in Tamil Nadu, Karnataka and Andhra Pradesh. Medall employs over 900 people and 85 Radiologists and Pathologists.
Mr.Raju joined the Board of Polaris in December 2005. He also serves on the Board of American International School, Chennai and Prodapt Business Solutions.
Mr.Raju is a member of YPO (Young Presidents Organisation) and founding member of WPO (World President's Organisation) in Chennai.
Mr.Raju is also the recipient of Entrepreneur Award from TiECON from Tamil Nadu Government in 2008‐09 and is a recognised expert and speaker in the field of business process outsourcing. He is a chemical engineering graduate from IIT, Chennai and holds an executive MBA from IIM, Ahmedabad.
Mr.Satya Pal ‐ Former Secretary (Telecom), Chairman MTNL & Telecom Expert
Mr.Satya Pal is a graduate in electrical technology and electrical communication engineering from Indian Institute of Science, Bangalore. He joined the Department of Telecommunications in 1955 and became Member of Telecom Board in 1986. In 1988, he became Secretary, Department of Telecommunications, Chairman, Telecom Board and Chairman, MTNL. He retired in August 1989. He is a Founder Fellow of The Institute of Electronics and Telecommunication Engineers.
Mr.Satya Pal joined the Board of Polaris in April 1997. He Chairs the Shareholders’ Committee and a member of the Remuneration & Compensation Committee. Mr.Satya Pal advises Polaris on Operational and Strategic issues. He is also a Director of Paramount Communications Ltd and Member of its Audit Committee and Chairman of its Remuneration Committee.
3. Audit Committee
The Company has a qualified and independent Audit Committee comprises of Non‐executive Directors/Independent Directors. The Chairman of the Committee is an Independent Director. The Company Secretary acts as Secretary to the Committee. Members of the Audit Committee are as follows:
Name Designation
Arvind Kumar Chairman
Abhay Agarwal Member
Dr. Ashok Jhunjhunwala Member
R.C.Bhargava Member
The Audit Committee had met six times during the year 2010‐11. The details of the meeting are mentioned in Page No.16.
Powers of the Committee • To investigate any activity within its terms of reference. • To secure attendance of and seek information from any employee including
representative of Prime Shareholders (subject to internal approvals). • To obtain outside legal or other professional advice, if necessary. • To secure attendance of outsiders with relevant expertise, if it considers necessary. • Compliance with the accounting standards
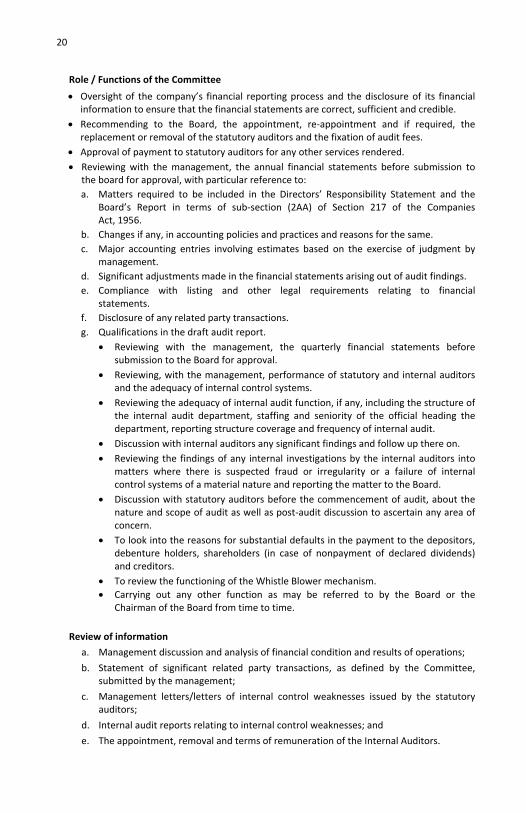
20
Role / Functions of the Committee
• Oversight of the company’s financial reporting process and the disclosure of its financial information to ensure that the financial statements are correct, sufficient and credible.
• Recommending to the Board, the appointment, re‐appointment and if required, the replacement or removal of the statutory auditors and the fixation of audit fees.
• Approval of payment to statutory auditors for any other services rendered. • Reviewing with the management, the annual financial statements before submission to
the board for approval, with particular reference to: a. Matters required to be included in the Directors’ Responsibility Statement and the
Board’s Report in terms of sub‐section (2AA) of Section 217 of the Companies Act, 1956.
b. Changes if any, in accounting policies and practices and reasons for the same. c. Major accounting entries involving estimates based on the exercise of judgment by
management. d. Significant adjustments made in the financial statements arising out of audit findings. e. Compliance with listing and other legal requirements relating to financial
statements. f. Disclosure of any related party transactions. g. Qualifications in the draft audit report.
• Reviewing with the management, the quarterly financial statements before submission to the Board for approval.
• Reviewing, with the management, performance of statutory and internal auditors and the adequacy of internal control systems.
• Reviewing the adequacy of internal audit function, if any, including the structure of the internal audit department, staffing and seniority of the official heading the department, reporting structure coverage and frequency of internal audit.
• Discussion with internal auditors any significant findings and follow up there on. • Reviewing the findings of any internal investigations by the internal auditors into
matters where there is suspected fraud or irregularity or a failure of internal control systems of a material nature and reporting the matter to the Board.
• Discussion with statutory auditors before the commencement of audit, about the nature and scope of audit as well as post‐audit discussion to ascertain any area of concern.
• To look into the reasons for substantial defaults in the payment to the depositors, debenture holders, shareholders (in case of nonpayment of declared dividends) and creditors.
• To review the functioning of the Whistle Blower mechanism. • Carrying out any other function as may be referred to by the Board or the
Chairman of the Board from time to time.
Review of information
a. Management discussion and analysis of financial condition and results of operations;
b. Statement of significant related party transactions, as defined by the Committee, submitted by the management;
c. Management letters/letters of internal control weaknesses issued by the statutory auditors;
d. Internal audit reports relating to internal control weaknesses; and
e. The appointment, removal and terms of remuneration of the Internal Auditors.

Polaris Annual Report 2010‐11 21 Report on Corporate Governance 4. Remuneration & Compensation Committee
The Remuneration & Compensation Committee consisting of Non‐executive Independent Directors, who evaluates and finalise among other things, compensation and benefits of Executive Directors and the procedures and modalities for giving effect to the Employee Stock Option Scheme which inter alia includes determination of eligibility criteria, maximum number of options/ shares offered to each employee and the aggregate number of options / shares offered during the period covered under the Scheme, identification of classes of employees entitled to participate in the scheme, framing of a detailed pricing formula, mode or process of exercise of the option etc.
The Remuneration & Compensation Committee had met four times during the year 2010‐11. The details of the meeting are mentioned in Page No.16.
Members of the Remuneration & Compensation Committee are as follows:
Name Designation
R.C.Bhargava Chairman
Dr.Ashok Jhunjhunwala Member
Satya Pal Member
Remuneration policy The remuneration policy of the Company has been so structured in order to match the market trends of the IT industry. The Board in consultation with the Remuneration & Compensation Committee decides the remuneration policy for whole‐time directors. The Company has made adequate disclosures to the members on the remuneration paid to Directors from time to time. Remuneration/ Commission payable to Directors is determined by the contributions made by the respective directors for the growth of the Company.
During the year Mr.Arun Jain, Chairman & Managing Director informed the Board about his decision not to draw remuneration from the Company, (salary & bonus) except certain essential perquisites. Accordingly the Board considered Mr.Arun Jain’s decision and taken on record the salary, allowances, perquisites, etc paid upto August 2010. Further the Board requested Mr.Arun Jain to accept a salary of Rs.101/‐ per month and other perquisites till the conclusion of current tenure as on May 31, 2011 (within the overall limit approved by the Shareholders).
Gross Remuneration paid / payable to Directors for the Financial Year 2010‐11 Rs. in Lacs
Name of the Director Salary,
Perquisites & Allowances
Contribution to PF & other
funds Commission
SittingFees
Stock Options exercised
Arun Jain 22.74 2.40 ‐‐ ‐‐ NilAbhay Agarwal ‐‐ ‐‐ 6.33 1.70 NilArvind Kumar ‐‐ ‐‐ 6.33 1.50 6,000Ashok Jhunjhunwala Dr. ‐‐ ‐‐ 6.33 1.90 6,000R.C.Bhargava ‐‐ ‐‐ 6.33 1.70 2,000Raju Venkatraman ‐‐ ‐‐ 6.33 0.95 NilSatya Pal ‐‐ ‐‐ 6.33 0.90 2,000Total 22.74 2.40 38.00 8.65 16,000

22
Stock Options
During the financial year 2010‐11, 735,000 and 165,000 number of Options were granted under ASOP 2003 and 2004 Schemes respectively as per ‘Market Price’ defined in the ASOP Policy as detailed hereunder:‐
Sl. No.
Date of Grant Option Price
(Rs.)
ASOP 2003 ASOP 2004
No. of Associates
No. of
Options
No. of Associates
No. of
Options
1 April 22, 2010 185.95 98 523,500 21 140,000
2 July 15, 2010 207.40 22 49,500 ‐ ‐
3 October 19, 2010 173.85 31 100,000 08 25,000
4 January 21, 2010 183.85 18 62,000 ‐ ‐
169 735,000 29 165,000
The Company has obtained a certificate from the Auditors of the Company certifying that the Company’s Associate Stock Option Plan(s) are being implemented in accordance with the SEBI (Employees Stock Option Scheme and Employees Stock Purchase Scheme) Guidelines, 1999 as applicable and in accordance with the resolution of the Members in the General Meeting.
5. Shareholders’ Committee
The Shareholders’ Committee consists of Non‐executive Directors only. It focuses on Shareholders’ grievances and strengthening of investor relations. This Committee specifically looks into the redressal of shareholders complaints like transfer of shares, non‐receipt of balance sheet, non‐receipt of declared dividends etc.
The purpose of constituting this Committee is to uphold the basic rights of the shareholders including right to transfer and registration of shares, obtaining relevant information about the company on a timely and regular basis, participating and voting in shareholders meetings, electing members of the board and sharing in the residual profits of the Company. Further the Committee is empowered to act on behalf of the Board, in the matters connected with allotment of shares, issuance of duplicate share certificates, split and consolidation of shares into marketable lots etc.
The Shareholders’ Committee had met four times during the year 2010‐11.
Members of the Shareholders’ Committee are as follows:
Name Designation
Satya Pal Chairman
Abhay Agarwal Member
Dr.Ashok Jhunjhunwala Member
Raju Venkatraman Member

Polaris Annual Report 2010‐11 23 Report on Corporate Governance
During the year, under ASOP 2003 Scheme the company has allotted 234,450 equity shares of Rs.5/‐ each to 121 Associates / Directors and under ASOP 2004 Scheme company has transferred 72,900 equity shares of Rs.5/‐ each to 22 Associates pursuant to exercise of options granted as detailed hereunder:
Sl. No.
Date of Allotment
ASOP 2003 ASOP 2004
No. of Associates
No. of shares allotted
No. of Associates
No. of shares allotted
1 April 21, 2010 13 32,300 5 9,600
2 May 17, 2010 17 15,850 2 2,400
3 June 18, 2010 06 16,200 2 13,000
4 July 19, 2010 19 31,100 ‐ ‐
5 August 19, 2010 16 43,500 5 5,800
6 September 17, 2010 10 21,500 1 3,000
7 October 19, 2010 10 6,400 1 16,000
8 November 22, 2010 09 42,600 1 1,500
9 December 17, 2010 04 3,600 2 2,000
10 January 21, 2011 07 12,700 ‐ ‐
11 February 25, 2011 09 6,700 3 19,600
12 March 09, 2011 01 2,000 ‐ ‐
Total 121 234,450 22 72,900
As the result of the above allotments; the issued, subscribed and paid‐up equity share capital of the company has increased from Rs.494,805,735/‐ comprising of 98,961,147 numbers of equity shares of Rs.5/‐ each as on March 31, 2010 to Rs.495,977,985/‐ comprising of 99,195,597 numbers of equity shares of Rs.5/‐ each as on March 31, 2011. The allotted equity shares are listed and traded in the Stock Exchanges.
Consolidated Scheme wise ASOP status for the year ended March 31, 2011
Sl. No. Description ASOP 2003 ASOP 2004
1 Outstanding at the beginning of the year 2,880,300 609,500
2 Granted during the year 735,000 165,000
3 Exercised during the year 234,450 72,900
4 Forfeited during the year 399,000 73,900
5 Outstanding at the end of the year 2,981,850 627,700

24
During the year 970 numbers of Requests / Complaints had been received and resolved by the Company as detailed hereunder.
Status of Request / Complaints during the period April 01, 2010 to March 31, 2011
Sl. No.
Subject Received Replied / resolved
A. REQUESTS 1 Change/Correction of Address 22 22 2 Receipt of Dividend Warrant Order for Revalidation 169 169 3 Change/Correction of Bank Mandate 10 10 4 Change/Correction of Bank Mandate/Name/Damage‐Dw 13 13 5 Request for Issue of Duplicate Dividend Warrant 0 0 6 Receipt of IB For Issue of Duplicate Dividend Warrant 7 7 7 Query Regarding Payment of Dividend Warrant 18 18 8 Receipt of DD(s) Against DW From Company/Bank 10 10 9 Request for ECS Facility 5 5 10 Letters from Clients Regarding Bills/Payments 2 2 11 Postal Return Documents (Reminder Letters) 417 417 12 Letter from SEBI/Stock Exchange/Acknowledgement 2 2 13 Registration of Power of Attorney 0 0 14 Loss of Securities and Request for Issue of Duplicate 5 5 15 Receipt of IB and Affidavit for Issue of Duplicate Securities 0 0 16 Request for Consolidation / Split of Securities 9 9 17 Deletion of Joint Name Due to Death 0 0 18 Request for Transfer / Transmission of Securities 18 18 19 DD Received from Banks Against ECS Rejections 0 0 20 Change & Correction of Name on Securities 4 4 21 Specimen Sign Change / Not Mentioned in Application 3 3 22 Change & Correction of Name on Dividend Warrant 3 3 23 Request for Demat / Remat 91 91 24 Clarification Regarding Shares 16 16 25 Request for Exchange of Securities 0 0 26 Others (Clarification / Acknowledgement / NSDL Operation) 28 28
Total (A) 852 852
B. COMPLAINTS 1 Non‐Receipt of Annual Report 15 15 2 Non‐Receipt of Dividend Warrants 96 96 3 Non‐Receipt of Securities 7 7 4 Non‐Receipt of Fresh/New Securities 0 0 5 Non‐Receipt of Refund Orders 0 0
Total (B) 118 118
Total (A) + (B) 970 970
Note: No. of complaints not resolved to the satisfaction of shareholders: Nil and no pending complaints as on March 31, 2011.

Polaris Annual Report 2010‐11 25 Report on Corporate Governance 6. Details of the Sub‐Committees constituted by the Board
Share Transfer Committee
The Share Transfer Committee is empowered to consider and approve the physical transfer, transmission and transposition etc. of the shares of the Company. The Committee met eleven times during the year 2010‐11.
The present members of the Committee are:
Name Designation
R.Srikanth President & Chief Financial Officer
Muthusubramanian.B Senior Vice President (Finance & Company Secretary)
Lokhandwala Property Committee
The Lokhandwala Property Committee is empowered to negotiate, finalise and accept such terms and conditions including sale consideration for sale of 151 flats in the building “Whispering Palms” situated at No.4, Co‐operative Housing Society Ltd., Lokhandwala Township, Akurli Road, Kandivili (East), Mumbai – 400 101. The Committee members discussed frequently about the status of sale of flats.
The present members of the Committee are:
Name Designation
Govind Singhal President & Chief Operating Officer
R.Srikanth President & Chief Financial Officer
K.Govindarajan Senior Vice President (Administration) & Global Head (Special Projects)
Investment Committee
The Investment Committee is empowered to invest the funds of the company on any single transaction, not exceeding USD 10Mn or in any other currency equivalent to USD 10Mn for acquiring shares of any company, bodies corporate, exclusively for technology or strategic or business purposes and to acquire any property(ies), (existing facilities, land & building) software products, Intellectual Property Rights thereof (related to business development). The Committee met twice during the year 2010‐11.
The present members of the Committee are:
Name Designation
Arun Jain Chairman & Managing Director
Govind Singhal President & Chief Operating Officer
S.R.Ramaswami President & Head‐Strategy & Corporate Development
R. Srikanth President & Chief Financial Officer
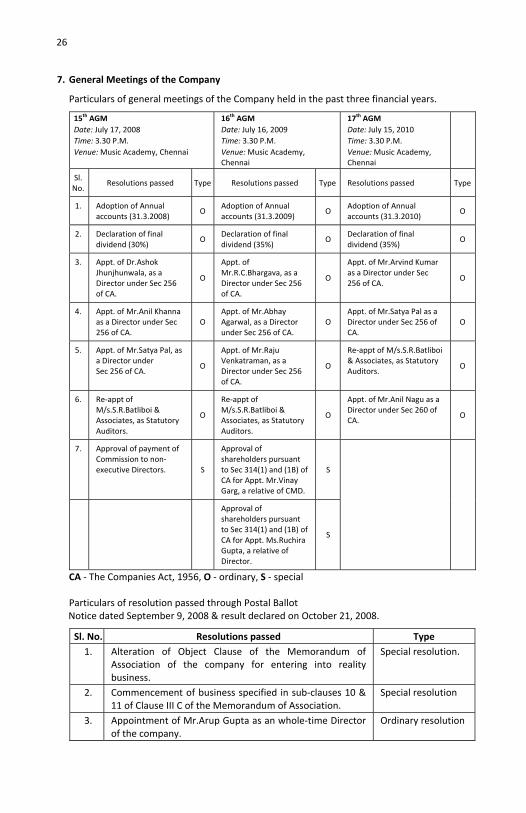
26
7. General Meetings of the Company
Particulars of general meetings of the Company held in the past three financial years.
15th AGM Date: July 17, 2008 Time: 3.30 P.M. Venue: Music Academy, Chennai
16th AGM Date: July 16, 2009 Time: 3.30 P.M. Venue: Music Academy, Chennai
17th AGM Date: July 15, 2010 Time: 3.30 P.M. Venue: Music Academy, Chennai
Sl. No.
Resolutions passed Type Resolutions passed Type Resolutions passed Type
1. Adoption of Annual accounts (31.3.2008)
O Adoption of Annual accounts (31.3.2009)
O Adoption of Annual accounts (31.3.2010)
O
2. Declaration of final dividend (30%)
O Declaration of final dividend (35%)
O Declaration of final dividend (35%)
O
3. Appt. of Dr.Ashok Jhunjhunwala, as a Director under Sec 256 of CA.
O
Appt. of Mr.R.C.Bhargava, as a Director under Sec 256 of CA.
O
Appt. of Mr.Arvind Kumar as a Director under Sec 256 of CA.
O
4. Appt. of Mr.Anil Khanna as a Director under Sec 256 of CA.
O Appt. of Mr.Abhay Agarwal, as a Director under Sec 256 of CA.
O Appt. of Mr.Satya Pal as a Director under Sec 256 of CA.
O
5. Appt. of Mr.Satya Pal, as a Director under Sec 256 of CA.
O
Appt. of Mr.Raju Venkatraman, as a Director under Sec 256 of CA.
O
Re‐appt of M/s.S.R.Batliboi & Associates, as Statutory Auditors.
O
6. Re‐appt of M/s.S.R.Batliboi & Associates, as Statutory Auditors.
O
Re‐appt of M/s.S.R.Batliboi & Associates, as Statutory Auditors.
O
Appt. of Mr.Anil Nagu as a Director under Sec 260 of CA.
O
7. Approval of payment of Commission to non‐executive Directors. S
Approval of shareholders pursuant to Sec 314(1) and (1B) of CA for Appt. Mr.Vinay Garg, a relative of CMD.
S
Approval of shareholders pursuant to Sec 314(1) and (1B) of CA for Appt. Ms.Ruchira Gupta, a relative of Director.
S
CA ‐ The Companies Act, 1956, O ‐ ordinary, S ‐ special Particulars of resolution passed through Postal Ballot Notice dated September 9, 2008 & result declared on October 21, 2008.
Sl. No. Resolutions passed Type 1. Alteration of Object Clause of the Memorandum of
Association of the company for entering into reality business.
Special resolution.
2. Commencement of business specified in sub‐clauses 10 & 11 of Clause III C of the Memorandum of Association.
Special resolution
3. Appointment of Mr.Arup Gupta as an whole‐time Director of the company.
Ordinary resolution

Polaris Annual Report 2010‐11 27 Report on Corporate Governance 8. Disclosures
Related Party Transactions
Related Party Transactions are defined as transactions of the Company of material nature, with Promoters, Directors or the Management, their subsidiaries or relatives etc. that may have potential conflict with the interest of the Company at large.
Details on materially significant Related Party Transactions are shown in the Note No. 8 under Significant Policies and Notes to accounts to the consolidated Balance Sheet and Profit & Loss Account.
Statutory Compliance, Penalties & Strictures
Details of non‐compliance by the Company, penalties, strictures imposed on the Company by the stock Exchange or SEBI or any other statutory authority, on any matter related to capital markets during the last three years:‐ Nil.
Compliance with mandatory requirements and adoption of non‐mandatory requirements of Clause 49 of the Listing Agreement
The Company has complied with the mandatory requirements of Clause 49 of the Listing Agreement including CEO/CFO certification. As required under Clause 49, a certificate signed by CEO & CFO of the Company has been placed before the Board of Directors and the same has been provided elsewhere in this report. Further, a certificate from the Statutory Auditors, certifying the compliance of clause 49 of the Listing agreement was adhered/adopted has also been provided elsewhere in this report.
Clause 49 also requires disclosures of adoption by the Company of non‐mandatory requirements specified in the said clause, the implementation of which is discretionary on the part of the Company. Accordingly, the adoption of non‐mandatory requirements are given below:‐
a. Remuneration & Compensation Committee
The Company has constituted a Remuneration & Compensation Committee consisting of only Non‐executive Directors. A detailed note on Remuneration & Compensation Committee is provided elsewhere in the report.
b. Whistle Blower Policy
The Company has established a mechanism for employees to report concerns about unethical behaviors, actual or suspected fraud, and violation of Code of Conduct of the Company etc. The mechanism also provides for adequate safeguards against victimization of employees who avail of the mechanism and also provides for direct access by the Whistle Blower to the Audit Committee. We affirm that during the Financial Year 2010‐11; no employee has been denied to access the Audit Committee.
Ombudsman
Ombudsman is a Polaris initiative, to resolve workplace conflicts. It is a forum for associates and retirees to report, discuss and resolve workplace issues. Polaris Ombudsman, run by Wg Cdr G.N.Mathur with an objective to build Polaris into a more positive and productive workplace. His office promises complete confidentiality in all the matters discussed with him. Ombudsman also assures "No Reprisal" to the complainant who brings to light a problem or blows the whistle against someone. It works as an early warning system to the organization.

28
c. Risk Management framework
The Board of Director on January 21, 2005 adopted the risk management framework. The framework provides an integrated approach for managing the risks in various aspects of the business. A write‐up on the above is provided in the Management discussions & analysis report.
d. Insider Trading Policy
As per the SEBI (Prohibition of Insider Trading) Regulations, 1992 an Insider Trading Policy of the company is in force. The policy guides a mechanism for regulating transactions of the shares of the company and enforces a code of conduct and internal procedures.
The details of Trading window during the year 2010‐11
Sl. No. Closed on Opened on
1. April 10, 2010 April 22, 2010
2. July 6, 2010 July 16, 2010
3. October 9, 2010 October 25, 2010
4. January 11, 2011 January 24, 2011
9. Means of communication
Quarterly financial results
Quarterly financial results of the Company are published in one widely circulated English Newspaper (Business Standard) and a Vernacular Newspaper, Tamil (Makkal Kural). The results are also promptly forwarded to Stock Exchanges in which the shares of the Company are listed and simultaneously uploaded/published on the Company’s website www.polaris.co.in. The website also displays all official news releases issued by the Company from time to time.
Investor Education
Investors are being provided with timely information on all Company related matters including recruitment / appointment and remuneration of Executive Directors, circulars on the advantages of Dematerialization and sub‐division of shares etc.
The Company's official website www.polaris.co.in has in it a separate page for investor relations in which the quarterly, half‐yearly and annual results of the Company are displayed. The Company has assigned a separate email ID [email protected] for investor correspondence. All press releases issued by the Company from time to time are informed to the concerned Stock Exchanges in which the shares of the Company are listed and the same are also hosted in the Company's website for the knowledge of the investors. A separate column in the website called "Frequently Asked Questions” is given, which answers substantially all the expected queries of investors about the Company.
The Management Discussion & Analysis report (MD&A)
The MD&A gives an overview of the Industry, Company’s business and its Financials etc., is provided separately as a part of this Annual Report on page no.81.

Polaris Annual Report 2010‐11 29 Report on Corporate Governance 10. General Shareholder information
Date of incorporation January 5, 1993Registered Office Polaris House, No.244, Anna Salai,
Chennai ‐ 600 006.Date of Annual General Meeting July 20, 2011Venue of Annual General Meeting Chinmaya Heritage Centre,
No.2, 13th Avenue, Harrington Road, Chetpet, Chennai – 600 031.
Financial Reporting: (tentative and subject to change) 01.04.2011 ‐ 31.03.2012First quarter ending June 30, 2011 Between 15th and 31st July 2011Second quarter ending September 30, 2011 Between 15th and 31st October 2011Third quarter ending December 31, 2011 Between 15th and 31st January 2012For the year ending March 31, 2012 Between 15th and 30th April 2012Annual General Meeting for the year ending March 31, 2011
July/August 2011
Book Closure July 11 to July 20, 2011Dividend for 2010‐11 Dividend – 90%. (Recommended)
i.e Rs.4.50/‐ per equity share. Listing of shares with Stock Exchanges / Polaris shares traded inNational Stock Exchange of India Ltd. w.e.f November 24, 1999.
The Bombay Stock Exchange Ltd. w.e.f. September 29, 1999
Madras Stock Exchange Ltd. w.e.f. September 27, 1999.
NSE ‐ Scrip Code BSE ‐ Scrip Code Reuters codePOLARIS 532254 POLS.BO (BSE)
POLS.NS (NSE)ISIN Code INE763A01023• The Company’s shares are traded in “Group A” category in the Bombay Stock
Exchange, Mumbai since March 26, 2001. • The Company hereby confirms that the Listing fee for the year 2011‐12, payable to
each of the stock exchanges pursuant to Clause 38 of Listing Agreement in which the Company’s shares are Listed have been paid.
Registrars and Share Transfer Agent
Karvy Computershare Private Ltd. Unit: Polaris Software Lab Ltd. Plot No.17 ‐ 24 Vittal Rao Nagar, Madhapur, Hyderabad – 500 081. Tel: 040 – 4465 5000 Fax: 040 – 2342 0814 / 2342 0857 E‐mail: [email protected] URL: www.karvycomputershare.com
Publication of Quarterly Results
Quarterly financial results were published during financial year 2010‐11Language News paper Date
English Tamil
Business Standard Makkal Kural
April 22, 2010July 16, 2010
October 20, 2010January 22, 2011
Website address of the Company in which reports/financial results have been posted www.polaris.co.in
Website address of stock exchange(s) in which reports / financial results are postedThe National Stock Exchange of India Ltd The Bombay Stock Exchange Ltdwww.nseindia.com www.bseindia.comWhether the Official News releases are displayed by the company √ Yes No

30
Share market data and the graphical representation of closing market price movement of the Company’s shares quoted in the National Stock Exchange Ltd. (NSE) & Bombay Stock Exchange (BSE) from April 2010 to March 2011.
Stock market data for the period April 2010 to March 2011 from National & Bombay Stock Exchanges
Month 2010‐11
NSE ‐ Price BSE ‐ PriceHigh Low Closing Volume High Low Closing Volume
April 191.00 161.20 184.75 20,612,574 190.90 147.60 184.45 3,678,363 May 190.50 162.55 171.55 12,633,864 190.70 162.15 172.00 1,561,333 June 185.80 167.70 179.75 10,729,787 186.80 167.05 180.10 1,777,828 July 214.85 173.25 175.05 38,575,515 215.00 174.00 175.00 6,944,604 August 188.00 161.10 164.20 11,766,291 184.80 161.35 163.85 2,340,234 September 181.95 162.15 162.85 13,466,802 181.70 162.50 163.35 2,770,139 October 183.00 155.00 161.75 12,758,266 182.90 159.40 162.35 2,216,848 November 170.80 131.20 147.85 13,171,800 172.00 132.10 147.35 1,787,845 December 183.00 145.10 174.55 15,114,809 182.90 146.00 174.35 2,278,433 January 192.75 160.60 167.30 20,180,641 192.90 160.90 167.35 3,686,775 February 202.50 161.15 181.85 30,571,121 202.55 161.50 181.80 7,344,819 March 193.10 172.25 188.85 10,827,604 193.15 175.30 188.85 1,750,318
Total 210,409,074 38,137,539 Polaris share price (High / Low) during the financial year 2010‐11:
Stock Exchange Yearly high price Date Yearly low price DateNSE 214.85 12.07.2010 131.20 26.11.2010BSE 215.00 13.07.2010 132.10 26.11.2010
100.00
120.00
140.00
160.00
180.00
200.00
220.00
240.00
Market P
rice (R
s.)
Apr‐10 May‐10 Jun‐10 Jul‐10 Aug‐10 Sep‐10 Oct‐10 Nov‐10 Dec‐10 Jan‐11 Feb‐11 Mar‐11
High 191.00 190.50 185.80 214.85 188.00 181.95 183.00 170.80 183.00 192.75 202.50 193.10
Low 161.20 162.55 167.70 173.25 161.10 162.15 155.00 131.20 145.10 160.60 161.15 172.25
Closing 184.75 171.55 179.75 175.05 164.20 162.85 161.75 147.85 174.55 167.30 181.85 188.85
'Polaris at NSE'

Polaris Annual Report 2010‐11 31 Report on Corporate Governance
100.00
150.00
200.00
250.00
Market P
rice (R
s.)
Apr‐10 May‐10 Jun‐10 Jul‐10 Aug‐10 Sep‐10 Oct‐10 Nov‐10 Dec‐10 Jan‐11 Feb‐11 Mar‐11
High 190.90 190.70 186.80 215.00 184.80 181.70 182.90 172.00 182.90 192.90 202.55 193.15
Low 147.60 162.15 167.05 174.00 161.35 162.50 159.40 132.10 146.00 160.90 161.50 175.30
Closing 184.45 172.00 180.10 175.00 163.85 163.35 162.35 147.35 174.35 167.35 181.80 188.85
'Polaris at BSE'
100.00
120.00
140.00
160.00
180.00
200.00
2,000.00
4,000.00
6,000.00
8,000.00
10,000.00
12,000.00
14,000.00
16,000.00
18,000.00
20,000.00
22,000.00
Market Inde
x
Apr‐10 May‐10 Jun‐10 Jul‐10 Aug‐10 Sep‐10 Oct‐10 Nov‐10 Dec‐10 Jan‐11 Feb‐11 Mar‐11
SENSEX 17,558. 16,944. 17,700. 17,868. 17,971. 20,069. 20,032. 19,521. 20,509. 18,327. 17,823. 19,445.
NIFTY Index 5278 5086 5313 5368 5402 6030 6018 5863 6135 5506 5333 5834
NSE Closing 184.75 171.55 179.75 175.05 164.20 162.85 161.75 147.85 174.55 167.30 181.85 188.85
'NSE & BSE Index Vs.Polaris at NSE'
Nifty
Sensex
Polaris at NSE
Pric
e (R
s.)
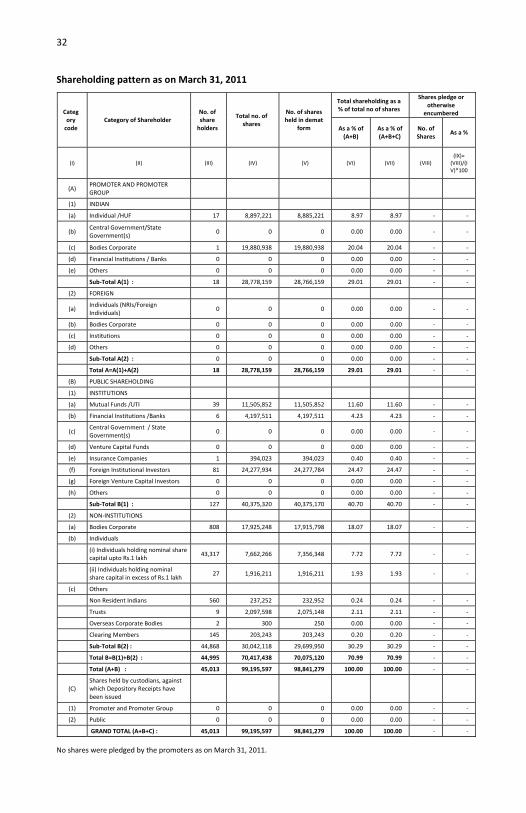
32
Shareholding pattern as on March 31, 2011
Category code
Category of Shareholder No. of share holders
Total no. of shares
No. of shares held in demat
form
Total shareholding as a % of total no of shares
Shares pledge or otherwise
encumbered
As a % of (A+B)
As a % of (A+B+C)
No. of Shares
As a %
(I) (II) (III) (IV) (V) (VI) (VII) (VIII) (IX)= (VIII)/(IV)*100
(A) PROMOTER AND PROMOTER GROUP
(1) INDIAN
(a) Individual /HUF 17 8,897,221 8,885,221 8.97 8.97 ‐ ‐
(b) Central Government/State Government(s)
0 0 0 0.00 0.00 ‐ ‐
(c) Bodies Corporate 1 19,880,938 19,880,938 20.04 20.04 ‐ ‐
(d) Financial Institutions / Banks 0 0 0 0.00 0.00 ‐ ‐
(e) Others 0 0 0 0.00 0.00 ‐ ‐
Sub‐Total A(1) : 18 28,778,159 28,766,159 29.01 29.01 ‐ ‐
(2) FOREIGN
(a) Individuals (NRIs/Foreign Individuals)
0 0 0 0.00 0.00 ‐ ‐
(b) Bodies Corporate 0 0 0 0.00 0.00 ‐ ‐
(c) Institutions 0 0 0 0.00 0.00 ‐ ‐
(d) Others 0 0 0 0.00 0.00 ‐ ‐
Sub‐Total A(2) : 0 0 0 0.00 0.00 ‐ ‐
Total A=A(1)+A(2) 18 28,778,159 28,766,159 29.01 29.01 ‐ ‐
(B) PUBLIC SHAREHOLDING
(1) INSTITUTIONS
(a) Mutual Funds /UTI 39 11,505,852 11,505,852 11.60 11.60 ‐ ‐
(b) Financial Institutions /Banks 6 4,197,511 4,197,511 4.23 4.23 ‐ ‐
(c) Central Government / State Government(s)
0 0 0 0.00 0.00 ‐ ‐
(d) Venture Capital Funds 0 0 0 0.00 0.00 ‐ ‐
(e) Insurance Companies 1 394,023 394,023 0.40 0.40 ‐ ‐
(f) Foreign Institutional Investors 81 24,277,934 24,277,784 24.47 24.47 ‐ ‐
(g) Foreign Venture Capital Investors 0 0 0 0.00 0.00 ‐ ‐
(h) Others 0 0 0 0.00 0.00 ‐ ‐
Sub‐Total B(1) : 127 40,375,320 40,375,170 40.70 40.70 ‐ ‐
(2) NON‐INSTITUTIONS
(a) Bodies Corporate 808 17,925,248 17,915,798 18.07 18.07 ‐ ‐
(b) Individuals
(i) Individuals holding nominal share capital upto Rs.1 lakh
43,317 7,662,266 7,356,348 7.72 7.72 ‐ ‐
(ii) Individuals holding nominal share capital in excess of Rs.1 lakh
27 1,916,211 1,916,211 1.93 1.93 ‐ ‐
(c) Others
Non Resident Indians 560 237,252 232,952 0.24 0.24 ‐ ‐
Trusts 9 2,097,598 2,075,148 2.11 2.11 ‐ ‐
Overseas Corporate Bodies 2 300 250 0.00 0.00 ‐ ‐
Clearing Members 145 203,243 203,243 0.20 0.20 ‐ ‐
Sub‐Total B(2) : 44,868 30,042,118 29,699,950 30.29 30.29 ‐ ‐
Total B=B(1)+B(2) : 44,995 70,417,438 70,075,120 70.99 70.99 ‐ ‐
Total (A+B) : 45,013 99,195,597 98,841,279 100.00 100.00 ‐ ‐
(C) Shares held by custodians, against which Depository Receipts have been issued
(1) Promoter and Promoter Group 0 0 0 0.00 0.00 ‐ ‐
(2) Public 0 0 0 0.00 0.00 ‐ ‐
GRAND TOTAL (A+B+C) : 45,013 99,195,597 98,841,279 100.00 100.00 ‐ ‐
No shares were pledged by the promoters as on March 31, 2011.

Polaris Annual Report 2010‐11 33 Report on Corporate Governance Shareholding pattern as on March 31, 2011
List of persons holding more than 1% of the total number of shares
Promoters29%
Bodies Corporate18%
FII/OCB/NRI25%
IFI/Banks/MFs16%
Individuals10%
Trusts2%
Promoters
Bodies Corporate
FII/OCB/NRI
IFI/Banks/MFs
Individuals
Trusts
Sl No. Name of the Shareholder No. of Shares % of share capital
1 Polaris Holdings Limited 19,880,938 20.04
2 Orbitech Limited 15,379,606 15.50
3 Arun Jain 4,302,364 4.34
4 Matthews India Fund 4,300,318 4.34
5 Franklin Mutual Series Funds‐ Mutual Beacon Fund 4,228,650 4.26
6 Citibank A/C. Orbitech Limited 4,195,486 4.23
7 Yogesh Andlay 2,075,047 2.09
8 Tata trustee Co. Ltd A/c Tata Mutual Fund ‐ Tata Equity P/E Fund 2,000,000 2.02
9 Sundaram Mutual Fund A/c Sundaram Smile Fund 1,700,547 1.71
10 J P Morgan Funds 1,604,300 1.62
11 Orbitech Employees Welfare Trust 1,291,425 1.30
12 ING Vysya Life Insurance Company Limited 1,231,000 1.24
13 Carlson Fund ‐ Asian Small Cap 1,200,000 1.21
14 LSV Emerging Markets Equity Fund LP 1,127,800 1.14
15 State of Wisconsin Investment Board ‐ Acadianemerging Equity 1,031,959 1.04
16 Manju Jain 1,022,460 1.03
Total 66,571,900 67.11

34
Shareholding of Directors / office bearers as on March 31, 2011
Sl. No.
Name of the Director / Officer bearer No. of shares % of Share Capital
1 Arun Jain 4,302,364 4.342 Abhay Agarwal 27,622 0.033 Arvind Kumar 29,000 0.034 Ashok Jhunjhunwala Dr. 7,900 0.015 RC Bhargava 14,600 0.016 Raju Venkatraman 250 0.007 Satya Pal 35,400 0.048 R.Srikanth‐ Compliance Officer Nil ‐‐9 Muthusubramanian.B – Company Secretary 2,500 0.00
Distribution Schedule of Shareholding as on March 31, 2011
No. of Shares Total Demat‐holdings Physical holdings
No. of Shareholders
No of Shares No. of
Shareholders No of Shares
No. of Shareholders
No of Shares
Upto 10 6,849 39,871 6,769 39,781 80 90 11 ‐ 50 14,338 510,373 14,238 505,479 100 4,894 51 ‐ 100 9,462 883,790 9,253 863,005 209 20,785 101 ‐ 500 11,714 2,719,467 10,794 2,544,568 920 174,899 501 ‐ 5000 2,314 3,011,326 2,222 2,892,576 92 118,750 5001 ‐ 10000 111 789,779 109 777,179 2 12,600 10001‐ 50000 113 2,313,749 112 2,291,449 1 22,300 50001 ‐100000 33 2,368,876 33 2,368,876 0 0 100001 & above 79 86,558,366 79 86,558,366 0 0 Total 45,013 99,195,597 43,609 98,841,279 1,404 354,318
Comparative distribution schedule as on March 31, 2011
Shares Physical Demat Total
Nos. % Nos. % Nos. %31.03.2011 354,318 0.36 98,841,279 99.64 99,195,597 10031.03.2010 369,158 0.37 98,591,989 99.63 98,961,147 100Shareholders 31.03.2011 1,404 3.12 43,609 96.88 45,013 10031.03.2010 1,450 2.96 47,613 97.04 49,063 100
• Share Transfer System
The applications for transfers, transmission and transposition are received by the Company at its Registered Office address at Chennai or at Messrs Karvy Computershare Private Ltd., Hyderabad, Registrar and Share Transfer Agents (RTA) of the Company. As the Company’s shares are currently traded in demat form, the transfers are processed and approved by NSDL/CDSL in the electronic form through its Depository Participants. The RTA on a regular basis processes the physical transfers and the share certificates are sent to the respective transferees.
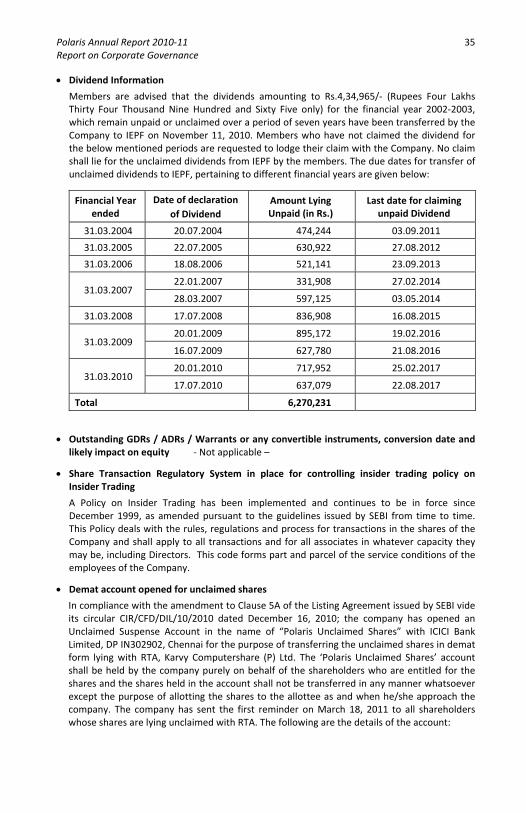
Polaris Annual Report 2010‐11 35 Report on Corporate Governance • Dividend Information
Members are advised that the dividends amounting to Rs.4,34,965/‐ (Rupees Four Lakhs Thirty Four Thousand Nine Hundred and Sixty Five only) for the financial year 2002‐2003, which remain unpaid or unclaimed over a period of seven years have been transferred by the Company to IEPF on November 11, 2010. Members who have not claimed the dividend for the below mentioned periods are requested to lodge their claim with the Company. No claim shall lie for the unclaimed dividends from IEPF by the members. The due dates for transfer of unclaimed dividends to IEPF, pertaining to different financial years are given below:
Financial Year ended
Date of declaration of Dividend
Amount Lying Unpaid (in Rs.)
Last date for claiming unpaid Dividend
31.03.2004 20.07.2004 474,244 03.09.2011
31.03.2005 22.07.2005 630,922 27.08.2012
31.03.2006 18.08.2006 521,141 23.09.2013
31.03.2007 22.01.2007 331,908 27.02.2014
28.03.2007 597,125 03.05.2014
31.03.2008 17.07.2008 836,908 16.08.2015
31.03.2009 20.01.2009 895,172 19.02.2016
16.07.2009 627,780 21.08.2016
31.03.2010 20.01.2010 717,952 25.02.2017
17.07.2010 637,079 22.08.2017
Total 6,270,231
• Outstanding GDRs / ADRs / Warrants or any convertible instruments, conversion date and likely impact on equity ‐ Not applicable –
• Share Transaction Regulatory System in place for controlling insider trading policy on Insider Trading
A Policy on Insider Trading has been implemented and continues to be in force since December 1999, as amended pursuant to the guidelines issued by SEBI from time to time. This Policy deals with the rules, regulations and process for transactions in the shares of the Company and shall apply to all transactions and for all associates in whatever capacity they may be, including Directors. This code forms part and parcel of the service conditions of the employees of the Company.
• Demat account opened for unclaimed shares
In compliance with the amendment to Clause 5A of the Listing Agreement issued by SEBI vide its circular CIR/CFD/DIL/10/2010 dated December 16, 2010; the company has opened an Unclaimed Suspense Account in the name of “Polaris Unclaimed Shares” with ICICI Bank Limited, DP IN302902, Chennai for the purpose of transferring the unclaimed shares in demat form lying with RTA, Karvy Computershare (P) Ltd. The ‘Polaris Unclaimed Shares’ account shall be held by the company purely on behalf of the shareholders who are entitled for the shares and the shares held in the account shall not be transferred in any manner whatsoever except the purpose of allotting the shares to the allottee as and when he/she approach the company. The company has sent the first reminder on March 18, 2011 to all shareholders whose shares are lying unclaimed with RTA. The following are the details of the account:

36
Outstanding at the beginning of the year
No. of shareholders claimed during
the year
No. of shareholders’
claim transferred during the year
Outstanding at the end of the year
Shareholders Shares Shareholders Shares
727 111,100 Nil Nil 727 111,100
• Green Initiative
As a part of Green Initiative in Corporate Governance undertaken by the Ministry of Corporate Affairs (MCA), Government of India through its Circular Nos. 17/2011 & 18/2011 dated April 21 & 29, 2011 respectively, has allowed Companies to send official documents to their shareholders in electronic form.
Recognizing the said circular issued by MCA and also as an active partaker to reduce carbon footprint, your Company proposes to send the Annual Report for the year ended March 31, 2011 in electronic form to the email address provided by you through the Depositories.
Following the MCA directives, the Annual Report in an easily accessible format will be made available on your Company website, www.polaris.co.in. We will also notify the date of Annual General Meeting and the date of uploading of the Annual Report in the Company’s website in National and regional newspapers.
We are confident that you would appreciate the “Green Initiative” taken by MCA and your Company’s desire to participate in such initiatives.
Polaris is committed to energy conservation and environment protection. Significant and focused efforts have been rolled out under the "Green Initiative". For example, we have virtualised our servers thereby saving substantial energy. The Annexure to the Director's Report on page no.10 carries the details of various such initiatives.
• Locations
Headquartered in Chennai; the other branch offices addresses / locations are furnished elsewhere in the Annual Report. Polaris also has six subsidiaries in India namely Polaris Enterprise Solutions Ltd., Optimus Global Services Ltd., SEEC Technologies Asia (P) Ltd., Laser Soft Infosystems Ltd., Indigo Tx Software (P) Ltd and SFL Properties (P) Ltd.
• Addresses for correspondence
The Compliance Officer POLARIS SOFTWARE LAB LTD. Regd. Office: Polaris House, 244, Anna Salai, Chennai ‐ 600 006 Phone: 044‐3987 4000, Fax: 044‐2852 3280E‐mail: [email protected]
The Company Secretary POLARIS SOFTWARE LAB LTD. Regd. Office: Polaris House, 244, Anna Salai, Chennai ‐ 600 006 Phone: 044‐3987 4000, Fax: 044‐2852 3280 E‐mail: [email protected]
By the order of the Board
for Polaris software Lab Ltd.
Place: Chennai Arun JainDate: April 28, 2011 Chairman & Managing Director

Polaris Annual Report 2010‐11 37 Report on Corporate Governance
CEO & CFO CERTIFICATION UNDER CLAUSE 49(V) OF THE LISTING AGREEMENT
To: The Board of Directors of Polaris Software Lab Ltd., Chennai
We, Arun Jain, Chairman & Managing Director and R.Srikanth, President & Chief Financial Officer of Polaris Software Lab Ltd., (“company”) hereby certifies that:‐
a. We have reviewed financial statements and the cash flow statement of the company for the financial year ended March 31, 2011 and that to the best of our knowledge and belief:
i. these statements do not contain any materially untrue statement or omit any material fact or contain statements that might be misleading;
ii. these statements together present a true and fair view of the company’s affairs and are in compliance with existing accounting standards, applicable laws and regulations.
b. There are, to the best of our knowledge and belief, no transactions entered into by the company during the year which are fraudulent, illegal or violative of the company’s code of conduct.
c. We accept responsibility for establishing and maintaining internal controls for financial reporting and that we have evaluated the effectiveness of internal control systems of the company pertaining to financial reporting and we have disclosed to the auditors and the Audit Committee, deficiencies in the design or operation of such internal controls, if any, of which we are aware and the steps we have taken or propose to take to rectify these deficiencies.
d. We have indicated to the auditors and the audit committee
i. significant changes in internal control over financial reporting during the year;
ii. significant changes in accounting policies during the year and the same have been disclosed in the notes to the financial statements; and
iii. instances of significant fraud of which we have become aware and the involvement therein, if any, of the management or an employee having a significant role in the company’s internal control system over financial reporting.
Place: Chennai Date: April 28, 2011
Arun Jain Chairman & Managing Director
R SrikanthPresident & Chief Financial Officer

38
AUDITORS’ CERTIFICATE ON COMPLIANCE WITH THE CONDITIONS OF CORPORATE GOVERNANCE UNDER CLAUSE 49 OF THE LISTING AGREEMENT
Auditors’ Certificate
To
The Members Polaris Software Lab Ltd. Chennai
We have examined the compliance of conditions of corporate governance by Polaris Software Lab Limited, for the year ended on March 31, 2011, as stipulated in clause 49 of the Listing Agreement of the said Company with stock exchanges.
The compliance of conditions of corporate governance is the responsibility of the management. Our examination was limited to procedures and implementation thereof, adopted by the Company for ensuring the compliance of the conditions of the Corporate Governance. It is neither an audit nor an expression of opinion on the financial statements of the Company.
In our opinion and to the best of our information and according to the explanations given to us, we certify that the Company has complied with the conditions of Corporate Governance as stipulated in the above mentioned Listing Agreement.
We further state that such compliance is neither an assurance as to the future viability of the Company nor the efficiency or effectiveness with which the management has conducted the affairs of the Company.
For S.R.BATLIBOI & ASSOCIATES Firm registration No. 101049W Chartered Accountants per S Balasubrahmanyam Partner Membership No. 053315 Place: Chennai Date: April 28, 2011
To
The Members Polaris Software Lab Ltd. Chennai
Sub: Declaration by the CEO under Clause 49 (I)(D)(ii) of the Listing Agreement
I, Arun Jain, Chairman & Managing Director of Polaris Software Lab Ltd. to the best of my knowledge and belief, declare that all the members of the Board of Directors and Senior Management Personnel have affirmed compliance with the Code of Conduct of the Company for the year ended March 31, 2011.
Place: Chennai Arun JainDate: April 28, 2011 Chairman & Managing Director

Polaris Annual Report 2010‐11 39 Consolidated Financial Statements
CONSOLIDATED FINANCIAL STATEMENTS FOR THE YEAR ENDED MARCH 31, 2011
Polaris Annual Report 2010‐11

40
CONTENTS OF CONSOLIDATED FINANCIAL STATEMENTS
Auditors’ Report __________________ 41
Balance Sheet __________________ 42
Profit & Loss Account __________________ 43
Statement of Cash Flows __________________ 44
Schedules __________________ 45
Notes to Accounts __________________ 56

Polaris Annual Report 2010‐11 41 Consolidated Financial Statements Auditor's Report
To The Board of Directors of Polaris Software Lab Limited
1. We have audited the attached consolidated balance sheet of Polaris Software Lab Limited, its subsidiaries and associates (together referred to as “the group” as described in Note A of schedule 18 to the financial statements), as at March 31, 2011 and also the consolidated profit and loss account and the consolidated cash flow statement for the year ended on that date annexed thereto. These financial statements are the responsibility of the Polaris's management and have been prepared by the management on the basis of separate financial statements and other financial information regarding components. Our responsibility is to express an opinion on these financial statements based on our audit.
2. We conducted our audit in accordance with the auditing standards generally accepted in India. Those Standards require that we plan and perform the audit to obtain reasonable assurance about whether the financial statements are free of material misstatement. An audit includes examining, on a test basis, evidence supporting the amounts and disclosures in the financial statements. An audit also includes assessing the accounting principles used and significant estimates made by management, as well as evaluating the overall financial statement presentation. We believe that our audit provides a reasonable basis for our opinion.
3. The financial statements of certain associates (NMSWorks Software Private Limited and Adrenalin eSystems Limited) which reflect a net profit of Rs. 4,23.05 Lacs for the year ended March 31, 2011 and accumulated losses of Rs.3,121.57 Lacs as at March 31, 2011 have not been audited.
The attached consolidated financial statements do not include any share of loss/profit from these associates, as losses to the extent of the equity investment had already been absorbed in the consolidated financial statements by March 31, 2010. The effect of adjustments, if any, that may have been required to be made to attached consolidated financial statement, had the financial statements of those associates been audited, is not currently ascertainable. Our audit report on the consolidated financial statements for the year ended March 31, 2010 was qualified accordingly.
4. We did not audit the financial statements of certain subsidiaries, whose financial statements reflect total assets of Rs 32,613.38 Lacs as at March 31, 2011, the total revenue of Rs 36,287.33 lacs and cash outflow (net) amounting to Rs.134.90 Lacs for the year then ended. These financial statements and other financial information have been audited by other auditors whose reports have been furnished to us, and our opinion is based solely on the report of other auditors.
5. We report that the consolidated financial statements have been prepared by the Polaris's management in accordance with the requirements of Accounting Standards (AS) 21, Consolidated financial statements and Accounting Standards (AS) 23, Accounting for Investments in Associates in Consolidated Financial Statements notified pursuant to the Companies (Accounting Standards) Rules, 2006, (as amended).
6. Based on our audit and on consideration of reports of other auditors on separate financial statements and on the other financial information of the components, and to the best of our information and according to the explanations given to us, subject to our comments in paragraph 3, the effect of which on the attached consolidated financial statements is not currently ascertainable, we are of the opinion that the attached consolidated financial statements give a true and fair view in conformity with the accounting principles generally accepted in India:
(a) in the case of the consolidated balance sheet, of the state of affairs of the Group as at March 31, 2011;
(b) in the case of the consolidated profit and loss account, of the profit for the year ended on that date; and
(c) in the case of the consolidated cash flow statement, of the cash flows for the year ended on that date.
For S.R. BATLIBOI & ASSOCIATES Firm registration number: 101049W Chartered Accountants
per S Balasubrahmanyam Partner Membership No.: 053315
Place: Chennai Date; April 28, 2011

42
Polaris Software Lab Limited ‐ Group Consolidated Balance Sheet as at March 31, 2011
Rs. in Lacs Schedule March 31, 2011 March 31, 2010SOURCES OF FUNDS SHAREHOLDERS' FUNDS Share capital 1 4,959.78 4,948.06 Reserves and surplus 2 98,294.72 82,298.81 103,254.50 87,246.87 MINORITY INTEREST 254.16 ‐ LOAN FUNDS Secured loans 3 572.04 245.60
DEFERRED TAX LIABILITIES (NET) 12 220.84 302.54 104,301.54 87,795.01 APPLICATION OF FUNDS FIXED ASSETS Gross block 4 60,796.74 55,989.08 Less: Accumulated depreciation and amortisation 37,944.84 34,520.36 Net block 22,851.90 21,468.72 Capital‐work‐in progress including capital advances 6,514.58 1,245.68 29,366.48 22,714.40
GOODWILL [Refer note C9(c) ‐ (e) of schedule 18] 6,440.33 5,057.45 INVESTMENTS 5 38,429.51 38,967.06 DEFERRED TAX ASSETS (NET) 13 1,154.75 644.67 CURRENT ASSETS, LOANS AND ADVANCES Sundry debtors 6 22,718.54 17,463.24 Cash and bank balances 7 14,225.44 12,372.13 Other current assets 8 18,383.35 12,569.52 Loans and advances 9 11,635.80 8,265.63 66,963.13 50,670.52 Less: CURRENT LIABILITIES AND PROVISIONS Current liabilities 10 29,168.46 24,618.65 Provisions 11 8,884.20 5,640.44 38,052.66 30,259.09 NET CURRENT ASSETS 28,910.47 20,411.43 104,301.54 87,795.01 Significant accounting policies and notes to accounts 18
The Schedules referred to above and the notes thereon form an integral part of the Consolidated Balance Sheet
As per our report of even date.
For S.R.BATLIBOI & ASSOCIATES Firm Registration number: 101049W Chartered Accountants
For and on behalf of the Board of Directors of Polaris Software Lab Limited
per S. Balasubrahmanyam Partner Membership No 053315 Chennai April 28, 2011
Arun Jain Chairman & Managing Director R. Srikanth President & Chief Financial Officer Chennai April 28, 2011
B. Muthusubramanian Senior Vice President – Finance & Secretary
R.C. Bhargava Director

Polaris Annual Report 2010‐11 43 Consolidated Financial Statements Polaris Software Lab Limited ‐ Group Consolidated Profit and Loss Account for the year ended March 31, 2011
Rs. in Lacs except per share data Year Ended Schedule March 31, 2011 March 31, 2010INCOME Software development services and products ‐ Overseas 139,907.94 121,748.61 ‐ Domestic 17,057.74 10,447.64 Income from Business Process Management (BPM) ‐ Overseas 137.31 461.64 ‐ Domestic 1,530.15 2,717.73 Other income, net 14 5,906.95 (730.08) 164,540.09 134,645.54 EXPENDITURE Software development and BPM expenses 15 107,239.25 87,009.58 Selling, administrative and other general expenses 16 30,004.20 26,164.22 137,243.45 113,173.80
OPERATING PROFIT BEFORE INTEREST, DEPRECIATION AND AMORTISATION
27,296.64 21,471.74
Finance charges 17 114.87 91.09 Depreciation and amortisation 4 3,365.86 3,501.53 3,480.73 3,592.62
PROFIT BEFORE TAX 23,815.91 17,879.12 Income taxes ‐ Current tax 4,616.97 3,148.58 ‐ Deferred tax (441.64) (30.08) ‐ MAT credit entitlement (587.23) (565.23)PROFIT AFTER TAX 20,227.81 15,325.85 Minority Interest 18.16 ‐Share of profit / (loss) of associate companies [Refer note C9(a) of schedule 18]
‐ (41.61)
NET PROFIT FOR THE YEAR 20,245.97 15,284.24 Profit brought forward from previous year 45,510.39 35,583.68Amount available for appropriation 65,756.36 50,867.92 APPROPRIATIONS Dividend ‐ Interim ‐ 1,730.81 ‐ Final 4,465.02 1,731.82 Tax on dividend 717.65 588.47 Amount transferred to general reserve 1,900.00 1,306.43 Balance carried to balance sheet 58,673.69 45,510.39 65,756.36 50,867.92 EARNINGS PER SHARE [Refer note C7 of schedule 18](equity shares par value Rs 5/‐ each)Basic 20.43 15.48 Diluted 20.28 15.34 Number of shares used in computing earnings per shareBasic 99,100,729 98,765,014 Diluted 99,825,120 99,667,786
Significant accounting policies and notes to accounts 18
The Schedules referred to above and the notes thereon form an integral part of the Consolidated Profit and Loss Account
As per our report of even date.
For S.R.BATLIBOI & ASSOCIATES Firm Registration number: 101049W Chartered Accountants
For and on behalf of the Board of Directors of Polaris Software Lab Limited
per S. Balasubrahmanyam Partner Membership No 053315 Chennai April 28, 2011
Arun Jain Chairman & Managing Director R. Srikanth President & Chief Financial Officer Chennai April 28, 2011
B. Muthusubramanian Senior Vice President – Finance & Secretary
R.C. Bhargava Director

44
Polaris Software Lab Limited ‐ Group Statement of Consolidated Cash flows for the year ended March 31, 2011
Rs. in Lacs March 31, 2011 March 31, 2010
Cash Flows from operating activities Profit before taxation 23,815.91 17,879.12 Adjustments for:
Depreciation 3,365.86 3,501.53 Interest income (240.56) (156.35)Dividend income (1,778.69) (1,481.31)(Profit) / Loss on sale of fixed assets (1,061.16) (40.24)Provision for doubtful debts 367.99 257.06Bad debts written off ‐ 98.59Lease finance charges ‐ 2.44 Exchange differences on translation of foreign currency cash and cash equivalents
270.41 (197.97)
Unrealised exchange (gain) / loss 402.51 151.28 (Profit) / Loss on sale of Investments (51.10) 19.10
Changes in current assets and liabilitiesDecrease / (Increase) in sundry debtors (5,839.24) 3,560.62 Decrease/ (Increase) in loans and advances (7,759.69) 2,480.36 Increase/(Decrease) in current liabilities and provisions 3,887.25 2,251.33
Taxes paid (5,346.28) (2,904.67)
Net cash flows from operating activities 10,033.21 25,420.89 Cash Flows from investing activities Purchase of fixed assets and changes in capital work‐in‐progress (9,413.90) (3,466.56)Acquisition of Subsidiary [Refer note C9(c) ‐ (e) of schedule 18] (1,807.78) (3,471.95)Investment in associate company (80.80) ‐(Purchase) / Sale proceeds of other long term investments (250.61) ‐Net increase in non‐trade investments 942.60 (14,602.72)Proceeds from sale of fixed assets 1,189.73 75.94 Interest received 240.56 156.35 Dividend received 1,778.69 1,481.31
Net cash flows used in investing activities (7,401.51) (19,827.63)
Cash flows from financing activitiesProceeds from share capital issued on exercise of stock options 11.72 14.25 Proceeds from share premium on exercise of stock options 190.68 225.62 Proceeds from secured loans 1,267.90 178.53Repayment of secured loans (941.46) (35.71)Lease finance charges ‐ (2.44)Dividends paid during the year (2,022.99) (3,460.39)Dividend tax paid during the year ‐ Net cash flows used in investing activities (1,494.15) (3,080.14)
Exchange differences on translation of foreign currency cash and cash equivalents and movement in foreign currency translation reserve 398.75 (925.51)Total increase / (decrease) in cash and equivalents during the year 1,536.30 1,587.61 Cash balance of subsidiaries on acquisition 317.01 245.31
Cash and cash equivalents at the beginning of the Year 12,372.13 10,539.21 Cash and cash equivalents at the end of the Year * [Refer Schedule 7]
14,225.44 12,372.13
* The balances include Rs 62.70 (March 31, 2010: Rs 64.82) which are not available for use by the Company as they represent corresponding unpaid dividend liabilities. Previous year/period figures have been regrouped to confirm to current year presentation
As per our report of even date.
For S.R.BATLIBOI & ASSOCIATES Firm Registration number: 101049W Chartered Accountants
For and on behalf of the Board of Directors of Polaris Software Lab Limited
per S. Balasubrahmanyam Partner Membership No 053315 Chennai April 28, 2011
Arun Jain Chairman & Managing Director R. Srikanth President & Chief Financial Officer Chennai April 28, 2011
B. Muthusubramanian Senior Vice President – Finance & Secretary
R.C. Bhargava Director

Polaris Annual Report 2010‐11 45 Consolidated Financial Statements Polaris Software Lab Limited ‐ Group Schedules to the Consolidated Balance Sheet as at March 31, 2011
Rs. in Lacs March 31, 2011 March 31, 20101 SHARE CAPITAL Authorised 120,000,000 equity shares of Rs 5 each. 6,000.00 6,000.00 (March 31, 2010: 120,000,000 equity shares of Rs 5 each) 10,000,000 11 % preference shares of Rs 5 each. 500.00 500.00 (March 31, 2010: 10,000,000 11% preference shares of Rs 5
each)
6,500.00 6,500.00 Issued, Subscribed and Paid up 99,195,597 equity shares of Rs 5 each 4,959.78 4,948.06 (March 31, 2010: 98,961,147 equity shares of Rs 5 each )
fully paid up 4,959.78 4,948.06 Of the above : (i) 17,062,550 equity shares of Rs 5 each (March 31, 2010:
17,062,550 equity shares of Rs 5 each) were issued as bonus shares by capitalisation of securities premium account during the year 2001‐02.
(ii) 45,850,549 equity shares of Rs 5 each (March 31, 2010 : 45,850,549 equity shares of Rs 5 each) were issued pursuant to a scheme of amalgamation of Orbitech Solutions Limited with the Company during the year 2002‐03.
(iii) For stock options outstanding refer note C5 of schedule 18
2 RESERVES AND SURPLUS General Reserve ‐ As per last balance sheet 18,026.40 16,719.97 Add : Transferred from Profit and Loss Account 1,900.00 1,306.43 19,926.40 18,026.40
Foreign currency translation reserve ‐ As per last balance sheet
36.43 1,529.76
Add : Adjustment for the year 741.93 (1,493.33) 778.36 36.43
Securities Premium Account ‐ As per last balance sheet 18,725.59 18,499.97 Add: Premium received on issue of shares under ASOP plans 190.68 225.62
to employees 18,916.27 18,725.59
Profit and Loss Account balance 58,673.69 45,510.39 98,294.72 82,298.81
3 SECURED LOANS From Banks ‐ Overdraft (Secured against fixed deposit receipts) 572.04 245.53 ‐ Finance Lease Obligation ‐ 0.07 (Secured against cars taken on finance lease by the
Company) 572.04 245.60

46
Polaris So
ftware Lab Limited
‐ Group
Sche
dules to th
e Co
nsolidated
Balan
ce She
et as at M
arch 31, 201
1
4. FIXED
ASSETS Rs. in Lacs
Net Block
March 31,
2010
4,018.25
9,858.97
3,557.92
422.85
3,160.01
62.67
21,080.67 ‐
388.05
‐ ‐
388.05
21
,468.72 ‐
Note:
1 Land includ
es leasehold land
‐ Gross block Rs 243.46
; Net Block Rs 222.82
(March 31, 2010 : G
ross block Rs 243.46; Net Block Rs 228.26
). 2 Building includ
es leasehold im
provem
ents amou
nting to Gross Block of R
s 327.48
and
Net Block of R
s 108.09
(March 31, 2010: Gross Block of R
s 337.04
and
Net Block of R
s 115.54
). * Exchange adjustments represent fo
reign exchange gain / loss on accoun
t of translatio
n of overseas subsidiaries and
branche
s
March 31,
2011
4,642.83
9,322.67
4,224.55
376.80
3,132.40
795.02
22,494.27
22.45
335.18
‐ ‐
357.63
22
,851.90
21,468.72
Dep
reciation an
d Amortisation
March 31,
2011
19
.65
3,131.63
21,690.57
785.08
4,331.68
266.21
30,224.82
6,636.63
223.45
256.89
603.05
7,720.02
37
,944.84
34,520.36
Exchan
ge
adjustmen
ts * ‐
21.34
22.05
0.12
21.53 ‐
65.04 ‐
23.09 ‐ ‐
23.09
88.13
(250.43)
on
deletion
s ‐
36.12
452.59
0.93
92.63
85.64
667.91
‐ ‐ ‐ ‐ ‐ 667.91
1,494.27
For the
year
4.45
505.68
1,954.12
95.51
571.43
131.31
3,262.50
‐
103.35
‐ ‐
103.35
3,365.85
3,501.53
Dep
reciation on
assets acquired
on acquisition
‐ ‐
14.77 ‐
17.65
2.94
35.36 ‐ ‐ ‐
603.05
603.05
638.41
1,389.32
April 01,
2010
15
.20
2,640.73
20,152.22
690.38
3,813.70
217.60
27,529.83
6,636.63
97.01
256.89
‐
6,990.53
34
,520.36
31,374.21
Gross Block
March 31,
2011
4,662.48
12,454.30
25,915.12
1,161.88
7,464.08
1,061.23
52,719.09
6,659.08
558.63
256.89
603.05
8,077.65
60
,796.74
55,989.08
Exchan
ge
adjustmen
ts *
(0.13)
44.19
17.96
0.65
24.61 ‐
87.28 ‐
73.57 ‐ ‐
73.57
160.85
(598.66)
Deletions
4.47
92.85
475.88
0.93
130.02
92.34
796.49
‐ ‐ ‐ ‐ ‐ 796.49
1,529.97
Add
itions
0.07
3.26
2,636.84
48.93
565.32
868.13
4,122.55
22.45 ‐ ‐ ‐
22.45
4,145.00
3,650.88
Assets
acqu
ired
on
acqu
isition
633.56
‐
26.06 ‐
30.46
5.17
695.25
‐ ‐ ‐
603.05
603.05
1,298.30
1,631.97
April 01,
2010
4,033.45
12,499.70
23,710.14
1,113.23
6,973.71
280.27
48,610.50
6,636.63
485.06
‐
256.89
‐
7,378.58
55
,989.08
52,834.86
Description
TANGIBLE A
SSETS
Land (Refer note 1)
Buildings (Re
fer
note
2) Plant & M
achine
ry (including
Com
puter Equipm
ent,
softw
are and accessories)
Electrical fittings
Furniture, Fittings and
Office
equ
ipmen
t Veh
icles
SUB TO
TAL (A
)
INTA
NGIBLE ASSETS
Intellectual Property Rights –
Banking
Intellectual Property Rights
Insurance
Intellectual Property Rights –
Retails
Intellectual Property Rights –
Stock Broking
SUB TO
TAL (B
) TOTA
L (A+B
)
Previou
s year
Sl.No.
A 1 2 3 4 5 6 B 1 2 3 4

Polaris Annual Report 2010‐11 47 Consolidated Financial Statements Polaris Software Lab Limited ‐ Group Schedules to the Consolidated Balance Sheet as at March 31, 2011
Rs. in Lacs March 31, 2011 March 31, 2010 5
INVESTMENTS
LONG TERM INVESTMENT (AT COST) TRADE (UNQUOTED)
Software Sidoun GmbH Germany 4.96 4.96 Common stock of Euros 1,175,990 fully paid up (March 31, 2010: Common stock of Euros 1,175,990) Less: Diminution in value of investments ‐ ‐ 4.96 4.96
NMSWorks Software Private Limited, India 415.26 415.00 725,756 equity shares of Rs.10 each fully paid up (March 31, 2010: 725,756 equity shares of Rs.10 each fully paid up)
Less: Provision for diminution in value of investments (415.00) (415.00) [Refer note C 9 (b) of schedule 18] 0.26 ‐
378,614 12% optionally convertible cumulative preference shares of Rs. 10 each fully paid up
233.04 152.50
(March 31, 2010: 224,524 12 % Optionally Convertible Cumulative Preference shares of Rs. 10 each. )
Adrenalin eSystems Limited, India 833.88 833.88 13,078,080 equity shares of Rs 5 each fully paid up (March 31, 2010 : 13,078,080 equity shares of Rs 5 each fully paid)
Less: Share of Profit / (Loss) of Associate Company (833.88) (833.88) [Refer note C9 (a) of schedule 17] ‐ ‐
1,52,00,000 7% cumulative preference shares of Rs 5 each fully paid up
760.00 760.00
(March 31, 2010: 1,52,00,000 7% cumulative preference shares of Rs 5/‐ each fully paid up)
Tyfone Inc, 250.61 ‐ 481,232 equity shares of USD 1 each fully paid up (March 31, 2010: Nil)
( A ) 1,248.87 917.46
LONG TERM INVESTMENT (AT COST) NON TRADE
Equity Shares – Quoted 237 equity shares in Andhra Bank of Rs.10/‐ each 0.21 0.21 (March 31, 2010 : 237 equity shares in Andhra Bank of Rs.10/‐
each)
Equity Shares – Unquoted 100 equity shares in Catholic Syrian Bank of Rs.10/‐ each 0.24 0.15 (March 31, 2010 : 100 equity shares in Catholic Syrian Bank of
Rs.10/‐ each)
Bonds – Quoted 500.00 500.00 Indian Railway Finance Corporation 500 Bonds (March 31, 2010: 500 Bonds ) Face value: Rs 100,000.00 per bond
( B ) 500.45 500.36

48
Polaris Software Lab Limited ‐ Group Schedules to the Consolidated Balance Sheet as at March 31, 2011
Rs. in Lacs March 31, 2011 March 31, 2010 5 INVESTMENTS (continued) CURRENT INVESTMENTS (Lower of cost and market value) NON TRADE (UNQUOTED) Mutual Funds Birla Sun Life DBF ‐ Retail ‐Monthly Dividend ‐ 501.40 NIL units (March 31, 2010: 4,829,871.86 units) Face value: Rs 10.00 per unit
HDFC HIF ‐ S T P ‐ Dividend ‐ 1,781.45 NIL units (March 31, 2010: 16,801,023.5 units) Face value: Rs 10.00 per unit
HDFC Short Term Plan ‐ Dividend ‐ 2,709.97 NIL units (March 31, 2010: 26,216,749.43 units) Face value: Rs 10.00 per unit
Templeton India STIP ‐ Weekly Dividend ‐ 214.45 NIL units (March 31, 2010: 19,963.08 units) Face value: Rs 1,000.00 per unit
Templeton India STIP ‐ IP ‐ Weekly Dividend ‐ 1,903.57 NIL units (March 31, 2010: 188,244.61 units) Face value: Rs 1,000.00 per unit
Templeton FRIF ‐ Long Term ‐ Super IP ‐ Daily Dividend ‐ 2,629.99 NIL units (March 31, 2010: 26,281,174.40 units) Face value: Rs 10.00 per unit
Religare Active Income Fund ‐ IP ‐ Monthly Dividend ‐ 1,533.84 NIL units (March 31, 2010: 15,338,376.97 units) Face value: Rs 10.00 per unit
UTI Fixed Income Interval Fund ‐ Quarterly Plan III ‐ IP ‐ Dividend
‐ 2,000.00
NIL units (March 31, 2010: 19,998,000.20 units) Face value: Rs 10.00 per unit
UTI FIIF ‐ Series 2 ‐ Quarterly Interval Plan VI ‐ Dividend 500.05 2,011.41 5,000,538.153 units (March 31, 2010: 20,112,687.16 units) Face value: Rs 10.00 per unit
Reliance RSF ‐ Debt ‐ IP ‐ Growth 112.26 300.00 893,254.682 units (March 31, 2010: 2,387,185.59 units) Face value: Rs 10.00 per unit
LICMF Savings plus Fund ‐ Daily Dividend Plan Reinvestment
‐ 2,571.44
NIL units (March 31, 2010: 25,714,412.14 units) Face value: Rs 10.00 per unit
HDFC Cash Management Fund ‐ Treasury Advantage ‐ WP ‐ Daily Dividend
‐ 83.90
NIL units (March 31, 2010: 836,392.68 units) Face value: Rs 10.00 per unit
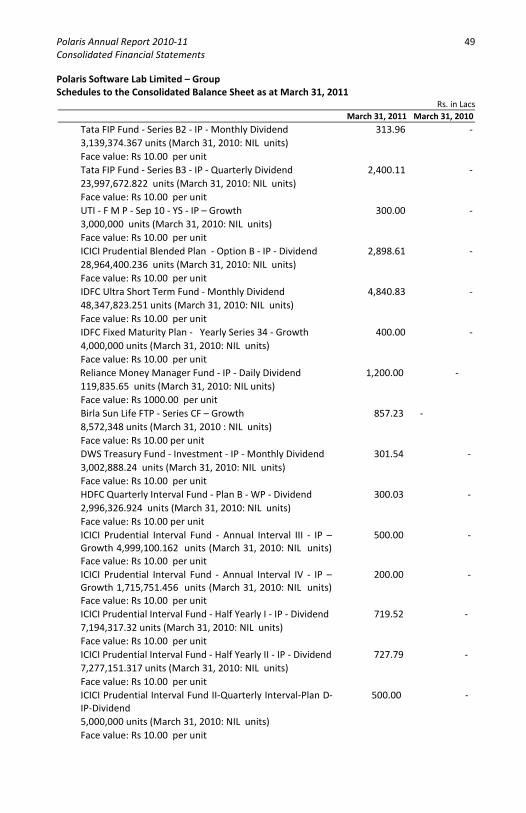
Polaris Annual Report 2010‐11 49 Consolidated Financial Statements Polaris Software Lab Limited – Group Schedules to the Consolidated Balance Sheet as at March 31, 2011
Rs. in Lacs March 31, 2011 March 31, 2010
Tata FIP Fund ‐ Series B2 ‐ IP ‐ Monthly Dividend 313.96 ‐ 3,139,374.367 units (March 31, 2010: NIL units) Face value: Rs 10.00 per unit Tata FIP Fund ‐ Series B3 ‐ IP ‐ Quarterly Dividend 2,400.11 ‐ 23,997,672.822 units (March 31, 2010: NIL units) Face value: Rs 10.00 per unit UTI ‐ F M P ‐ Sep 10 ‐ YS ‐ IP – Growth 300.00 ‐ 3,000,000 units (March 31, 2010: NIL units) Face value: Rs 10.00 per unit ICICI Prudential Blended Plan ‐ Option B ‐ IP ‐ Dividend 2,898.61 ‐ 28,964,400.236 units (March 31, 2010: NIL units) Face value: Rs 10.00 per unit IDFC Ultra Short Term Fund ‐ Monthly Dividend 4,840.83 ‐ 48,347,823.251 units (March 31, 2010: NIL units) Face value: Rs 10.00 per unit IDFC Fixed Maturity Plan ‐ Yearly Series 34 ‐ Growth 400.00 ‐ 4,000,000 units (March 31, 2010: NIL units) Face value: Rs 10.00 per unit Reliance Money Manager Fund ‐ IP ‐ Daily Dividend 1,200.00 ‐
119,835.65 units (March 31, 2010: NIL units) Face value: Rs 1000.00 per unit Birla Sun Life FTP ‐ Series CF – Growth 857.23 ‐
8,572,348 units (March 31, 2010 : NIL units) Face value: Rs 10.00 per unit DWS Treasury Fund ‐ Investment ‐ IP ‐ Monthly Dividend 301.54 ‐ 3,002,888.24 units (March 31, 2010: NIL units) Face value: Rs 10.00 per unit HDFC Quarterly Interval Fund ‐ Plan B ‐ WP ‐ Dividend 300.03 ‐ 2,996,326.924 units (March 31, 2010: NIL units) Face value: Rs 10.00 per unit ICICI Prudential Interval Fund ‐ Annual Interval III ‐ IP –
Growth 4,999,100.162 units (March 31, 2010: NIL units) Face value: Rs 10.00 per unit
500.00 ‐
ICICI Prudential Interval Fund ‐ Annual Interval IV ‐ IP – Growth 1,715,751.456 units (March 31, 2010: NIL units) Face value: Rs 10.00 per unit
200.00 ‐
ICICI Prudential Interval Fund ‐ Half Yearly I ‐ IP ‐ Dividend 719.52 ‐ 7,194,317.32 units (March 31, 2010: NIL units) Face value: Rs 10.00 per unit ICICI Prudential Interval Fund ‐ Half Yearly II ‐ IP ‐ Dividend 727.79 ‐ 7,277,151.317 units (March 31, 2010: NIL units) Face value: Rs 10.00 per unit ICICI Prudential Interval Fund II‐Quarterly Interval‐Plan D‐
IP‐Dividend 500.00 ‐
5,000,000 units (March 31, 2010: NIL units) Face value: Rs 10.00 per unit

50
Polaris Software Lab Limited – Group Schedules to the Consolidated Balance Sheet as at March 31, 2011
Rs. in Lacs March 31, 2011 March 31, 2010
IDFC FMP ‐ HYS 12 ‐ Dividend 1,000.00 ‐ 10,000,000 units (March 31, 2010: NIL units) Face value: Rs 10.00 per unit
IDFC Savings Advantage Fund ‐ Monthly Dividend 704.12 ‐ 70,400.94 units (March 31, 2010: NIL units) Face value: Rs 1,000.00 per unit
Kotak FMP 6 M Series 10 400.00 ‐ 4,000,000 units (March 31, 2010: NIL units) Face value: Rs 10.00 per unit
Reliance Liquid Fund ‐ Cash Plan ‐ Daily Dividend 0.16 ‐ 1,447.288 units (March 31, 2010: NIL units) Face value: Rs 10.00 per unit
Reliance FHF 15 ‐ Series 8 ‐ Dividend 400.19 ‐ 4,001,898.79 units (March 31, 2010: NIL units) Face value: Rs 10.00 per unit
Reliance FHF 15 ‐ Series 9 ‐ Dividend 300.19 ‐ 3,001,879.24 units (March 31, 2010: NIL units) Face value: Rs 10.00 per unit
Reliance Fixed Horizon Fund XVI Series 1 ‐ Growth 600.00 ‐ 6,000,000 units (March 31, 2010: NIL units) Face value: Rs 10.00 per unit
Reliance Medium Term Fund ‐ Daily Dividend ‐ 1,911.55 NIL units (March 31, 2010: 11,181,590.25 units) Face value: Rs. 10.00 per unit
Birla Sun Life Floating Rate Fund‐LTP‐IP‐ Weekly Dividend ‐ 1,002.42 NIL units (March 31, 2010: 10,001,051.78 units) Face value: Rs 10.00 per unit
Kotak Floater ‐ LT ‐ Daily Dividend 1,802.39 323.09 17,891,779.88 units (March 31, 2010: 3,205,344.36 units) Face value: Rs 10.00 per unit
IDFC Money Manager Fund ‐ Investment Plan ‐ Inst Plan B‐Daily Dividend Reinvestment
‐
2,945.90
NIL units (March 31, 2010: 29,414,858.12 units) Face value: Rs 10.00 per unit
LICMF Income Plus Fund‐Daily Dividend Plan Reinvestment ‐ 704.62 NIL units (March 31, 2010: 7,046,168.70 units) Face value: Rs 10.00 per unit
Sundaram BNP Paribas Flexible Fund‐STIP‐Daily Dividend ‐ 506.87 NIL units (March 31, 2010: 5,042,496.34 units) Face value: Rs 10.00 per unit
DWS Cash Opportunities Fund ‐ IP ‐ Daily Dividend ‐ 314.72 NIL units (March 31, 2010: 3,139,545.07units) Face value: Rs 10.00 per unit
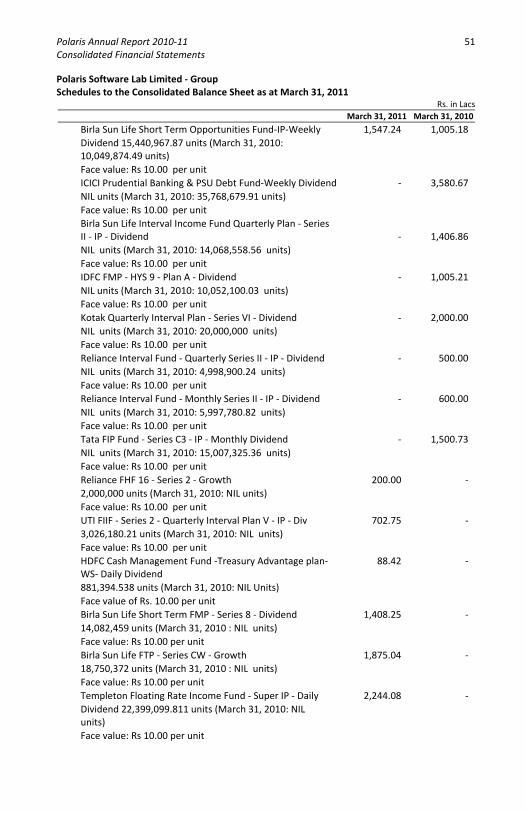
Polaris Annual Report 2010‐11 51 Consolidated Financial Statements Polaris Software Lab Limited ‐ Group Schedules to the Consolidated Balance Sheet as at March 31, 2011
Rs. in Lacs March 31, 2011 March 31, 2010 Birla Sun Life Short Term Opportunities Fund‐IP‐Weekly 1,547.24 1,005.18 Dividend 15,440,967.87 units (March 31, 2010:
10,049,874.49 units) Face value: Rs 10.00 per unit ICICI Prudential Banking & PSU Debt Fund‐Weekly Dividend ‐ 3,580.67 NIL units (March 31, 2010: 35,768,679.91 units) Face value: Rs 10.00 per unit Birla Sun Life Interval Income Fund Quarterly Plan ‐ Series
II ‐ IP ‐ Dividend
‐
1,406.86 NIL units (March 31, 2010: 14,068,558.56 units) Face value: Rs 10.00 per unit IDFC FMP ‐ HYS 9 ‐ Plan A ‐ Dividend ‐ 1,005.21 NIL units (March 31, 2010: 10,052,100.03 units) Face value: Rs 10.00 per unit Kotak Quarterly Interval Plan ‐ Series VI ‐ Dividend ‐ 2,000.00 NIL units (March 31, 2010: 20,000,000 units) Face value: Rs 10.00 per unit Reliance Interval Fund ‐ Quarterly Series II ‐ IP ‐ Dividend ‐ 500.00 NIL units (March 31, 2010: 4,998,900.24 units) Face value: Rs 10.00 per unit Reliance Interval Fund ‐ Monthly Series II ‐ IP ‐ Dividend ‐ 600.00 NIL units (March 31, 2010: 5,997,780.82 units) Face value: Rs 10.00 per unit Tata FIP Fund ‐ Series C3 ‐ IP ‐ Monthly Dividend ‐ 1,500.73 NIL units (March 31, 2010: 15,007,325.36 units) Face value: Rs 10.00 per unit Reliance FHF 16 ‐ Series 2 ‐ Growth 200.00 ‐ 2,000,000 units (March 31, 2010: NIL units) Face value: Rs 10.00 per unit UTI FIIF ‐ Series 2 ‐ Quarterly Interval Plan V ‐ IP ‐ Div 702.75 ‐ 3,026,180.21 units (March 31, 2010: NIL units) Face value: Rs 10.00 per unit HDFC Cash Management Fund ‐Treasury Advantage plan‐
WS‐ Daily Dividend 88.42 ‐
881,394.538 units (March 31, 2010: NIL Units) Face value of Rs. 10.00 per unit Birla Sun Life Short Term FMP ‐ Series 8 ‐ Dividend 1,408.25 ‐ 14,082,459 units (March 31, 2010 : NIL units) Face value: Rs 10.00 per unit Birla Sun Life FTP ‐ Series CW ‐ Growth 1,875.04 ‐ 18,750,372 units (March 31, 2010 : NIL units) Face value: Rs 10.00 per unit Templeton Floating Rate Income Fund ‐ Super IP ‐ Daily 2,244.08 ‐ Dividend 22,399,099.811 units (March 31, 2010: NIL
units)
Face value: Rs 10.00 per unit

52
Polaris Software Lab Limited ‐ Group Schedules to the Consolidated Balance Sheet as at March 31, 2011
Rs. in Lacs March 31, 2011 March 31, 2010
DWS Money Plus Fund ‐ IP ‐ Daily Dividend 301.11 ‐ 2,987,464.554 units (March 31, 2010: NIL units) Face value: Rs 10.00 per unit
Religare FMP ‐ Series V ‐ Plan C ‐ Dividend 400.00 ‐ 4,000,000 units (March 31, 2010: NIL units) Face value: Rs 10.00 per unit
Religare Credit Opportunities Fund‐IP‐Monthly Dividend 406.62 ‐ 3,996,948.525 units (March 31, 2010: NIL units) Face value: Rs 10.00 per unit
Reliance FHF 18 ‐ Series 2 ‐ Growth 500.00 ‐ 5,000,000 units (March 31, 2010: NIL units) Face value: Rs 10.00 per unit
Tata Floater Fund ‐ Daily Dividend 1,213.78 ‐ 12,094,758.233 units (March 31, 2010: NIL units) Face value: Rs 10.00 per unit
UTI Treasury Advantage Fund ‐ IP ‐ Daily Dividend 300.00 ‐ 29,993.578 units (March 31, 2010: NIL units) Face value: Rs 1000.00 per unit
UTI FTIF ‐ Series VIII ‐ Plan 6 ‐ Dividend 200.00 ‐ 2,000,000 units (March 31, 2010: NIL units) Face value: Rs 10.00 per unit
ICICI Prudential Flexible Income Plan‐Premium‐Daily Dividend
300.00 ‐
283,728.188 units (March 31, 2010: NIL units) Face value: Rs 10.00 per unit
IDBI Ultra Short Term Fund ‐ Daily Dividend 1,214.53 ‐ 12,145,265.102 units (March 31, 2010: NIL units) Face value: Rs 10.00 per unit
IDFC FMP ‐ YS 35 ‐ Growth 200.11 ‐ 2,001,071.658 units (March 31, 2010: NIL units) Face value: Rs 10.00 per unit
IDFC Fixed Maturity Plan‐100 Days Series–1–Dividend Payout Option
300.00 ‐
3,000,000 units (March 31, 2010: NIL units) Face value: Rs 10.00 per unit
SBI Magnum Income Fund ‐ FRP ‐ Savings Plus Bond ‐ Daily Dividend
1,000.23 ‐
9,945,296.01 units (March 31, 2010: NIL units) Face value: Rs 10.00 per unit Less: Provision for diminution in value of investments (0.95) ‐ ( C ) 36,680.19 37,549.24 (A + B + C) 38,429.51 38,967.06
Aggregate market value of quoted investments 511.60 500.26
Aggregate book value of quoted investments 500.45 500.21
Aggregate book value of unquoted investments 37,929.06 38,466.85
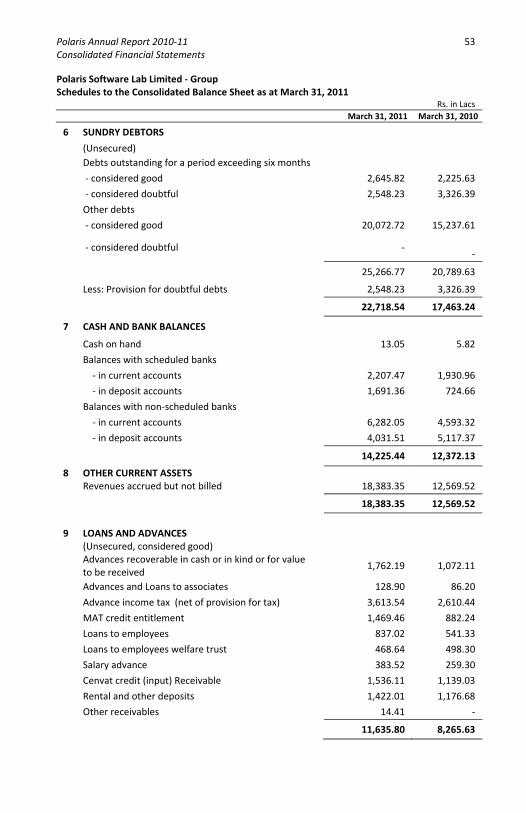
Polaris Annual Report 2010‐11 53 Consolidated Financial Statements Polaris Software Lab Limited ‐ Group Schedules to the Consolidated Balance Sheet as at March 31, 2011
Rs. in Lacs
March 31, 2011 March 31, 2010
6 SUNDRY DEBTORS
(Unsecured) Debts outstanding for a period exceeding six months
‐ considered good 2,645.82 2,225.63
‐ considered doubtful 2,548.23 3,326.39
Other debts
‐ considered good 20,072.72 15,237.61
‐ considered doubtful ‐
‐
25,266.77 20,789.63
Less: Provision for doubtful debts 2,548.23 3,326.39
22,718.54 17,463.24
7 CASH AND BANK BALANCES
Cash on hand 13.05 5.82
Balances with scheduled banks
‐ in current accounts 2,207.47 1,930.96
‐ in deposit accounts 1,691.36 724.66
Balances with non‐scheduled banks
‐ in current accounts 6,282.05 4,593.32
‐ in deposit accounts 4,031.51 5,117.37
14,225.44 12,372.13
8 OTHER CURRENT ASSETSRevenues accrued but not billed 18,383.35 12,569.52
18,383.35 12,569.52
9
LOANS AND ADVANCES (Unsecured, considered good)
Advances recoverable in cash or in kind or for value to be received
1,762.19 1,072.11
Advances and Loans to associates 128.90 86.20
Advance income tax (net of provision for tax) 3,613.54 2,610.44
MAT credit entitlement 1,469.46 882.24
Loans to employees 837.02 541.33
Loans to employees welfare trust 468.64 498.30
Salary advance 383.52 259.30
Cenvat credit (input) Receivable 1,536.11 1,139.03
Rental and other deposits 1,422.01 1,176.68
Other receivables 14.41 ‐
11,635.80 8,265.63

54
Polaris Software Lab Limited ‐ Group Schedules to the Consolidated Balance Sheet as at March 31, 2011
Rs. in Lacs March 31, 2011 March 31, 2010
10 CURRENT LIABILITIES
Sundry creditors 24,376.55 20,503.80 Unclaimed dividends 62.70 64.82 Advances received from customers 348.00 846.16 Billings in excess of revenue 4,381.21 3,203.87
29,168.46 24,618.65
11 PROVISIONS
Provision for gratuity [Refer note C4 of schedule 18] 1,512.06 1,520.32 Provision for leave benefits 1,803.03 1,896.20
Provision for taxation (net of Advance income tax and tax deducted at source )
381.17 197.78
Proposed dividend 4,463.80 1,731.82 Provision for tax on proposed dividend 724.14 294.32
8,884.20 5,640.44
12 DEFERRED TAX LIABILITY
Fixed assets 211.34 804.67 Provision for doubtful debts ‐ (509.17)Others 9.50 7.04
220.84 302.54
13 DEFERRED TAX ASSET
Fixed assets (410.17) 467.94 Sundry debtors 686.54 62.31 Others 878.38 114.42
1,154.75 644.67

Polaris Annual Report 2010‐11 55 Consolidated Financial Statements Polaris Software Lab Limited ‐ Group Schedules to the Consolidated Profit & Loss Account for the year ended March 31, 2011
Rs. in Lacs March 31, 2011 March 31, 2010
14 OTHER INCOME Interest received on deposits with banks 176.44 127.45Interest on staff advance 25.85 24.12Interest on Indian Railway Bonds 37.12 ‐Interest on others 1.15 4.78
Dividends received on investment in mutual funds (Current , Non trade ‐ unquoted) 1,778.69 1,481.31
Profit / (loss) on sale of investments, net 51.10 (19.10)Profit / (loss) on sale of assets, net 1,061.16 40.24 Miscellaneous income 1,146.59 253.08 Foreign exchange gains / (losses), net 1,628.85 (2,641.96)
5,906.95 (730.08)
15 SOFTWARE DEVELOPMENT AND BPM EXPENSES
Salaries and bonus including overseas staff expenses and outsourced consultants cost* 91,899.47 75,709.85
Staff welfare 3,584.91 2,870.47 Contribution to provident and other funds* 2,368.18 1,835.26Gratuity [Refer note C4 of schedule 18] 422.69 279.08Travel Project 5,609.57 3,881.87 Communication expenses 1,748.46 1,892.54 Software Licenses & Hardware cost 1,548.20 491.15 Consumables and computer maintenance 57.77 49.36
107,239.25 87,009.58
16 SELLING, ADMINISTRATION AND OTHER GENERAL EXPENSESSalaries and bonus including overseas staff expenses * 13,832.43 12,751.19
Contribution to provident and other funds * 309.25 278.35 Rent 2,311.83 2,144.44 Travelling and conveyance 2,843.38 2,007.27 Power and fuel 1,527.74 1,487.29 Professional and Legal charges 2,911.53 1,514.86 Business promotion 1,429.82 1,331.14 Repairs ‐ Plant and machinery 949.01 966.44 Repairs ‐ Building 80.12 108.68
Repairs ‐ Others 468.88 368.39 Office maintenance 643.22 543.48 Provision for doubtful debts 367.99 257.06 Bad debts / advances written off 1,139.56 98.59 Less: out of provision for earlier years (1,139.56) ‐ ‐ Insurance charges 203.48 231.52 Printing and stationery 175.15 190.41 Rates and taxes 139.92 186.98 Donations 194.52 141.52 Auditors' remuneration 50.70 50.62 Directors' sitting fees 8.65 9.20
Advertisements 10.81 11.29 Miscellaneous expenses 1,545.77 1,485.50
30,004.20 26,164.22
* Refer note C10 of schedule 18
17 FINANCE CHARGES Lease finance charges ‐ 2.44 Bank charges and others 114.87 88.65
114.87 91.09
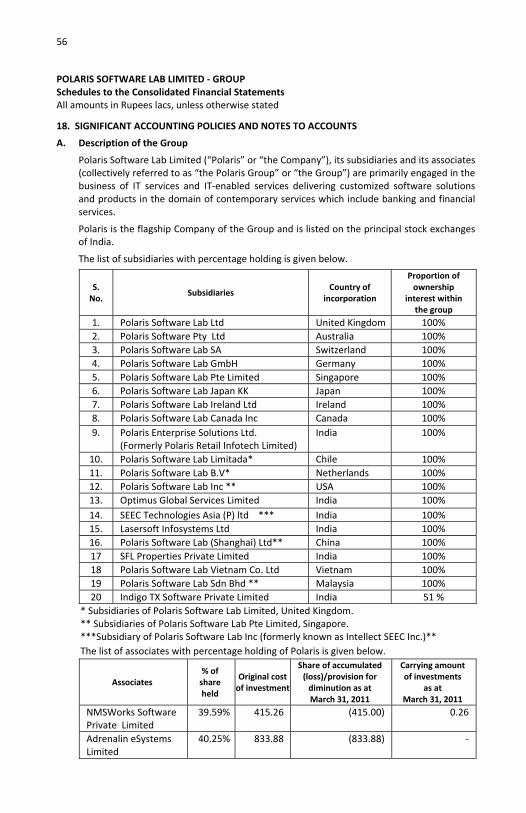
56
POLARIS SOFTWARE LAB LIMITED ‐ GROUP Schedules to the Consolidated Financial Statements All amounts in Rupees lacs, unless otherwise stated
18. SIGNIFICANT ACCOUNTING POLICIES AND NOTES TO ACCOUNTS
A. Description of the Group
Polaris Software Lab Limited (“Polaris” or “the Company”), its subsidiaries and its associates (collectively referred to as “the Polaris Group” or “the Group”) are primarily engaged in the business of IT services and IT‐enabled services delivering customized software solutions and products in the domain of contemporary services which include banking and financial services.
Polaris is the flagship Company of the Group and is listed on the principal stock exchanges of India.
The list of subsidiaries with percentage holding is given below.
S. No.
Subsidiaries Country of
incorporation
Proportion of ownership
interest within the group
1. Polaris Software Lab Ltd United Kingdom 100%2. Polaris Software Pty Ltd Australia 100%3. Polaris Software Lab SA Switzerland 100%4. Polaris Software Lab GmbH Germany 100%5. Polaris Software Lab Pte Limited Singapore 100%6. Polaris Software Lab Japan KK Japan 100%7. Polaris Software Lab Ireland Ltd Ireland 100%8. Polaris Software Lab Canada Inc Canada 100%9. Polaris Enterprise Solutions Ltd.
(Formerly Polaris Retail Infotech Limited) India 100%
10. Polaris Software Lab Limitada* Chile 100%11. Polaris Software Lab B.V* Netherlands 100%12. Polaris Software Lab Inc ** USA 100%13. Optimus Global Services Limited India 100%14. SEEC Technologies Asia (P) ltd *** India 100%15. Lasersoft Infosystems Ltd India 100%16. Polaris Software Lab (Shanghai) Ltd** China 100%17 SFL Properties Private Limited India 100%18 Polaris Software Lab Vietnam Co. Ltd Vietnam 100%19 Polaris Software Lab Sdn Bhd ** Malaysia 100%20 Indigo TX Software Private Limited India 51 %
* Subsidiaries of Polaris Software Lab Limited, United Kingdom. ** Subsidiaries of Polaris Software Lab Pte Limited, Singapore. ***Subsidiary of Polaris Software Lab Inc (formerly known as Intellect SEEC Inc.)** The list of associates with percentage holding of Polaris is given below.
Associates % of share held
Original cost of investment
Share of accumulated (loss)/provision for diminution as at March 31, 2011
Carrying amount of investments
as at March 31, 2011
NMSWorks Software Private Limited
39.59% 415.26 (415.00) 0.26
Adrenalin eSystems Limited
40.25% 833.88 (833.88) ‐

Polaris Annual Report 2010‐11 57 Consolidated Financial Statements POLARIS SOFTWARE LAB LIMITED – GROUP Schedules to the Consolidated Financial Statements All amounts in Rupees lacs, unless otherwise stated
B. SIGNIFICANT ACCOUNTING POLICIES
1. Basis of preparation
(a) The consolidated financial statements of the Polaris Group are prepared under the historical cost convention on the accrual basis in accordance with Generally Accepted Accounting Principles (GAAP) in India, and in all material respects comply with the notified accounting standard by Companies Accounting Standards Rules, 2006 ( as amended) and the relevant provisions of the Companies Act, 1956, (the Act). Accounting policies have been consistently applied except where a newly issued accounting standard is initially adopted or a revision to an existing accounting standard requires a change in the accounting policy hitherto in use. Management evaluates all recently issued or revised accounting standards on an ongoing basis.
The consolidated financial statements include the financial statements of Polaris Software Lab Limited and all its subsidiaries, which are more than 50%, owned or controlled. The financial statements are prepared in accordance with the principles and procedures required for the preparation and presentation of consolidated financial statements as laid down under the accounting standard on Consolidated Financial Statements as specified in the Companies (Accounting Standard) Rules, 2006 (as amended).
The financial statements of the Company and its subsidiaries are consolidated on a line by line basis by adding together like items of assets, liabilities, income and expenses. In respect of investments made in Associate Companies, the equity method prescribed under Accounting for Investments in Associates in Consolidated Financial Statements as specified in the Companies Accounting Standards Rules, 2006 (as amended), has been adopted in the preparation of these financial statements. The consolidated financial statements are prepared by applying uniform accounting policies in use at the Group. All material inter‐Company transactions and balances are eliminated on consolidation.
(b) In case of foreign subsidiaries, revenue items are consolidated at the average rate prevailing during the year. All the assets and liabilities are converted at the rates prevailing at the end of the year. Exchange gains / (losses) arising on conversion are recognized under Foreign Currency Translation Reserve. The excess of cost to the Company of its investment in subsidiary companies over its share of the equity of the subsidiary companies at the date on which the investments in the subsidiary companies are made, is recognized as goodwill being an asset in the consolidated financial statement.
(c) Goodwill arising on acquisition of an associate by the Group has been included in the carrying amount of investments in the associates and has been disclosed separately.
2. Use of estimates
The preparation of financial statements in conformity with generally accepted accounting principles requires management to make estimates and assumptions that affect the reported amounts of assets and liabilities, disclosure of contingent liabilities at the date of the financial statements and the results of operations during the reporting year end.

58
POLARIS SOFTWARE LAB LIMITED – GROUP Schedules to the Consolidated Financial Statements All amounts in Rupees lacs, unless otherwise stated
SIGNIFICANT ACCOUNTING POLICIES AND NOTES TO ACCOUNTS (Continued)
Although these estimates are based upon management’s best knowledge of current events and actions, actual results could differ from these estimates. Management periodically assesses using external and internal sources whether there is an indication that an asset may be impaired. Impairment occurs where the carrying value exceeds the present value of future cash flows expected to arise from the continuing use of the asset and its eventual disposal.
The impairment loss to be expensed is determined as the excess of the carrying amount over the higher of the asset’s net sales price or present value as determined above. Contingencies are recorded when it is probable that a liability will be incurred, and the amount can be reasonably estimated. Actual results could differ from those estimates.
3. Revenue recognition
Revenue is recognized to the extent that it is probable that the economic benefits will flow to the Company and the revenue can be reliably measured.
Software development and support services
Revenue from software development and support services comprises income from time‐and‐material and fixed price contracts. Revenue with respect to time‐and‐material contracts is recognized as related services are performed. Revenue from fixed‐price contracts is recognized in accordance with the proportionate completion method. Provision for estimated losses on incomplete contract is recorded in the period in which such losses become probable based on the current contract estimates.
Revenue accrued and not billed represents earnings on ongoing fixed price and time and material contracts over amounts invoiced to customers. Revenue in excess of billing represents earnings on ongoing fixed price & time and material contracts over amounts invoiced to customers.
Billings in excess of revenue represent amounts billed in case of ongoing fixed price and time and material contracts wherein amounts have been billed in accordance with the billing cycle and efforts would be incurred subsequent to the balance sheet date.
Product licenses and related revenues
Revenues from product licenses and related services comprise income under multiple element arrangements recognized as follows:
• License fees and fees for customization/implementation services are recognized using proportionate completion method. Provision for estimated losses, if any, on incomplete contracts are recorded in the year in which such losses become probable based on current contract estimates.
• Product maintenance revenues are recognized over the period of the maintenance contract.
• Revenue from sale of licenses which are not in the nature of multiple element arrangements are recognized upon delivery of these licenses which constitute transfer of all risks and rewards and has no further obligations under those arrangements.
Polaris Annual Report 2010‐11 59 Consolidated Financial Statements POLARIS SOFTWARE LAB LIMITED – GROUP Schedules to the Consolidated Financial Statements All amounts in Rupees lacs, unless otherwise stated
SIGNIFICANT ACCOUNTING POLICIES AND NOTES TO ACCOUNTS (Continued)
Business Process Outsourcing
Revenue from call centre services comprises income from time and material contracts. Revenue is recognized in accordance with the terms of the contract with the customer, as related services are performed.
Other Income
Interest is recognized using the time‐proportion method.
Dividend income is recognized when the Company’s right to receive dividend is established.
4. Fixed assets and capital work‐in‐progress
Fixed assets are stated at cost, less accumulated depreciation until the date of the balance sheet and impairment losses if any. Cost comprises the purchase price and any attributable cost of bringing the asset to its working condition for its intended use. Capital work in progress includes advances paid to acquire fixed assets and cost of assets not ready for intended use before the balance sheet date.
5. Leases
Assets acquired on finance leases are capitalized and a corresponding liability disclosed as lease obligations under “Secured Loans”. Such assets are capitalized at fair values or present value of minimum lease payments, whichever is lower, at the inception of the lease term and disclosed as leased assets. Rentals paid by the Group are apportioned between the finance charge and as a reduction of the outstanding liability. Finance charge reflects a constant periodic rate of interest on the remaining balance of liability for each period. Lease management fees, legal charges and other initial direct costs are capitalised.
Leases where the lessor effectively retains substantially all the risks and the benefits of ownership of the leased term are classified as operating leases. Operating lease payments are recognized as an expense in the Profit and Loss account on a straight‐line basis over the lease term.
6. Depreciation and Amortisation
Depreciation on fixed assets is provided using the straight‐line method based on rates specified in Schedule XIV of the Companies Act, 1956 or on estimated useful lives of assets estimated by the management, whichever is higher. Individual assets costing less than Rs 5,000/‐ are depreciated at the rate of 100 %.

60
POLARIS SOFTWARE LAB LIMITED – GROUP Schedules to the Consolidated Financial Statements All amounts in Rupees lacs, unless otherwise stated
SIGNIFICANT ACCOUNTING POLICIES AND NOTES TO ACCOUNTS (Continued)
The estimated useful life considered for depreciation of fixed assets are as follows:
Asset category Estimated Useful Life (years)
Tangible assets
Buildings 29
Leasehold Improvements 10 or over the lease period whichever is lesser
Plant and machinery 6‐7
Computer equipment and Software 3
Servers and computer accessories 5
Furniture and fixtures, office equipment and electrical fittings
10
Vehicles 4‐6
Software Products & Intellectual property assets (indigenously developed)
3‐5
Leasehold land is amortized over the period of lease.
In some subsidiaries and associates, depreciation is calculated on written down value basis. The depreciation charge in respect of these entities is not significant in the context of the consolidated financial statements.
The excess of consideration paid over the book value of assets acquired has been recognized as goodwill in accordance with Accounting Standard (AS) 21 on ‘Consolidated Financial Statements’. Goodwill arising on account of acquisition of subsidiaries and affiliates is not being amortised but is being reviewed periodically for impairment. If the carrying value of the goodwill exceeds its fair value, goodwill is considered to be impaired and the impairment is charged to the Profit and Loss Account for the year.
7. Impairment
The carrying amounts of assets are reviewed at each balance sheet date if there is any indication of impairment based on internal/external factors. An impairment loss is recognized wherever the carrying amount of an asset exceeds its recoverable amount. The recoverable amount is the greater of the asset’s net selling price and value in use. In assessing value in use, the estimated future cash flows are discounted to their present value at the pre‐tax discount rate reflecting current market assessment of time value of money and risks specific to asset.
After impairment, depreciation is provided on the revised carrying amount of the asset over its remaining useful life.
Polaris Annual Report 2010‐11 61 Consolidated Financial Statements POLARIS SOFTWARE LAB LIMITED – GROUP Schedules to the Consolidated Financial Statements All amounts in Rupees lacs, unless otherwise stated
SIGNIFICANT ACCOUNTING POLICIES AND NOTES TO ACCOUNTS (Continued)
8. Research and development expenses for software products
Expenditure
Software product and Intellectual property development costs are expensed as incurred until technological feasibility is established. Development costs incurred subsequent to the achievement of technological feasibility are capitalised and amortised over estimated useful life of the products. This capitalisation is done only if the Group has the intention and ability to complete the product, the product is likely to generate future economic benefits, adequate resources to complete the product are available to the Group and the Group is able to accurately measure such expense.
Such costs comprise expenditure that can be directly attributed, or allocated on a reasonable and consistent basis, to development of the product and intellectual property rights.
Amortization
The amortization of software development costs and intellectual property rights are allocated on a systematic basis over the best estimate of its useful life after the product is ready for use. The factors considered for identifying the basis include obsolescence, product life cycle and actions of competitors.
The amortization period and the method are reviewed at each year end. If the expected useful life of the product is shorter from previous estimates, the amortization period is changed accordingly.
9. Foreign currency transactions and translations
Foreign currency transactions are recorded in the reporting currency, by applying to the foreign currency amount the exchange rates that approximates prevailing at the date of the transaction.
Foreign currency monetary items are reported using the closing rate. Non‐monetary items which are carried in terms of historical cost denominated in a foreign currency are reported using the exchange rate at the date of the transaction; and non‐monetary items which are carried at fair value or other similar valuation denominated in a foreign currency are reported using the exchange rates that existed when the values were determined.
Exchange differences arising on the settlement of monetary items or on reporting Group's monetary items at rates different from those at which they were initially recorded during the year, or reported in previous financial statements, are recognised as income or as expenses in the year in which they arise except those arising from investments in non‐integral operations.
The financial statements of a non‐integral foreign operation are translated into Indian Rupees as follows:
• Income and expense items are translated at the average exchange rate for the year.
• Assets and liabilities, both monetary and non‐monetary, are translated at the closing rate.
• All resulting exchange differences are accumulated in foreign currency translation reserve, which is reflected under reserves and surplus.

62
POLARIS SOFTWARE LAB LIMITED – GROUP Schedules to the Consolidated Financial Statements All amounts in Rupees lacs, unless otherwise stated
SIGNIFICANT ACCOUNTING POLICIES AND NOTES TO ACCOUNTS (Continued)
On the disposal of a non‐integral foreign operation, the cumulative amount of the exchange differences which have been deferred and which relate to that operation are recognized as income or as expenses in the same period in which the gain or loss on disposal is recognized.
When there is a change in the classification of a foreign operation, the translation procedures applicable to the revised classification are applied from the date of the change in the classification.
10. Forward contracts in foreign currencies
The Group uses foreign exchange forward contracts to hedge its exposure to movements in foreign currency rates. The use of these foreign exchange forward contracts reduces the risk or cost to the Group and the Group does not use the foreign exchange forward contracts for trading or speculation purposes.
Forward exchange contracts that are not hedges of forecasted transactions are accounted for using the guidance in Accounting Standard (‘AS’) 11, ‘The effects of changes in foreign exchange rates’. The premium or discount on all such contracts arising at the inception of each contract is amortised as income or expense over the life of the contract. Any profit or loss arising on the cancellation or renewal of forward contracts is recognized as income or as expense for the period. The exchange difference is calculated as the difference between the foreign currency amount of the contract translated at the exchange rate at the reporting date, or the settlement date where the transaction is settled during the reporting period, and the corresponding foreign currency amount translated at the latter of the date of inception of the forward exchange contract and the last reporting date. Such exchange differences are recognised in the profit and loss account in the reporting period in which the exchange rates change.
Pursuant to the Announcement of the ICAI dated March 29, 2008, the Group records net mark‐to‐market losses, if any, in respect of forward exchange contracts entered in to hedge a highly probable forecast transaction but, net mark‐to‐market gains are not recorded for such transactions.
11. Investments
Investments are classified as long term investments and current investments. Investments that are readily realizable and intended to be held for not more than a year are classified as current investments. All other investments are classified as long‐term investments. Long‐term investments are stated at cost and any decline other than temporary, in the value of such investments is charged to the Profit and Loss account. Current investments are stated at the lower of cost and market value determined on an individual investment basis. However, provision for diminution in value is made to recognise a decline other than temporary in the value of the investments.

Polaris Annual Report 2010‐11 63 Consolidated Financial Statements POLARIS SOFTWARE LAB LIMITED – GROUP Schedules to the Consolidated Financial Statements All amounts in Rupees lacs, unless otherwise stated
SIGNIFICANT ACCOUNTING POLICIES AND NOTES TO ACCOUNTS (Continued)
12. Retirement and other employee benefits
Provident Fund
Employees receive benefits from a provident fund, which is a defined contribution plan. Both the employee and the Company make monthly contributions to the Regional Provident Fund equal to a specified percentage of the covered employee’s salary. The Group has no further obligations under the plan beyond its monthly contributions. The contributions are charged to the Profit and Loss Account of the year when the contributions to the respective funds are due and there are no other obligations other than the contribution payable.
Gratuity
The Group provides for gratuity in accordance with the Payment of Gratuity Act, 1972, a defined benefit retirement plan (the Plan) covering all employees. The plan, subject to the provisions of the above Act, provides a lump sum payment to eligible employees at retirement, death, incapacitation or termination of employment, of an amount based on the respective employee’s salary and the tenure of employment. Gratuity liability is accrued and provided for on the basis of an actuarial valuation on projected unit credit method made at the end of each financial year. Actuarial gains/losses are immediately taken to profit and loss account and are not deferred.
Superannuation
The Group contributes a specified percentage of the eligible employees’ basic salary towards superannuation (the Plan) to a fund. A trust has been created and approved by the Income‐tax authorities for this purpose. This Plan provides for various options for payment of pension at retirement or termination of employment as per the trust rules. The Group has no further obligations under the Plan beyond its annual contribution.
Leave Benefits
As per the current employment policy of the Group, employees can carry forward accumulated leave balances as per Group’s leave policy which can be utilized in the subsequent years. In case of overseas branches, the employees are eligible to encash the accumulated leave balances.
Provision for compensated absences is accrued and provided for on the basis of actuarial valuation made at the end of the each financial year. The actuarial valuation is done as per projected unit credit method Encashment of accumulated leave balances are accounted for in the year in which the leave balances are credited to employees on actual basis.
Subsidiaries
Retirement benefits are provided to employees of subsidiaries in accordance with the local laws and regulations prevailing in the Country in which the subsidiary is located.
64
POLARIS SOFTWARE LAB LIMITED – GROUP Schedules to the Consolidated Financial Statements All amounts in Rupees lacs, unless otherwise stated
SIGNIFICANT ACCOUNTING POLICIES AND NOTES TO ACCOUNTS (Continued)
13. Income taxes and Deferred Tax
Tax expense comprises of current and deferred tax. The current charge for income taxes is calculated in accordance with the relevant tax regulations applicable to the Group. The current tax provision and advance income tax as at balance sheet date have been arrived at after setting off advance tax and current tax provision where the Group has legally enforceable right to set off assets against liabilities and where such assets and liabilities relate to taxes on income levied by the same governing taxation laws.
Minimum alternative tax (MAT) paid in accordance to the tax laws, which gives rise to future economic benefits in the form of adjustment of future income tax liability, is considered as an asset if there is convincing evidence that the Group will pay normal income tax after the tax holiday period. Accordingly, MAT is recognised as an asset in the balance sheet when it is probable that the future economic benefit associated with it will flow to the Group and the asset can be measured reliably.
Deferred tax assets and liabilities are recognised for the future tax consequences attributable to timing differences between the taxable income and accounting income. Deferred tax assets and liabilities are measured using the tax rates and tax laws that have been enacted or substantively enacted by the balance sheet date. The effect on deferred tax assets and liabilities of a change in tax rates is recognised in the year that includes the enactment date. Deferred tax assets and deferred tax liabilities across various countries of operation are not set off against each other as the Group does not have legal right to do so.
Deferred tax assets are recognised only if there is a reasonable certainty that sufficient future taxable income will be available against which such deferred tax assets can be realised and are reassessed for the appropriateness of their respective carrying values at each balance sheet date. Unrecognised deferred tax assets of earlier years are re‐assessed and recognised to the extent that it has become reasonably certain that future taxable income will be available against which such deferred tax assets can be realized. The Group writes‐down the carrying amount of a deferred tax asset to the extent that it is no longer reasonably certain, that sufficient future taxable income will be available against which deferred tax asset can be realized.
The Company has availed the tax holiday benefits under Section 10A of the Income tax Act, 1961 for some of the units and, accordingly, its business income (to the extent covered by that section) is exempt from tax up to and including year ending March 31, 2011.
14. Stock based compensation
In accordance with the Employee Stock Option Scheme and Employee Stock Purchase Scheme Guidelines, 1999 issued by the Securities and Exchange Board of India (“SEBI”) and the Guidance Note on Accounting for Employee Share‐based Payments, issued by the Institute of Chartered Accountants of India, the ‘Option Discount’ has been amortized on a straight‐line basis over the vesting period of the shares to be issued if any, under Stock Option Plans and disclosed as ‘employee stock compensation expense’ in the profit and loss Account. The Company measures compensation cost relating to employee stock options using the intrinsic value method.
‘Option Discount’ means the excess of the market price / fair value of the underlying shares at the date of grant of the options over the exercise price of the options.

Polaris Annual Report 2010‐11 65 Consolidated Financial Statements POLARIS SOFTWARE LAB LIMITED – GROUP Schedules to the Consolidated Financial Statements All amounts in Rupees lacs, unless otherwise stated
SIGNIFICANT ACCOUNTING POLICIES AND NOTES TO ACCOUNTS (Continued)
15. Earnings per share
The basic earnings per share are computed by dividing the net profit attributable to equity shareholders for the year by the weighted average number of equity shares outstanding during the year. The number of shares used in computing diluted earnings per share comprises the weighted average shares considered for deriving basic earnings per share and also the weighted average number of equity shares which would have been issued on the conversion of all dilutive potential equity shares. Dilutive potential equity shares are deemed converted as at the beginning of the year, unless they have been issued at a later date.
C. NOTES TO ACCOUNTS:
1. All amounts in the financial statements are presented in Rupees Lacs, except for per share data and as otherwise stated.
2. Capital commitments and contingent liabilities
(i) The estimated amount of contracts remaining to be executed on capital account, and not provided for (net of advances) as at March 31, 2011 is Rs 3,171.10 (March 31, 2010: Rs 1,689.85).
(ii) As at March 31, 2011, the Group has outstanding guarantees and counter guarantees of Rs.1,222.29 (March 31, 2010: Rs.1,683.86) issued to various banks, in respect of the guarantees given by the banks in favour of various government authorities and others.
(iii) Claims against the Group, not acknowledged as debts includes:
(a) Demand from Indian income tax authorities as at March 31, 2011 is Rs.754.63 (March 31, 2010: Rs.1,366.09). The tax demand is mainly on account of disallowance of a portion of the deduction claimed by the Company under Section 10A of the Income tax act.;
(b) Sales Tax demand from Commercial Tax Officer, Chennai is Rs.520.00 as at March 31, 2011 (March 31, 2010: Rs 520); and
(c) Sales Tax demand from Commercial Tax Officer, Hyderabad is Rs.98.00 as at March 31, 2011 (March 31, 2010: Rs 42.40).
(d) Service tax demand from Commissioner of Central excise, Chennai as at March 31, 2011 is Rs 32.25 (March 31, 2010: 32.25)
The Group is contesting the demands raised by the respective tax authorities, and the management, including its tax advisers, believes that its position will likely be upheld in the appellate process. No tax expense has been accrued in the financial statements for the tax demand raised. Management believes that the ultimate outcome of these proceedings will not have a material adverse effect on the Group’s financial position and results of operations.

66
POLARIS SOFTWARE LAB LIMITED – GROUP Schedules to the Consolidated Financial Statements All amounts in Rupees lacs, unless otherwise stated
SIGNIFICANT ACCOUNTING POLICIES AND NOTES TO ACCOUNTS (Continued)
(iv) The Company is also involved in other law suit and claims including suits filed by former employees, which arise in the ordinary course of business. However there are no such matters pending that the Company expects to be material in relation to its business.
3. Leases
(i) The future obligation for vehicles taken on lease is given below.
Particulars As at March 31,2011
As at March 31, 2010
Not later than one year ‐ 0.07
Later than one year and not later than 5 years ‐ ‐
‐ 0.07
Less: Amount representing future interest ‐ ‐
Present Value of minimum lease rentals ‐ 0.07
(ii) The Group has taken certain offices and residential premises for the employees under operating leases, which expires at various dates in future years and renewable for further period at the option of the Group. There are no restrictions imposed by the lease arrangements. The minimum lease rental payments to be made in respect of these leases are as follows.
Particulars As at
31 March 2011
As at31 March 2010
Lease payments for the year 1,663.79 1,852.62Contingent rent recognised in Profit and Loss Account Minimum Lease Payments:Not later than one year 1,614.54 1,022.35Later than one year and not later than five years 2,684.52 1,576.05Later than five years 564.80 247.81Total 4,863.86 2,846.21
4. Gratuity
The Group has a defined benefit gratuity plan. Every employee who has completed five years or more of service gets a gratuity on departure at 15 days salary (last drawn salary) for each completed year of service. A trust by name “Polaris Software Lab group gratuity trust” has been constituted to administer the gratuity fund.
The following tables summaries the components of net benefit expense recognised in the profit and loss account and the funded status and amounts recognised in the balance sheet for the respective plans.
Reconciliation of opening and closing balances of the present value of defined benefit obligation:

Polaris Annual Report 2010‐11 67 Consolidated Financial Statements POLARIS SOFTWARE LAB LIMITED – GROUP Schedules to the Consolidated Financial Statements All amounts in Rupees lacs, unless otherwise stated
SIGNIFICANT ACCOUNTING POLICIES AND NOTES TO ACCOUNTS (Continued)
Particulars Year ended March 31,
2011
Year ended March 31,
2010 Obligations at the beginning of the year 1,714.78 1,459.63Obligations at the beginning of the year for the subsidiary acquired during the year
15.23 109.58
Adjustments to opening obligations during the year ‐ (86.54)Current service cost 366.32 312.67Interest cost 126.51 111.19 Expected return on plan assets ‐ 0.77Actuarial (gain) / losses (39.77) (71.05)Benefits paid (204.29) (121.47)Obligations at the year end 1,978.78 1,714.78Change in plan assetsPlan assets at year beginning, at fair value 194.46 42.61Plan assets at year beginning, at fair value for the subsidiary acquired during the year
‐ 87.16
Adjustments to opening fair value of plan assets during the year
‐ 2.37
Expected Return on plan assets 27.48 15.18Actuarial gain / (loss) 2.89 ‐Contributions 446.19 169.72Benefits paid (204.30) (122.58)Plan assets at year end, at fair value 466.72 194.46
Reconciliation of present value of the obligation and the fair value of plan assets
Fair Value of plan assets at the end of the year 466.72 194.46Present value of defined benefit obligations at the end of the year
(1,978.78) (1,714.78)
Asset/(Liability) recognized in the balance sheet 1,512.06 (1,520.32) Gratuity cost for the yearCurrent service cost 366.32 312.67Interest cost 126.51 111.19Expected return on plan assets (27.48) 15.18Actuarial (gain) / losses (42.66) (71.05)Adjustments during the year from opening obligations ‐ (88.91)Net gratuity cost 422.69 279.08
Defined Benefit Obligation 1,978.78 1,714.78Plan Assets 466.72 194.46Surplus/( deficit) 1,512.06 (1,520.32)Experience adjustments on plan liabilities (39.77) (71.05)Experience adjustments on plan assets 2.89 ‐Assumptions: Discount rate 7.98% 7.82%Estimated return on plan assets 7.98% 7.82%Employee turnover 16% 16%

68
POLARIS SOFTWARE LAB LIMITED – GROUP Schedules to the Consolidated Financial Statements All amounts in Rupees lacs, unless otherwise stated
SIGNIFICANT ACCOUNTING POLICIES AND NOTES TO ACCOUNTS (Continued)
The present value of defined benefit obligations as at March 31, 2009 is Rs 1,459.63 and as March 31, 2008 is Rs 988.22. The experience adjustments on plan liabilities as at March 31, 2009 is Rs.21.30 and as at March 31, 2008 is Rs.24.79. The amount expected to be contributed to gratuity in the next financial year as required by AS 15 Revised is Rs.270.
The fund is invested in the form of a prescribed insurance policy with ICICI Prudential and Life Insurance Corporation of India (“LIC”). The overall expected rate of return on assets is determined based on the market prices prevailing on that date, applicable to the period over which the obligation is to be settled.
The estimates of future salary increases, considered in actuarial valuation, take account of inflation, seniority, promotion and other relevant factors, such as supply and demand in the employment market.
5. Stock Option Plans
The Company has four stock option plans that provide for the granting of stock options to employees including Directors of the Company (not being promoter Directors and not holding more than 10% of the equity shares of the Company). The objectives of these plans include attracting and retaining the best personnel, providing for additional performance incentives and promoting the success of the Company by providing employees the opportunity to acquire equity shares.
The option plans are summarized below.
Associate Stock Option Plan 2000
On March 9, 2000 the Company’s shareholders approved in the Extraordinary General Meeting (EGM) an Associated Stock Option Plan (“the 2000 Plan”). The 2000 Plan provides for issuance of 938,400 equity shares of Rs.5/‐ each to the employees including Directors. Employee Remuneration and Compensation Committee administers the 2000 Plan. Under the Plan, based on the recommendation of Employee Remuneration and Compensation Committee, the options were granted at a discount not exceeding 25% of the market price of shares on the date of grant. The option vests over a period of five years from the grant date.
Subsequently, the shareholders of the Company approved the following modifications to the 2000 Plan:
• At the EGM held on March 7, 2001 the Plan was modified to permit cancellation/ accept surrender of options; and
• At the Annual General Meeting held on September 6, 2002 the exercise price of the options to be granted will be the market price of the shares on the date of the grant.

Polaris Annual Report 2010‐11 69 Consolidated Financial Statements POLARIS SOFTWARE LAB LIMITED – GROUP Schedules to the Consolidated Financial Statements All amounts in Rupees lacs, unless otherwise stated
SIGNIFICANT ACCOUNTING POLICIES AND NOTES TO ACCOUNTS (Continued)
A summary of the status of the 2000 Plan at March 31, 2011 is presented below.
The options exercisable at the end of the year have become nil and hence ceases to exist.
Associate Stock Option Plan 2001
The Shareholders of the Company in the Extraordinary General Meeting (EGM) held on 7 March 2001 approved an Associate Stock Option Plan (“the 2001 Plan”). The 2001 Plan provides for issuance of 1,194,000 equity shares of Rs.5/‐ each to the employees including Directors at the closing market price of shares on the date of grant. The option vests over a period of five years from the grant date.
A summary of the status of the 2001 plan at March 31, 2011 is presented below.
Particulars
March 31, 2011 March 31, 2010
Number of Shares
Weighted Average Exercise
Price (Rs.)
Number of Shares
Weighted Average Exercise
Price(Rs.) Outstanding at the beginning of the year
‐ ‐ 6,000 123.65
Expired during the year ‐ ‐ (6,000) 123.65Outstanding at the end of the year
‐ ‐
During the year ended 31 March 2002, the Company announced and allotted bonus shares by capitalising a part of securities premium account in the ratio of 1 equity share for every 2 shares held on the record date. The Associate Stock Option Schemes (ASOP) mentioned above provide power to the compensation committee for suitable adjustments to the quantum and price of ASOPs in case of corporate actions such as stock split, bonus etc. The holders of options granted prior to issuance of bonus shares by the Company are entitled to receive additional options in the ratio of one additional option for every two options held.
At the Ninth Annual General Meeting held on 6 September 2002, a special resolution was passed, effective 7 March 2001, wherein the total number of options to be granted under the 2000 Plan and 2001 Plan along with options already granted by the Company and outstanding under the schemes shall not at any time exceed 6.25 % (2.75 % under 2000 Plan and 3.5% under the 2001 Plan) of the total shares issued by the Company on the date (s) of grant of such options.
The options exercisable at the end of the year have become nil and hence ceases to exist.
March 31, 2011 March 31, 2010
Particulars Number of Shares
Weighted Average Exercise Price (Rs.)
Number of Shares
Weighted Average Exercise Price(Rs.)
Outstanding at the beginning of the year
‐ ‐ 5,400 123.65
Expired during the year ‐ ‐ (5,400) 123.65 Outstanding at the end of the year ‐ ‐ ‐ ‐

70
POLARIS SOFTWARE LAB LIMITED – GROUP Schedules to the Consolidated Financial Statements All amounts in Rupees lacs, unless otherwise stated
SIGNIFICANT ACCOUNTING POLICIES AND NOTES TO ACCOUNTS (Continued)
Associate Stock Option Plan 2003
The Shareholders of the Company at the EGM held on the March 12, 2004 approved an Associate Stock Option Plan (“the 2003 Plan”). The 2003 Plan provides for issuance of 3,895,500 options, convertible in to equivalent number of equity shares of Rs 5 each, to the employees including Directors. No compensation cost has been recorded as the scheme terms are fixed and the exercise price equals the market price of the underlying stock on the grant date. The market price, in accordance with the SEBI (Employee Stock Option Scheme and Employee Stock Purchase Scheme) Guidelines 1999 as amended from time to time, shall be the latest available closing price prior to the date of the meeting of the Board of Directors in which options are granted, on the stock exchange on which the shares of the Company are listed. If the Shares are listed on more than one stock exchange then the stock exchange where there is highest trading volume on the said date shall be considered. The option vests over a period of 5 years from the date of grant in a graded manner, with 20% of the options vesting each year. The exercise period shall commence from the date of vesting and expires within 36 months from the last vesting date.
A summary of the status of the 2003 plan at March 31, 2011 is presented below.
The details of exercise price for stock options outstanding at the end of the year are:
Particulars March 31, 2011 March 31, 2010
Range of exercise price 34.35‐152.95 34.35‐171.95Weighted average remaining contractual life (in years)
4.41 4.62
Weighted average fair value of options granted
97.56 75.29
March 31, 2011 March 31, 2010 Particulars
Number of Shares
Weighted Average Exercise Price (Rs.)
Number of Shares
Weighted Average Exercise Price(Rs.)
Outstanding at the beginning of the year
2,880,300 144.66 3,213,850 129.44
Granted during the year 735,000 185.57 396,000 143.51
Exercised during the year (234,450) 86.33 (284,950) 84.18
Forfeited during the year (222,600) 145.97 (244,500) 113.88
Expired during the year (176,400) 167.37 (200,100) 134.10
Outstanding at the end of the year
2,981,850 149.94 2,880,300 144.66
Exercisable at the end of the year
2,037,450 149.73 1,576,200 147.36
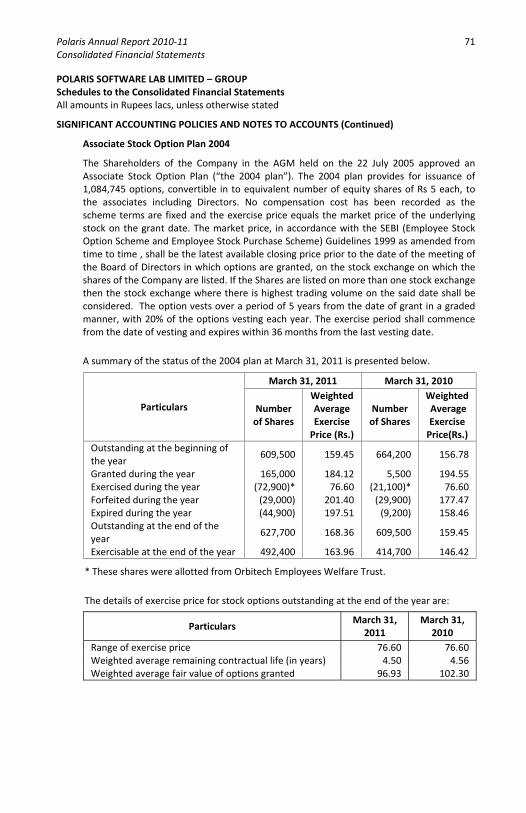
Polaris Annual Report 2010‐11 71 Consolidated Financial Statements POLARIS SOFTWARE LAB LIMITED – GROUP Schedules to the Consolidated Financial Statements All amounts in Rupees lacs, unless otherwise stated
SIGNIFICANT ACCOUNTING POLICIES AND NOTES TO ACCOUNTS (Continued)
Associate Stock Option Plan 2004
The Shareholders of the Company in the AGM held on the 22 July 2005 approved an Associate Stock Option Plan (“the 2004 plan”). The 2004 plan provides for issuance of 1,084,745 options, convertible in to equivalent number of equity shares of Rs 5 each, to the associates including Directors. No compensation cost has been recorded as the scheme terms are fixed and the exercise price equals the market price of the underlying stock on the grant date. The market price, in accordance with the SEBI (Employee Stock Option Scheme and Employee Stock Purchase Scheme) Guidelines 1999 as amended from time to time , shall be the latest available closing price prior to the date of the meeting of the Board of Directors in which options are granted, on the stock exchange on which the shares of the Company are listed. If the Shares are listed on more than one stock exchange then the stock exchange where there is highest trading volume on the said date shall be considered. The option vests over a period of 5 years from the date of grant in a graded manner, with 20% of the options vesting each year. The exercise period shall commence from the date of vesting and expires within 36 months from the last vesting date.
A summary of the status of the 2004 plan at March 31, 2011 is presented below.
Particulars
March 31, 2011 March 31, 2010
Number of Shares
Weighted Average Exercise Price (Rs.)
Number of Shares
Weighted Average Exercise Price(Rs.)
Outstanding at the beginning of the year
609,500 159.45 664,200 156.78
Granted during the year 165,000 184.12 5,500 194.55Exercised during the year (72,900)* 76.60 (21,100)* 76.60Forfeited during the year (29,000) 201.40 (29,900) 177.47Expired during the year (44,900) 197.51 (9,200) 158.46Outstanding at the end of the year
627,700 168.36 609,500 159.45
Exercisable at the end of the year 492,400 163.96 414,700 146.42
* These shares were allotted from Orbitech Employees Welfare Trust.
The details of exercise price for stock options outstanding at the end of the year are:
Particulars March 31,
2011 March 31,
2010 Range of exercise price 76.60 76.60Weighted average remaining contractual life (in years) 4.50 4.56Weighted average fair value of options granted 96.93 102.30

72
POLARIS SOFTWARE LAB LIMITED – GROUP Schedules to the Consolidated Financial Statements All amounts in Rupees lacs, unless otherwise stated
SIGNIFICANT ACCOUNTING POLICIES AND NOTES TO ACCOUNTS (Continued)
Proforma Disclosure
In accordance with SEBI (Employee Stock Option Scheme and Employee Stock Purchase Scheme) Guidelines, 1999, had the compensation cost for associate stock option plans been recognized based on the fair value at the date of grant in accordance with Black‐Scholes model, the proforma amounts of the Group’s net profit and earnings per share would have been as follows:
Particulars Year ended
March 31, 2011 Year ended
March 31, 2010 Profit after tax ‐ as reported 20,245.97 15,284.24‐ proforma profit 20,105.38 15,216.00Earnings Per Share (in Rs.)Basic ‐ As reported 20.43 15.48 ‐ Pro forma 20.29 15.41Diluted ‐ As reported 20.28 15.34 ‐ Pro forma 20.14 15.27
The fair value of option as at March 31, 2011 is Rs 140.59 (March 31, 2010: Rs 68.24)
The fair value of options was estimated at the date of grant using the Black‐Scholes model with the following assumptions:
Particulars April to March 2011 April to March 2010
Risk‐free interest rate 7.99% 7.08%
Expected life 2.5 to 6.5 years 2.5 to 6.5 years
Expected volatility 63.06% 67.32%
Expected dividend yield 1.37% 1.35%
6. Segment Reporting
The Group’s operations predominantly relate to providing IT services and IT‐enabled services, delivered to customers operating in various industry segments globally. Accordingly, IT service revenues represented along industry classes comprise the primary basis of segmental information set out in these financial statements. Secondary segmental reporting is performed on the basis of the geographical location of customers.
The accounting policies consistently used in the preparation of the financial statements are also applied to record revenue and expenditure in individual segments.
Business (primary) segments of the Group are:
a) Banking and financial services ; and
b) Emerging verticals

Polaris Annual Report 2010‐11 73 Consolidated Financial Statements POLARIS SOFTWARE LAB LIMITED – GROUP Schedules to the Consolidated Financial Statements All amounts in Rupees lacs, unless otherwise stated
SIGNIFICANT ACCOUNTING POLICIES AND NOTES TO ACCOUNTS (Continued)
Revenue and direct expenses in relation to segments are categorized based on items that are individually identifiable to that segment, while other costs, wherever allocable, is apportioned to the segments on an appropriate basis. Certain expenses are not specifically allocable to individual segments as the underlying services are used interchangeably. The Group believes that it is not practicable to provide segment disclosures relating to such expenses, and accordingly such expenses are separately disclosed as ‘unallocated’ and directly charged against total income.
Total assets used in the Group’s business or liabilities contracted have not been identified to any of the reportable segments, as the fixed assets and services are used interchangeably between segments. The Group believes that it is currently not practicable to provide segment disclosures relating to total assets and liabilities since a meaningful segregation of the available data is onerous.
Customer relationships are driven based on the location of the respective client. The geographical segments comprise:
a) United States of America b) Europe c) Asia Pacific d) India and Middle East.
Primary segment information
Particulars Year ended
March 31, 2011 Year ended
March 31, 2010
Segment revenues
Banking and financial services 143,438.11 120,882.48Emerging verticals 15,195.03 14,493.14 158,633.14 135,375.62 Segment Profit before finance charges, unallocable expenses and tax
Banking and financial services 48,780.84 41,033.78Emerging verticals 5,171.10 4,293.24 53,951.94 45,327.02Finance charges (114.87) (91.09)Other unallocable expenditure net of unallocable income (30,021.16) (27,356.81) Profit before taxation 23,815.91 17,879.12Income taxes including deferred tax, fringe benefit tax and net of MAT credit entitlement (3,588.10) (2,553.27)
Profit after taxation 20,227.81 15,325.85

74
POLARIS SOFTWARE LAB LIMITED – GROUP Schedules to the Consolidated Financial Statements All amounts in Rupees lacs, unless otherwise stated
SIGNIFICANT ACCOUNTING POLICIES AND NOTES TO ACCOUNTS (Continued)
Secondary segment information
Region Year ended
March 31, 2011 Year ended
March 31, 2010 Segment revenuesUnited States of America 87,034.83 63,947.92Europe 38,884.87 41,366.45Asia Pacific 13,284.47 17,514.25India and Middle East 19,428.97 12,547.00 158,633.14 135,375.62
Revenues by geographic area are based on the geographic location of the customer.
7. Earnings per Share (“EPS”)
Reconciliation of basic and diluted shares used in computing EPS:
Particulars Year ended
March 31, 2011 Year ended
March 31, 2010
Weighted average number of equity shares outstanding during the year‐Basic 99,100,729
98,765,014
Add: Effect of dilutive issue of stock options to be converted
724,391 902,772
Weighted average number of equity shares outstanding during the year‐Diluted
99,825,120
99,667,786
Net profit for calculation of Basic and diluted EPS 20,245.97 15,284.24Basic earnings per share 20.43 15.48Diluted earnings per share 20.28 15.34
8. Related party transactions List of related parties:
Associates 1. NMSWorks Software Private Limited (‘NMS’) 2. Adrenalin eSystems Limited (‘Adrenalin eSystems’)
Others Enterprises that directly, or indirectly through one or more intermediaries, control the Group and enterprise of which the Group is an associate
1. Citi Bank and its branches (Upto July 23, 2010) 2. Polaris Holdings Private Limited
3. Orbitech Limited
4. Orbitech Employees welfare trust
(a) Enterprises that have a member of Key Management in common with that of the Group Ullas Trust.
Key Management Personnel Mr.Arun Jain, Chairman & Managing Director
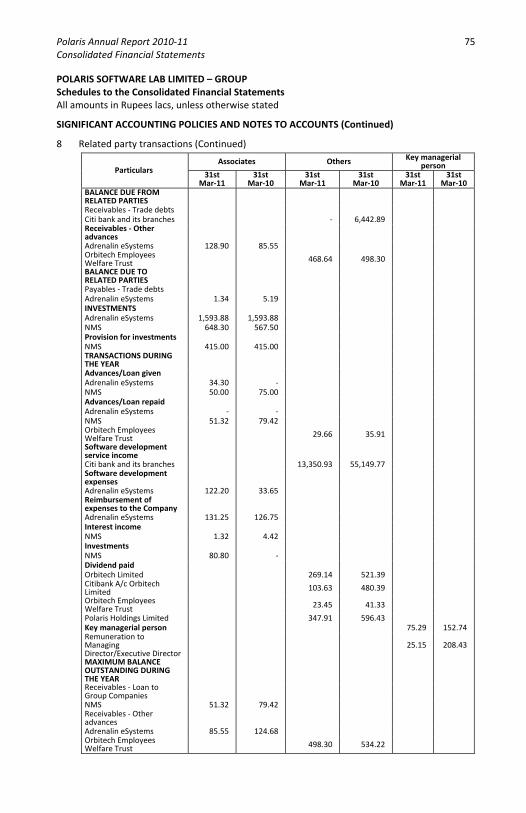
Polaris Annual Report 2010‐11 75 Consolidated Financial Statements POLARIS SOFTWARE LAB LIMITED – GROUP Schedules to the Consolidated Financial Statements All amounts in Rupees lacs, unless otherwise stated
SIGNIFICANT ACCOUNTING POLICIES AND NOTES TO ACCOUNTS (Continued)
8 Related party transactions (Continued)
Particulars Associates Others Key managerial
person31st
Mar‐1131st
Mar‐1031st
Mar‐11 31st
Mar‐1031st
Mar‐1131st
Mar‐10BALANCE DUE FROM RELATED PARTIES
Receivables ‐ Trade debtsCiti bank and its branches ‐ 6,442.89 Receivables ‐ Other advances
Adrenalin eSystems 128.90 85.55 Orbitech Employees Welfare Trust 468.64 498.30
BALANCE DUE TO RELATED PARTIES
Payables ‐ Trade debtsAdrenalin eSystems 1.34 5.19 INVESTMENTS Adrenalin eSystems 1,593.88 1,593.88 NMS 648.30 567.50 Provision for investmentsNMS 415.00 415.00 TRANSACTIONS DURINGTHE YEAR
Advances/Loan given Adrenalin eSystems 34.30 ‐ NMS 50.00 75.00 Advances/Loan repaidAdrenalin eSystems ‐ ‐ NMS 51.32 79.42 Orbitech Employees Welfare Trust 29.66 35.91
Software development service income
Citi bank and its branches 13,350.93 55,149.77 Software development expenses
Adrenalin eSystems 122.20 33.65 Reimbursement of expenses to the Company
Adrenalin eSystems 131.25 126.75 Interest income NMS 1.32 4.42 Investments NMS 80.80 ‐ Dividend paid Orbitech Limited 269.14 521.39 Citibank A/c Orbitech Limited 103.63 480.39
Orbitech Employees Welfare Trust 23.45 41.33
Polaris Holdings Limited 347.91 596.43 Key managerial person 75.29 152.74 Remuneration to Managing Director/Executive Director
25.15 208.43
MAXIMUM BALANCE OUTSTANDING DURING THE YEAR
Receivables ‐ Loan to Group Companies
NMS 51.32 79.42 Receivables ‐ Other advances
Adrenalin eSystems 85.55 124.68 Orbitech Employees Welfare Trust 498.30 534.22

76
POLARIS SOFTWARE LAB LIMITED – GROUP Schedules to the Consolidated Financial Statements All amounts in Rupees lacs, unless otherwise stated
SIGNIFICANT ACCOUNTING POLICIES AND NOTES TO ACCOUNTS (Continued)
9. Investments in Associates and subsidiaries
a) The Company's equity ownership interest in Adrenalin eSystems Limited ("ASL") is 40.25% as at March 31, 2011. ASL is primarily engaged in the business of providing specific solutions relating to Human Relations suite of software solutions. The accumulated losses to the extent of Rs.2,941.10 as per the unaudited financial statements of ASL as on March 31, 2011 are on account of initial / start‐up stage of operations. ASL has earned nominal profits in the current year. As per the valuation of ASL as at March 31, 2011 carried out by the independent valuation expert, there is no diminution in the carrying value of investments. Accordingly, management believes that there is no other than temporary diminution in the value of its investments in the ASL and hence it is stated at cost.
The Consolidated Financial Statements include Rs 833.88 as share of accumulated losses which is accounted under equity method as per AS 23 – accounting for investment in associates. The financial Statements of Adrenalin are yet to be audited. In the opinion of the management, the impact that may arise upon completion of the audit of the financial statements of Adrenalin, if any, will not be material.
b) The Company’s equity ownership interest in NMSWorks Software Private Limited (“NMS”) is 39.59% as at March 31, 2011. NMS is primarily engaged in the business of designing network management in Telecommunication and Internet Services. The Company has made substantial profits of Rs 363.04 during the year. The orders secured during the year have reduced the accumulated losses. NMS had accumulated losses aggregating to Rs 180.46 as per the unaudited financial statements of NMS as on March 31, 2011. Accordingly, the Company had determined and recorded a provision of Rs 415, in the earlier years, for other than temporary diminution in the value of its equity investment in NMS.
c) The Company has acquired equity interest in Laser Soft Infosystems Limited (‘Laser Soft’), a leading Banking software services company specializing in serving the unique needs of India & emerging markets with effect from November 16, 2009. The total consideration for acquisition is Rs. 5,201.05 subject to price adjustment conditions based on future financial performance of Laser Soft over the next two years. The Company has paid a sum of Rs 4,322.94 for 94.29% equity interest as at March 31, 2011. The Company has accrued for the consideration payable for the balance equity shares, as the management expects the payment is probable in accordance with the term of the agreement and a reasonable estimate of the amount can be made as at March 31, 2011.
d) The Company has acquired 51 % equity stake in Indigo TX Software Private Limited (‘Indigo’), a SAAS Software developer for Rs 800.75 on May 10, 2010. The Company has the obligation to acquire the balance equity at a price to be determined based on future financial performance over a period of 6 years. The excess of purchase consideration over the net assets of Indigo TX Software Private Limited to the extent Rs. 517.31 is recognized as goodwill. The profit and loss account for the year includes revenue of Rs. 339.43 of Indigo TX and loss of Rs 46.62 of Indigo TX.

Polaris Annual Report 2010‐11 77 Consolidated Financial Statements POLARIS SOFTWARE LAB LIMITED – GROUP Schedules to the Consolidated Financial Statements All amounts in Rupees lacs, unless otherwise stated
SIGNIFICANT ACCOUNTING POLICIES AND NOTES TO ACCOUNTS (Continued)
e) The Company has acquired 100% equity in SFL Properties Private Ltd (‘SFL’). The total consideration for acquisition is Rs 984.53. The excess of purchase consideration over the net assets of SFL Properties Private Limited to the extent of Rs. 865.56 is recognized as goodwill.
f) Laser Soft Infosystems Limited and SFL Properties Private Limited, subsidiaries of the company are proposed to be merged with the company with effect from April 1, 2011.
10. Following are the aggregate amounts incurred on certain specific expenses that are required to be disclosed under Schedule VI to the Companies Act, 1956.
Particulars Year ended
March 31, 2011 Year ended
March 31, 2010
Salaries and bonus including overseas staff expenses 105,731.90 88,461.04
Contribution to provident and other funds 2,677.43 2,113.61
Total 108,409.33 90,574.65
11. Derivative instruments
The Group uses foreign currency forward contracts to hedge its risks associated with foreign currency fluctuations relating to certain firm commitments and forecasted revenue receivable transactions. The Group does not use forward contracts for speculative purposes.
The following are the outstanding Forward Exchange Contracts entered into by the Group
Particulars As at
March 31, 2011 As at
March 31, 2010 Number of contracts 97 108USD Equivalent 1,920 1,940INR Equivalent 94,515.63 93,906.93

78
POLARIS SOFTWARE LAB LIMITED – GROUP Schedules to the Consolidated Financial Statements All amounts in Rupees lacs, unless otherwise stated
SIGNIFICANT ACCOUNTING POLICIES AND NOTES TO ACCOUNTS (Continued)
12. Unhedged Foreign Currency Exposure
The year‐ end foreign currency exposures that have not been hedged by a derivative instrument or otherwise are given below:
Particulars Currency
2011 2010Amount in Foreign currency
INR Equivalent
Amount in Foreign currency
INR Equivalent
Amounts receivable in foreign currency
USD 291.21 12,988.07 251.52 11,271.93
EUR 201.39 12,764.01 14.79 893.81
GBP 6.03 433.23 2.05 139.19
AUD 0.77 35.32 1.22 50.39
CAD 9.13 419.94 8.38 370.37
CNY 1.17 8.10 0.17 1.12
SGD 1.96 69.25 1.94 62.22
CHF 7.18 350.23 5.55 235.03
AED 1.57 19.07 ‐ ‐
Amounts payable in foreign currency
USD 97.75 4,359.76 82.04 3,634.64
GBP 12.95 929.69 25.01 1,468.81
EUR 3.45 218.84 2.18 132.03
CHF 0.09 4.45 0.03 1.10
JPY 139.72 75.45 48.55 23.30
13. Previous year figures have been regrouped/reclassified, wherever necessary, to conform to current year’s presentation.
As per our report of even date For S.R.BATLIBOI & ASSOCIATES Firm Registration number: 101049W Chartered Accountants
For and on behalf of the Board of Directors of Polaris Software Lab Limited
per S. Balasubrahmanyam Partner Membership No 053315 Chennai April 28, 2011
Arun Jain Chairman & Managing Director
R. Srikanth President & Chief Financial Officer Chennai April 28, 2011
B. Muthusubramanian Senior Vice President – Finance & Secretary
R.C. Bhargava Director
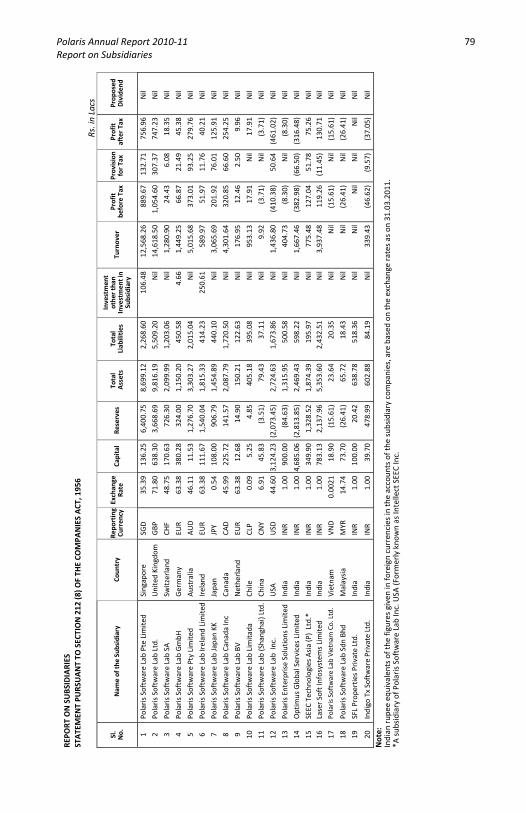
Polaris Annual Report 2010‐11 79 Report on Subsidiaries
REPO
RT ON SUBS
IDIARIES
STATEMEN
T PU
RSUANT TO
SEC
TION 212
(8) O
F TH
E CO
MPA
NIES ACT
, 195
6
Rs. in Lacs
Prop
osed
Dividen
d
Nil
Nil
Nil
Nil
Nil
Nil
Nil
Nil
Nil
Nil
Nil
Nil
Nil
Nil
Nil
Nil
Nil
Nil
Nil
Nil
Note:
Indian
rup
ee equ
ivalen
ts of the
figures given in fo
reign curren
cies in
the accoun
ts of the
sub
sidiary companies, are based
on the exchange ra
tes as on 31
.03.20
11.
*A sub
sidiary of Polaris Softw
are Lab Inc. USA
(Formerly kno
wn as Intellect SEEC Inc.
Profit
after Tax
756.96
747.23
18.35
45.38
279.76
40.21
125.91
254.25
9.96
17.91
(3.71)
(461
.02)
(8.30)
(316
.48)
75.26
130.71
(15.61
)
(26.41
)
Nil
(37.05
)
Provision
for Tax
132.71
307.37
6.08
21.49
93.25
11.76
76.01
66.60
2.50
Nil
Nil
50.64
Nil
(66.50
)
51.78
(11.45
)
Nil
Nil
Nil
(9.57)
Profit
before Tax
889.67
1,05
4.60
24.43
66.87
373.01
51.97
201.92
320.85
12.46
17.91
(3.71)
(410
.38)
(8.30)
(382
.98)
127.04
11
9.26
(15.61
)
(26.41
)
Nil
(46.62
)
Turnover
12,568.26
14,618.50
1,28
0.90
1,44
9.25
5,01
5.68
589.97
3,06
5.69
4,30
1.64
176.95
953.13
9.92
1,43
6.80
404.73
1,66
7.46
775.48
3,93
7.48
Nil
Nil
Nil
339.43
Investmen
t othe
r than
Investmen
t in
Subsidiary
106.48
Nil
Nil
4.66
Nil
250.61
Nil
Nil
Nil
Nil
Nil
Nil
Nil
Nil
Nil
Nil
Nil
Nil
Nil
Nil
Total
Liab
ilities
2,26
8.60
5,50
9.20
1,20
3.06
450.58
2,01
5.04
414.23
440.10
1,72
0.50
122.63
395.08
37.11
1,67
3.86
500.58
598.22
195.97
2,43
2.51
20.35
18.43
518.36
84.19
Total
Assets
8,69
9.12
9,81
6.19
2,09
9.99
1,15
0.20
3,30
3.27
1,81
5.33
1,45
4.89
2,08
7.79
150.21
405.18
79.43
2,72
4.63
1,31
5.95
2,46
9.43
1,87
4.39
5,35
3.60
23.64
65.72
638.78
602.88
Reserves
6,40
0.75
3,66
8.69
726.30
324.00
1,27
6.70
1,54
0.04
906.79
141.57
14.90
4.85
(3.51)
(2,073
.45)
(84.63
)
(2,813
.85)
1,32
8.52
2,13
7.96
(15.61
)
(26.41
)
20.42
478.99
Capital
136.25
638.30
170.63
380.28
11.53
111.67
108.00
225.72
12.68
5.25
45.83
3,12
4.23
900.00
4,68
5.06
349.90
78
3.13
18.90
73.70
100.00
39.70
Exchan
ge
Rate
35.39
71.80
48.75
63.38
46.11
63.38
0.54
45.99
63.38
0.09
6.91
44.60
1.00
1.00
1.00
1.00
0.00
21
14.74
1.00
1.00
Repo
rting
Curren
cy
SGD
GBP
CHF
EUR
AUD
EUR
JPY
CAD
EUR
CLP
CNY
USD
INR
INR
INR
INR
VND
MYR
INR
INR
Coun
try
Singapo
re
United Kingdo
m
Switzerland
Germany
Australia
Ireland
Japan
Canada
Nethe
rland
Chile
China
USA
Ind
ia
Ind
ia
Ind
ia
Ind
ia
Vietnam
Malaysia
Ind
ia
Ind
ia
Nam
e of the
Sub
sidiary
Polaris Softw
are Lab Pte Limite
d
Polaris Softw
are Lab Ltd.
Polaris Softw
are Lab SA
Polaris Softw
are Lab GmbH
Polaris Softw
are Pty Limite
d
Polaris Softw
are Lab Ireland Limite
d
Polaris Softw
are Lab Japan KK
Polaris Softw
are Lab Canada
Inc
Polaris Softw
are Lab BV
Polaris Softw
are Lab Limita
da
Polaris Softw
are Lab (Shanghai) Ltd.
Polaris Softw
are Lab Inc.
Polaris Enterprise Solutio
ns Lim
ited
Optim
us Global Services Limite
d
SEEC Techno
logies Asia (P) Ltd.*
Laser Soft Infosystems Limite
d Polaris Softw
are Lab Vietnam Co. Ltd.
Polaris Softw
are Lab Sdn Bh
d
SFL Prope
rties Private Ltd.
Indigo
Tx Software Private Ltd.
Sl.
No.
1 2 3 4 5 6 7 8 9 10
11
12
13
14
15
16
17
18
19
20

80
This page has been intentionally left blank

Polaris Annual Report 2010‐11 81 Management Discussion & Analysis
MANAGEMENT DISCUSSION & ANALYSIS Forming part of the Financial Statements for the year ended March 31, 2011
Polaris Annual Report 2010‐11

82
This page has been intentionally left blank
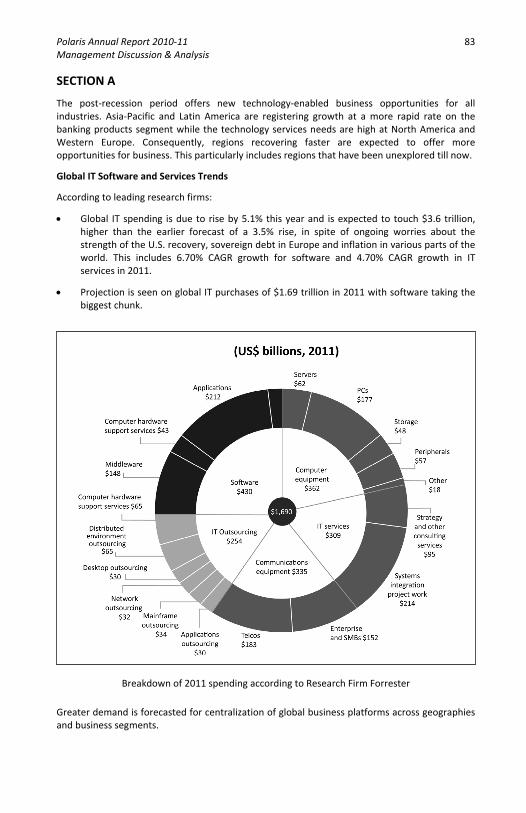
Polaris Annual Report 2010‐11 83 Management Discussion & Analysis
SECTION A
The post‐recession period offers new technology‐enabled business opportunities for all industries. Asia‐Pacific and Latin America are registering growth at a more rapid rate on the banking products segment while the technology services needs are high at North America and Western Europe. Consequently, regions recovering faster are expected to offer more opportunities for business. This particularly includes regions that have been unexplored till now.
Global IT Software and Services Trends
According to leading research firms:
• Global IT spending is due to rise by 5.1% this year and is expected to touch $3.6 trillion, higher than the earlier forecast of a 3.5% rise, in spite of ongoing worries about the strength of the U.S. recovery, sovereign debt in Europe and inflation in various parts of the world. This includes 6.70% CAGR growth for software and 4.70% CAGR growth in IT services in 2011.
• Projection is seen on global IT purchases of $1.69 trillion in 2011 with software taking the biggest chunk.
Breakdown of 2011 spending according to Research Firm Forrester
Greater demand is forecasted for centralization of global business platforms across geographies and business segments.

84
The Global Financial Technology Sector
Global information technology spending by financial services institutions is expected to reach US$363.8 billion in 2011, an increase of 3.7% over 2010. This figure is substantially higher than the lackluster 2.5% growth increase experienced in 2010. Growth rates are starting to climb across most regions and IT products and services should grow to US$393 billion by 2013, a 3.9% CAGR from 2011 to 2013.
While large banks continue to differ in their overall attitudes toward IT and business process outsourcing, buy versus build IT decisions, and the use of Software as a Service (SaaS), their comfort with IT outsourcing is growing. Nearly half of large financial institutions (46%) favor software from vendors, while a minority (16%) prefers to build technology in‐house.
Early in 2010‐2011, global financial companies have evinced a growing interest in cloud computing. The primary driver of this phenomenon is due to the financial advantages of not having to invest in buying IT systems and software, but rather on using 'Software as a Service'. This is expected to incur huge savings.
The US & European Financial Technology Sector
Shrugging off the effects of 2008 and 2009, Financial Services Institutions have been recording growth in the US and European markets. IT spending in the US rose by 6% last year and should grow by another 5% in 2011. Of the global IT investments by financial services institutions, firms in North America and Europe account for 34.2% and 33.6%, respectively.
The decisions taken to optimise on verticals that focus on key growth areas and geographies have helped these financial institutions leverage their strengths and register increased revenues. European and North American financial institutions currently spend almost equal amount on IT. North America will experience climbing growth rates through 2012 while Europe will struggle.
The US and European financial technology market offers a complex picture as on one end these two regions are technologically advanced, but on the other end they rely heavily on legacy systems that are unable to ramp up to meet current and future requirements. Over the years Financial Services Institutions have developed multiple and sliced customized solutions. But these technologies, more often than not, have lead to duplication of effort and cannot offer a centralized system. Thus, there is a great need to revamp the technologies of the financial services industry of this region to meet global requirements.
The Emerging Markets Financial Technology Sector
Emerging markets continue to show promise and the IT spend across emerging markets viz., Latin America, APAC, Middle East, Africa and Eastern Europe. The Latin America and Africa markets are expected to contribute 6% while Asia Pacific region is expected to contribute 26%. The emerging markets are primarily product markets and this directly fits in to the Polaris IntellectTM strategy.
Firms in Asia‐Pacific account for 26.4%, and Latin America and Africa account for the remaining 5.8%. Among all regions, the fastest growth will be seen in financial services institutions in Asia‐Pacific, with IT spending increasing at 6.2% in 2011 and a CAGR of 6.2% from 2011 to 2013. Growth will continue to rise in this region, and total spending in Asia‐Pacific is expected to reach US$108.2 billion in 2013. Latin America and Africa are expected to grow at a relatively modest rate (3.7%). Spending in this region will grow to US$21.2 billion in 2011.
Though late comers, financial services institutions in these regions are often better than their 'technologically advanced' competitors in the US and Western Europe due to the fact that they are adopting the latest technologies. An additional factor is the growing economy.

Polaris Annual Report 2010‐11 85 Management Discussion & Analysis Polaris Differentiator
Polaris continues to focus on bringing efficiency to our customers. This is made possible through our methodologies, frameworks and commitment to deliver as per our D‐3 OTIF standards. Our ability to demonstrate mastery on the banking, financial services and insurance business domain has been consistently noticed and appreciated by our customers. Our direct presence across 20 countries in 6 continents gives us reach to our global, regional and country‐specific customers, and very importantly keeps us connected with current happenings in the financial world across the globe. This knowledge can be quickly translated to business benefit for our customers.
During Lakshya 2010, (the annual direction setting forum), Polaris came out with an Integrated Enterprise Value Creation model around six dimensions called the Enterprise Value Cuboid. The value dimensions are Customer Capital, Human Capital, Execution Capital, Intellectual Property Capital, Brand Capital and Finance Capital.
Customer Capital: The pillars of our customer capital are satisfied customers, repeat business and increased customer engagement. Starting our journey, Polaris 1.0, with one customer in India, today in era of Polaris 3.2, we are partners with 9 out of the Top 10 Global Banks, 7 out of the Top 10 Insurance companies and a total of over 200+ satisfied customers worldwide. Predominantly positioned as specialists in Financial Technologies, Polaris is getting recognized for driving programs towards unlocking efficiencies and providing cutting edge business solutions by leveraging technology.
Human Capital: The competence of Polaris' 10,974 associates is the key in making it the Market Leader in Financial Technology. Hence, we keep investing, both in terms of money and time for their overall development. In this regard, Polaris has established the School of Financial Technology for domain‐specific training and its arm, Nalanda for all job‐related and personality development training.
o School of Financial Technology: Continuous training and constant skill upgradation of human resources assumes critical importance in the absorption of new technologies. With the banking sector increasing in scale and complexity, there is a constant demand for trained manpower and a new genre of management professionals to meet the emerging challenges. The School of Financial Technology, located at Hyderabad, offers Certificate courses at both the ‘primer’ and ‘practitioner’ levels, Executive fast‐track modules in Retail Banking, Core Banking, Investment Banking and Corporate Banking as well as Customised Enterprise Training Workshops. The courses are offered to Polaris' associates and to the company’s key G8 accounts.
o It aims at generating over 1,000 highly skilled ‘techno‐bankers’ every year for Polaris’ growing needs to service its Top Global 50 accounts.
o Nalanda is a part of the School of Financial Technology and can offer over 60,000 man‐days of training. With a competency based career focus, learning and development is aligned with key business goals along with the creation of a common culture and value system across the organization. Strategy focused e‐learning programs are also part of this corporate entity‐learn at your own pace, time and place.
o The training programs at Nalanda ensure that associates not only enhance their personal skills, but technical skills too, thereby creating a cross‐utilization associate structure. The induction program for campus recruits is also conceptualized and put together by Nalanda.
o Polaris is certified by the American Society for Training & Development (ASTD), the world’s largest association dedicated to workplace learning and performance professionals as a ‘Champion of Learning’ for its contribution towards imparting learning programs among employees throughout the organization.

86
Execution Capital: Absolute execution has always been the key to our success and nothing describes it better than the Polaris Prism. Whether it is the proprietary Banking Knowledge Shelving and Wiring (KSW) framework (L0) that has over 5000 business processes, and over one hundred thousand business cases documented in the areas of Core Banking, Lending and Mortgages, Credit card, Private banking, Brokerage, Asset Management, Cash Management, Liquidity Management, Trade Finance and Treasury spaces; COPARIS – a stringent proprietary measure used to ensure execution or D‐3 OTIF representing flawless delivery in full before scheduled date and time, everything integrates to become the DNA of Polaris' extreme execution potential.
Intellectual Property Capital: Encapsulation of the best practices into a cutting edge and world class product suite – the all encompassing suite for Banking, Financial Services and Insurance space – what we call as Global Universal Banking (GUB). Polaris' products and platforms are branded as Intellect™, a 'designed for SOA' product platform that was launched way back in 2005.
Intellect™ brings distinctive advantage to Polaris. It opens up the technology markets beyond the traditional developed markets of US and Europe and provides a non‐linear element to the business growth. The Intellect™ suite has been rolled out in banks present in over 30 countries.
The company’s IT department was recognised for its high performance by several forums. In addition to bagging the ‘Customer Appreciation Best Practise’ for IT Policies Implementation and Controls, the department and department heads also received the following accolades.
• “Agile Infrastructure Implementation” – CIO Forum
• Best 100 CIOs for the Fourth Year & CIO Hall of fame
• Great Mind Challenge for business Awards – IBM
• Customer Appreciation Best Practice ‐ For IT Policies implementation & Controls
Brand Capital: Perceptions are often built up by hard facts, rather than impressions. Our presence at key industry events such as Sibos and Acord Loma among others have given us high visibility in the marketplace and contributed significantly to the funnel.
Polaris' unique account‐based marketing approach is a research‐based connect with key accounts. Our in‐house team of experts supports the work that account managers are doing by finding new and improved ways to bring value to customers by leveraging our product‐based solutions. To this end we have also developed a proprietary Touch Point Index to track our engagement with our key accounts. However, our strongest brand ambassadors remain our 10,500+ team of associates and our satisfied customers.
Finance Capital: The road ahead looks promising. With an affirmative growth in global economy, the optimisation of strengths by global financial institutions opens up fantastic opportunities. In this new scenario, the Polaris leadership team has a clear direction to lead the organization to its goals. Within the Global Top 20 banking and insurance accounts, we have a closer focus on Global Top 8 accounts. Many strategies are being rolled out to increase revenues from the Global Top 8 accounts. Such strategies span across areas of addressing our customer’s immediate requirements, mid‐term requirements and long term vision.
At this juncture, Polaris is happy to state that the net profit has registered a YoY growth of 32.46%.
Green Initiatives
The company has undertaken the following initiatives towards Conservation of Energy.
(a) Virtualization of servers and Server Consolidation
(b) Introduction of Low Power desktops
(c) Replacement of CRT monitors with LCD monitors

Polaris Annual Report 2010‐11 87 Management Discussion & Analysis
SECTION B
Financial Position
Highlights
• Revenue registered an YoY growth of 17.18% during the FY11
• Earnings per share increased to Rs.20.43 in FY11 ( Rs. 15.48 in FY10)
• The book value per share increased to Rs.104.21 in FY11 (Rs. 88.29 in FY10)
• Based on the NSE prices, market capitalization was Rs.187,331 Lacs as on March 31, 2011 (Rs 162,197 Lacs in FY10)
• Dividend paid/recommended during the year stands at 90% (70% in FY10)
• Registering a YoY growth of 32.46%, the Net Profit during the year is Rs.20,245.97 Lacs (Rs.15,284.24 Lacs in FY10)
Performance Trend
Over the years, Polaris had set predictable Profitable growth / revenue, with single minded focus on taking leadership in the Financial Technology space. The Sales funnel of the company has grown, reflecting emphatic positioning as a Global Financial Technology leader.
In its journey of Business progress and excellence, Polaris has created significant wealth for all its shareholders.
Value Addition Since FY 2008
Earnings Per Share
Earnings per share saw an increase of 175% from Rs.7.42 (FY 08) to Rs.20.43 (FY 11)
7.42
13.2515.48
20.43
0
5
10
15
20
25
FY 08 FY 09 FY 10 FY 11
EPS (Rs)
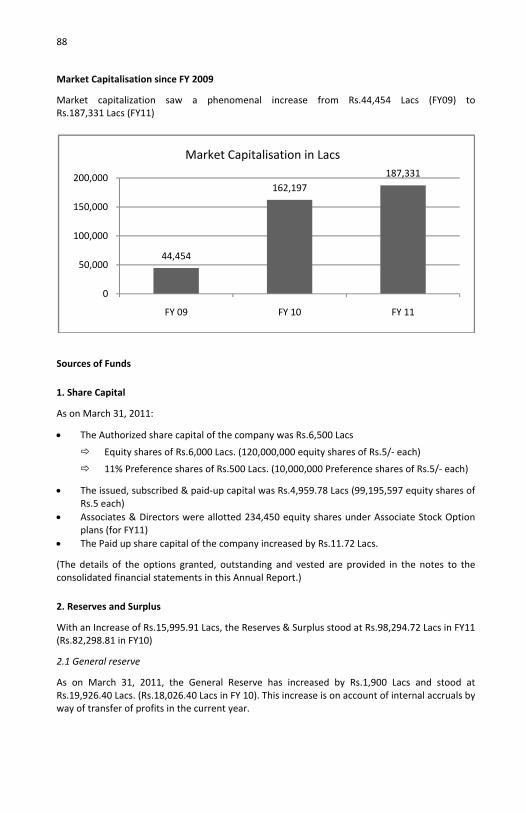
88
Market Capitalisation since FY 2009
Market capitalization saw a phenomenal increase from Rs.44,454 Lacs (FY09) to Rs.187,331 Lacs (FY11)
Sources of Funds
1. Share Capital
As on March 31, 2011:
• The Authorized share capital of the company was Rs.6,500 Lacs
Equity shares of Rs.6,000 Lacs. (120,000,000 equity shares of Rs.5/‐ each)
11% Preference shares of Rs.500 Lacs. (10,000,000 Preference shares of Rs.5/‐ each)
• The issued, subscribed & paid‐up capital was Rs.4,959.78 Lacs (99,195,597 equity shares of Rs.5 each)
• Associates & Directors were allotted 234,450 equity shares under Associate Stock Option plans (for FY11)
• The Paid up share capital of the company increased by Rs.11.72 Lacs.
(The details of the options granted, outstanding and vested are provided in the notes to the consolidated financial statements in this Annual Report.)
2. Reserves and Surplus
With an Increase of Rs.15,995.91 Lacs, the Reserves & Surplus stood at Rs.98,294.72 Lacs in FY11 (Rs.82,298.81 in FY10)
2.1 General reserve
As on March 31, 2011, the General Reserve has increased by Rs.1,900 Lacs and stood at Rs.19,926.40 Lacs. (Rs.18,026.40 Lacs in FY 10). This increase is on account of internal accruals by way of transfer of profits in the current year.
44,454
162,197187,331
0
50,000
100,000
150,000
200,000
FY 09 FY 10 FY 11
Market Capitalisation in Lacs
Polaris Annual Report 2010‐11 89 Management Discussion & Analysis 2.2 Foreign currency translation reserve
The balance of foreign currency translation reserve increased by Rs.741.93 Lacs and stood at Rs.778.36 Lacs as on March 31, 2011. (Rs.36.43 Lacs in FY 10). The raise is on account of translation of non‐integral overseas subsidiaries and branches into reporting currency in line with Accounting Standard 11 of ICAI.
2.3 Securities premium account
With an increase of Rs.190.68 Lacs, the Securities premium account stood at Rs.18,916.27 Lacs as on March 31,2011. (Rs.18,725.59 Lacs in FY10). The raise is on account of premium on the issue of shares during the year 2010‐11 under ASOP schemes.
2.4 Profit and loss account
As of March 31, 2011:
• The balance retained in the profit and loss account increased by Rs.13,163.30 Lacs and stood at Rs.58,673.69 Lacs (Rs.45,510.39 Lacs in FY10)
• Rs. 13,163.30 Lacs is recorded as the internal accrual after providing for
Proposed dividend of Rs. 4,465.02 Lacs
Dividend tax of Rs.717.65 Lacs.
• Increasing by Rs.1,131.57 Lacs, the total amount of profits appropriated to dividend including dividend tax stood at Rs.5,182.67 Lacs (Rs.4,051.10 Lacs in FY10)
2.5 Shareholder funds
As of March 31, 2011:
• The total shareholder funds increased by Rs.16,007.63 Lacs and stood at Rs.103,254.50 Lacs (Rs.87,246.87 Lacs in FY 10).
• The book value per share increased by Rs.15.92 and stood at Rs. 104.21 (Rs.88.29 in FY 10)
3. Secured Loans
Laser Soft Infosystems Ltd and Indigo TX Software Private Ltd, the subsidiaries of our company availed Rs.572.04 Lacs as working capital facilities from scheduled banks.
Application of Funds
4. Fixed Assets
4.1 Capital expenditure
The capital expenditure for FY 11 is Rs.9,413.90 Lacs (Rs.3,466.56 Lacs in FY 10)
4.2 Additions to fixed assets
• Additions of Rs 4,145 Lacs to our gross block comprise the following:
Rs.3.33 Lacs for land & buildings
Rs.3,251.09 Lacs for plant, machinery & furniture
Rs.22.45 Lacs for intangible assets
Rs.868.13 Lacs for vehicles

90
• Increase in Capital Work‐in‐progress of Rs.5,268.90 Lacs has contributed to the
construction / improvement of facilities getting ready for the use in FY 12 and beyond
• Fixed assets acquired on acquisition of subsidiaries (Indigo TX Software Private Ltd / SFL Properties Private Ltd) during the year amounts to Rs.1,298.30 Lacs and corresponding accumulated depreciation of Rs.638.41Lacs leaving a net book value of Rs.659.89 Lacs.
• Construction of SIPCOT Project, Hyderabad, Mumbai and Thane Units add momentum for the year.
5. Goodwill on consolidation
As a result of acquisition of Indigo TX Software Private Ltd and SFL Properties Private Ltd during the year, the company has recognized goodwill of Rs.1,382.88 Lacs. The Excess of consideration paid over the net asset value acquired has been recognized as goodwill in accordance with Accounting Standard (AS) 21 on consolidated financial statements.
6. Strategic Business Acquisition
6.1 Inorganic Growth Strategy
Growth is often accelerated through increased innovation, to compete and align with those companies that are developing the innovative technology or have an access to customer base.
The Company is looking forward to grow inorganically given the right M&A candidates that would either help us build depth, breadth and scale in our capabilities.
6.1.1 Indigo TX Software Private Ltd
51% equity stake has been acquired in Indigo TX Software Private Limited, a SaaS Software developer for Rs.800.75 on May 10, 2010. The company’s platform Go Tx, is an enterprise brokerage solution for the securities market on a pay per use model catering to half a million customers. This Solution allows brokers the luxury of single platform that facilitates trading multiple instruments such as equities, derivatives, mutual funds, commodities and currency, providing access to multiple markets besides integrating the front, middle and back office functions.
6.1.2 SFL Properties Private Ltd
The Total consideration being Rs.1,502.72 Lacs, the entire equity interests in SFL Properties Private Ltd have been acquired during the year. This property held by SFL shall be utilized for constructing new development centers.
6.1.3 IdenTrust™ Inc.
IdenTrust™ Inc., is a US‐based Global Leader in Trusted Identity Solutions and one of the premier providers of digital Identity authentication services to several key banks. IdenTrust™ also participates in United States federal identity programs and supply chain markets.
IdenTrust™, being a proven provider of bank‐grade identity authentication in 175 countries, will bring in the required expertise, allowing us to create more value for our clients by providing the most secure Financial Infrastructure solutions. This significant investment will explore a new area that fulfills our long term commitment to being a one‐stop shop for all Fin Tech needs.
Polaris Annual Report 2010‐11 91 Management Discussion & Analysis 7. Investments
Aiming at procuring business benefits and operational efficiency for the company, several strategic investments were done.
The investments in our foreign subsidiaries for FY 11 were as follows:
• Rs.22.50 Lacs for PSL Vietnam (incorporated in Vietnam) • Rs.75.00 Lacs in Polaris Software Lab Sdn Bhd (incorporated in Malaysia and a subsidiary of
PSL‐Singapore)
With an additional investment of Rs.331.41 Lacs for FY11, the long‐term investment stand at Rs.1,248.87 Lacs
• NMSWorks Software Private Limited, India • Rs.0.26 Lacs in equity shares • Rs.80.54 Lacs in preference shares
• Tyfone Inc Rs.250.61 Lacs in equity shares
8. Sundry Debtors
• Sundry debtors amount to Rs.22,718.54 Lacs (net of provision for doubtful debts amounting to Rs.2,548.23 Lacs) as at March 31, 2011 (Rs.17,463.24 Lacs in FY 10 (net of provision for doubtful debts amounting to Rs.3,326.39 Lacs)).
• For the year ended March 31, 2011, debtors are 14.32% of the revenues (12.90% in FY 10)
• At the end of FY 11, the days of sales outstanding were 45 days (43 days in FY 10)
9. Cash & Cash Equivalents
Cash and cash equivalents includes bank balances, rupee accounts and foreign currency accounts and mutual fund investments. Cash and cash equivalents increased by Rs.984.34 Lacs (1.95%) and stood at Rs.51,405.71 Lacs as at March 31, 2011 (Rs.50,421.73 Lacs in FY 10). The rise is on account of improved collections during the year and is in line with the financial strategy adopted under the present economic scenario by the company.
The treasury policy calls for investing in highly rated mutual fund debt instruments and banks. Due to the above policy and effective liquidity management, our company has earned a dividend of Rs.1,778.69 Lacs compared to the previous year increase of Rs.1,481.31 Lacs.
10. Other current assets and Loans & Advances
As on March 31, 2011, Loans and advances were Rs.30,019.15 Lacs (Rs.20,835.15 Lacs in FY 10), recording an increase by Rs.9,184 Lacs (44.08%).
Significant items of Loans & Advances along with its variance are presented as follows:
• Advance income tax shown is net of provision for tax and includes MAT credit entitlement. Increase in Advance tax of Rs.1,590.32 Lacs was due to higher component of MAT in the current year of Rs.587.22 Lacs as per provisions of Sec. 115 JB of the Income tax Act, based on book profits.
• Revenue accrued but not billed has increased by Rs.5,813.83 Lacs due to new project mile stones with billing cycle for the contracts entered during the year.
• Others comprise of advances, loans to associates and rental deposits. The prime reason for increase in others is predominantly attributable to the increase in rental deposits/earnest money deposits and service credit of Rs.642.41 Lacs.

92
11. Curren
On accounCurrent lia
Increase iincentives
12. Provis
Provision dividend ipayable tAnnual ge
13. Net Cu
As at Mar
• The
• The
Increase isof the com
14. Deferr
As on Ma(Rs.342.13the financprovisionsgrowth antaxable in
15. Cash
Cash flowchanges itransactioand financ
nt Liabilities
nt of Liability towards babilities have increased
in the accrued salariess and bonus for the curr
sions
for the current year hn the current year. Proo the shareholders. Ueneral Meeting.
urrent Assets
ch 31, 2011:
net current assets were
current ratio was 1.76
s primarily due to the rmpany) and rental / ear
red Tax Assets / Liabilit
rch 31, 2011, the comp3 Lacs in FY 10). Defercial and tax books aris for sundry debtors. Tnd improved operationcome.
Flow Analysis
ws are reported by adjun working capital, incons relating to investincing activities of the Co
8,903.92
1,494
billing in excess of revend by Rs.4,549.81 Lacs (1
s is on account of incrent year along with th
as increased by 57.51%oposed dividend represepon approval by our s
e Rs.28,910.47 Lacs (Rs
(1.67 in FY 10).
rise in the cash and banrnest money deposits h
ty
pany recorded net deferred tax assets/ liabilitiising out of depreciatiThe Company assessesns that the deferred t
usting net profit beforeome taxes paid, cash g and financing activitompany are identified a
Cash Flow Char
10,666.64
.14
Rs in Lacs
nue and accrued salarie8.48%).
crease in the performae head count increase d
% primarily on accountents the final dividend shareholders, this will
.20,411.43 in FY 10).
nk balances (based on theld by the company.
erred tax asset aggregates represent timing difion on assets, carry fo the likelihood based tax assets will be reco
e tax for effect of nontransactions of capitaies. Cash flows from ond reported separately
rt
Cash flows fromoperating activ
Cash flows frominvesting activi
Cash flows fromfinancing activ
es and benefits, the
ance development during the year.
t of proposed final recommended and be paid after the
he finance strategy
ting Rs.933.91 Lacs fferences between orward losses and on the continuous vered from future
‐cash transactions, al nature and cash perating, investing y.
m vities
m ities
m ities

Polaris Annual Report 2010‐11 93 Management Discussion & Analysis Cash flow from operating activities
Net Cash of Rs.10,666.64 Lacs was generated from operating activities by the company in FY 11. Net cash provided by operating activities of Rs.10,666.64 Lacs after utilization of cash for tax and working capital requirements, driven by business needs in the current year.
Cash flow from investing activities
In FY 11, the company used Rs.8,903.92 Lacs on investing activities. The significant items of cash flow from investing activities were purchase of fixed assets acquisition of subsidiary and investment in associate companies as a part of growth strategy.
Cash flow from financing activities
In FY 11, the Company used Rs.1,494.15 Lacs in financing activities. The substantial items of cash used from financing activities are for payment of dividend and repayment of secured loans during the current year.
Cash equivalents of Rs.51,405.71 Lacs are reported after considering the cash flow from operating activities, financing activities and investing activities and the short term investment balances as at the end of the year. The Cash equivalents remained positive compared to last year even with significant investment activities during the year.
SECTION C
Results of Operations
1. Revenue
With 88.28% revenue from Export business and 11.72% of revenue from domestic market, the total revenue for the year ended March 31, 2011 stands at Rs.158,633.14 Lacs. A revenue growth of 17.18% is achieved in FY 11.
2. Other Income
The Company‘s other income amounts to Rs.5,906.95 Lacs in FY11.
This comprises of:
• Rs.240.56 Lacs from interest on deposits
• Rs.1,778.69 Lacs from dividend received on mutual funds
• Rs.1,061.16 Lacs from profit on sale of assets
• Rs.51.10 Lacs from profit on sale investments
• Rs.1,146.59 Lacs through miscellaneous income
• Foreign exchange gain of Rs.1,628.85 Lacs
• Profit on sale of assets consists mainly of flats located in Lokhandwala Township, Mumbai during the current year

94
3. Expenditure
3.1 Software / Product Development Expenses
Software / product development expenses primarily consist of:
• Compensation to our software professionals
• Expenses on travel to execute work at client site
• Consultancy charges
• Software development charges
• Cost of software purchased for delivery to clients
• Bandwidth and communication expenses
• Proportionate infrastructure charges
During the year our software development expenses were Rs.107,239.25 Lacs at 67.60% of revenue against Rs.87,009.58 Lacs at 64.27% of revenue in the previous year.
The principal reason for increase in the software development expense is on account of:
Product related revenue was on the increasing trend in the current year which require the recruitment of highly skilled software professional and consultants to contribute for the delivery of revenue in various projects (increase of Rs.16,866.15 Lacs)
Travel project costs representing the cost of overseas travel and visa expenses (by Rs.1,727.70 Lacs) due to increase in the volume of business. Such an increase was impelled by the business needs of the company in the changing market conditions.
3.2 Selling, General and Administration
Selling expense primarily consist of salaries, travel, advertising and business promotion. General and Administrative Expense primarily consists of Salaries and related costs for administrative, executive, finance and Human Resource function.
We incurred SG&A expenses Rs.30,004.20 Lacs during the current year (Rs.26,164.22 Lacs in FY 10). Overall SGA expenses increased by Rs.3,839.98 Lacs due to increase in salary, rent, travel, Business promotion, office maintenance expenses and professional charges. Salary costs include the bonus payment. The increase in the professional expenses of Rs.1,396.67 Lacs is dominantly on account of recruitment expenses incurred in the current year
4. Depreciation & Amortization
Depreciation on fixed assets is provided using the straight‐line method based on rates specified in Schedule XIV of the Companies Act, 1956 or on estimated useful lives of assets, whichever is higher.
We have provided Rs.3,365.86 Lacs for March 31, 2011 as against Rs.3,501.53 Lacs for March 31, 2010 as depreciation for the respective years representing 2.12% and 2.59% of total revenues.

Polaris Annual Report 2010‐11 95 Management Discussion & Analysis 5. Income Tax
Income tax includes current tax and deferred tax. Details of the same are given below:
The company has calculated the tax liability after considering MAT in‐line with under section 115JB of Income Tax Act, 1961.
Rs. in Lacs Particulars March 31, 2011 March 31. 2010Tax 3,588.10 2,553.27Profit Before Tax (PBT) 23,815.91 17,879.12% of tax on PBT 15.07% 14.28%
6. Profit after Tax
• The Net Profit after Tax increased to Rs.20,245.97 Lacs from Rs.15,284.24 Lacs in the previous year, primarily due to the following factors:
Revenue for the year has increased by Rs.23,257.52 Lacs as against previous year
Increase in other income is primarily towards the monetization of assets (Rs.1,020.92 Lacs)
IntellectTM revenues crossed Rs.10,000 Lacs and 16 new IntellectTM wins were recorded in the current year
Foreign exchange gain has increased by Rs.4,270.81 Lacs from Rs.2,641.96 Lacs (Forex loss) to Rs.1,628.85 Lacs forex gain
7. Dividends
Our company has a track record of delivering dividends to the shareholders in a consistent manner. The table below shows the trend on dividend payouts.
Dividend Payout
2010‐11 2009‐10 2008‐09 2007‐08 2006‐07 2005‐06 2004‐05 2003‐04
Dividend % 90 70 55 30 45 25 35 35
Dividend payout % 22 23 21 20 22 58 30 24
8. Capital Markets
The Capital Market Information relating to the company's shares such as stock exchanges in which they are listed/traded, trading volume, stock price movements etc., has been provided in the Report on Corporate Governance (under the heading "General Shareholder Information") which forms part of the Annual Report 2010‐11.
9. Subsidiary Companies
For Subsidiary Companies details refer the Report on Subsidiaries on Page Nos. 56, 76 & 79.
SECTION D
Opportunities & Threats
Polaris' consistent focus on disciplined execution and sustained innovation has been a hallmark in every customer engagement. Our focused efforts in ensuring knowledge upgradation at all levels ensure that we are fine tuned to current and future trends in the Financial Services Industry. This continues to provide the edge to build future‐proof solution that delivers tangible business benefit to our customers.

96
• A strong leadership team that has clear vision and direction to lead the company to its
goals
• Scientific frameworks and methodologies that are built to ensure seamless delivery; performance management and effective reviews
• Demonstrated expertise on deep domain knowledge in the Banking, Financial Services & Insurance areas
• Strong technical know‐how and quick adaptability to internalize technology changes; constantly working on research mode to ensure we are future‐fit
• Enhanced experience of working world‐class customers
The affirmative growth of the world economy; the optimisation of respective strengths by global financial institutions opens up fantastic opportunities.
Strategy Polaris, in its pursuit towards becoming Global Financial Technology Infrastructure Leader, has defined strategies for its services business and for its IntellectTM solutions. We have devised the following strategies:
• Enhance relationship with Global Top 20 accounts, delivering higher revenues
• Within the Global Top 20, have a closer focus on Global Top 8 accounts. Many strategies are being rolled out to increase revenues from the Global Top 8 accounts. Such strategies span across areas of addressing our customer’s immediate requirements, mid‐term requirements and long term vision
• Significant efforts have gone in planned branding initiatives that reinforce our positioning at a global FinTech leader across the world
• We are now associated with Dun & Bradstreet for the Top Banker Awards; regular participant in Sibos with increased successes; connects with various industry forums across geographies are part of our Branding Strategy
• Constant evaluation of opportunities enhancing inorganic growth through leveraging strong balance sheet
Opportunities
In December 2009 Internal Strategy meeting, we identified the following growth levers, viz.:
• IntellectTM Expansion
• Strategic Accounts Expansion
• Country Expansion
• Insurance Accounts Expansion
Focused efforts and investments were made to these four clearly defined growth levers resulting in significant new businesses, cross‐sell and up‐sell opportunities. We have unique opportunities in the areas of:
• Progressive modernisation of legacy applications from the developed economies
• Product drive opportunities in the emerging markets; Middle East, Africa, SAARC Nations show exciting promise for product driven growth
• Global Tier 1 banks as well as Tier 2 and Tier 3 banks continue to explore smart technology solutions to enhance their growth ‐ particularly their new country expansion. This increases the opportunities for us to provide the right solutions

Polaris Annual Report 2010‐11 97 Management Discussion & Analysis Competition
Polaris has impressive solution offerings that encompass all elements of Banking, Financial Services and Insurance. This places Polaris in a unique position. The competitions are spread across one or more sections of what we offer and may not be in full. In the banking platform space, IntellectTM Global Universal Banking (GUB) competes with players such as Oracle, SAP, Temenos (T‐24) and Infosys (Finacle). We also compete with few regionally available solutions providers in different geographies. Most of our competitors from the Indian markets have only core banking solution. Our solution offerings span all areas of retail, corporate and investment banking. Some of our solutions in Liquidity, Wealth, Custody and Portal are leading products in the global market place. Combined together, Polaris owns the largest IP and application Infrastructure in the Banking and Insurance space.
In the services space are counted among the top services providers in the Financial Services outsourcing space competing with players including the large global outsourcing vendors viz. IBM, Cap Gemini and Cognizant; and Indian outsourcing vendors including TCS, Infosys, Wipro and HCL.
Threats
We at Polaris do not envisage significant threats to our outlook as the trends, funnel and directions are very positive. However, currency fluctuations, strength of the Dollar, Rupee, Euro will have its impact on the earnings. The withdrawal of STP benefits will impact the Indian IT Industry as a whole and we are fully prepared for this. Increased hiring and enhancing wages will have its effect and may pose minor risks to the projections.
The steep increase in the visa fees as passed by the United States House of Representatives throws a risk of increased operational cost; the overall rising costs in India do pose a global challenge for Indian IT companies with other locations emerging competitive. Polaris, like other key IT players in India, is addressing this threat in a proactive manner.
Risks & Concerns
A formal risk management process was rolled out in May 2005 in Polaris. This process is fine tuned based on changes, learning and need. A Risk Governance Committee comprising of the CEO, CFO & Head of Process Excellence as its members is in place. This committee builds, maintains, reviews & suggests changes to the Risk Manual from time to time. Various Risks – macro & micro – are identified, its impact on the organisation is assessed and a process to have identified risks mitigated is rolled out.
IT Security Risk; Market Risk; Financial Reporting Risk; Exchange Risk; Contractual Compliance Risk; other Compliance Risks are the broad categories of Risks that are monitored and mitigated.
Human Resources Development
The total employee strength stood at 10,974 as at March 31, 2011. Polaris launched two separate initiatives to enable the organization to meet its growth and expansion targets through the development of talent from within. The Performance Development Dialogue (PDD) initiative seeks to ensure healthy dialogue on performance and capability development between supervisors and their associates, thus enabling these associates to be better suited to opportunities that would become available to them in the near future. The Headway program seeks to equip Project Managers with the requisite tools to meet the challenges of delivering large projects and programs to demanding customers.

98
This page has been intentionally left blank

Polaris Annual Report 2010‐11 99 Abridged Financial Statements
ABRIDGED FINANCIAL STATEMENTS FOR THE YEAR ENDED MARCH 31, 2011
Polaris Annual Report 2010‐11

100
CONTENTS OF ABRIDGED FINANCIAL STATEMENTS
Auditors’ Report on Abridged Financial Statements __________________ 101
Auditors’ Report to Members __________________ 102
Balance Sheet __________________ 106
Profit & Loss Account __________________ 107
Statement of Cash Flows __________________ 108
Notes to abridged financial statements __________________ 109
Balance Sheet abstract __________________ 116

Polaris Annual Report 2010‐11 101 Abridged Financial Statements Auditor’s Report on Abridged Financial Statements To The Members of Polaris Software Lab Limited,
1. We have examined the abridged balance sheet of Polaris Software Lab Limited (‘the Company’) as at March 31, 2011 and the abridged profit and loss account and cash flow statement for the year ended on that date, together with the notes thereon (hereafter collectively referred to as “abridged financial statements”).
2. These abridged financial statements have been prepared by the Company pursuant to Rule 7A of the Companies (Central Government's) General Rules and Forms, 1956 and Clause 32 of the Listing Agreement and are based on the complete set of financial statements of the Company for the year ended March 31, 2011 prepared in accordance with Schedule VI to the Companies Act, 1956 and covered by our report dated April 28, 2011 to the members of the Company which report is attached.
For S.R. BATLIBOI & ASSOCIATES Firm Registration number: 101049W Chartered Accountants
per S Balasubrahmanyam Partner Membership No.: 053315
Chennai April 28, 2011

102
Auditors’ Report To The Members of Polaris Software Lab Limited
1. We have audited the attached Balance Sheet of Polaris Software Lab Limited (‘the Company’) as at March 31, 2011 and also the Profit and Loss account and the cash flow statement for the year ended on that date annexed thereto. These financial statements are the responsibility of the Company’s management. Our responsibility is to express an opinion on these financial statements based on our audit.
2. We conducted our audit in accordance with auditing standards generally accepted in India. Those Standards require that we plan and perform the audit to obtain reasonable assurance about whether the financial statements are free of material misstatement. An audit includes examining, on a test basis, evidence supporting the amounts and disclosures in the financial statements. An audit also includes assessing the accounting principles used and significant estimates made by management, as well as evaluating the overall financial statement presentation. We believe that our audit provides a reasonable basis for our opinion.
3. As required by the Companies (Auditor’s Report) Order, 2003 (as amended) issued by the Central Government of India in terms of sub‐section (4A) of Section 227 of the Companies Act, 1956, we enclose in the Annexure a statement on the matters specified in paragraphs 4 and 5 of the said Order.
4. Further to our comments in the Annexure referred to above, we report that:
i. We have obtained all the information and explanations, which to the best of our knowledge and belief were necessary for the purposes of our audit;
ii. In our opinion, proper books of account as required by law have been kept by the Company so far as appears from our examination of those books;
iii. The balance sheet, profit and loss account and cash flow statement dealt with by this report are in agreement with the books of account;
iv. In our opinion, the balance sheet, profit and loss account and cash flow statement dealt with by this report comply with the accounting standards referred to in sub‐section (3C) of section 211 of the Companies Act, 1956;
v. On the basis of the written representations received from the directors, as on March 31, 2011, and taken on record by the Board of Directors, we report that none of the directors is disqualified as on March 31, 2011 from being appointed as a director in terms of clause (g) of sub‐section (1) of section 274 of the Companies Act, 1956;
vi. In our opinion and to the best of our information and according to the explanations given to us, the said accounts give the information required by the Companies Act, 1956, in the manner so required and give a true and fair view in conformity with the accounting principles generally accepted in India; a) in the case of the balance sheet, of the state of affairs of the Company as at
March 31, 2011; b) in the case of the profit and loss account, of the profit for the year ended on that
date; and c) in the case of cash flow statement, of the cash flows for the year ended on that date.
For S.R. BATLIBOI & ASSOCIATES Firm registration number: 101049W Chartered Accountants
per S Balasubrahmanyam Partner Membership No.: 053315
Place: Chennai Date: April 28, 2011
Polaris Annual Report 2010‐11 103 Abridged Financial Statements Annexure referred to in paragraph 3 of our report of even date Re: Polaris Software Lab Limited (‘the Company’)
(i) (a) The Company has maintained proper records showing full particulars, including quantitative details and situation of fixed assets.
(b) All fixed assets have not been physically verified by the management during the year but there is a regular programme of verification which, in our opinion, is reasonable having regard to the size of the Company and the nature of its assets. No material discrepancies were noticed on such verification.
(c) There was no substantial disposal of fixed assets during the year. (ii) Due to the nature of business, the Company has no inventories and accordingly the
provisions of Clause 4(ii) of the Companies (Auditor’s Report) Order 2003 (as amended) are not applicable to the Company.
(iii) (a) The Company has granted loan to one company covered in the register maintained
under section 301 of the Companies Act, 1956. The maximum amount involved during the year was Rs.160.50 Lacs and the year‐ end balance of loans granted to such parties was Rs.160.50 Lacs.
(b) In our opinion and according to the information and explanations given to us, the rate of interest and other terms and conditions for such loans are not prima facie prejudicial to the interest of the Company.
(c) In respect of loans granted, repayment of the principal amount is as stipulated and payment of interest have been regular.
(d) There is no overdue amount of loans granted to companies, firms or other parties listed in the register maintained under section 301 of the Companies Act, 1956.
(e) As informed, the Company has not taken any loans, secured or unsecured from companies, firms or other parties covered in the register maintained under section 301 of the Companies Act, 1956.
(iv) In our opinion and according to the information and explanations given to us, there is an
adequate internal control system commensurate with the size of the Company and the nature of its business, for the purchase of fixed assets and for the sale of services. During the course of our audit, no major weakness has been noticed in the internal control system in respect of these areas. During the course of our audit, we have not observed any continuing failure to correct major weakness in internal control system of the company. The activities of the Company do not include purchase and sale of goods.
(v) (a) According to the information and explanations provided by the management, we are of the opinion that the particulars of contracts or arrangements referred to in section 301 of the Act that need to be entered into the register maintained under section 301 have been so entered.
(b) In respect of transactions made in pursuance of such contracts or arrangements exceeding value of Rupees five lakhs entered into during the financial year, at prices which are reasonable having regard to the prevailing market prices at the relevant time after considering the unique and specialized nature of the items involved.
104
(vi) The Company has not accepted any deposits from the public.
(vii) In our opinion, the Company has an internal audit system commensurate with the size and nature of its business.
(viii) To the best of our knowledge and as explained, the Central Government has not prescribed maintenance of cost records under clause (d) of sub‐section (1) of section 209 of the Companies Act, 1956 for the products of the Company.
(ix) (a) Undisputed statutory dues including Provident Fund, Investor Education and Protection Fund, Income Tax, Sales Tax, Wealth Tax, Service Tax, Cess and other material statutory dues have generally been regularly deposited with the appropriate authorities though there has been a slight delay in a few cases in deposit of provident fund and employee’s state insurance dues. The provisions relating to excise duty and customs duty are not applicable to the Company.
Further, since the Central Government has till date not prescribed the amount of cess payable under section 441 A of the Companies Act, 1956, we are not in a position to comment upon the regularity or otherwise of the company in depositing the same.
(b) According to the information and explanations given to us, there are no undisputed dues in respect of Provident Fund, Investor Education and Protection Fund, Employees’ State Insurance, Income Tax, Wealth Tax, Service Tax, Sales Tax, Cess and other material statutory dues which were outstanding, at the year end for a period of more than six months from the date they became payable.
(c) According to the records of the Company, there are no dues outstanding of wealth tax and Cess on account of any dispute. Dues outstanding of income‐tax, sales‐tax, service tax and Cess on account of any dispute, are as follows:
Name of the statute Nature of dues
Amount (Rs. in Lacs)
Period to which the amount
relates
Forum where dispute is pending
Income Tax Act 1961 Income tax
118.21 2000‐01 High Court
Income Tax Act 1961 Income tax
507.49 2001‐02 High Court
Income Tax Act 1961 Income tax
864.44 2003‐04 Income Tax Appellate Tribunal
Income Tax Act 1961 Income tax
97.25 2004‐05 Income Tax Appellate Tribunal
Tamil Nadu General Sales tax Act, 1959
Sales tax 520.00 2004‐05 High Court
Central Sales Tax Act,1956
Central sales tax
55.62 2008‐09 Appellate Commissioner
Central Sales Tax Act,1956
Central sales tax
12.55 2006‐07 High Court
Central Sales Tax Act,1956
Central sales tax
29.85 2007‐08 High Court
Finance Act, 1994 Service tax*
132.82 2004‐05 CESTAT
* The Company has also deposited a sum of Rs.68.28 Lacs under protest.

Polaris Annual Report 2010‐11 105 Abridged Financial Statements (x) The Company has no accumulated losses at the end of the financial year and has not
incurred cash losses in the current and immediately preceding financial year.
(xi) Based on our audit procedures and as per the information and explanations given by the management, we are of the opinion that the Company has not defaulted in repayment of dues to a bank. The Company has no dues in respect of a financial institution and has not issued any debenture during the year.
(xii) According to the information and explanations given to us and based on the documents and records produced to us, the Company has not granted loans and advances on the basis of security by way of pledge of shares, debentures and other securities.
(xiii) In our opinion, the Company is not a chit fund or a nidhi / mutual benefit fund / society. Therefore, the provisions of clause 4(xiii) of the Companies (Auditor’s Report) Order, 2003 (as amended) are not applicable to the Company.
(xiv) In our opinion, the Company is not dealing in or trading in shares, securities, debentures and other investments. Accordingly, the provisions of clause 4(xiv) of the Companies (Auditor’s Report) Order, 2003 (as amended) are not applicable to the Company.
(xv) According to the information and explanations given to us, the Company has not given any guarantee for loans taken by others from bank or financial institutions.
(xvi) The Company did not have any term loans outstanding during the year.
(xvii) According to the information and explanations given to us and on an overall examination of the balance sheet of the Company, we report that no funds raised on short‐term basis have been used for long‐term investment.
(xviii) The Company has not made any preferential allotment of shares to parties or companies covered in the register maintained under section 301 of the Companies Act, 1956.
(xix) The Company did not have any outstanding debentures during the year.
(xx) During the year, the Company has not raised any money by way of public issue and accordingly the provisions of clause 4(xx) of the Companies (Auditors’ report) Order, 2003 (as amended) are not applicable to the Company.
(xxi) Based upon the audit procedures performed for the purpose of reporting the true and fair view of the financial statements and as per the information and explanations given by the management, we report that no fraud on or by the Company has been noticed or reported during the course of our audit.
For S.R. BATLIBOI & ASSOCIATES Firm registration number: 101049W Chartered Accountants
per S Balasubrahmanyam Partner Membership No.: 053315
Place: Chennai Date: April 28, 2011

106
Polaris Software Lab LimitedAbridged Balance Sheet as at March 31, 2011
Rs. in Lacs March 31, 2011 March 31, 2010
I. SOURCES OF FUNDS
(1) SHAREHOLDERS' FUNDS (a) Equity capital 4,959.78 4,948.06
(b) Reserves and surplus (i) General reserve 20,116.56 18,216.56 (ii) Foreign currency translation reserve 79.04 99.17 (iii) Securities premium account 18,916.26 18,725.58 (iv) Surplus in profit and loss account 47,639.17 36,019.06
(2) DEFERRED TAX LIABILITY (NET) ‐ 84.15
91,710.81 78,092.58
II. APPLICATION OF FUNDS (1) FIXED ASSETS (a) Net block (original cost less depreciation) 18,420.48 17,173.07 (b) Capital work‐in‐progress 6,514.57 1,245.25
(2) INVESTMENTS (a) Investment in subsidiary companies
(Unquoted)15,792.40 12,157.44
(b) Others (i) Quoted * 500.00 500.00 (ii) Unquoted 36,591.76 39,136.26 (3) DEFERRED TAX ASSET (NET) 236.50 ‐ (4) (i) CURRENT ASSETS, LOANS AND ADVANCES (a) Sundry debtors 14,583.70 11,368.28 (b) Cash and bank balances 6,559.63 5,270.47 (c) Other current assets 12,477.66 8,609.06 (d) Loans and advances (i) To subsidiary and associate companies 2,283.48 999.83 (ii) To others 7,238.32 5,199.87 43,142.79 31,447.51 LESS: (ii) CURRENT LIABILITIES AND PROVISIONS (a) Current liabilities 21,290.59 18,360.91 (b) Provisions 8,197.10 5,206.04 29,487.69 23,566.95 NET CURRENT ASSETS (i ‐ ii) 13,655.10 7,880.56
91,710.81 78,092.58
* Aggregate market value of the quoted investments March 31, 2011: Rs. 511.15 (March 31, 2010: Rs. 500.00)
Notes to abridged financial statements form an integral part of the Abridged Financial Statements.
As per our report on the abridged financial statements of even date.
For S.R.BATLIBOI & ASSOCIATES Firm Registration number: 101049W Chartered Accountants
For and on behalf of the Board of Directors of Polaris Software Lab Limited
per S. Balasubrahmanyam Partner Membership No 053315 Chennai April 28, 2011
Arun Jain Chairman & Managing Director
R. Srikanth President & Chief Financial Officer Chennai April 28, 2011
B. Muthusubramanian Senior Vice President – Finance & Secretary
R.C. Bhargava Director

Polaris Annual Report 2010‐11 107 Abridged Financial Statements Polaris Software Lab LimitedAbridged Profit and Loss Account for the year ended March 31, 2011
Rs. in Lacs except per share data March 31, 2011 March 31, 2010 I INCOME Software development services and products ‐ Overseas 124,066.02 105,445.35 ‐ Domestic 13,530.43 8,902.34 Dividend 1,778.69 1,476.75 Interest 49.76 108.33 Other income 6,720.66 143.27 146,145.56 116,076.04 II EXPENDITURE Salaries & other employee benefits 101,624.50 82,481.64 Software development expenses 6,077.28 4,384.82 Selling, administrative and other general expenses 11,469.43 8,923.84 Managerial remuneration 71.79 247.63 Finance charges 34.21 47.42 Depreciation and amortisation 2,643.66 2,544.59 Auditor's remuneration 50.70 50.62 Provision for doubtful debts (net) 274.28 179.36 Bad debts / advances written off ‐ 98.59 Foreign exchange (gains) / losses, net 2,281.94 2,106.71 124,527.79 101,065.22
III PROFIT BEFORE TAX ( I ‐ II ) 21,617.77 15,010.82 IV Provision for taxation ‐ Current tax 3,800.86 2,424.22 ‐ Deferred tax (320.65) 6.97 ‐ MAT credit entitlement (565.22) (484.69)V PROFIT AFTER TAX 18,702.78 13,064.32 VI Profit brought forward from previous year 36,019.06 28,312.27 VII Amount available for appropriation 54,721.84 41,376.59 VIII APPROPRIATIONS Dividend ‐ Interim ‐ 1,730.81 ‐ Final 4,465.02 1,731.82 Tax on dividend 717.65 588.47 Amount transferred to general reserve 1,900.00 1,306.43 Balance carried to balance sheet 47,639.17 36,019.06 54,721.84 41,376.59 EARNINGS PER SHARE (equity shares par value Rs 5/‐ each) Basic 18.87 13.23 Diluted 18.74 13.11 Number of shares used in computing earnings per share Basic 99,100,729 98,765,014 Diluted 99,825,120 99,667,786
Notes to abridged financial statements form an integral part of the Abridged Financial Statements. As per our report on the abridged financial statements of even date.
For S.R.BATLIBOI & ASSOCIATES Firm Registration number: 101049W Chartered Accountants
For and on behalf of the Board of Directors of Polaris Software Lab Limited
per S. Balasubrahmanyam Partner Membership No 053315 Chennai April 28, 2011
Arun Jain Chairman & Managing Director R. Srikanth President & Chief Financial Officer Chennai April 28, 2011
B. Muthusubramanian Senior Vice President – Finance & Secretary
R.C. Bhargava Director

108
Polaris Software Lab LimitedStatement of cash flows for the period ended March 31, 2011
Rs. in Lacs March 31, 2011 March 31, 2010
CASH FLOWS FROM OPERATING ACTIVITIESProfit before tax 21,617.77 15,010.82 Adjustments for: Depreciation / amortisation 2,643.66 2,544.59 Interest income (49.76) (108.33) Dividend income (1,778.69) (1,476.75) Exchange differences on translation of foreign currency cash and cash equivalents
2.44 (157.10)
Exchange differences on foreign exchange translation 142.44 206.60 Provision for doubtful debts (Net) (762.68) 179.36 Bad debts / advances written off ‐ 98.59 (Profit) / Loss on sale of investments (45.17) 19.00 (Profit) / Loss on sale of fixed assets (1,029.89) (5.66) Lease finance charges ‐ 2.44 Changes in current assets and liabilities Decrease / (Increase) in sundry debtors (2,572.09) 6,342.53 Decrease / (Increase) in other current assets & loans and advances
(6,183.06) 3,398.33
Increase / (Decrease) in current liabilities and provisions 2,829.02 131.22
Taxes paid (4,334.34) (2,183.27)Net cash from operating activities 10,479.65 24,002.37
CASH FLOWS FROM INVESTING ACTIVITIESPurchase of fixed assets and changes in capital work‐in‐progress (9,235.00) (3,309.63)Proceeds from sale of fixed assets 1,102.60 16.32 Acquisition of subsidiary [Refer note B 8 (e) of schedule 15] (1,807.78) (3,471.95)(Purchase) / sale proceeds of other long term investments (80.80) ‐Net decrease / (increase) in non‐trade investments 843.29 (14,443.25)Loans to group companies (Net) ‐ 922.75 Interest received 49.76 108.33 Dividend received 1,778.69 1,476.75 Net cash used in investing activities (7,349.24) (18,700.68)
CASH FLOWS FROM FINANCING ACTIVITIESProceeds from share capital issued on exercise of stock options 11.72 14.25 Proceeds from securities premium on exercise of stock options 190.68 225.62 Repayment of secured loans ‐ (35.71)Lease finance charges paid ‐ (2.44)Dividends paid during the period (including dividend tax) (2,022.99) (3,460.39)Net cash used in financing activities (1,820.59) (3,258.67)
Exchange differences on translation of foreign currency cash and cash equivalents and movement in foreign currency translation reserve
(20.66) (456.96)
Net increase / (decrease) in cash and cash equivalents during the period
1,289.16 1,586.06
Cash and cash equivalents at the beginning of the period 5,270.47 3,684.41
Cash and cash equivalents at the end of the year * 6,559.63 5,270.47
* The balances include Rs 62.70 (March 31, 2010: Rs 64.82) which are not available for use by the Company as they represent corresponding unpaid dividend liabilities. As per our report of even date.
For S.R.BATLIBOI & ASSOCIATES Firm Registration number: 101049W Chartered Accountants
For and on behalf of the Board of Directors of Polaris Software Lab Limited
per S. Balasubrahmanyam Partner Membership No 053315 Chennai April 28, 2011
Arun Jain Chairman & Managing Director R. Srikanth President & Chief Financial Officer Chennai April 28, 2011
B. Muthusubramanian Senior Vice President – Finance & Secretary
R.C. Bhargava Director

Polaris Annual Report 2010‐11 109 Abridged Financial Statements Polaris Software Lab Limited (All amounts are in Rs. in Lacs, unless otherwise stated)
Notes to Abridged Financial Statements
1. All amounts in the financial statements are presented in Rupees Lacs, unless otherwise stated. The note numbers appearing in the brackets “[ ]” are as they appear in the complete set of Financial Statements. These abridged financial statements have been prepared in accordance with the requirements of Rule 7A of the Companies (Central Government’s) General Rules and Forms, 1956 and clause 32 of the Listing Agreement. These abridged financial statements have been prepared on the basis of the complete set of financial statements for the year ended March 31, 2011.
2. [B5] Capital commitments and contingent liabilities
i) The estimated amount of contracts remaining to be executed on capital account and not provided for (net of advances) as at March 31, 2011 is Rs.3,171.10 (March 31, 2010: Rs.1,689.85).
ii) As at March 31, 2011, the Company has outstanding guarantees and counter guarantees of Rs.1,222.29 (March 31, 2010: Rs.1,447.86) issued to various banks, in respect of guarantees given by the banks in favour of various government authorities and others.
iii) Claims against the Company, not acknowledged as debts include:
a) Demand from Indian income tax authorities as at March 31, 2011 is Rs.754.63 (March 31, 2010: Rs.692.08). The tax demand is mainly on account of disallowance of a portion of the deduction claimed by the company under Section 10A of the Income Tax Act. The Company is in the process of filing an appeal with the higher appellate authorities.
b) Sales Tax demand from Commercial Tax Officer Chennai is Rs.520.00 as at March 31, 2011 (March 31, 2010: Rs.520.00).
c) Sales Tax demand from Commercial Tax Officer, Hyderabad is Rs.98.00 as at March 31, 2011 (March 31, 2010: Rs.42.40).
d) Service tax demand from Commissioner of Central Excise, Chennai as at March 31, 2011 is Rs.32.25 (March 31, 2010: Rs.32.25).
The Company is contesting the demands raised by the respective tax authorities, and the management, including its tax advisers, believes that its position will likely be upheld in the appellate process and ultimate outcome of these proceedings will not have a material adverse effect on the Company’s financial position and results of operations.
iv) The Company is also involved in other law suit and claims including suits filed by former employees, which arise in the ordinary course of business. However there are no such matters pending that the Company expects to be material in relation to its business.
3. [B6] Leases
The Company has taken certain offices and residential premises for the employees under operating leases which expires at various dates in future years and renewable for further period at the option of the Company. There are no restrictions imposed by the lease arrangements. The minimum lease rental payments to be made in respect of these leases are as follows:

110
Polaris Software Lab Limited (All amounts are in Rs. in Lacs, unless otherwise stated)
Notes to Abridged Financial Statements
Particulars As at
March 31, 2011 As at
March 31, 2010
Lease payments for the year 974.08 816.01
Contingent rent recognised in Profit and Loss Account
‐ ‐
Minimum Lease Payments :
Not later than one year 1,026.43 505.52 Later than one year and not later than five years
1,311.09 536.50
Later than five years ‐ ‐
Total 2,337.52 1,042.02
4. [B7] Quantitative details
The Company is engaged in the development of computer software. The production and sale of such software cannot be expressed in any generic unit. Hence, it is not possible to give the quantitative details of sales and the information as required under paragraphs 3, 4C and 4D of part II of Schedule VI to the Companies Act, 1956.
5. [B8] Managerial remuneration
Particulars Year ended
March 31, 2011 Year ended
March 31, 2010
Chairman and Managing Director
Salary and perquisites 22.74 155.15
Contribution to provident and other funds 2.40 7.20
Executive Director and Other Directors
Salaries and perquisites 38.00 73.88
Contribution to provident and other funds ‐ 2.20
Sitting fees 8.65 9.20
Total 71.79 247.63
The Directors are covered under the Company’s gratuity policy along with the other employees of the Company. Proportionate amount of gratuity is not included in the disclosure above. However actual payments, if any, made on their resignation / retirement is considered.
Salaries and perquisites to other directors include commission of Rs.38.00 (March 31, 2010 Rs. 30.00) payable to non‐executive directors.

Polaris Annual Report 2010‐11 111 Abridged Financial Statements Polaris Software Lab Limited (All amounts are in Rs. in Lacs, unless otherwise stated)
Notes to Abridged Financial Statements
Computation of Net Profit in accordance with section 349 of the Companies Act, 1956 for calculation of commission payable to directors.
S.No Particulars Year Ended
March 31, 2011 Year Ended
March 31, 2010 Profit as per Profit and Loss Account 18,702.78 13,064.32 Add: 1 Whole‐time directors’ remuneration 25.14 208.43
2 Directors’ sitting fees 8.65 9.20
3 Commission to non‐whole‐time directors 38.00 30.00
4 Depreciation and amortization 2,643.66 2,544.59
5 Provision for taxation 2,914.99 1,946.50
6 Provision for doubtful debts 274.28 179.36
7 Loss of a Capital nature ‐ 13.34
24,607.5 17,995.74 Less: 1 Depreciation as envisaged under Section
350 of the Companies Act 1956 * 2,643.66 2,544.59
2 Profit of a Capital nature 1,075.06 ‐
Net profit on which commission is payable 20,888.78 15,451.15
Commission to other directors at 1% of the net profits as calculated above
208.89 154.51
Maximum allowed by the shareholders 45.00 45.00
Commission approved by the board 38.00 30.00
* The Company depreciates fixed assets based on estimated useful lives that are lower than those implicit in Schedule XIV of the Companies Act 1956. Accordingly, the rates of depreciation used by the Company are higher than the minimum prescribed by the Schedule XIV.
6. [B13] Earnings per Share (“EPS”)
Reconciliation of basic and diluted shares used in computing EPS:
Particulars Year ended
March 31, 2011 Year ended
March 31, 2010 Weighted average number of equity shares outstanding during the year – Basic
99,100,729 98,765,014
Add: Effect of dilutive issue of stock options to be converted
724,391 902,772
Weighted average number of equity shares outstanding during the year –Diluted
99,825,120 99,667,786
Net profit for calculation of Basic and diluted EPS 18,702.78 13,064.32Basic earnings per share (in Rs.) 18.87 13.23Diluted earnings per share (in Rs.) 18.74 13.11Face value per equity share (in Rs.) 5.00 5.00

112
Polaris Software Lab Limited (All amounts are in Rs. in Lacs, unless otherwise stated)
Notes to Abridged Financial Statements
7. [B15] Investments in subsidiaries and associates
a) The Company’s subsidiary Optimus Global Services Limited (`Optimus’) incorporated in September 2002, is engaged in the business processing outsourcing services. Optimus has accumulated losses amounting to Rs.2,822.35 as at March 31, 2011 on account of initial/set up stage operation in earlier years and on account of slowdown in BPO industry during the last three years. The management is optimistic about the future growth of Optimus and expects that Optimus will earn profits in the future. Accordingly, management believes that there is no other than temporary diminution in the value of its investments in the subsidiary and hence it is stated at cost.
b) The Company's equity ownership interest in Adrenalin eSystems Limited ("ASL") is 40.25% as at March 31, 2011. ASL is primarily engaged in the business of providing specific solutions relating to Human Relations suite of software solutions. The accumulated losses to the extent of Rs.2,941.10 as per the unaudited financial statements of ASL as on March 31, 2011 are on account of initial / start‐up stage of operations. ASL has earned nominal profits in current year. As per the valuation of ASL as at March 31, 2011 carried out by the independent valuation expert, there is no diminution in the carrying value of investments. Accordingly, management believes that there is no other than temporary diminution in the value of its investments in ASL and hence it is stated at cost.
c) The Company’s equity ownership interest in NMSWorks Software Private Limited (“NMS”) is 39.59% as at March 31, 2011. NMS is primarily engaged in the business of designing network management in Telecommunication and Internet Services. The Company has made substantial profits of Rs. 363.04 during the year. The orders secured during the year have reduced the accumulated losses. NMS had accumulated losses aggregating to Rs. 180.46 as per the unaudited financial statements of NMS as on March 31, 2011. Accordingly, the Company had determined and recorded a provision of Rs. 415, in the earlier years, for other than temporary diminution in the value of equity investment in NMS.
d) The Company has acquired entire equity interest in Laser Soft Infosystems Limited (‘Laser Soft’), a leading Banking software services company specializing in serving the unique needs of India & emerging markets with effect from November 16, 2009. The total consideration for acquisition is Rs.5,201.05 subject to price adjustment conditions based on future financial performance of Laser Soft over the next two years. The Company has paid a sum of Rs.4,322.94 for 94.29% equity interest as at March 31, 2011. The Company has accrued for the consideration payable for the balance equity shares, as the management expects the payment is probable in accordance with the term of the agreement and a reasonable estimate of the amount can be made as at March 31, 2011.
e) The Company has acquired 51% equity stake in Indigo Tx Software Private Limited, a SAAS Software developer of Rs.800.75 on May 10, 2010. The company has the obligation to acquire the balance equity at a price to be determined based on future financial performance over a period of 6 years.
f) The Company has acquired 100% equity in SFL Properties Ltd. The total consideration for acquisition is Rs. 984.53.
g) Laser Soft Infosystem Limited & SFL Properties Private Limited, subsidiaries of the company are proposed to be merged with the company with effect from April 1, 2011.

Polaris Annual Report 2010‐11 113 Abridged Financial Statements Polaris Software Lab Limited (All amounts are in Rs. in Lacs, unless otherwise stated)
Notes to Abridged Financial Statements
8. [B17] The following investments were purchased and sold during the year
Particulars Face Value
in Rs. Units Cost
Baroda Pioneer Liquid Fund ‐ Inst Plan ‐ Daily Dividend
1,000 0.40 400.15
Baroda Pioneer Treasury Advantage Fund ‐ IP ‐ Daily Dividend
1,000 0.40 404.68
Birla Sun Life Cash Plus ‐ Institutional Premium Plan ‐ Daily Dividend
10 150.02 1,500.16
Birla Sun Life Cash Plus ‐ Institutional Premium Plan ‐ Daily Dividend
10 50.01 500.07
Birla Sun Life Savings Fund ‐ IP ‐ Daily Dividend 10 101.23 1,012.35 Birla Sun Life Quarterly Interval Fund ‐ Series 4 – Dividend
10 187.50 1,875.04
Birla Sun Life Ultra Short Term Fund ‐ IP ‐ Daily Dividend
10 294.04 2,940.39
Birla Sun Life Ultra Short Term Fund ‐ IP ‐ Daily Dividend
10 140.82 1,408.25
Birla Sun Life Floating Rate Fund ‐ LTP ‐ IP ‐ Daily Dividend
10 50.41 504.09
Birla Sun Life Short Term FMP‐Series 3 ‐ Dividend 10 153.75 1,537.54 Birla Sun Life Cash Manager ‐ I P ‐ Daily Dividend 10 185.72 1,857.23 DWS Treasury Fund ‐ Investment ‐ IP ‐ Monthly Dividend
10 30.23 302.25
Templeton India TMA ‐ Super IP ‐ Daily Dividend 1,000 3.30 3,300.36 Templeton India Ultra Short Bond Fund ‐ Super IP – Dividend
10 353.54 3,535.38
Templeton India STIP ‐ Monthly Dividend 1,000 1.02 1,020.44 HDFC Liquid Fund ‐ Premium Plan ‐ Daily Dividend 10 60.01 600.07 HDFC Quaterly Interval Fund ‐ Plan A ‐ Retail – Dividend
10 40.00 400.02
HDFC Quaterly Interval Fund ‐ Plan A ‐ WP – Dividend
10 40.11 401.14
HDFC FMP ‐ 35D ‐ August 2010 (14) ‐ 3 – Dividend 10 30.00 300.03 ICICI Prudential Liquid ‐ I P ‐ Daily Dividend 100 3.00 300.15 ICICI Prudential Blended ‐ Plan B ‐ Optoin II – Dividend
10 216.57 2,165.66
ICICI Prudential Liquid ‐ Super IP ‐ Daily Dividend 100 24.01 2,400.97 ICICI Prudential FRF ‐ Plan D ‐ Daily Dividend 100 22.21 2,220.57 ICICI Prudential Interval Fund ‐ Monthly Interval I‐IP – Dividend
10 60.26 602.60
ICICI Prudential Interval Fund II ‐ Quarterly Interval ‐ Plan C ‐ IP – Dividend
10 30.00 300.00
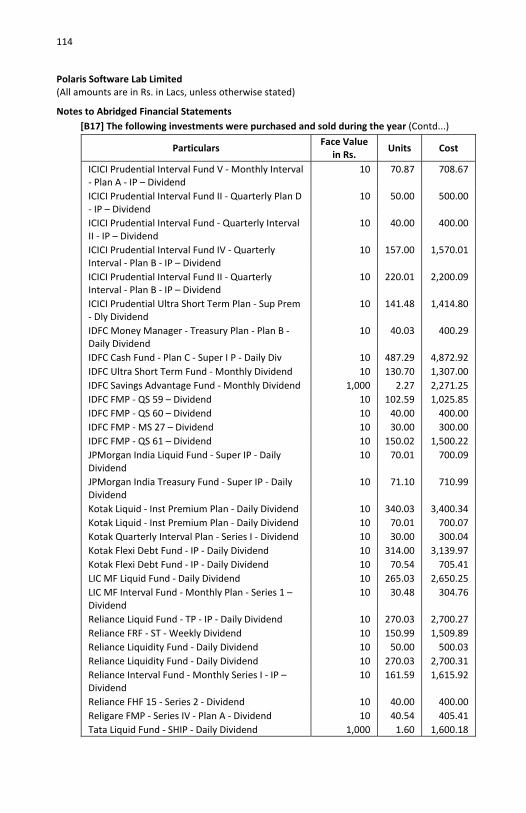
114
Polaris Software Lab Limited (All amounts are in Rs. in Lacs, unless otherwise stated)
Notes to Abridged Financial Statements
[B17] The following investments were purchased and sold during the year (Contd...)
Particulars Face Value
in Rs. Units Cost
ICICI Prudential Interval Fund V ‐ Monthly Interval ‐ Plan A ‐ IP – Dividend
10 70.87 708.67
ICICI Prudential Interval Fund II ‐ Quarterly Plan D ‐ IP – Dividend
10 50.00 500.00
ICICI Prudential Interval Fund ‐ Quarterly Interval II ‐ IP – Dividend
10 40.00 400.00
ICICI Prudential Interval Fund IV ‐ Quarterly Interval ‐ Plan B ‐ IP – Dividend
10 157.00 1,570.01
ICICI Prudential Interval Fund II ‐ Quarterly Interval ‐ Plan B ‐ IP – Dividend
10 220.01 2,200.09
ICICI Prudential Ultra Short Term Plan ‐ Sup Prem ‐ Dly Dividend
10 141.48 1,414.80
IDFC Money Manager ‐ Treasury Plan ‐ Plan B ‐ Daily Dividend
10 40.03 400.29
IDFC Cash Fund ‐ Plan C ‐ Super I P ‐ Daily Div 10 487.29 4,872.92 IDFC Ultra Short Term Fund ‐ Monthly Dividend 10 130.70 1,307.00 IDFC Savings Advantage Fund ‐ Monthly Dividend 1,000 2.27 2,271.25 IDFC FMP ‐ QS 59 – Dividend 10 102.59 1,025.85 IDFC FMP ‐ QS 60 – Dividend 10 40.00 400.00 IDFC FMP ‐ MS 27 – Dividend 10 30.00 300.00 IDFC FMP ‐ QS 61 – Dividend 10 150.02 1,500.22 JPMorgan India Liquid Fund ‐ Super IP ‐ Daily Dividend
10 70.01 700.09
JPMorgan India Treasury Fund ‐ Super IP ‐ Daily Dividend
10 71.10 710.99
Kotak Liquid ‐ Inst Premium Plan ‐ Daily Dividend 10 340.03 3,400.34 Kotak Liquid ‐ Inst Premium Plan ‐ Daily Dividend 10 70.01 700.07 Kotak Quarterly Interval Plan ‐ Series I ‐ Dividend 10 30.00 300.04 Kotak Flexi Debt Fund ‐ IP ‐ Daily Dividend 10 314.00 3,139.97 Kotak Flexi Debt Fund ‐ IP ‐ Daily Dividend 10 70.54 705.41 LIC MF Liquid Fund ‐ Daily Dividend 10 265.03 2,650.25 LIC MF Interval Fund ‐ Monthly Plan ‐ Series 1 – Dividend
10 30.48 304.76
Reliance Liquid Fund ‐ TP ‐ IP ‐ Daily Dividend 10 270.03 2,700.27 Reliance FRF ‐ ST ‐ Weekly Dividend 10 150.99 1,509.89 Reliance Liquidity Fund ‐ Daily Dividend 10 50.00 500.03 Reliance Liquidity Fund ‐ Daily Dividend 10 270.03 2,700.31 Reliance Interval Fund ‐ Monthly Series I ‐ IP – Dividend
10 161.59 1,615.92
Reliance FHF 15 ‐ Series 2 ‐ Dividend 10 40.00 400.00 Religare FMP ‐ Series IV ‐ Plan A ‐ Dividend 10 40.54 405.41 Tata Liquid Fund ‐ SHIP ‐ Daily Dividend 1,000 1.60 1,600.18

Polaris Annual Report 2010‐11 115 Abridged Financial Statements Polaris Software Lab Limited (All amounts are in Rs. in Lacs, unless otherwise stated)
Notes to Abridged Financial Statements
[B17] The following investments were purchased and sold during the year (Contd...)
Particulars Face Value
in Rs. Units Cost
Tata FIP Fund – Series A 2 – IP – Monthly Dividend
10 30.25 302.46
Tata FIP Fund ‐ Series A3 ‐ IP ‐ Monthly Dividend 10 30.43 304.30 UTI Liquid Fund ‐ Cash Plan ‐ IP ‐ Daily Dividend 1,000 0.30 300.03 UTI Liquid Fund ‐ Cash Plan ‐ IP ‐ Daily Dividend 1,000 1.50 1,500.26 UTI Fixed Income Interval Fund ‐ Quarterly Plan I ‐ IP – Dividend
10 31.44 314.37
UTI Fixed Income Interval Fund ‐ Monthly Plan I ‐ IP – Dividend
10 30.57 305.72
UTI Fixed Income Interval Fund ‐ Monthly Plan II ‐ IP – Dividend
10 50.91 509.06
UTI Floating Rate Fund ‐ STP ‐ IP ‐ Daily Dividend 1,000 1.11 1,107.37
9. Key Ratios
March 31, 2011 March 31, 2010Ratios ‐ Operational performance
Operating profit / Total Revenue (%) 17.16 s15.16 PAT / Total Revenue (%) 13.21 11.25
Ratios ‐ Return Return on assets (PBT / Total Assets) (%) 17.84 14.77 PAT / Average Net worth (%) 22.04 17.73 Operating profit / Capital employed (%) 26.49 22.57
Ratios ‐ Balance Sheet Current ratio 1.49 1.33 Book value per share (Rs) 92. 45 78.83 Total Revenue / Total Assets (%) 1.17 1.14
10. [B9] As at March 31, 2011, the Company had no outstanding dues to Micro and Medium enterprises (March 31, 2010: Rs.Nil). The list of Micro and Medium enterprises was determined by the Company on the basis of information available with the Company. The Company also had no outstanding dues that require to be furnished under Section 22 of the Micro, Small and Medium Enterprises Development Act, 2006.
11. [B20] Previous year figures have been regrouped/reclassified, wherever necessary, to conform to current year presentation.
As per our report on the abridged financial statements of even date
For S.R.BATLIBOI & ASSOCIATES Firm Registration number: 101049W Chartered Accountants
For and on behalf of the Board of Directors of Polaris Software Lab Limited
per S. Balasubrahmanyam Partner Membership No 053315 Chennai April 28, 2011
Arun Jain Chairman & Managing Director R. Srikanth President & Chief Financial Officer Chennai April 28, 2011
B. Muthusubramanian Senior Vice President – Finance & Secretary
R.C. Bhargava Director
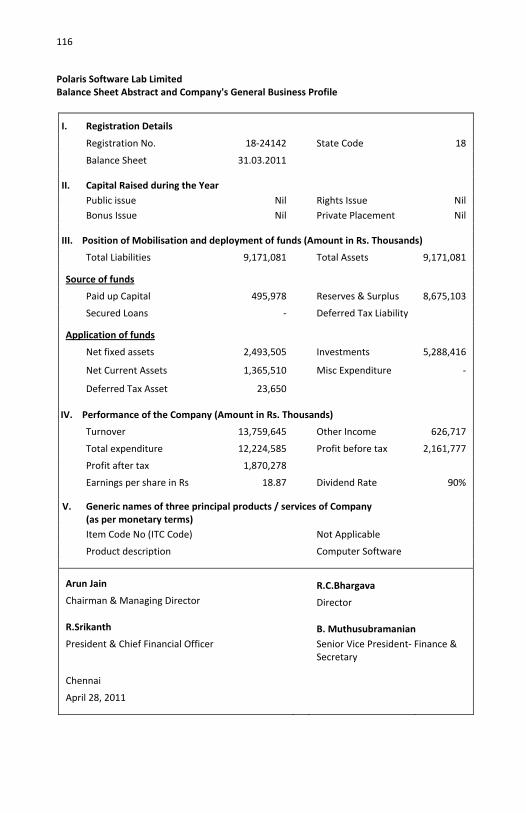
116
Polaris Software Lab Limited Balance Sheet Abstract and Company's General Business Profile
I. Registration Details
Registration No. 18‐24142 State Code 18 Balance Sheet 31.03.2011
II. Capital Raised during the Year Public issue Nil Rights Issue Nil Bonus Issue Nil Private Placement Nil
III. Position of Mobilisation and deployment of funds (Amount in Rs. Thousands) Total Liabilities 9,171,081 Total Assets 9,171,081
Source of funds Paid up Capital 495,978 Reserves & Surplus 8,675,103 Secured Loans ‐ Deferred Tax Liability
Application of funds Net fixed assets 2,493,505 Investments 5,288,416 Net Current Assets 1,365,510 Misc Expenditure ‐
Deferred Tax Asset 23,650
IV. Performance of the Company (Amount in Rs. Thousands) Turnover 13,759,645 Other Income 626,717 Total expenditure 12,224,585 Profit before tax 2,161,777 Profit after tax 1,870,278 Earnings per share in Rs 18.87 Dividend Rate 90%
V. Generic names of three principal products / services of Company (as per monetary terms)
Item Code No (ITC Code) Not Applicable Product description Computer Software
Arun Jain R.C.Bhargava Chairman & Managing Director Director
R.Srikanth B. Muthusubramanian President & Chief Financial Officer Senior Vice President‐ Finance &
Secretary
Chennai
April 28, 2011

117
POLARIS SOFTWARE LAB LIMITED Registered Office: Polaris House, No.244, Anna Salai, Chennai ‐ 600 006
Phone: 044 ‐ 2852 4154, Fax: 044 ‐ 2852 3280, Website: www.polaris.co.in
NOTICE
NOTICE IS HEREBY GIVEN THAT THE EIGHTEENTH ANNUAL GENERAL MEETING OF THE COMPANY WILL BE HELD ON WEDNESDAY THE 20TH JULY 2011 AT 2.30 P.M. AT CHINMAYA HERITAGE CENTRE, No.2, 13TH AVENUE, HARRINGTON ROAD, CHETPET, CHENNAI‐600 031 TO TRANSACT THE FOLLOWING BUSINESS:
ORDINARY BUSINESS
1. To receive, consider and adopt the Audited Balance Sheet as at March 31, 2011 and the Profit and Loss Account for the year ended on that date together with the reports of the Directors’ and the Auditors’ thereon.
2. To declare dividend for the financial year 2010‐11, if any.
3. To appoint a Director in the place of Dr.Ashok Jhunjhunwala, who retires by rotation and being eligible, offers himself for re‐appointment.
4. To appoint a Director in the place of Mr.R.C.Bhargava, who retires by rotation and being eligible, offers himself for re‐appointment.
5. To appoint Auditors of the Company to hold office from the conclusion of this meeting until the conclusion of the next Annual General Meeting of the Company and to authorize the Board of Directors to fix their remuneration. M/s S.R.Batliboi & Associates, Chartered Accountants, the retiring auditors are eligible for re‐appointment.
SPECIAL BUSINESS
6. To consider and if thought fit, to pass with or without modification(s), the following resolution as a SPECIAL RESOLUTION:
Resolved that pursuant to the provisions of Sections 198, 269, 309, 310 read with Schedule XIII and other applicable provisions, if any, of the Companies Act, 1956 consent of the company be and is hereby accorded for the re‐appointment of Mr.Arun Jain as Chairman & Managing Director of the company for a further period of five (5) years commencing from June 1, 2011 and ending on May 31, 2016 on the following terms and conditions:
(i) Salary: Nil
(ii) Bonus & Commission: Nil
(iii) Perquisites at actual cost, amount not exceeding Rs.20,00,000 /‐ (Rupees Twenty Lacs only) per annum as detailed hereunder:
(a) Reimbursement of medical expenses & leave travel allowance for self and family.
(b) Use of car with chauffeur and telephone at residence.
(c) Medical and accident insurance premium as per rules of the company and Key‐man Insurance, if any.
(d) Leave in accordance with the leave rules of the company from time to time in force.

118
Perquisites shall be evaluated at actual cost to the company and where it is not possible to ascertain the actual cost, such perquisites shall be evaluated as per the Income Tax Rules.
The term “family” means spouse, the dependent children and dependent parents.
Resolved further that the aggregate of the remuneration payable to Mr.Arun Jain as detailed in Sl. No.(i) to (iii) above shall be subject to the overall ceilings laid down under Section 198 and 309 of the Companies Act, 1956.
Resolved further that notwithstanding anything contained herein above, where, in any financial year during the tenure of his re‐appointment, the company has no profits or its profits are inadequate, the remuneration payable to Mr.Arun Jain shall be governed by and be subject to the ceilings provided under Section II of Part II of Schedule XIII to the Companies Act, 1956 or such other limits as may be prescribed by the Central Government from time to time as minimum remuneration.
Resolved further that during the tenure of his re‐appointment Mr.Arun Jain, Chairman & Managing Director shall not be liable to retire by rotation and shall perform all such duties as are entrusted to him from time to time by the Board of Directors and as may be required to be performed by him from time to time, subject to the supervision and control of the Board of Directors.
By Order of the Board For Polaris Software Lab Limited
Place: Chennai Date: April 28, 2011
B. MuthusubramanianSenior Vice President (Finance & Secretary)
NOTES:
1. A member entitled to attend and vote is entitled to appoint a proxy to attend and vote instead of himself and such proxy need not be a member of the Company. Voting is by show of hands unless a poll is demanded by a member or members present in person, or by proxy, holding at least one‐tenth of the total shares entitled to vote on the resolution or by those holding paid‐up capital of at least Rs.50,000/‐. A proxy shall not vote except on a poll. Proxies in order to be effective must be received by the Company at its Registered Office not less than 48 hours before the meeting. Shareholders holding requisite number of shares/voting power and who wish to demand a poll are requested to inform the Company of their intention to do so, to enable the Company to make appropriate arrangements for the conduct of poll.
2. Member/Proxy holder must bring the attendance slip to the meeting and hand it over at the entrance duly signed.
3. The Register of Members and Share Transfer Books of the Company will be closed from July 11, 2011 to July 20, 2011 (both days inclusive).
4. The Register of Directors’ Shareholding, maintained under Section 307 of the Companies Act, 1956 (herein after referred to as the ‘Act’) will be available for inspection by the members at the Annual General Meeting.
5. The Register of Contracts, maintained under Section 301 of the Act will be available for inspection by the members at the Registered Office of the Company.

119 6. The certificate from the Auditors of the Company certifying that the Company’s Associate
Stock Option Plan(s) are being implemented in accordance with the SEBI (Employees Stock Option Scheme and Employees Stock Purchase Scheme) Guidelines, 1999 as applicable and in accordance with the resolution of the Members in the General Meeting is available for inspection by the Members at the Annual General Meeting.
7. Members are requested to quote their Registered Folio Number or Demat Account number & Depository Participant (DP) ID number on all correspondences with the Company. The transfer deeds, communication for change of address, bank details, ECS details, mandates (if any), should be lodged with Registrar & Share Transfer Agents (RTA) of the company, M/s.Karvy Computershare Private Limited, Hyderabad. Members whose shares are held in the electronic mode are requested to intimate the same to their respective Depository Participants.
8. The Company is extending the Electronic Clearing Service (ECS) facility to the shareholders, which will enable the shareholders of the Company to receive dividend amount (credit) directly in to the bank account of shareholder.
9. Members who are holding physical shares in more than one folio are requested to intimate to the Company / RTA, the details of all their folio numbers for consolidation into a single folio.
10. The additional information pursuant to Clause 49 of the Listing Agreement with respect to the details of the Directors seeking re‐appointment in this 18th Annual General Meeting is furnished hereunder.
11. Dividend for the Financial Year ended March 31, 2004 which remains unclaimed will be due for transfer to the Investor Education Protection Fund (IEPF) of the Central Government later this year, pursuant to the provisions of Section 205A of the Act. Members who have not encashed their dividend warrants for the financial year ended March 31, 2004 or any subsequent financial year(s), are requested to correspond with M/s.Karvy Computershare Private Limited, Hyderabad. Members are requested to note once unclaimed dividend is transferred to IEPF pursuant to the Section 205C of the Act, no further claim shall be undertaken by the Company.
12. This notice for the 18th Annual General Meeting is attached hereto with the Annual Report for the financial year 2010‐11.
13. The Explanatory Statement pursuant to Section 173(2) of the Act is annexed hereto.
14. Green Initiative:
The Ministry of Corporate Affairs (MCA), Government of India through its Circular Nos. 17/2011 & 18/2011 dated April 21 & 29, 2011 respectively, has allowed Companies to send official documents to its shareholders in electronic form as a part of green initiative. Recognizing the said circular issued by MCA and also your Company proposes to send the Annual Report for the year ended March 31, 2011 in electronic form, to the email address provided by you and made available by the Depositories. Based on the MCA directives, the Annual Report in an easily accessible format will be made available on your Company website, www.polaris.co.in.

120
EXPLANATORY STATEMENT UNDER SECTION 173(2) OF THE COMPANIES ACT, 1956 FORMING PART OF THE NOTICE OF THE 18TH ANNUAL GENERAL MEETING SCHEDULED TO BE HELD ON JULY 20, 2011.
Item No. 6
Mr.Arun Jain is a promoter of Polaris Software Lab Ltd and has been in the Board since inception. He was initially appointed as a Managing Director w.e.f June 1, 1996 and he subsequently was re‐appointed as Chairman & Managing Director of the Company from time to time.
The existing tenure of his appointment expires on May 31, 2011 and the Remuneration & Compensation Committee and the Board of Directors of the Company have approved and recommended his re‐appointment for a further period of five years w.e.f June 1, 2011.
During the year Mr.Arun Jain, Chairman & Managing Director informed the Board about his decision not to draw remuneration from the Company, (salary & bonus) except certain essential perquisites. Mr.Arun Jain’s decision was considered by the Board and the same was appreciated for exhibiting such high standards as an entrepreneur. Accordingly, the Board approved a minimum salary of Rs.101/‐ per month, for the current tenure upto May 31, 2011 (within the overall limit approved by the Shareholders). However, on his re‐appointment he will not draw any salary except few perquisites on actual basis as listed in the resolution.
The above re‐appointment of Mr.Arun Jain and fixation of his terms by the Board shall be subject to the approval of the members under Section 269 of the Act. The re‐appointment, if approved by the members will have effect from June 1, 2011 for a further period of five years. Mr.Arun Jain shall not be liable to retire by rotation.
None of the Directors is concerned or interested in the aforesaid resolution except Mr.Arun Jain.
A notice pursuant to Section 302 of the Act was sent to all shareholders of the company.
Your Directors recommend the passing of the aforesaid Special Resolution.
For Polaris Software Lab Limited
Place: Chennai B.Muthusubramanian Date: April 28, 2011 Senior Vice President (Finance & Secretary)
Pursuant to the Listing Agreement, the additional information of those Directors who are seeking re‐appointment at the 18th Annual General Meeting to be held on July 20, 2011
Name Dr.Ashok Jhunjhunwala Mr.R.C.Bhargava Father’s name Mr.B.L.Jhunjhunwala Mr.M.P.BhargavaAddress # C2/2/5, Third Loop Road,
IIT Campus, Chennai – 600 036. 220, Sector 15A, Noida, Uttar Pradesh ‐ 201 301.
Date of birth June 22, 1953 July 30, 1934Nationality Indian IndianOccupation Service Retired Date of Appointment June 16, 2001 March 30, 1999
The Profile and attendance records of the Directors seeking re‐appointment are furnished in the Corporate Governance Report which forms part of the Annual Report 2010‐11.
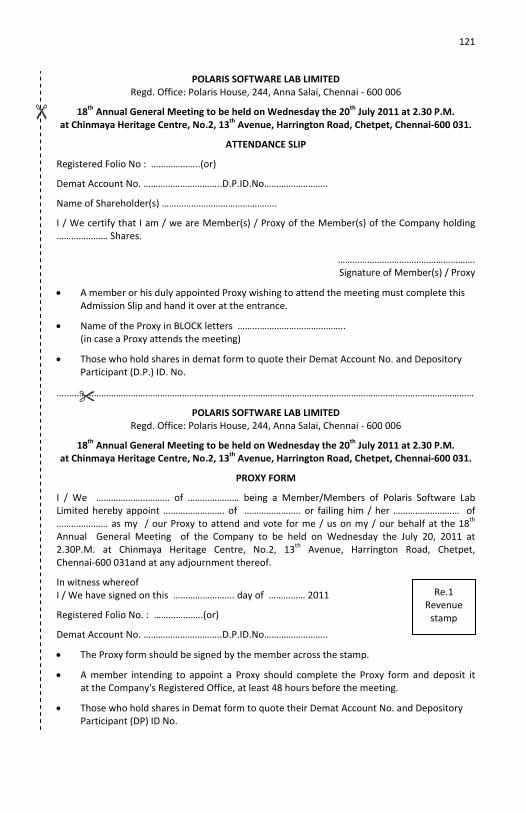
121
Re.1 Revenue stamp
POLARIS SOFTWARE LAB LIMITED Regd. Office: Polaris House, 244, Anna Salai, Chennai ‐ 600 006
18th Annual General Meeting to be held on Wednesday the 20th July 2011 at 2.30 P.M. at Chinmaya Heritage Centre, No.2, 13th Avenue, Harrington Road, Chetpet, Chennai‐600 031.
ATTENDANCE SLIP
Registered Folio No : ………………..(or)
Demat Account No. …………………………..D.P.ID.No……………………..
Name of Shareholder(s) ………………………………………..
I / We certify that I am / we are Member(s) / Proxy of the Member(s) of the Company holding ………………… Shares.
……………….………………………………. Signature of Member(s) / Proxy
• A member or his duly appointed Proxy wishing to attend the meeting must complete this Admission Slip and hand it over at the entrance.
• Name of the Proxy in BLOCK letters …………………………………….. (in case a Proxy attends the meeting)
• Those who hold shares in demat form to quote their Demat Account No. and Depository Participant (D.P.) ID. No.
…..……….………………………………………………………………………………………………………………..………………………
POLARIS SOFTWARE LAB LIMITED Regd. Office: Polaris House, 244, Anna Salai, Chennai ‐ 600 006
18th Annual General Meeting to be held on Wednesday the 20th July 2011 at 2.30 P.M. at Chinmaya Heritage Centre, No.2, 13th Avenue, Harrington Road, Chetpet, Chennai‐600 031.
PROXY FORM
I / We ………………………… of ………………… being a Member/Members of Polaris Software Lab Limited hereby appoint ……………………. of ………………….. or failing him / her ……………………… of ………………… as my / our Proxy to attend and vote for me / us on my / our behalf at the 18th Annual General Meeting of the Company to be held on Wednesday the July 20, 2011 at 2.30P.M. at Chinmaya Heritage Centre, No.2, 13th Avenue, Harrington Road, Chetpet, Chennai‐600 031and at any adjournment thereof.
In witness whereof I / We have signed on this ……………………. day of …………… 2011
Registered Folio No. : ………………..(or)
Demat Account No. …………………………..D.P.ID.No……………………..
• The Proxy form should be signed by the member across the stamp.
• A member intending to appoint a Proxy should complete the Proxy form and deposit it at the Company's Registered Office, at least 48 hours before the meeting.
• Those who hold shares in Demat form to quote their Demat Account No. and Depository Participant (DP) ID No.

122
This page has been intentionally left blank

123
NOTES

124
NOTES

• Belfast • Chennai • Chicago • Dubai
• Dublin • Frankfurt • Fremont • Hong Kong
• Hyderabad • London • Madrid • Manama
• Melbourne • Mississauga • Mumbai • Neuchatel
• New Delhi • New Jersey • Paris • Pittsburgh
• Riyadh • Santiago • Seoul • Singapore
• Sydney • Tokyo • Toronto • Utrecht • Wicklow
• Pune
Corporate Headquarters:
'Foundation', # 34, Rajiv Gandhi Salai,
Chennai - 603103. INDIA.
Phone: 91-44-27435001 / 91-44-39873000
Polaris Software Lab Limited
www.polarisFT.com
PS
L/C
OR
/AR
P/2
06
/01


