Page 1
2
More Money, More Opportunities: The Impact of a No-Loan Program on the Post-
Baccalaureate Enrollment Decisions of Low-Income and First-Generation Students
Dennis A. Kramer II, Ph.D.
University of Florida
Justin C. Ortagus, Ph.D.
University of Florida
Abstract
To counter the rising costs of higher education, institutions have increasingly turned to no-loan
programs to provide financial assistance to their low-income and first-generation students.
However, little is known of the influence of these no-loan programs on post-enrollment
outcomes. This study examines the impact of no-loan program participation on post-
baccalaureate enrolment decisions using a regression discontinuity approach. Results from this
study indicate a positive and statistically significant effect of no-loan program participation on
graduate school enrollment for historically underrepresented and disadvantaged students.
Acknowledgements
This study has been generously funded by the Access Group and the Association for Institutional
Research. We are grateful to both funders, especially Tinsley Smith, for their support.
Corresponding Author’s Contact Information: Dennis A. Kramer II, Ph.D.
Assistant Professor of Education Policy
Director, Education Policy Research Center
(352) 273-4315
[email protected]
Page 2
3
Introduction
First-generation and low-income students remain underrepresented within selective
colleges and universities due largely to their lack of financial resources (Tierney & Venegas,
2009; Pallais & Turner, 2006; Nora, Barlow, & Crisp, 2006). These historically underrepresented
students are concentrated primarily within community colleges and public regional institutions
rather than the public flagships and more-selective private institutions that continue to enroll a
disproportionate number of socioeconomically privileged students (Bastedo & Jaquette, 2011).
Numerous researchers have found that a student’s finances and ability to pay for college are
significant barriers to enrolling at a college or university (Heller, 1997; St. John, Tuttle, &
Musoba, 2006; Dynarski, 2008). Given these financial barriers to higher education, low-income
students, many of whom are also first-generation students, often make enrollment decisions
based on their ability to pay tuition and fees rather than their academic merit. One way for
colleges and universities to reduce the financial barriers facing many first-generation and low-
income students is to establish a no-loan program to cover unmet financial needs through direct
institutional grants or tuition discounts (Hillman, 2012).
Various scholars have examined the impact of no-loan programs, finding that such
programs have significantly increased undergraduate enrollment among low-income students at
selective institutions (Avery et al., 2006; Fiske, 2010; Pallais & Turner, 2006; Waddell &
Singell, 2011; Hillman, 2012). However, fewer researchers have examined the post-enrollment
effects of no-loan programs, and no study has explored the effect of no-loan program
participation on students’ likelihood to enroll in graduate school. Graduate education has been
shown to be positively associated with students’ labor market outcomes and overall quality of
life (Baum, Ma, & Payea, 2010). Many of the highest-paying professions are restricted to
Page 3
4
individuals who have earned a graduate degree, but the social and financial advantages of
graduate education appear to be distributed unequally, with low-income students being less
likely than their peers to enroll in graduate school and eventually complete their graduate degree
(Morelon-Quainoo et al., 2009).
Building on the work of Malcom and Dowd (2012) and Zhang (2013), who articulated
the role of student debt on graduate school enrollment, this study analyzes the effects of no-loan
program participation on students’ post-baccalaureate enrollment decisions. Capitalizing on the
strict income threshold, we use a student-level administrative data set from the University of
Florida and matched data from the National Student Clearinghouse to estimate the effect of
participation in the Machen Florida Opportunity Scholars Program (MFOSP), a no-loan
program. Specifically, this study is guided by the following research questions:
Research Question 1: Does participation in MFOSP affect the post-baccalaureate
enrollment decisions of low-income and first-generation college students?
Research Question 2: Does a reduction in student loans increase the likelihood of
students’ pursuing graduate or professional degrees?
Research Question 3: Do the effects of no-loan program participation vary according to
demographic or academic characteristics?
Results from this study indicate that participation in MFOSP is positively related to
graduate school enrollment. More specifically, we find that increases in the likelihood of
enrolling in graduate school are concentrated primarily within underrepresented minorities who
participated in MFOSP. Our results also indicate a divergent effect of MFOSP participation
among STEM and non-STEM bachelor’s degree recipients. Non-STEM graduates who
participated in MFOSP were shown to be more likely to enroll in graduate school, while MFOSP
Page 4
5
participation did not appear to make a statistically significant difference in the likelihood of
graduate enrollment among STEM graduate when compared to similar STEM graduates who did
not participate in MFOSP.
The Machen Florida Opportunity Scholars Program
In 2006, the University of Florida started MFOSP as a way of facilitating low-income
students’ access to and matriculation toward a college degree. Unlike most no-loan programs,
MFOSP provides students with not only significant financial support but also access to academic
counseling, cohort social engagement opportunities, and a community of student affairs
practitioners who help participating students meet both academic and social challenges. Each
year, the program is limited to approximately 300 incoming low-income (parental income of less
than $40,000 annually), first-generation, and in-state students. Unfortunately, MFOSP has
limited funding and cannot afford to serve all students who qualify to participate in the no-loan
program. In addition to providing scholarship support, the program provides additional support
in the form of peer mentors, financial literacy workshops, career planning, and one-on-one
academic coaching. This study will compare and analyze the graduate enrollment indicators of
students selected for MFOSP relative to students who have similar demographic and educational
characteristics but did not participate in MFOSP.
Literature Review
The primary aim of this section is to review literature related to the influence of financial
aid on student outcomes, previous research on no-loan programs, and the factors associated with
graduate school enrollment. Several of these studies focus specifically on first-generation and
low-income student populations within higher education. Accordingly, we draw on these distinct
literature bases to motivate this study.
Page 5
6
The Effect of Financial Aid on Postsecondary Students
Numerous studies have examined the role of financial aid—both need- and merit-based—
on student enrollment, matriculation, and success. Deming and Dynarski (2009) found that need-
based grant eligibility has a positive effect on whether students enroll in college, with the
estimated probability of enrollment increasing by 3% to 4% for each additional $1,000 in grant
aid eligibility. Additionally, Bettinger (2004) studied the persistence of Pell grant students and
found that the availability of Pell grants strongly reduced student attrition. Additional scholars
have suggested that the availability of need-based financial aid programs positively influences
degree attainment (Tierney & Venegas, 2009; Heller, 2002; McPherson & Morton, 1997).
Despite the well-established literature base on the role of need-based aid, surprisingly little
research has explored the effect of need-based grants on post-enrollment outcomes, such as
graduate enrollment decisions, even though need-based aid accounts for the vast majority of all
grant aid awarded by the state and federal governments (Baum, 2016).
Since the adoption of the first statewide merit-based scholarship program—Georgia’s
HOPE Scholarship—in 1993, merit-based financial aid policies have been viewed as another
mechanism for delivering financial aid to postsecondary students. Previous scholars have shown
that merit-based aid programs typically achieve their stated goals of increasing in-state student
enrollment (Dynarksi, 2002; Cornwell, Mustard, & Sridhar, 2006) and preventing talented
students from pursuing higher education elsewhere (Zhang & Ness, 2010). In addition, several
studies have examined the post-enrollment effects of merit-based scholarships on postsecondary
students (Bruce & Carruthers, 2011; Dynarski, 2008; Scott-Clayton, 2011). This shift toward
merit-based financial aid may limit the amount of postsecondary available to low-income
Page 6
7
students, causing the postsecondary students with the greatest financial need to turn to loans to
finance their postsecondary education.
Prior Research on No-Loan Programs
Although little is known about the influence of need-based grants on graduate school
enrollment, the literature on the influence of no-loan programs on graduate school enrollment is
even less robust. Regarding the impact of no-loan programs on undergraduate enrollment, Pallais
and Turner (2006) found that the University of Virginia experienced an increase in the
enrollment of low-income students in the first year of the implementation of its no-loan program.
The authors also concluded that no-loan programs would have differential effects depending on
the state in which they were located. The no-loan program at Harvard University, the Harvard
Financial Aid Initiative, also appeared to lead to an increase in the proportion of low-income
students among first-year undergraduate students in the fall of 2006 (Avery et al., 2006).
Additionally, Linsenmeier, Rosen, and Rouse (2006) analyzed an anonymous institution’s
decision to eliminate loans for all students and reported that no-loan programs did not
significantly increase enrollment among all types of low-income students but did positively and
significantly affect the matriculation rate of low-income minority students.
Waddell and Singell (2011) examined low-income student enrollments before and after
the introduction of no-loan policies within a national sample of public four-year universities. The
authors found a positive effect on the number of low-income students after the adoption of a no-
loan program. Waddell and Singell also reported that low-income students who participated in
the no-loan program were more academically prepared and faced a lower risk of attrition when
compared to their low-income peers who were not enrolled in a no-loan program. However,
Hillman (2012) cautioned that the adoption of no-loan programs could further stratify
Page 7
8
opportunities for low-income students within higher education by “skimming” the highest-
achieving low-income students rather than adopting a broad strategy of support for all qualified
low-income students. Although a number of researchers have examined the undergraduate
enrollment effects of no-loan program adoption, this study represents the first attempt to examine
the long-term influence of no-loan programs by examining the impact of no-loan program
participation on the likelihood of enrolling in graduate school.
Factors Related to Graduate School Enrollment
Despite the well-established benefits of graduate education (Baum et al., 2010; Hearn &
Holdsworth, 2004), historically underrepresented student populations are not as likely to enroll in
graduate school (Perna, 2004). Low-income students, in particular, are less likely than their more
affluent peers to enroll in graduate school (Morelon-Quainoo et al., 2009). Previous researchers
have noted that additional factors may affect students’ likelihood of enrolling in graduate school.
Zhang (2005) found that attending a high-quality undergraduate institution increases the
likelihood of attending graduate school—a predictable trend given that a larger share of
advantaged and affluent students enroll in these high-quality institutions (Cabrera & La Nasa,
2001; Zhang, 2003). Academic disciplines (Bedard & Herman, 2008; Sax 2001), gender (Sax,
2001; Perna, 2004; Pascarella et al., 2004), and race (Perna, 2004; Pascarella et al., 2004) are
also significant predictors of graduate school enrollment. Johnson (2013) found that graduate
school enrollment is influenced by a host of external factors, such as local, state, and national
economic indicators.
Although scholars have documented numerous factors affecting graduate school
enrollment, much of the academic literature has focused on the role of undergraduate debt on
graduate school enrollment. Fox (1992) found that undergraduate debt led to women becoming
Page 8
9
slightly less likely to enroll in graduate and professional school, but the author also noted that
undergraduate debt appears to lead to a shift in enrollment toward doctoral programs rather than
other post-baccalaureate degree programs. Weiler (1994) extended earlier work and reported that
the level of undergraduate student was not a significant factor in the decision to enroll in
graduate school.
Millett (2003) quantified the relationship between undergraduate debate and graduate
school enrollment, finding that students with student loan debt of $5,000 or higher are
significantly less likely to apply to graduate or professional school relative to their peers who did
not have educational debt. Zhang (2013) found that the negative relationship between
undergraduate debt and graduate school enrollment were primarily concentrated within doctoral
(Ph.D.), MBA, and first professional programs. Malcom and Dowd (2012) reported that
borrowing at typical debt levels negatively affected graduate school enrollment for students of
every racial/ethnic group included in their study. Although several studies appear to suggest a
negative relationship between student loan debt and graduate school enrollment, the student
population most negatively affected by student loan debt—low-income and first-generation
students—has yet to be fully examined.
Conceptual Framework
To provide the rationale for this study, we are guided by the economic theory of human
capital and the random utility model of student choice to explain the rationale for the analysis. In
relation to higher education, the theory of investment in human capital (Mincer, 1958) suggests
that students make decisions about continuing their education based on the costs and benefits
associated with enrollment. For example, the decision to enroll in graduate school is subject to a
variety of considerations, such as the direct costs of tuition and fees and the opportunity costs of
Page 9
10
foregone earnings, before determining whether graduate education is a worthwhile investment.
The prospective graduate student weighs the costs and expected benefits of graduate education
and only enrolls in graduate school if the costs of graduate enrollment are outweighed by the
expected benefits (DesJardins & Toutkoushian, 2005; Paulsen & Toutkoushian, 2008).
As noted by DesJardins and Toutkoushian (2005), the relative uncertainty of future
benefits associated with graduate education coupled with an individual’s willingness to accept
risk can complicate the decision to enroll in graduate school. The random utility model of student
choice can be used to explain an individual’s decision despite under these types of uncertainty.
This model has been used in earlier work to study student choice (DesJardins, Ahlburg, &
McCall, 2006), as students will attempt to maximize their net utility when making their decision
to choose among schooling and non-schooling alternatives (DesJardins & Toutkoushian, 2005).
Following the logic outlined by previous applications of the random utility model of
student choice (DesJardins & Toutkoushian, 2005; Muñoz, Harrington, Curs, & Ehlert, 2016),
we define the utility individuals receive based on their decision to attend graduate school as
follows:
Uig =U (Fg, Fi , Ni )
where U is the utility that individual i obtains from choosing to enroll in graduate school g. The
inputs to the utility function are defined as follows: F represents the financial factors related to
attending graduate school g (e.g., tuition and fees); F also represents financial factors associated
with individual i (e.g., no-loan program eligibility); and N represents non-financial individual
characteristics associated with the utility of the decision to enroll in graduate school (e.g.,
academic ability; undergraduate major).
Page 10
11
Although an individual’s utility is unobservable, we can deduce that utility is maximized
based upon the student’s decision. In other words, when a student chooses graduate school (g)
over the non-graduate school alternatives (h), we can deduce that g provided the student with
greater net benefits (utility) relative to the non-graduate school option of entering the labor
market with sub-graduate level credentials. In line with DesJardins and Toutkoushian (2005) and
Muñoz et al. (2016), we model utility maximization as Uig > Uih.
To examine whether participation in a no-loan program impacts the decision to enroll in
graduate school, we apply the economic theory of human capital and the random utility model of
student choice. As noted earlier, the student’s decision is based upon whether the direct and
opportunity costs of graduate enrollment are outweighed by the benefits associated with graduate
education. Because prior work has shown that low-income students are debt-averse (Burdman,
2005), we hypothesize that students who participate in MFOSP (a no-loan program) are more
likely to enroll in graduate school because their similar peers will be reluctant to take out student
loan debt to pursue graduate studies. In addition, this debt aversion established in previous
literature is compounded by informational asymmetries that lead many low-income and first-
generation students to determine that the cost of graduate school is too high despite the well-
established benefits of graduate education.
5. Data and Research Design
To answer our research questions, we used student-level administrative data from the
University of Florida and graduate school enrollment data from the National Student
Clearinghouse’s Student Tracker database. Specifically, we gained access to the administrative
database for five cohorts of incoming first-year students (fall 2005 to fall 2009) and tracked their
Page 11
12
bachelor’s degree completion and post-baccalaureate enrollment decisions through fall 2016.1
Considering the nature of the no-loan program studied within this paper, we limited our sample
to first-generation college students.2 Our total analytical sample included 8,570 students evenly
distributed across our analytical time period. In addition to offering access to bachelor’s degree
completion and graduate school enrollment data, our analytical dataset includes (1) pre-college
academic characteristics, (2) family’s educational and financial information, (3) student
demographic information, (4) postsecondary financial indicators (total loans, on-campus work
earnings, cumulative Pell Grant awards), and (5) postsecondary academic and enrollment
outcomes (credits earned, degree major, degree GPA, and enrollment patterns).
Variables
Independent/Forcing Variable
Despite the complexities associated with qualifying for MFOSP, first-generation status
and parental income levels are the primary requirements. Considering that we have restricted our
sample to first-generation college students, the independent/forcing variable for our regression
discontinuity design is parental income. Notwithstanding the widely distributed and known
income threshold of $40,000, prior research has demonstrated that students have a difficult time
manipulating parental income systematically (Rubin, 2011). Because students must have been
admitted to the university before being considered for the no-loan program, we find it unlikely
that students, or their parents, would purposely earn less than $40,000 to qualify for the program
without any guarantee of admission to the University of Florida.
1 We limited our analytical sample to fall 2009 enrollees to ensure enough time for students to graduate with a
bachelor’s degree and make a decision about graduate school enrollment. 2 Based on the university’s definition of “first-generation” and the requirements for participation within the no-loan
program, first-generation status is given to students whose parents did not enter or complete any postsecondary
education. Students whose siblings have completed or enrolled in college can be considered first-generation
students.
Page 12
13
Dependent Variables
To test the effect of no-loan program participation on post-baccalaureate enrollment
outcomes, we use a variety of expected and actual graduate school enrollment indicators. First,
we examine students’ level of desire to enroll in graduate school while they are undergraduate
students. Using administratively linked data from the Student Experience in the Research
University (SERU) survey, we analyze the likelihood of students indicating that they expect to
enroll in graduate school in either their third- or their fourth-year survey response. Second, we
use graduate school enrollment data from the National Student Clearinghouse (NSC) to examine
post-baccalaureate enrollment behaviors. NSC data allow us to analyze each program type
(master’s, doctoral, professional degree) at the student level. We are able to capture and code
students who have enrolled in multiple graduate programs during the time period of our
analytical sample. For example, a student who pursued a master’s degree directly after
graduation and a law degree three years later would be coded as having enrolled in both a
master’s degree program and a professional degree program. Because we wanted to capture
student graduate program decision making, students enrolling in a Ph.D. program were not coded
as having also enrolled in a master’s degree, even though many Ph.D. program enrollees earn a
master’s degree as part of their Ph.D. studies.
Covariates
One of the primary assumptions surrounding our analytical strategy is that students on
either side of the income threshold are “normally” distributed across factors that not only affect
assignment to the treatment but also may affect dependent variables independently. To this end,
we include a variety of the pre-college characteristics that are associated with enrollment and
success in undergraduate education but may also directly affect the likelihood of graduate school
Page 13
14
enrollment: (1) high school GPA, (2) SAT/ACT composite scores, (3) number of AP/IB courses
completed, (4) parental income and financial asset information,3 and (5) student race/ethnicity
and gender.
Analytical Strategy
To estimate the causal effects of no-loan program participation on graduate school
enrollment, we exploit the established and strict income cutoff required to qualify for no-loan
program participation and apply a regression discontinuity research design to estimate the effects
of falling just below (or above) the cutoff. We capitalize on the randomness of a student’s
position with respect to parental income and the differential effect of access to the no-loan
program to identify the causal effects of participation in the no-loan program. Our analytical
approach relies on a fuzzy regression discontinuity (FRD) design (Imbens & Lemeuix, 2008).
We operationalize our regression discontinuity design by using instrumental variables
within a two-stage least squares estimation strategy. In our two-stage approach, we rely on the
indicator of a student’s position just below the income threshold as an instrumental variable for
access to the no-loan program. In the first stage, we model the probability that a student has
access to the no-loan program as a function of the cutoff on the income continuum and that
student’s position just below that cutoff using the following model:
Pr(𝑁𝐿𝑖𝑐) = 𝜋0 + 𝜋1𝐵𝐸𝐿𝑂𝑊𝑖𝑐 + 𝜋2𝑓(𝑅𝑉)𝑖𝑐 + 𝜋3𝐵𝐸𝐿𝑂𝑊 × 𝑅𝑉𝑖𝑐 + 𝑿𝒊𝒄′ 𝜷 + 𝛾𝑖 + 𝜀𝑖𝑐 (1)
In this model, Pr(𝑁𝐿𝑖𝑐) is the probability of accessing the no-loan program for student i in
school s in entrance cohort c, 𝑅𝑉𝑖𝑐is our running or forcing variable—parental income—used to
signal eligibility for the program, 𝐵𝐸𝐿𝑂𝑊𝑖𝑐is a binary indicator of falling below the threshold,
𝐵𝐸𝐿𝑂𝑊 × 𝑅𝑉𝑖𝑐is an interaction term that allows the relationship between the forcing variable
3 Because we limited our sample to only first-generation college students, we did not include parental education
level.
Page 14
15
and outcome to differ for treated and nontreated students, 𝑿𝒊𝒄′ is a vector of student-level
covariates to improve statistical precision (as shown in the appendix, the core results are not
affected when including or excluding covariates, although including them improves statistical
precision), 𝛾𝑐is a set of application cohort fixed effects, and 𝜀𝑖𝑐is the error.
We then use the fitted probabilities that a student will access the no-loan program as the
first stage in estimating the effect of participation in the no-loan program on our graduate
enrollment outcomes (already discussed) by using the following specification:
𝑌𝑖𝑐 = 𝜃0 + 𝜃1Pr(𝑁�̂�𝑖𝑐) + 𝜃2𝑓(𝑅𝑉)𝑖𝑐 + 𝜃3𝐵𝐸𝐿𝑂𝑊 × 𝑅𝑉𝑖𝑐 +𝑿𝒊𝒄′ 𝜷 + 𝛾𝑐 + 𝜀𝑖𝑐 (2)
In this specification, all terms are defined as they were previously, with only the fitted values
from the first stage as a new term. The key parameter of interest is 𝜃1, which represents the local
average treatment on graduate enrollment outcomes, relative to those of students just above the
participation income threshold.
Testing Required Model Assumptions
Ensuring that the appropriate conditions are met to support the use of the regression
discontinuity design is a necessary precursor for this analysis. Pursuant to established
methodological literature (Imbens & Lemeuix, 2008; Schochet et al., 2010), a valid regression
discontinuity (RD) design must demonstrate a smooth and continuous distribution of the forcing
variable and balance of observable characteristics among units of analysis that fall just below or
above the plausibly exogenous cutoff used to define the treatment. Our data satisfy both of these
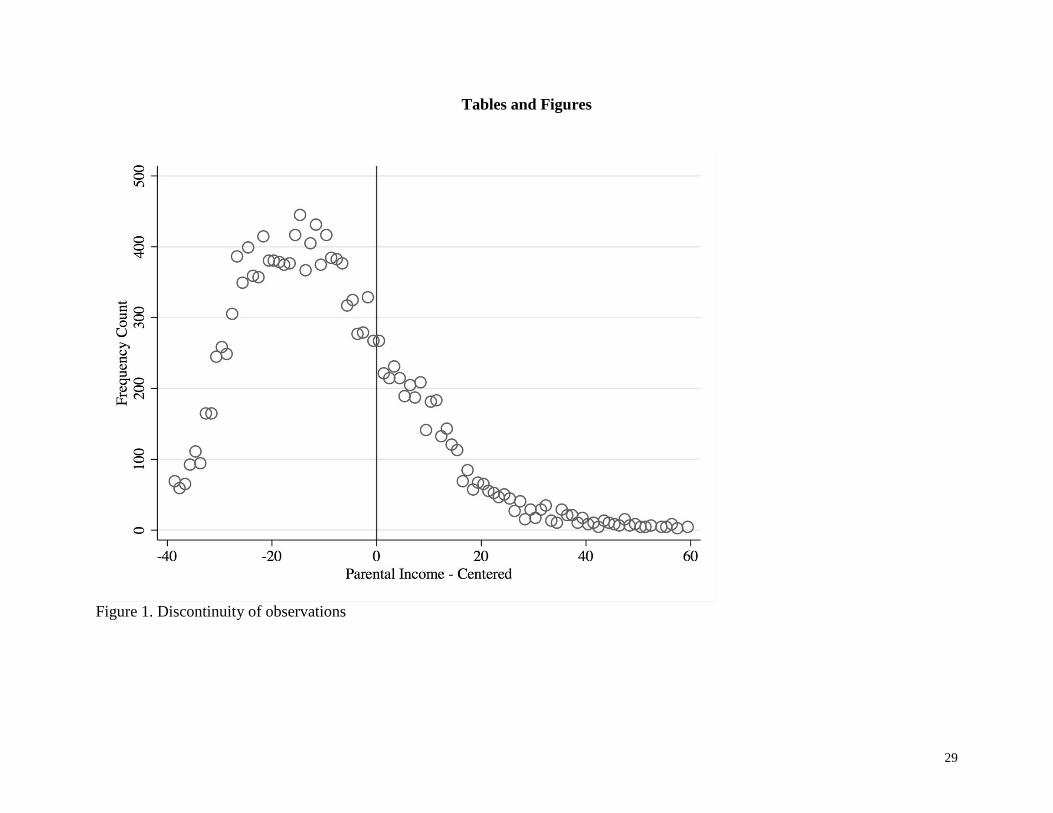
criteria across each of the thresholds that we evaluated. Figure 1 presents the distributions of
observations along our forcing variable. We fail to find any visual evidence of manipulation at
the $40,000 income cutoff. Additionally, we conduct an informal McCrary test of
Page 15
16
manipulation—using the STATA command rddensity—and find no statistical evidence on
differences in observations around the cutoff.
--- Figure 1 Here ---
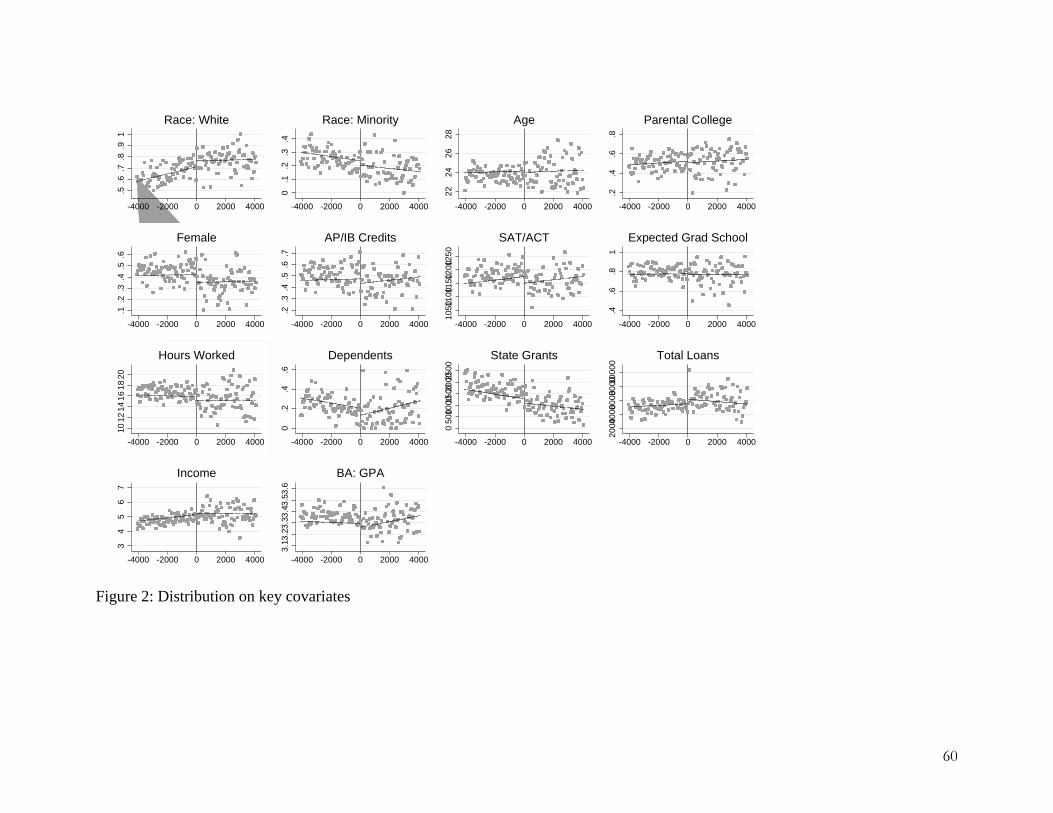
In Figure 2, we present the distribution of the running variable on key pre-college factors.
As we display later in this paper, there does not appear to be any visual evidence of
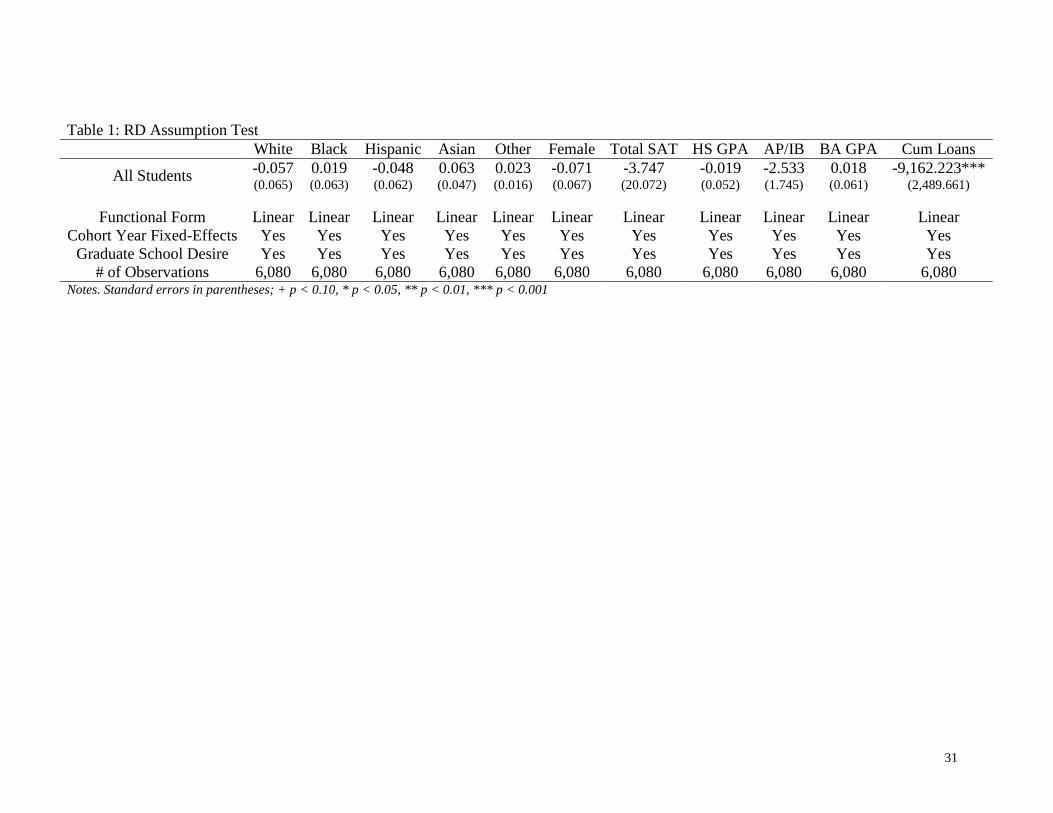
discontinuities in any of our key pre-college characteristics. Table 1 provides our formal test of
the differences among graduate enrollment outcomes and confirms no statistical differences
around the threshold in key pre-college characteristics. We do find that MFOSP no-loan program
participants have lower cumulative loan debt—$9,162.22 on average—which is expected given
the intervention associated with no-loan program participation.
--- Figure 2 Here ---
--- Table 1 Here ---
Results
Descriptives
Table 2 provides means and standard deviations for our primary graduate school
enrollment indicators and the key predictors discussed previously. Table 2 also provides a
breakdown of these descriptive by group membership: (1) MFOSP participants, (2) MFOSP
qualifier but nonparticipant, and (3) MFOSP non-qualifier.
---Table 2 Here ---
Our descriptive results suggest a potential difference between MFOSP participants and non-
participants in terms of graduate school enrollment. This is most evident in master’s degree
programs, with 27.4% of MFOSP graduates enrolling in a master’s program compared to 18.2%
for qualifying non-participants and 19.5% for non-qualifiers. Enrollment in Ph.D. programs
Page 16
17
appears to be constant across our groups. Participants in MFOSP appear to be less likely to enroll
in a professional degree program relative to members of the other two groups.
Overall Graduate School Enrollment
Table 3 provides our main RD effects on actual graduate school enrollment according to
the type of degree program. Across each of our specifications, the core assumption of our fuzzy
RD design—that the assignment variable serves an effective instrument for participation in the
no-loan program—is met. We present three specifications to examine the influence of no-loan
program participation on graduate school enrollment. Specification (1) presents our base FRD
estimates. Specification (2) extends our first specification to include a cohort (time) fixed-effects
to account for time since bachelor’s degree completion. Specification (3) includes a binary
indicator (yes or no) of whether the student indicated interest in enrolling in graduate school
during his or her first or second year. This is important to include, as it accounts for baseline
interest in graduate school enrollment and helps explain any endogenous influences (Xu, 2016).
Specification (3) is our preferred specification, but it only enhances the precision of our
estimates and does not change the directionality of our relationships.
We find that participation in the MFOSP no-loan program is associated with statistically
significant increases in the likelihood of enrollment in graduate school—21.6% on average. This
effect was primarily concentrated in master’s-level programs. Interestingly, participation in the
MFOSP no-loan program significantly decreases the likelihood of student enrollment in Ph.D.
programs—11.3% on average. Although it is not statistically significant, we find suggestive
evidence of a positive relationship between MFOSP no-loan program participation and
enrollment in professional programs.
--- Table 3 Here ---
Page 17
18
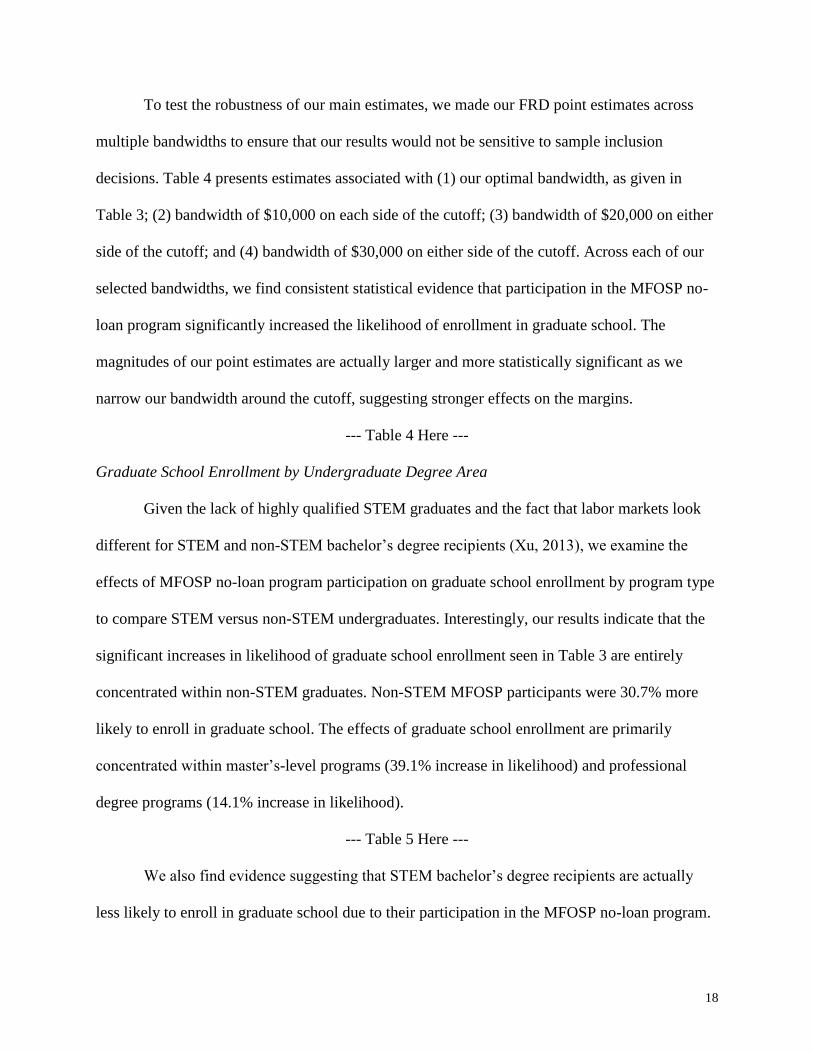
To test the robustness of our main estimates, we made our FRD point estimates across
multiple bandwidths to ensure that our results would not be sensitive to sample inclusion
decisions. Table 4 presents estimates associated with (1) our optimal bandwidth, as given in
Table 3; (2) bandwidth of $10,000 on each side of the cutoff; (3) bandwidth of $20,000 on either
side of the cutoff; and (4) bandwidth of $30,000 on either side of the cutoff. Across each of our
selected bandwidths, we find consistent statistical evidence that participation in the MFOSP no-
loan program significantly increased the likelihood of enrollment in graduate school. The
magnitudes of our point estimates are actually larger and more statistically significant as we
narrow our bandwidth around the cutoff, suggesting stronger effects on the margins.
--- Table 4 Here ---
Graduate School Enrollment by Undergraduate Degree Area
Given the lack of highly qualified STEM graduates and the fact that labor markets look
different for STEM and non-STEM bachelor’s degree recipients (Xu, 2013), we examine the
effects of MFOSP no-loan program participation on graduate school enrollment by program type
to compare STEM versus non-STEM undergraduates. Interestingly, our results indicate that the
significant increases in likelihood of graduate school enrollment seen in Table 3 are entirely
concentrated within non-STEM graduates. Non-STEM MFOSP participants were 30.7% more
likely to enroll in graduate school. The effects of graduate school enrollment are primarily
concentrated within master’s-level programs (39.1% increase in likelihood) and professional
degree programs (14.1% increase in likelihood).
--- Table 5 Here ---
We also find evidence suggesting that STEM bachelor’s degree recipients are actually
less likely to enroll in graduate school due to their participation in the MFOSP no-loan program.
Page 18
19
This effect is shown primarily by the decreased likelihood of MFOSP participants enrolling in
STEM Ph.D. programs.
Graduate School Enrollment by Race/Ethnicity
Despite the core focus of MFOSP on supporting first-generation and low-income
students, MFOSP also enrolls a significant proportion of students from traditionally
underrepresented and disadvantaged racial/ethnic groups. Table 6 provides our FRD estimates by
both program type and race/ethnicity. Overall, we find that participation in the MFOSP no-loan
program appears to positively affect the likelihood of graduate school enrollment for
underrepresented students within higher education. This is particularly evident for participating
Hispanic students, who had a 121% increase in likelihood of enrollment in graduate school.
Although it is not statistically significant, we also find suggestive evidence of increases in the
likelihood of graduate school enrollment for MFOSP participants identifying as African
American or Black.
--- Table 6 Here ---
In addition to findings related to overall graduate school enrollment effects, we also
found that the influence of participating in MFOSP varied according to the level of graduate
programs. Participation in a no-loan program appeared to influence the type of graduate
programs differently according to the MFOSP participant’s race/ethnicity. For students who
identified as Hispanic/Latino or African American/Black, participation in a no-loan program
significantly increased the likelihood of enrollment in master’s-level degree program (78.7% and
32.5%) and professional doctorate programs (39.4% and 8.4%). This is in stark contrast to
students who identified as Asian or Pacific Islander, as these students had a significant decrease
in their overall graduate school enrollment (52.8%) and master’s program enrollment (60.4%)
Page 19
20
but a significant increase in the likelihood that they would pursue a Ph.D. degree (11.8%).
Graduate school enrollment—regardless of the type of graduate program—for White or
Caucasian students was not significantly affected by participation in MFOSP.
Conclusion and Discussion
Graduate education has been identified as a primary way for underprivileged students to
climb the social ladder (Baum, Ma, & Payea, 2010). This study has examined the effect of
participation in a no-loan program on the likelihood of first-generation and low-income students
enrolling in graduate school. Overall, we found positive and statistically significant evidence that
participation in a no-loan program (MFOSP) increased graduate school enrollment for these
historically underrepresented and disadvantaged students. Our results are consistent with
previous findings related to the significant role that undergraduate student debt plays in students’
graduate school enrollment decisions (Malcom & Dowd, 2012; Zhang, 2013), as participating in
MFOSP effectively reduces the cost burden for students and enables them to pursue graduate
education. Although it is plausible that some students enter graduate school as a way of deferring
the repayment of their student loans (Baum & O’Malley, 2003), our estimates illustrate an
inverse relationship to such a claim by showing that students with significantly less student loans
have a higher likelihood of graduate school enrollment.
The positive effects of participation in the MFOSP on graduate school enrollment were
not uniform across graduate degree program types. Specifically, we found that a reduction in
student loans increased graduate school enrollment in master’s and professional degree
programs. These results align with the work of Zhang (2013), who found that increases in
undergraduate student debt decrease the likelihood of enrollment in master’s and professional
degree programs. Our findings suggest that removing the financial burden for first-generation
Page 20
21
and low-income students may allow them to pursue graduate degree programs that would
otherwise have significant tuition-related costs (e.g., MBA, JD, MD).
The differential effects associated with the influence of MFOSP participation on the type
of graduate programs and racial/ethnic subgroup membership were also noteworthy. Our
findings confirm the work of Kim, DesJardins, and McCall (2009), who also demonstrated that
financial aid policies have varying effects on students from different racial/ethnic subgroups.
Contrary to our expectations, participation in MFOSP had little or no effect on graduate school
enrollment for White first-generation and low-income students. Results suggesting a positive
effect of MFOSP participation on graduate school enrollment for African American/Black
students confirm previous claims of students’ elevated confidence to pursue advanced degrees
associated previously with participation in the Gates Millennium Scholarship (GMS) program
(Marks & Reid, 2013).
Participation in a no-loan program had the greatest effect for Hispanic students; this
finding is in direct alignment with the work of Gross, Torres, and Zerquera (2013), who found
that reductions in the cost of an undergraduate degree affected Hispanic/Latino student
persistence and completion more than they did for any other racial/ethnic subgroup. The effects
of Hispanic/Latino students’ participation in MFOSP are particularly promising considering their
significant underrepresentation in U.S. graduate education. According to the National Center for
Education Statistics (NCES) Digest of Education Statistics (2013), Hispanic students make up
the lowest proportion of students enrolled in graduate degree programs, with only 7% of the total
number of graduate students identifying as Hispanic. That same NCES report reported that
Hispanic/Latino students who did enroll in graduate school did so disproportionately in four
fields: (1) education, (2) business, (3) health, and (4) law, which provides additional insight into
Page 21
22
our finding suggesting that MFOSP participation significantly increases master’s and
professional degree program enrollment for Hispanic/Latino students.
Despite our analytical approach and the robustness checks we have employed, this study
is subject to several limitations. First, we examine graduate school enrollment rather than
applications to graduate school. Considering the multidimensionality of graduate school
admissions—students apply but institutions admit—our estimates capture the desires of both
students’ and graduate institutions. Although we find similarities among students on
undergraduate indicators (degree GPA and major choice), future research could examine the
graduate school application behaviors of students. Second, our sample is limited to first-
generation bachelor’s degree completers at a single public research and state flagship institution,
and this study cannot be considered generalizable across higher education. Finally, our analysis
examined only enrollment in graduate school. Future studies can explore completion outcomes
after students gain access to graduate school. Considering the influence of debt on the likelihood
of completion within graduate degree programs (Malcom & Dowd, 2012; Zhang, 2013), one can
reasonably deduce that participation in a no-loan program would have a similar positive effect on
graduate degree completion.
As institutions continue to look for ways to support students, particularly those from low-
income and first-generation backgrounds, no-loan programs have grown in popularity. Various
scholars (Avery et al., 2006; Hillman, 2012; Waddell & Singell, 2011) have documented the
positive effects of no-loan program adoption on undergraduate enrollment among low-income
students. However, little is known of the long-term effects of no-loan program participation. This
study adds to the growing evidence of the potential effect of no-loan programs by filling this gap
within the academic literature. Adding to prior evidence of the potential externalities of no-loan
Page 22
23
programs is particularly important considering the substantial institutional costs associated with
program implementation.4 By complementing previous studies of the short-term effect of no-loan
program adoption with our findings related to the long-term impacts of MFOSP can potentially
help proponents of no-loan programs seeking to justify additional adoptions of no-loan programs
throughout higher education.
4 At the University of Florida, MFOSP—which is more targeted than most no-loan programs are—has an estimated
cost of $13 million annually.
Page 23
24
8. References
Avery, C., Hoxby, C. M., Jackson, C. K., Burek, K., Pope, G., & Raman, M. (2006). Cost should
be no barrier: An evaluation of the first year of Harvard’s financial aid initiative.
Cambridge, MA: National Bureau of Economic Research. Retrieved from http://www.
nber.org/papers/w12029
Baum, S., & O'Malley, M. (2003). College on credit: How borrowers perceive their education
debt. Journal of Student Financial Aid, 33(3), 1.
Baum, S., Ma, J., & Payea, K. (2012). Trends in public higher education: Enrollment, prices,
student aid, revenues, and expenditures. Retrieved from College Board Trends in Higher
Education Series website: http://trends. collegeboard. org/sites/default/files/trends-2012-
public-higher-educationexpenditures-brief. pdf.
Becker, G. S. (1964). Human capital theory. Columbia, New York.
Becker, G. S. (1976). Altruism, egoism, and genetic fitness: Economics and
sociobiology. Journal of economic Literature, 14(3), 817-826.
Becker, G. S. (1993). Nobel lecture: The economic way of looking at behavior. Journal of
political economy, 101(3), 385-409.
Becker, G. S. (1994). Human capital revisited. In Human Capital: A Theoretical and Empirical
Analysis with Special Reference to Education (3rd Edition) (pp. 15-28). The University
of Chicago Press.
Bedard, K., & Herman, D. A. (2008). Who goes to graduate/professional school? The importance
of economic fluctuations, undergraduate field, and ability. Economics of Education
Review, 27(2), 197-210.
Page 24
25
Bettinger, E. (2004). How financial aid affects persistence. In College choices: The economics of
where to go, when to go, and how to pay for it (pp. 207-238). University of Chicago
Press.
Bruce, D. J., & Carruthers, C. K. (2014). Jackpot? The impact of lottery scholarships on
enrollment in Tennessee. Journal of Urban Economics, 81, 30-44.
Cabrera, A. F., & La Nasa, S. M. (2001). On the path to college: Three critical tasks facing
America's disadvantaged. Research in Higher Education, 42(2), 119-149.
Cornwell, C., Mustard, D. B., & Sridhar, D. J. (2006). The enrollment effects of merit-based
financial aid: Evidence from Georgia’s HOPE program. Journal of Labor
Economics, 24(4), 761-786.
Deming, D., & Dynarski, S. (2009). Into college, out of poverty? Policies to increase the
postsecondary attainment of the poor (No. w15387). National Bureau of Economic
Research.
DesJardins, S. L., & McCall, B. P. (2014). The impact of the Gates Millennium Scholars
Program on college and post-college related choices of high ability, low-income minority
students. Economics of Education Review, 38, 124-138.
Dynarski, S. (2004). The new merit aid. In College choices: The economics of where to go, when
to go, and how to pay for it (pp. 63-100). University of Chicago Press.
Dynarski, S. (2008). Building the stock of college-educated labor. Journal of human
resources, 43(3), 576-610.
Elster, J. (1986). Rational choice. NYU Press.
Page 25
26
Fenske, R. H., Porter, J. D., & DuBrock, C. P. (2000). Tracking financial aid and persistence of
women, minority, and needy students in science, engineering, and mathematics. Research
in Higher Education, 41(1), 67-94.
Fiske, E. (2010). The Carolina Covenant. in R. Kahlenberg (Ed.), Rewarding Strivers: Helping
Low-Income Students Succeed in College (pp. 17–70). New York, NY: The Century
Foundation.
Gross, J. P., Torres, V., & Zerquera, D. (2013). Financial aid and attainment among students in a
state with changing demographics. Research in Higher Education, 54(4), 383-406.
Heller, D. E. (Ed.). (2002). Condition of access: Higher education for lower income students.
Westport, Conn.: American Council on Education/Praeger.
Hillman, N. W. (2013). Economic diversity in elite higher education: Do no-loan programs
impact Pell enrollments?. The Journal of Higher Education, 84(6), 806-833.
Imbens, G. W., & Lemieux, T. (2008). Regression discontinuity designs: A guide to
practice. Journal of econometrics, 142(2), 615-635.
Johnson, M. T. (2013). The impact of business cycle fluctuations on graduate school
enrollment. Economics of education review, 34, 122-134.
Linsenmeier, D. M., Rosen, H. S., & Rouse, C. E. (2006). Financial aid packages and college
enrollment decisions: An econometric case study. Review of Economics and
Statistics, 88(1), 126-145.
Malcom, L. E., & Dowd, A. C. (2012). The impact of undergraduate debt on the graduate school
enrollment of STEM baccalaureates. The Review of Higher Education, 35(2), 265-305.
Page 26
27
Marks, B. T., & Reid, K. W. (2013). Guest Editorial: The Rapidly Changing Landscape in
Higher Education and Its Impact on African American Students. The Journal of Negro
Education, 82(3), 213-225.
Millett, C. M. (2003). How undergraduate loan debt affects application and enrollment in
graduate or first professional school. The Journal of Higher Education, 74(4), 386-427.
Monks, J. (2009). The impact of merit-based financial aid on college enrollment: A field
experiment. Economics of Education Review, 28(1), 99-106.
Nora, A., Barlow, L., & Crisp, G. (2006). Examining the tangible and psychosocial benefits of
financial aid with student access, engagement, and degree attainment. American
Behavioral Scientist, 49(12), 1636-1651.
Pallais, A., & Turner, S. (2006). Opportunities for low-income students at top colleges and
universities: Policy initiatives and the distribution of students. National Tax Journal, 357-
386.
Pascarella, E. T., Pierson, C. T., Wolniak, G. C., & Terenzini, P. T. (2004). First-generation
college students: Additional evidence on college experiences and outcomes. The Journal
of Higher Education, 75(3), 249-284.
Pendleton, L. & Kramer II, D. A. (2015). Opportunities for Low-Income Students: Evaluation of
the Machen Florida Opportunity Scholars Program (MFOSP) on Proximal and Distal
Outcomes. Paper presented at the 2015 Association for the Study of Higher Education
(ASHE) Annual Conference. Denver, CO.
Perna, L. W. (2004). Understanding the decision to enroll in graduate school: Sex and
racial/ethnic group differences. The Journal of Higher Education, 75(5), 487-527.
Page 27
28
Rubin, R. B. (2011). The pell and the poor: A regression-discontinuity analysis of on-time
college enrollment. Research in Higher Education, 52(7), 675-692.
Sax, L. J. (2001). Undergraduate science majors: Gender differences in who goes to graduate
school. The Review of Higher Education, 24(2), 153-172.
Scott-Clayton, J. (2011). On money and motivation a quasi-experimental analysis of financial
incentives for college achievement. Journal of Human Resources, 46(3), 614-646.
Tierney, W. G., & Venegas, K. M. (2009). Finding money on the table: Information, financial
aid, and access to college. The Journal of Higher Education, 80(4), 363-388.
Waddell, G. R., & Singell, L. D. (2011). Do no-loan policies change the matriculation patterns of
low-income students?. Economics of Education Review, 30(2), 203-214.
Zhang, L. (2005). Advance to graduate education: The effect of college quality and
undergraduate majors. The Review of Higher Education, 28(3), 313-338.
Zhang, L. (2013). Effects of college educational debt on graduate school attendance and early
career and lifestyle choices. Education Economics, 21(2), 154-175.
Zhang, L., & Ness, E. C. (2010). Does state merit-based aid stem brain drain?. Educational
Evaluation and Policy Analysis, 32(2), 143-165.
Page 28
29
Tables and Figures
Figure 1. Discontinuity of observations
Page 29
30
Figure 2. Distribution on Key Demographic Characteristics.
Page 30
31
Table 1: RD Assumption Test
White Black Hispanic Asian Other Female Total SAT HS GPA AP/IB BA GPA Cum Loans
All Students -0.057 0.019 -0.048 0.063 0.023 -0.071 -3.747 -0.019 -2.533 0.018 -9,162.223*** (0.065) (0.063) (0.062) (0.047) (0.016) (0.067) (20.072) (0.052) (1.745) (0.061) (2,489.661)
Functional Form Linear Linear Linear Linear Linear Linear Linear Linear Linear Linear Linear
Cohort Year Fixed-Effects Yes Yes Yes Yes Yes Yes Yes Yes Yes Yes Yes
Graduate School Desire Yes Yes Yes Yes Yes Yes Yes Yes Yes Yes Yes
# of Observations 6,080 6,080 6,080 6,080 6,080 6,080 6,080 6,080 6,080 6,080 6,080 Notes. Standard errors in parentheses; + p < 0.10, * p < 0.05, ** p < 0.01, *** p < 0.001
Page 31
32
Table 2: Descriptives on Key Outcomes and Predictors Total Sample Group 1: MFOS Group 2: Non-MFOS Group 3: Non-Qualifiers
Graduate School Enrollment Any Graduate School 0.383 (0.486) 0.407 (0.492) 0.349 (0.477) 0.367 (0.483)
Master's Program 0.233 (0.423) 0.274 (0.446) 0.182 (0.387) 0.195 (0.397)
Ph.D. Program 0.036 (0.187) 0.036 (0.187) 0.031 (0.174) 0.045 (0.208)
Professional Degree Program 0.106 (0.308) 0.094 (0.292) 0.122 (0.328) 0.113 (0.317)
Undergraduate Indicators
Bachelor's Degree GPA 3.267 (0.403) 3.255 (0.401) 3.286 (0.404) 3.269 (0.41)
Cumulative Loan Debt 9,000.28 (15,839.80) 4,900.07 (12,381.88) 12,940.38 (15,884.55) 14,974.26 (21,000.71)
Bachelor's: Social Sciences 0.281 (0.45) 0.293 (0.455) 0.289 (0.454) 0.226 (0.419)
Bachelor's: STEM 0.159 (0.366) 0.135 (0.342) 0.174 (0.38) 0.208 (0.407)
Bachelor's: Business 0.104 (0.306) 0.111 (0.315) 0.091 (0.288) 0.104 (0.306)
Bachelor's: Education 0.014 (0.117) 0.014 (0.12) 0.013 (0.114) 0.014 (0.116)
Bachelor's: Arts / Humanities 0.119 (0.324) 0.126 (0.332) 0.112 (0.316) 0.109 (0.312)
Bachelor's: Health 0.215 (0.411) 0.214 (0.411) 0.214 (0.41) 0.222 (0.416)
Bachelor's: Agriculture 0.108 (0.311) 0.106 (0.308) 0.107 (0.309) 0.118 (0.323)
Four-Year Completion Rate 0.732 (0.443) 0.745 (0.436) 0.711 (0.454) 0.729 (0.446)
Six-Year Completion Rate 0.987 (0.114) 0.988 (0.107) 0.979 (0.143) 0.995 (0.067)
Pre-College / Demographic Indicators
Initial Parental Income 28,028.95 (14,883.60) 22,946.17 (9,806.317) 23,812.07 (11,399.03) 51,248.32 (11,062.11)
Initial Parental Assets 10,157.93 (34,008.13) 3,694.463 (11,638.3) 20,672.92 (51,089.77) 12,096.82 (38,871.98)
First-Year Bright Futures 0.904 (0.294) 0.886 (0.318) 0.911 (0.284) 0.95 (0.218)
Race: White 0.228 (0.42) 0.211 (0.409) 0.24 (0.427) 0.262 (0.441)
Race: Black/African American 0.339 (0.473) 0.372 (0.484) 0.305 (0.461) 0.294 (0.457)
Race: Hispanic/Latino 0.266 (0.442) 0.282 (0.45) 0.247 (0.432) 0.249 (0.433)
Race: Asian / Pacific Islander 0.149 (0.356) 0.119 (0.324) 0.182 (0.387) 0.186 (0.39)
Race: Other/Multi-Racial 0.018 (0.132) 0.016 (0.125) 0.026 (0.159) 0.009 (0.095)
Gender: Female 0.663 (0.473) 0.682 (0.466) 0.641 (0.48) 0.643 (0.48)
Total SAT Score ^ 1,132.05 (154.338) 1,115.57 (154.169) 1,145.47 (151.278) 1,160.23 (154.48)
Final High School GPA 3.881 (0.418) 3.84 (0.428) 3.917 (0.413) 3.945 (0.382)
AP/IB Credits Completed 10.547 (11.649) 9.331 (10.992) 11.107 (11.737) 13.376 (12.918)
Observations 1296 691 384 221
Notes. Standard deviations in parentheses; ^ students submitting ACT scores were converted to their corresponding SAT composite score for comparison
Page 32
33
Table 3: RD Regression Estimates on Graduate School Enrollment (by degree type)
(1) (2) (3)
Panel 1: Any Graduate Degree 0.106 0.109 0.216* (0.078) (0.071) (0.086)
Panel 2: Master's Degree 0.136 + 0.129 + 0.135* (0.073) (0.073) (0.064)
Panel 3: Ph.D. Programs -0.095*** -0.095*** -0.113***
(0.026) (0.027) (0.033)
Panel 4: Professional Degree Programs 0.091 0.105 0.092 (0.064) (0.064) (0.060)
Functional Form Linear Linear Linear
Cohort Year Fixed-Effects No Yes Yes
Graduate School Desire No No Yes Notes. Standard errors in parentheses; + p < 0.10, * p < 0.05, ** p < 0.01, *** p < 0.001
Page 33
34
Table 4: Robustness Check of Graduate School Enrollment Estimates (by bandwidths)
Optimal BW: -/+ 10 BW: -/+ 20 BW: -/+ 30
Panel 1: Any Graduate Degree 0.216* 0.235** 0.156* 0.147** (0.086) (0.088) (0.062) (0.050)
Panel 2: Master's Degree 0.135* 0.160* 0.119* 0.102* (0.064) (0.077) (0.056) (0.045)
Panel 3: Academic Doctorate -0.113*** -0.120*** -0.073** -0.046*
(0.033) (0.032) (0.024) (0.020)
Panel 4: Professional Doctorate 0.092 0.088 0.022 0.047 (0.060) (0.059) (0.039) (0.031)
Functional Form Linear Linear Linear Linear
Cohort Year Fixed-Effects Yes Yes Yes Yes
Graduate School Desire Yes Yes Yes Yes Notes. Standard errors in parentheses; + p < 0.10, * p < 0.05, ** p < 0.01, *** p < 0.001
Page 34
35
Table 5: Graduate School Enrollment by STEM and Non-STEM
STEM Non-STEM (1) (2) (1) (2)
Panel 1: Any Graduate Degree -0.571* -0.223 0.395*** 0.307** (0.239) (0.173) (0.114) (0.096)
Panel 2: Master's Degree -0.435+ -0.158 0.395*** 0.391*** (0.225) (0.168) (0.109) (0.110)
Panel 3: Academic Doctorate -0.141+ -0.160+ -0.048 -0.052 (0.083) (0.095) (0.031) (0.035)
Panel 4: Professional Doctorate -0.123 -0.070 0.195** 0.141* (0.134) (0.120) (0.073) (0.062)
Functional Form Linear Linear Linear Linear
Cohort Year Fixed-Effects Yes Yes Yes Yes
Graduate School Desire No Yes No Yes Notes. Standard errors in parentheses; + p < 0.10, * p < 0.05, ** p < 0.01, *** p < 0.001
Page 35
36
Table 6: RD Regression Estimates on Graduate School Enrollment (by Race/Ethnicity)
All Students Asian Black Hispanic White
Panel 1: Any Graduate Degree 0.216* -0.528+ 0.217 1.215*** -0.010 (0.086) (0.305) (0.149) (0.311) (0.176)
Panel 2: Master's Degrees 0.135* -0.604* 0.325** 0.787** 0.012 (0.064) (0.293) (0.117) (0.276) (0.171)
Panel 3: Academic Doctorate -0.113*** 0.118* -0.037 -0.305* 0.024
(0.033) (0.058) (0.052) (0.147) (0.234)
Panel 4: Professional Doctorate 0.092 -0.147 0.084+ 0.394* -0.050 (0.060) (0.165) (0.047) (0.186) (0.113)
Cohort Year Fixed-Effects Yes Yes Yes Yes Yes
Graduate School Desire Yes Yes Yes Yes Yes Notes. Standard errors in parentheses; + p < 0.10, * p < 0.05, ** p < 0.01, *** p < 0.001
Page 36
37
The Influence of Pell Grants on Graduate School Enrollment
Justin C. Ortagus, Ph.D.
University of Florida
Dennis A. Kramer II, Ph.D.
University of Florida
Abstract
The federal Pell Grant program is the largest source of need-based aid available to undergraduate
students, but we know very little regarding its impact after students graduate. This study
examines the influence of Pell Grants on graduate enrollment using a regression discontinuity
design. Descriptive evidence suggests that increases in the level of need-based aid may be
positively related to the likelihood of graduate school enrollment. Our empirical results indicate
that African American or Black students who receive Pell Grants are more likely to enroll in
post-baccalaureate professional degree programs.
Acknowledgements
This study has been generously funded by the Access Group and the Association for Institutional
Research. We are grateful to both funders, especially Tinsley Smith, for their support.
Corresponding Author’s Contact Information: Justin C. Ortagus, Ph.D.
Assistant Professor of Higher Education Administration & Policy
(352) 273-4338
[email protected]
Page 37
38
Introduction
The federal Pell Grant program—which was formerly known as the Basic Educational
Opportunity Grant program—is the largest source of need-based aid available to undergraduate
students. Although federal loans are available to all postsecondary students, Pell Grants are only
available to low-income undergraduate students who demonstrate financial need (U.S.
Department of Education, 2017). The Pell Grant is designed to promote access to higher
education among low-income and historically underrepresented student populations, as it is the
primary form of financial aid that does not need to be repaid by student recipients. Previous
researchers have found a positive relationship between need-based aid and the probability of
enrolling in college (Kane, 1999, 2003; Seftor & Turner, 2002; Dynarski, 2003), but these
studies focus solely on undergraduate enrollment.
Prior research has shown that graduate education is related to greater labor market
outcomes and a higher quality of life (Baum, Ma, & Payea, 2010). Many high-paying
professions, such as doctors, lawyers, and pharmacists, are only available to individuals who
have earned their graduate degree (Morelon-Quainoo et al., 2009). Individuals who earn graduate
degrees are also more likely to have children who eventually obtain higher levels of education
when compared to those who did not earn a graduate degree (Baum et al., 2010). However, the
social and financial advantages associated with graduate education appear to be distributed
unequally, with low-income students being less likely than their peers to enroll in graduate
school and obtain a graduate degree (Morelon-Quainoo et al., 2009).
With the rising cost of higher education (Clotfelter, 1996; Millett, 2003; Bowen, 2013;
Cheslock, Ortagus, Umbricht, & Wymore, 2016), students have been forced to increase their
reliance on student loans (Hearn & Holdsworth, 2004). This trend is especially disconcerting for
Page 38
39
low-income students, who accrue a disproportionate amount of loan debt relative to their peers
(Price, 2004). Despite the well-established benefits of graduate education (Baum et al., 2010;
Hearn & Holdsworth, 2004), the prospect of undertaking additional student loan debt to enroll in
graduate coursework may dissuade otherwise-capable applicants from pursuing graduate studies.
Because Pell Grants are designed to provide aid in ways that reduce low-income students’
dependence on loans, Pell-eligible students may be able to limit their loan debt and become more
willing to undertake student loan debt to experience the benefits of graduate education. To
examine the relationship between Pell Grants and graduate enrollment, this study addresses the
following research question: To what extent do Pell Grants impact the likelihood of graduate
school enrollment?
Literature Review
Given that need-based aid accounts for the considerable majority of all grant aid awarded
by state and federal governments (Baum, 2016), numerous studies have examined the effect of
need-based financial aid on student outcomes. The majority of these studies focus solely on the
impact of need-based aid on the short-term outcomes of students by concentrating their analyses
within a narrow time period immediately following high school graduation (Dynarski, 2003;
Ehrenberg & Sherman, 1984; Leslie & Brinkman, 1987; Kane, 1999). Our study complements
previous literature by looking at the longer-term impact of need-based aid by examining the
impact of Pell Grants on the likelihood of graduate school enrollment. This review of relevant
literature will focus primarily on enrollment trends of low-income students, the effect of need-
based aid on student outcomes, and factors influencing the likelihood of enrolling in graduate
school.
Page 39
40
The college enrollment rates of individuals from low-income families are significantly
lower than their middle- and upper-income peers. Even after controlling for academic ability,
college enrollment rates are between 25 and 30 percentage points lower for high school
graduates whose families are in the lowest quintile of total income relative to their peers from the
highest-earning families (Baum & Ma, 2007). Trends within graduate school enrollment for low-
income students follow a similar pattern, with low-income students failing to enroll in graduate
school at the same pace as their academically similar peers from higher socioeconomic
backgrounds (Malcom & Dowd, 2012).
Deming and Dynarski (2009) found that need-based grant eligibility can have a strong
and positive effect on whether students enroll in college, with the estimated probability of
enrollment increasing by 3% to 4% for each additional $1,000 in grant aid eligibility. However,
Rubin (2011) examined the effect of Pell Grant eligibility on college enrollment and found no
effect. Rubin explained this finding by suggesting that the minimum Pell Grant amount may be
inadequate given the continually rising price of college attendance. Additional studies have
examined the post-enrollment effect of merit-based scholarships on postsecondary students
(Dynarksi, 2008; Scott-Clayton, 2011), but surprisingly little research has examined the effect of
need-based grants on long-term student outcomes, such as graduate school enrollment.
Low-income students are far more likely than their peers to accrue student loan debt to
pay for their undergraduate education. In an analysis of bachelor’s degree recipients from public
universities, Baum and Payea (2012) found that roughly 68% of students from families earning
less than $30,000 per year had an average cumulative debt of at least $16,500. However, only
40% of students from families earning more than $120,000 accrued any debt, with the average
amount of student loan debt at $14,500. Because we know that providing financial aid can
Page 40
41
reduce financial burdens and improve undergraduate for low-income students (Dynarski & Scott-
Clayton, 2013), one can reasonably deduce that need-based aid (Pell Grants) obtained as an
undergraduate can reduce financial barriers to graduate enrollment and positively impact the
likelihood of low-income students enrolling in graduate school.
Although graduate education has been found to be beneficial across student types (Baum
et al., 2010; Hearn & Holdsworth, 2004), prior research has shown that historically
underrepresented student populations are not as likely to enroll in graduate school (Perna, 2004).
For example, low-income students were found to be less likely than their peers to engage with
graduate education (Morelon-Quainoo et al., 2009). Previous researchers have consistently found
a positive relationship between a student’s academic achievement and likelihood of enrolling in
graduate school (Mullen, Goyette, & Soares, 2003; Zhang, 2005); however, there is not a clear
consensus in the literature regarding the impact of financial considerations on the likelihood of
graduate school enrollment. For example, the influence of undergraduate debt on graduate school
enrollment has been examined by numerous researchers (Schapiro, O’Malley, & Litten, 1991;
Fox, 1992; Weiler, 1994; Heller, 2001; Millett, 2003;), but the findings generated from these
studies vary considerably and offer little clarity for policymakers or researchers seeking to
understand the relationship between student loan debt and graduate school enrollment.
As institutions, states, and the federal government continue to make considerable
financial investments into need-based financial aid programs, rigorous projections of their impact
on long-term outcomes, such as the likelihood to enroll in graduate school, are needed. Our study
will complement the studies outlined previously by focusing on the post-baccalaureate impact of
need-based financial aid through an examination of the influence of Pell Grants on graduate
enrollment among low-income students.
Page 41
42
Conceptual Framework
This study draws from the economic theory of human capital and the random utility
model of student choice to explain the rationale for the analysis. In the context of higher
education, the theory of investment in human capital (Mincer, 1958) suggests that students make
decisions about continuing their education based on the costs and benefits associated with
enrollment. The decision to enroll in graduate school, for example, is subject to a variety of
considerations, such as the direct costs of tuition and fees and the opportunity costs of foregone
earnings, before determining whether graduate education is a worthwhile investment. Before
deciding to attend graduate school, the prospective student weighs the costs and expected
benefits of graduate education and enrolls in graduate school if the costs of graduate enrollment
are outweighed by the expected benefits (DesJardins & Toutkoushian, 2005; Paulsen &
Toutkoushian, 2008).
The uncertainty of future benefits associated with graduate education and an individual’s
willingness to accept risk can complicate the decision to enroll in graduate school (DesJardins &
Toutkoushian, 2005). The random utility model of student choice can be used to explain an
individual’s decision despite under these types of uncertainty. This model has been used in
earlier work to study student choice (DesJardins, Ahlburg, & McCall, 2006), as students will
attempt to maximize their net utility when making their decision to choose among schooling and
non-schooling alternatives (DesJardins & Toutkoushian, 2005).
In line with the logic outlined by previous applications of the random utility model of
student choice (DesJardins & Toutkoushian, 2005; Muñoz, Harrington, Curs, & Ehlert, 2016),
we define the utility individuals receive based on their decision to attend graduate school as
follows:
Page 42
43
Uig = U(Fg, Fi , Ni )
where U is the utility that individual i obtains from choosing to enroll in graduate school g. The
inputs to the utility function are defined as follows: F represents the financial factors related to
attending graduate school g (e.g., tuition and fees); F also represents financial factors associated
with individual i (e.g., Pell eligibility); and N represents non-financial individual characteristics
associated with the utility of the decision to enroll in graduate school (e.g., ability; undergraduate
major).
Although an individual’s utility is unobservable, we can deduce that utility is maximized
based upon the student’s decision. In other words, when a student chooses graduate school (g)
over the non-graduate school alternatives (h), we can deduce that g provided the student with
greater net benefits (utility) relative to the non-graduate school option of entering the labor
market with sub-graduate level credentials. Following DesJardins and Toutkoushian (2005) and
Muñoz et al. (2016), we model utility maximization as Uig > Uih.
We apply the economic theory of human capital and the random utility model of student
choice to show how Pell Grants influence the decision to enroll in graduate school. The student’s
decision is thereby contingent upon whether the direct and opportunity costs of graduate
enrollment are outweighed by the benefits associated with graduate education. Because previous
researchers have shown that low-income students are debt-averse (Burdman, 2005), we
hypothesize that students who receive Pell Grants are more likely to enroll in graduate school
because their otherwise-similar peers will decline to take out additional student loan debt to
pursue graduate studies. This debt aversion is exacerbated by informational asymmetries that
lead many low-income students to deem the cost of graduate school to be too high despite the
well-established, long-term benefits of graduate education.
Page 43
44
Data and Methods
Data
To examine the influence of Pell Grants on graduate school enrollment, we use a
nationally representative longitudinal sample survey of bachelor’s degree recipients provided by
the National Center for Education Statistics (NCES)—Baccalaureate and Beyond Longitudinal
Study (B&B:08/12). The survey is restricted to postsecondary students who completed the
requirements to obtain a bachelor’s degree during the 2007-08 academic year. B&B:08/12
addresses issues related to the education and employment experiences of bachelor’s degree
experiences and includes two follow-up surveys. The survey also addresses questions related to
bachelor’s degree recipients’ participation in financial aid programs and undergraduate debt. The
first follow-up for B&B:08/12 occurred one year after graduation (2009), and the second follow-
up occurred three years later (2012). The final B&B:08/12 dataset has approximately 17,160
participants, including any student who participated during the first year and was deemed eligible
for the first follow-up based on the transcripts or interviews. For data preparation and analyses,
we used revised panel weights to investigate the impact of Pell Grants on students’ post-
baccalaureate enrollment decisions.
Variables
Independent/forcing variable. The primary mechanism used to award Pell Grants is the
federally calculated expected family contribution (EFC). Information for EFC is captured from
student submissions on the Free Application for Federal Student Aid (FAFSA). Included within
the EFC calculation are taxed and untaxed income, assets, and social service benefits.
Additionally, family size and the number of family members attending postsecondary institutions
are included. Students with an EFC less than or equal to zero qualify for a Pell Grant. The Pell
Page 44
45
Grant award amount is dependent on the EFC level, with the lowest EFC receiving larger Pell
awards. The continuous nature of EFC, along with the strict eligibility cutoff for a Pell Grant,
allows us to employ it as an effective forcing variable for our analytical strategy.
Dependent variable. We employ a variety of graduate school enrollment indicators to test
the effect of Pell Grants on graduate school enrollment. In addition to post-baccalaureate
enrollment, the B&B:08/12 dataset also captures the type of programs in which students enroll.
The B&B:08/12 includes information regarding degree type (e.g., master’s, doctoral) as well the
subject area of the graduate or professional program (e.g., law, business, science). We leveraged
the information pertaining to the type of graduate or professional degree to examine the
heterogeneous effects of receiving a Pell Grant. However, we were unable to examine specific
subject areas given concerns over power and the limited sample sizes of our fuzzy regression
discontinuity cutoff.
Covariates. One of the primary assumptions surrounding our analytical strategy is that
students on either side of the income threshold are “normally” distributed across factors that may
affect assignment to the treatment and independently affect the dependent variables. To this end,
we include a variety of the pre-college characteristics that are associated with enrollment and
success in undergraduate education and may directly affect graduate school enrollment: (1) high
school GPA, (2) SAT/ACT composite scores, (3) number of AP/IB courses completed, (4)
parental income and financial asset information, (5) parental education level, and (6) student
race/ethnicity and gender.
Analytical Strategy
We exploit the established and strict income cutoff required to qualify for a Pell Grant
and apply a regression discontinuity research design to estimate the effects of falling just below
Page 45
46
(or above) the cutoff. To do so, we capitalize on the randomness of a student’s position with
respect to parental income to identify the causal effects of Pell Grant participation on post-
baccalaureate enrollment decisions. Since compliance is not perfect, our analytical approach
relies on a fuzzy regression discontinuity (FRD) design (Imbens & Lemeuix, 2008).
We operationalize our regression discontinuity design by using instrumental variables
within a two-stage least squares estimation strategy. In our two-stage approach, we rely on the
indicator of a student’s position just below the expected family contribution (EFC) threshold as
an instrumental variable for access to a Pell Grant. In the first stage, we model the probability
that a student has access to Pell Grants as a function of the student’s position being just below
the cutoff on the EFC continuum:
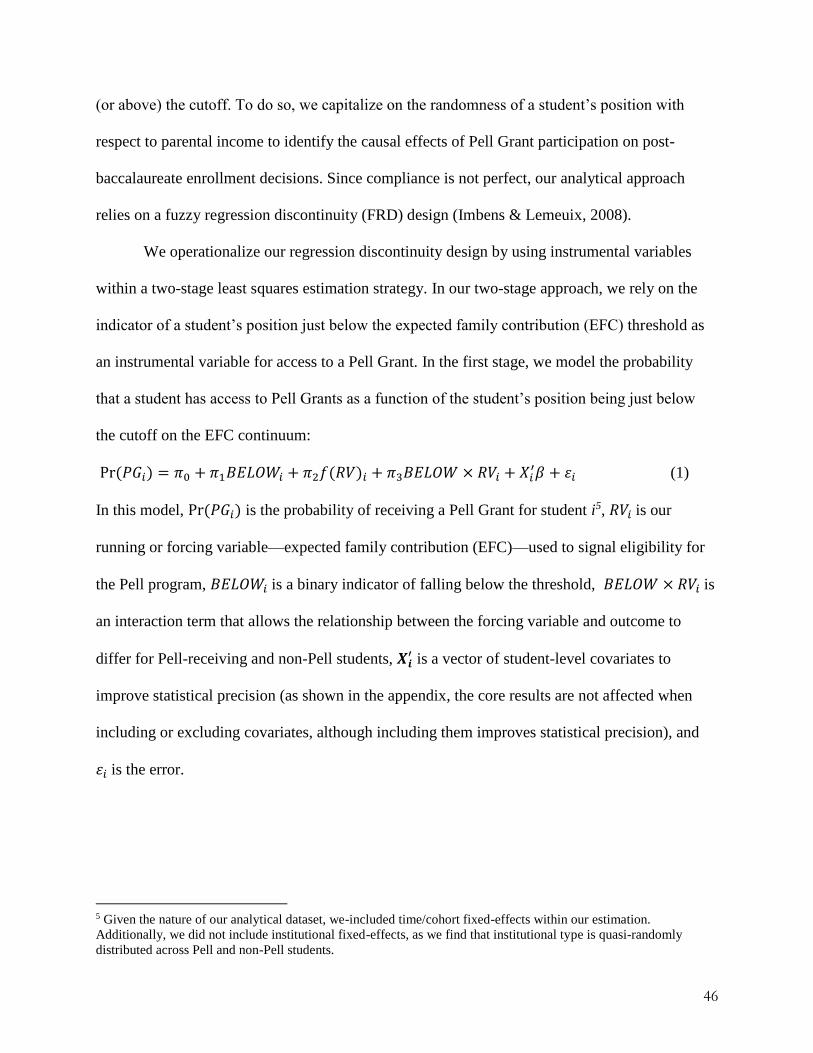
Pr(𝑃𝐺𝑖) = 𝜋0 + 𝜋1𝐵𝐸𝐿𝑂𝑊𝑖 + 𝜋2𝑓(𝑅𝑉)𝑖 + 𝜋3𝐵𝐸𝐿𝑂𝑊 × 𝑅𝑉𝑖 + 𝑋𝑖′𝛽 + 𝜀𝑖 (1)
In this model, Pr(𝑃𝐺𝑖) is the probability of receiving a Pell Grant for student i5, 𝑅𝑉𝑖is our
running or forcing variable—expected family contribution (EFC)—used to signal eligibility for
the Pell program, 𝐵𝐸𝐿𝑂𝑊𝑖is a binary indicator of falling below the threshold, 𝐵𝐸𝐿𝑂𝑊 × 𝑅𝑉𝑖is
an interaction term that allows the relationship between the forcing variable and outcome to
differ for Pell-receiving and non-Pell students, 𝑿𝒊′ is a vector of student-level covariates to
improve statistical precision (as shown in the appendix, the core results are not affected when
including or excluding covariates, although including them improves statistical precision), and
𝜀𝑖is the error.
5 Given the nature of our analytical dataset, we-included time/cohort fixed-effects within our estimation.
Additionally, we did not include institutional fixed-effects, as we find that institutional type is quasi-randomly
distributed across Pell and non-Pell students.
Page 46
47
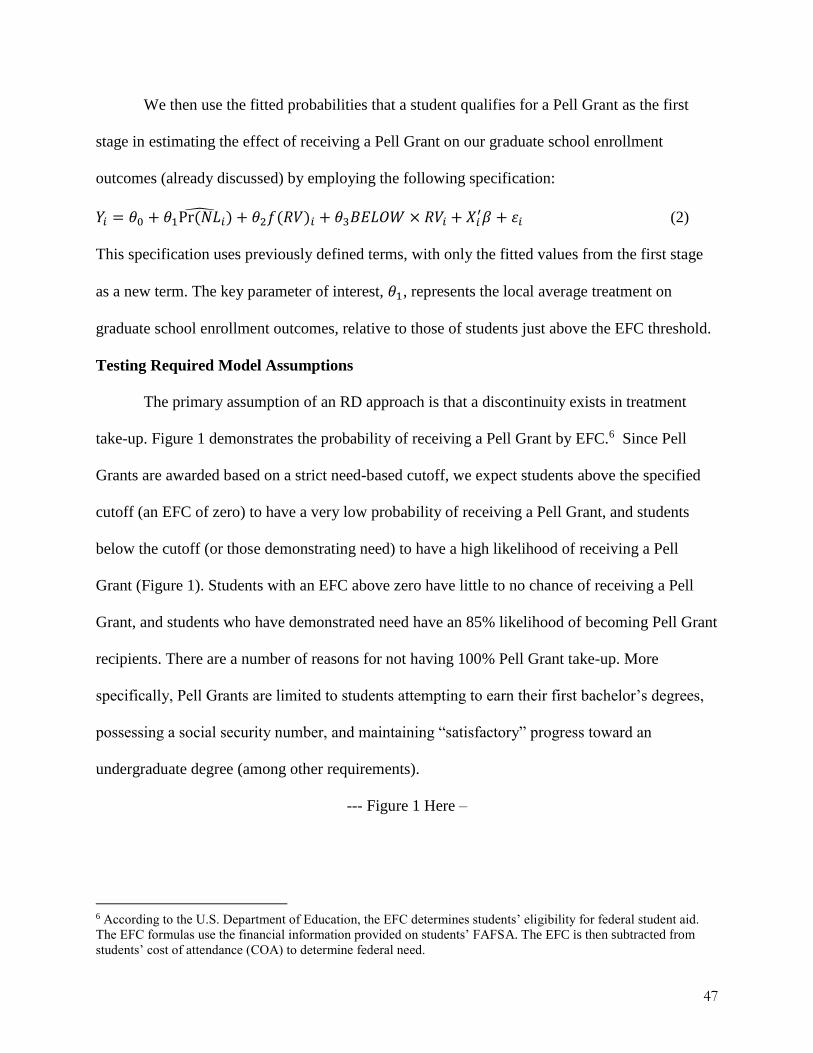
We then use the fitted probabilities that a student qualifies for a Pell Grant as the first
stage in estimating the effect of receiving a Pell Grant on our graduate school enrollment
outcomes (already discussed) by employing the following specification:
𝑌𝑖 = 𝜃0 + 𝜃1Pr(𝑁�̂�𝑖) + 𝜃2𝑓(𝑅𝑉)𝑖 + 𝜃3𝐵𝐸𝐿𝑂𝑊 × 𝑅𝑉𝑖 + 𝑋𝑖′𝛽 + 𝜀𝑖 (2)
This specification uses previously defined terms, with only the fitted values from the first stage
as a new term. The key parameter of interest, 𝜃1, represents the local average treatment on
graduate school enrollment outcomes, relative to those of students just above the EFC threshold.
Testing Required Model Assumptions
The primary assumption of an RD approach is that a discontinuity exists in treatment
take-up. Figure 1 demonstrates the probability of receiving a Pell Grant by EFC.6 Since Pell
Grants are awarded based on a strict need-based cutoff, we expect students above the specified
cutoff (an EFC of zero) to have a very low probability of receiving a Pell Grant, and students
below the cutoff (or those demonstrating need) to have a high likelihood of receiving a Pell
Grant (Figure 1). Students with an EFC above zero have little to no chance of receiving a Pell
Grant, and students who have demonstrated need have an 85% likelihood of becoming Pell Grant
recipients. There are a number of reasons for not having 100% Pell Grant take-up. More
specifically, Pell Grants are limited to students attempting to earn their first bachelor’s degrees,
possessing a social security number, and maintaining “satisfactory” progress toward an
undergraduate degree (among other requirements).
--- Figure 1 Here –
6 According to the U.S. Department of Education, the EFC determines students’ eligibility for federal student aid.
The EFC formulas use the financial information provided on students’ FAFSA. The EFC is then subtracted from
students’ cost of attendance (COA) to determine federal need.
Page 47
48
Appropriate conditions must be met to support the use of the regression discontinuity
design before the analysis. Pursuant to the established methodological literature (Imbens &
Lemeuix, 2008; Schochet et al., 2010), a valid regression discontinuity (RD) design must
demonstrate a smooth and continuous distribution of the forcing variable, as well as balance of
observable characteristics among units of analysis that fall just below or above the plausibly
exogenous cutoff used to define the treatment. Our data satisfy both of these criteria across each
of the evaluated thresholds. We fail to find any visual evidence of manipulation at the $40,000
income cutoff. Additionally, we conduct an informal McCrary test of manipulation—using the
STATA command RD density—and find no statistical evidence of differences in observations
around the cutoff. In Figure 2, we present the distribution of the running variable on key factors.
As will be seen, there does not appear to be any visual evidence of large and systematic
discontinuities in any of our identified characteristics.
--- Figure 2 Here ---
Table 1 provides our formal test of the differences among these characteristics
accounting for Pell Grant take-up and optimal bandwidth selection. Table 2 suggests that there
may be a slight discontinuity in the likelihood that a student receiving Pell Grant is not White
and that those who receive Pell Grants have slightly lower amounts of cumulative student loans
at the time of graduation. However, we did not find any systematic evidence that respondents
receiving a Pell Grant had any statistical difference in their desire to enroll and complete a
graduate degree when asked during the first year of their undergraduate education. Combined
with our analytical approach, this finding allows us to attribute any differences in graduate
school enrollment as related to the receipt of a Pell Grant and not to students’ pre-college desires
related to graduate school enrollment.
Page 48
49
--- Table 1 Here ---
Results
Table 2 provides descriptive statistics—means and standards deviations—for our
treatment and control groups on graduate school enrollment outcomes. Given that the receipt of
the Pell Grant is an annual qualification, we have provided descriptive statistics for students who
1) never received Pell Grants, 2) received Pell Grants at any time during the analytical period, 3)
received the Pell Grant for only one year, 4) received Pell Grants for two years, 5) received Pell
Grants for three years, and 6) received Pell Grants for four or more years. The primary
comparison should be made between (1) and (6) and examine the effects of receiving Pell Grants
during the entire time as an undergraduate and never receiving the Pell Grant. In general, those
receiving Pell Grants were slightly more likely to enroll in graduate school (49% vs. 50%) but
less likely to enroll in a master’s degree program (35% vs. 33%). Pell Grant recipients’
enrollment was higher for doctorate (4% to 6%) than professional degree programs (9% vs.
12%). Additionally, the number of years students receive the Pell Grant appears to be linked with
graduate school enrollment, with each additional year increasing the likelihood of enrollment in
any graduate school across various types of programs.
--- Table 2 Here ---
Before examining the local average treatment effects, we further unpacked post-
baccalaureate enrollment by the level of Pell Grant awards in Table 3. As with the majority of
state and federal need-based financial aid policies, the amount of Pell Grant awarded is related to
the level of need, with students who demonstrate the largest need receiving the largest award.
Table 3 provides the graduate school enrollment likelihoods for Pell Grant recipients by the level
of the cumulative award. Across the overall sample and various student subgroups, we find
Page 49
50
descriptive evidence of a relationship between the amount of Pell Grants received and the
likelihood of graduate school enrollment. In general, we show the amount of cumulative Pell
Grants appears to have a positive relationship with the likelihood of graduate school enrollment,
particularly for underrepresented minority students pursuing doctoral or professional degree
programs. For example, African American/Black students who are in the lowest quartile of
cumulative Pell Grants awarded had a doctoral degree program enrollment percentage of 2.7%
compared to 7.0% for African American/Black students in the highest quartile of cumulative Pell
Grants awarded. Hispanic/Latino students in the lowest quartile had a 4.3% enrollment
percentage within professional degree programs, but those in the highest quartile had a 15.8%
enrollment percentage. These trends were not only isolated to select racial/ethnic subgroups, as
similar trends held for the subgroup of first-generation college students.
--- Table 3 Here ---
Figure 4 provides the graphical representation of our RD analysis by graduate program
degree type, showing a potential positive discontinuity between Pell recipients and non-
recipients on doctorate and professional degree programs. We also find limited visual evidence
of a difference in overall graduate school enrollment and master’s program enrollment. Given
that master’s program enrollment is the primary type of graduate school enrollment, it is not
surprising to see similar results between master’s program and overall graduate school
enrollment.
--- Figure 3 Here ---
Table 4 provides our FRD estimates for the effects of Pell Grants on post-baccalaureate
enrollment decisions by degree type and the number of Pell Grants awarded. Within Table 3, we
specify three different RD estimates, with Model 1 being our base FRD approach, Model 2
Page 50
51
building on Module 1 to include NCES sample weights for the nationally representative sample,
and Module 3 adding covariates to Module 2 to increase robustness and strengthen the precision
of our analysis. In general, we find limited statistical evidence that receiving a Pell Grant induces
students to enroll in graduate school. While not statistically significant, we find negative point
estimates for enrollment in any graduate program or master’s degree programs and positive point
estimates for doctoral or professional programs. Additionally, the strongest impacts appear to be
concentrated within our analysis examining non-Pell recipients and students receiving a Pell
Grant for four or more years, which aligns with our conceptual framework and suggests a
cumulative effect of receiving Pell Grants.
--- Table 4 Here ---
Heterogeneous Effects by Student Groups
Prior work by Gross, Torres, and Zerquera (2013) indicates that various student
subgroups respond differently to financial aid. To this end, Figure 4 and Table 5 examine the
effect of Pell Grants on post-baccalaureate enrollment across subgroups. Figure 4 provides a
graphical representation of enrollment in any graduate school by race/ethnicity and first-
generation status. Figure 4 shows visual evidence that White, Black, and first-generation Pell
Grant recipients who demonstrate the most need appear to be the most likely to enroll in graduate
school, even when compared alongside their more affluent peers within the same race/ethnicity
or first-generation subgroups, which confirms some of the early descriptive results presented
earlier in Table 3.
--- Figure 4 Here ---
We formally test the impact of Pell Grants on graduate school enrollment for a variety of
student groups in Table 5. Similar to our estimates in Table 4, we provide limited statistical
Page 51
52
evidence the receipt of Pell Grants impacts graduate school enrollment among students from
various subgroups, such as race/ethnicity and first-generation status. The lone exception within
our results is that African American/Black students have an increased likelihood (33%) of
enrolling in a graduate professional program after receiving a Pell Grant.
--- Table 5 Here ---
Conclusion and Implications
Numerous empirical studies examine the relationship between undergraduate student debt
and graduate enrollment decisions (Schapiro, O’Malley, & Litten, 1991; Fox, 1992; Heller,
2001; Millett, 2003), but fewer studies have connected need-based aid and graduate enrollment
decisions. This study seeks to assess the impact of the federal Pell Grant program—the nation’s
largest need-based aid program—on post-baccalaureate enrollment decisions. Capitalizing on the
strict qualification threshold, we generate one of the first causal estimates on the effect of Pell
Grant participation on graduate school enrollment.
Although we provide descriptive evidence of a relationship between the amount of Pell
Grants received and the likelihood of graduate school enrollment, our empirical results lack
statistically significant evidence of the impact of Pell Grants on graduate school enrollment, with
a few exceptions. Our heterogeneous results confirm the earlier work of Kim, DesJardins, and
McCall (2009), who demonstrated that students from different racial/ethnic subgroups respond
differently to various financial aid policies. Contrary to the work of Gross, Torres, and Zerquera
(2013), we found that African American/Black students appeared to be more sensitive to
receiving a Pell Grant when deciding whether to enroll in graduate school. More specifically, the
impact of receiving Pell Grants on graduate enrollment appears to be concentrated within
Page 52
53
African American/Black students pursuing professional degree programs (e.g., J.D., MBA),
many of which are associated with higher tuition and fees.
The relative lack of significant empirical results related to the impact of receiving the Pell
Grants on graduate school enrollment may be due to the variability of the Pell Grant award.
Specifically, students on the margins of qualifying for Pell Grants received the minimum award
amount of $600 per year, whereas compared to those receiving the maximum Pell amount of
5,750 per year.7 Because we examine the impact of Pell Grants for students just below and above
the qualification threshold, this study would not capture students receiving the highest
allocations of Pell Grant awards within the empirical analyses.8 In line with our conceptual
framework (DesJardins & Toutkoushian, 2005; Mincer, 1958; Muñoz, Harrington, Curs, &
Ehlert, 2016), we provide suggestive evidence that the level of the Pell Grant award appears to
be positively related to the likelihood of enrolling in graduate school.
This study is subject to multiple limitations. First, because we examine the effects of
receiving a Pell Grant on graduate school enrollment among students just above and below the
threshold, our results should be viewed solely as the local average treatment effect of receiving
Pell Grants rather than the treatment effect of receiving Pell Grants. Despite the strict income
threshold for qualifying for a Pell Grant—a key assumption of the RD design—the declining
nature of the Pell Grant award for students who are closer to the income threshold serves to add
to the level of complexity of our analysis. To this end, our local average treatment effects should
be taken in combination with our descriptive results to demonstrate a connection between not
only receiving a Pell Grant but also the amount of Pell Grants received and post-baccalaureate
7 The 4-year average of the minimum and maximum Pell Grant awards between 2008 and 2012. The 4-year average
annual Pell Grant award was $3,820 during the same period. 8 Descriptive results pertaining to the influence of the level of Pell Grants on graduate enrollment can be found in
Table 3.
Page 53
54
decision making. Second, while this study leverages a nationally representative dataset, our
analysis may be slightly underpowered and therefore reliant on survey response data. Finally, we
examine graduate school enrollment as the sole outcome and do not account for the graduate
school application process. Given that graduate enrollment requires that students apply to
graduate school and institutions subsequently offer admission to those prospective students, our
analysis cannot account for students’ desire to pursue graduate education.
Combined with the literature connecting undergraduate debt and need-based financial aid
with graduate school enrollment, we provide additional nuance to this important topic area and
add to our collective understanding of undergraduate financial aid on post-baccalaureate
enrollment decisions. Despite the relative lack of significant empirical results, our study
complements this previous work and adds insight into the mechanisms at play during the post-
baccalaureate decision-making process. Future research can continue to examine the connection
between need-based aid and post-baccalaureate enrollment decisions, particularly the impact of
levels of need-based aid on the likelihood of graduate school enrollment.
Page 54
55
References
Bailey, M., & Dynarski, S. (2011). Inequality in postsecondary education. In Duncan G. &
Murnane R. (Eds.), Whither Opportunity? Rising Inequality, Schools, and Children's Life
Chances (pp. 117-132). Russell Sage Foundation.
Baum, S. (2016). Trends in student aid. Washington, DC: The College Board.
Baum, S., & Ma, J. (2007). Education pays: The benefits of higher education for individuals and
society. Washington, DC: The College Board.
Baum, S., Ma, J., & Payea, K (2010). Education pays: The benefits of higher education for
individuals and society. Washington, D. C.: College Board.
Bowen, W. (2013). Buying the best: Higher education in the digital age. Princeton, NJ:
Princeton University Press.
Burdman, P. (2005). The student debt dilemma: Debt aversion as a barrier to college access.
Center for Studies in Higher Education.
Clotfelter, C. T. (1996). Buying the best: Cost escalation in elite higher education. Princeton, NJ:
Princeton University Press.
Dynarski, S. M. (2003). Does aid matter? Measuring the effect of student aid on college
attendance and completion. American Economic Review, 93(1), 279–288.
Dynarski, S. (2008). Building the stock of college-educated labor. Journal of Human
Resources, 43(3), 576-610.
Dynarski, S., & Scott-Clayton, J. (2013). Financial aid policy: Lessons from research (No.
w18710). National Bureau of Economic Research.
Ehrenberg, R. G., & Sherman, D. R. (1984). Optimal financial aid policies for a selective
university. Journal of Human Resources, 19(2), 202–230.
Page 55
56
English, D., & Umbach, P. D. (2016). Graduate school choice: An examination of individual and
institutional effects. The Review of Higher Education, 39(2), 173-211.
Fox, M. (1992). Student debt and enrollment in graduate and professional school. Applied
Economics, 24, 669–677.
Gross, J. P., Torres, V., & Zerquera, D. (2013). Financial aid and attainment among students in a
state with changing demographics. Research in Higher Education, 54(4), 383-406.
Hearn, J. & Holdsworth, J. M (2004). Federal student aid: The shift from grants to loans. In E. P.
St. John, & M.D. Parsons (Eds.) Public funding of higher education: Changing contexts
and new rationales. Baltimore, MD: Johns Hopkins University Press.
Heller, D. E. (2001). Debts and decisions: Student loans and their relationship to graduate school
and career choice. Lumina Foundation for Education.
Imbens, G. W., & Lemieux, T. (2008). Regression discontinuity designs: A guide to
practice. Journal of econometrics, 142(2), 615-635.
Kane, T. J. (1999). The price of admission: Rethinking how Americans pay for college.
Washington, DC: The Brookings Institution Press.
Leslie, L. L., & Brinkman, P. T. (1987). Student price response in higher education. The Journal
of Higher Education, 58(2), 181–204
McPherson, M. S., and Shapiro, M. O. ﴾1999﴿. The student aid game: Meeting need and
rewarding talent in American higher education. Princeton, NJ: Princeton University
Press.
Millett, C. M. (2003). How undergraduate loan debt affects application and enrollment in
graduate or first professional school. The Journal of Higher Education, 74(4). 386–427.
Page 56
57
Mincer, J. (1958). Investment in human capital and personal income distribution. The Journal of
Political Economy, 66, 281–302.
Mullen, A. L., Goyette, K. A., & Soares, J. A. (2003). Who goes to graduate school? Social and
academic correlates of educational continuation. Sociology of Education, 76(2), 143–169.
Muñoz, J., Harrington, J. R., Curs, B. R., & Ehlert, M. (2016). Democratization and diversion:
The effect of Missouri's A+ Schools Program on postsecondary enrollment. The Journal
of Higher Education, 87(6), 801-830.
Morelon-Quainoo, C., Johnson S. D., Winkle-Wagner, R., Smith, D. G. (2009). The advanced-
degree pipeline for graduate and professional students of color. In M. F. Howard-
Hamilton, C. L. Morelon-Quainoo, S.D. Johnson, R. Winkle-Wagner, & L. Santiague
(Eds.) Standing on the outside looking in: Underrepresented students’ experiences in
advanced degree programs (pp. 5–24). Sterling, VA: Stylus Publishing, LLC.
Perna, L. W. (2004). Understanding the decision to enroll in graduate school: Sex and
racial/ethnic group differences. The Journal of Higher Education, 75(5), 487-527.
Price, D. ﴾2004﴿. Borrowing inequality: Race, class, and student loans. Boulder, CO: Lynne
Rienner Publishers.
Schapiro, M. O., O’Malley, M. P., & Litten, L. H. (1991). Progression to graduate school from
the “elite” colleges and universities. Economics of Education Review, 10(3), 227–244.
Seftor, N. S., & Turner, S. E. (2002). Back to school: Federal student aid policy and adult college
enrollment. Journal of Human Resources, 37(2), 336-352.
U.S. Department of Education. (2017). Federal Pell Grant program. Retrieved from
https://www2.ed.gov/programs/fpg/index.html.
Page 57
58
Weiler, W.C. (1991). The effect of undergraduate student loans on the decision to pursue
postbaccalaureate study. Educational Evaluation and Policy Analysis, 13(3), 212–220.
Zhang, L. (2005). Advance to graduate education: The effect of college quality and
undergraduate majors. The Review of Higher Education, 28(3), 313–338.
Page 58
59
Figures and Tables
Figure 1: Pell Grant take-up by expected family contribution (EFC)
0.2
.4.6
.81
Pro
ba
bili
ty o
f T
reatm
en
t
-4000 -2000 0 2000 4000EFC
Page 59
60
Figure 2: Distribution on key covariates
.5.6
.7.8
.91
-4000 -2000 0 2000 4000
Race: White
0.1
.2.3
.4
-4000 -2000 0 2000 4000
Race: Minority
22
24
26
28
-4000 -2000 0 2000 4000
Age
.2.4
.6.8
-4000 -2000 0 2000 4000
Parental College.1
.2.3
.4.5
.6
-4000 -2000 0 2000 4000
Female
.2.3
.4.5
.6.7
-4000 -2000 0 2000 4000
AP/IB Credits
10
5011
0011
5012
0012
50
-4000 -2000 0 2000 4000
SAT/ACT
.4.6
.81
-4000 -2000 0 2000 4000
Expected Grad School
10
12
14
16
18
20
-4000 -2000 0 2000 4000
Hours Worked
0.2
.4.6
-4000 -2000 0 2000 4000
Dependents
05
0010
0015
0020
0025
00
-4000 -2000 0 2000 4000
State Grants
20
0040
0060
0080
0010
00
0
-4000 -2000 0 2000 4000
Total Loans
34
56
7
-4000 -2000 0 2000 4000
Income
3.1
3.2
3.3
3.4
3.5
3.6
-4000 -2000 0 2000 4000
BA: GPA
Page 60
61
Figure 3: Graphical representation of RD estimates on Pell and Graduate School Enrollment
0.2
.4.6
.8
-4000 -2000 0 2000 4000
Overall
0.2
.4.6
.8
-4000 -2000 0 2000 4000
Master
0.0
5.1
.15
.2.2
5
-4000 -2000 0 2000 4000
Doctorate
0.1
.2.3
-4000 -2000 0 2000 4000
Professional
Page 61
62
Figure 4: Graphical representation of RD estimates on Pell and Graduate School Enrollment by Student Subgroups
.2.3
.4.5
.6.7
-4000 -2000 0 2000 4000
White
0.2
.4.6
.8-4000 -2000 0 2000 4000
Black
0.2
.4.6
.8
-4000 -2000 0 2000 4000
Hispanic
0.2
.4.6
.81
-4000 -2000 0 2000 4000
Asian
.2.3
.4.5
.6.7
-4000 -2000 0 2000 4000
First-Gen
Page 62
63
Race: WhiteRace:
MinorityAge Parent: BA Female
AP/IB
Credits
ACT/SAT
Score
Grad School
Expect
Hours
Worked
# of
Dependents
Total State
GrantsTotal Loans Income
Degree
GPA
-0.253+ 0.190 -1.853 -0.033 0.078 0.200 20.048 -0.170 2.978 -0.241 519.624 -3,791.524+ 0.087 -0.115
(0.146) (0.163) (2.007) (0.179) (0.150) (0.169) (45.873) (0.159) (3.230) (0.204) (653.645) (2,046.546) (0.759) (0.162)
Functional Form Linear Linear Linear Linear Linear Linear Linear Linear Linear Linear Linear Linear Linear Linear
Survey Weights IncludedYes Yes Yes Yes Yes Yes Yes Yes Yes Yes Yes Yes Yes Yes
Student-level Covariates Yes Yes Yes Yes Yes Yes Yes Yes Yes Yes Yes Yes Yes Yes
Observations 5,237 5,237 5,237 5,237 5,237 5,237 5,237 5,237 5,237 5,237 5,237 5,237 5,237 5,237
All Students
IV Estimates of on RD Assumption
Table 1: RD Assumption Test on Key Covariates
Page 63
64
Table 2: Descriptive Statistics
Pell: No Pell: Yes Pell: 1 Year Pell: 2 Years Pell: 3 Years Pell: 4+ Years
Any Graduate School Enrollment 0.49 0.50 0.45 0.51 0.50 0.51
(0.50) (0.50) (0.50) (0.50) (0.50) (0.50)
Master's Program Enrollment 0.35 0.33 0.31 0.37 0.33 0.34
(0.48) (0.47) (0.46) (0.48) (0.47) (0.47)
Doctoral Program Enrollment 0.04 0.06 0.05 0.07 0.06 0.06
(0.20) (0.24) (0.23) (0.25) (0.24) (0.25)
Professional Degree Program
Enrollment
0.09 0.12 0.10 0.10 0.13 0.13
(0.29) (0.32) (0.30) (0.30) (0.34) (0.33)
Observations 6,159 6,223 1,204 967 1,005 3,047
Notes. Standard deviations in parentheses
Page 64
65
0 - 25th 26th-50th 51st-75th 76th-100th 0 - 25th 26th-50th 51st-75th 76th-100th 0 - 25th 26th-50th 51st-75th 76th-100th 0 - 25th 26th-50th 51st-75th 76th-100th
0.400 0.428 0.483 0.510 0.335 0.348 0.366 0.379 0.039 0.043 0.073 0.073 0.070 0.084 0.117 0.133
(0.49) (0.50) (0.50) (0.50) (0.47) (0.48) (0.48) (0.49) (0.19) (0.20) (0.26) (0.26) (0.26) (0.28) (0.32) (0.34)
0.368 0.416 0.411 0.467 0.304 0.330 0.313 0.343 0.039 0.046 0.060 0.083 0.066 0.082 0.094 0.115
(0.48) (0.49) (0.49) (0.50) (0.46) (0.47) (0.46) (0.47) (0.19) (0.21) (0.24) (0.28) (0.25) (0.27) (0.29) (0.32)
0.482 0.578 0.570 0.586 0.446 0.495 0.520 0.487 0.027 0.051 0.089 0.070 0.039 0.085 0.085 0.112
(0.50) (0.50) (0.50) (0.49) (0.50) (0.50) (0.50) (0.50) (0.16) (0.22) (0.29) (0.26) (0.19) (0.28) (0.28) (0.32)
0.457 0.548 0.430 0.517 0.418 0.421 0.355 0.369 0.017 0.044 0.036 0.046 0.043 0.140 0.071 0.158
(0.50) (0.50) (0.50) (0.50) (0.50) (0.50) (0.48) (0.48) (0.13) (0.21) (0.19) (0.21) (0.20) (0.35) (0.26) (0.37)
0.387 0.436 0.486 0.515 0.331 0.353 0.412 0.364 0.034 0.029 0.049 0.069 0.053 0.086 0.081 0.142
(0.49) (0.50) (0.50) (0.50) (0.47) (0.48) (0.49) (0.48) (0.18) (0.17) (0.22) (0.25) (0.22) (0.28) (0.27) (0.35)
All Students
Caucasian / White
African American / Black
First-Generation
Notes. Standard deviations in parentheses; 0 percentile = lowest cumulative Pell Grant award; 100th percentile = largest cumulative Pell Grant award
Hispanic / Latino
Any Graduate Program Master's Program Doctoral Program Professional Degree Program
Table 3: Descriptives by Level of Percentile of Cumulative Pell Grant Awards
Page 65
66
Table 4: RD Effects on Graduate School Enrollment (by Pell Dosage)
IV Estimates of Pell Grant Receipt Any Graduate Program Master's Program Doctoral Program Professional Degree Program
(1) (2) (3) (1) (2) (3) (1) (2) (3) (1) (2) (3)
Panel 1: All Students 0.008 -0.018 -0.010 -0.042 -0.046 -0.023 0.028 0.005 0.011 0.041 0.010 0.018 (0.055) (0.055) (0.054) (0.059) (0.071) (0.068) (0.027) (0.031) (0.032) (0.038) (0.055) (0.047)
Panel 2: Pell ≥ 4 Yrs vs. No Pell -0.003 -0.011 0.013 -0.080 -0.044 0.010 0.063 0.047 0.064 -0.006 -0.054 -0.040 (0.116) (0.169) (0.122) (0.135) (0.186) (0.174) (0.050) (0.059) (0.062) (0.079) (0.099) (0.100)
Panel 3: Pell ≥ 3 Yrs vs. No Pell -0.034 -0.058 -0.066 -0.101 -0.091 -0.079 0.030 0.010 0.025 0.035 -0.003 0.003 (0.067) (0.093) (0.093) (0.094) (0.118) (0.093) (0.040) (0.044) (0.045) (0.052) (0.064) (0.061)
Panel 4: Pell ≥ 2 Yrs vs. No Pell -0.015 -0.030 -0.021 -0.074 -0.084 -0.061 0.023 0.004 0.012 0.066 0.038 0.040 (0.062) (0.062) (0.062) (0.069) (0.087) (0.081) (0.032) (0.036) (0.037) (0.042) (0.054) (0.051)
Functional Form Linear Linear Linear Linear Linear Linear Linear Linear Linear Linear Linear Linear
Survey Weights Included No Yes Yes No Yes Yes No Yes Yes No Yes Yes
Student-level Covariates No No Yes No No Yes No No Yes No No Yes
# of Observations 7,217 7,217 7,217 7,217 7,217 7,217 7,217 7,217 7,217 7,217 7,217 7,217
Notes. Standard errors in parentheses; + p < 0.10, * p < 0.05, ** p < 0.01, *** p < 0.001
Page 66
67
Table 5: RD Effects on Graduate School Enrollment (by Student Groups)
IV Estimates of Pell Grant Receipt
Any Graduate
Program
Master's
Program
Doctoral
Program
Professional Degree
Program
All Students -0.010
-0.023
0.011
0.018
(0.054)
(0.068)
(0.032)
(0.047)
White Students -0.045 -0.046 0.031 0.001 (0.080) (0.067) (0.030) (0.041)
Black / African American
Students
-0.212 -0.533 0.046 0.332*
(0.313) (0.339) (0.049) (0.168)
Hispanic / Latino Students -0.001 0.110 0.002 -0.018 (0.528) (0.481) (0.169) (0.036)
Asian / Pacific Islander Students -0.179 0.133 0.002 -0.319 (0.403) (0.424) (0.169) (0.324)
First-Generation Students -0.079 -0.094 0.002 0.018 (0.087) (0.090) (0.169) (0.049)
Functional Form Linear Linear Linear Linear
Survey Weights Included Yes Yes Yes Yes
Student-level Covariates Yes Yes Yes Yes
Notes. Standard errors in parentheses; + p < 0.10, * p < 0.05, ** p < 0.01, *** p < 0.001