90
usfunds.com 1.800.US.FUNDS January 2013 • 13-042 More Sunshine, Less Stormy Weather Outlook 2013 Frank Holmes, CEO and Chief Investment Officer

usfunds.com 1.800.US.FUNDS January 2013 • 13-042
More Sunshine, Less Stormy Weather Outlook 2013
Frank Holmes, CEO and Chief Investment Officer
usfunds.com January 2013 13-042
usfunds.com
Go to usfunds.com To Sign Up for the Investor Alert Today
2
Subscribe to the weekly, free e-newsletter at usfunds.com/subscribe
And for advisors— Subscribe to Advisor Alert at usfunds.com/AAsubscribe

usfunds.com January 2013 13-042
usfunds.com
U.S. Global Investors is Mobile
3
Get Investor Alert and Frank Talk On the Go
Visit www.usfunds.com/apps

usfunds.com January 2013 13-042
usfunds.com
We Focus on Education at usfunds.com
4
43 MFEA STAR Awards for Excellence in Education

usfunds.com January 2013 13-042
usfunds.com
5
We Focus on Fund Performance at usfunds.com
Winner of 29 Lipper performance awards, certificates and top rankings since 2000
(Four out of 13 U.S. Global Investors Funds received Lipper performance awards from 2005 to 2008, six out of 13 received certificates from 2000 to 2007,
and two out of 13 received top rankings from 2009 to 2010.)
Investment leadership results in performance

usfunds.com January 2013 13-042
usfunds.com
Fund Recognition: 4 Funds in the Top 4 Percent for 10-Year Period
6

usfunds.com January 2013 13-042
usfunds.com
Generating Alpha — “Performance and Results Oriented”
7

usfunds.com January 2013 13-042
usfunds.com
Metaphor: Tipping Points, Melting Points H2O is Like Money
8
Ice Turns to Water at 32º, but Still H2O

usfunds.com January 2013 13-042
usfunds.com
9
Chindia – Rising Middle Class
Source: padanisaa.blogspot.com

usfunds.com January 2013 13-042
usfunds.com
10
Government Policy Model — Precursor for Change
President Barack Obama Ben Bernanke, Chairman of the Federal Reserve

usfunds.com January 2013 13-042
usfunds.com
11
Emerging World Holds 50% of the Global Population, Just 22% of GDP

usfunds.com January 2013 13-042
usfunds.com
Are You Underweight?
Energy & Basic Materials
15% of S&P 500
12

usfunds.com January 2013 13-042
usfunds.com
Global Resources Fund Outperformed ETFs – 10 year
13
Past performance is no guarantee of future results.
usfunds.com January 2013 13-042
usfunds.com
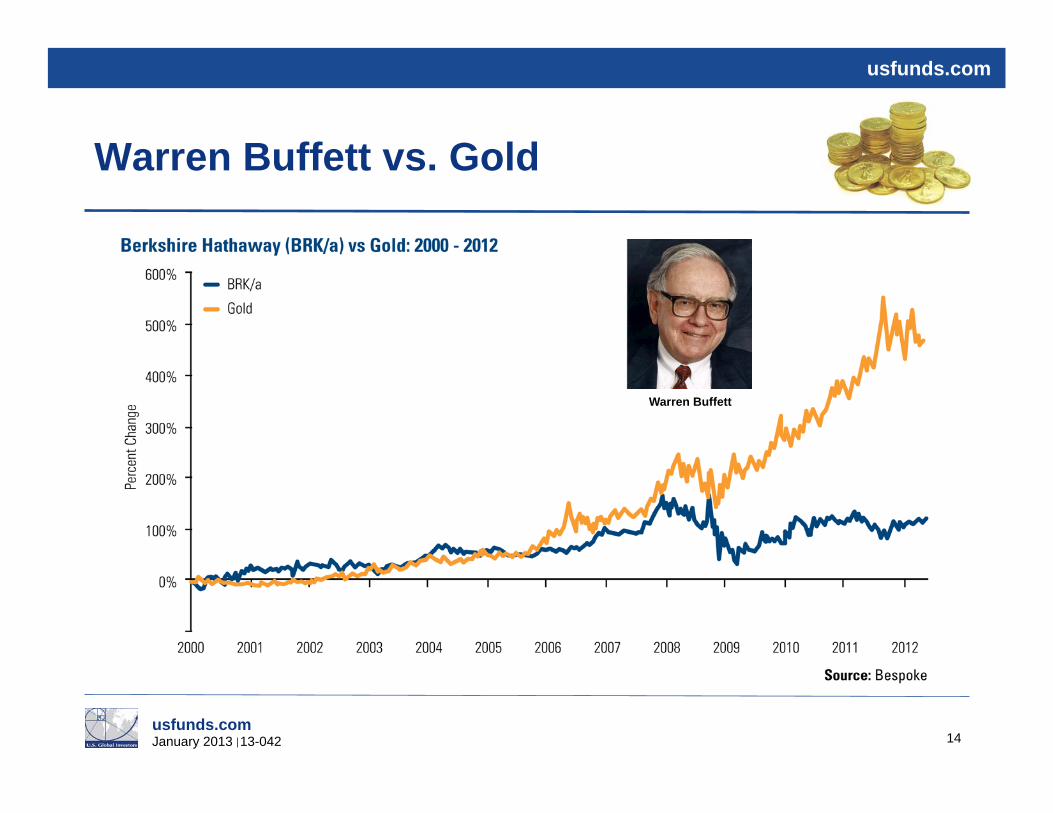
Warren Buffett vs. Gold
14
Warren Buffett

usfunds.com January 2013 13-042
usfunds.com
Tech Stocks Lost More Than Lipper Gold Funds Combined
15

usfunds.com January 2013 13-042
usfunds.com
Two Stocks Lost $61 Billion, Almost as Much as Is Invested in SPDR Gold Shares (GLD)
16

usfunds.com January 2013 13-042
usfunds.com
17

usfunds.com January 2013 13-042
usfunds.com
“Follow the Money” — Equities and Gold Have Outperformed Bonds
18
usfunds.com January 2013 13-042
usfunds.com
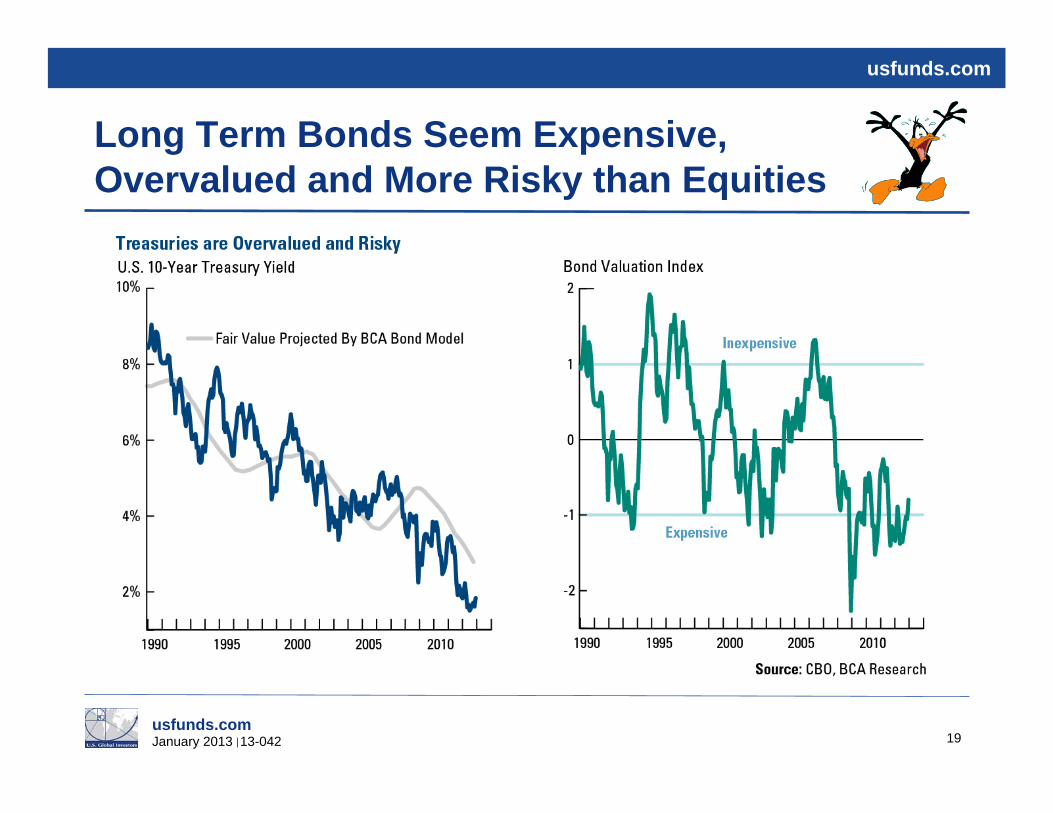
Long Term Bonds Seem Expensive, Overvalued and More Risky than Equities
19
usfunds.com January 2013 13-042
usfunds.com
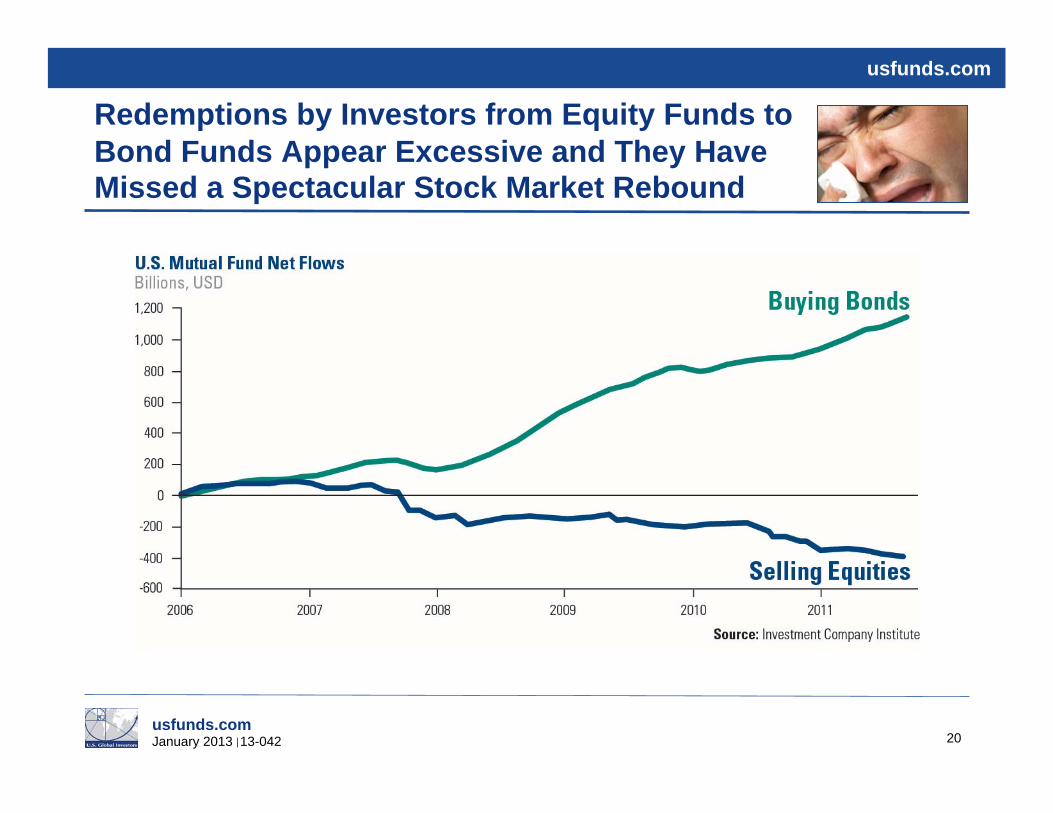
Redemptions by Investors from Equity Funds to Bond Funds Appear Excessive and They Have Missed a Spectacular Stock Market Rebound
20

usfunds.com January 2013 13-042
usfunds.com
Presidential Election Cycle and the Power of Money
21

usfunds.com January 2013 13-042
usfunds.com
“Follow the Money”– Gold Price Surged With Increase of U.S. Monetary Base
22

usfunds.com January 2013 13-042
usfunds.com
“Follow the Money”– Global Liquidity Boom Good for Gold and Emerging Markets
23
usfunds.com January 2013 13-042
usfunds.com
Predicting Attractive Tops and Bottoms — Easier in South Beach vs. Markets
24
Priority — Reading Money Magazine

usfunds.com January 2013 13-042
usfunds.com
Seasonality Fluctuations Appear Poised to Rebound – XAU Gold Stock Index
25
usfunds.com January 2013 13-042
usfunds.com
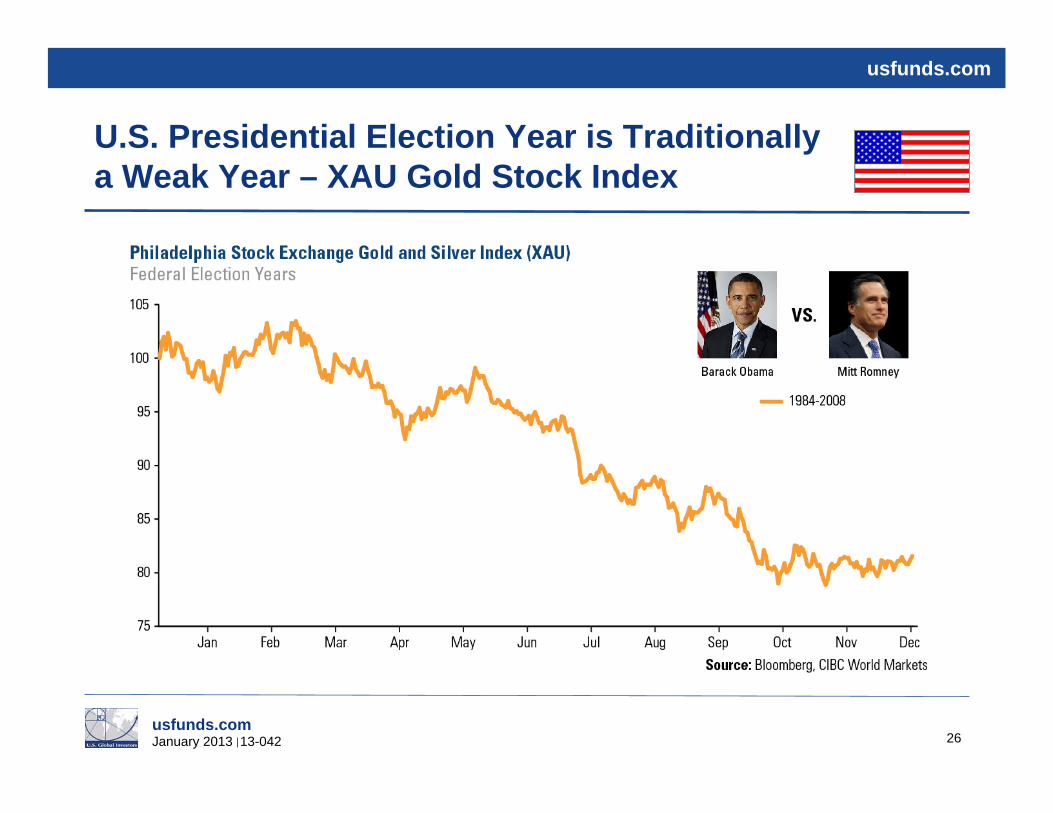
U.S. Presidential Election Year is Traditionally a Weak Year – XAU Gold Stock Index
26

usfunds.com January 2013 13-042
usfunds.com
Managing Expectations — But 2013 Should Post Better Comebacks for Gold Stocks?
27
Past performance does not guarantee future results.

usfunds.com January 2013 13-042
usfunds.com
Managing Expectations — Year-over-Year Rolling Oscillator
28

usfunds.com January 2013 13-042
usfunds.com
Reasons for Active Management — Gold and Silver Have Different Seasonal Patterns
29

usfunds.com January 2013 13-042
usfunds.com
30
More Sunshine, Less Stormy Weather
usfunds.com January 2013 13-042
usfunds.com
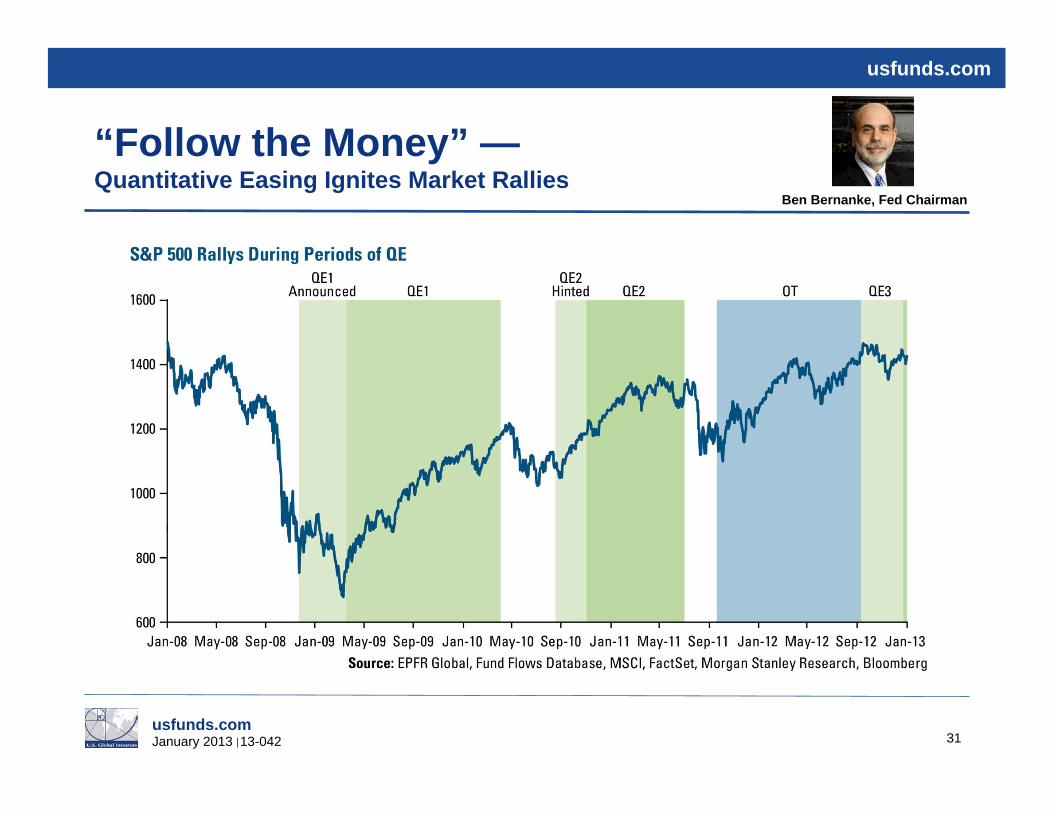
“Follow the Money” — Quantitative Easing Ignites Market Rallies
31
Ben Bernanke, Fed Chairman

usfunds.com January 2013 13-042
usfunds.com
Not Just the Fed: There’s Been a Global Easing Cycle
32

usfunds.com January 2013 13-042
usfunds.com
Implications of Global Easing Policies
Higher commodity prices Housing & auto rebound Fund flows into “risky” assets
33

usfunds.com January 2013 13-042
usfunds.com
Perpetual Global Central Bank Stimulus
34
usfunds.com January 2013 13-042
usfunds.com
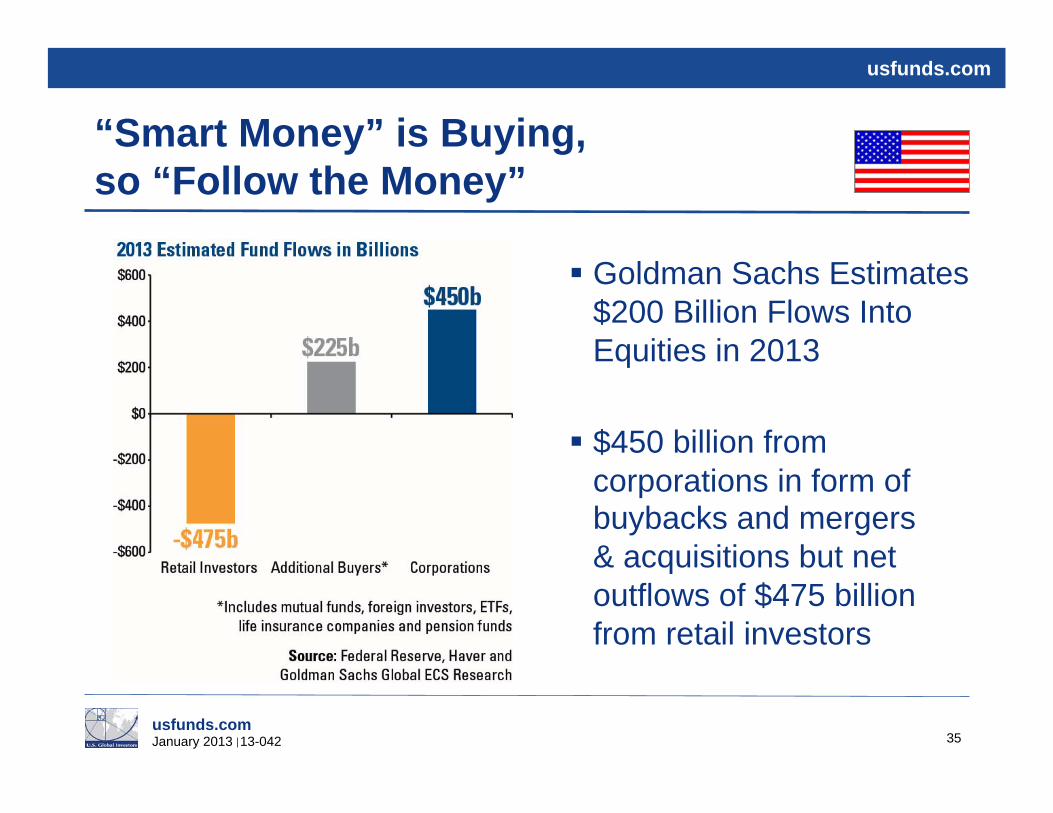
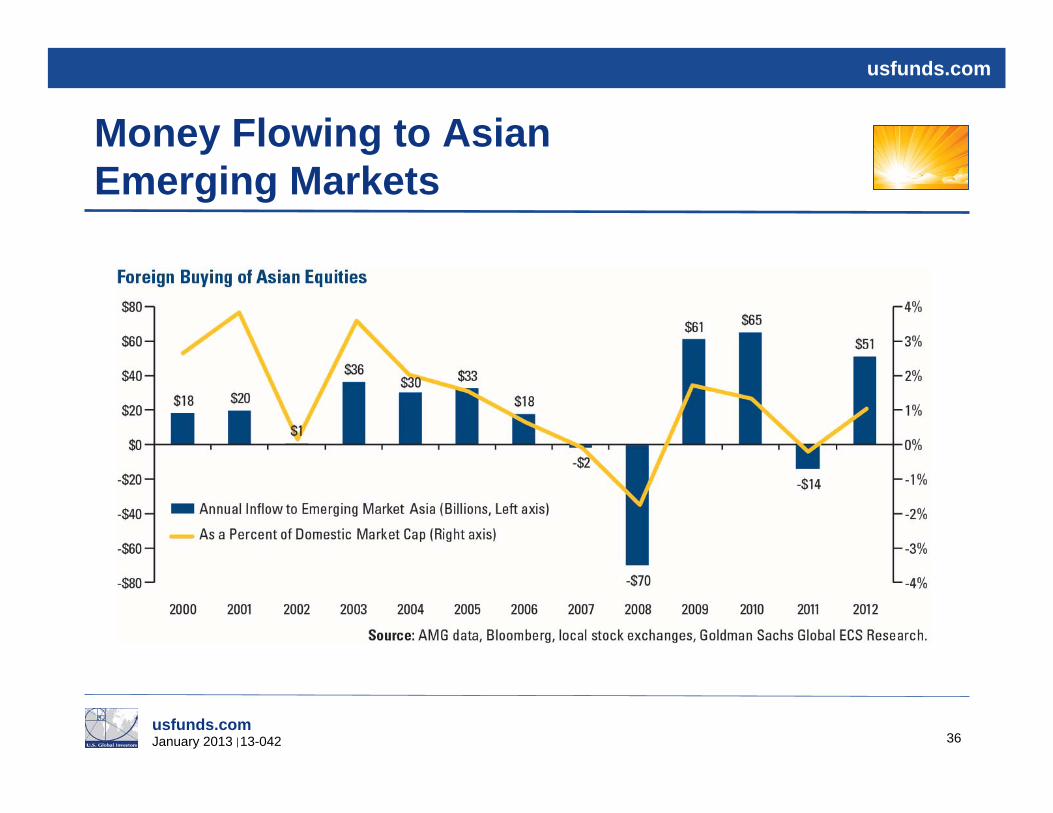
“Smart Money” is Buying, so “Follow the Money”
Goldman Sachs Estimates $200 Billion Flows Into Equities in 2013
$450 billion from corporations in form of buybacks and mergers & acquisitions but net outflows of $475 billion from retail investors
35
usfunds.com January 2013 13-042
usfunds.com
Money Flowing to Asian Emerging Markets
36

usfunds.com January 2013 13-042
usfunds.com
Price Reversal — Chinese Stocks Undervalued
37
“Chinese Stocks Looking Like a Bargain” October 22, 2012
usfunds.com January 2013 13-042
usfunds.com
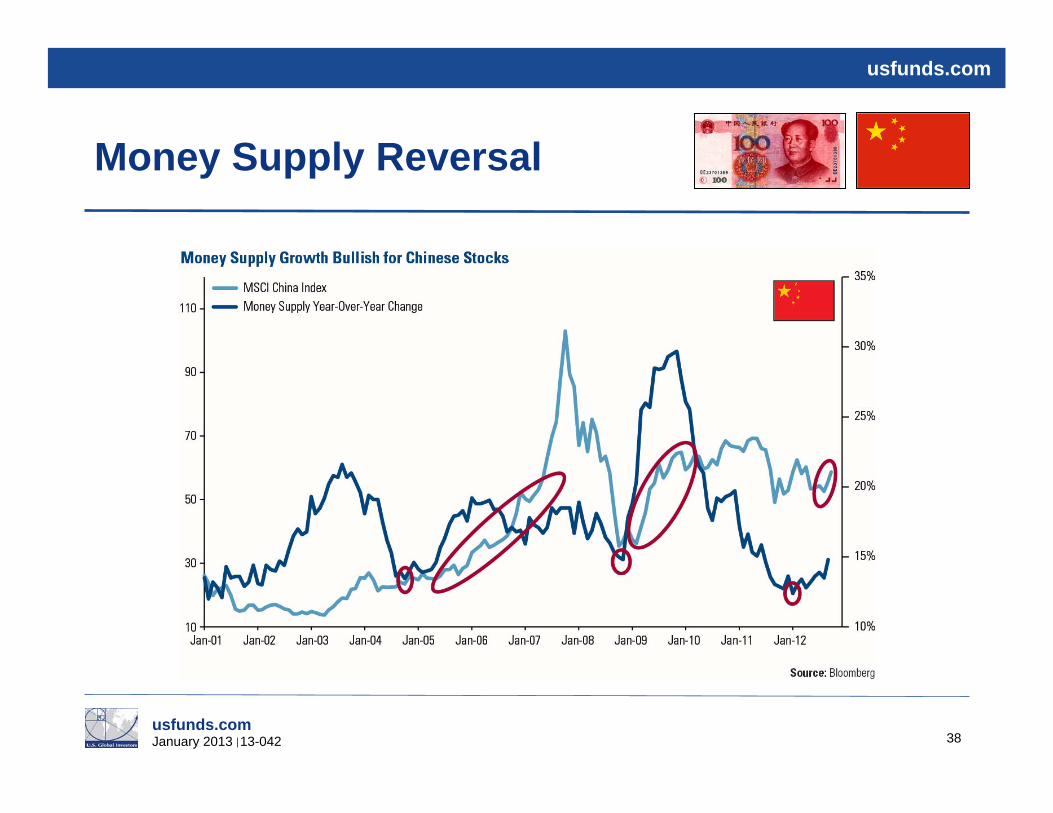
Money Supply Reversal
38

usfunds.com January 2013 13-042
usfunds.com
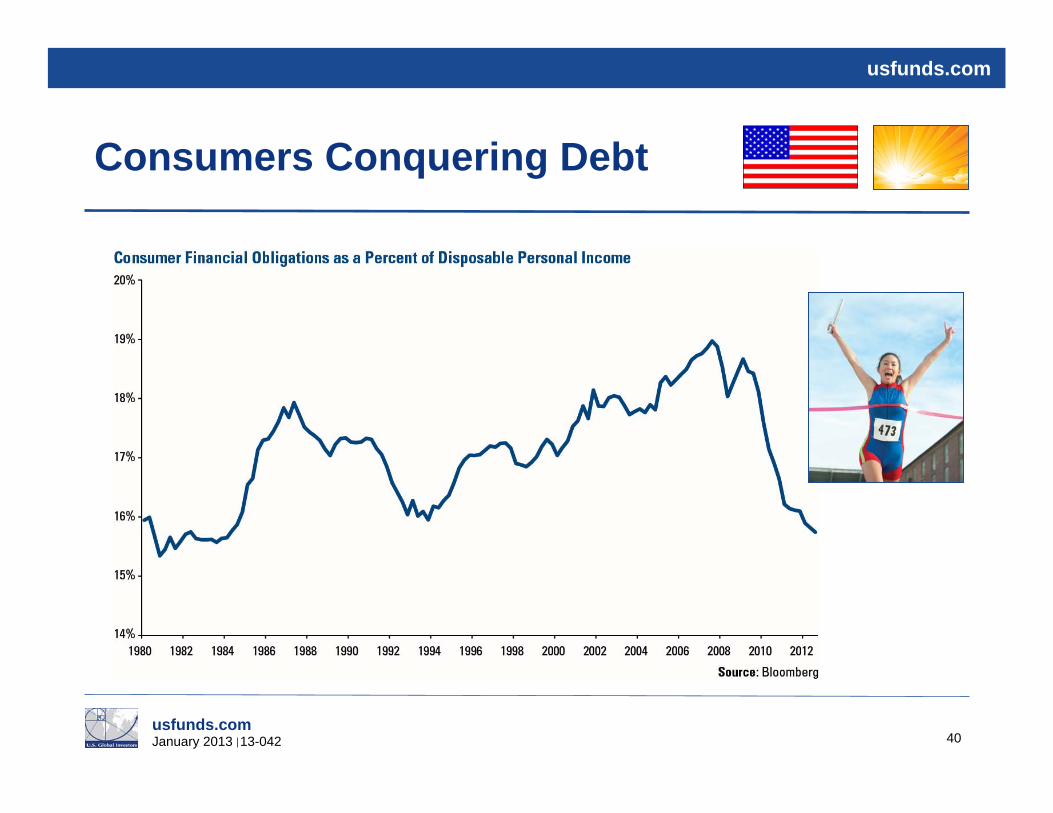
Good News — U.S. Businesses and Households Are Deleveraging
39
usfunds.com January 2013 13-042
usfunds.com
Consumers Conquering Debt
40
usfunds.com January 2013 13-042
usfunds.com
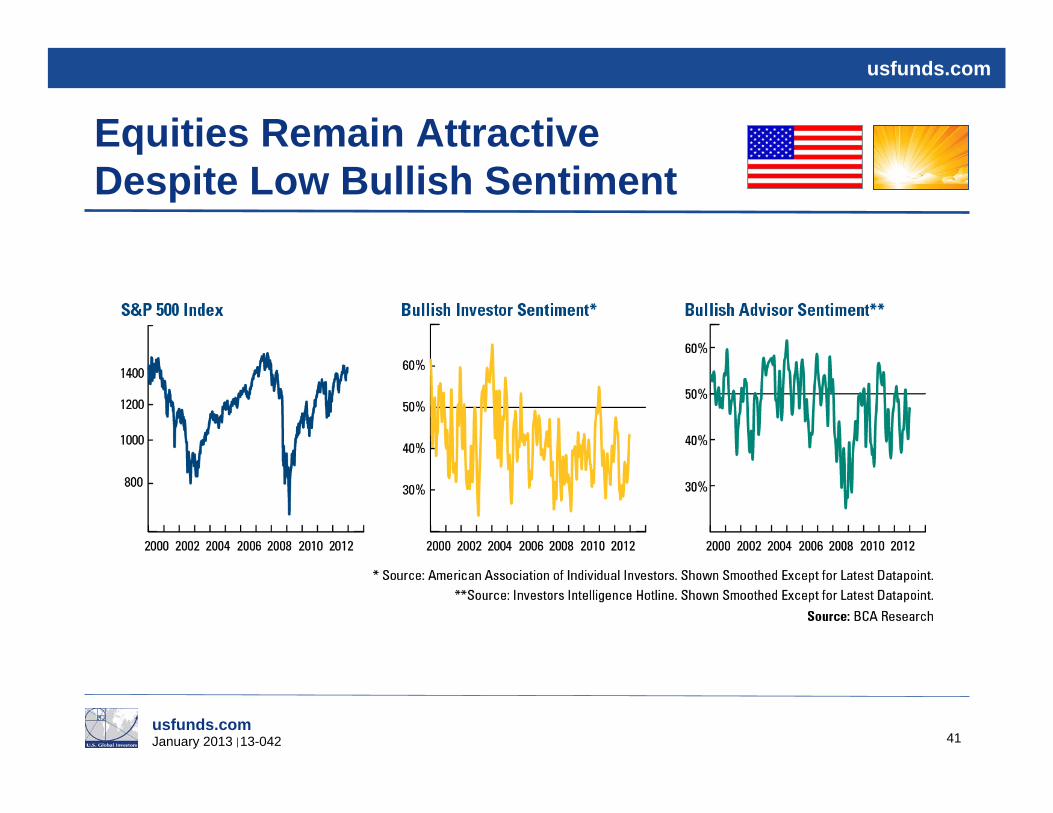
Equities Remain Attractive Despite Low Bullish Sentiment
41
usfunds.com January 2013 13-042
usfunds.com
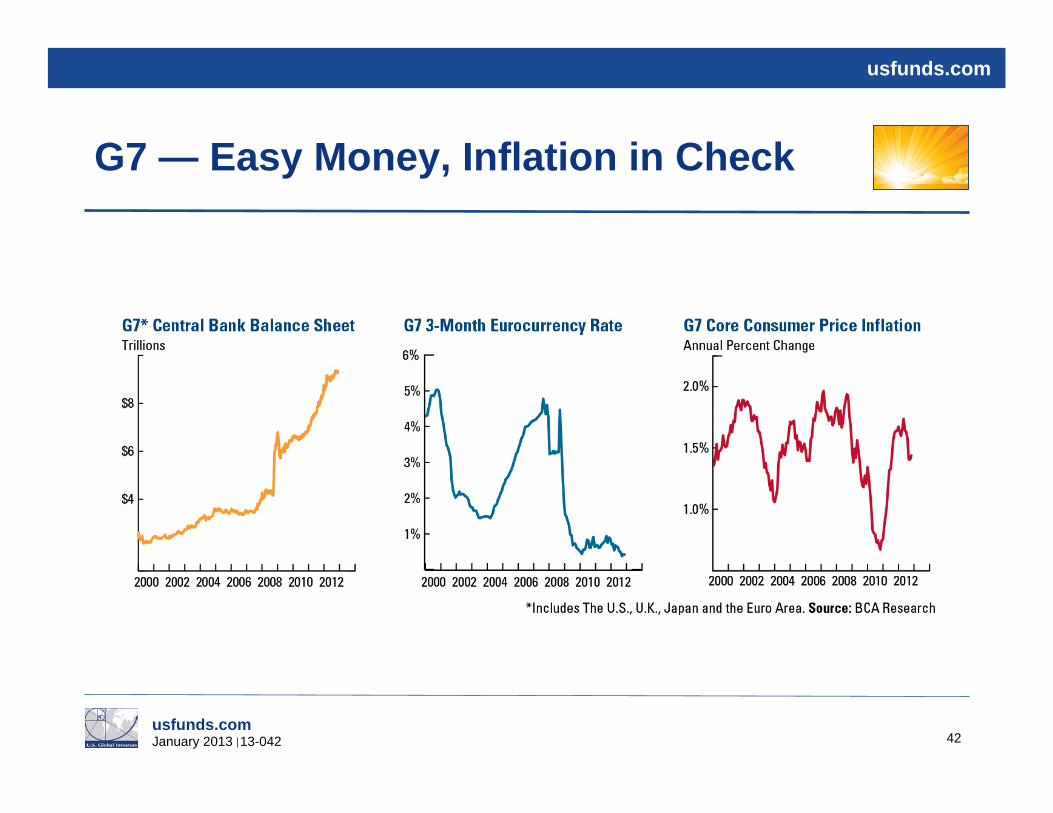
G7 — Easy Money, Inflation in Check
42

usfunds.com January 2013 13-042
usfunds.com
E7— Emerging Markets Remain Attractive
43
usfunds.com January 2013 13-042
usfunds.com
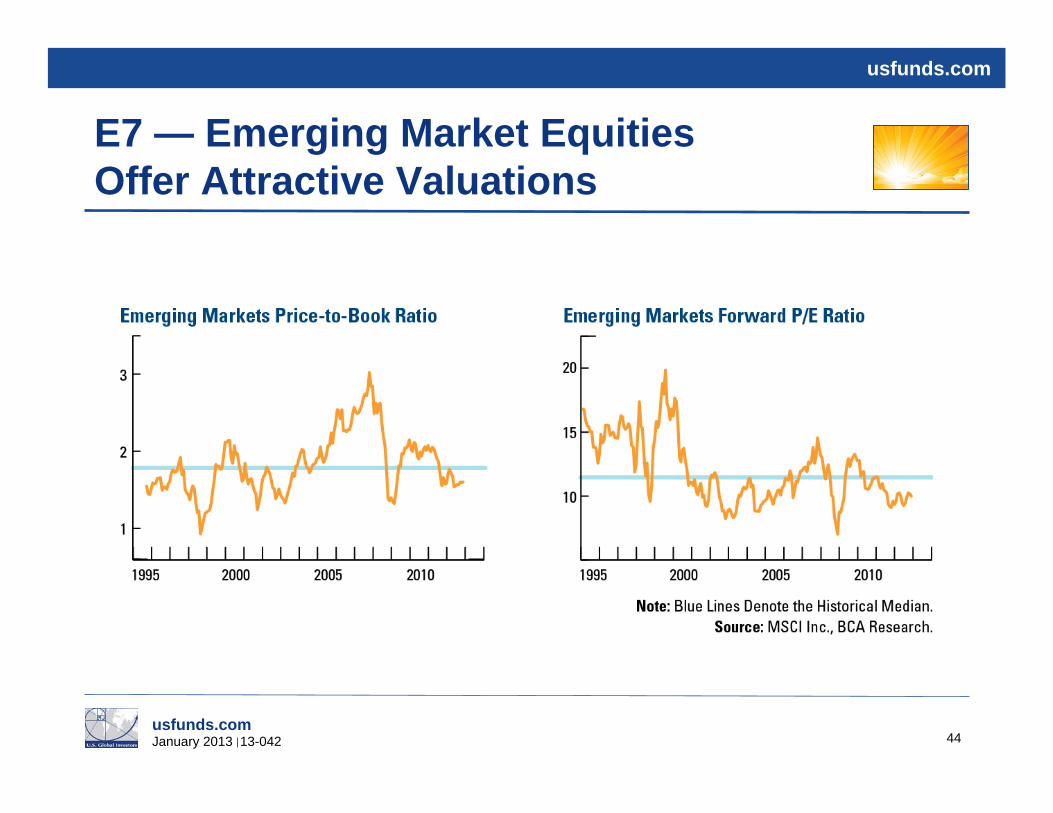
E7 — Emerging Market Equities Offer Attractive Valuations
44

usfunds.com January 2013 13-042
usfunds.com
Europe’s Banks Need More Capital — Postponed by Basel III — “Follow the Money”
45

usfunds.com January 2013 13-042
usfunds.com
“Follow the Money” — Unprecedented Cash Injections from Central Banks
46
usfunds.com January 2013 13-042
usfunds.com
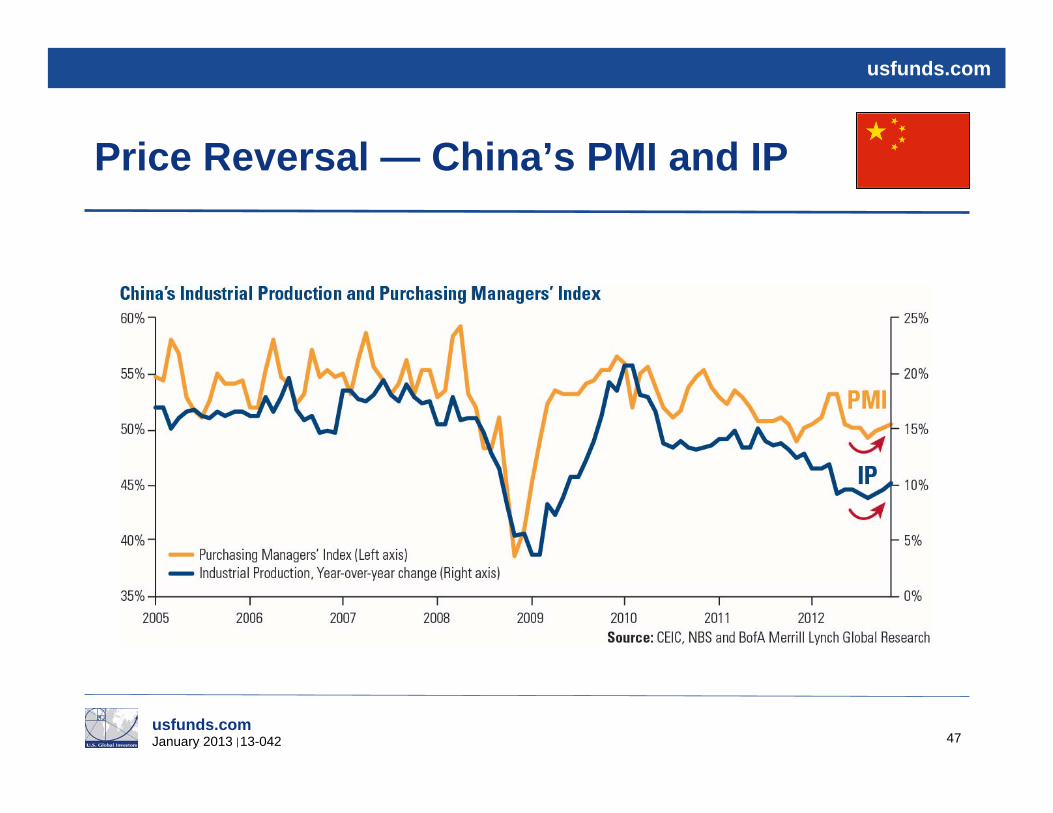
Price Reversal — China’s PMI and IP
47

usfunds.com January 2013 13-042
usfunds.com
Record Oil Demand in China
48

usfunds.com January 2013 13-042
usfunds.com
Housing— Major Price Reversal Good for Employment and Commodity Demand…Collateral Stimulation…Cars, Appliances
49

usfunds.com January 2013 13-042
usfunds.com
Construction Steel Stocks Experienced Deeper Drawdown in 2012 — Opportunity for Restocking?
50

usfunds.com January 2013 13-042
usfunds.com
Prices of Spot Iron Ore in China and Shanghai Rebar Futures Have Edged Up on the Back of Better Economic Activity
51
usfunds.com January 2013 13-042
usfunds.com
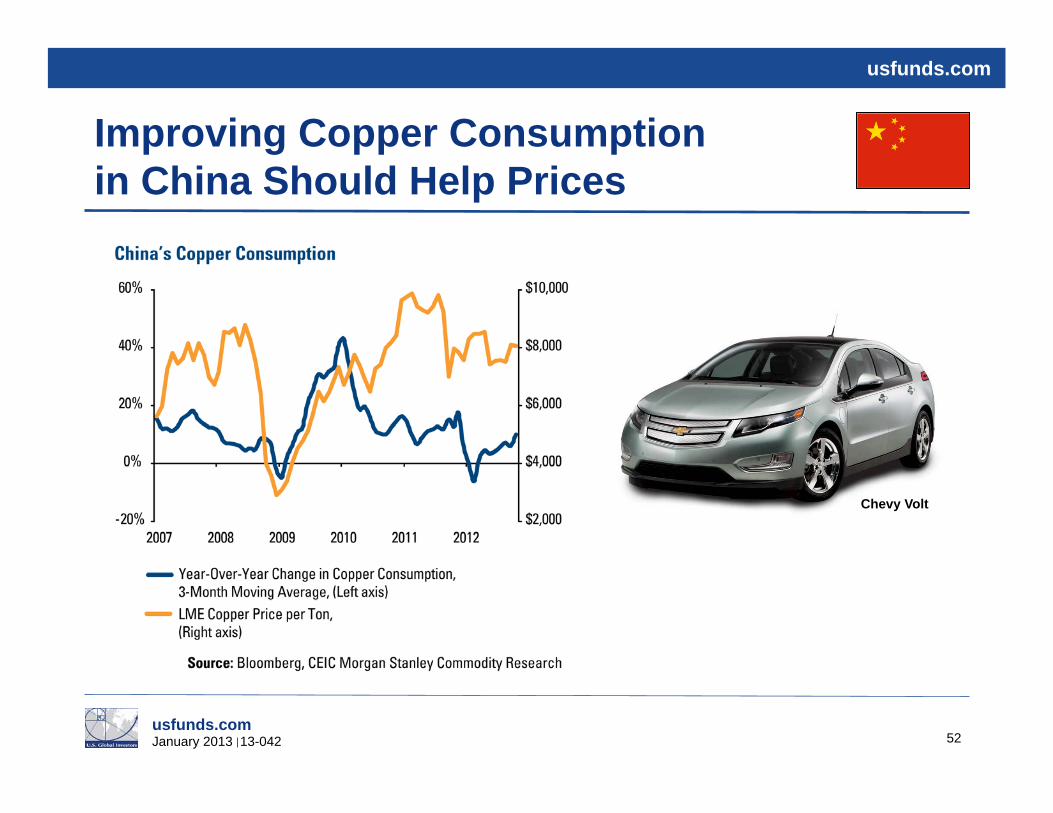
Improving Copper Consumption in China Should Help Prices
52
Chevy Volt

usfunds.com January 2013 13-042
usfunds.com
Uranium Production Not Enough to Meet Long-Term Demand
53

usfunds.com January 2013 13-042
usfunds.com
Gold Demand Drivers
54
Elvis Presley

usfunds.com January 2013 13-042
usfunds.com
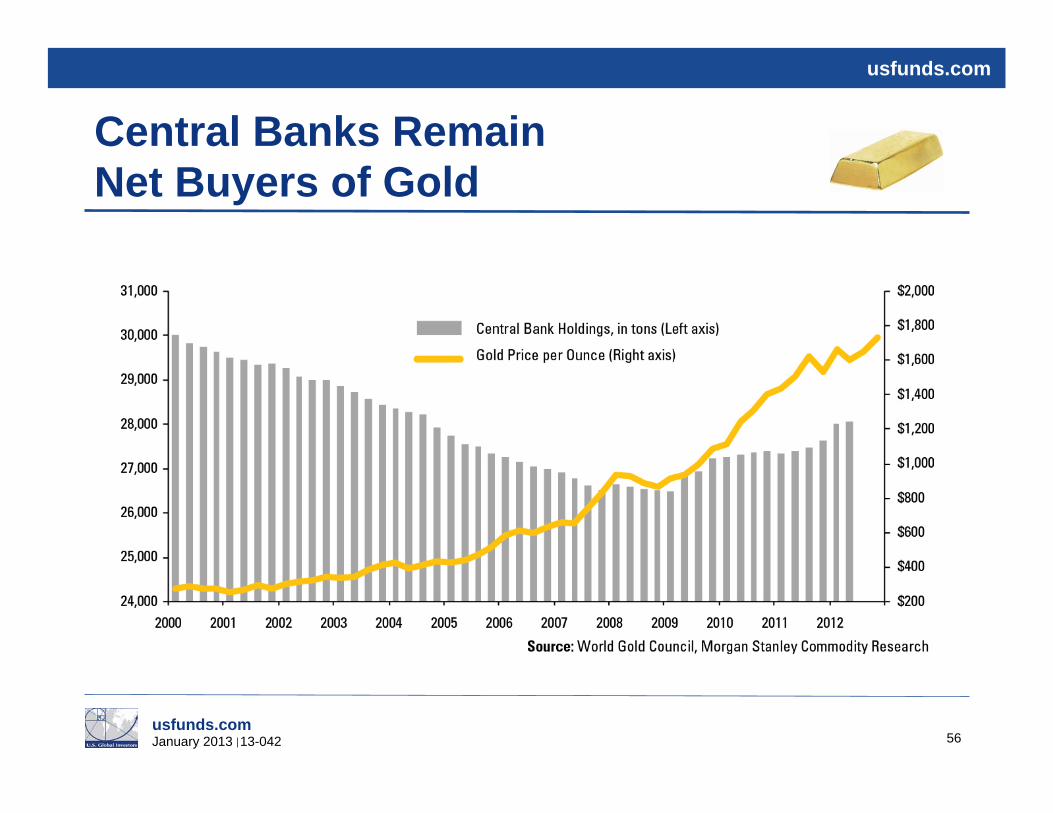
Gold Fundamentals Remain Strong With Central Bank Net Purchases
55
usfunds.com January 2013 13-042
usfunds.com
Central Banks Remain Net Buyers of Gold
56

usfunds.com January 2013 13-042
usfunds.com
Total Global Gold ETF Holdings
57

usfunds.com January 2013 13-042
usfunds.com
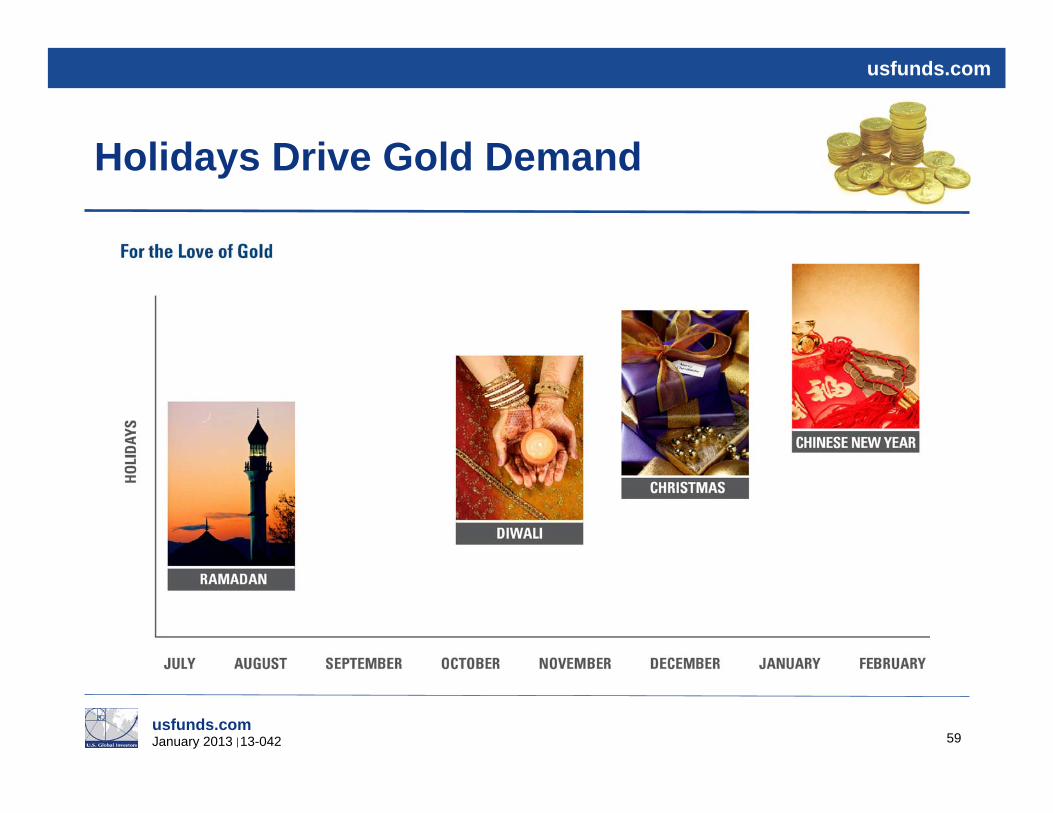
Driver: The Love Trade
58
usfunds.com January 2013 13-042
usfunds.com
Holidays Drive Gold Demand
59

usfunds.com January 2013 13-042
usfunds.com
Gold “Love Trade” Strong Correlation Between Rising Incomes and Gold Price
60

usfunds.com January 2013 13-042
usfunds.com
China’s Increasing Jewelry Demand
61

usfunds.com January 2013 13-042
usfunds.com
Gold Stocks Underperform Bullion
62
Source: Bloomberg

usfunds.com January 2013 13-042
usfunds.com
63
Bullion Has Outperformed Gold Stocks Over the Last Four Years
usfunds.com January 2013 13-042
usfunds.com
64
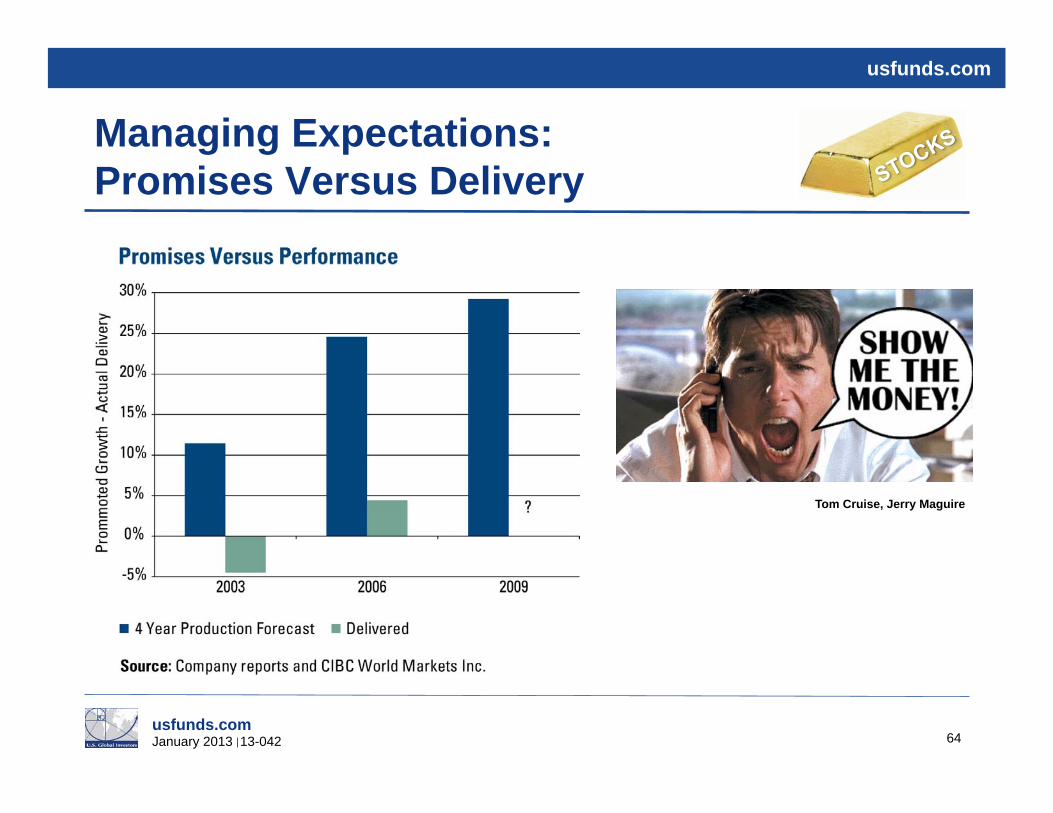
Managing Expectations: Promises Versus Delivery
Tom Cruise, Jerry Maguire

usfunds.com January 2013 13-042
usfunds.com
Gold Producers Are Issuing Stock Options and Shares Faster Than They Are Growing Production, So Gold Leverage Is Harmed
65
Tom Cruise, Jerry Maguire

usfunds.com January 2013 13-042
usfunds.com
Managing Expectations: Show Me the Money On a Per Share Basis
66
Tom Cruise, Jerry Maguire
usfunds.com January 2013 13-042
usfunds.com
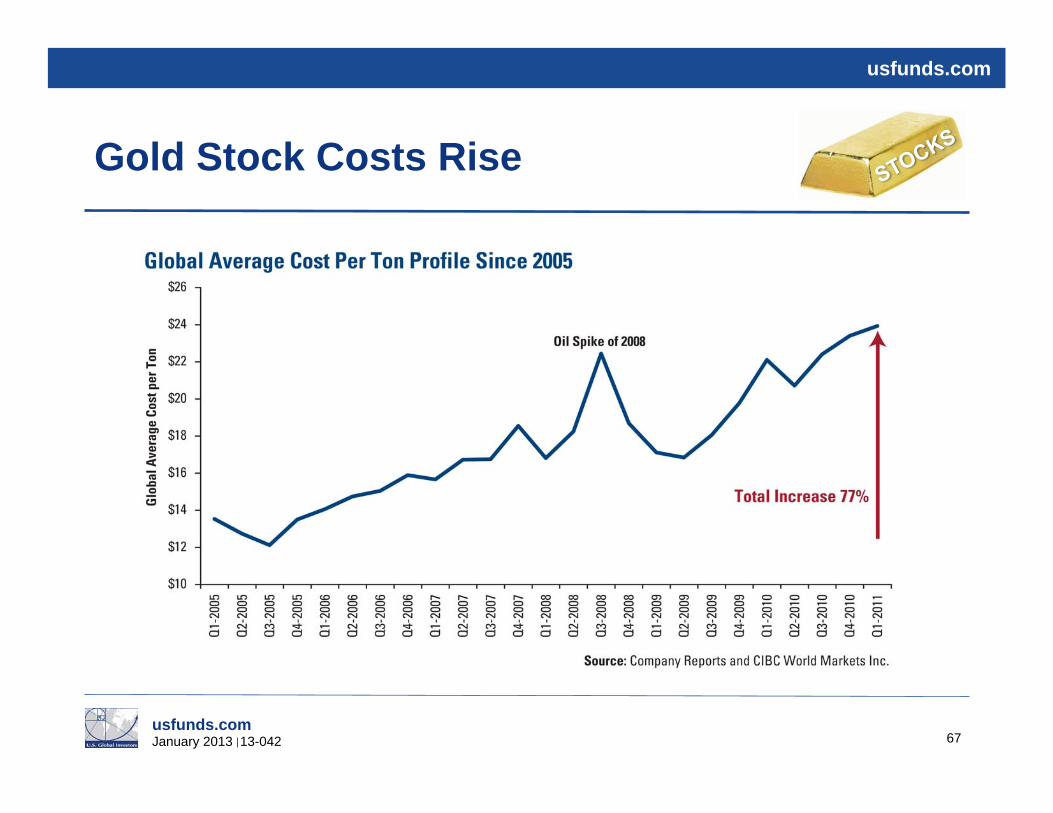
Gold Stock Costs Rise
67
usfunds.com January 2013 13-042
usfunds.com
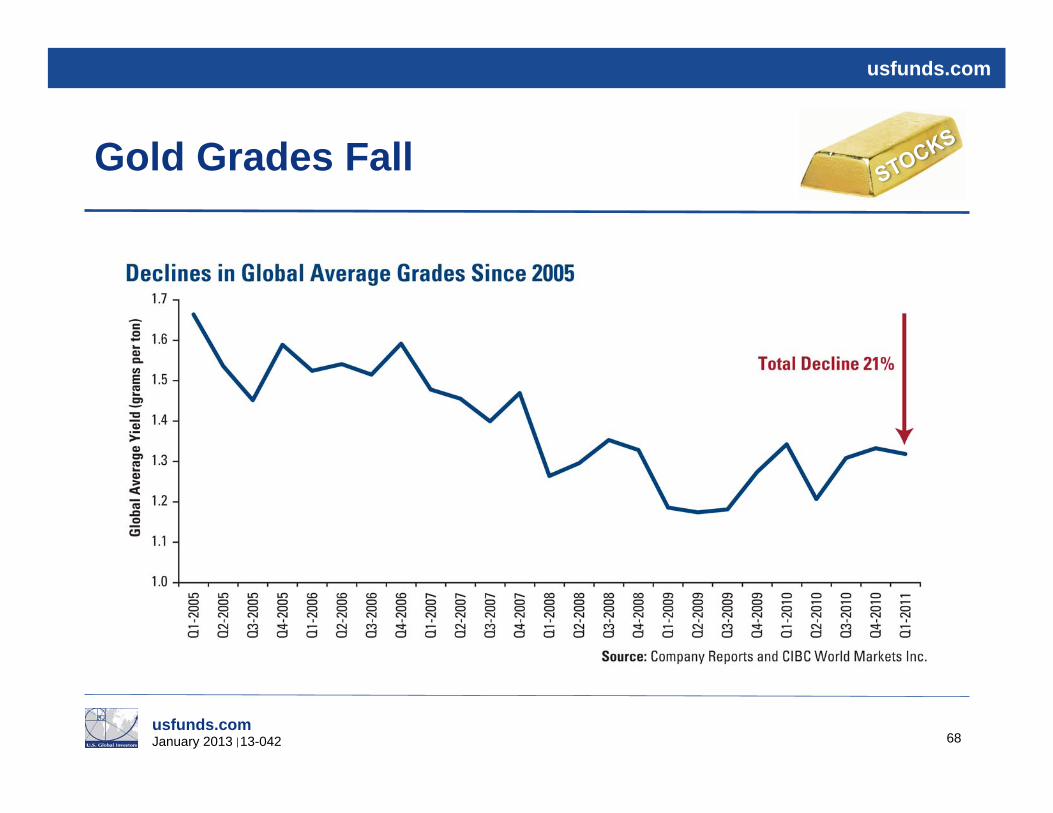
Gold Grades Fall
68
usfunds.com January 2013 13-042
usfunds.com
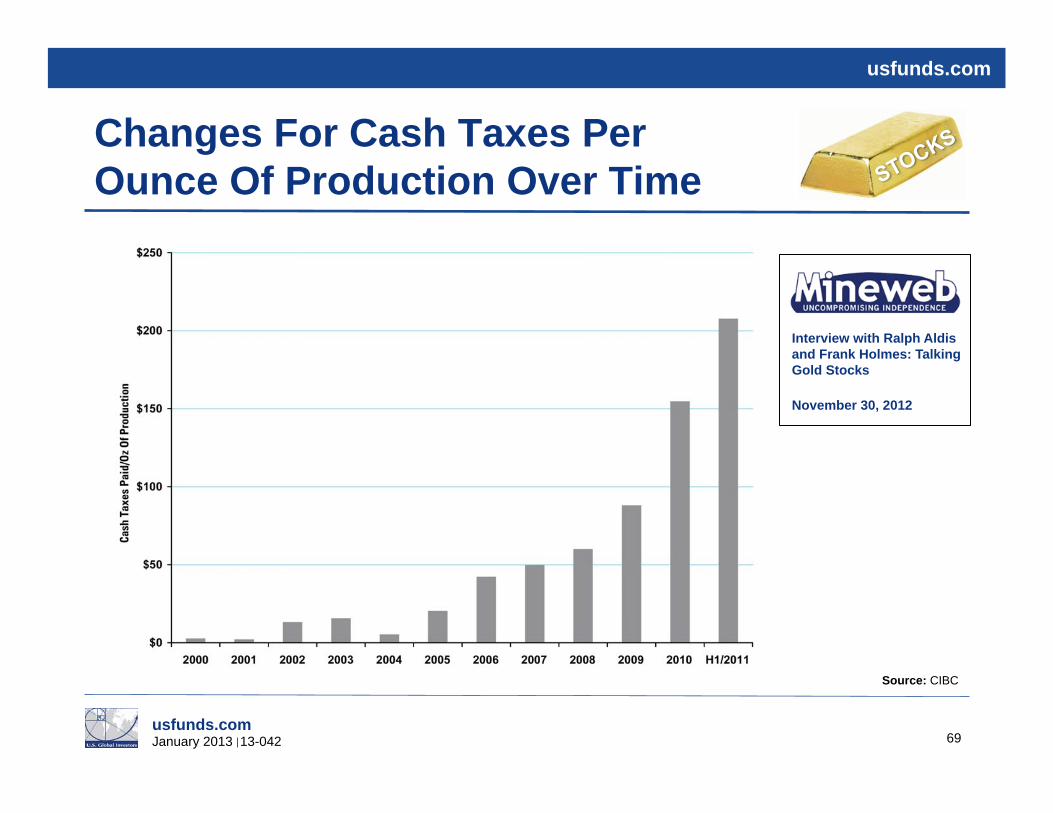
Changes For Cash Taxes Per Ounce Of Production Over Time
69
Source: CIBC
Interview with Ralph Aldis and Frank Holmes: Talking Gold Stocks
November 30, 2012

usfunds.com January 2013 13-042
usfunds.com
The Replacement Cost for an Ounce Of Gold is $1500 with $1700 as a Sustainable Number (2012)
70
usfunds.com January 2013 13-042
usfunds.com
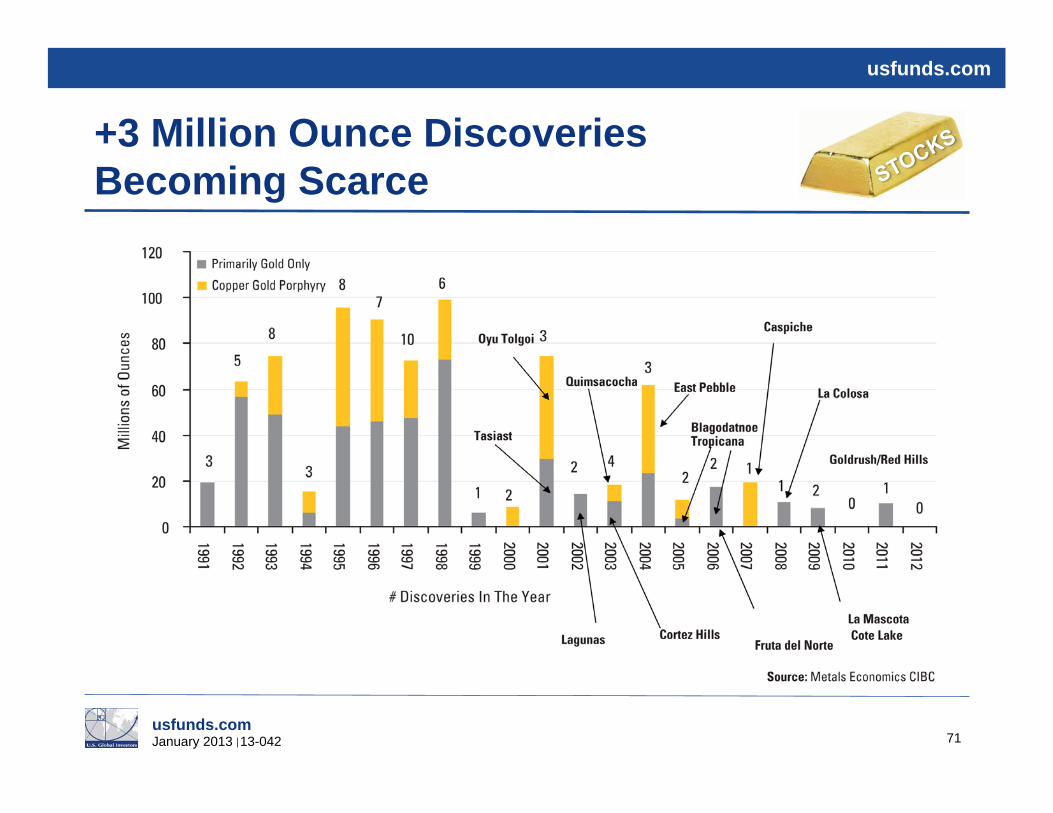
+3 Million Ounce Discoveries Becoming Scarce
71
usfunds.com January 2013 13-042
usfunds.com
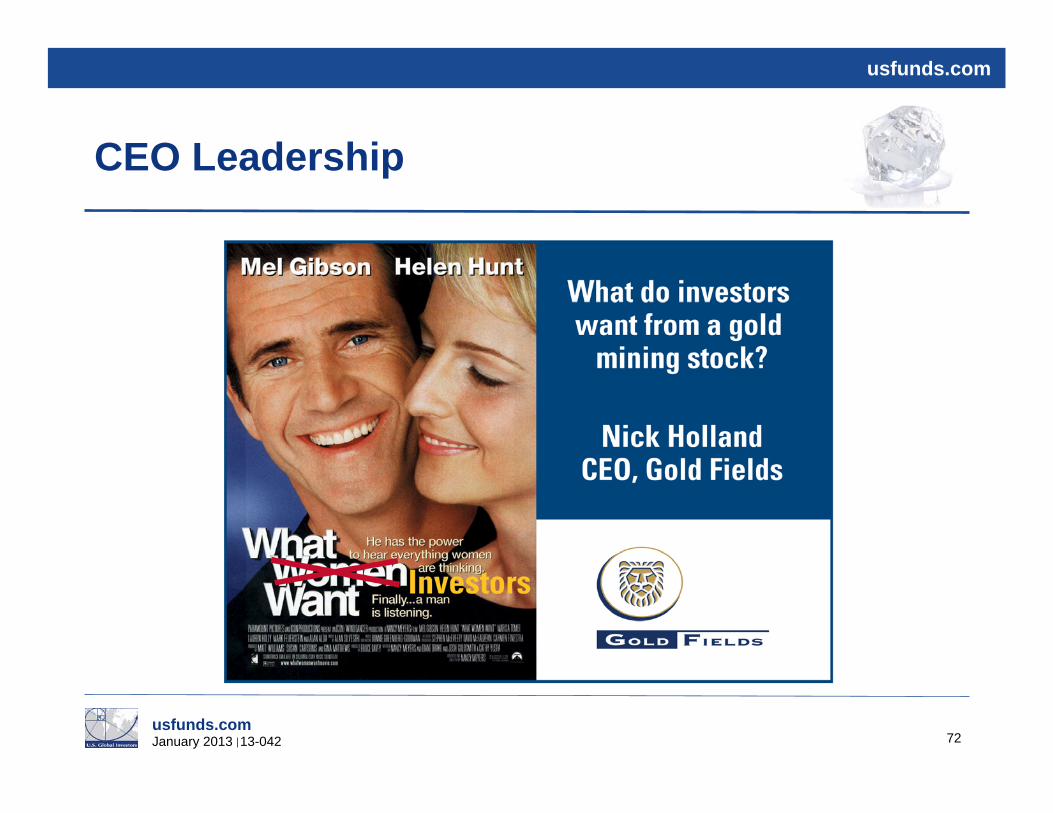
CEO Leadership
72

usfunds.com January 2013 13-042
usfunds.com
Investors in Gold Equities Seek Leverage to the Gold Price
73
usfunds.com January 2013 13-042
usfunds.com
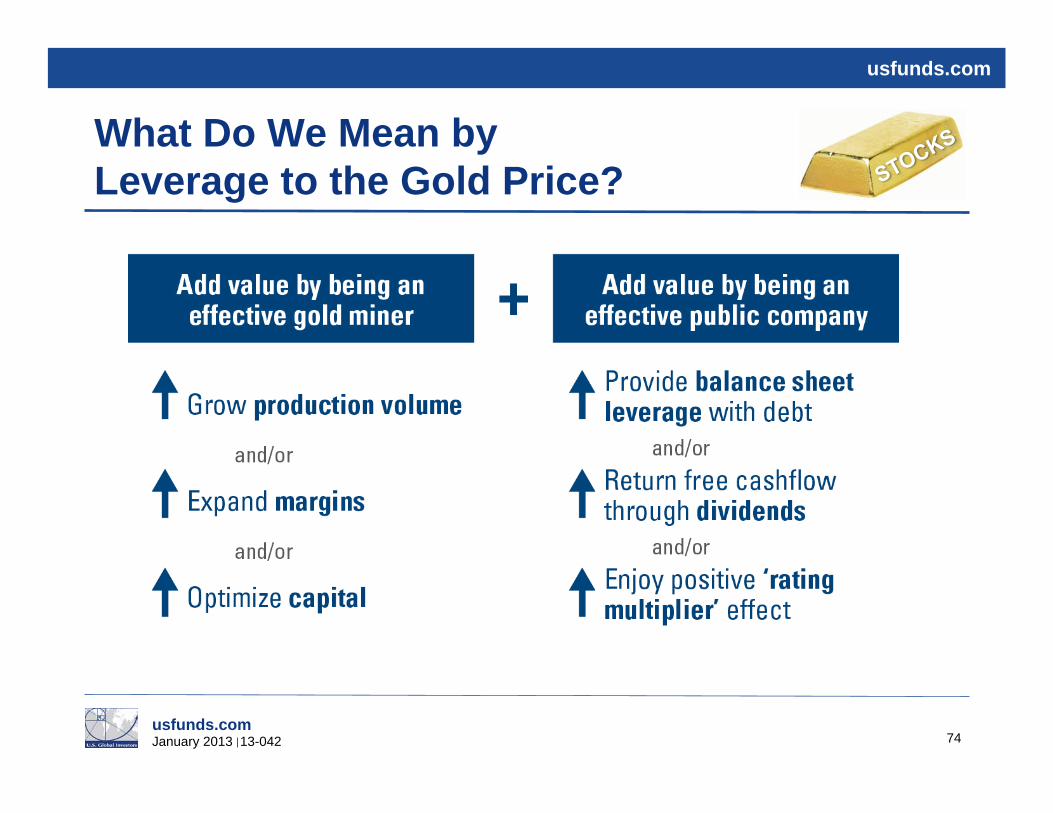
What Do We Mean by Leverage to the Gold Price?
74

usfunds.com January 2013 13-042
usfunds.com
Dividend Yields Continue to Underperform in a “Yield-Hungry” Environment
75
usfunds.com January 2013 13-042
usfunds.com
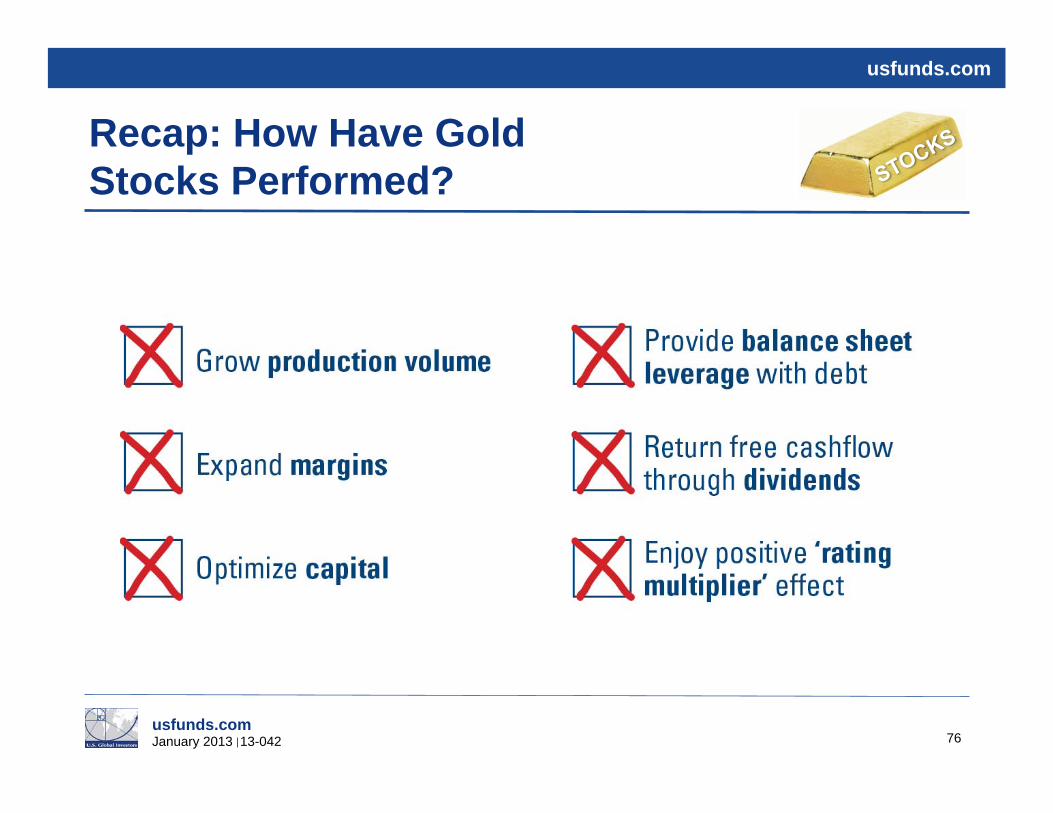
Recap: How Have Gold Stocks Performed?
76
usfunds.com January 2013 13-042
usfunds.com
Multiple Compression: How Long Before Revival?
77
Baywatch
usfunds.com January 2013 13-042
usfunds.com
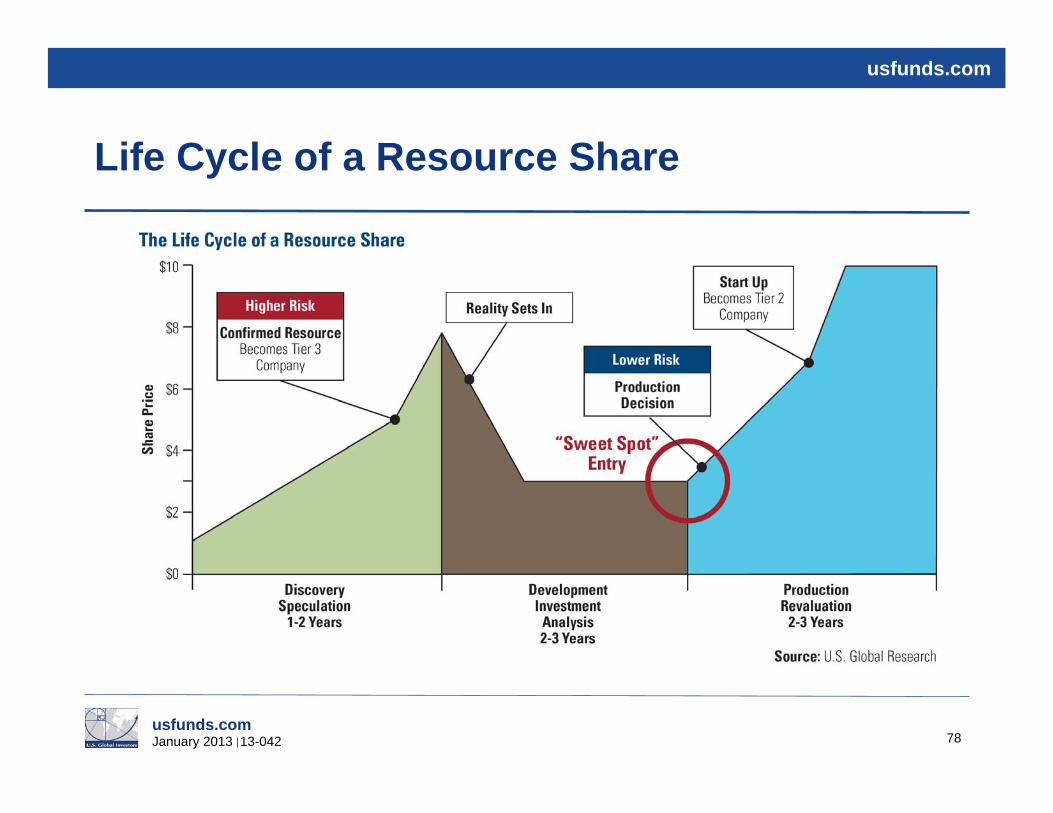
Life Cycle of a Resource Share
78
usfunds.com January 2013 13-042
usfunds.com
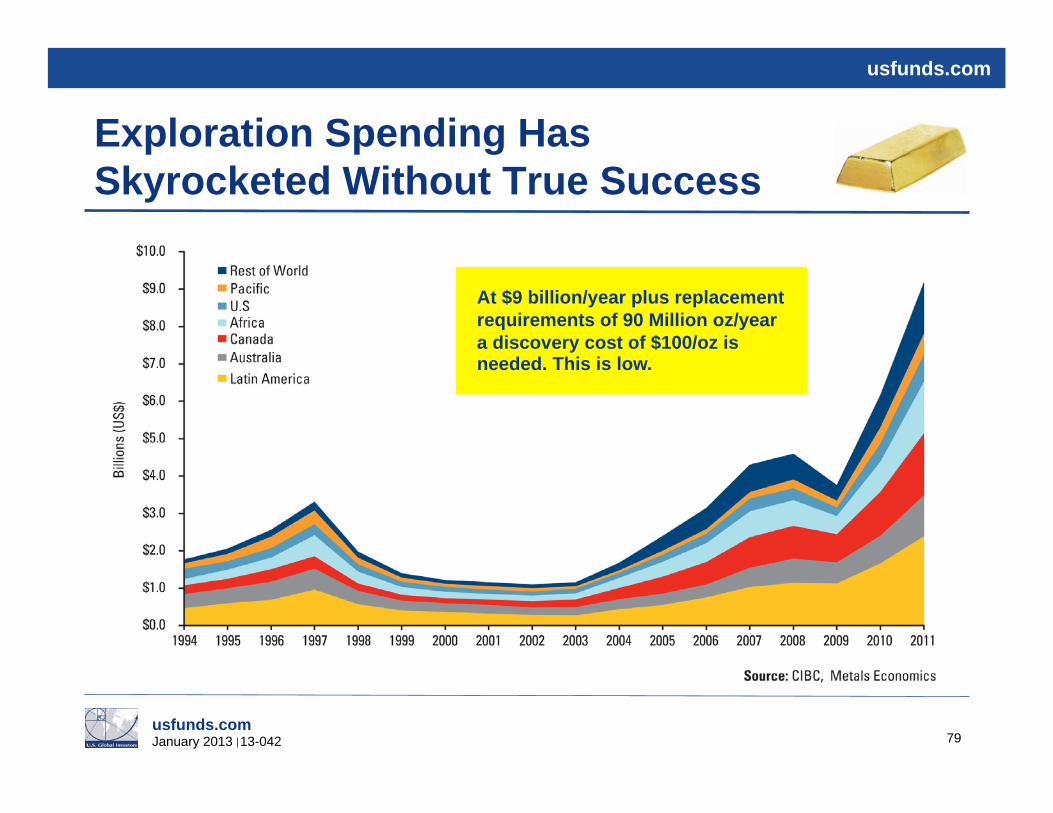
Exploration Spending Has Skyrocketed Without True Success
79
At $9 billion/year plus replacement requirements of 90 Million oz/year a discovery cost of $100/oz is needed. This is low.

usfunds.com January 2013 13-042
usfunds.com
Reasons for Active Management — Annual Rotation in Leadership
80
usfunds.com January 2013 13-042
usfunds.com
81
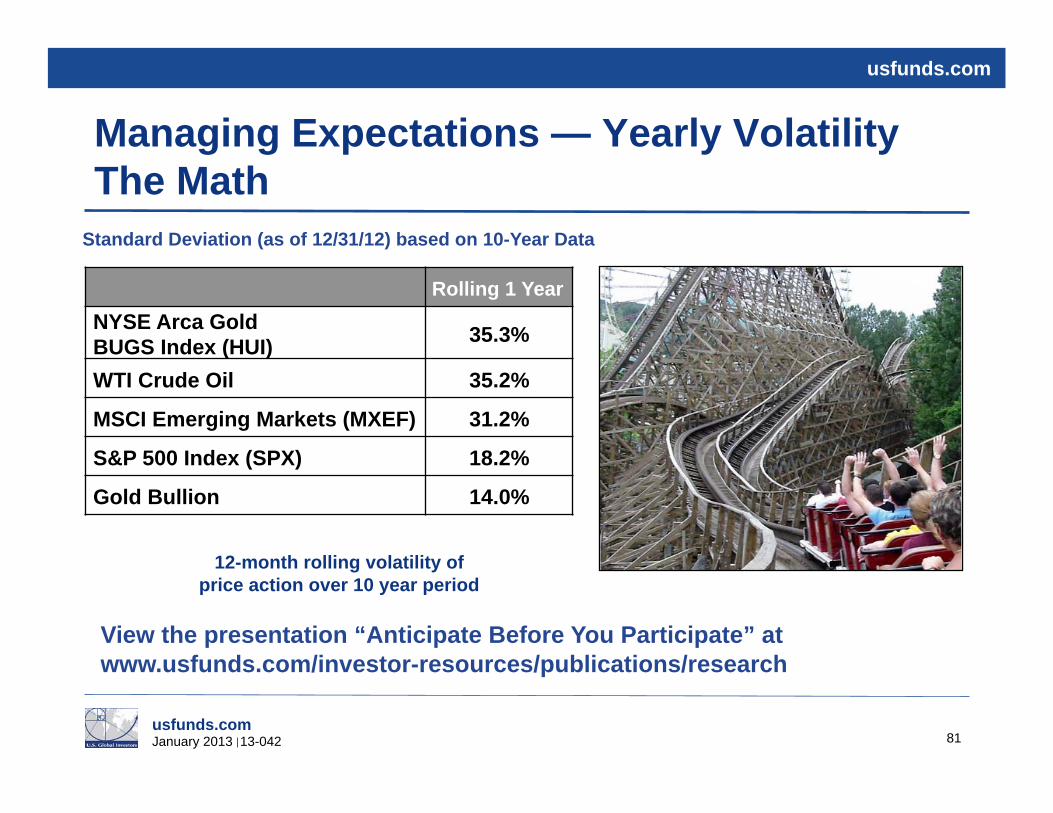
Managing Expectations — Yearly Volatility The Math
View the presentation “Anticipate Before You Participate” at www.usfunds.com/investor-resources/publications/research
Rolling 1 Year NYSE Arca Gold BUGS Index (HUI) 35.3%
WTI Crude Oil 35.2%
MSCI Emerging Markets (MXEF) 31.2%
S&P 500 Index (SPX) 18.2%
Gold Bullion 14.0%
12-month rolling volatility of price action over 10 year period
Standard Deviation (as of 12/31/12) based on 10-Year Data
usfunds.com January 2013 13-042
usfunds.com
82
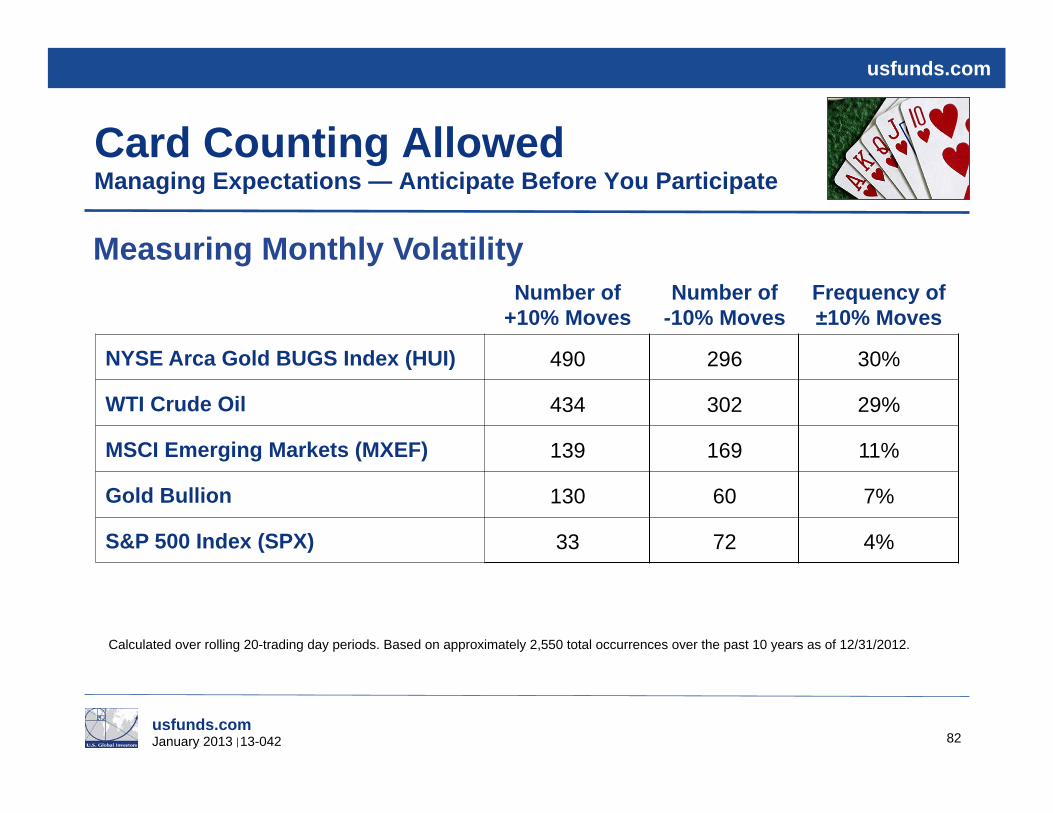
Card Counting Allowed Managing Expectations — Anticipate Before You Participate
Measuring Monthly Volatility Number of
+10% Moves Number of
-10% Moves Frequency of ±10% Moves
NYSE Arca Gold BUGS Index (HUI) 490 296 30%
WTI Crude Oil 434 302 29%
MSCI Emerging Markets (MXEF) 139 169 11%
Gold Bullion 130 60 7%
S&P 500 Index (SPX) 33 72 4%
Calculated over rolling 20-trading day periods. Based on approximately 2,550 total occurrences over the past 10 years as of 12/31/2012.
usfunds.com January 2013 13-042
usfunds.com
83
Trying to Stop a Bull Market Has Risks
usfunds.com January 2013 13-042
usfunds.com
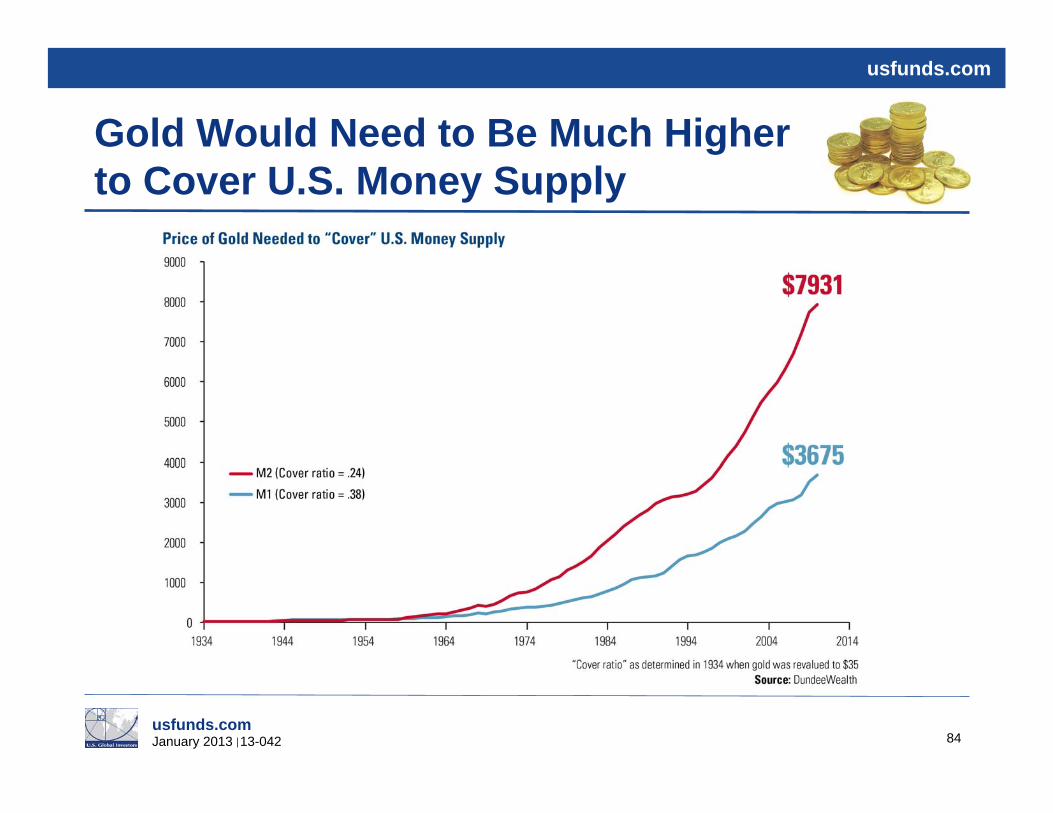
Gold Would Need to Be Much Higher to Cover U.S. Money Supply
84

usfunds.com January 2013 13-042
usfunds.com
Fear Trade: Aligning Gold Price to Bretton Woods II — $46,000/oz?
85
usfunds.com January 2013 13-042
usfunds.com
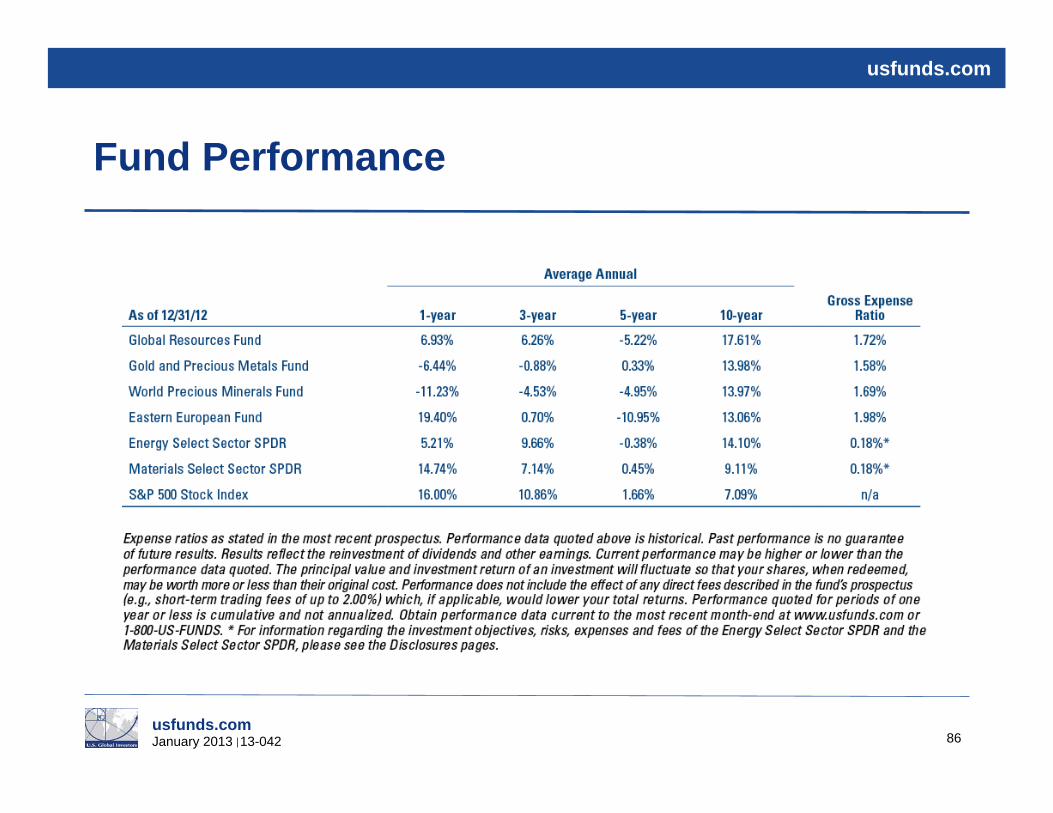
Fund Performance
86
usfunds.com January 2013 13-042
usfunds.com
Disclosures
87
Please consider carefully a fund’s investment objectives, risks, charges and expenses. For this and other important information, obtain a fund prospectus by visiting www.usfunds.com or by calling 1-800-US-FUNDS (1-800-873-8637). Read it carefully before investing. Distributed by U.S. Global Brokerage, Inc.
All opinions expressed and data provided are subject to change without notice. Some of these opinions may not be appropriate to every investor.
Foreign and emerging market investing involves special risks such as currency fluctuation and less public disclosure, as well as economic and political risk. Because the Global Resources Fund concentrates its investments in a specific industry, the fund may be subject to greater risks and fluctuations than a portfolio representing a broader range of industries. The Eastern European Fund invests more than 25% of its investments in companies principally engaged in the oil & gas or banking industries. The risk of concentrating investments in this group of industries will make the fund more susceptible to risk in these industries than funds which do not concentrate their investments in an industry and may make the fund’s performance more volatile. By investing in a specific geographic region, a regional fund’s returns and share price may be more volatile than those of a less concentrated portfolio.
Gold, precious metals, and precious minerals funds may be susceptible to adverse economic, political or regulatory developments due to concentrating in a single theme. The prices of gold, precious metals, and precious minerals are subject to substantial price fluctuations over short periods of time and may be affected by unpredicted international monetary and political policies. We suggest investing no more than 5% to 10% of your portfolio in these sectors.
Although Lipper makes reasonable efforts to ensure the accuracy and reliability of the data contained herein, the accuracy is not guaranteed by Lipper. Users acknowledge that they have not relied upon any warranty, condition, guarantee, or representation made by Lipper. Any use of the data for analyzing, managing, or trading financial instruments is at the user's own risk. This is not an offer to buy or sell securities.

usfunds.com January 2013 13-042
usfunds.com
Disclosures
88
Morningstar Ratings are based on risk-adjusted return. The Morningstar Rating for a fund is derived from a weighted-average of the performance figures associated with its three-, five- and ten-year (if applicable) Morningstar Rating metrics. Past performance does not guarantee future results. For each fund with at least a three-year history, Morningstar calculates a Morningstar Rating™ based on a Morningstar Risk-Adjusted Return measure that accounts for variation in a fund’s monthly performance (including the effects of sales charges, loads, and redemption fees), placing more emphasis on downward variations and rewarding consistent performance. The top 10% of funds in each category receive 5 stars, the next 22.5% receive 4 stars, the next 35% receive 3 stars, the next 22.5% receive 2 stars and the bottom 10% receive 1 star. (Each share class is counted as a fraction of one fund within this scale and rated separately, which may cause slight variations in the distribution percentages.)
The S&P 500 Stock Index is a widely recognized capitalization-weighted index of 500 common stock prices in U.S. companies. The Philadelphia Stock Exchange Gold and Silver Index (XAU) is a capitalization-weighted index that includes the leading companies involved in the mining of gold and silver. The MSCI China Free Index is a capitalization weighted index that monitors the performance of stocks from the country of China. The Purchasing Manager’s Index is an indicator of the economic health of the manufacturing sector. The PMI index is based on five major indicators: new orders, inventory levels, production, supplier deliveries and the employment environment. The NAHB Housing Market Index is derived from a monthly survey, and gauges builder perceptions of current single-family home sales and sales expectations for the next six months, as well as rating traffic of prospective buyers. Scores from each component are then used to calculate a seasonally adjusted index where any number over 50 indicates that more builders view conditions as good than poor. The Market Vectors Junior Gold Miners Index is a market-capitalization-weighted index. It covers the largest and most liquid companies that derive at least 50 percent from gold or silver mining or have properties to do so. The NYSE Arca Gold Miners Index is a modified market capitalization weighted index comprised of publicly traded companies involved primarily in the mining for gold and silver. The index benchmark value was 500.0 at the close of trading on December 20, 2002. The MSCI Emerging Markets Index is a free float-adjusted market capitalization index that is designed to measure equity market performance in the global emerging markets.
Alpha is a measure of performance on a risk-adjusted basis. Alpha takes the volatility (price risk) of a mutual fund and compares its risk-adjusted performance to a benchmark index. The excess return of the fund relative to the return of the benchmark index is a fund's alpha. Standard deviation is a measure of the dispersion of a set of data from its mean. The more spread apart the data, the higher the deviation. Standard deviation is also known as historical volatility. M1 Money Supply includes funds that are readily accessible for spending. M2 Money Supply is a broad measure of money supply that includes M1 in addition to all time-related deposits, savings deposits, and non-institutional money-market funds.

usfunds.com January 2013 13-042
usfunds.com
Disclosures
89
Holdings in the Global Resources Fund, World Precious Minerals Fund, Gold and Precious Metals Fund and Eastern European Fund as a percentage of net assets as of 12/31/2012: Berkshire Hathaway 0.00%; Facebook 0.00%; Gold Fields (World Precious Minerals Fund 0.05%, Gold and Precious Metals Fund 0.04%); Groupon 0.00%; iShares Core Total US Bond 0.00%; SPDR Gold Shares (World Precious Minerals Fund 1.64%, Gold and Precious Metals Fund 2.70%).
usfunds.com January 2013 13-042
usfunds.com
Disclosures
Investment Objective: The Global Resources Fund is an actively managed fund that takes a diversified approach to the natural resources sector by investing in energy and basic materials. The fund invests in companies involved in the exploration, production and processing of petroleum, natural gas, coal, alternative energies, chemicals, mining, iron and steel, and paper and forest products, and can invest in any part of the world.
The Select Sector SPDR ETFs are passively managed funds that seek to replicate as closely as possible, before fees and expenses, the performance of the S&P 500 Index. Each Select Sector SPDR is an “index fund” that invests in a particular sector or group of industries represented by a specified Select Sector Index. The companies included in each Select Sector Index are selected on the basis of general industry classification from a universe of companies defined by the S&P 500 Index.
Liquidity: The Global Resources Fund can be purchased or sold at a net asset value (NAV) determined at the end of each trading day. The Select Sector SPDR ETFs can be purchased or sold intraday. These purchases and redemptions may generate brokerage commissions and other charges not reflected in the ETF’s published expense ratio.
Safety/Fluctuations of principal/return: Loss of money is a risk of investing in the Global Resources Fund and the Select Sector SPDR ETFs. Shares of the three securities are subject to sudden fluctuations in value. The Energy Select Sector and Materials Select Sector SPDR Funds may also be subject to bid-ask premiums or discounts to net asset value (NAV) that could adversely affect a shareholder’s actual returns.
Tax features: The Global Resources Fund may make distributions that may be taxed as ordinary income or capital gains. Under current federal law, long-term capital gains for individual investors in the fund are taxed at a maximum rate of 15%. For the Energy Select Sector and Materials Select Sector SPDR Funds, long-term capital gain distributions will result from gains on the sale or exchange of capital assets held by a Fund for more than one year. Any long-term capital gains distributions you receive from a Fund are taxable as long-term capital gain regardless of how long you have owned your shares. Long-term capital gains are currently taxed at a maximum of 15%. Information provided here is neither tax nor legal advice and is general in nature. Federal and state laws and regulations are subject to change.
90


