More than Meets the Eye: Consumers’ Willingness to Pay for Marine Stewardship Council’s Certified Seafood Kar Ho Lim Assistant Professor [email protected]Department of Agricultural and Environmental Sciences Tennessee State University 204c Farrell-Westbrook Complex, Nashville, TN 37209, Phone (615) 963-7977 Carola Grebitus Assistant Professor [email protected]Morrison School of Agribusiness, W.P. Carey School of Business, Arizona State University, 7231 E. Sonoran Arroyo Mall, Mesa, AZ 85212, Phone (480) 727-4098. Wuyang Hu Professor [email protected]Department of Agricultural Economics, University of Kentucky 313 C.E. Barnhart Building Lexington, KY 40546-0276 Rodolfo M. Nayga, Jr. Professor and Tyson Chair in Food Policy Economics [email protected]Department of Agricultural Economics & Agribusiness, University of Arkansas 217 Agriculture Building Fayetteville, AR 72701 Phone: (479)575-2299 Selected Paper prepared for presentation at the 2015 Agricultural & Applied Economics Association and Western Agriculture Economics Association Annual Meeting, San Francisco, CA, July 26-28. Copyright 2015 by Kar Ho Lim, Carola Grebitus, Wuyang Hu, and Rudy Nayga. All rights reserved. Readers may make verbatim copies of this document for non-commercial purposes by any means, provided that this copyright notice appears on all such copies.
Transcript
More than Meets the Eye: Consumers’ Willingness to Pay for Marine Stewardship
Fish stock depletion is one of the most challenging ecological crises in the world. The FAO 19
announced that over 90% of fish stock is fully exploited or overexploited (FAO, 2014). This dire 20
situation highlights the need for a systematic and broad-based approach that will ensure the 21
sustainability of the fish stock. One of possible approaches is the use of “Ecolabels”. In essence, 22
the usefulness of ecolabels is contingent on its ability to create market differentiation. Ecolabels 23
can kill two birds with one stone. Unlike prices and other search attributes, environmental 24
attributes related to a product’s production are often impossible for the individual consumer to 25
assess (Caswell and Mojduszka, 1996, Wessells, et al., 1999). Ecolabels could address the 26
information gap that is inherent in “sustainability” related attributes (i.e., as a credence attribute), 27
2
making it possible for consumers to differentiate between sustainable and conventional products. 28
With the provision of ecolabels, consumers could then make informed purchase decisions 29
depending on their preferences and willingness to pay (WTP) for sustainable products. Moreover, 30
if consumers are willing to pay a higher price for an eco-labeled product, then this could serve as 31
a signal to producers and could then motivate them to participate in sustainable production 32
practices with the potential of price premium, greater market share, or in some cases, the eligibility 33
to make it to retailers’ shelf. 34
The number of consumers demanding guilt-free seafood are on the rise, so are the number of 35
sustainable fisheries certifier (Christian et al. 2013). The most established certifier in the fishery 36
industry is the Marine Stewardship Council (MSC). Founded by WWF and Unilever in 1997, the 37
MSC sets and maintains standards for sustainable fishing and seafood traceability. This NGO has 38
rapidly become the biggest seafood certifier, with 255 fisheries now MSC certified accounting for 39
11 million metric tons or 12% of the annual global harvest of seafood (Marine Stewardship Council, 40
2015). Diamond (2005) contends that the MSC is a good example of collaboration between 41
environmental effort and business interest in promoting sustainability. 42
Nevertheless, Stokstad (2011) highlighted that MSC has not yet won over the skeptics of the 43
certifiers’ positive impact on sustainability. While MSC has assumed the leadership in the fishery 44
certification business, whether consumers recognize and are willing to pay for its label remains an 45
open debate. For example, concerns were raised that MSC’s standard is not sufficiently stringent, 46
pointing to incidences where MSC has allowed certification of declining fish stocks and fish stocks 47
that require more scientific studies to assess their sustainability status. In addition, MSC has a low 48
rate of certification amongst fisheries in small-scale fisheries, especially those in developing 49
countries where environmental enforcement is typically weaker than in developed countries 50
(Jacquet, et al., 2010). 51
Given the debate about the MSC label, it would then be important to know if consumers are 52
convinced about the effectiveness of MSC in achieving its goal in sustainability. Despite the belief 53
that consumers prefer sustainably-produced food products, recent evidence suggests that ecolabels 54
do not always induce favorable consumer preference (Delmas and Lessem, 2014). Among others, 55
trust is a significant factor in consumer preference of sustainable products and of fundamental 56
3
importance (Wessells, et al., 1999). Consumers have to trust MSC’s visions and its ability to 57
achieve those visions in order to be willing to pay for the certificate. In addition to trust towards 58
the certifying agency, existing literature shows that consumers’ attitudes and certain demographic 59
factors can influence the preference for sustainably produced seafood (Brécard, et al., 2009, 60
Wessells, et al., 1999). For example, Jaffry, et al. (2004) find that consumers in the UK prefer 61
sustainability certified products. Roheim, et al. (2011) detected a price premium for the MSC label 62
using a hedonic price model in the Metropolitan London market. Johnston, et al. (2001) highlighted 63
that the preference is heterogeneous across geopolitical boundaries. 64
Evidence of strong consumer acceptance may hold the key to increase producers’ participation in 65
the sustainable practice, especially given that the cost of obtaining MSC certification range from 66
$10,000 for small scale fisheries to $500,000 for larger and more complex fisheries (Roheim, 2003, 67
Washington, 2008). Washington (2008) further points out that the lack of in-depth analysis 68
showing a higher willingness to pay for ecolabels may have detrimental effects to participation of 69
fisheries in developing countries. 70
There is scant literature however on US consumers’ WTP for sustainably produced seafood. In 71
addition, most existing literature merely provides a rather static average WTP, omitting the 72
potential for heterogeneity in the valuation estimates and hence, also the assessment of the fraction 73
of the market willing to pay for sustainably produced seafood. Moreover, the literature is relatively 74
scarce on the joint effects that MSC certification might have with other categories of attributes 75
when they are presented together. Louviere, et al. (2000) exhort that the interaction effects could 76
account for a significant portion of decision makers’ choice. For instance, MSC certificates may 77
mitigate the negative connotation associated with imported seafood from developing countries due 78
to poorer environmental standard and practice that are often linked to these countries. MSC 79
certification could also have substitution effect that could crowd out WTP for other attributes (Gao 80
and Schroeder, 2009). 81
1. To fill this void in the literature, in our study, we will estimate consumers’ WTP for 82
sustainable seafood and also address taste heterogeneity and the relationships between 83
ecolabelling, country of origin labeling and health claims. The main goals of this study are: 84
4
To determine willingness to pay for sustainably produced seafood amongst American 85
consumers. 86
2. To quantify the share of American consumers willing to pay a premium for sustainably 87
produced seafood. 88
3. To evaluate the presence of complementary or substitution effects that MSC certification 89
might have with other seafood attributes. 90
Our results using an online consumer choice experiment study suggest that US consumers 91
generally exhibit a heterogeneous willingness to pay for sustainable seafood. In addition, we 92
observe that sustainability could complement Country of Origin labeling on imported products and 93
some health claims. 94
Methodology 95
Design of the Study 96
The data of this study is collected via an online survey. Survey development involved literature 97
review, consultation with experts, and pretesting. In the online choice experiments, 1039 canned 98
tuna consumers from the US participated. The sample was stratified based on education, gender, 99
and age of the American population so that the preferences determined are representative of 100
American canned tuna consumers. 101
While the main goal of this study is to assess consumer willingness to pay for MSC certified 102
seafood, we included other attributes to avoid single cue bias (Bilkey and Nes, 1982). As noted, 103
the MSC certification was used to represent sustainable practice as it is the largest seafood labeling 104
program of its kind. Second, the country of origin attribute was included (unspecified, USA, 105
Ecuador, Vietnam). Third, a label was used to indicate if the can lining material is free of 106
Bisphenol-A, a controversial plastic packaging material that is linked to obesity, endocrine 107
disruption, and other health concerns (Bhandari, et al., 2013, Munguia-Lopez, et al., 2005, 108
Takeuchi, et al., 2004, Yoshida, et al., 2001). Fourth, a heart-healthy label, which is used to 109
highlight food that meets certain nutritional requirements that promote heart health was included 110
(present or absent). Lastly, the price was included based on market prices of canned tuna in the 111
U.S. 112
5
The product attributes and their levels were used in a choice experiment to measure consumers’ 113
willingness to pay. To design the choice experiment, we used Bayesian D-Optimality Criteria to 114
construct the choice sets. This avoids efficiency-reducing dominant choice sets (Crabbe and 115
Vandebroek, 2012). The design had a D-Efficiency score of 88.40%. The choice experiment 116
consisted of a total of 24 choice sets. To minimize potential respondent fatigue, the choice sets 117
were distributed into four blocks, and each respondent was presented with six choice sets (Savage 118
and Waldman, 2008). Each choice set featured two five ounces canned tuna options incorporating 119
various combinations of the attributes. Each choice set also includes an opt-out option, which 120
allows the respondents the option of not buying if the two given canned tuna choices do not 121
represent an appealing option for purchase (Hensher, et al., 2005, Louviere, et al., 2000). 122
Econometric Model 123
The decision process for choice of canned tuna can be represented by a random utility model. The 124
utility of Individual decision maker i, associated with alternative j in choice set t is given as: 125
The parameters to be estimated are 𝛃 , γ, and 𝛅. The vector xjt depicts non-price main-level 126
attributes presented in the alternative j of choice set t. Following the specification of the mixed 127
logit model, the parameter vector 𝜷 accounts for the part worth of utility associated with the 128
attributes, and is assumed to follow a given distribution 𝑓(𝜷); thus, the model also produces 129
estimates for standard deviations of the random parameters, λ. The price attribute, p, is assumed 130
to be fix to avoid distribution of the price parameter around zero for a more realistic distribution 131
of willingness to pay. The mixed logit model enables accounting for taste heterogeneity, which 132
could provide a more realistic representation of the distribution of taste as preference of attributes 133
in food is often found to be heterogeneous. Vector z represents the interaction terms of MSC and 134
none price attributes. The stochastic error term 𝜀𝑖𝑗𝑡 is assumed to follow type I extreme value 135
distribution (Train, 2003). 136
𝑈𝑖𝑗𝑡 = 𝛃′𝑖𝐱𝑖𝑗𝑡 + γpijt + 𝛅′𝐳ijt + 𝜀𝑖𝑗𝑡 (1)
6
Results 137
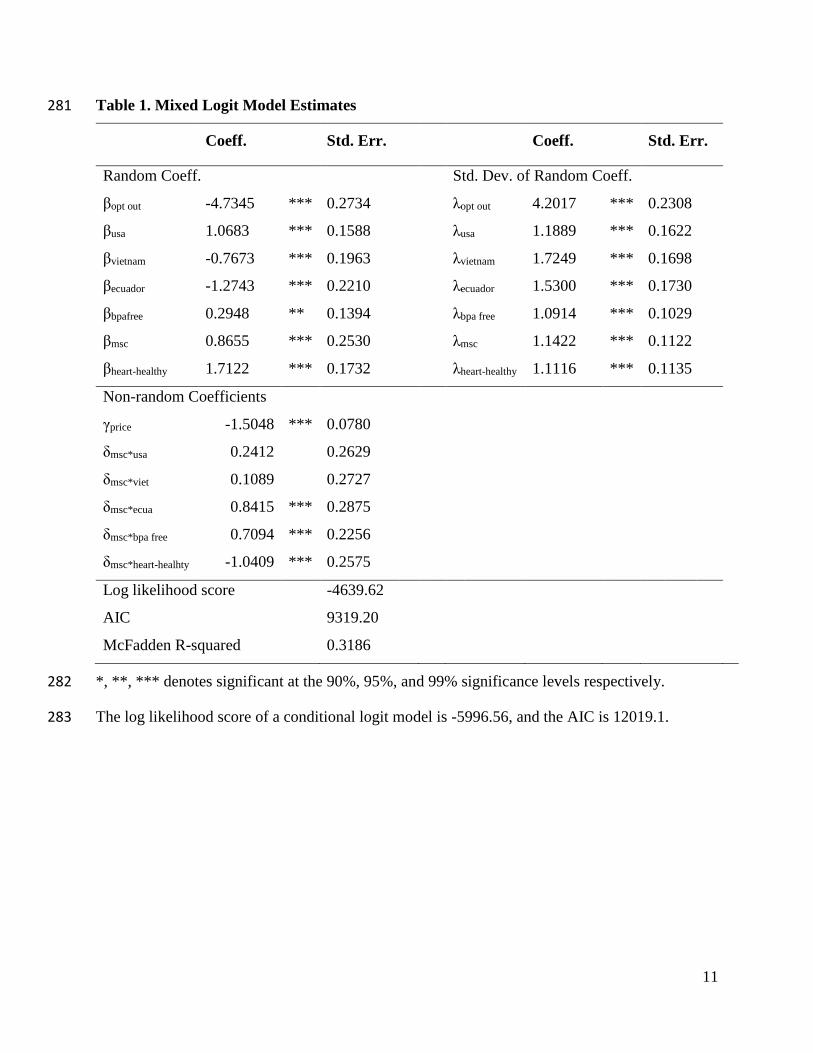
The final model records a McFadden Pseudo R-squared score of 0.3186 (see table 1). The AIC 138
criterion suggests that the mixed logit specification significantly improves upon a counterpart 139
model estimated with a conditional logit specification where all parameters in equation (1) were 140
assumed as non-random. All of the estimated standard deviation of the random parameters are 141
significant and lend credence to the presence of taste heterogeneity among the examined attributes. 142
The statistically significant and negative price parameter conforms to the standard theory, which 143
suggests that higher price reduces the likelihood of purchase. 144
Preference and Willingness to Pay for MSC Certification 145
Of main interest in our study are the parameters associated with MSC. The significant and positive 146
main level parameter suggests that consumers prefer canned tuna furnished with the MSC label. 147
The standard deviation associated with MSC points to the existence of taste heterogeneity in 148
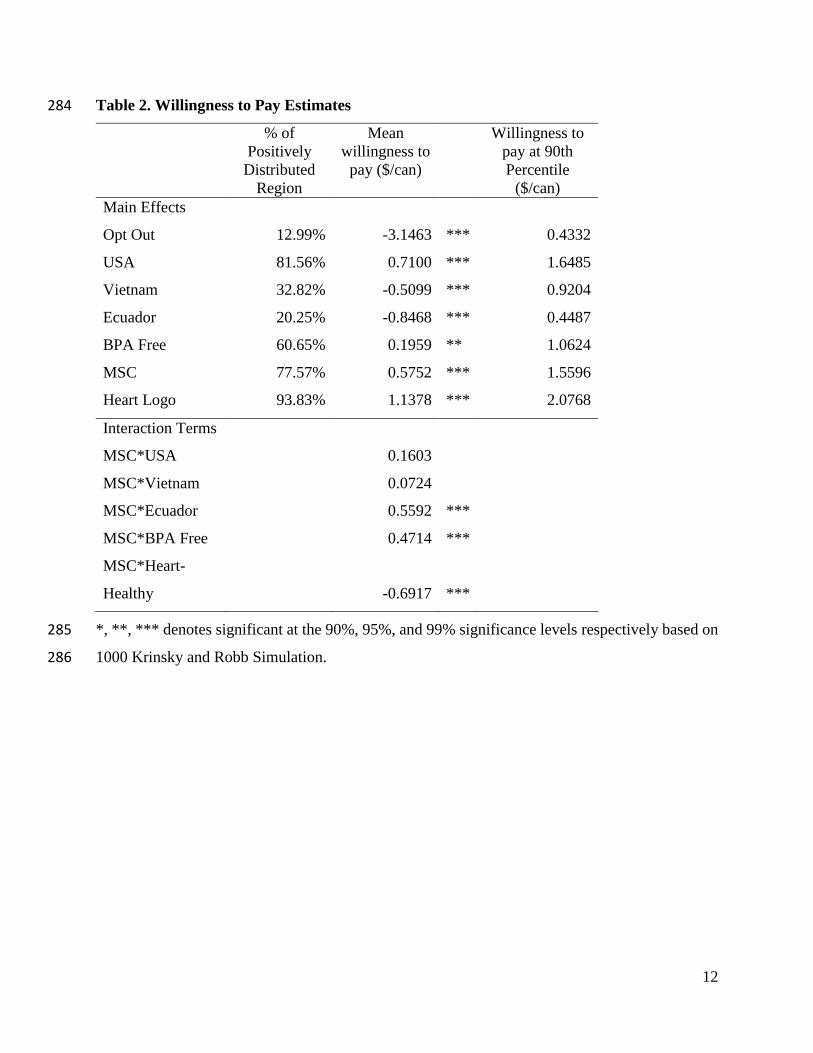
regards to MSC-labelled seafood. Our estimates suggest that about three quarter of the respondents 149
show preference for MSC-labelled canned tuna (table 1), which is in line with Johnston, et al. 150
(2001) who observed that 80% of Americans are willing to pay for sustainably-produced salmon. 151
Assuming that the price per can of five ounces of tuna is $2.00, our results suggest that consumers 152
are willing to pay a sizeable amount for sustainably produced canned tuna. The willingness to pay 153
for MSC-labelled tuna is estimated to have a mean value of $0.58 per can, and $1.55 per can at the 154
90th percentile (table 2). The willingness to pay estimates agree generally with findings from 155
previous studies. While it appears to be higher than the 14.2% mean premium reported in Roheim, 156
et al. (2011), the discrepancy could stem from difference of measurement between market 157
premium and willingness to pay. 158
The finding of the sizeable willingness to pay supports the notion that US consumers prefer MSC-159
labelled seafood products. This is important given that policy-makers and others have raised 160
doubts regarding the effectiveness of MSC as a tool to support the market condition for sustainable 161
seafood market (Roheim, et al., 2011). This finding suggest that US consumers intend to support 162
sustainably produced seafood, and it may lend credence that regardless of how consumers may 163
7
associate the MSC label to the actual production, they express trust towards the products that bear 164
the MSC label. 165
The negative coefficients associated with imported products, βvietnam and βecuador, suggest that US 166
consumers view imported canned tuna unfavorably even when comparing against similar products 167
that are not labeled with origin; conversely, consumers prefer domestic products (origin USA) over 168
an unlabeled product. These results are hardly surprising given that studies have repeatedly shown 169
that US consumers prefer US products over imports (Lim, et al., 2013, Tonsor, et al., 2009), and 170
favor labelled US products over unlabeled products (Loureiro and Umberger, 2007). In relation to 171
the MSC certificate, the question arises as to whether the certificate improves the negative 172
connotation that Americans displayed towards imported seafood. 173
Judging from the term, γmsc*Ecuador, the test rejects the null hypothesis that the interaction effects 174
between MSC and country of origins does not exist. MSC might show positive interaction effects 175
for imported product. To illustrate, the average consumer has a negative willingness to pay of 176
$ -.85 for a can of Ecuadorian tuna compared to a similar can of tuna not labeled for Country of 177
Origin. Nevertheless, when Ecuadorian canned tuna is offered with the MSC label, the MSC label 178
increases willingness to pay by on average $1.14 per can from the main ($0.56) and interaction 179
effect ($0.58) of having the MSC certification. 180
The interaction effects of sustainable production and health claims are mixed. From the main 181
effects, the estimates suggest that consumers prefer BPA-free and Heart-healthy claims. When 182
BPA-free is offered in addition to MSC certification, we observe a complementary effect. The 183
mean willingness to pay increases by $0.47 per can when BPA-free is offered with MSC 184
certification. This complementary effect suggests that MSC labelling could strengthen the positive 185
image of certain claims. 186
Nevertheless, the interaction terms between the Heart-healthy claim and MSC certification is 187
negative; this suggests that MSC is a gross substitute to the Heart-healthy claim. The data provide 188
no direct explanation as to why the relationship between the two attributes exists. The two 189
attributes however could be net substitutes, i.e., consumers could perceive the two attributes 190
serving overlapping purposes, thus offering one attribute over the other does not lead to simple 191
8
addition of their associated values. We could also postulate that while the two attributes are not 192
necessarily net substitute, it is possible that the income effect exerts downward pressure on utility. 193
In other words, as the number of attributes offered increases, consumers accommodate the budget 194
constraint by cutting back expenditure especially on those attributes that have large main effects, 195
such as the Heart-healthy claims; thus the two attributes could be net complements, but gross 196
substitutes (Nicholson and Snyder, 2011). 197
Conclusion 198
The MSC certificate provides considerable promise as a market-based tool for sustainable fisheries. 199
To succeed as a long-term solution, however, it must receive a critical mass of participation from 200
producers (Roheim, et al., 2011, Wessells, et al., 1999). For this to happen, consumers’ willingness 201
to pay is a necessary condition for market premium or wider market access. The existing literature 202
provides limited information about consumers’ willingness to pay for sustainable fishery products. 203
Our results suggest that most US consumers are willing to pay for MSC-certified seafood, and that 204
the amount they are willing to pay is substantial, especially in the higher percentile. Additionally, 205
we found that MSC certification might be especially advantageous for exporting producers from 206
developing countries as our model demonstrated a complementary effect, which will help alleviate 207
the negative image commonly associated with imported products. 208
This article shows consumers’ taste variation to MSC-labelled products, and is possibly the first 209
to point out complementary effects that MSC might have with other attributes. Nevertheless, the 210
scope of this research is limited to the US population and canned products. The results are unlikely 211
to be fully generalizable to other markets and products. Even though the marginal willingness to 212
pay estimates are believed to be robust (Lusk and Schroeder, 2004), as with all stated preference 213
studies, the results are contingent upon the accuracy of the data obtained from stated preference 214
methods involving hypothetical choice scenarios. Nevertheless, our analysis serves as a reasonable 215
starting point for further discussion on the effectiveness of MSC in championing sustainable 216
fisheries. 217
Reference 218
Bhandari, R., J. Xiao, and A. Shankar. 2013. "Urinary bisphenol A and obesity in US children." American 219 journal of epidemiology 177:1263-1270. 220
9
Bilkey, W.J., and E. Nes. 1982. "Country-of-origin Effects on Product Evaluations." Journal of 221 International Business Studies:89-99. 222
Brécard, D., et al. 2009. "Determinants of demand for green products: An application to eco-label 223 demand for fish in Europe." Ecological Economics 69:115-125. 224
Caswell, J.A., and E.M. Mojduszka. 1996. "Using Informational Labeling to Influence the Market for 225 Quality in Food Products." American Journal of Agricultural Economics 78:1248-1253. 226
Crabbe, M., and M. Vandebroek. 2012. "Using Appropriate Prior Information to Eliminate Choice Sets 227 with a Dominant Alternative from D-efficient Designs." Journal of Choice Modelling 5:22-45. 228
Delmas, M.A., and N. Lessem. 2014. "Eco-Premium or Eco-Penalty? Eco-labels and quality in the organic 229 wine market." Business & Society, Forthcoming. 230
Diamond, J. 2005. Collapse: How societies choose to fail or succeed: Penguin. 231
FAO. 2014. "The State of World Fisheries and Aquaculture." 232
Gao, Z., and T.C. Schroeder. 2009. "Effects of Label Information on Consumer Willingness-to-Pay for 233 Food Attributes." American Journal of Agricultural Economics 91:795-809. 234
Hensher, D.A., J.M. Rose, and W.H. Greene. 2005. Applied choice analysis: a primer. New York: 235 Cambridge University Press. 236
Jacquet, J., et al. 2010. "Conserving wild fish in a sea of market-based efforts." Oryx 44:45-56. 237
Jaffry, S., et al. 2004. "Consumer choices for quality and sustainability labelled seafood products in the 238 UK." Food Policy 29:215-228. 239
Johnston, R.J., et al. 2001. "Measuring consumer preferences for ecolabeled seafood: an international 240 comparison." Journal of Agricultural and Resource Economics:20-39. 241
Lim, K.H., et al. 2013. "U.S. Consumers’ Preference and Willingness to Pay for Country-of-Origin-Labeled 242 Beef Steak and Food Safety Enhancements." Canadian Journal of Agricultural Economics/Revue 243 canadienne d'agroeconomie 61:93-118. 244
Loureiro, M.L., and W.J. Umberger. 2007. "A choice experiment model for beef: What US consumer 245 responses tell us about relative preferences for food safety, country-of-origin labeling and 246 traceability." Food Policy 32:496-514. 247
Louviere, J.J., D.A. Hensher, and J.D. Swait. 2000. Stated choice methods: analysis and applications. New 248 York: Cambridge University Press. 249
Lusk, J., and T.C. Schroeder. 2004. "Are Choice Experiments Incentive Compatible? A Test with Quality 250 Differentiated Beef Steaks." American Journal of Agricultural Economics 86:467-482. 251
Marine Stewardship Council (2015) "MSC in numbers." In. 252
Munguia-Lopez, E., et al. 2005. "Migration of bisphenol A (BPA) from can coatings into a fatty-food 253 simulant and tuna fish." Food additives and contaminants 22:892-898. 254
Nicholson, W., and C. Snyder. 2011. Microeconomic theory: basic principles and extensions: Cengage 255 Learning. 256
Roheim, C.A. 2003. "Early indications of market impacts from the marine stewardship council's 257 ecolabeling of seafood." 258
10
Roheim, C.A., F. Asche, and J.I. Santos. 2011. "The elusive price premium for ecolabelled products: 259 evidence from seafood in the UK market." Journal of Agricultural Economics 62:655-668. 260
Savage, S.J., and D.M. Waldman. 2008. "Learning and fatigue during choice experiments: a comparison 261 of online and mail survey modes." Journal of Applied Econometrics 23:351-371. 262
Stokstad, E. 2011. "Seafood eco-label grapples with challenge of proving its impact." Science 334:746-263 746. 264
Takeuchi, T., et al. 2004. "Positive relationship between androgen and the endocrine disruptor, 265 bisphenol A, in normal women and women with ovarian dysfunction." Endocrine journal 51:165-266 169. 267
Tonsor, G., et al. 2009. "Consumer Valuation of Beef Steak Food Safety and Quality Assurances in 268 Canada, Japan, Mexico, and the United States." Canadian Journal of Agricultural Economics 269 57:395-416. 270
Train, K. 2003. Discrete choice methods with simulation. New York: Cambridge Univ Press. 271
Washington, S. 2008. "Ecolabels and marine capture fisheries: current practice and emerging issues." 272 GLOBEFISH Research Programme (FAO). 273
Wessells, C.R., R.J. Johnston, and H. Donath. 1999. "Assessing consumer preferences for ecolabeled 274 seafood: the influence of species, certifier, and household attributes." American Journal of 275 Agricultural Economics:1084-1089. 276
Yoshida, T., et al. 2001. "Determination of bisphenol A in canned vegetables and fruit by high 277 performance liquid chromatography." Food Additives & Contaminants 18:69-75. 278
279
280
11
Table 1. Mixed Logit Model Estimates 281
Coeff. Std. Err.
Coeff. Std. Err.
Random Coeff. Std. Dev. of Random Coeff.
βopt out -4.7345 *** 0.2734 λopt out 4.2017 *** 0.2308