More Than Words: Is Startup’s Propensity to Patent and Publish Sensitive to Investor Characteristics? 1 Elisa Alvarez-Garrido Georgia State University [email protected]Gary Dushnitsky London Business School [email protected]This version: April 16th, 2012. A short version will be published in the Best Paper Proceedings, AoM 2012. 1 Funding from the Mack Center for Technological Innovation at the Wharton School is greatly appreciated. Thanks to Brent Godfarb, Jeff Furman, Isin Guler, and Mike Roach for their thoughtful comments and suggestions.
Transcript
More Than Words:
Is Startup’s Propensity to Patent and Publish Sensitive to Investor Characteristics?1
A short version will be published in the Best Paper Proceedings, AoM 2012.
1 Funding from the Mack Center for Technological Innovation at the Wharton School is greatly appreciated. Thanks to Brent Godfarb, Jeff Furman, Isin Guler, and Mike Roach for their thoughtful comments and suggestions.
More Than Words
2
ABSTRACT
Over the last decade, corporations became an increasingly important source of financing for innovative
startups across a wide array of industries. This paper investigates the consequences of Corporate Venture
Capital (CVC) investments: Do strategically-oriented CVCs affect startups' research productivity? Do
CVC-backed startups overemphasize basic over applied research? We study these questions using a
longitudinal sample of 574 U.S. biotechnology ventures founded from 1990 to 2003. We find that CVCs
foster publications more than VCs, especially when the CVC parent firm shares industry niche with the
venture. And while CVCs also foster the venture’s patents more than VCs, the effect is stronger when the
CVC parent firm is in a different industry niche. In summary, our findings highlight the innovation
implications of different investor types.
More Than Words
3
“Corporate venture funding, the investment of corporate funds into external endeavors, is expected to become a much more crucial source of funding to the industry, with 30 percent of CEOs surveyed saying they will tap corporate venture capital as a finance source in the next 12 months, versus only 10 percent who did so in the past 12 months.” PwC 2012 CEO survey of California Biomedical Industry (in collaboration with CHI and BayBio).
INTRODUCTION
Innovation is one of the cornerstones of today’s economy, and as such policy makers and
researchers seek to provide incentives to fund it, and to better understand the consequences of that
innovation on firms and the economy. Because entrepreneurial ventures are an important source of
innovative ideas and products (e.g., 1988), the question of how to fund innovative ventures is at the center
of the larger issue (Hall, 2002).
It has been argued that venture capital (VC) stimulates the innovation of the entrepreneurial
ventures they back (Kortum & Lerner, 2000; Samila & Sorenson, 2010). And yet VCs are only one
source of funding. Increasingly, corporate investors, also known as corporate venture capitalists (CVC),
are becoming an important alternative (Dushnitsky, 2011), which like VCs, pursue financial but also
strategic objectives (Dushnitsky & Shaver, 2009; Gompers & Lerner, 1998). This study seeks to
understand the implications of CVC investment on entrepreneurial innovation: Do strategically-oriented
CVCs affect startups' research productivity? Do CVC-backed startups overemphasize basic or applied
research?
The purpose of this paper is to study the impact on entrepreneurial ventures’ innovativeness,
comparing CVC-backed ventures to those funded by VCs. To that end, we study the research output (both
basic and applied) of CVC-backed ventures and further explore whether such output is affected by the
competitive position of the CVC-venture pair (i.e., do they target the same industry niche?). Specifically,
we focus on the two main types of innovative outcomes: (1) patents, as a result of applied research, that
More Than Words
4
award monopoly commercialization rights, and (2) scientific publications, which are the result of basic
research that is far from a commercial application, and generate knowledge spillovers.
Corporate venture capital investment is on the rise. The reason is threefold. First, there is a
relative decline in VC investment. The financial crisis constrains VCs’ ability to raise capital from
pension funds, endowments and other traditional financiers. This, in turn, leads to lesser availability of
venture capital, and therefore increases the relative attractiveness of CVCs. Second, entrepreneurial
ventures recognize that established corporations offer not only financial capital but also access to valuable
complementary assets (e.g., corporate manufacturing facilitates, or distributions channels). There are
some industries, such as the pharmaceutical industry, where corporate complementary assets are highly
valued, and thus CVC-backing is particularly attractive. Third, more and more corporations understand
the value of having 'eyes and ears' in the world of innovative entrepreneurial ventures. Indeed, the number
of CVCs has more than doubled in the past decade (Dushnitsky, 2011).
Because CVCs are affiliated with a large corporation, they are driven by a balance of VC-like
financial objectives and corporate-oriented strategic goals. As a result, corporate venture capitals pose
unique opportunities and threats to the much smaller entrepreneurial venture. The advantages include the
aforementioned access to complementary assets: the corporation can be instrumental in speeding the time-
to-market and reducing the commercialization costs of an entrepreneurial invention, as well as substantial
endorsement effect and industry know-how (Stuart et al., 1999). The disadvantages have to do with the
fact that a large corporation is well-positioned to expropriate an entrepreneurial idea and commercialize it
as its own (Dushnitsky & Shaver, 2009; Katila et al., 2008).
In a nutshell, our analysis pivots on three elements. We explore whether (a) the research output of
entrepreneurial ventures (i.e., patents or publications) is sensitive to (b) investor identity (i.e., VC or
CVC), and (c) the relative market positioning of the venture-investor pair (i.e., whether or not the venture
operates in the same industry niche as the CVC). Our findings present evidence of a division of labor.
More Than Words
5
Specifically, CVC-backed ventures exhibit greater publications and patents compared to VC-backed ones.
Interestingly, the impact of same-industry-niche CVC investor diverges: it is associated with the highest
increase in a venture’s publications, yet the lowest impact on patents.
We investigate these issues by studying 574 biotechnology ventures founded between 1990 and
2003, of which 198 ventures are backed by a corporate venture capital and the remainder are VC-backed.
The biotechnology industry is an ideal setting to test our hypotheses: (a) it is capital intensive and requires
VC or CVC-backing, (b) it is a field where basic and applied research are highly intertwined, leading
firms to invest in both (Rosenberg, 1990), and (c) it provides well-accepted measures of basic-research
outcomes (i.e., scientific publications) and commercial applied- research outcomes (i.e., patents). The
empirical strategy seeks to identify the treatment and selection effects, using structural models and
leveraging the variation in the availability of CVC funding. The results suggest that inventor type affects
the ventures’ innovation trajectory. CVC-backing promotes ventures' publications more than VC-backing
does; the effect is even greater when the CVC parent firm is in the same industry niche as the venture. We
also find that CVCs foster patenting more than VCs, especially when the CVC and the startup compete in
different industry segments, suggesting that CVCs nurture the patenting but also internalize part of the
innovation outcomes of the startup. The results are economically important, leading to increases of more
than 50% on the rate of patents and publications.
This study makes several contributions. First, it adds to a growing literature that documents
innovation implications of different investor types. We focus on the biotechnology industry, where VCs
and CVCs are commonplace. Second, it is the first paper, to the best of our knowledge, to investigate the
consequences of different investors along different innovative outcomes. Whereas prior work focuses on
commercialize-able innovation (i.e., patents), we also consider the impact of ventures' basic research (i.e.,
scientific publications). We therefore shed light on the way in which investor characteristics contribute to
knowledge spillovers.
More Than Words
6
TYPES OF INNOVATIVE OUTCOMES
It is commonplace to distinguish between two archetypes of innovation activity: basic and applied
research. The National Science Foundation defines basic research as “systematic study directed toward
fuller knowledge or understanding of the fundamental aspects of phenomena and of observable facts
without specific applications towards processes or products in mind”, and applied research as “systematic
study to gain knowledge or understanding necessary to determine the means by which a recognized and
specific need may be met.”2 Economists and management scholars use similar definitions. For instance,
Stern (2004: 837) defines “participation in science to be distinguishable from commercially motivated
knowledge production, involve the formulation and testing of theories (which may, but need not, result in
commercial spillovers), and result in public disclosure in academic journals.”
In the biotechnology industry, patents are particularly instrumental in appropriating commercial
value (Cohen et al., 2002; Levin et al., 1987; Shan et al., 1994). The technology that results from the
applied research efforts is typically protected through patents, which are externally validated through the
patent examination process (Griliches, 1990), and are indicators of commercialize-able new products
(Basberg, 1987; Hagedoorn & Cloodt, 2003). Entrepreneurial ventures tend to patent their innovations so
as to secure the commercial monopoly rights associated with them. In contrast, basic research has no
direct commercial application and is typically disseminated through scientific publications and academic
conferences. It is a public good and plays an instrumental role in applied research and technology (Cohen
et al., 2002; Gambardella, 1995; Gittelman & Kogut, 2003; Powell et al., 1996; Zucker et al., 2002).
Public institutions invest in this public good, but interestingly, firms do as well, as a means to improve
their productivity in their applied research activities, and as an incentive for their scientists (Stern, 2004).
With the passing of the Bayh-Dole act in 1980, patenting in the universities became prevalent,
raising the question of whether academic publications were diminished in turn. One stream of literature
2 As defined by the National Science Foundation (http://www.nsf.gov/statistics/randdef/fedgov.cfm, accessed on 1/1/2012)
More Than Words
7
has sought to analyze the extent to which science and technology in the universities act as substitutes
(Agrawal & Henderson, 2002; Azoulay et al., 2009; Goldfarb, 2008; Goldfarb et al., 2009; Larsen, 2011;
Mowery & Ziedonis, 2002), and the role of institutions in shaping this interaction (Furman & Stern,
2011).
While universities have a central role in science, firms also engage in basic research and share
their results through academic publications. The rationale for such investment is that basic research partly
leads to applied research, because it increases the absorptive capacity of the firm (Cohen & Levinthal,
1989, 1990; Rosenberg, 1990), but also because it provides an incentive for scientists (Dasgupta & David,
1994; Stern, 2004). Lim (2004) shows that this close industry relationship between science and
technology is stronger in pharmaceuticals than in other fields, such as semiconductors. Indeed, much of
the work on the science-technology relationship focuses on the life sciences fields (e.g., Azoulay et al.,
2009; Murray & Stern, 2007; Stern, 2004).
It follows that patenting and publications are distinct, but they are highly intertwined,
underscoring the need to study both types of research if we are to anlyze the dynamics of entrepreneurial
venture’s innovation. And while extant work has focused on the basic-applied research output from
universities, there has been little work on the basic-applied balance in the private sectors, and specifically
on that of entrepreneurial ventures. There is no work that we are aware of on the impact of different
investors on this balance.
CORPORATE VENTURE CAPITAL AND STARTUP INNOVATIVENESS
In recent years, an incipient stream of literature has begun to analyze the role of investors on the
venture’s innovative outcomes. In addition to some work on the role of government investment
(Svensson, 2007), the main focus is on venture capitalists. Kortum and Lerner (2000) show that VCs have
spurred patenting across industries in the U.S. Furthermore, the presence of venture capitalists increase
More Than Words
8
the effect of knowledge spillovers from research centres and univeristies on the rates of patenting of firms
(Samila & Sorenson, 2010).
Yet, to the best of our knowledge, past work has focused on one type of investor –VCs- and on
one type of innovative outcome –patents. This paper takes two steps further, studying the effect of
corporate venture capitals as compared to venture capitalists, on the two types of outcomes – patents and
publications. The key insight is that as financial investors, the VCs benefit when the ventures they back
are successful at creating and commercializing innovation. As strategic investors with existing products
and services of their own, corporations may have a different approach. In what follows, we expand and
hypothesize on these issues.
CVCs and Ventures' Publications
As the investment arm of a corporation, corporate venture capitalists may provide additional
resources and knowhow to the entrepreneurial ventures, but may also have interests in them beyond mere
financial success. In addition, both VCs and CVCs select the ventures they invest in. Hence, to
understand how CVCs impact innovation differently from VCs we need to understand not only how
CVCs select ventures, but also the interest that CVCs have on the innovation outcomes of the venture,
and the means by which they can affect the innovation processes.
Previous research has emphasized that both VCs and CVCs select the ventures they invest in, and
that they naturally prefer those that are more innovative and promising. To the extent that publications
signal how promising the venture is, or the knowledge and innovative capabilities of its scientists, it is
possible that both VCs and CVCs prefer ventures with more scientific publications. However, because
publishing is costly, once the VC or CVC invests it has to choose to nurture, or not, future scientific
publications of the venture. The question, then, is whether there are incentives to foster publications, and
whether there are resources that can be leveraged to foster them.
More Than Words
9
There are two broad motives for ventures to engage in publications. As a “ticket of admission,”
the research leading to scientific publications increases the absorptive capacity of the venture and, in turn,
its research productivity (Arora & Gambardella, 1994; Cohen & Levinthal, 1989, 1990; Rosenberg,
1990). Besides, publications are valued by scientists and provides them with an incentive to engage in the
R&D activities that will lead to the discovery of a technology (Dasgupta & David, 1994; Stern, 2004).
For these reasons, both large corporations and entrepreneurial ventures engage in research that leads to
publications in addition to patents.
Extant work indicates that entrepreneurial ventures are specifically a source of highly valuable
and innovative ideas (Kortum & Lerner, 2000; Shane, 2001; Zingales, 2000). According to this line of
reasoning, star scientists/innovators will opt away from fixed salary (i.e., as an employee in a corporate
R&D lab) and towards profit sharing (i.e., founding their own new venture) when they have an idea that is
highly lucrative (Anton & Yao, 1995; Gans & Stern, 2003). Thus, we expect to observe the formation of
new ventures primarily when entrepreneurs have highly innovative ideas (Aghion & Tirole, 1994).
Accordingly, large corporations engage in corporate venture capital activities as a vehicle to gain
a window into cutting edge and high potential research developed by high-technology entrepreneurial
interested in promoting publications at the venture, because they drives the future commercial success of
the ventures innovation (Rosenberg, 1990), but also because it keeps scientists engaged and motivated
(Stern, 2004), and this is particularly relevant in a small and young organization that can offer fewer
extrinsic rewards.
The question that follows is whether the CVC can offer resources and capabilities that could be
valuable for the venture’s R&D activities. One of the mechanisms is the provision of financial resources.
Financing is a typical constraint that researchers in high technology industries face. Another mechanism
has to do with access to management talent. Professionalizing the venture (Hellmann & Puri, 2002) may
More Than Words
10
also prove relevant to the R&D processes, because lower-quality management may detract attention from
the R&D processes to focus on day-to-day problem solving activities. In addition to these mechanisms
(Block & MacMillan, 1993; Dushnitsky & Lenox, 2005a), a CVC may also take advantage of the
resources and knowledge from its parent corporation: providing unique services that build on corporate
resources, including access to corporate laboratories, knowledge of navigating regulatory demands and
FDA processes, as well as access to their suppliers and distribution networks, or access to their patent
lawyers (Acs et al., 1997; Zucker et al., 1998). These resources can be used to help develop and test
promising new inventions (Scotchmer, 2004).
It follows that CVC parent firms have both the incentive and the resources to support and
stimulate basic research conducted by the entrepreneurial venture. In comparison, VC-backed ventures
are privy to business advice, yet do not experience the same level of scientific conversations.
Consequently, we expect CVC-backed ventures to create more scientific knowledge of the type published
in academic journals.3
Hypothesis 1. All else being equal, the publication outcomes of CVC-backed ventures increase
above and beyond those of VC-backed ventures.
The implications of CVC-backing may be sensitive to the degree to which the corporation and the
venture compete in the same industry niche. The topic of knowledge-sharing, including the effect of
resource complementarities and complexities inherent to knowledge transfer (e.g., Dyer & Singh, 1998;
Hamel, 1991; Sampson, 2007), has been examined in the framework of strategic alliances and may be
exacerbated in the context of corporate venture capital where the entrepreneur's main asset is knowledge
based.
3 Note that there is no incentive to keep the scientific discovery secret. The scientific process requires validation of the results, which in turn requires publicity (Kuhn, 1962). Besides, scientists pay to be scientists because instead they are rewarded by the public recognition of their scientific achievements. Therefore, even if CVC enterprises would prefer to keep the scientific discovery secret to reduce external spillovers, the nature of such discovery requires publicity.
More Than Words
11
In high technology fields, innovation is a lengthy process and firms often specialize in different
stages of the innovation chain. There is, then, certain division of labor, with startups often focused on the
early stages of the process and incumbents farther down the chain. The biotechnology and
pharmaceuticals are the archetypical examples in the literature (Galambos & Sturchio, 1998; Pisano,
1991, 2006). It follows that CVC parent firms in the same industry niche as the startup have additional
incentives to foster publications, because the knowledge outcomes of such research are of great value to
their R&D projects. In essence, CVC parent firms explore by investing in the venture’s scientific
An industry-niche overlap will also enhance the parent’s ability to accurately evaluate and
potentially commercialize an innovation. The degree to which a firm learns from a venture depends in
part on its absorptive capacity (Cohen & Levinthal, 1990; Pisano, 1991; Veugelers, 1997). Recent work
highlights the ‘relative’ nature of absorptive capacity, that is, a firm’s ability to learn from another firm is
contingent on domain similarities (Ahuja & Katila, 2001; Lane & Lubatkin, 1998). Overlap in knowledge
domains allows a firm to better gauge the value of its prospective partner’s invention. Essentially, CVC
parent firms in the same industry niche possess resources and knowledge that are more complementary to
the ventures’ than those of CVCs in a different industry niche, and as a result the former are better
equipped to aid the venture.
Consistent with the prediction in hypothesis 1, we argue that both CVCs in the same and in a
different industry niche will nurture publications more than VCs.
Hypothesis 2. (a) All else being equal, the publication outcomes of ventures backed by same-
industry-niche CVCs increase above and beyond those of VC-backed ventures.
(b) All else being equal, the publication outcomes of ventures backed by different-industry-niche
CVCs increase above and beyond those of VC-backed ventures.
More Than Words
12
CVCs and Ventures' Patents
Investors, be that a CVC or an independent VC, also affect a venture’s patenting outcomes.
Moreover, it is well known that ventures invest in patents as a signal of quality, among other things to
attract investors, and that both VCs and CVCs prefer ventures with more patents (Amit et al., 1990; Hsu
& Ziedonis, 2011). Kortum and Lerner (2000) found that even after controlling for selection, VCs foster
patenting after the investment. Therefore, as in the case of publications, there is still the question of
whether VCs and CVCs have the same incentives and capabilities to nurture the firm’s innovative
processes.
A key observation is that investors' objectives shape the value they assign to patents. One might
argue that VCs, as financial investors, view patents as a means-to-an-end (i.e., they allow a venture to
access more capital, either through further fundraising, licensing or eventually, IPO or trade sale),
whereas for strategic CVCs patenting is a goal in and by itself. Specifically, corporate venture capitalists
invest in entrepreneurial ventures because they provide a “window” into different technologies, hence
allowing them to learn and explore (Dushnitsky & Lenox, 2006; Wadhwa et al., 2009). For VCs,
however, patents are a quality signal for high-technology ventures that increase the value of their
investment, especially when the venture is young and the information asymmetries are greater (Hsu &
Ziedonis, 2011). Also, both CVCs and VCs can aid the venture in their R&D processes, but as in the case
of publications, CVCs have a greater array of resources and knowledge that complement those of the
venture, and as a result they are better positioned than VCs to foster patenting outcomes.
This line of reasoning suggests that CVCs foster patents more than VCs. The picture is, however,
more complex, because CVC parent firms have the infrastructure, and possibly the incentives, to
internalize the venture’s technology. It is therefore necessary to analyze the dynamics of technology
appropriation between the established corporation and the venture.
More Than Words
13
Both VCs and CVCs have an incentive to foster the venture’s patenting outcomes, which as a
signal of quality lower the information asymmetries (Hsu & Ziedonis, 2011), making the entrepreneurial
venture more attractive to later stage investors and also to the stock market investors or corporations,
facilitating further rounds of investment, and IPO or a trade-sale. Furthermore, patents can be licensed or
sold, and this is for the most part the main source of profits for early stage ventures that still lack a
commercial product. In essence, by fostering patents, corporate and independent VCs enable the financial
success of the entrepreneurial venture in their portfolio.
But the resources and knowledge-base of the CVC parent firm provide the entrepreneur with an
alternative to the costly and time-consuming patenting process. Through the corporation, the venture has
access to distribution channels and so it may be possible to avoid (or at least keep a trade secret and
postpone until commercialization is more certain) the patent application and subsequent licensing
agreements. Moreover, many ventures reach licensing and/or commercial agreements with the CVC
parent corporation in a way that allows the venture to capture part of the rents associated with the
innovation, while leaving the costly commercialization phase to the corporation. Finally, it is also
possible that the corporation takes advantage of their privileged position, to expropriate the technology of
the startup. In this case the effect of CVC-backing would not necessarily translate into more patents for
the venture, even though it may translate into more patents for the CVC if they want to fully expropriate
the technology.
Overall, we argue that CVCs possess resources and knowhow that complement those of the
venture, and hence may foster patenting outcomes more than VCs. However, CVCs may also reduce the
patenting outcomes of the venture by providing an alternative avenue to the venture or by expropriating
its technology. Because it is an empirical question whether CVCs foster patents more than VCs or not, we
propose the two effects on hypothesis 3 (a) and (b).
More Than Words
14
Hypothesis 3. (a) All else being equal, the patenting outcomes of CVC-backed ventures increase
above and beyond those of VC-backed ventures.
(b) All else being equal, the patenting outcomes of CVC-backed ventures decrease compared to
those of VC-backed ventures.
These positive and negative effects of CVC-backing are exacerbated when the CVC parent firm
competes in the same industry niche as the entrepreneurial venture. Research in life sciences is a lengthy
and complex process and as a result biotechnology ventures tend to focus more on the earlier stages of the
process, while incumbents focus on the later stages (Pisano, 1991). When the CVC parent firm and the
venture are in the same industry segment, there is a greater degree of complementarity between the
resources and knowledge-bases of both. This greater complementarity of resources facilitates the
commercialization of the technology through avenues different from the patent, also increasing the
incentives of the corporation to expropriate and internalize the technology. In essence, even though there
is a greater potential to nurture the applied research efforts, the CVC also offers a better alternative to
patenting, either voluntarily by the entrepreneur or forced by the CVC parent firm. Therefore, we expect
that the negative effect on patenting outcomes will be predominant when the CVC parent firm’s and the
venture’s industry niches overlap (hypothesis 4.a).
In contrast, when the CVC goal is to expand the parent’s product categories, and hence invests in
a startup in a new (different) industry niche, they are less likely to internalize the innovation directly. In
this case, the parent does not have the organizational structure in this business segment in order to directly
exploit this technology, and it is more valuable to keep it in the startup. For instance, this is the case of the
Novartis Option Fund, which seeks to “enabl[e] the development of novel programs and technologies that
may be complementary to Novartis’ research endeavors” and “is coupled with an option to [license] a
specific therapeutic program giving early validation for the startup company’s technology or programs by
More Than Words
15
a large Pharma.”4 In this case Novartis funds ventures in complementary (but different) areas and
negotiates the licensing of the technology ex ante.
Even though both types of CVCs have complementary resources to foster patenting, the resources
of same-industry-niche CVCs are more valuable. And even though both types of CVCs have incentives to
foster patents, those in different industry niches have more incentives. While the mechanism may differ,
we expect both types of CVCs to have an effect on patenting above and beyond VCs.
Hypothesis 4. (a) All else being equal, the patenting outcomes of ventures backed by same-
industry-niche CVCs increase above and beyond those of VC-backed ventures.
(b) All else being equal, the patenting outcomes of ventures backed by different-industry-niche
CVCs increase above and beyond those of VC-backed ventures.
METHODOLOGY
Empirical setting and sample description
We test our hypotheses using a sample of 574 U.S. biotechnology ventures founded during the
period 1990 to 2003, and observed until 2005. Our sample brings together financial performance of these
ventures as well as the investments they received, and a full history of their publications and patents.
Venture Economics collects the data using a variety of sources, including the investment banking
community, industry associations, or surveys of general partners and their portfolio companies. This
database is widely used in previous research (Dushnitsky & Lenox, 2005a, 2005b; Gompers, 1995; Guler
& Guillén, 2010; Sorenson & Stuart, 2001).
Biotechnology is an ideal setting to test our hypotheses. Being high-technology, innovation is
valuable and ventures have a general desire to increase their innovative outcomes; as a result, patents and
publications are good measures of innovation in this industry (Rothaermel & Thursby, 2007; Stuart et al.,
4 Source: Novartis website, http://www.novartisventurefunds.com/index.php?id=234 (accessed Jan 17, 2012).
More Than Words
16
1999; Zucker et al., 2002), Moreover, critical developments in the industry are strongly rooted in
advancement of basic research, yet also require additional progress through applied research (e.g.,
Gittelman & Kogut, 2003; Huang & Murray, 2009; Lim, 2004). Finally, since innovation is costly, they
rely heavily on external funding from corporate and independent VCs.
The main goal of this paper is to assess the effects on the innovation strategies of CVCs relative
to VCs. To establish a baseline for comparison, we restrict the sample to those ventures that are VC-
backed, and then analyze the effect of being CVC-backed. Each venture is observed since founding and
until 2005, and they drop from the sample only in case of bankruptcy or acquisition. The rationale to close
the window in 2005 stems from the time lag between filing and publication of patents. Collected in 2011,
a six year lag is roughly the mean lag (4 years) plus one standard deviation (2 years), increasing our
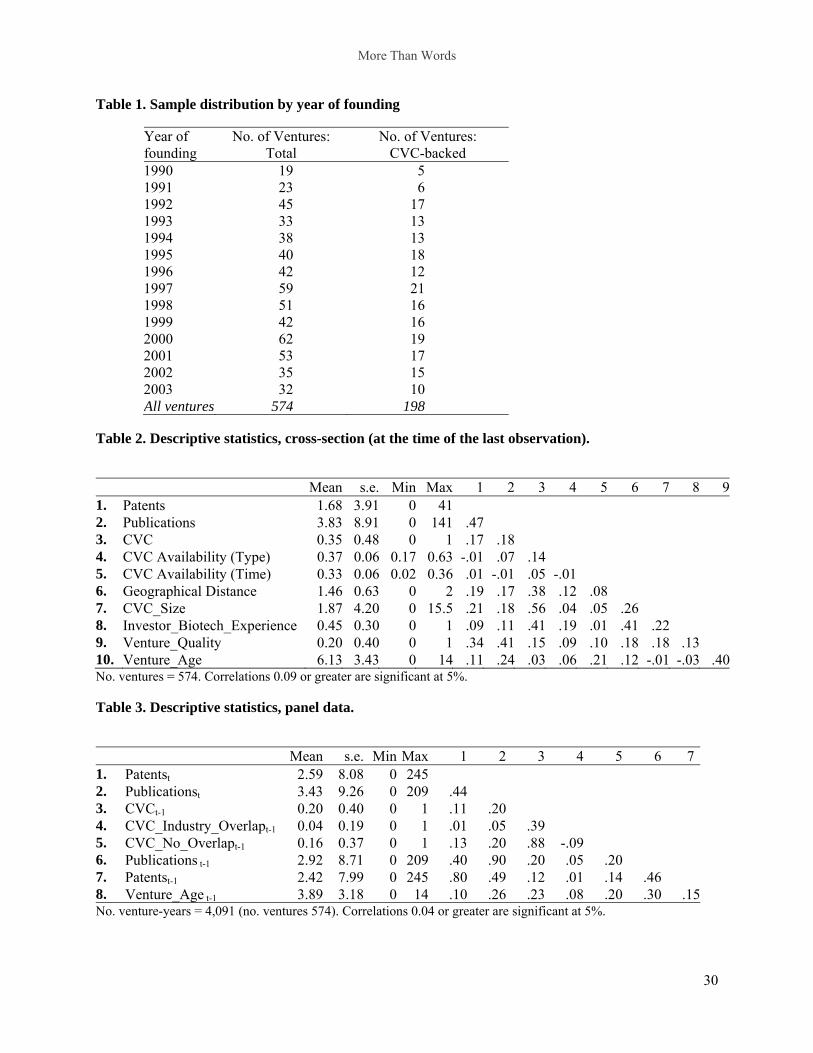
confidence that we observe most of the patents published by the ventures in our sample.5 Table 1 shows
the distribution of founding years over the period of observation, generally increasing until the peak of the
financial bubble in 2000, and drastically decreasing right afterwards.
[Table 1 about here]
Empirical Strategy
The main econometric challenge of the paper is that CVCs choose the startups they fund. In fact,
both corporate and independent VCs seek to invest in inherently innovative startups (Amit et al., 1990;
Eckhardt et al., 2006; Sørensen, 2007), suggesting that the superior innovation outcome may be, at least
in part, due to a selection effect. Because the focus of the paper is on the treatment effect of CVCs, it is
critical to devise an identification strategy that addresses how CVCs select the ventures.
First we estimate a set of two-stage analyses that seeks to separate the selection from the
treatment effects. Because in the first stage it is important to include exogenous variables that meet the
exclusion restriction, we conducted an extensive search of the recent literature of corporate finance.
5 Note that we should only be concerned with the right tail of the distribution. Just as a reference, if the distribution were normal, this lag of mean+sd would cover roughly 85% of the patents.
More Than Words
17
Berger et al. (2005) instrument the selection of a bank with the availability of credit in a particular
geographical area, and building on their paper, Bottazzi et al. (2008) instrument the experience of the
investor with the local availability of investor experience. Likewise, Hellmann et al. (2008) utilize a
combination of geographic availability with temporal availability of investors. Following a different
approach Faulkender and Petersen (2006) utilize different measures of investor visibility and information
availability, because the more visible firms are more likely to be selected, and those with more public
information available are easier to be researched.
We need an instrument that is correlated with the investment of a CVC firm, but which does not
lead to higher patents or publications of the venture. Building on Berger et al. (2005) and Bottazzi et al.
(2008), we measure the availability of CVC investment for a particular type of biotech and also for a
particular time. The former was calculated as the proportion of biotechnology ventures in a particular
biotechnology field that obtain CVC funding. We also exploit the geographical distance between the
investors and the biotechnology ventures. Past research has shown that independent VCs tend to invest
locally (Sorenson & Stuart, 2001); CVC parents, however, choose a location for strategic considerations,
and therefore may invest in entrepreneurial ventures that are located farther away from their main
business. We expect that greater geographical distance between the venture and the investor will be
associated with CVCs. It is plausible that distance mitigates the potential effect of the venture capitalists
on the patents and publications; yet the direction of the effect would be opposite to the direction of the
selection. Finally, following the specification by Dushnitsky and Shaver (2009), we also include an
estimate of CVC size and the degree to which the CVC or the VC have industry experience.
We estimate the two-stage models in the cross-section formed by last year of observation for each
of the ventures, which is when the information is more complete. Note that with count dependent
variables it is not possible to implement a panel-data two-stage model. We estimate two different
specifications: a treatment-effects model and a structural Poisson model. The former jointly estimates by
maximum-likelihood a probit regression on the first stage, and an OLS regression on the second stage.
More Than Words
18
The latter estimates the same first stage regression, and a Poisson regression on the second stage. We
include the residuals of the first stage on the second stage, calculating the correct standard errors using
bootstrap. Note that by including the residuals, the Poisson is robust to overdispersion (Cameron &
Trivedi, 2009: 592). Finally, we estimate the effect on the change in patents and change in publications,
comparing the yearly patent and publication output at the time of investment by the VC and three years
afterwards, and estimating a treatment-effects regression. Because the independent variables are 0 before
the CVC enters, and 1 thereafter, it captures the change in the yearly patenting or publishing outcomes.
As an additional robustness check, we also perform univariate analyses at the time of selection and four
years afterwards, finding the same results. While each econometric approach has unique advantages, we
further emphasize that our results are mainly consistent across all approaches.
The main strength of the two-stage models is that they better identify the selection and treatment
effects. Yet they only allow for a cross-sectional analysis of count dependent variables, and they can only
test the presence or absence of CVC, but cannot accommodate a more complex test of the industry
overlap of such CVC.6 In order to test these issues, we specify fixed-effects Poisson models, estimated
through quasi-maximum-likelihood, which is robust to overdispersion and to venture fixed-effects
(Wooldridge, 1997). Robust standard errors were calculated using the xtpqml Stata command (Simcoe,
2007). Within the limits of the statistical technique, we control for different sources of endogeneity: a)
including fixed-effects controls for all time-invariant sources of selection, such as the characteristics of
the founding team, or the location of the venture; and b) to estimate publications (patents), we control for
the lagged flow of patents (publications), which co-vary with the quality of the scientific team, and the
research resources in general, hence reducing the concern with endogeneity in this set of regressions.
In addition, the dependent variables and the main independent variables are defined such that we
can better identify the treatment and selection effects. By using a flow rather than a stock measure of
output (namely, focusing on annual patent output rather than aggregate stock of patents), we are able to
6 The probit model in the first stage can estimate the presence/absence of CVC, but not also different CVC types.
More Than Words
19
better identify the post-investment nurturing effect. Also, the main independent variable is 0 until the
CVC enters, and 1 thereafter, hence estimating the change from pre- to post- investment.
Variable definitions
Dependent variables
, is a count of patents7 for venture i and year t (flow variable). The flow of patents per
year is a common measure of innovative outcomes (e.g., Ahuja & Katila, 2001; Cockburn et al., 2002).
With the help of several research assistants, we hand-collected patent information from the United States
Patent and Trademark Office (U.S.P.T.O.), matching the biotechnology startup in the sample to the
assignee of the patent. The matching took into consideration the location of the startup as established in
the patent, checking whether the venture had research labs in other locations when necessary, and
comparing the inventors across different patents to ensure the accuracy of the matching. We only included
published patents, but used the date of application, as it is customary in the literature.
, is a count of scientific publications for venture i and year t (flow variable), which
is a typical measure of basic science on past research (e.g., Agrawal & Henderson, 2002; Azoulay et al.,
2009).We used the Web of Knowledge (formerly ISI) Database, from Thomson, hand-collecting those
publications such that the focal venture is listed as the affiliation of one of the authors, and following the
same matching criteria we used for patents. This database is widely used in prior work (Azoulay et al.,
2009; Cockburn & Henderson, 1998; Gittelman & Kogut, 2003; Goldfarb, 2008), and it has two features
that suit our research question: it imposes quality filters to the journals included in their list, and unlike
more specialized databases, it covers a wide array of disciplines. Less depth in the number of journals
included allows us to have more comparable publications in terms of quality. Greater scope in the number
7 We chose to estimate the count of patents rather than the citations because our arguments are not related to the quality of the patent, but to the level of outcome in itself. The number of citations varies with the patent examiner additions, and with the traction of a particular field of research at a given point in time (e.g. monoclonal antibodies vs. stem cells). Since our theory does not speak to these choices we prefer to use a more conservative measure.
More Than Words
20
of journals included is an attractive feature for biotechnology research, which is a highly interdisciplinary
area which draws from biology to computer science.
Independent variables and controls
, is an indicator of whether venture i was CVC-backed in t-1. The variable is 0 until a
CVC invests in the venture, and 1 thereafter. This is the main variable of interest in hypotheses 1 and 3.
, and , breaks the information from ,
into two indicator variables. The former measure takes the value of 1 when there is a CVC investor, and
that CVC parent firm operates in the same industry niche as the venture (as measured by a four-digit SIC
code). The latter measure takes the value of 1 when there is a CVC investor, and the CVC –venture pair
exhibit no industry-niche overlap. Industry overlap is defined following Dushnitsky and Shaver (2009);
for ventures, we followed the Venture Economics Industry Classification (VEIC) and matched to the SIC
classification using Dushnitsky’s VEIC_SIC concordance. We compare the industry that defines the
primary operations of the investor with the industry of venture as defined by this concordance. These are
the two main independent variables used to test hypotheses 2 and 4.
, measures the number of years since the venture was founded. This variable
proxies for the growth of the startup, that enables it to increase the patent and publication output.
First-step regressors
The first stage estimates the probability of CVCi. In addition to , , we include the
following additional variables:
CVC Availability (Type)i and CVC Availability (Time)t measure the percentage of biotechnology
ventures that are CVC-backed, by type and by year, respectively. We use our sample as the market of
reference. We measure the type of biotechnology using VentureXpert’s VEIC classification, at the two-
digit level.
More Than Words
21
measures the geographical distance between the investor and the
venture. The variable takes lower values when the investor is closer to the venture (i.e., same economic
area, same state, or same country). We follow the agglomeration literature (Alcácer & Zhao, 2011) and
use the Bureau of Economic Analysis definition of economic areas (2004 classification), which is based
on commuting distances. Hence, we define the closest distance as the same economic area. Note that
when there is more than one investor, we utilize the maximum distance; results are robust to using the
average or the median.
measures the extent to which independent and corporate VCs are
specialized in biotechnology, and proxies the degree of industry-niche overlap with the past portfolio of
investments. For each investor we calculate the number of biotechnology investments in the past 15 years
over the total number of investments. Because investors syndicate to build on each other’s strengths
(Brander et al., 2002), we take the maximum of these ratios when there is more than one investor in the
syndicate.
measures the size (defined as total sales) of the CVC investor relative to the median size
of their respective industry niches along the period of analysis. When more than one CVC investor was
present, we averaged the relative size, but results were robust when considering the maximum.
measures whether the venture went public during the window of observation,
building on previous literature that shows that an IPO is a testimony of the underlying quality of the
venture (Gompers & Lerner, 1998).
RESULTS
Descriptive Statistics and Univariate Analyses
We present the descriptive statistics both for the cross section at the time of the last observation
(table 2) and for the panel data (table 3). There are 574 ventures, and 4,091 venture-years, respectively.
On average, ventures in the sample patent about 2.60 patents and 3.4 publications per year (table 3). In
More Than Words
22
general, those ventures that patent more, also publish more (the correlation is positive and significant,
close to 45%). Note that because the sample was defined as VC-backed ventures, the percentage of CVC-
backing is higher than in the population of startups. Roughly one third of the startups in the sample are
funded by a CVC (table 2), corresponding to 21% of the venture-years (table 3). Consistent with previous
findings (Dushnitsky & Shaver, 2009), most CVCs do not share industry niche with the ventures in the
portfolio; indeed, roughly 4 out of 5 CVCs in the sample are in a different industry niche.
[Tables 2 and 3 about here]
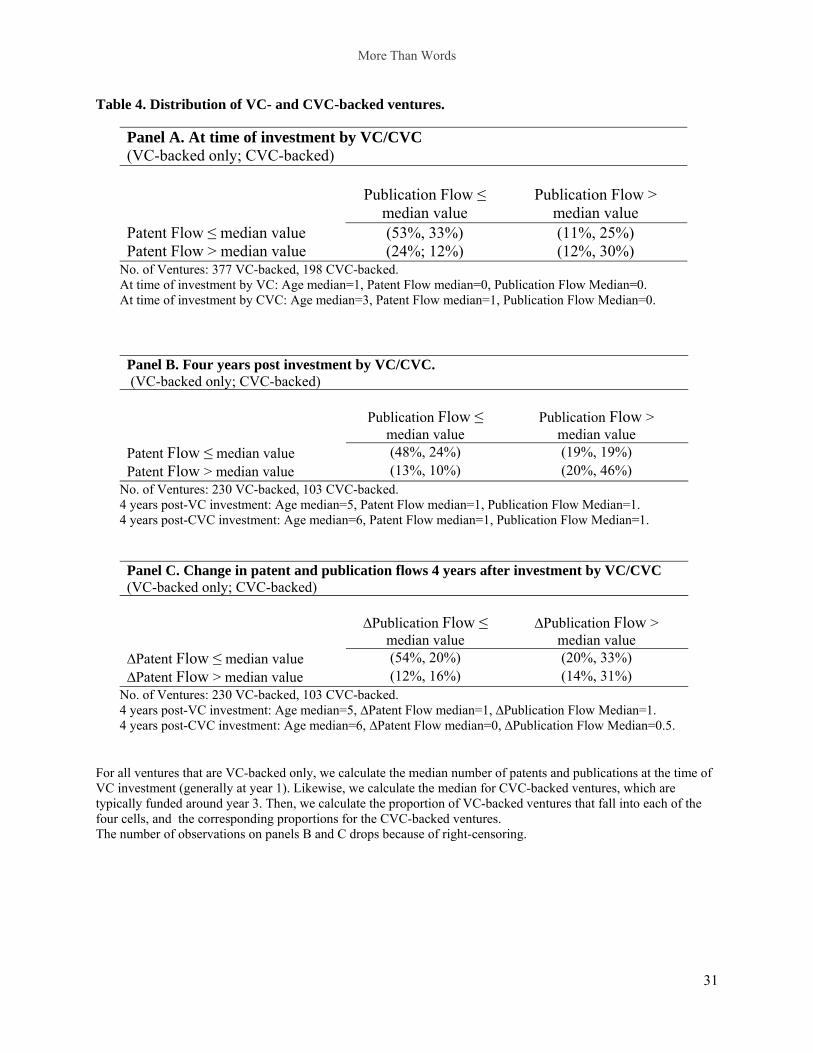
Before moving to a multivariate framework, we conduct a univariate analysis of patents and
publications for VC and CVC-backed ventures. On table 4 we divide the ventures into low/high patents
per year, and into low/high publications per year. Note that the median patent and publication level is
calculated for the cohort of ventures; that is, even though CVC firms tend to enter later in the life of the
venture, the median is calculated for the corresponding age cohort, and so the table factors in the potential
increase.
Panel A calculates the percentage of VC- and CVC-backed ventures in each of the four categories
at the time of investment by the VC or the CVC (on average at year 1 and 3 respectively). Univariate
analyses show that more than half the times, VCs choose ventures that are in the low/low category.
According to the expectations, CVCs seem to select ventures that are, on average, more innovative: about
a third are in the low/low category, but 30% are in the high/high/category, and 25% are high in
publications.
Panel B calculates the same percentages but four years after the investment by the VC and the
CVC. Interestingly, again about half of the VC investments continue to be on the low/low category. That
is, VCs seem to maintain the status quo to a certain extent. CVC-backed ventures exhibit a change from
investment: the percentage of ventures on the low/low category is slightly reduced (from one third to one
quarter), but more importantly the percentage in the high/high category rises from 30% to 46%. In
More Than Words
23
essence, even though CVC firms did select the most innovative ventures, they seem to nurture them to
become even more innovative.
To further explore this issue, on panel C we present the change in patents and publications per
year, comparing the flow measures at the time of investment and the flow measures four years after
investment. By comparing the flow measures at two points in time, rather than the average rate of change,
we are able to assess the change in the trend. Consistent with the previous panel, more than half of VC-
backed ventures are in the low/low category, and only 14% increased both their patenting and publication
outcomes. In contrast, 31% of CVC-backed ventures experienced an increase in patents and publications.
[Table 4 about here]
Overall, the univariate analyses on table 4 support the thesis that CVCs not just select more
innovative ventures, but they nurture their innovative activities to help them increase their outcomes. In
contrast, VCs seem to select startups that are less innovative, consistent with the predictions of Amit et al.
(1990), and they don’t seem to have such a marked effect on nurturing them. In what follows, we seek to
identify the selection and treatment effects using structural models.
Structural Models and Panel Data
The main econometric challenge of the paper is to assess if there is a treatment effect of CVC
beyond the selection effect. First, we analyze the results of two-step structural models that seek to identify
the treatment and selection effects (tables 5 and 6). Then, after assessing that there is a treatment effect,
we proceed to a more fine-grained analysis of it (table 7).
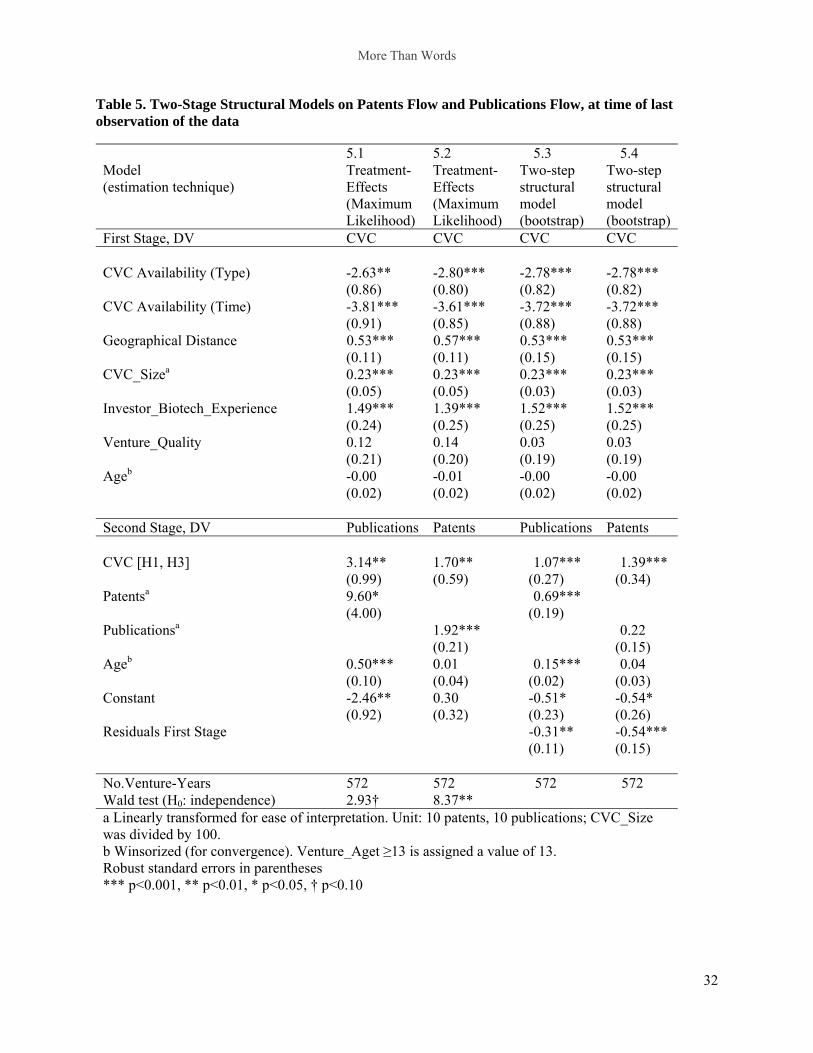
On table 5 we show the results of structural-models of the flow of publications in the cross-
section composed by the last observation for each venture. The first stage for all four models is a probit
that estimates the presence of CVC. The second stage is an OLS estimated by maximum likelihood
(models 5.1 and 5.2), or a Poisson which includes the residuals of the first stage and is estimated by
bootstrap (models 5.3 and 5.4). The estimates for the first stage are robust throughout the four
More Than Words
24
specifications. Interestingly, the availability of CVC both by type of biotech and by time reduces the
likelihood of a CVC, despite the positive correlation, which may be suggesting a crowding-out effect. The
results for other variables are broadly consistent with those in Dushnitsky and Shaver’s (2009). It is more
likely that a CVC will join if the Investor Biotech Experience is high, and if the CVC is big relative to its
competitors. Contrary to the expectations, distance increases the likelihood of the CVC joining. Since the
distance is defined for both CVC and VC, this would be consistent with the VC being already
geographically close to the startup, diminishing the need for more investors in the area. As expected,
venture characteristics also affect the selection process, such that older ventures and those with greater
quality have a greater chance of attracting a CVC.
The results for the second stage are robust throughout models and suggest that there is a positive
effect of CVC on both publications and patents above and beyond selection. As expected, though, there is
a selection effect. On models 5.1 and 5.2, the test of independent of equations is rejected, and on models
5.3 and 5.4 the residuals of the first stage are significant. However, after selection is accounted for, there
is still a remaining effect of CVC on both patents and publications. This treatment effect is also
economically significance: the presence of a CVC increases publications by 107% (model 5.3), and
patents by 139% (model 5.4). Overall, these results yield support for hypothesis 1 and for hypothesis 3.a:
there is a positive, and not a negative, effect of CVC on patents, above and beyond the effect of VC-
backing.
[Table 6 about here]
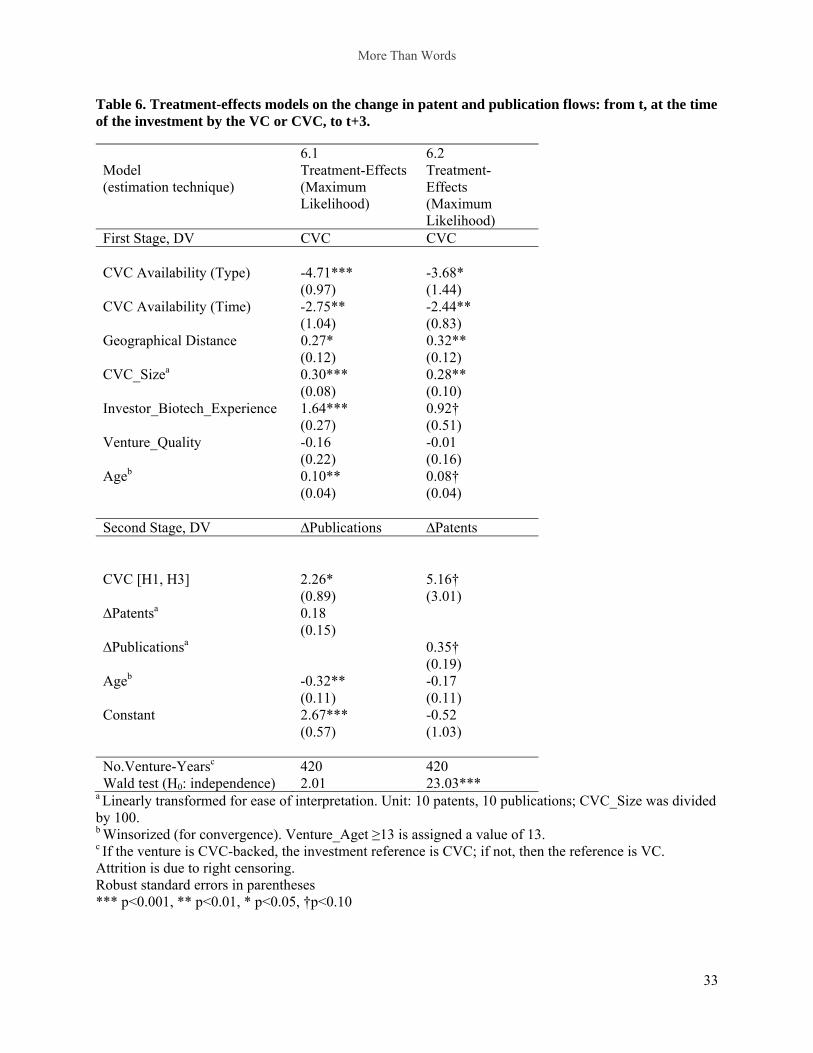
On table 6 we present structural-models for the change in the flow of patents and of publications,
calculated as the difference between the patents (publications) in the year of investment and the patents
(publications) three years after. This difference is a continuous variable, which is positive when venture is
patenting (publishing) at a higher per-year rate than when the venture was selected, zero when there is no
change, and negative when the yearly outcomes are lower. The year of investment is defined as the year
More Than Words
25
the CVC invested, or if the venture is not CVC-backed, the year the VC invested. The results are broadly
consistent with those of table 5: even after controlling for selection, CVC firms lead to a higher rate of
publications per year. The same effect is true for patents, though it is only marginally significant.
Overall, the results from tables 5 and 6 show there is a treatment effect of CVC on publications
and patents above and beyond the selection effect, in support of hypotheses 1 and 3.a. We turn now to
present a more fine-grained analysis of this treatment effect, in a panel data regression framework, and
controlling for selection as much as the technique allows.
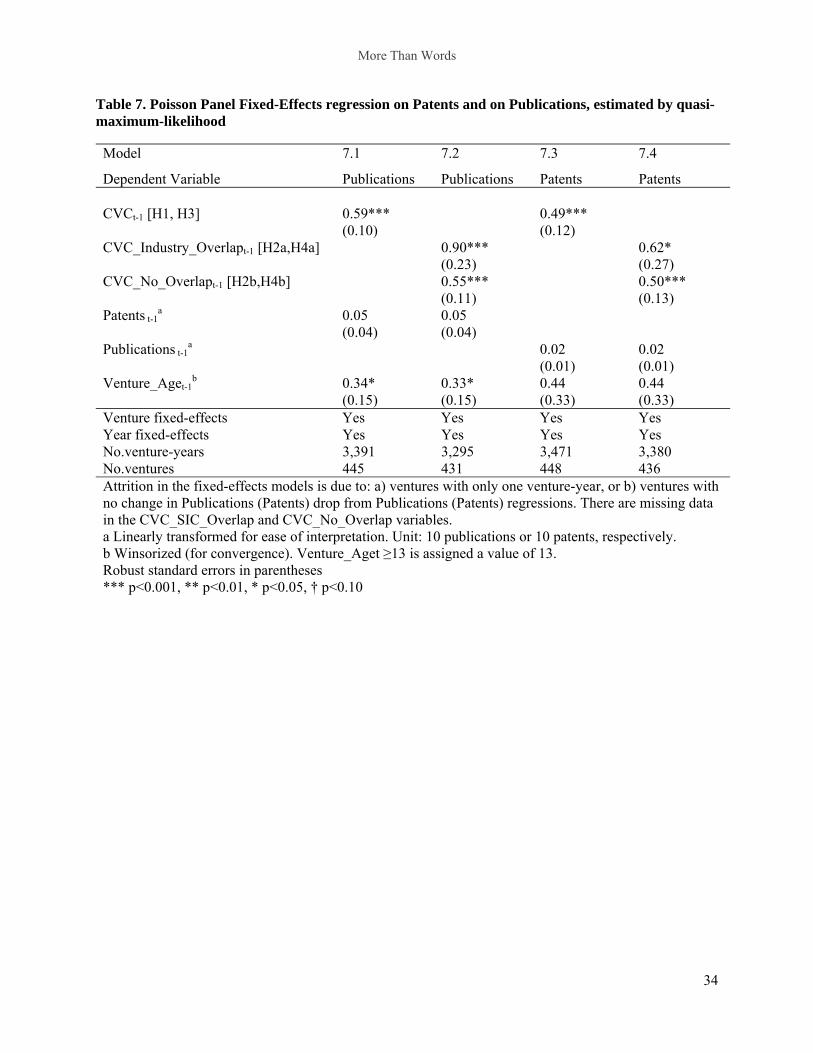
Table 7 presents the fixed-effects Poisson regressions, estimated by quasi-maximum-likelihood.8
All these models include venture and year fixed-effects, and control for Venture_Age. Model 7.1 tests the
effect of CVCt-1 investment on Publications, measuring the differential effect between CVC-backed and
only VC-backed (hypothesis 1). The effect is positive, statistically significant, and economically relevant.
In the years after the CVC joins the syndicate, the yearly publication output increases by 59%. In other
words, ventures that are backed by a CVC produce nearly 60% more publications than those that don’t.
[Table 7 about here]
Model 7.2 tests separately the differential effects of CVC_Industry_Overlap and
CVC_No_Overlap versus being only VC-backed, to analyze whether the two effects are positive and
significant or not. In support of hypothesis 2, both coefficients are positive and statistically significant.
The estimated effect of having a CVC in the same industry niche is a 90% increase in publications, while
the effect of a CVC in a different industry niche is of 55%. While big in magnitude, this difference is only
marginally significant: a one-sided test of CVCs in the same industry niche having a greater effect on
8 Fixed-effects models estimate the within-venture variation, and as a result all ventures with only one observation or with no change in the dependent variable drop. Hence, the number of observations is lower than in tables 2 and 3. In unreported analyses we compared the sub-samples used in the patents and publications regressions finding that: a) the sub-samples used in the patents and publications regressions have significantly more patents and more publications on average, which is explained by the fact that ventures with zero patents and zero publications throughout the period of analysis dropped in these regressions; and b) there are no significant differences between sub-sample used in the patent models and the one used in the publication models.
More Than Words
26
publications than in different industry niche yields a 6% significance. However, this is a conservative test,
because the fixed-effects and the partial likelihood estimation all increase the standard errors.
Model 7.3 tests the effect of CVCt-1 investment on Patents (hypotheses 3a and 3b). The effect of
CVC on Patents is positive and significant, yielding support for hypothesis 3a. The effect is economically
relevant, with a 50% increase in the yearly patent output after the CVC joins the investment syndicate.
Model 7.4 separates this effect into CVCs in the same industry niche, and CVCs in a different industry
niche. In support of hypothesis 4, both effects are positive and significant. Unlike in the case of
publications, however, we find that the effect is very close: 62% increase in patents if the industry niche is
the same, compared to 50% in different industry niche.
Jointly considered, the results in models 7.2 and 7.4 show that CVCs in different industry niche
foster both publications and patents similarly. And while CVCs in the same industry niche as the venture
foster both publications and patents, there seems to be a greater emphasis on publications than on patents.
This may suggest that there is a “division of labor”, where same-industry ventures are pushed to do more
publications than patents.
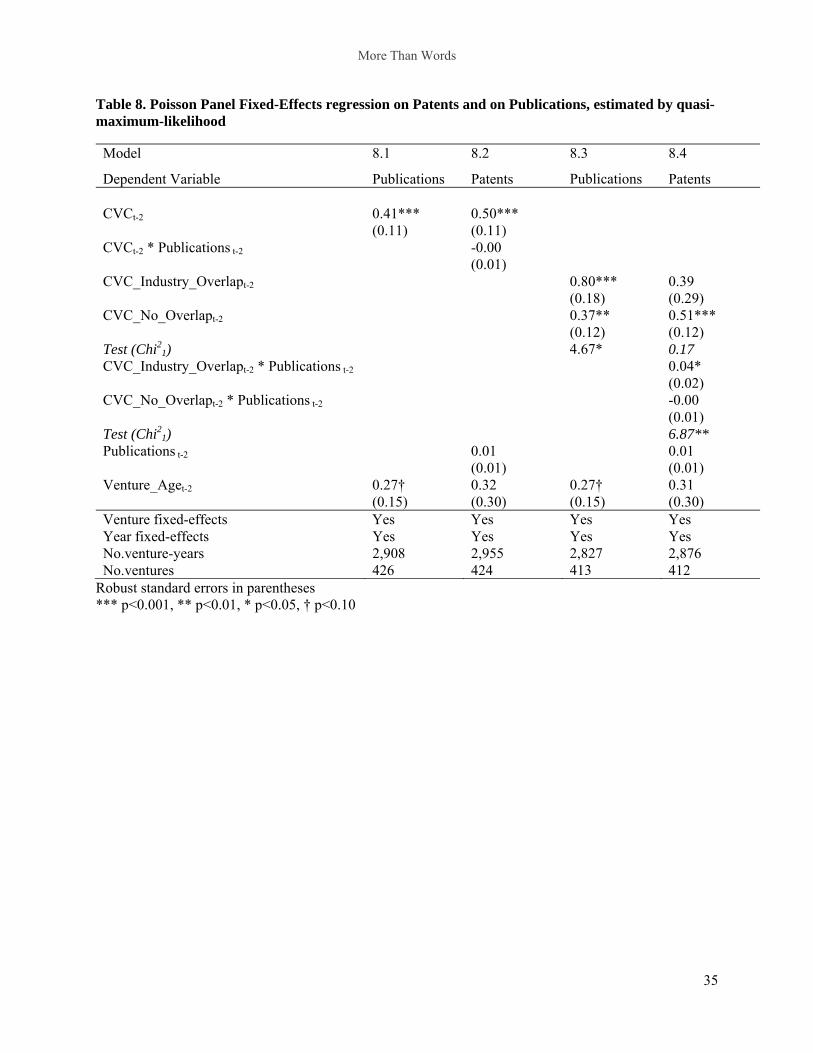
To further analyze this issue, we estimate how publications turn into patents, and whether CVC
firms affect the rate at which this change happens. Departing from the model in Gallasso and Simcoe
(2010), we first estimate the flow of publications, and the direct effect of CVC on publications. Then, we
estimate the flow of patents, and the effect of CVC, publications, and the interaction of both, to capture
how CVCs affect the extent to which publications increase the productivity of patents. In all these
regressions we use two-year lags (Dushnitsky & Lenox, 2005b), rather than the standard one-year lag, to
allow for sufficient time for the effects to develop.
The two first models on table 8 test the effect of CVC on publications and patents. We find that
CVC parent firms foster the number of publications, and of patents, but we do not find evidence of an
indirect effect of CVC on patents through publications (model 8.1). However, when we separate CVC
More Than Words
27
into those that share the industry niche with the venture and those that don’t, the results are strikingly
different (model 8.2). Those CVCs in the same industry niche foster publications more than CVCs in
different industry niche, though both effects are positive (model 8.3). And while those CVCs in different
industry niche foster patents, they don’t necessarily foster how publications turn into patents (model 8.4).
In contrast, CVCs in the same industry niche don’t have a direct effect on patents, but they do have an
indirect effect through publications (model 8.4).
These results seem to suggest that when the CVC is in the same industry as the venture, there is
an increase in the productivity that is consistent with greater resource complementarity. Yet, there seems
to be no direct effect on patenting, which may suggest indeed there is a division of labor between the
venture and the CVC, with the venture more focused on the upper part of the research value chain.
DISCUSSION AND CONCLUSION
This paper analyzes the effect of CVC investment, compared to VC investment, on two types of
innovative outcomes of startups: scientific publications, as the outcome of basic research, and patents, as
the outcome of applied research. We found that CVC-backing greatly increases the publication outcomes
of the venture. We argue that with greater incentives to foster basic research, as a ticket of admission to
applied research (Rosenberg, 1990), and with a greater pool of resources and knowledge (Acs et al.,
1997), CVC parent firms help the startups greatly increase their scientific discoveries. These effects are
even stronger when the parent of the CVC and the venture operate in the same industry niche, because
there are greater complementarities in the knowledge-base of the two firms.
The dynamics are very different when we analyze the effect of CVC on patents. While they foster
patents above and beyond VCs, this is the outcome of two opposite effects. On one hand, CVC parent
firms have resources and knowhow above and beyond those of VCs, and are therefore capable of
nurturing the venture’s applied research. And yet, these same resources and infrastructure provide an
alternative avenue to the venture to profit from the innovation, avoiding the costly patenting process.
More Than Words
28
Notwithstanding, the corporation may also have incentives to expropriate the technology to
commercialize it on its own. By distinguishing between CVCs in the same industry niche as the venture –
where there are more incentives to internalize the innovation – and CVCs in a different industry niche, we
conclude that both processes are operating simultaneously. Indeed, there seems to be a “division of labor”
such that CVCs in the same-industry niche foster more basic research than applied research, then pushing
the ventures they fund up in the research value chain.
Empirical studies in the entrepreneurship financing literature face the challenge of separating
selection and nurturing effects. Specifically, the empirical challenge lies in the fact that both VCs and
CVCs choose where to invest. Indeed, our results seem to support the idea that the latter select more
innovative ventures than the former. However, the results consistently show that there is an effect beyond
selection that indicates that CVCs in effect nurture the startups in their portfolio and allow them to
innovate more. This increases our confidence that the results are not driven by selection only and, indeed,
there is a nurturing effect once the ventures are selected.
The paper seeks to contribute to the CVC literature by showing that CVCs are not just an
alternative source of financing. They provide entrepreneurial ventures with valuable resources that add to
those provided by VCs, and allow them to increase the rate of innovation by an economically significant
amount. Our results further suggest that when the venture and CVC pair operate in the same industry
niche, the resources of the latter provide the venture with an alternative way to profit from their
innovation. Yet, the corporation is also in a position to expropriate the technology developed by the
venture. The effects of CVC on the innovation processes are, therefore, not neutral to the competition
between the two, showing that this is a case where the knowledge sharing dynamics pointed out by the
strategic alliance literature are aggravated.
We have also sought to contribute to the literature on basic vs. applied research, by analyzing the
drivers of these two different types of innovation. Our results are consistent with previous findings, which
More Than Words
29
show that basic research leads to applied research, but not necessarily (Stern, 2004). Importantly, we find
that not only do ventures have an incentive to do both applied and basic science (Rosenberg, 1990), but
corporations also have an incentive to foster the basic research of the startups they fund. This suggests
that they benefit in some way from this knowledge spillovers, and is consistent with the idea of corporate
investing as a window into other technologies (Dushnitsky & Lenox, 2005b).
More research is needed to clarify some of these issues. Our data did not allow us to identify the
different mechanisms by which startups with CVC investors from the same industry niche patent less.
Future research could delve into this important issue, to further understand the influence of established
corporations on startups’ innovative processes. Our research is also limited by the analysis of just one
industry: biotechnology. Even though focusing on this industry allowed us to net out alternative
explanations, it raises the question of generalizability. Specifically, this is a field prone to the division of
labor in research, where basic and applied research are highly intertwined, but this may not be the case in
all high technology industries.
Our research has implications for ventures, CVCs and their parents, and for public policy. When
seeking additional funding, entrepreneurial ventures should better understand the implications of being
financed by an established corporation. In particular, they should evaluate the resources that the
corporation may share with them, and the extent to which these resources are valuable for their innovation
processes. Moreover, whether the venture is a competitor or whether they have a focus on basic vs.
applied science are also important issues to consider.
Finally, given the innovation contribution of CVC-backing, policy makers should reward CVC
investment in a similar manner to their support of venture capital funds. At this time of crises, when
reactivating the innovation and the damaged entrepreneurial net is needed the most, and when individual
investors are more risk averse than ever before, strengthening the investment of corporations may be one
Table 4. Distribution of VC- and CVC-backed ventures.
Panel A. At time of investment by VC/CVC (VC-backed only; CVC-backed) Publication Flow ≤
median value Publication Flow >
median value Patent Flow ≤ median value (53%, 33%) (11%, 25%) Patent Flow > median value (24%; 12%) (12%, 30%)
No. of Ventures: 377 VC-backed, 198 CVC-backed. At time of investment by VC: Age median=1, Patent Flow median=0, Publication Flow Median=0. At time of investment by CVC: Age median=3, Patent Flow median=1, Publication Flow Median=0.
Panel B. Four years post investment by VC/CVC. (VC-backed only; CVC-backed) Publication Flow ≤
median value Publication Flow >
median value Patent Flow ≤ median value (48%, 24%) (19%, 19%) Patent Flow > median value (13%, 10%) (20%, 46%)
No. of Ventures: 230 VC-backed, 103 CVC-backed. 4 years post-VC investment: Age median=5, Patent Flow median=1, Publication Flow Median=1. 4 years post-CVC investment: Age median=6, Patent Flow median=1, Publication Flow Median=1.
Panel C. Change in patent and publication flows 4 years after investment by VC/CVC (VC-backed only; CVC-backed) ∆Publication Flow ≤
median value ∆Publication Flow >
median value ∆Patent Flow ≤ median value (54%, 20%) (20%, 33%) ∆Patent Flow > median value (12%, 16%) (14%, 31%)
No. of Ventures: 230 VC-backed, 103 CVC-backed. 4 years post-VC investment: Age median=5, ∆Patent Flow median=1, ∆Publication Flow Median=1. 4 years post-CVC investment: Age median=6, ∆Patent Flow median=0, ∆Publication Flow Median=0.5.
For all ventures that are VC-backed only, we calculate the median number of patents and publications at the time of VC investment (generally at year 1). Likewise, we calculate the median for CVC-backed ventures, which are typically funded around year 3. Then, we calculate the proportion of VC-backed ventures that fall into each of the four cells, and the corresponding proportions for the CVC-backed ventures. The number of observations on panels B and C drops because of right-censoring.
More Than Words
32
Table 5. Two-Stage Structural Models on Patents Flow and Publications Flow, at time of last observation of the data
5.1 5.2 5.3 5.4 Model (estimation technique)
Treatment-Effects (Maximum Likelihood)
Treatment-Effects (Maximum Likelihood)
Two-step structural model (bootstrap)
Two-step structural model (bootstrap)
First Stage, DV CVC CVC CVC CVC CVC Availability (Type) -2.63** -2.80*** -2.78*** -2.78***
(0.92) (0.32) (0.23) (0.26) Residuals First Stage -0.31** -0.54***
(0.11) (0.15)
No.Venture-Years 572 572 572 572 Wald test (H0: independence) 2.93† 8.37** a Linearly transformed for ease of interpretation. Unit: 10 patents, 10 publications; CVC_Size was divided by 100. b Winsorized (for convergence). Venture_Aget ≥13 is assigned a value of 13. Robust standard errors in parentheses *** p<0.001, ** p<0.01, * p<0.05, † p<0.10
More Than Words
33
Table 6. Treatment-effects models on the change in patent and publication flows: from t, at the time of the investment by the VC or CVC, to t+3.
Second Stage, DV ∆Publications ∆Patents CVC [H1, H3] 2.26* 5.16† (0.89) (3.01) ∆Patentsa 0.18
(0.15) ∆Publicationsa 0.35†
(0.19) Ageb -0.32** -0.17
(0.11) (0.11) Constant 2.67*** -0.52
(0.57) (1.03)
No.Venture-Yearsc 420 420 Wald test (H0: independence) 2.01 23.03***
a Linearly transformed for ease of interpretation. Unit: 10 patents, 10 publications; CVC_Size was divided by 100. b Winsorized (for convergence). Venture_Aget ≥13 is assigned a value of 13. c If the venture is CVC-backed, the investment reference is CVC; if not, then the reference is VC. Attrition is due to right censoring. Robust standard errors in parentheses *** p<0.001, ** p<0.01, * p<0.05, †p<0.10
More Than Words
34
Table 7. Poisson Panel Fixed-Effects regression on Patents and on Publications, estimated by quasi-maximum-likelihood
b 0.34* 0.33* 0.44 0.44 (0.15) (0.15) (0.33) (0.33)
Venture fixed-effects Yes Yes Yes Yes Year fixed-effects Yes Yes Yes Yes No.venture-years 3,391 3,295 3,471 3,380 No.ventures 445 431 448 436 Attrition in the fixed-effects models is due to: a) ventures with only one venture-year, or b) ventures with no change in Publications (Patents) drop from Publications (Patents) regressions. There are missing data in the CVC_SIC_Overlap and CVC_No_Overlap variables. a Linearly transformed for ease of interpretation. Unit: 10 publications or 10 patents, respectively. b Winsorized (for convergence). Venture_Aget ≥13 is assigned a value of 13. Robust standard errors in parentheses *** p<0.001, ** p<0.01, * p<0.05, † p<0.10
More Than Words
35
Table 8. Poisson Panel Fixed-Effects regression on Patents and on Publications, estimated by quasi-maximum-likelihood
Robust standard errors in parentheses *** p<0.001, ** p<0.01, * p<0.05, † p<0.10
More Than Words
36
REFERENCES
Acs ZJ, Audretsch DB. 1988. Innovation in large and small firms: An empirical analysis. American Economic Review 78(4): 678-690.
Acs ZJ, Morck R, Shaver JM, Yeung B. 1997. The internationalization of small and medium-sized enterprises: A policy perspective. Small Business Economics 9(1): 7-20.
Aghion P, Tirole J. 1994. The management of innovation. Quarterly Journal of Economics 1994(4): 1185-1207.
Agrawal A, Henderson R. 2002. Putting patents in context: Exploring knowledge transfer from MIT. Management Science 48(1): 44-60.
Ahuja G, Katila R. 2001. Technological acquisitions and the innovation performance of acquiring firms: A longitudinal study. Strategic Management Journal 22(3): 197-220.
Alcácer J, Zhao M. 2011. Local R&D strategies and multi-location firms: The role of internal linkages. Management Science In press.
Amit R, Glosten L, Muller E. 1990. Entrepreneurial ability, venture investments, and risk sharing. Management Science 36(10): 1232-1245.
Anton JJ, Yao DA. 1995. Start-ups, spin-offs, and internal projects. Journal of Law, Economics and Organization 11(2): 362-378.
Arora A, Gambardella A. 1994. Evaluating technological information and utilizing it: Scientific knowledge, technological capability, and external linkages in biotechnology. Journal of Economic Behavior and Organization 24(1): 91-114.
Azoulay P, Ding W, Stuart T. 2009. The impact of academic patenting on the rate, quality and direction of (public) research output. Journal of Industrial Economics 57(4): 637-676.
Basberg BL. 1987. Patents and the measurement of technological change: A survey of the literature. Research Policy 16(2): 131-141.
Berger AN, Miller NH, Petersen MA, Rajan RG, Stein JC. 2005. Does function follow organizational form? Evidence from the lending practices of large and small banks. Journal of Financial Economics 76(2): 237-269.
More Than Words
37
Block Z, MacMillan IC. 1993. Corporate venturing: Creating new business within the firm. Harvard Business School Press: Boston, MA.
Bottazzi L, Da Rin M, Hellmann T. 2008. Who are the active investors? Evidence from venture capital. Journal of Financial Economics 89: 488-512.
Brander JA, Amit R, Antweiler W. 2002. Venture-capital syndication: Improved venture selection vs. the value-added hypothesis. Journal of Economics and Management Strategy 11(3): 423-452.
Cameron AC, Trivedi PK. 2009. Microeconometrics using Stata. Stata Press: College Station, Texas.
Cockburn I, Henderson R. 1998. Absorptive capacity, coauthoring behavior, and the organization of research in drug discovery. Journal of Industrial Economics 46(2): 157-182.
Cockburn I, Henderson R, Stern S. 2002. Balancing incentives: The tension between basic and applied research, Boston University and NBER.
Cohen WM, Levinthal DA. 1989. Innovation and learning: The two faces of R&D. Economic Journal 99(397): 569-596.
Cohen WM, Levinthal DA. 1990. Absorptive capacity: A new perspective on learning and innovation. Administrative Science Quarterly 35(1): 128-152.
Cohen WM, Nelson RR, Walsh J. 2002. Links and impacts: The influence of public research on industrial R&D. Management Science 48(1): 1-23.
Dasgupta P, David PA. 1994. Toward a new economics of science. Research Policy 23(5): 487-521.
Dushnitsky G. 2011. Corporate venture capital in the twenty-first century: An integral part of firms' innovation toolkit.
Dushnitsky G, Lenox MJ. 2005a. When do firms undertake R&D by investing in new ventures? Strategic Management Journal 26(10): 947-965.
Dushnitsky G, Lenox MJ. 2005b. When do incumbents learn from entrepreneurial ventures? Corporate venture capital and investing firm innovation rates. Research Policy 34: 615-639.
Dushnitsky G, Lenox MJ. 2006. When does corporate venture capital investment create firm value? Journal of Business Venturing 21(6): 753.
More Than Words
38
Dushnitsky G, Shaver JM. 2009. Limitations to inter-organizational knowledge acquisition: The paradox of corporate venture capital. Strategic Management Journal.
Dyer JH, Singh H. 1998. The relational view: Cooperative strategy and sources of interorganizational competitive advantage. Academy of Management Review 23(4): 660-679.
Eckhardt JT, Shane S, Delmar F. 2006. Multistage selection and the financing of new ventures. Management Science 52(2): 220-232.
Faulkender M, Petersen MA. 2006. Does the source of capital affect capital structure? Review of Financial Studies 19(1): 45-79.
Furman JL, Stern S. 2011. Climbing atop the shoulders of giants: The impact of institutions on cumulative research. American Economic Review 101(5): 1933-1963.
Galambos L, Sturchio JL. 1998. Pharmaceutical firms and the transition to biotechnology: A study in strategic innovation. Business History Review 72(2): 250-278.
Galasso A, Simcoe TS. 2010. CEO overconfidence and innovation, University of Toronto.
Gambardella A. 1995. Science and innovation: The US pharmaceutical industry in the 1980s. Cambrdige University Press: Cambridge, UK.
Gans JS, Stern S. 2003. The product market and the market for “ideas”: Commercialization strategies for technology entrepreneurs. Research Policy 32: 333-350.
Gittelman M, Kogut B. 2003. Does good science lead to valuable knowledge? Biotechnology firms and the evolutionary logic of citation patterns. Management Science 49(4): 366-382.
Goldfarb B. 2008. The effect of government contracting on academic research: Does the source of funding affect scientific output? Research Policy 37(1): 41-58.
Goldfarb B, Marschke G, Smith A. 2009. Scholarship and inventive activtiy in the university: Complements or substitutes? Economics of Innovation and New Technology 18(8): 743-756.
Gompers PA. 1995. Optimal investment, monitoring, and the staging of venture capital. Journal of Finance 50(5): 1461-1489.
Gompers PA, Lerner J. 1998. The determinants of corporate venture capital success: Organizational structure, incentives and complementarities., National Bureau of Economic Research: Cambridge, MA.
More Than Words
39
Griliches Z. 1990. Patent statistics as economic indicators: A survey. Journal of Economic Literature 28(4): 1661-1707.
Guler I, Guillén MF. 2010. Home country networks and foreign expansion: Evidence from the venture capital industry. Academy of Management Journal 53(2): 390-410.
Hagedoorn J, Cloodt M. 2003. Measuring innovative performance: Is there an advantage in using multiple indicators? Research Policy 32: 1365-1379.
Hall BH. 2002. The financing of research and development. Oxford Review of Economic Policy 18(1): 35-51.
Hamel G. 1991. Competition for competence and interpartner learning within international strategic alliances. Strategic Management Journal 12(Summer): 83-103.
Hellmann T, Lindsey L, Puri M. 2008. Building relationships early: Banks in venture capital. Review of Financial Studies 21(2): 513-541.
Hellmann T, Puri M. 2002. Venture capital and the professionalization of start-up firms: Empirical evidence. Journal of Finance 57(1): 169-197.
Hsu DH, Ziedonis R. 2011. Strategic factor markets and the financing of technology startups: When do patents matter more as signaling devices? , The Wharton School: Philadelphia.
Huang KG, Murray F. 2009. Does patent strategy shape the long-run supply of public knowledge? Evidence from human genetics. Academy of Management Journal 52(6).
Katila R, Rosenberger JD, Eisenhardt KM. 2008. Swimming with sharks: Technology ventures, defense mechanisms and corporate relationships. Administrative Science Quarterly 53(2): 295-332.
Kortum S, Lerner J. 2000. Assessing the contribution of venture capital to innovation. RAND Journal of Economics 31(4): 674-692.
Kuhn TS. 1962. The structure of scientific revolutions. University of Chicago Press: Chicago, IL.
Lane PJ, Lubatkin M. 1998. Relative absorptive capacity and interorganizational learning. Strategic Management Journal 19(5): 461-477.
More Than Words
40
Larsen MT. 2011. The implciations of academic enterprise for public science: An overview of the empirical evidence. Research Policy 40(1): 6-19.
Levin RC, Klevorick AK, Nelson RR, Winter SG. 1987. Appropriating the returns from industrial research and development. Brookings Papers on Economic Activity 1987(3): 783-831.
Lim K. 2004. The relationship between research and innovation in the semiconductor and pharmaceutical industries (1981-1997). Research Policy 33(2): 287-321.
Mowery DC, Ziedonis AA. 2002. Academic patent quality and quantity before and after the Bayh-Dole act in the United States. Research Policy 31(3): 399-418.
Murray F, Stern S. 2007. Do formal intellectual property rights hinder the free flow of scientific knowledge? An empirical test of the anti-commons hypothesis. Journal of Economic Behavior and Organization 63(4): 648-687.
Pisano G. 1991. The governance of innovation: Vertical integration and collaborative arrangements in the biotechnology industry. Research Policy 20(3): 237-249.
Pisano G. 2006. Science business: The promise, the reality, and the future of biotech. Harvard Business School Press: Boston: Massachusetts.
Powell WW, Koput KW, Smith-Doerr L. 1996. Interorganizational collaboration and the locus of innovation: Networks of learning in biotechnology. Administrative Science Quarterly 41(1): 116-145.
Rosenberg N. 1990. Why do firms do basic research (with their own money)? Research Policy 19(2): 165-174.
Rothaermel FT, Thursby M. 2007. The nanotech versus the biotech revolution: Sources of productivity in incumbent firm research. Research Policy 36: 832-849.
Samila S, Sorenson O. 2010. Venture capital as a catalyst to commercialization. Research Policy 39(10): 1348-1360.
Sampson RC. 2007. R&D alliances and firm performance: The impact of technological diversity and alliance organization on innovation. Academy of Management Journal 50(2): 364-386.
Scotchmer S. 2004. Innovation and incentives. MIT Press: Cambridge, MA.
More Than Words
41
Shan W, Walker G, Kogut B. 1994. Interfirm cooperation and startup innovation in the biotechnology industry. Strategic Management Journal 15(5): 387-394.
Shane S. 2001. Technological opportunities and new firm creation. Management Science 47(2): 205-220.
Simcoe TS. 2007. XTPQML: Stata module to estimate Fixed-effects Poisson (Quasi-ML) regression with robust standard errors S456821 ed., Boston College Department of Economics.
Sørensen M. 2007. How smart is smart money? A two-sided matching model of venture capital. Journal of Finance 62(6): 2725-2762.
Sorenson O, Stuart T. 2001. Syndication networks and the spatial distribution of venture capital investments. American Journal of Sociology 106(6): 1546-1588.
Stern S. 2004. Do scientists pay to be scientists? Management Science 50(6): 835-853.
Stuart T, Hoang H, Hybels RC. 1999. Interorganizational endorsements and the performance of entrepreneurial ventures. Administrative Science Quarterly 44(2): 315-349.
Svensson R. 2007. Commericalization of patents and external finnacing during the R&D phase. Research Policy 36(7): 1052-1069.
Veugelers R. 1997. Internal R&D expenditures and external technology sourcing. Research Policy 36(3): 303-315.
Wadhwa A, Kotha S. 2006. Knowledge creation through external venturing: Evidence from the telecommunications equipment manufacturing industry. Academy of Management Journal 49(4): 819-835.
Wadhwa A, Phelps C, Kotha S. 2009. Learning from startups: Determinants of exploratory knowledge creation, Ecole Polytechnique Federale de Lausanne: Laussanne, Switzerland.
Wooldridge JM. 1997. Quasi-likelihood methods for count data. In Handbook of applied econometrics. Pesaran MH, Schmidt P (eds.), Blackwell: Oxford.
Zingales L. 2000. In search of new foundations. Journal of Finance 55(4): 1623-1653.
Zucker LG, Darby MR, Armstrong J. 2002. Commercializing knowledge: University science, knowledge capture, and firm performance in biotechnology. Management Science 48(1): 138-153.
More Than Words
42
Zucker LG, Darby MR, Brewer MB. 1998. Intellectual human capital and the birth of U.S. biotechnology enterprises. American Economic Review 88(4): 290-306.