137
Registered number: 2068222 Registered office: 25 Cabot Square Canary Wharf London E14 4QA MORGAN STANLEY & CO. INTERNATIONAL plc Report and financial statements 31 December 2012
Registered number: 2068222
Registered office:
25 Cabot Square
Canary Wharf
London E14 4QA
MORGAN STANLEY & CO. INTERNATIONAL plc
Report and financial statements
31 December 2012
MORGAN STANLEY & CO. INTERNATIONAL plc
CONTENTS PAGE
Directors' report 1
Independent auditor's report 14
Consolidated income statement 16
Consolidated statement of comprehensive income 17
Consolidated statement of changes in equity 18
Consolidated statement of financial position 19
Consolidated statement of cash flows 20
Notes to the consolidated financial statements 21
Company balance sheet 106
Notes to the company financial statements 107
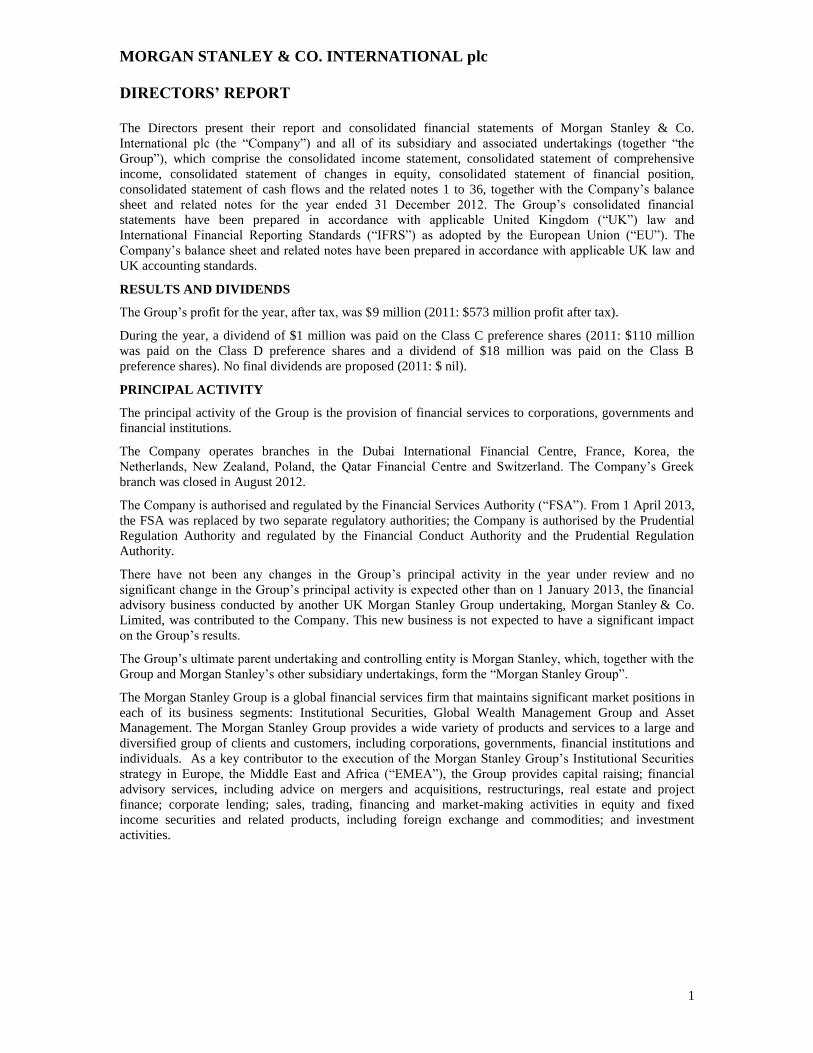
MORGAN STANLEY & CO. INTERNATIONAL plc
DIRECTORS’ REPORT
1
The Directors present their report and consolidated financial statements of Morgan Stanley & Co.
International plc (the “Company”) and all of its subsidiary and associated undertakings (together “the
Group”), which comprise the consolidated income statement, consolidated statement of comprehensive
income, consolidated statement of changes in equity, consolidated statement of financial position,
consolidated statement of cash flows and the related notes 1 to 36, together with the Company’s balance
sheet and related notes for the year ended 31 December 2012. The Group’s consolidated financial
statements have been prepared in accordance with applicable United Kingdom (“UK”) law and
International Financial Reporting Standards (“IFRS”) as adopted by the European Union (“EU”). The
Company’s balance sheet and related notes have been prepared in accordance with applicable UK law and
UK accounting standards.
RESULTS AND DIVIDENDS
The Group’s profit for the year, after tax, was $9 million (2011: $573 million profit after tax).
During the year, a dividend of $1 million was paid on the Class C preference shares (2011: $110 million
was paid on the Class D preference shares and a dividend of $18 million was paid on the Class B
preference shares). No final dividends are proposed (2011: $ nil).
PRINCIPAL ACTIVITY
The principal activity of the Group is the provision of financial services to corporations, governments and
financial institutions.
The Company operates branches in the Dubai International Financial Centre, France, Korea, the
Netherlands, New Zealand, Poland, the Qatar Financial Centre and Switzerland. The Company’s Greek
branch was closed in August 2012.
The Company is authorised and regulated by the Financial Services Authority (“FSA”). From 1 April 2013,
the FSA was replaced by two separate regulatory authorities; the Company is authorised by the Prudential
Regulation Authority and regulated by the Financial Conduct Authority and the Prudential Regulation
Authority.
There have not been any changes in the Group’s principal activity in the year under review and no
significant change in the Group’s principal activity is expected other than on 1 January 2013, the financial
advisory business conducted by another UK Morgan Stanley Group undertaking, Morgan Stanley & Co.
Limited, was contributed to the Company. This new business is not expected to have a significant impact
on the Group’s results.
The Group’s ultimate parent undertaking and controlling entity is Morgan Stanley, which, together with the
Group and Morgan Stanley’s other subsidiary undertakings, form the “Morgan Stanley Group”.
The Morgan Stanley Group is a global financial services firm that maintains significant market positions in
each of its business segments: Institutional Securities, Global Wealth Management Group and Asset
Management. The Morgan Stanley Group provides a wide variety of products and services to a large and
diversified group of clients and customers, including corporations, governments, financial institutions and
individuals. As a key contributor to the execution of the Morgan Stanley Group’s Institutional Securities
strategy in Europe, the Middle East and Africa (“EMEA”), the Group provides capital raising; financial
advisory services, including advice on mergers and acquisitions, restructurings, real estate and project
finance; corporate lending; sales, trading, financing and market-making activities in equity and fixed
income securities and related products, including foreign exchange and commodities; and investment
activities.
MORGAN STANLEY & CO. INTERNATIONAL plc
DIRECTORS’ REPORT
2
BUSINESS REVIEW
During 2012, global market and economic conditions improved modestly as European policymakers
became more determined in combating the region’s debt crisis and central bankers around the globe took a
number of actions to stimulate the economic recovery. Despite these improvements, global market and
economic conditions in 2012 were challenged by concerns about the ongoing European sovereign debt
crisis, the United States (“US”) “fiscal cliff” (i.e., the combination of expiring tax cuts and spending cuts on
or after 1 January 2013), the US federal debt ceiling and its potential adverse impact on the US economy,
and slowing economic growth in emerging markets.
These on-going conditions present difficulties and uncertainty for the business outlook that may adversely
impact the financial performance of the Group in the future.
In Europe, major equity market indices ended 2012 higher compared with the beginning of the year,
primarily due to investors’ optimism about Europe’s progress in addressing its sovereign debt crisis,
especially in Greece, Ireland, Italy, Portugal and Spain (the “European Peripherals”), and the sovereign
debt exposures in the European banking system. In the euro-area, gross domestic product declined in 2012
and the unemployment rate increased to 11.7% at 31 December 2012 from 10.4% at 31 December 2011.
At 31 December 2012, the European Central Bank’s (“ECB”) benchmark interest rate was 0.75%
(2011: 0.5%). The Bank of England’s (“BOE”) benchmark interest rate was 0.5% and was unchanged from
a year ago. To inject further monetary stimulus into the economy in the UK, the BOE increased the size of
its quantitative easing program on two separate occasions in 2012. In 2012, the ECB conducted its second
three-year refinancing operation and widened the pool of eligible collateral for refinancing operations to
ease funding conditions for euro-area banks. In addition, EU leaders agreed on a new bailout and debt-
restructuring agreement designed to reduce Greece’s debt and reached another agreement to ease the
recapitalisation of struggling European banks. In September 2012, the ECB outlined the details of a plan to
buy euro-area government bonds and reiterated its pledge to preserve the euro. In December 2012, EU
finance ministers reached an agreement to bring many of the continent’s banks under a single supervisor.
Despite these actions, several major rating agencies downgraded the credit ratings for some euro-zone
countries, and some EU member countries, such as Italy and Spain, entered into a technical recession (two
consecutive quarters of negative change in gross domestic product) in 2012.
In response to the ongoing uncertainties in Europe the Group has continued to reduce its net exposure to
European Peripherals. At 31 December 2012, exposure before hedges to European peripheral countries was
$3,373 million (2011: $5,893 million) and the net exposure after hedges was $2,719 million
(2011: $4,806 million). Details of the country risk exposures to European Peripherals are provided on
page 6 of the Directors’ Report.
The consolidated income statement for the year is set out on page 16. The Group’s profit after tax for the
year decreased by $564 million to $9 million, a decrease of 98% compared to the year ended
31 December 2011.
The Group’s revenues are best reviewed across the aggregate of ‘Net gains on financial instruments
classified as held for trading’, ‘Net gains on financial instruments designated at fair value through profit or
loss’, ‘Net gains on available-for-sale financial assets’, ‘Interest income’, ‘Interest expense’ and ‘Other
income’ (“aggregate revenues”). Aggregate revenues for the year declined by 10% to $3,674 million
compared to $4,092 million in 2011.
Investment banking revenues during the year were lower compared to 2011, reflecting lower revenues from
advisory and underwriting transactions.
Equity sales and trading revenues decreased during the year compared to 2011, despite reflecting an accrual
for expected reimbursement from clients on certain equity transactions (see note 6). The decrease was
driven by lower core and portfolio equity products revenues as well as by negative revenues related to
changes in the fair value of net derivative contracts and on borrowings that are measured at fair value
attributable to the tightening of Morgan Stanley’s credit default swap spreads. This was partly offset by an
increase in equity derivative products revenues.
MORGAN STANLEY & CO. INTERNATIONAL plc
DIRECTORS’ REPORT
3
BUSINESS REVIEW (CONTINUED)
Revenues within fixed income and commodities sales and trading decreased during the year compared to
2011. Results in 2012 included negative revenues from the impact of the tightening of Morgan Stanley’s
debt-related credit spreads on borrowings that are measured at fair value, as well as reduced revenues on
credit derivative products and non-core fixed income products. This was partially offset by increased
revenues in interest rate, foreign exchange, corporate debt, securitised and commodity products.
Aggregate revenues for the year exclude net day one gains of $141 million not recognised upon initial
recognition of financial instruments measured at fair value where valuation techniques include
unobservable market data (2011: $307 million).
Other expense increased from $3,293 million in 2011 to $3,402 million in 2012 mainly driven by increased
management charges from other Morgan Stanley Group undertakings relating to other services, partially
offset by decreases in brokerage fees and administration and corporate services expenses.
The Group’s effective tax rate for the year was 96% compared to 31% for the prior year, driven by a non-
UK capital gains tax provision and the impact of group relief. See note 8 for further details.
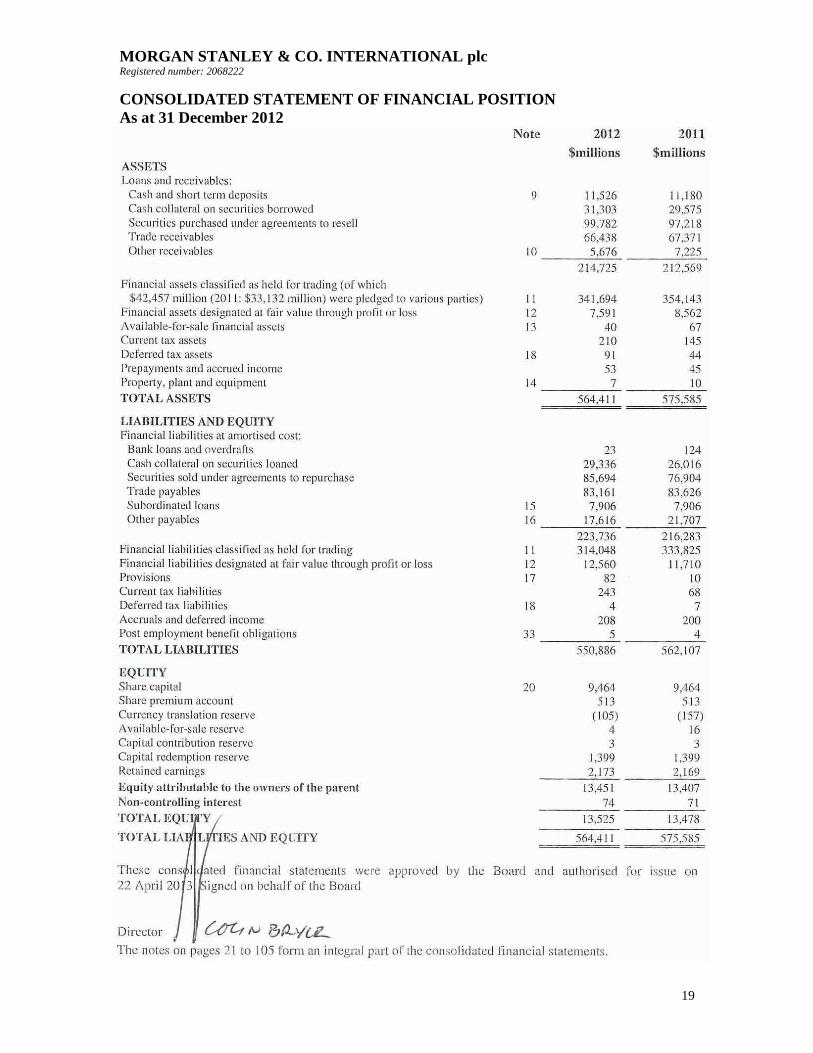
The consolidated statement of financial position presented on page 19 reflects decreases in the Group’s
total assets and total liabilities of $11,174 million and $11,221 million respectively, a decrease of 2% as at
31 December 2012 when compared to 31 December 2011. The decrease in total assets is mainly driven by a
decrease in financial assets classified as held for trading of $12,449 million. The decrease in total liabilities
is driven by reductions in financial liabilities classified as held for trading of $19,777 million and in other
payables of $4,091 million partially offset by increases in cash collateral on securities loaned and securities
sold under agreements to repurchase of $12,110 million. The decrease in financial assets and liabilities held
for trading is primarily driven by reduced derivative positions.
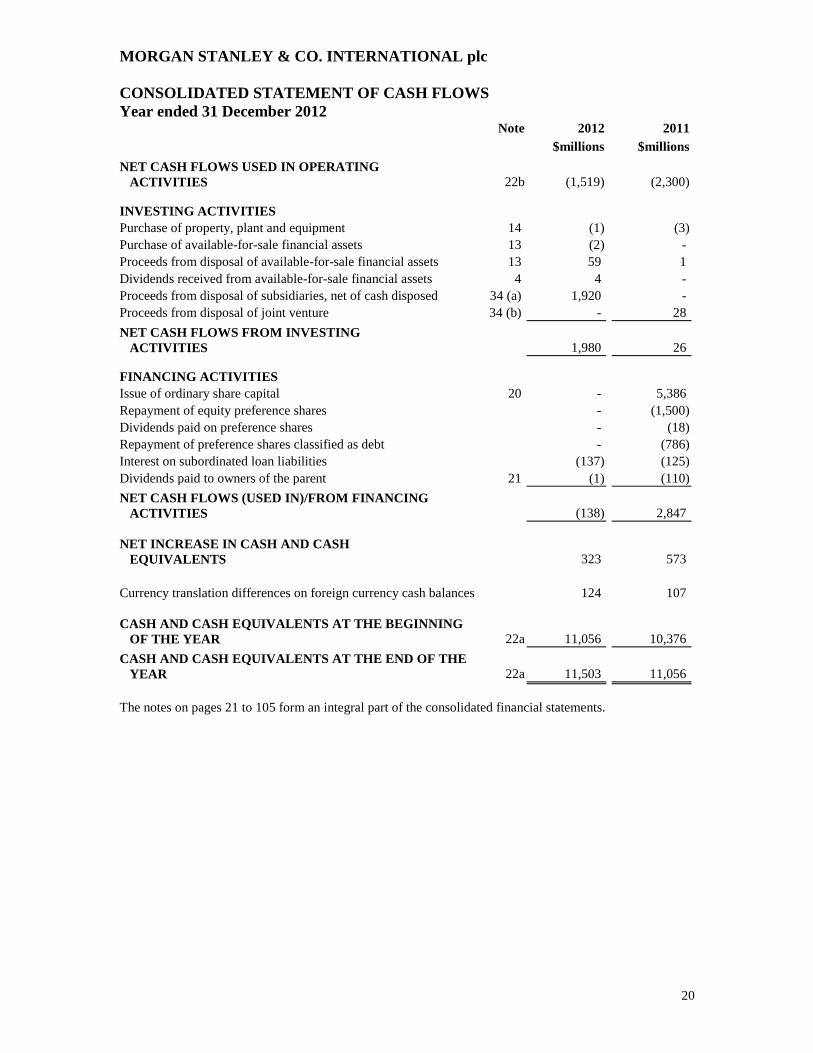
The consolidated statement of cash flows presented on page 20 shows a net increase in cash of $323 million
during the year (2011: net increase of $573 million). Net cash flows used in operating activities was
$1,519 million (2011: $2,300 million), offset by proceeds from disposal of subsidiaries and available-for-
sale financial assets amounting to $1,979 million. Interest paid on subordinated debt was $137 million
(2011: $125 million).
The performance of the Group is included in the results of the Morgan Stanley Group which are disclosed
in the Morgan Stanley Group’s Annual Report on Form 10-K to the United States Securities and Exchange
Commission. The Morgan Stanley Group manages its key performance indicators on a global basis but in
consideration of individual legal entities. For this reason, the Group’s Directors believe that providing
further performance indicators for the Group itself would not enhance an understanding of the
development, performance or position of the business of the Group.
The risk management section below sets out the Group's and the Morgan Stanley Group's policies for the
management of liquidity and cash flow risk and other significant business risks.
Risk management
Risk is an inherent part of both Morgan Stanley’s and the Group’s business activity and is managed by the
Group within the context of the broader Morgan Stanley Group’s business activities. The Morgan Stanley
Group seeks to identify, assess, monitor and manage each of the various types of risk involved in its
activities on a global basis, in accordance with defined policies and procedures and in consideration of the
individual legal entities.
Note 25 to the consolidated financial statements provides qualitative and quantitative disclosures about the
Group’s management of and exposure to financial risks.
MORGAN STANLEY & CO. INTERNATIONAL plc
DIRECTORS’ REPORT
4
BUSINESS REVIEW (CONTINUED)
Risk management (continued)
Market risk
Market risk refers to the risk that a change in the level of one or more market prices, rates, indices, implied
volatilities (the price volatility of the underlying instrument imputed from option prices), correlations or
other market factors, such as liquidity, will result in losses for a position or portfolio.
The Morgan Stanley Group manages the market risk associated with its trading activities on a global basis,
at both a trading division and an individual product level, which includes consideration of market risk for
each individual legal entity.
The Group has enhanced its VaR model during 2012 to make it more responsive to current market
conditions while maintaining a longer-term perspective. This enhancement is consistent with regulatory
requirements. The current VaR model estimates are lower than the VaR estimates produced under the
previously used model because the prior model places more emphasis on the large market moves
experienced during the 2008 financial crisis, while the current model places more emphasis on more recent
volatility, which has been generally lower.
Under the current VaR model, the Group’s average VaR for Primary Risk Categories for 2012 was
$24 million compared with $31 million under the previous model. The period end VaR was $21 million
while it was $26 million under the previous model. The average Credit Portfolio VaR for 2012 was
$14 million compared with $16 million under the previous model. The average total trading VaR for 2012
was $30 million compared with $38 million under the previous model.
Under the previous VaR model, the Group’s average VaR for Primary Risk Categories for 2012 was
$31 million compared with $43 million for 2011. The decrease in average VaR for Primary Risk
Categories is primarily due to reduced risk taking in fixed income products. The average Credit Portfolio
VaR for 2012 was $16 million compared with $21 million for 2011. The decrease in the average VaR over
the year was from decreased counterparty exposure during 2012. The average total trading VaR for 2012
was $38 million compared with $54 million for 2011.
Credit risk
Credit risk refers to the risk of loss arising when a borrower, counterparty or issuer does not meet its
obligations.
The Morgan Stanley Group manages credit risk exposure on a global consolidated basis as well as giving
consideration to individual legal entities. It does this by ensuring transparency of material credit risks,
ensuring compliance with established limits, approving material extensions of credit, escalating risk
concentrations to appropriate senior management and mitigating credit risk through the use of collateral and
other arrangements.
Country risk exposure
The Morgan Stanley Group and the Group have exposure to country risk. Country risk exposure is the risk
that events within a country, such as currency crises, regulatory changes and other political events, will
adversely affect the ability of the sovereign government and/or obligors within the country to honour their
obligations to the Group.
MORGAN STANLEY & CO. INTERNATIONAL plc
DIRECTORS’ REPORT
5
BUSINESS REVIEW (CONTINUED)
Risk management (continued)
Country risk exposure (continued)
Country risk exposure is measured in accordance with the Morgan Stanley Group and the Group’s internal
risk management standards and includes obligations from sovereign governments, corporations, clearing
houses and financial institutions. The Morgan Stanley Group and the Group actively manage country risk
exposure through a comprehensive risk management framework that combines credit and market
fundamentals as well as scenario analysis, and allows the Group to effectively identify, monitor and limit
country risk. Country risk exposure before and after hedges is monitored and managed, with stress testing
and scenario analysis conducted on a continuous basis, to identify exposure concentrations, wrong way risk
(the risk that occurs when exposure to a counterparty is adversely correlated with the credit quality of that
counterparty) and the impact of idiosyncratic events. In addition, indirect exposures are identified through
the Group’s counterparty credit analysis as having a vulnerability or exposure to another country or
jurisdiction. Examples of such counterparties include: mutual funds that invest in a single country, offshore
companies whose assets reside in another country to that of the offshore jurisdiction and finance company
subsidiaries of corporations. The outcome of such identification can result in a reclassification of country
risk, amendment of counterparty limits or exposure mitigation. The Group reduces its country risk exposure
through the effect of risk mitigants, such as netting agreements with counterparties that permit the Group to
offset receivables and payables with such counterparties, obtaining collateral from counterparties, and by
hedging.
The Group’s country risk exposure, including the effect of the risk mitigants as at 31 December 2012 is
shown across the following two tables. The basis for determining the domicile of the exposure is based on
the country of jurisdiction for the obligor or guarantor, factors such as physical location of operations or
assets, location and source of cash flows/revenues, and location of collateral (if applicable). Credit Default
Swaps (“CDSs”) are incorporated in the exposure where protection is both purchased and sold.
The Group’s sovereign exposures consist of financial instruments entered into with sovereign and local
governments. Its non-sovereign exposures comprise exposures to corporations, clearing houses and
financial institutions.
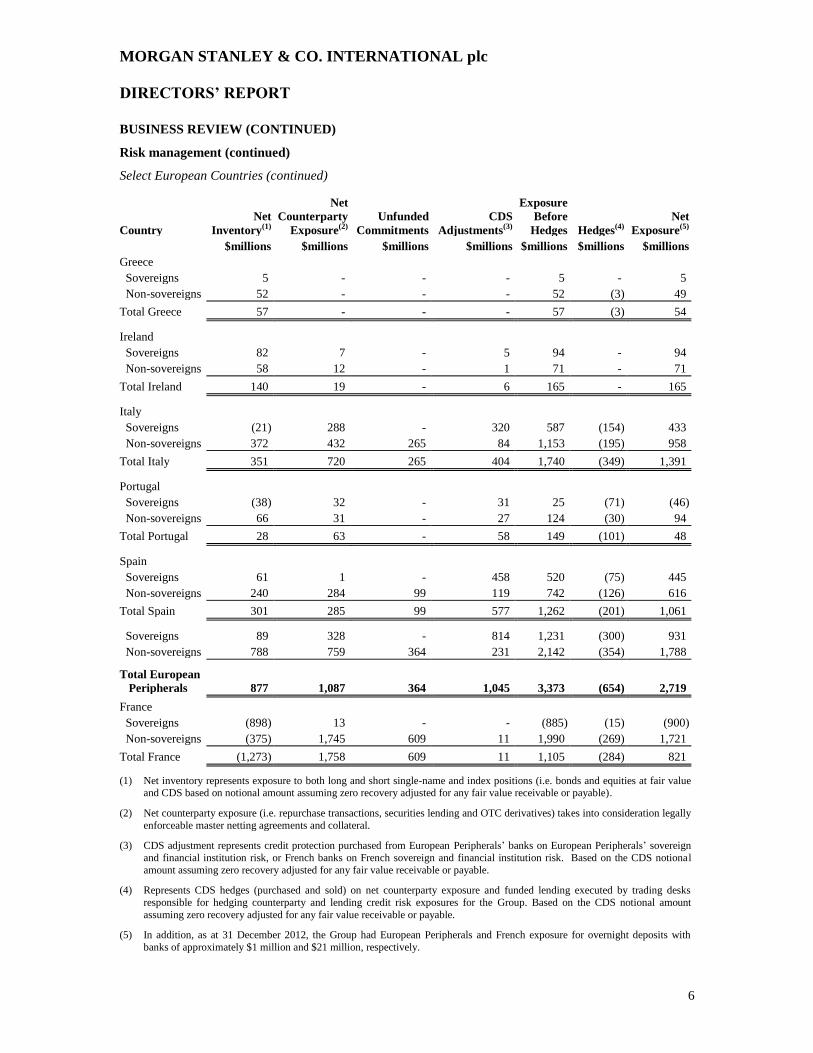
Select European Countries
In connection with certain of its Institutional Securities business segment activities, the Group has country
risk exposure to many foreign countries. During the year ended 31 December 2012, the European
Peripherals and France continued to experience varying degrees of credit deterioration due to weaknesses in
their economic and fiscal situations.
The following table shows the Group’s country risk exposure to European Peripherals and France at
31 December 2012. The majority of the financial instruments included in the table below are classified as
held for trading and are measured at fair value or are collateralised borrowings or lendings. As a result, the
Group does not have any recognised impairment on the financial instruments included in its country risk
exposure to European Peripherals and France. Exposure to other Morgan Stanley Group undertakings has
been excluded from the table below.
MORGAN STANLEY & CO. INTERNATIONAL plc
DIRECTORS’ REPORT
6
BUSINESS REVIEW (CONTINUED)
Risk management (continued)
Select European Countries (continued)
Country Net
Inventory(1)
Net
Counterparty
Exposure(2) Unfunded
Commitments CDS
Adjustments(3)
Exposure
Before
Hedges Hedges(4)
Net
Exposure(5) $millions $millions $millions $millions $millions $millions $millions
Greece
Sovereigns 5 - - - 5 - 5
Non-sovereigns 52 - - - 52 (3) 49
Total Greece 57 - - - 57 (3) 54
Ireland
Sovereigns 82 7 - 5 94 - 94
Non-sovereigns 58 12 - 1 71 - 71
Total Ireland 140 19 - 6 165 - 165
Italy
Sovereigns (21) 288 - 320 587 (154) 433
Non-sovereigns 372 432 265 84 1,153 (195) 958
Total Italy 351 720 265 404 1,740 (349) 1,391
Portugal
Sovereigns (38) 32 - 31 25 (71) (46)
Non-sovereigns 66 31 - 27 124 (30) 94
Total Portugal 28 63 - 58 149 (101) 48
Spain
Sovereigns 61 1 - 458 520 (75) 445
Non-sovereigns 240 284 99 119 742 (126) 616
Total Spain 301 285 99 577 1,262 (201) 1,061
Sovereigns 89 328 - 814 1,231 (300) 931
Non-sovereigns 788 759 364 231 2,142 (354) 1,788
Total European
Peripherals 877 1,087 364 1,045 3,373 (654) 2,719
France
Sovereigns (898) 13 - - (885) (15) (900)
Non-sovereigns (375) 1,745 609 11 1,990 (269) 1,721
Total France (1,273) 1,758 609 11 1,105 (284) 821
(1) Net inventory represents exposure to both long and short single-name and index positions (i.e. bonds and equities at fair value and CDS based on notional amount assuming zero recovery adjusted for any fair value receivable or payable).
(2) Net counterparty exposure (i.e. repurchase transactions, securities lending and OTC derivatives) takes into consideration legally
enforceable master netting agreements and collateral.
(3) CDS adjustment represents credit protection purchased from European Peripherals’ banks on European Peripherals’ sovereign
and financial institution risk, or French banks on French sovereign and financial institution risk. Based on the CDS notional
amount assuming zero recovery adjusted for any fair value receivable or payable.
(4) Represents CDS hedges (purchased and sold) on net counterparty exposure and funded lending executed by trading desks
responsible for hedging counterparty and lending credit risk exposures for the Group. Based on the CDS notional amount
assuming zero recovery adjusted for any fair value receivable or payable.
(5) In addition, as at 31 December 2012, the Group had European Peripherals and French exposure for overnight deposits with
banks of approximately $1 million and $21 million, respectively.
MORGAN STANLEY & CO. INTERNATIONAL plc
DIRECTORS’ REPORT
7
BUSINESS REVIEW (CONTINUED)
Risk management (continued)
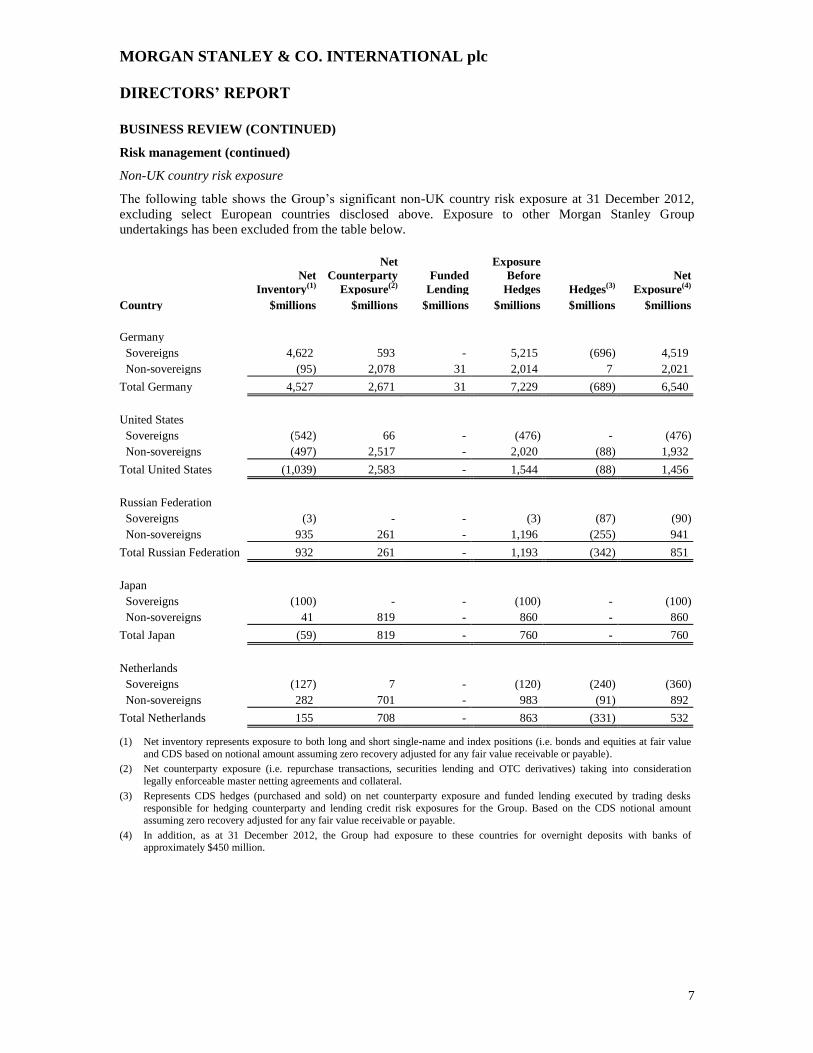
Non-UK country risk exposure
The following table shows the Group’s significant non-UK country risk exposure at 31 December 2012,
excluding select European countries disclosed above. Exposure to other Morgan Stanley Group
undertakings has been excluded from the table below.
Net
Inventory(1)
Net
Counterparty
Exposure(2) Funded
Lending
Exposure
Before
Hedges Hedges(3)
Net
Exposure(4)
Country $millions $millions $millions $millions $millions $millions
Germany
Sovereigns 4,622 593 - 5,215 (696) 4,519
Non-sovereigns (95) 2,078 31 2,014 7 2,021
Total Germany 4,527 2,671 31 7,229 (689) 6,540
United States
Sovereigns (542) 66 - (476) - (476)
Non-sovereigns (497) 2,517 - 2,020 (88) 1,932
Total United States (1,039) 2,583 - 1,544 (88) 1,456
Russian Federation
Sovereigns (3) - - (3) (87) (90)
Non-sovereigns 935 261 - 1,196 (255) 941
Total Russian Federation 932 261 - 1,193 (342) 851
Japan
Sovereigns (100) - - (100) - (100)
Non-sovereigns 41 819 - 860 - 860
Total Japan (59) 819 - 760 - 760
Netherlands
Sovereigns (127) 7 - (120) (240) (360)
Non-sovereigns 282 701 - 983 (91) 892
Total Netherlands 155 708 - 863 (331) 532
(1) Net inventory represents exposure to both long and short single-name and index positions (i.e. bonds and equities at fair value
and CDS based on notional amount assuming zero recovery adjusted for any fair value receivable or payable).
(2) Net counterparty exposure (i.e. repurchase transactions, securities lending and OTC derivatives) taking into consideration
legally enforceable master netting agreements and collateral.
(3) Represents CDS hedges (purchased and sold) on net counterparty exposure and funded lending executed by trading desks
responsible for hedging counterparty and lending credit risk exposures for the Group. Based on the CDS notional amount assuming zero recovery adjusted for any fair value receivable or payable.
(4) In addition, as at 31 December 2012, the Group had exposure to these countries for overnight deposits with banks of approximately $450 million.
MORGAN STANLEY & CO. INTERNATIONAL plc
DIRECTORS’ REPORT
8
BUSINESS REVIEW (CONTINUED)
Risk management (continued)
Liquidity and capital resources
Liquidity and funding risk refers to the risk that the Group will be unable to meet its funding obligations in
a timely manner. Liquidity risk stems from the potential risk that the Group will be unable to obtain
necessary funding through borrowing money at favourable interest rates or maturity terms, or selling assets
in a timely manner and at a reasonable price.
The primary goal of the Morgan Stanley Group’s liquidity risk management framework is to ensure that the
Morgan Stanley Group, including the Group, have access to adequate funding across a wide range of
market conditions. The framework is designed to enable the Group to fulfil its financial obligations and
support the execution of the Group’s business strategies. The Group’s capital management framework is
further described in note 31.
Morgan Stanley continues to actively manage its capital and liquidity position to ensure adequate resources
are available to support the activities of the Morgan Stanley Group, including the Group, to enable the
Morgan Stanley Group to withstand market stresses, and to meet regulatory stress testing requirements
proposed by regulators globally. The Morgan Stanley Group uses Liquidity Stress Tests to model liquidity
outflows across multiple scenarios over a range of time horizons. These scenarios contain various
combinations of idiosyncratic and systemic stress events.
On 21 June 2012, Moody’s Investor Services announced the conclusion of an industry-wide reassessment
and revised ratings for 15 global capital markets banks. The Morgan Stanley Group’s long- and short- term
debt ratings were lowered two notches to Baa1/P-2 from A2/P-1, and a negative outlook was assigned.
While certain aspects of a credit ratings downgrade are quantifiable pursuant to contractual provisions, the
impact it will have on the Morgan Stanley Group’s business and results of operation in future periods is
inherently uncertain and will depend on a number of inter-related factors, including among others, the
magnitude of the downgrade, individual client behaviour and future mitigating actions the Morgan Stanley
Group may take. The liquidity impact of additional collateral requirements is included in the Morgan
Stanley Group’s Liquidity Stress Tests.
Operational risk
Operational risk refers to the risk of financial or other loss, or potential damage to the Group’s or the
Morgan Stanley Group’s reputation, resulting from inadequate or failed internal processes, people,
resources and systems or from other external events (e.g. fraud, legal and compliance risks, damage to
physical assets, etc.). Legal, regulatory and compliance risk is included in the scope of operational risk and
is discussed below under “Legal, regulatory and compliance risk”.
The Group’s business is highly dependent on the ability to process, on a daily basis, a large number of
transactions across numerous and diverse markets in many currencies. In general, the transactions
processed are increasingly complex. The Group relies on the ability of the Morgan Stanley Group’s
employees, its internal systems, and systems at technology centres operated by unaffiliated third parties to
process a high volume of transactions.
The Group also faces the risk of operational failure or termination of any of the clearing agents, exchanges,
clearing houses or other financial intermediaries it uses to facilitate securities transactions. In the event of a
breakdown or improper operation of the Group’s or a third party’s systems or improper or unauthorised
action by third parties or the Morgan Stanley Group’s employees, the Group could suffer financial loss, an
impairment to its liquidity, a disruption of its businesses, regulatory sanctions or damage to its reputation.
MORGAN STANLEY & CO. INTERNATIONAL plc
DIRECTORS’ REPORT
9
BUSINESS REVIEW (CONTINUED)
Risk management (continued)
Operational risk (continued)
The Group’s operations rely on the secure processing, storage and transmission of confidential and other
information in its computer systems. Like other financial services firms, we have been and continue to be
subject to unauthorised access, mishandling or misuse, computer viruses and other events. Events such as
these could have a security impact on the Group’s systems and jeopardise the Group’s or the Group’s
clients’ or counterparties’ personal, confidential, proprietary or other information processed and stored in,
and transmitted through, the Group’s computer systems. Furthermore, such events could cause
interruptions or malfunctions in the Group’s, the Group’s clients’, the Group’s counterparties’ or third
parties’ operations, which could result in reputational damage, litigation or regulatory fines or penalties not
covered by insurance maintained by the Group, or adversely affect the business, financial condition or
results of operations.
The Morgan Stanley Group has established an operational risk management process that operates on a
global and regional basis to identify, measure, monitor and control risk. Effective operational risk
management is essential to reducing the impact of operational risk incidents and mitigating legal,
regulatory, and reputational risks.
Legal, regulatory and compliance risk
Legal risk includes the risk of exposure to fines, penalties, judgements, damages and/or settlements in
connection with regulatory or legal actions as a result of non-compliance with applicable legal or regulatory
requirements and standards or litigation. Legal risk also includes contractual and commercial risk such as
the risk that a counterparty’s performance obligations will be unenforceable. The Morgan Stanley Group is
generally subject to extensive regulation in the different jurisdictions in which it conducts its business. In
the current environment of rapid and possibly transformational regulatory change, the Morgan Stanley
Group also views regulatory change as a component of legal risk.
The Morgan Stanley Group has established procedures based on legal and regulatory requirements on a
worldwide basis that are designed to foster compliance with applicable statutory and regulatory
requirements. The Morgan Stanley Group, principally through the Legal and Compliance Division, also
has established procedures that are designed to require that the Morgan Stanley Group’s policies relating to
business conduct, ethics and practices are followed globally. In connection with its businesses, the Morgan
Stanley Group has and continuously develops various procedures addressing issues such as regulatory
capital requirements, sales and trading practices, new products, information barriers, potential conflicts of
interest, structured transactions, use and safekeeping of customer funds and securities, lending and credit
granting, anti-money laundering, privacy and recordkeeping. In addition, the Morgan Stanley Group has
established procedures to mitigate the risk that a counterparty’s performance obligations will be
unenforceable, including consideration of counterparty legal authority and capacity, adequacy of legal
documentation, the permissibility of a transaction under applicable law and whether applicable bankruptcy
or insolvency laws limit or alter contractual remedies. The legal and regulatory focus on the financial
services industry presents a continuing business challenge for the Morgan Stanley Group.
Significant changes in the way that major financial services institutions are regulated are occurring in the
United Kingdom (“UK”), Europe, the US and worldwide. The reforms being discussed and, in some cases,
already implemented, include several that contemplate comprehensive restructuring of the regulation of the
financial services industry. Such measures will likely lead to stricter regulation of financial institutions
generally, and heightened prudential requirements for systemically important firms in particular. Such
measures could include taxation of financial transactions, liabilities and employee compensation as well as
reforms of the over-the-counter (“OTC”) derivatives markets, such as mandated exchange trading and
clearing, position limits, margin, capital and registration requirements. Changes in tax legislation in the
UK and worldwide, such as taxation of financial transactions, liabilities and employees compensation, are
also possible.
MORGAN STANLEY & CO. INTERNATIONAL plc
DIRECTORS’ REPORT
10
BUSINESS REVIEW (CONTINUED)
Risk management (continued)
Many of these reforms, if enacted, may materially affect the Group’s and the Morgan Stanley Group’s
business, financial condition, results of operations and cash flows in the future.
Basel II Pillar 3 disclosures
The disclosures made in order to comply with the FSA's rules, which implement in the UK the EU
Directives underlying the revised capital adequacy framework, are available on the Morgan Stanley
website.
Going Concern
Business risks associated with the uncertain market and economic conditions are being monitored and
managed by the Morgan Stanley Group and the Group. Retaining sufficient liquidity and capital to
withstand these market pressures remains central to the Morgan Stanley Group’s and the Group’s strategy.
In particular, the Morgan Stanley Group’s capital is deemed sufficient to exceed the minimum capital ratio
under the most negative stressed scenario reviewed by the US Federal Reserve.
Taking all of these factors into consideration, the Directors believe it is reasonable to assume that the Group
will have access to adequate resources to continue in operational existence for the foreseeable future.
Accordingly they continue to adopt the going concern basis in preparing the annual report and financial
statements.
DIRECTORS
The following Directors held office throughout the year and to the date of approval of this report (except
where otherwise shown):
P Bailas (ceased to be a director on 18 September 2012)
C D S Bryce
L G P M Francois (resigned 16 March 2012)
Sir E J W Gieve (appointed 1 October 2012)
T C Kelleher (Chairman)
N Nandra (appointed 20 March 2013 and resigned 16 April 2013)
F R Petitgas
I Plenderleith
R Rooney
D A Russell
C E Woodman
DIRECTORS’ AND OFFICERS’ LIABILITY INSURANCE
Directors’ and Officers’ Liability Insurance is taken out by Morgan Stanley, the Group’s ultimate parent
undertaking, for the benefit of the Directors and Officers of the Company and its subsidiaries.
DIRECTORS’ INDEMNITY
Qualifying third party indemnity provisions (as defined in section 234 of the Companies Act 2006) were in
force during the year and up to and including the date of the Director's report for the benefit of the Directors
of the Group.
MORGAN STANLEY & CO. INTERNATIONAL plc
DIRECTORS’ REPORT
11
AUDIT COMMITTEE
Morgan Stanley International Limited (“MSI”), the Company’s ultimate UK parent undertaking, has an
Audit Committee which assists the Boards of MSI, the Company, other MSI regulated subsidiary
undertakings and certain other Morgan Stanley Group undertakings in meeting their responsibilities in
ensuring an effective system of internal control and compliance, and in meeting their external financial
reporting obligations. The Audit Committee meets regularly and reports to the MSI Board on a quarterly
basis.
EMPLOYEES
Both the Group and the Morgan Stanley Group place considerable value on the investment in their
employees and have continued their practice of keeping employees informed on matters affecting them.
Employees are encouraged to present their suggestions and views on Morgan Stanley Group’s performance
to management and employees participate directly in the success of the business through Morgan Stanley
Group’s various compensation incentive plans.
Every effort is also made to ensure that disabled applicants, or those existing employees who are disabled
or may have become disabled, are treated as fairly as possible on terms comparable with those of other
employees. Appropriate training is arranged for disabled persons, including retraining for alternative work
for employees who become disabled, to promote their career development within the organisation.
EMPLOYEE REMUNERATION
The Group employs staff directly through branches of the Company, in addition to utilising staff employed
by other Morgan Stanley Group undertakings. The Group’s policies are comparable and consistent with
those of Morgan Stanley Group, which include the deferral of significant portions of certain key
employees’ discretionary compensation. Note 32 to the consolidated financial statements provides
additional information and disclosure regarding the Group’s compensation policies.
EVENTS AFTER THE REPORTING DATE
Contribution of business from Morgan Stanley & Co. Limited
On 1 January 2013, the financial advisory business conducted by another Morgan Stanley Group
undertaking, Morgan Stanley & Co. Limited, was contributed to the Company. This new business is not
expected to have a significant impact on the Group’s results.
FSA Core Group
In accordance with the FSA’s Core Group regulations, on 27 March 2013, the Company entered into a
Deed of Agreement ("the agreement") whereby certain other Morgan Stanley Group undertakings, known
collectively as the Contributing Entities, undertook to provide additional capital resources to the Company
and certain Morgan Stanley Group undertakings registered with the FSA (collectively the ‘Authorised
Firms’) if required in compliance with the regulatory requirements applicable to the members of a core UK
group.
In the event that the capital resources of the Company were to fall below its capital requirements as
determined by the FSA, the agreement gives the Company the unilateral right to demand a contribution of
capital resources from the Contributing Entities, in order to meet its capital requirements.
The amount of the contribution is limited to the Contributing Entities’ surplus capital, to the extent that
such capital is not required to repay that company’s liabilities, as defined in the agreement. The capital
resources may be provided in the form of a subscription and payment for shares or other capital
instruments; to the extent legally permissible through payment of dividends or other distributions of capital
resources or through such other legally permissible means as may be determined to be appropriate.
Entering into the agreement did not result in any adjustments to the Group’s consolidated statement of
financial position at 31 December 2012. The agreement will remain in force while the Company is an
Authorised Firm in Morgan Stanley's UK core group, as determined for regulatory purposes, subject to
earlier termination in certain circumstances.
MORGAN STANLEY & CO. INTERNATIONAL plc
DIRECTORS’ REPORT
12
POLICY AND PRACTICE ON PAYMENT OF CREDITORS
It is the Group’s and the Company’s policy that payments to suppliers are made in accordance with those
terms and conditions agreed between the Group or the Company and its suppliers, providing that all trading
terms and conditions have been complied with.
The Group’s and the Company’s trade creditors balance is comprised primarily of unsettled securities
transactions with exchanges, clearing houses, market counterparties, individual investors and other Morgan
Stanley Group undertakings. It is the Group’s and the Company’s policy that these transactions are settled
in accordance with the standard terms of the relevant exchange or market and disclosure of creditor days is
not considered a relevant measure.
AUDITOR
Deloitte LLP have expressed their willingness to continue in office as auditor of the Group and a resolution
to re-appoint them will be proposed at the forthcoming annual general meeting.
Statement as to disclosure of information to the auditor
Each of the persons who are Directors of the Company at the date when this report is approved confirms
that: so far as each of the Directors is aware, there is no relevant audit information (being information
needed by the Group’s auditor in connection with preparing their report) of which the Group 's auditor
is unaware; and
each of the Directors has taken all the steps that he/she ought to have taken as a Director to make
himself/ herself aware of any relevant audit information and to establish that the Group's auditor is
aware of that information.
MORGAN STANLEY & CO. INTERNATIONAL plc
DIRECTORS’ REPORT
13
DIRECTORS’ RESPONSIBILITIES STATEMENT
The Directors are responsible for preparing their report and the financial statements in accordance with
applicable law and regulations.
Company law requires the Directors to prepare financial statements for each financial year. Under that law
the Directors have prepared the financial statements in accordance with IFRSs as adopted by the EU and
Article 4 of the International Accounting Standards (“IAS”) Regulation. Under company law the Directors
must not approve the accounts unless they are satisfied that they give a true and fair view of the state of
affairs of the Group and of the profit or loss of the Group for that period.
In preparing the Group financial statements, the Directors are required by IAS 1 ‘Presentation of financial
statements’ (“IAS 1”) to:
(a) properly select and apply accounting policies;
(b) present information, including accounting policies, in a manner that provides relevant, reliable,
comparable and understandable information;
(c) provide additional disclosures when compliance with the specific requirements in IFRSs is
insufficient to enable users to understand the impact of particular transactions, other events and
conditions on the entity’s financial position and financial performance; and
(d) make an assessment of the Group’s ability to continue as a going concern.
In preparing the Company financial statements the Directors are required to:
(a) select suitable accounting policies and then apply them consistently;
(b) make judgements and estimates that are reasonable and prudent;
(c) state whether applicable UK Accounting Standards have been followed; and
(d) prepare the financial statements on the going concern basis unless it is inappropriate to presume that
the Company will continue in business.
The Directors are responsible for keeping adequate accounting records that are sufficient to show and
explain the Group’s transactions and disclose with reasonable accuracy at any time the financial position of
the Group and enable them to ensure that the financial statements comply with the Companies Act 2006.
They are also responsible for safeguarding the assets of the Group and hence for taking reasonable steps for
the prevention and detection of fraud and other irregularities.
The Directors, the names of whom are set out on page 10 of the Directors’ report, confirm to the best of
their knowledge:
in accordance with rule 4.1.12(3)(a) of the FSA’s Disclosure and Transparency Rules, the consolidated
financial statements, which have been prepared in accordance with IFRSs as issued by the International
Accounting Standards Board (“IASB”) and as endorsed by the EU, have been prepared in accordance
with the applicable set of accounting standards and give a true and fair view of the assets, liabilities,
financial position and profit or loss of the Group and the undertakings included in the consolidation
taken as a whole; and
INDEPENDENT AUDITOR’S REPORT TO THE MEMBERS OF MORGAN
STANLEY & CO. INTERNATIONAL plc
14
We have audited the Group and Company financial statements of Morgan Stanley & Co. International plc
for the year ended 31 December 2012 which comprise the consolidated income statement, the consolidated
statement of comprehensive income, the consolidated statement of changes in equity, the consolidated
statement of financial position and the consolidated statement of cash flows and the Company balance sheet
and the related notes 1 to 36 for the consolidated financial statements and the related notes 1 to 21 for the
Company financial statements. The financial reporting framework that has been applied in the preparation
of the Group financial statements is applicable law and IFRSs as adopted by the EU. The financial
reporting framework that has been applied in the preparation of the Company financial statements is
applicable law and United Kingdom Accounting Standards (United Kingdom Generally Accepted
Accounting Practice).
This report is made solely to the Group’s members, as a body, in accordance with Chapter 3 of Part 16 of
the Companies Act 2006. Our audit work has been undertaken so that we might state to the Group’s
members those matters we are required to state to them in an auditor’s report and for no other purpose. To
the fullest extent permitted by law, we do not accept or assume responsibility to anyone other than the
Group and the Group’s members as a body, for our audit work, for this report, or for the opinions we have
formed.
Respective responsibilities of Directors and auditor
As explained more fully in the Directors’ responsibilities statement, the Directors are responsible for the
preparation of the financial statements and for being satisfied that they give a true and fair view. Our
responsibility is to audit and express an opinion on the financial statements in accordance with applicable
law and International Standards on Auditing (UK and Ireland). Those standards require us to comply with
the Auditing Practices Board’s Ethical Standards for Auditors.
Scope of the audit of the financial statements
An audit involves obtaining evidence about the amounts and disclosures in the financial statements
sufficient to give reasonable assurance that the financial statements are free from material misstatement,
whether caused by fraud or error. This includes an assessment of: whether the accounting policies are
appropriate to the Group’s circumstances and have been consistently applied and adequately disclosed; the
reasonableness of significant accounting estimates made by the Directors; and the overall presentation of
the financial statements. In addition, we read all the financial and non-financial information in the annual
report to identify material inconsistencies with the audited financial statements. If we become aware of any
apparent material misstatements or inconsistencies we consider the implications for our report.
Opinion on financial statements
In our opinion the financial statements:
• give a true and fair view of the state of the Group’s affairs as at 31 December 2012 and of its profit
for the year then ended;
• have been properly prepared in accordance with IFRSs as adopted by the European Union; and
• have been prepared in accordance with the requirements of the Companies Act 2006.
Opinion on other matter prescribed by the Companies Act 2006
In our opinion the information given in the Directors’ report for the financial year for which the financial
statements are prepared is consistent with the financial statements.
INDEPENDENT AUDITOR’S REPORT TO THE MEMBERS OF MORGAN
STANLEY & CO. INTERNATIONAL plc
15
Matters on which we are required to report by exception
We have nothing to report in respect of the following matters where the Companies Act 2006 requires us to
report to you if, in our opinion:
• adequate accounting records have not been kept, or returns adequate for our audit have not been
received from branches not visited by us; or
• the financial statements are not in agreement with the accounting records and returns; or
• certain disclosures of Directors’ remuneration specified by law are not made; or
• we have not received all the information and explanations we require for our audit.
Robert Topley (Senior Statutory Auditor)
for and on behalf of Deloitte LLP
Chartered Accountants and Statutory Auditor
London
MORGAN STANLEY & CO. INTERNATIONAL plc
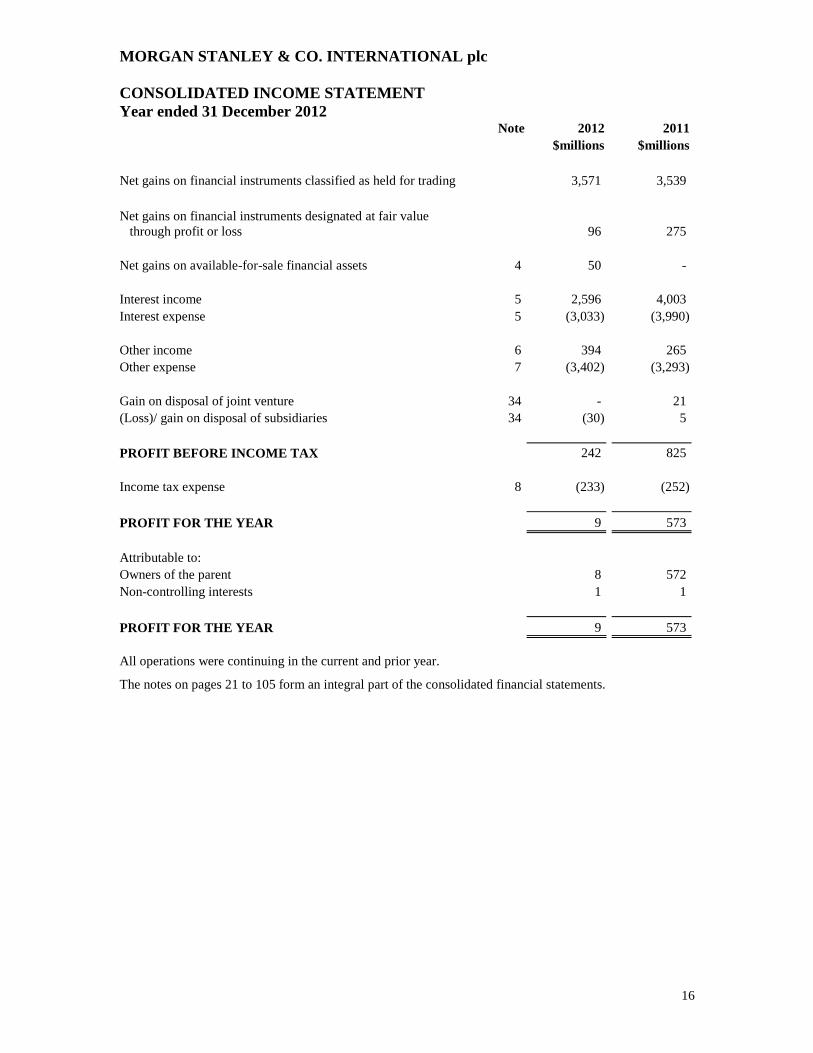
CONSOLIDATED INCOME STATEMENT
Year ended 31 December 2012
16
Note 2012 2011
$millions $millions
Net gains on financial instruments classified as held for trading 3,571 3,539
Net gains on financial instruments designated at fair value
through profit or loss 96 275
Net gains on available-for-sale financial assets 4 50 -
Interest income 5 2,596 4,003
Interest expense 5 (3,033) (3,990)
Other income 6 394 265
Other expense 7 (3,402) (3,293)
Gain on disposal of joint venture 34 - 21
(Loss)/ gain on disposal of subsidiaries 34 (30) 5
PROFIT BEFORE INCOME TAX 242 825
Income tax expense 8 (233) (252)
PROFIT FOR THE YEAR 9 573
Attributable to:
Owners of the parent 8 572
Non-controlling interests 1 1
PROFIT FOR THE YEAR 9 573
All operations were continuing in the current and prior year.
The notes on pages 21 to 105 form an integral part of the consolidated financial statements.
MORGAN STANLEY & CO. INTERNATIONAL plc
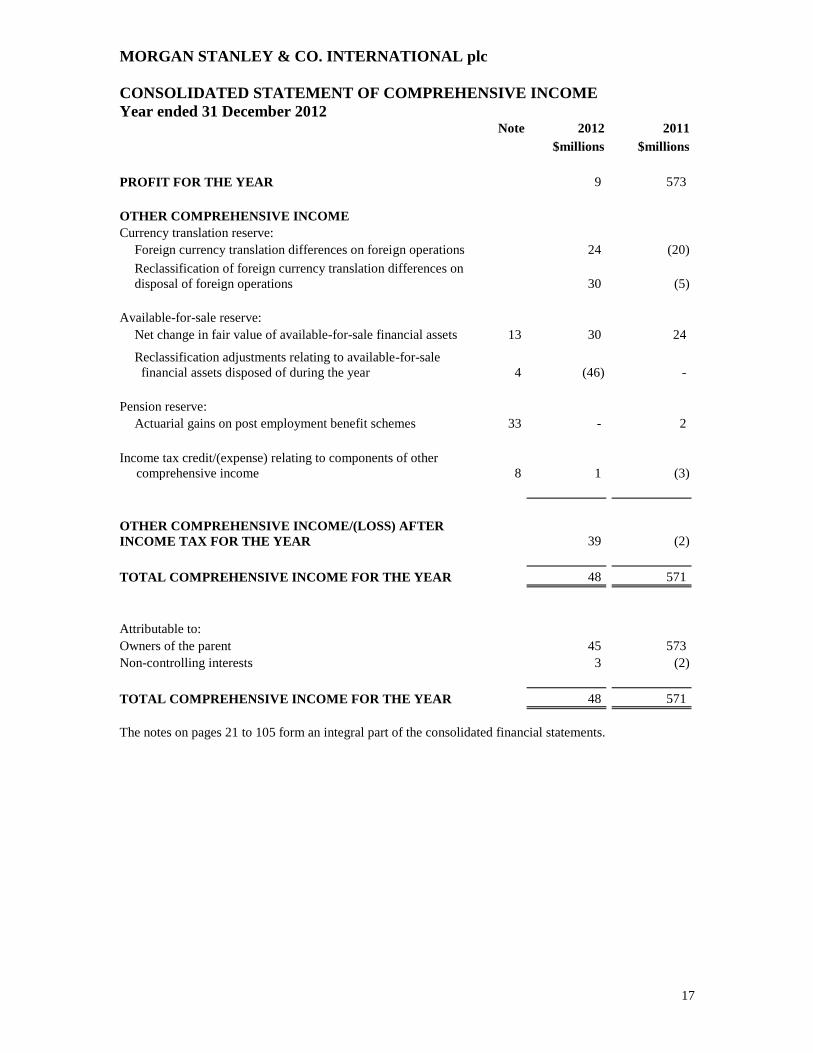
CONSOLIDATED STATEMENT OF COMPREHENSIVE INCOME
Year ended 31 December 2012
17
Note 2012 2011
$millions $millions
PROFIT FOR THE YEAR 9 573
OTHER COMPREHENSIVE INCOME
Currency translation reserve:
Foreign currency translation differences on foreign operations 24 (20)
Reclassification of foreign currency translation differences on
disposal of foreign operations 30 (5)
Available-for-sale reserve:
Net change in fair value of available-for-sale financial assets 13 30 24
Reclassification adjustments relating to available-for-sale
financial assets disposed of during the year 4 (46) -
Pension reserve:
Actuarial gains on post employment benefit schemes 33 - 2
Income tax credit/(expense) relating to components of other
comprehensive income 8 1 (3)
OTHER COMPREHENSIVE INCOME/(LOSS) AFTER
INCOME TAX FOR THE YEAR 39 (2)
TOTAL COMPREHENSIVE INCOME FOR THE YEAR 48 571
Attributable to:
Owners of the parent 45 573
Non-controlling interests 3 (2)
TOTAL COMPREHENSIVE INCOME FOR THE YEAR 48 571
The notes on pages 21 to 105 form an integral part of the consolidated financial statements.
MORGAN STANLEY & CO. INTERNATIONAL plc
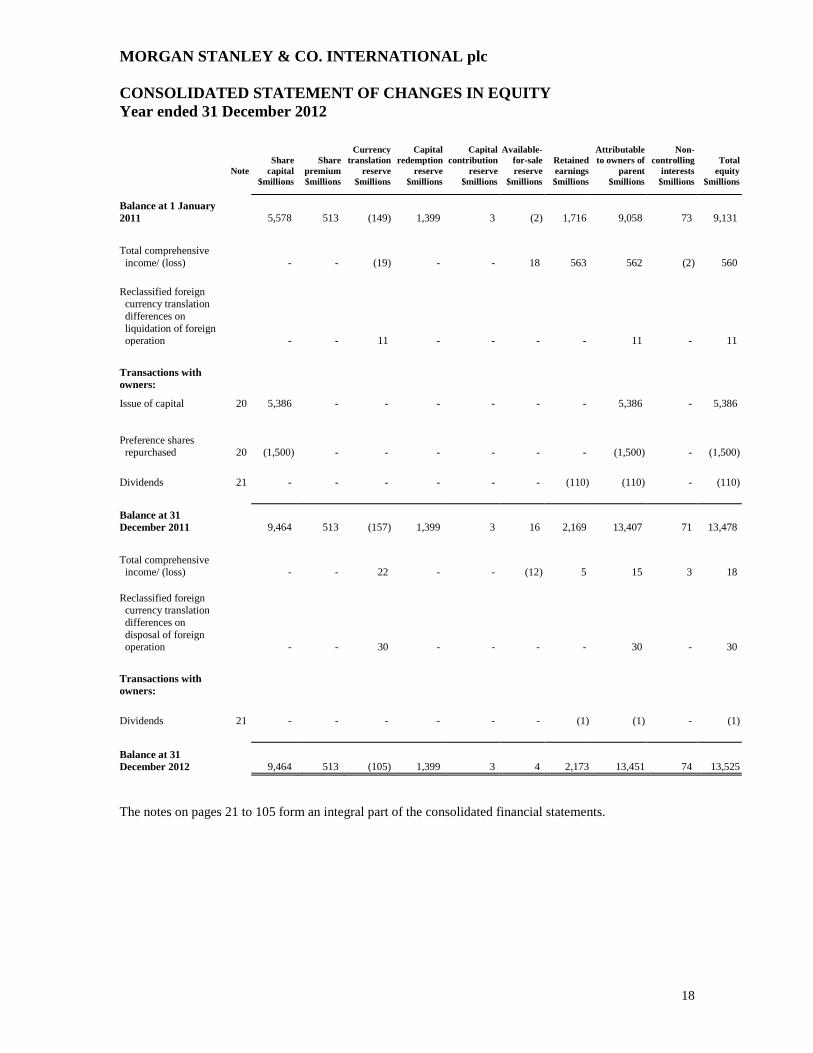
CONSOLIDATED STATEMENT OF CHANGES IN EQUITY
Year ended 31 December 2012
18
Note
Share
capital
Share
premium
Currency
translation
reserve
Capital
redemption
reserve
Capital
contribution
reserve
Available-
for-sale
reserve
Retained
earnings
Attributable
to owners of
parent
Non-
controlling
interests
Total
equity
$millions $millions $millions $millions $millions $millions $millions $millions $millions $millions
Balance at 1 January
2011 5,578 513 (149) 1,399 3 (2) 1,716 9,058 73 9,131
Total comprehensive
income/ (loss) - - (19) - - 18 563 562 (2) 560
Reclassified foreign currency translation
differences on
liquidation of foreign operation - - 11 - - - - 11 - 11
Transactions with
owners:
Issue of capital 20 5,386 - - - - - - 5,386 - 5,386
Preference shares repurchased 20 (1,500) - - - - - - (1,500) - (1,500)
Dividends 21 - - - - - - (110) (110) - (110)
Balance at 31
December 2011 9,464 513 (157) 1,399 3 16 2,169 13,407 71 13,478
Total comprehensive income/ (loss) - - 22 - - (12) 5 15 3 18
Reclassified foreign currency translation
differences on
disposal of foreign operation - - 30 - - - - 30 - 30
Transactions with
owners:
Dividends 21 - - - - - - (1) (1) - (1)
Balance at 31
December 2012 9,464 513 (105) 1,399 3 4 2,173 13,451 74 13,525
The notes on pages 21 to 105 form an integral part of the consolidated financial statements.
MORGAN STANLEY & CO. INTERNATIONAL plc Registered number: 2068222
CONSOLIDATED STATEMENT OF FINANCIAL POSITION
As at 31 December 2012
19
MORGAN STANLEY & CO. INTERNATIONAL plc
CONSOLIDATED STATEMENT OF CASH FLOWS
Year ended 31 December 2012
20
Note 2012 2011
$millions $millions
NET CASH FLOWS USED IN OPERATING
ACTIVITIES 22b (1,519) (2,300)
INVESTING ACTIVITIES
Purchase of property, plant and equipment 14 (1) (3)
Purchase of available-for-sale financial assets 13 (2) -
Proceeds from disposal of available-for-sale financial assets 13 59 1
Dividends received from available-for-sale financial assets 4 4 -
Proceeds from disposal of subsidiaries, net of cash disposed 34 (a) 1,920 -
Proceeds from disposal of joint venture 34 (b) - 28
NET CASH FLOWS FROM INVESTING
ACTIVITIES 1,980 26
FINANCING ACTIVITIES
Issue of ordinary share capital 20 - 5,386
Repayment of equity preference shares - (1,500)
Dividends paid on preference shares - (18)
Repayment of preference shares classified as debt - (786)
Interest on subordinated loan liabilities (137) (125)
Dividends paid to owners of the parent 21 (1) (110)
NET CASH FLOWS (USED IN)/FROM FINANCING
ACTIVITIES (138) 2,847
NET INCREASE IN CASH AND CASH
EQUIVALENTS 323 573
Currency translation differences on foreign currency cash balances 124 107
CASH AND CASH EQUIVALENTS AT THE BEGINNING
OF THE YEAR 22a 11,056 10,376
CASH AND CASH EQUIVALENTS AT THE END OF THE
YEAR 22a 11,503 11,056
The notes on pages 21 to 105 form an integral part of the consolidated financial statements.
MORGAN STANLEY & CO. INTERNATIONAL plc
NOTES TO THE CONSOLIDATED FINANCIAL STATEMENTS
Year ended 31 December 2012
21
1. CORPORATE INFORMATION
The principal activity of the Group is the provision of financial services to corporations, governments and
financial institutions.
The Company is incorporated and domiciled in England and Wales, at the following address:
25 Cabot Square, Canary Wharf, London, E14 4QA. The Company is authorised and regulated by the FSA.
The Company’s immediate parent undertaking is Morgan Stanley UK Group which is registered in England
and Wales. Copies of its financial statements can be obtained from the Registrar of Companies for England
and Wales, Companies House, Crown Way, Cardiff CF14 3UZ.
The Company’s ultimate parent undertaking and controlling entity is Morgan Stanley which, together with
the Group and Morgan Stanley’s other subsidiary undertakings, form the Morgan Stanley Group.
Morgan Stanley is incorporated in the state of Delaware, the United States of America.
2. BASIS OF PREPARATION
Statement of compliance
The Group has prepared its annual consolidated financial statements in accordance with IFRSs issued by
the IASB as adopted by the EU, Interpretations issued by the IFRS Interpretations Committee (“IFRIC”)
and the UK Companies Act 2006.
New standards and interpretations adopted during the year
The following amendment to a standard relevant to the Group’s operations was adopted during the year.
This amendment did not have a material impact on the Group’s consolidated financial statements.
An amendment to IFRS 7 ‘Financial instruments: Disclosures – transfers of financial assets’ was issued by
the IASB in October 2010 for prospective application in annual periods beginning on or after 1 July 2011.
The amendment was endorsed by the EU in November 2011.
There were no other standards or interpretations relevant to the Group’s operations which were adopted
during the year.
New standards and interpretations not yet adopted
As at the date of authorisation of these consolidated financial statements, the following standards and
interpretations relevant to the Group’s operations were issued by the IASB but not yet mandatory. Except
where otherwise stated, the Group does not expect that the adoption of the following standards and
interpretations will have a material impact on the Group’s consolidated financial statements.
An amendment to IAS 1 was issued by the IASB in June 2011 for application in annual periods beginning
on or after 1 July 2012. The revised standard was endorsed by the EU in June 2012.
An amendment to IAS 19 ‘Employee benefits’ was issued by the IASB in June 2011 for retrospective
application in annual periods beginning on or after 1 January 2013. The revised standard was endorsed by
the EU in June 2012.
IAS 27 ‘Consolidated and separate financial statements’ and IAS 28 ‘Investment in associates and joint
ventures’ were revised by the IASB in May 2011, for application in annual periods beginning on or after
1 January 2013. The revised standards were endorsed by the EU in December 2012 such that a Group shall
apply them at the latest as from the commencement date of its first financial year starting on or after
1 January 2014. It is the Group’s intention to adopt these revised standards from 1 January 2013.
An amendment to IAS 32 ‘Financial instruments: Presentation – offsetting financial instruments’ was
issued by the IASB in December 2011, for retrospective application in annual periods beginning on or after
1 January 2014. The amendment was endorsed by the EU in December 2012.
MORGAN STANLEY & CO. INTERNATIONAL plc
NOTES TO THE CONSOLIDATED FINANCIAL STATEMENTS
Year ended 31 December 2012
22
2. BASIS OF PREPARATION (CONTINUED)
An amendment to IFRS 7 ‘Financial instruments: Disclosures – offsetting financial assets and financial
liabilities’ was issued by the IASB in December 2011 for retrospective application in annual periods
beginning on or after 1 January 2013 and interim periods within those annual periods. The amendment was
endorsed by the EU in December 2012.
IFRS 9 ‘Financial instruments’ was issued by the IASB in November 2009 for retrospective application in
annual periods beginning on or after 1 January 2015. Although there are expected to be significant changes
to the presentation of financial instruments by the Group, there is not expected to be a significant impact on
net assets.
IFRS 10 ‘Consolidated financial statements’, IFRS 11 ‘Joint arrangements’ and IFRS 12 ‘Disclosure of
interests in other entities’ were issued by the IASB in May 2011 for retrospective application in annual
periods beginning on or after 1 January 2013. The standards were endorsed by the EU in December 2012
such that a Group shall apply them at the latest as from the commencement date of its first financial year
starting on or after 1 January 2014. It is the Group’s intention to adopt these standards from 1 January
2013.
Amendments to IFRS 10 ‘Consolidated financial statements’, IFRS 11 ‘Joint arrangements’ and IFRS 12
‘Disclosure of interests in other entities’ were issued by the IASB in June 2012 for retrospective
application in annual periods beginning on or after 1 January 2013.
IFRS 13 ‘Fair value measurement’ was issued by the IASB in May 2011 for prospective application in
annual periods beginning on or after 1 January 2013 and was endorsed by the EU in December 2012.
As part of the May 2012 Improvements to IFRSs, the IASB made amendments to the following standards
that are relevant to the Group’s operations: IAS 1, IAS 32 ‘Financial instruments: Presentation’ and IAS
34 ‘Interim financial reporting’ (for application in accounting periods beginning on or after
1 January 2013).
Basis of measurement
The consolidated financial statements of the Group are prepared under the historical cost convention except
for certain financial instruments that have been measured at fair value as explained in the accounting
policies below.
Use of estimates and sources of uncertainty
The preparation of the Group’s consolidated financial statements require management to make judgements,
estimates and assumptions regarding the valuation of certain financial instruments, deferred tax assets,
pension obligations, the outcome of litigation, and other matters that affect the consolidated financial
statements and related disclosures. The Group believes that the estimates utilised in preparing the
consolidated financial statements are reasonable, relevant and reliable. Actual results could differ from
these estimates.
Basis of consolidation
The consolidated financial statements of the Group comprise the financial statements of the Company and
its subsidiaries as at 31 December 2012. The financial statements for the subsidiaries are prepared for the
same reporting year as the Group, using consistent accounting policies. The financial statements of
overseas subsidiaries are translated into US dollars as described in note 3(b). Subsidiaries are consolidated
from the date that the Group gains control until the date that control ceases.
Intra-group balances, transactions, income and expenses and profits and losses resulting from intra-group
transactions are eliminated in preparing the consolidated financial statements.
MORGAN STANLEY & CO. INTERNATIONAL plc
NOTES TO THE CONSOLIDATED FINANCIAL STATEMENTS
Year ended 31 December 2012
23
2. BASIS OF PREPARATION (CONTINUED)
Basis of consolidation (continued)
Non-controlling interests represent the portion of profit or loss and total equity not owned, directly or
indirectly, by the Group and are presented separately in the consolidated income statement, consolidated
statement of comprehensive income and within equity in the consolidated statement of financial position,
separately from parent shareholders’ equity. The amount of non-controlling interest is measured either at
fair value or at the non-controlling interest’s proportionate share of the identifiable net assets.
The going concern assumption
The Group’s business activities, together with the factors likely to affect its future development,
performance and position, are reflected in the Business Review section of the Directors’ report on
pages 2 to 10. In addition, the notes to the consolidated financial statements include the Group’s objectives,
policies and processes for managing its capital; its financial risk management objectives; details of its
financial instruments; and its exposures to credit risk and liquidity risk.
As set out in the Directors’ report, retaining sufficient liquidity and capital to withstand market pressures
remains central to the Morgan Stanley Group’s and the Group’s strategy.
Taking all of these factors into consideration, the Directors believe it is reasonable to assume that the Group
will have access to adequate resources to continue in operational existence for the foreseeable future.
Accordingly, they continue to adopt the going concern basis in preparing the annual report and consolidated
financial statements.
3. SUMMARY OF SIGNIFICANT ACCOUNTING POLICIES
a. Functional currency
Items included in the consolidated financial statements are measured and presented in US dollars, the
currency of the primary economic environment in which the Group operates.
All currency amounts in the consolidated financial statements and Directors’ report are rounded to the
nearest million US dollars.
b. Foreign currencies
All monetary assets and liabilities denominated in currencies other than US dollars are translated into US
dollars at the rates ruling at the reporting date. Transactions in currencies other than US dollars are recorded
at the rates prevailing at the dates of the transactions. Foreign exchange differences on financial assets
classified as available-for-sale are recorded in the ‘Available-for-sale reserve’ in equity, with the exception
of translation differences on the amortised cost of monetary available-for-sale assets, which are recognised
through the consolidated income statement. Assets and liabilities of foreign operations are translated into
US dollars using the closing rate method. Translation differences arising from the net investments in the
foreign operations are taken to the ‘currency translation reserve’. All other translation differences are taken
through the consolidated income statement. Exchange differences recognised in the consolidated income
statement are presented in ‘Other income’ or ‘Other expense’, except where noted in 3(c) below.
On disposal of a foreign operation, the related cumulative gain or loss in the ‘currency translation reserve’
attributable to the owners of the parent is reclassified to the consolidated income statement and recorded
within gain or loss on disposal.
MORGAN STANLEY & CO. INTERNATIONAL plc
NOTES TO THE CONSOLIDATED FINANCIAL STATEMENTS
Year ended 31 December 2012
24
3. SUMMARY OF SIGNIFICANT ACCOUNTING POLICIES (CONTINUED)
c. Financial instruments
The Group classifies its financial assets into the following categories on initial recognition: financial assets
classified as held for trading; financial assets designated at fair value through profit or loss; available-for-
sale financial assets; and loans and receivables.
The Group classifies its financial liabilities into the following categories on initial recognition: financial
liabilities classified as held for trading, financial liabilities designated at fair value through profit or loss
and financial liabilities at amortised cost.
More information regarding these classifications is included below:
i) Financial instruments classified as held for trading
With the exception of loans, financial instruments classified as held for trading, including all
derivatives, are initially recorded on trade date at fair value (see note 3(d) below). All subsequent
changes in fair value, foreign exchange differences, interest and dividends are reflected in the
consolidated income statement in ‘Net gains/ (losses) on financial instruments classified as held for
trading’.
For loans classified as held for trading, from the date a loan’s terms are agreed (trade date), until the
loan is funded (settlement date), the Group recognises any unrealised fair value changes in the loan as
financial instruments classified as held for trading. On settlement date, the fair value of consideration
given is recognised as a financial asset classified as held for trading. All subsequent changes in fair
value, foreign exchange differences and interest are reflected in the consolidated income statement in
‘Net gains/ (losses) from financial instruments classified as held for trading’.
For all financial instruments classified as held for trading, transaction costs are excluded from the
initial fair value measurement of the financial instrument. These costs are recognised in the
consolidated income statement in ‘Other expense’.
ii) Financial instruments designated at fair value through profit or loss
The Group has designated certain financial assets and financial liabilities at fair value through profit or
loss when:
the financial assets or financial liabilities are managed, evaluated and reported internally on a fair
value basis;
the designation at fair value eliminates or significantly reduces an accounting mismatch which
would otherwise arise; or
the financial asset or financial liability contains an embedded derivative that significantly
modifies the cash flows that would otherwise be required under the contract.
From the date the transaction in a financial instrument designated at fair value is entered into (trade
date) until settlement date, the Group recognises any unrealised fair value changes in the contract as
financial instruments designated at fair value through profit or loss. On settlement date, the fair value
of consideration given or received is recognised as a financial instrument designated at fair value
through profit or loss (see note 3(d) below). All subsequent changes in fair value, foreign exchange
differences, interest and dividends are reflected in the consolidated income statement in ‘Net gains/
(losses) on financial instruments designated at fair value through profit or loss’.
Transaction costs are excluded from the initial fair value measurement of the financial instrument.
These costs are recognised in the consolidated income statement in ‘Other expense’.
MORGAN STANLEY & CO. INTERNATIONAL plc
NOTES TO THE CONSOLIDATED FINANCIAL STATEMENTS
Year ended 31 December 2012
25
3. SUMMARY OF SIGNIFICANT ACCOUNTING POLICIES (CONTINUED)
c. Financial instruments (continued)
iii) Available-for-sale financial assets
Financial assets classified as available-for-sale are non-derivative financial assets that are either
designated in this category or not classified in any of the other categories of financial instruments.
Financial assets classified as available-for-sale are recorded on trade date and are initially recognised
and subsequently measured at fair value (see note 3(d) below).
Transaction costs that are directly attributable to the acquisition of the available-for-sale financial asset
are added to the fair value on initial recognition.
For debt instruments, interest calculated using the effective interest method (see note 3(c)(iv) below),
impairment losses and reversals of impairment losses and foreign exchange differences on the
amortised cost of the asset are recorded in the consolidated income statement in ‘Net gains/ (losses) on
available-for-sale financial assets’.
For equity instruments, dividend income and impairment losses are recognised in the consolidated
income statement in ‘Net gains/ (losses) on available-for-sale financial assets’. All other gains and
losses on debt and equity instruments classified as available-for-sale are recognised in the ‘Available-
for-sale reserve’ within equity.
On disposal or impairment of an available-for-sale financial asset, the cumulative gain or loss in the
‘Available-for-sale reserve’ is reclassified to the consolidated income statement and reported in ‘Net
gains/ (losses) on available-for-sale financial assets’.
iv) Loans and receivables and financial liabilities at amortised cost
Financial assets classified as loans and receivables are initially recognised on settlement date at fair
value (see note 3(d) below) and subsequently measured at amortised cost less allowance for
impairment. Interest is recognised in the consolidated income statement in ‘Interest income’, using the
effective interest rate method as described below. Transaction costs that are directly attributable to the
acquisition of the financial asset are added to or deducted from the fair value on initial recognition.
Impairment losses and reversals of impairment losses on financial assets classified as loans and
receivables are recognised in the consolidated income statement in ‘Other expense’.
Financial liabilities held at amortised cost are initially recognised on settlement date at fair value (see
note 3(d) below) and subsequently measured at amortised cost. Interest is recognised in the
consolidated income statement in ‘Interest expense’ using the effective interest rate method as
described below. Transaction costs that are directly attributable to the issue of the financial liability
are added to or deducted from the fair value on initial recognition.
The effective interest rate method is a method of calculating the amortised cost of a financial asset or
financial liability (or a group of financial assets or financial liabilities) and of allocating the interest
income or interest expense over the expected life of the financial asset or financial liability. The
effective interest rate is the rate that exactly discounts the estimated future cash payments and receipts
through the expected life of the financial asset or financial liability (or, where appropriate a shorter
period) to the carrying amount of the financial asset or financial liability. The effective interest rate is
established on initial recognition of the financial asset and financial liability. The calculation of the
effective interest rate includes all fees and commissions paid or received, transaction costs, and
discounts or premiums that are an integral part of the effective interest rate. Transaction costs are
incremental costs that are directly attributable to the acquisition, issue or disposal of a financial asset or
financial liability.
MORGAN STANLEY & CO. INTERNATIONAL plc
NOTES TO THE CONSOLIDATED FINANCIAL STATEMENTS
Year ended 31 December 2012
26
3. SUMMARY OF SIGNIFICANT ACCOUNTING POLICIES (CONTINUED)
c. Financial instruments (continued)
iv) Loans and receivables and financial liabilities at amortised cost (continued)
In the course of financing its business and as part of its trading activities, the Group enters into
arrangements which involve the sale of securities with agreements to repurchase, the purchase of
securities with resale agreements, the lending of securities with collateral received and the borrowing
of securities with collateral given. Cash collateral balances repayable and accrued interest arising
under repurchase agreements and securities lending arrangements are classified as ‘Financial liabilities
at amortised cost’ and the related securities, where owned by the Group, are included in ‘Financial
assets classified as held for trading’. Cash collateral balances receivable and accrued interest arising
under resale agreements and securities borrowing arrangements are classified as ‘Loans and
receivables’. Securities received by the Group under resale arrangements and securities borrowing
arrangements are generally not recognised on the consolidated statement of financial position.
d. Fair value of financial instruments
Fair value measurement
Fair value is defined as the price that would be received to sell an asset or paid to transfer a liability (i.e. the
“exit price”) in an orderly transaction between market participants at the measurement date.
In determining fair value, the Group uses various valuation approaches and establishes a hierarchy for
inputs used in measuring fair value that maximises the use of relevant observable inputs and minimises the
use of unobservable inputs by requiring that the most observable inputs be used when available.
Observable inputs are inputs that market participants would use in pricing the asset or liability developed
based on market data obtained from sources independent of the Group. Unobservable inputs are inputs that
reflect the Group’s assumptions about the assumptions other market participants would use in pricing the
asset or liability, developed based on the best information available in the circumstances.
The availability of observable inputs can vary from product to product and is affected by a wide variety of
factors, including, for example, the type of product, whether the product is new and not yet established in
the marketplace, the liquidity of markets and other characteristics particular to the product. To the extent
that valuation is based on models or inputs that are less observable or unobservable in the market, the
determination of fair value requires more judgement.
The Group considers prices and inputs that are current as of the measurement date, including during periods
of market dislocation. In periods of market dislocation, the observability of prices and inputs may be
reduced for many instruments.
Valuation techniques
Fair value for many cash and over-the-counter (“OTC”) contracts is derived using pricing models. Pricing
models take into account the contract terms (including maturity), as well as multiple inputs including,
where applicable, commodity prices, equity prices, interest rate yield curves, credit curves, correlation,
creditworthiness of the counterparty, option volatility and currency rates. Where appropriate, valuation
adjustments are made to account for various factors such as liquidity risk (bid-ask adjustments), credit
quality, model uncertainty and concentration risk.
Adjustments for liquidity risk adjust model-derived valuations of financial instruments for the bid-mid or
mid-ask spread required to properly reflect the exit price of a risk position. Bid-mid and mid-ask spreads
are marked to levels observed in trader activity, broker quotes or other external third-party data. Where
these spreads are unobservable for the particular position in question, spreads are derived from observable
levels of similar positions.
MORGAN STANLEY & CO. INTERNATIONAL plc
NOTES TO THE CONSOLIDATED FINANCIAL STATEMENTS
Year ended 31 December 2012
27
3. SUMMARY OF SIGNIFICANT ACCOUNTING POLICIES (CONTINUED)
d. Fair value of financial instruments (continued)
Valuation techniques (continued)
Credit valuation adjustments are applied to both cash instruments and OTC derivatives. For cash
instruments, the impact of changes in its own credit spreads is considered when measuring the fair value of
liabilities and the impact of changes in the counterparty’s credit spreads is considered when measuring the
fair value of assets. For OTC derivatives, the impact of changes in both the Group’s and the counterparty’s
credit standing is considered when measuring fair value. In determining the expected exposure the Group
simulates the distribution of the future exposure to a counterparty, then applies market-based default
probabilities to the future exposure, leveraging external third-party CDS spread data. Where CDS spread
data are unavailable for a specific counterparty, bond market spreads, CDS spread data based on the
counterparty’s credit rating or CDS spread data that reference a comparable counterparty may be utilised.
The Group also considers collateral held and legally enforceable master netting agreements that mitigate
the Group’s exposure to each counterparty.
Adjustments for model uncertainty are taken for positions where underlying models are reliant on
significant inputs that are neither directly nor indirectly observable, hence requiring reliance on established
theoretical concepts in their derivation. These adjustments are derived by making assessments of the
possible degree of variability using statistical approaches and market-based information where possible.
The Group generally subjects all valuations and models to a review process initially and on a periodic basis
thereafter.
The Group may apply a concentration adjustment to certain of its OTC derivatives portfolios to reflect the
additional cost of closing out a particularly large risk exposure. Where possible, these adjustments are
based on observable market information but in many instances significant judgement is required to estimate
the costs of closing out concentrated risk exposures due to the lack of liquidity in the marketplace.
Fair value is a market-based measure considered from the perspective of a market participant rather than an
entity-specific measure. Therefore, even when market assumptions are not readily available, the Group’s
own assumptions are set to reflect those that the Group believes market participants would use in pricing
the asset or liability at the measurement date.
Valuation process
The Valuation Review Group (“VRG”) within the Financial Control Group is responsible for the Group’s
fair value valuation policies, processes and procedures. VRG is independent of the business units and
reports to the Chief Financial Officer (“CFO”), who has final authority over the valuation of the Group’s
financial instruments. VRG implements valuation control processes to validate the fair value of the
Group’s financial instruments measured at fair value including those derived from pricing models. These
control processes are designed to ensure that the values used for financial reporting are based on observable
inputs wherever possible. In the event that observable inputs are not available, the control processes are
designed to ensure that the valuation approach utilised is appropriate and consistently applied and that the
assumptions are reasonable.
MORGAN STANLEY & CO. INTERNATIONAL plc
NOTES TO THE CONSOLIDATED FINANCIAL STATEMENTS
Year ended 31 December 2012
28
3. SUMMARY OF SIGNIFICANT ACCOUNTING POLICIES (CONTINUED)
d. Fair value of financial instruments (continued)
Valuation process (continued)
The Group’s control processes apply to all financial instruments, unless otherwise noted. These control
processes include:
Model Review. VRG, in conjunction with the Market Risk Department and, where appropriate, the Credit
Risk Management Department, both of which report to the Chief Risk Officer, independently review
valuation models’ theoretical soundness, the appropriateness of the valuation methodology and calibration
techniques developed by the business units using observable inputs. Where inputs are not observable, VRG
reviews the appropriateness of the proposed valuation methodology to ensure it is consistent with how a
market participant would arrive at the unobservable input. The valuation methodologies utilised in the
absence of observable inputs may include extrapolation techniques and the use of comparable observable
inputs. As part of the review, VRG develops a methodology to independently verify the fair value
generated by the business unit’s valuation model. Before trades are executed using new valuation models,
those models are required to be independently reviewed. All of the Group’s valuation models are subject to
an independent annual VRG review.
Independent Price Verification. The business units are responsible for determining the fair value of
financial instruments using approved valuation models and valuation methodologies. Generally on a
monthly basis, VRG independently validates the fair values of financial instruments determined using
valuation models by determining the appropriateness of the inputs used by the business units and by testing
compliance with the documented valuation methodologies approved in the model review process described
above.
VRG uses recently executed transactions, other observable market data such as exchange data, broker/
dealer quotes, third-party pricing vendors and aggregation services for validating the fair values of financial
instruments generated using valuation models. VRG assesses the external sources and their valuation
methodologies to determine if the external providers meet the minimum standards expected of a third-party
pricing source. Pricing data provided by approved external sources are evaluated using a number of
approaches; for example, by corroborating the external sources’ prices to executed trades, by analysing the
methodology and assumptions used by the external source to generate a price and/ or by evaluating how
active the third-party pricing source (or originating sources used by the third-party pricing source) is in the
market. Based on this analysis, VRG generates a ranking of the observable market data to ensure that the
highest-ranked market data source is used to validate the business unit’s fair value of financial instruments.
For financial instruments where the fair value is based on unobservable inputs, VRG reviews the business
unit’s valuation techniques to ensure these are consistent with market participant assumptions.
The results of this independent price verification and any adjustments made by VRG to the fair value
generated by the business units are presented to management of the Morgan Stanley Group’s three business
segments (i.e., Institutional Securities, Global Wealth Management Group and Asset Management), the
CFO and the Chief Risk Officer on a regular basis.
Review of Transactions where the valuation is based on unobservable inputs. VRG reviews the models and
valuation methodology used to price all new material Level 3 transactions and both the Financial Control
Group and Market Risk Department management must approve the fair value of the trade that is initially
recognised.
MORGAN STANLEY & CO. INTERNATIONAL plc
NOTES TO THE CONSOLIDATED FINANCIAL STATEMENTS
Year ended 31 December 2012
29
3. SUMMARY OF SIGNIFICANT ACCOUNTING POLICIES (CONTINUED)
d. Fair value of financial instruments (continued)
Gains and losses on inception
In the normal course of business, the fair value of a financial instrument on initial recognition is the
transaction price (i.e. the fair value of the consideration given or received). In certain circumstances,
however, the fair value will be based on other observable current market transactions in the same
instrument, without modification or repackaging, or on a valuation technique whose variables include only
data from observable markets. When such evidence exists, the Group recognises a gain or loss on inception
of the transaction.
When unobservable market data has a significant impact on determining fair value at the inception of the
transaction, the entire initial gain or loss indicated by the valuation technique as at the transaction date is
not recognised immediately in the consolidated income statement and is recognised instead when the
market data becomes observable.
e. Derecognition of financial assets and liabilities
The Group derecognises a financial asset only when the contractual rights to the cash flows from the asset
expire, or when it transfers the financial asset and substantially all the risk and rewards of ownership of the
asset.
The Group derecognises financial liabilities when the Group’s obligations are discharged, cancelled or they
expire.
f. Impairment of financial assets
At each reporting date, an assessment is made as to whether there is any objective evidence of impairment
in the value of a financial asset classified as either available-for-sale or loans and receivables. Impairment
losses are recognised if an event has occurred which will have an adverse impact on the expected future
cash flows of an asset and the expected impact can be reliably estimated.
Impairment losses on available-for-sale financial assets are measured as the difference between cost (net of
any principal repayment and amortisation) and the current fair value. Where there is evidence that the
available-for-sale financial asset is impaired, the cumulative loss that had been previously recognised in
other comprehensive income is reclassified from the ‘Available-for-sale reserve’ and recognised in the
consolidated income statement within ‘Net gains/ (losses) on available-for-sale financial assets’.
Impairment losses on loans and receivables carried at amortised cost are measured as the difference
between the carrying amount of the financial asset and the present value of estimated cash flows discounted
at the asset’s original effective interest rate. Such impairment losses are recognised in the consolidated
income statement within ‘Other expense’ and are recognised against the carrying amount of the impaired
asset on the consolidated statement of financial position. Interest on the impaired asset continues to be
accrued on the reduced carrying amount based on the original effective interest rate of the asset.
Subsequent increases in fair value of previously impaired equity available-for-sale financial assets are
reported as fair value gains in the ‘Available-for-sale reserve’ through other comprehensive income and not
separately identified as an impairment reversal. For all other financial assets, if in a subsequent year, the
amount of the estimated impairment loss decreases because of an event occurring after the impairment was
recognised, the previously recognised impairment loss is reversed as detailed by financial asset in note
3c(iii) and (iv). Any reversal is limited to the extent that the value of the asset may not exceed the original
amortised cost of the asset had no impairment occurred.
MORGAN STANLEY & CO. INTERNATIONAL plc
NOTES TO THE CONSOLIDATED FINANCIAL STATEMENTS
Year ended 31 December 2012
30
3. SUMMARY OF SIGNIFICANT ACCOUNTING POLICIES (CONTINUED)
g. Impairment of non-financial assets
Non-financial assets that are subject to amortisation are reviewed for impairment whenever events or
changes in circumstances indicate that the carrying amount may not be recoverable. An impairment loss is
recognised for the amount by which the asset’s carrying amount exceeds its recoverable amount. The
recoverable amount is the higher of an asset’s fair value less costs to sell and its value in use. For the
purposes of assessing impairment, assets are grouped at the lowest levels for which there are separately
identifiable cash flows (cash generating units). Non-financial assets, other than goodwill, that have suffered
an impairment are reviewed for possible reversal of the impairment at the end of each reporting period.
Such impairment losses are recognised in the consolidated income statement within ‘Other expense’ and
are recognised against the carrying amount of the impaired asset on the consolidated statement of financial
position.
h. Fees and commissions
Fees and commissions classified within ‘Other income’ in the consolidated income statement include
account servicing fees, investment management fees, sales commissions, placement fees, advisory fees and
syndication fees. Fees and commissions classified within ‘Other expense’ include transaction and service
fees. These amounts are recognised as the related services are performed or received.
i. Property, plant and equipment
Property, plant and equipment are stated at cost net of depreciation and any provision for impairment in
value, which are included within ‘Other expense’ in the consolidated income statement. For assets in the
course of construction, interest that is directly attributable to the construction of the qualifying asset is
capitalised as a cost of the asset. The interest capitalisation rate is based on the Morgan Stanley Group’s
blended funding rates.
For premises held under operating leases, a reinstatement provision is recognised for the estimated cost to
reinstate the premises at the end of the lease period. When the reinstatement provision is established and
included within ‘Provisions’ in the consolidated statement of financial position, an equivalent asset is
recognised and included in the cost of leasehold improvements at the initial present value of any
reinstatement obligations. The discount effect included in the reinstatement provision is reversed over time
using a constant effective yield method and included within ‘Interest expense’ in the consolidated income
statement. The reinstatement asset is depreciated over the useful economic life of the relevant leasehold
improvement asset and the depreciation charge is included within ‘Other expense’.
Depreciation is provided on property, plant and equipment at rates calculated to write off the cost of the
assets on a straight line basis over their expected useful lives as follows:
Leasehold improvements including reinstatement assets - shorter of remaining lease term and 25 years
Fixtures, fittings and equipment - 3 to 8 years
MORGAN STANLEY & CO. INTERNATIONAL plc
NOTES TO THE CONSOLIDATED FINANCIAL STATEMENTS
Year ended 31 December 2012
31
3. SUMMARY OF SIGNIFICANT ACCOUNTING POLICIES (CONTINUED)
j. Business combinations and disposals
When subsidiaries are sold or the Group ceases to control an entity, the difference between the proceeds
(plus the fair value of any investment retained), and the total assets less total liabilities disposed of,
cumulative translation differences and unamortised goodwill, is recognised in the consolidated income
statement within ‘Gain/ loss on disposal of subsidiary’. Where the disposal or loss of control over an entity
includes a foreign operation, all foreign exchange differences accumulated in the ‘currency translation
reserve’ attributable to the equity holders of the Parent are reclassified to the consolidated income statement
within ‘Gain/ loss on disposal of subsidiary’.
k. Cash and cash equivalents
For the purposes of the consolidated statement of cash flows, cash and cash equivalents comprise cash and
demand deposits with banks, net of outstanding bank overdrafts, along with highly liquid investments, with
original maturities of three months or less, that are readily convertible to known amounts of cash and
subject to insignificant risk of change in value.
l. Income tax
The tax expense represents the sum of the tax currently paid and payable and deferred tax.
The tax currently payable is based on taxable profit for the year. Taxable profit may differ from net profit
as reported in the consolidated income statement because it excludes items of income or expense that are
taxable or deductible in other years and it further excludes items that are never taxable or deductible. The
Group’s liability for current tax is calculated using tax rates that have been enacted or substantively enacted
by the reporting date. Current tax is charged or credited in the consolidated income statement, except when
it relates to items charged or credited directly to other comprehensive income or equity, in which case the
current tax is also dealt with in other comprehensive income or equity respectively.
Deferred tax is the tax expected to be payable or recoverable on differences between the carrying amounts
of assets and liabilities in the consolidated financial statements and the corresponding tax bases used in the
computation of taxable profit, and is accounted for using the balance sheet liability method. Deferred tax
liabilities are generally recognised for all taxable temporary differences and deferred tax assets are
recognised to the extent that it is probable that taxable profits will be available against which deductible
temporary differences can be utilised.
Deferred tax liabilities are recognised for taxable temporary differences arising on investments in
subsidiaries and associates, except where the Group is able to control the reversal of the temporary
difference and it is probable that the temporary difference will not reverse in the foreseeable future.
The carrying amount of deferred tax assets is reviewed at each reporting date and limited to the extent that
it is probable that sufficient taxable profits will be available to allow all or part of the asset to be recovered.
Deferred tax is calculated at the tax rates that are expected to apply in the period when the liability is settled
or the asset is realised. Deferred tax is charged or credited in the consolidated income statement, except
when it relates to items charged or credited directly to other comprehensive income or equity, in which case
the deferred tax is dealt with in other comprehensive income or equity, respectively.
Current tax assets are offset against current tax liabilities and deferred tax assets are offset against deferred
tax liabilities when there is a legally enforceable right to set off current tax assets against current tax
liabilities and when they relate to income taxes levied by the same taxation authority and the Group intends
to settle its current tax assets and current tax liabilities on a net basis.
MORGAN STANLEY & CO. INTERNATIONAL plc
NOTES TO THE CONSOLIDATED FINANCIAL STATEMENTS
Year ended 31 December 2012
32
3. SUMMARY OF SIGNIFICANT ACCOUNTING POLICIES (CONTINUED)
m. Operating leases
Rentals payable under operating leases are charged to ‘Other expense’ in the consolidated income statement
on a straight line basis over the lease term. Lease incentives are allocated on a straight line basis over the
lease term as a reduction to rental expense.
Rentals receivable under operating leases are credited to ‘Other income’ in the consolidated income
statement on a straight line basis over the lease term. Initial direct costs incurred in negotiating and
arranging the lease are added to the carrying amount of the leased asset and recognised in the consolidated
income statement on a straight line basis over the lease term. Lease incentives are allocated on a straight
line basis over the lease term.
n. Provisions
Provisions are recognised when the Group has a present obligation as a result of a past event, when it is
probable that an outflow of resources embodying economic benefits will be required to settle the obligation
and when a reliable estimate can be made of the amount of the obligation. The amount recognised as a
provision is the best estimate of the consideration required to settle the present obligation at the year end
date, taking into account the risks and uncertainties surrounding the obligation. Where a provision is
measured using the cash flows estimate to settle the present obligation, its carrying amount is the present
value of those cash flows.
o. Employee compensation plans
i) Equity-settled share-based compensation plans
Morgan Stanley operates equity based compensation plans on behalf of the Group in relation to which, the
Group pays Morgan Stanley in consideration of the procurement of the transfer of shares to employees.
The cost of equity based transactions with employees is measured based on the fair value of the equity
instruments at grant date. Fair value of stock unit awards is based on the market price of Morgan Stanley
shares and fair value of stock option awards is estimated using the Black-Scholes option pricing model,
which takes into account the option’s exercise price, its expected term, the risk free interest rate and the
expected volatility of the market price of Morgan Stanley shares. Non-market vesting conditions are not
taken into account when measuring fair value, but are reflected by adjusting over time the number of
equity instruments included in the measurement of the transaction such that the amount ultimately
recognised reflects the number that actually vest. The expense for IFRS 2 'Share-based payment' ("IFRS
2") purposes is recorded within ‘Direct staff costs’ in ‘Other expense’ in the consolidated income
statement; the corresponding credit to retained earnings is reduced to the extent that payments are due to
Morgan Stanley in respect of these awards.
ii) Other deferred compensation plans
Morgan Stanley also maintains deferred compensation plans for the benefit of certain employees that
provide a return to the participating employees based upon the performance of various referenced
investments. Liabilities for these awards, which are included within ‘Accruals and deferred income’ in
the consolidated statement of financial position, are measured at fair value and recognised over time in
accordance with the awards’ vesting conditions. The related expense is recorded within ‘Direct staff
costs’ in ‘Other expense’. The Group economically hedges the exposure created by these deferred
compensation schemes by entering into derivative transactions with other Morgan Stanley Group
undertakings. The derivatives are recognised within ‘Financial instruments classified as held for trading’
in the consolidated statement of financial position and the related gains and losses are recorded within
‘Net gains/ (losses) on financial instruments classified as held for trading’ in the consolidated income
statement.
MORGAN STANLEY & CO. INTERNATIONAL plc
NOTES TO THE CONSOLIDATED FINANCIAL STATEMENTS
Year ended 31 December 2012
33
3. SUMMARY OF SIGNIFICANT ACCOUNTING POLICIES (CONTINUED)
p. Post employment benefits
The Group operates defined contribution and defined benefit post employment plans.
Contributions due in relation to the Group’s defined contribution post employment plan are recognised in
‘Other expense’ in the consolidated income statement when payable.
For the Group’s defined benefit post employment plan, the plan obligations are measured on an actuarial
basis in accordance with the advice of an independent qualified actuary using the projected unit credit
method and discounted at a rate that reflects the current rate of return on a high quality corporate bond of
equivalent term and currency to the plan liabilities. Plan assets are measured at their fair value at the
reporting date. A surplus or deficit of plan assets over liabilities is recognised in the consolidated statement
of financial position as an asset or a liability respectively. The value of any asset recognised is restricted to
the sum of any unrecognised past service costs plus the present value of available refunds and reductions in
future contributions to the plan. The current service cost and any past service costs together with the
expected return on plan assets less the unwinding of the discount on the plan liabilities is charged to ‘Direct
staff costs’ within ‘Other expense’ in the consolidated income statement. Actuarial gains and losses that
arise in calculating the Group’s obligation in respect of a plan are recognised in other comprehensive
income, in the period in which they occur.
Details of the plans are given in note 33 to these consolidated financial statements.
q. Offsetting of financial assets and financial liabilities
Where there is a current legally enforceable right to set off the recognised amounts and an intention to
either settle on a net basis or to realise the asset and the liability simultaneously, financial assets and
financial liabilities are offset and the net amount is presented on the consolidated statement of financial
position. In the absence of such conditions, financial assets and financial liabilities are presented on a gross
basis.
4. NET GAINS ON AVAILABLE-FOR-SALE FINANCIAL ASSETS
2012 2011
$millions $millions
Dividend income 4 -
Net fair value gains reclassified from the available-for-sale
reserve on disposal of asset
46 -
50 -
5. INTEREST INCOME AND INTEREST EXPENSE
‘Interest income’ and ‘Interest expense’ represent total interest income and total interest expense for
financial assets and financial liabilities that are not carried at fair value.
No other gains or losses have been recognised in respect of loans and receivables other than as disclosed as
‘Interest income’ and foreign exchange differences disclosed within ‘Other income’ within the consolidated
income statement.
No other gains or losses have been recognised in respect of financial liabilities measured at amortised cost
other than as disclosed in ‘Interest expense’ within the consolidated income statement.
Included within interest expense in 2011 was $18 million paid on the Class B preference shares, which
were classified as debt (see note 21).
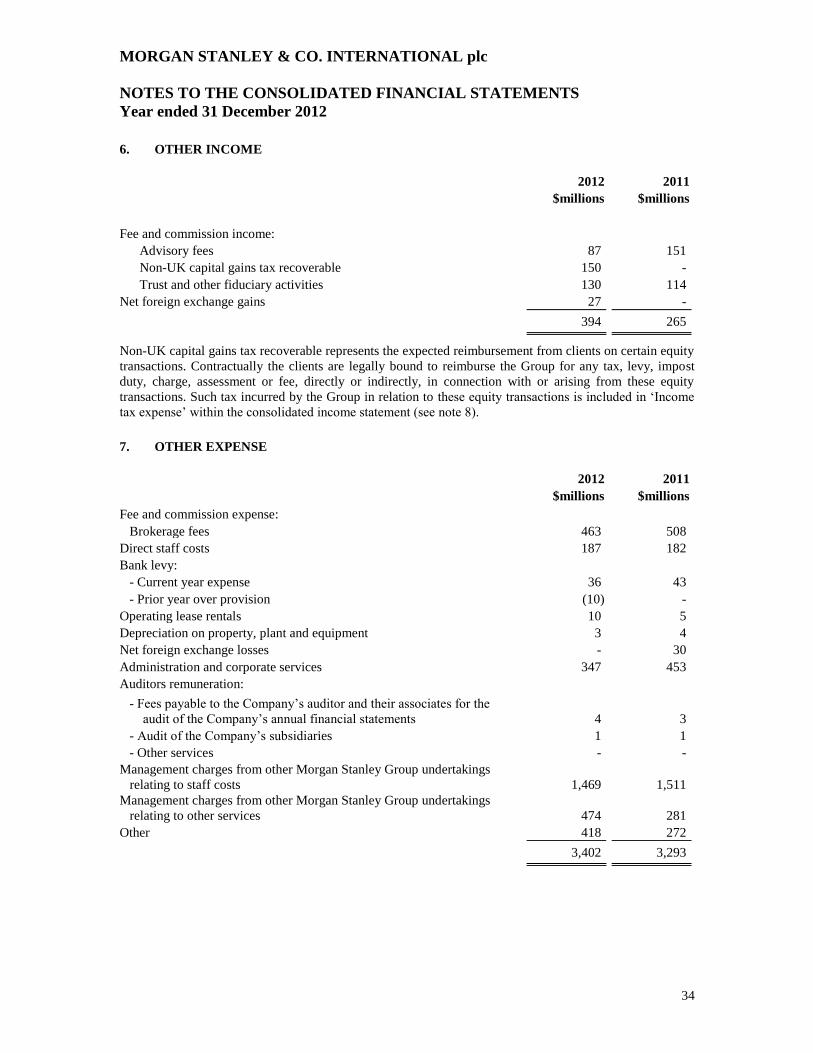
MORGAN STANLEY & CO. INTERNATIONAL plc
NOTES TO THE CONSOLIDATED FINANCIAL STATEMENTS
Year ended 31 December 2012
34
6. OTHER INCOME
2012 2011
$millions $millions
Fee and commission income:
Advisory fees 87 151
Non-UK capital gains tax recoverable 150 -
Trust and other fiduciary activities 130 114
Net foreign exchange gains 27 -
394 265
Non-UK capital gains tax recoverable represents the expected reimbursement from clients on certain equity
transactions. Contractually the clients are legally bound to reimburse the Group for any tax, levy, impost
duty, charge, assessment or fee, directly or indirectly, in connection with or arising from these equity
transactions. Such tax incurred by the Group in relation to these equity transactions is included in ‘Income
tax expense’ within the consolidated income statement (see note 8).
7. OTHER EXPENSE
2012 2011
$millions $millions
Fee and commission expense:
Brokerage fees 463 508
Direct staff costs 187 182
Bank levy:
- Current year expense 36 43
- Prior year over provision (10) -
Operating lease rentals 10 5
Depreciation on property, plant and equipment 3 4
Net foreign exchange losses - 30
Administration and corporate services 347 453
Auditors remuneration:
- Fees payable to the Company’s auditor and their associates for the
audit of the Company’s annual financial statements 4 3
- Audit of the Company’s subsidiaries 1 1
- Other services - -
Management charges from other Morgan Stanley Group undertakings
relating to staff costs 1,469 1,511
Management charges from other Morgan Stanley Group undertakings
relating to other services 474 281
Other 418 272
3,402 3,293
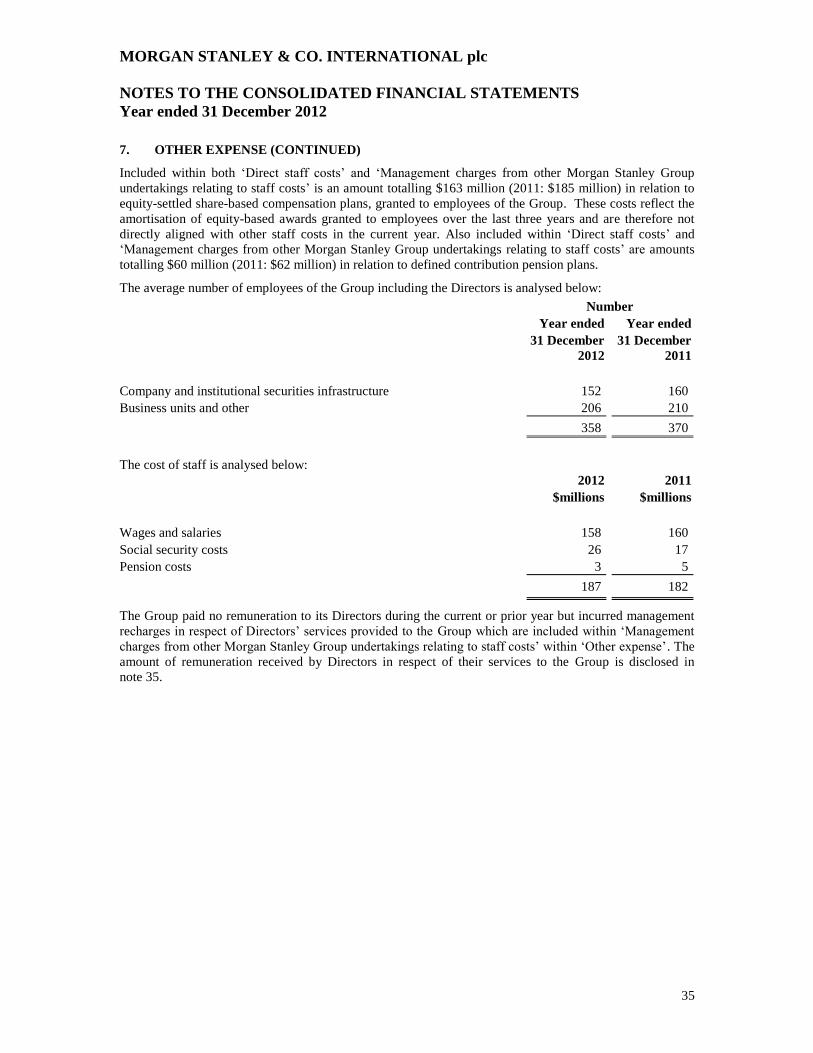
MORGAN STANLEY & CO. INTERNATIONAL plc
NOTES TO THE CONSOLIDATED FINANCIAL STATEMENTS
Year ended 31 December 2012
35
7. OTHER EXPENSE (CONTINUED)
Included within both ‘Direct staff costs’ and ‘Management charges from other Morgan Stanley Group
undertakings relating to staff costs’ is an amount totalling $163 million (2011: $185 million) in relation to
equity-settled share-based compensation plans, granted to employees of the Group. These costs reflect the
amortisation of equity-based awards granted to employees over the last three years and are therefore not
directly aligned with other staff costs in the current year. Also included within ‘Direct staff costs’ and
‘Management charges from other Morgan Stanley Group undertakings relating to staff costs’ are amounts
totalling $60 million (2011: $62 million) in relation to defined contribution pension plans.
The average number of employees of the Group including the Directors is analysed below:
Number
Year ended Year ended
31 December 31 December
2012 2011
Company and institutional securities infrastructure 152 160
Business units and other 206 210
358 370
The cost of staff is analysed below:
2012 2011
$millions $millions
Wages and salaries 158 160
Social security costs 26 17
Pension costs 3 5
187 182
The Group paid no remuneration to its Directors during the current or prior year but incurred management
recharges in respect of Directors’ services provided to the Group which are included within ‘Management
charges from other Morgan Stanley Group undertakings relating to staff costs’ within ‘Other expense’. The
amount of remuneration received by Directors in respect of their services to the Group is disclosed in
note 35.
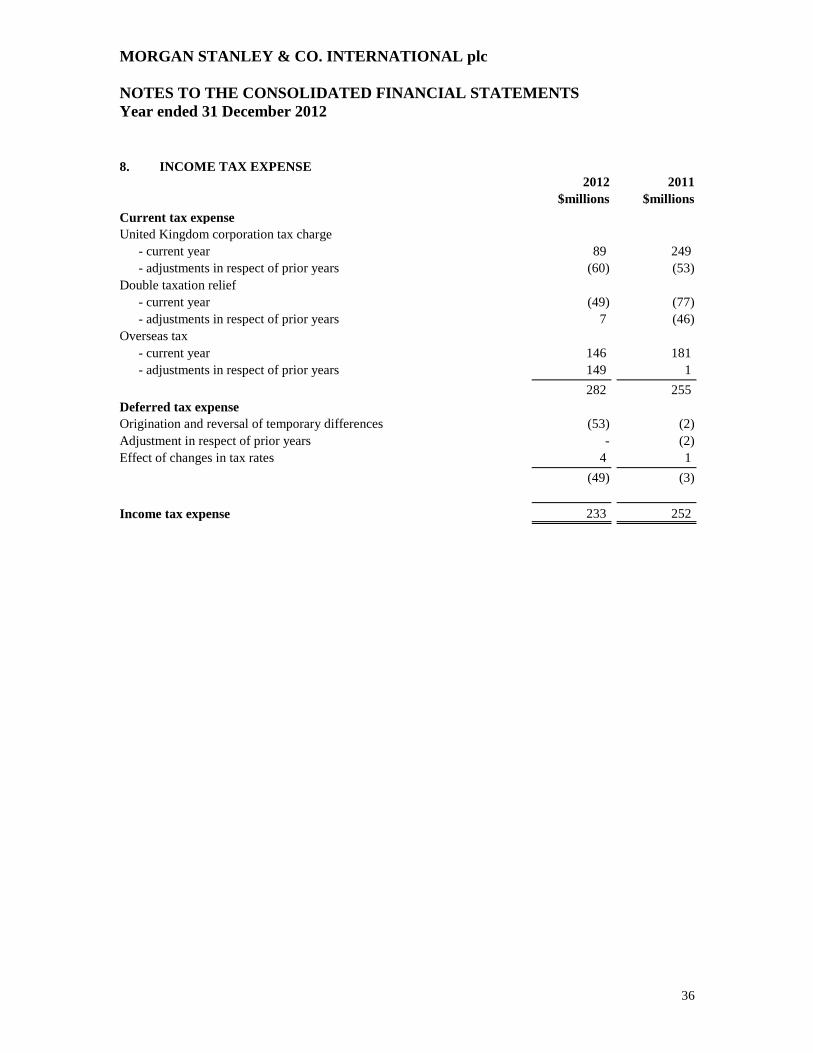
MORGAN STANLEY & CO. INTERNATIONAL plc
NOTES TO THE CONSOLIDATED FINANCIAL STATEMENTS
Year ended 31 December 2012
36
8. INCOME TAX EXPENSE
2012 2011
$millions $millions
Current tax expense
United Kingdom corporation tax charge
- current year 89 249
- adjustments in respect of prior years (60) (53)
Double taxation relief
- current year (49) (77)
- adjustments in respect of prior years 7 (46)
Overseas tax
- current year 146 181
- adjustments in respect of prior years 149 1
282 255
Deferred tax expense
Origination and reversal of temporary differences (53) (2)
Adjustment in respect of prior years - (2)
Effect of changes in tax rates 4 1
(49) (3)
Income tax expense 233 252
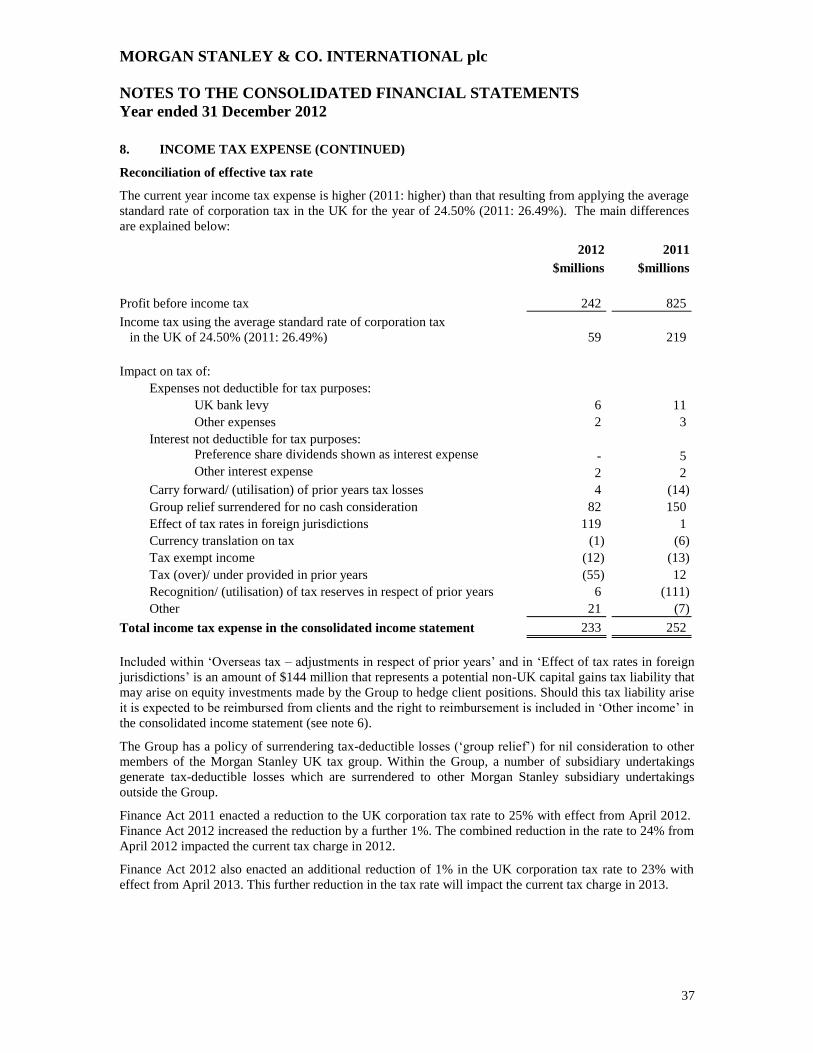
MORGAN STANLEY & CO. INTERNATIONAL plc
NOTES TO THE CONSOLIDATED FINANCIAL STATEMENTS
Year ended 31 December 2012
37
8. INCOME TAX EXPENSE (CONTINUED)
Reconciliation of effective tax rate
The current year income tax expense is higher (2011: higher) than that resulting from applying the average
standard rate of corporation tax in the UK for the year of 24.50% (2011: 26.49%). The main differences
are explained below:
2012 2011
$millions $millions
Profit before income tax 242 825
Income tax using the average standard rate of corporation tax
in the UK of 24.50% (2011: 26.49%) 59 219
Impact on tax of:
Expenses not deductible for tax purposes:
UK bank levy 6 11
Other expenses 2 3
Interest not deductible for tax purposes:
Preference share dividends shown as interest expense - 5
Other interest expense 2 2
Carry forward/ (utilisation) of prior years tax losses 4 (14)
Group relief surrendered for no cash consideration 82 150
Effect of tax rates in foreign jurisdictions 119 1
Currency translation on tax (1) (6)
Tax exempt income (12) (13)
Tax (over)/ under provided in prior years (55) 12
Recognition/ (utilisation) of tax reserves in respect of prior years 6 (111)
Other 21 (7)
Total income tax expense in the consolidated income statement 233 252
Included within ‘Overseas tax – adjustments in respect of prior years’ and in ‘Effect of tax rates in foreign
jurisdictions’ is an amount of $144 million that represents a potential non-UK capital gains tax liability that
may arise on equity investments made by the Group to hedge client positions. Should this tax liability arise
it is expected to be reimbursed from clients and the right to reimbursement is included in ‘Other income’ in
the consolidated income statement (see note 6).
The Group has a policy of surrendering tax-deductible losses (‘group relief’) for nil consideration to other
members of the Morgan Stanley UK tax group. Within the Group, a number of subsidiary undertakings
generate tax-deductible losses which are surrendered to other Morgan Stanley subsidiary undertakings
outside the Group.
Finance Act 2011 enacted a reduction to the UK corporation tax rate to 25% with effect from April 2012.
Finance Act 2012 increased the reduction by a further 1%. The combined reduction in the rate to 24% from
April 2012 impacted the current tax charge in 2012.
Finance Act 2012 also enacted an additional reduction of 1% in the UK corporation tax rate to 23% with
effect from April 2013. This further reduction in the tax rate will impact the current tax charge in 2013.
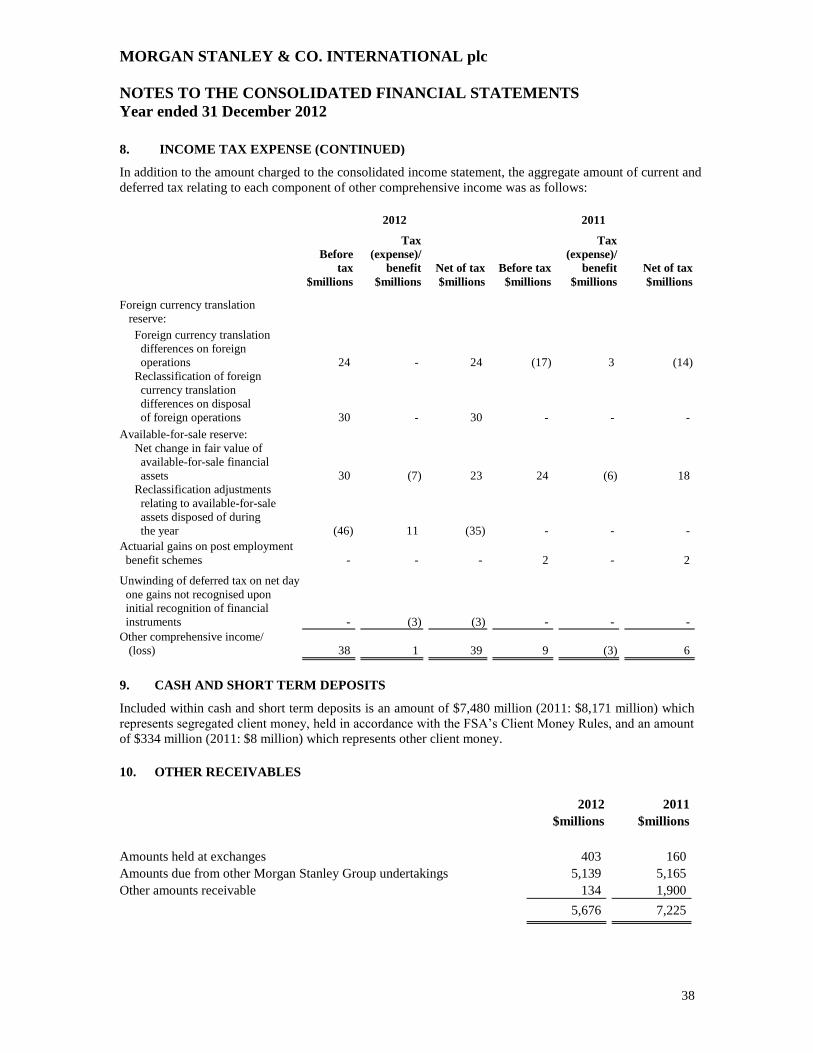
MORGAN STANLEY & CO. INTERNATIONAL plc
NOTES TO THE CONSOLIDATED FINANCIAL STATEMENTS
Year ended 31 December 2012
38
8. INCOME TAX EXPENSE (CONTINUED)
In addition to the amount charged to the consolidated income statement, the aggregate amount of current and
deferred tax relating to each component of other comprehensive income was as follows:
2012
2011
Before
tax
Tax
(expense)/
benefit Net of tax Before tax
Tax
(expense)/
benefit Net of tax
$millions $millions $millions $millions $millions $millions
Foreign currency translation
reserve:
Foreign currency translation
differences on foreign
operations 24 - 24 (17) 3 (14)
Reclassification of foreign
currency translation
differences on disposal
of foreign operations 30 - 30 - - -
Available-for-sale reserve:
Net change in fair value of
available-for-sale financial
assets 30 (7) 23 24 (6) 18
Reclassification adjustments
relating to available-for-sale
assets disposed of during
the year (46) 11 (35) - - -
Actuarial gains on post employment
benefit schemes - - - 2 - 2
Unwinding of deferred tax on net day
one gains not recognised upon
initial recognition of financial
instruments - (3) (3) - - -
Other comprehensive income/
(loss) 38 1 39 9 (3) 6
9. CASH AND SHORT TERM DEPOSITS
Included within cash and short term deposits is an amount of $7,480 million (2011: $8,171 million) which
represents segregated client money, held in accordance with the FSA’s Client Money Rules, and an amount
of $334 million (2011: $8 million) which represents other client money.
10. OTHER RECEIVABLES
2012 2011
$millions $millions
Amounts held at exchanges 403 160
Amounts due from other Morgan Stanley Group undertakings 5,139 5,165
Other amounts receivable 134 1,900
5,676 7,225
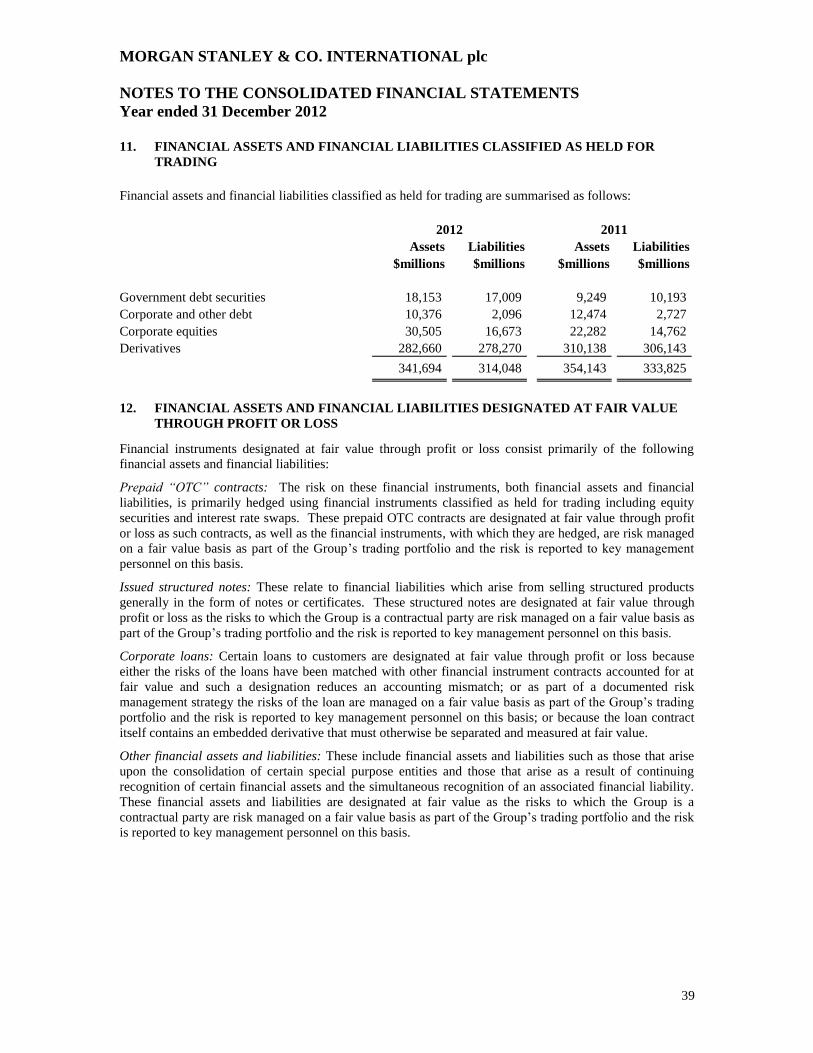
MORGAN STANLEY & CO. INTERNATIONAL plc
NOTES TO THE CONSOLIDATED FINANCIAL STATEMENTS
Year ended 31 December 2012
39
11. FINANCIAL ASSETS AND FINANCIAL LIABILITIES CLASSIFIED AS HELD FOR
TRADING
Financial assets and financial liabilities classified as held for trading are summarised as follows:
2012 2011
Assets Liabilities Assets Liabilities
$millions $millions $millions $millions
Government debt securities 18,153 17,009 9,249 10,193
Corporate and other debt 10,376 2,096 12,474 2,727
Corporate equities 30,505 16,673 22,282 14,762
Derivatives 282,660 278,270 310,138 306,143
341,694 314,048 354,143 333,825
12. FINANCIAL ASSETS AND FINANCIAL LIABILITIES DESIGNATED AT FAIR VALUE
THROUGH PROFIT OR LOSS
Financial instruments designated at fair value through profit or loss consist primarily of the following
financial assets and financial liabilities:
Prepaid “OTC” contracts: The risk on these financial instruments, both financial assets and financial
liabilities, is primarily hedged using financial instruments classified as held for trading including equity
securities and interest rate swaps. These prepaid OTC contracts are designated at fair value through profit
or loss as such contracts, as well as the financial instruments, with which they are hedged, are risk managed
on a fair value basis as part of the Group’s trading portfolio and the risk is reported to key management
personnel on this basis.
Issued structured notes: These relate to financial liabilities which arise from selling structured products
generally in the form of notes or certificates. These structured notes are designated at fair value through
profit or loss as the risks to which the Group is a contractual party are risk managed on a fair value basis as
part of the Group’s trading portfolio and the risk is reported to key management personnel on this basis.
Corporate loans: Certain loans to customers are designated at fair value through profit or loss because
either the risks of the loans have been matched with other financial instrument contracts accounted for at
fair value and such a designation reduces an accounting mismatch; or as part of a documented risk
management strategy the risks of the loan are managed on a fair value basis as part of the Group’s trading
portfolio and the risk is reported to key management personnel on this basis; or because the loan contract
itself contains an embedded derivative that must otherwise be separated and measured at fair value.
Other financial assets and liabilities: These include financial assets and liabilities such as those that arise
upon the consolidation of certain special purpose entities and those that arise as a result of continuing
recognition of certain financial assets and the simultaneous recognition of an associated financial liability.
These financial assets and liabilities are designated at fair value as the risks to which the Group is a
contractual party are risk managed on a fair value basis as part of the Group’s trading portfolio and the risk
is reported to key management personnel on this basis.
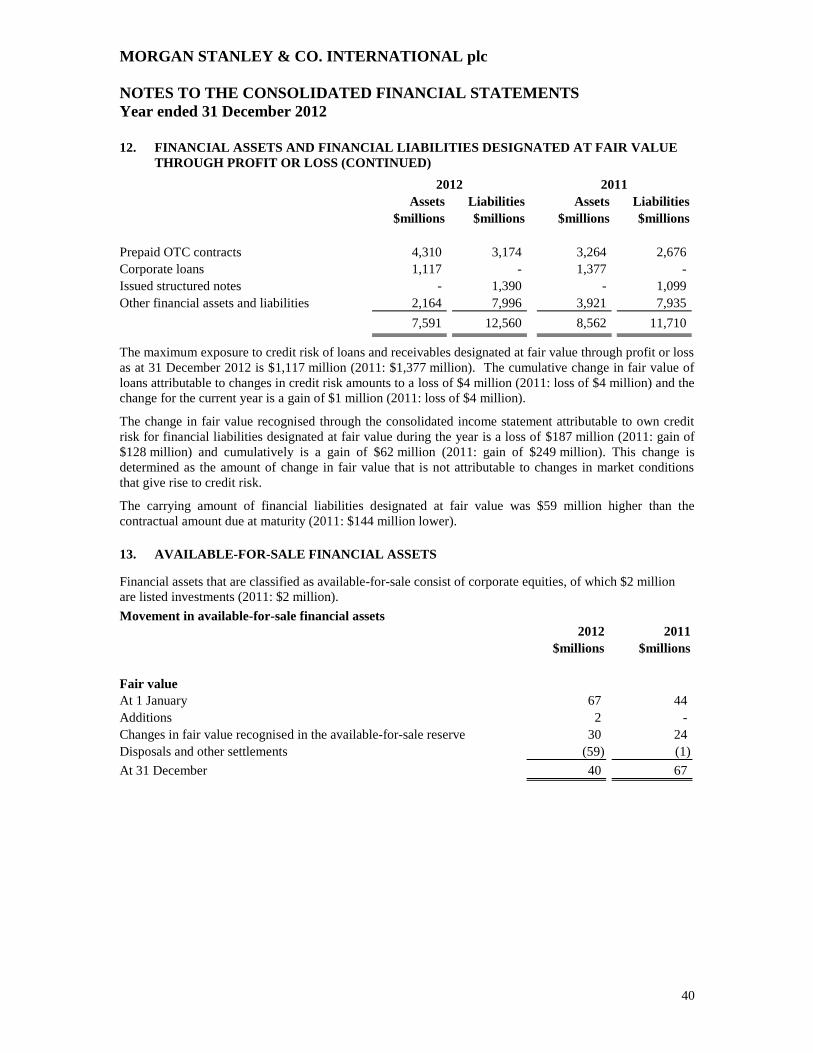
MORGAN STANLEY & CO. INTERNATIONAL plc
NOTES TO THE CONSOLIDATED FINANCIAL STATEMENTS
Year ended 31 December 2012
40
12. FINANCIAL ASSETS AND FINANCIAL LIABILITIES DESIGNATED AT FAIR VALUE
THROUGH PROFIT OR LOSS (CONTINUED)
2012 2011
Assets Liabilities Assets Liabilities
$millions $millions $millions $millions
Prepaid OTC contracts 4,310 3,174 3,264 2,676
Corporate loans 1,117 - 1,377 -
Issued structured notes - 1,390 - 1,099
Other financial assets and liabilities 2,164 7,996 3,921 7,935
7,591 12,560 8,562 11,710
The maximum exposure to credit risk of loans and receivables designated at fair value through profit or loss
as at 31 December 2012 is $1,117 million (2011: $1,377 million). The cumulative change in fair value of
loans attributable to changes in credit risk amounts to a loss of $4 million (2011: loss of $4 million) and the
change for the current year is a gain of $1 million (2011: loss of $4 million).
The change in fair value recognised through the consolidated income statement attributable to own credit
risk for financial liabilities designated at fair value during the year is a loss of $187 million (2011: gain of
$128 million) and cumulatively is a gain of $62 million (2011: gain of $249 million). This change is
determined as the amount of change in fair value that is not attributable to changes in market conditions
that give rise to credit risk.
The carrying amount of financial liabilities designated at fair value was $59 million higher than the
contractual amount due at maturity (2011: $144 million lower).
13. AVAILABLE-FOR-SALE FINANCIAL ASSETS
Financial assets that are classified as available-for-sale consist of corporate equities, of which $2 million
are listed investments (2011: $2 million).
Movement in available-for-sale financial assets
2012 2011
$millions $millions
Fair value
At 1 January 67 44
Additions 2 -
Changes in fair value recognised in the available-for-sale reserve 30 24
Disposals and other settlements (59) (1)
At 31 December 40 67
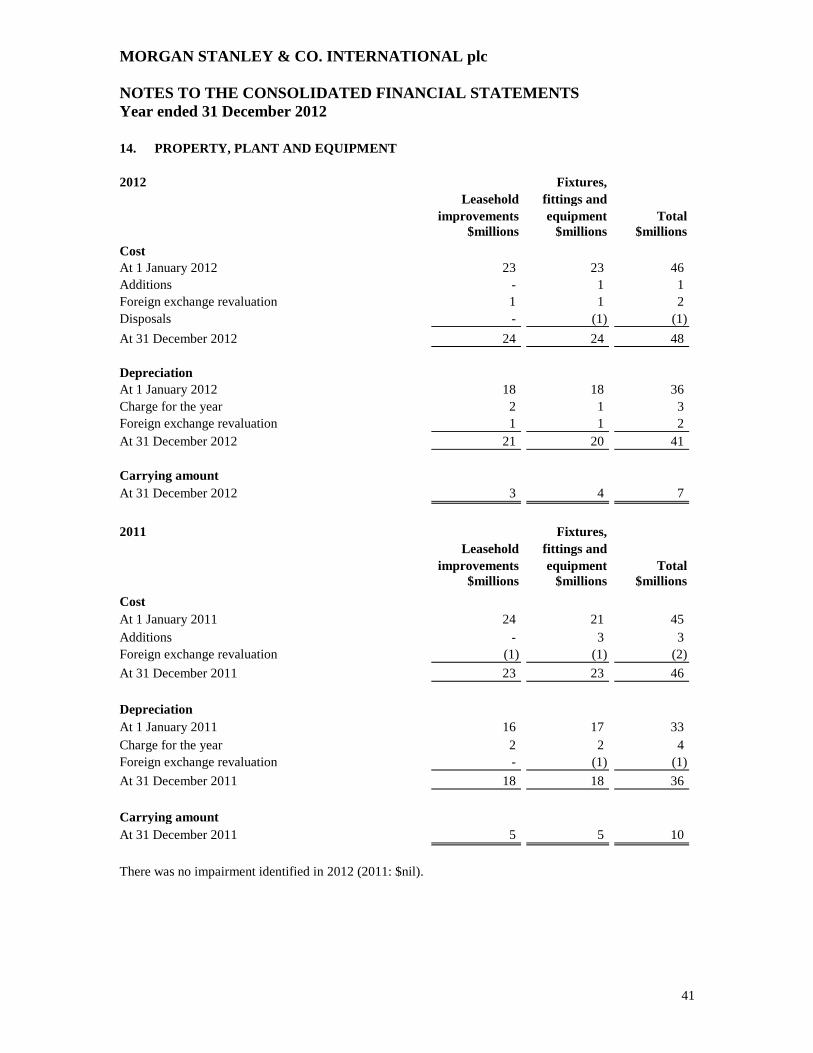
MORGAN STANLEY & CO. INTERNATIONAL plc
NOTES TO THE CONSOLIDATED FINANCIAL STATEMENTS
Year ended 31 December 2012
41
14. PROPERTY, PLANT AND EQUIPMENT
2012 Fixtures,
Leasehold fittings and
improvements equipment Total
$millions $millions $millions
Cost
At 1 January 2012 23 23 46
Additions - 1 1
Foreign exchange revaluation 1 1 2
Disposals - (1) (1)
At 31 December 2012 24 24 48
Depreciation
At 1 January 2012 18 18 36
Charge for the year 2 1 3
Foreign exchange revaluation 1 1 2
At 31 December 2012 21 20 41
Carrying amount
At 31 December 2012 3 4 7
2011 Fixtures,
Leasehold fittings and
improvements equipment Total
$millions $millions $millions
Cost
At 1 January 2011 24 21 45
Additions - 3 3
Foreign exchange revaluation (1) (1) (2)
At 31 December 2011 23 23 46
Depreciation
At 1 January 2011 16 17 33
Charge for the year 2 2 4
Foreign exchange revaluation - (1) (1)
At 31 December 2011 18 18 36
Carrying amount
At 31 December 2011 5 5 10
There was no impairment identified in 2012 (2011: $nil).
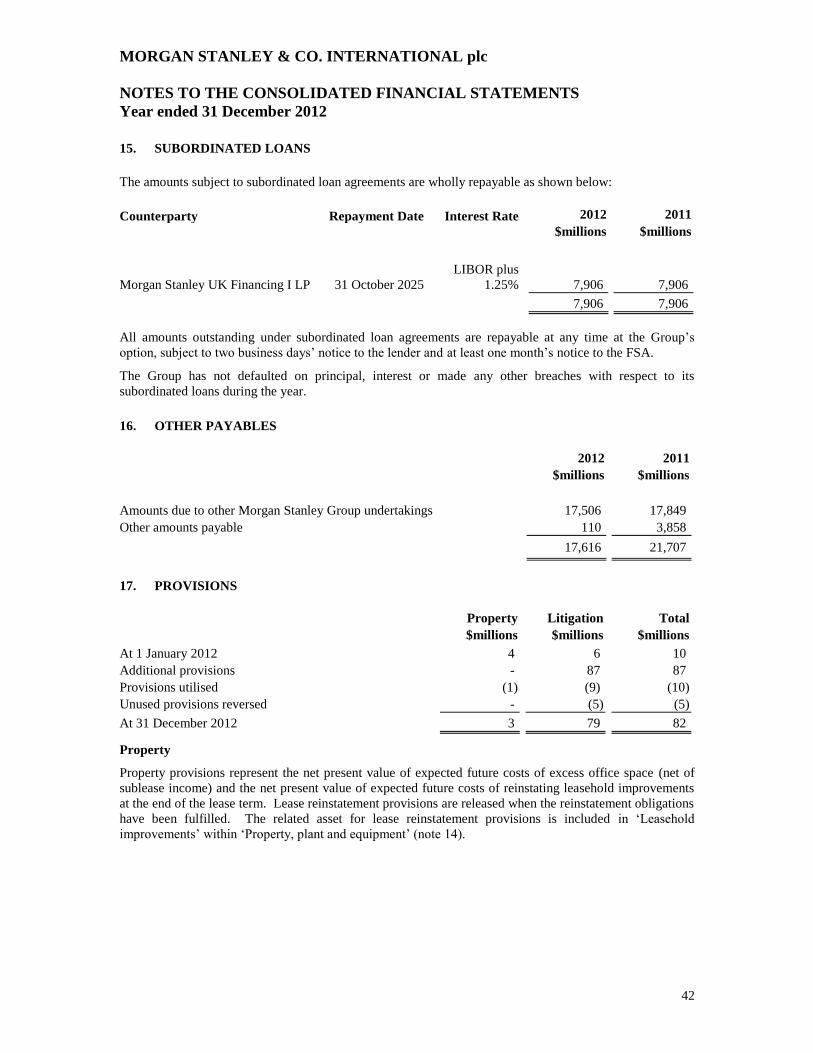
MORGAN STANLEY & CO. INTERNATIONAL plc
NOTES TO THE CONSOLIDATED FINANCIAL STATEMENTS
Year ended 31 December 2012
42
15. SUBORDINATED LOANS
The amounts subject to subordinated loan agreements are wholly repayable as shown below:
Counterparty Repayment Date Interest Rate 2012 2011
$millions $millions
Morgan Stanley UK Financing I LP 31 October 2025
LIBOR plus
1.25%
7,906 7,906
7,906 7,906
All amounts outstanding under subordinated loan agreements are repayable at any time at the Group’s
option, subject to two business days’ notice to the lender and at least one month’s notice to the FSA.
The Group has not defaulted on principal, interest or made any other breaches with respect to its
subordinated loans during the year.
16. OTHER PAYABLES
2012 2011
$millions $millions
Amounts due to other Morgan Stanley Group undertakings 17,506 17,849
Other amounts payable 110 3,858
17,616 21,707
17. PROVISIONS
Property Litigation Total
$millions $millions $millions
At 1 January 2012 4 6 10
Additional provisions - 87 87
Provisions utilised (1) (9) (10)
Unused provisions reversed - (5) (5)
At 31 December 2012 3 79 82
Property
Property provisions represent the net present value of expected future costs of excess office space (net of
sublease income) and the net present value of expected future costs of reinstating leasehold improvements
at the end of the lease term. Lease reinstatement provisions are released when the reinstatement obligations
have been fulfilled. The related asset for lease reinstatement provisions is included in ‘Leasehold
improvements’ within ‘Property, plant and equipment’ (note 14).
MORGAN STANLEY & CO. INTERNATIONAL plc
NOTES TO THE CONSOLIDATED FINANCIAL STATEMENTS
Year ended 31 December 2012
43
17. PROVISIONS (CONTINUED)
Litigation matters
In the normal course of business, the Group has been named, from time to time, as a defendant in various
legal actions, including arbitrations, class actions and other litigation, arising in connection with its
activities as a global diversified financial services institution. Certain of the actual or threatened legal
actions include claims for substantial compensatory and/or punitive damages or claims for indeterminate
amounts of damages. In some cases, the entities that would otherwise be the primary defendants in such
cases are bankrupt or are in financial distress. These actions have included, but are not limited to,
residential mortgage and credit crisis related matters. Over the last several years, the level of litigation and
investigatory activity focused on residential mortgage and credit crisis related matters has increased
materially in the financial services industry. As a result, the Group may become the subject of increased
claims for damages and other relief regarding residential mortgages and related securities in the future and,
while the Group has identified below any individual proceedings where the Group believes a material loss
to be reasonably possible and reasonably estimable, there can be no assurance that material losses will not
be incurred from claims that have not yet been notified to the Group or are not yet determined to be
probable or possible and reasonably estimable losses.
The Group is also involved, from time to time, in other reviews, investigations and proceedings (both
formal and informal) by governmental and self-regulatory agencies regarding the Group’s business and
involving, among other matters, accounting and operational matters, certain of which may result in adverse
judgments, settlements, fines, penalties, injunctions or other relief.
The Group contests liability and/or the amount of damages as appropriate in each pending matter. Where
available information indicates that it is probable a liability had been incurred at the date of the
consolidated financial statements and the Group can reasonably estimate the amount of that loss, the Group
accrues the estimated loss by a charge to income. In many proceedings, however, it is inherently difficult to
determine whether any loss is probable or even possible or to estimate the amount of any loss. In addition,
even where loss is possible or an exposure to loss exists in excess of the liability already accrued with
respect to a previously recognized loss contingency, it is not always possible to reasonably estimate the size
of the possible loss or range of loss.
For certain legal proceedings, the Group cannot reasonably estimate such losses, particularly for
proceedings that are in their early stages of development or where plaintiffs seek substantial or
indeterminate damages. Numerous issues may need to be resolved, including through potentially lengthy
discovery and determination of important factual matters, determination of issues related to class
certification and the calculation of damages, and by addressing novel or unsettled legal questions relevant
to the proceedings in question, before a loss or additional loss or range of loss or additional loss can be
reasonably estimated for any proceeding.
For certain other legal proceedings, the Group can estimate reasonably possible losses, additional losses,
ranges of loss or ranges of additional loss in excess of amounts accrued, but does not believe, based on
current knowledge and after consultation with counsel, that such losses will have a material adverse effect
on the Group’s consolidated financial statements as a whole, other than the matters referred to in the
following paragraphs.
MORGAN STANLEY & CO. INTERNATIONAL plc
NOTES TO THE CONSOLIDATED FINANCIAL STATEMENTS
Year ended 31 December 2012
44
17. PROVISIONS (CONTINUED)
Litigation matters (continued)
On 25 August 2008, the Morgan Stanley Group, the Group and two ratings agencies were named as
defendants in a purported class action related to securities issued by a structured investment vehicle
(“SIV”) called Cheyne Finance plc and Cheyne Finance LLC (together, the “Cheyne SIV”). The case is
styled Abu Dhabi Commercial Bank, et al. v. Morgan Stanley & Co. Inc., et al. and is pending in the United
States District Court for the Southern District of New York (“SDNY”). The complaint alleges, among other
things, that the ratings assigned to the securities issued by the Cheyne SIV were false and misleading,
including because the ratings did not accurately reflect the risks associated with the subprime residential
mortgage backed securities held by the Cheyne SIV. The plaintiffs currently assert allegations of aiding and
abetting fraud and negligent misrepresentation relating to approximately $852 million of securities issued
by the Cheyne SIV. The plaintiffs’ motion for class certification was denied in June 2010. The court
denied the Morgan Stanley Group’s and the Group’s motion for summary judgment on the aiding and
abetting fraud claim in August 2012. On 30 November 2012, the Morgan Stanley Group and the Group
filed a motion for summary judgment on the negligent misrepresentation claim. On 18 April 2013, the
Morgan Stanley Group and the Group have reached an agreement in principle to settle this matter.
On 15 July 2010, China Development Industrial Bank (“CDIB”) filed a complaint against the Morgan
Stanley Group, which is styled China Development Industrial Bank v. Morgan Stanley & Co. Incorporated
et al. and is pending in the Supreme Court of the State of New York, New York County. The complaint
relates to a $275 million credit default swap referencing the super senior portion of the STACK 2006-1
CDO. The complaint asserts claims for common law fraud, fraudulent inducement and fraudulent
concealment and alleges that the Morgan Stanley Group misrepresented the risks of the STACK 2006-1
CDO to CDIB, and that the Morgan Stanley Group knew that the assets backing the CDO were of poor
quality when it entered into the credit default swap with CDIB. The complaint seeks compensatory
damages related to the approximately $228 million that CDIB alleges it has already lost under the credit
default swap, rescission of CDIB’s obligation to pay an additional $12 million, punitive damages, equitable
relief, fees and costs. On 28 February 2011, the court presiding over this action denied the Morgan Stanley
Group’s motion to dismiss the complaint. On 7 July 2011, the appellate court affirmed the lower court’s
decision denying the motion to dismiss. Based on currently available information, the Morgan Stanley
Group believes it could incur a loss of up to approximately $240 million plus pre- and post-judgment
interest, fees and costs.
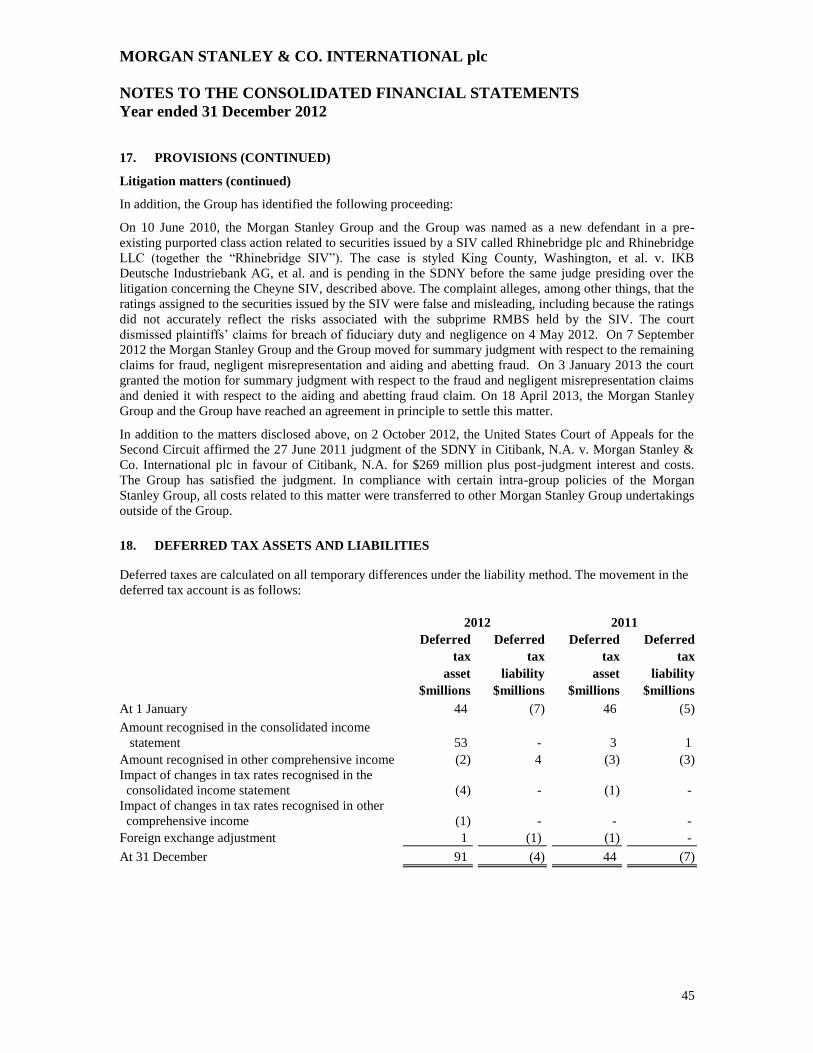
MORGAN STANLEY & CO. INTERNATIONAL plc
NOTES TO THE CONSOLIDATED FINANCIAL STATEMENTS
Year ended 31 December 2012
45
17. PROVISIONS (CONTINUED)
Litigation matters (continued)
In addition, the Group has identified the following proceeding:
On 10 June 2010, the Morgan Stanley Group and the Group was named as a new defendant in a pre-
existing purported class action related to securities issued by a SIV called Rhinebridge plc and Rhinebridge
LLC (together the “Rhinebridge SIV”). The case is styled King County, Washington, et al. v. IKB
Deutsche Industriebank AG, et al. and is pending in the SDNY before the same judge presiding over the
litigation concerning the Cheyne SIV, described above. The complaint alleges, among other things, that the
ratings assigned to the securities issued by the SIV were false and misleading, including because the ratings
did not accurately reflect the risks associated with the subprime RMBS held by the SIV. The court
dismissed plaintiffs’ claims for breach of fiduciary duty and negligence on 4 May 2012. On 7 September
2012 the Morgan Stanley Group and the Group moved for summary judgment with respect to the remaining
claims for fraud, negligent misrepresentation and aiding and abetting fraud. On 3 January 2013 the court
granted the motion for summary judgment with respect to the fraud and negligent misrepresentation claims
and denied it with respect to the aiding and abetting fraud claim. On 18 April 2013, the Morgan Stanley
Group and the Group have reached an agreement in principle to settle this matter.
In addition to the matters disclosed above, on 2 October 2012, the United States Court of Appeals for the
Second Circuit affirmed the 27 June 2011 judgment of the SDNY in Citibank, N.A. v. Morgan Stanley &
Co. International plc in favour of Citibank, N.A. for $269 million plus post-judgment interest and costs.
The Group has satisfied the judgment. In compliance with certain intra-group policies of the Morgan
Stanley Group, all costs related to this matter were transferred to other Morgan Stanley Group undertakings
outside of the Group.
18. DEFERRED TAX ASSETS AND LIABILITIES
Deferred taxes are calculated on all temporary differences under the liability method. The movement in the
deferred tax account is as follows:
2012 2011
Deferred Deferred Deferred Deferred
tax tax tax tax
asset liability asset liability
$millions $millions $millions $millions
At 1 January 44 (7) 46 (5)
Amount recognised in the consolidated income
statement 53 - 3 1
Amount recognised in other comprehensive income (2) 4 (3) (3)
Impact of changes in tax rates recognised in the
consolidated income statement (4) - (1) -
Impact of changes in tax rates recognised in other
comprehensive income (1) - - -
Foreign exchange adjustment 1 (1) (1) -
At 31 December 91 (4) 44 (7)
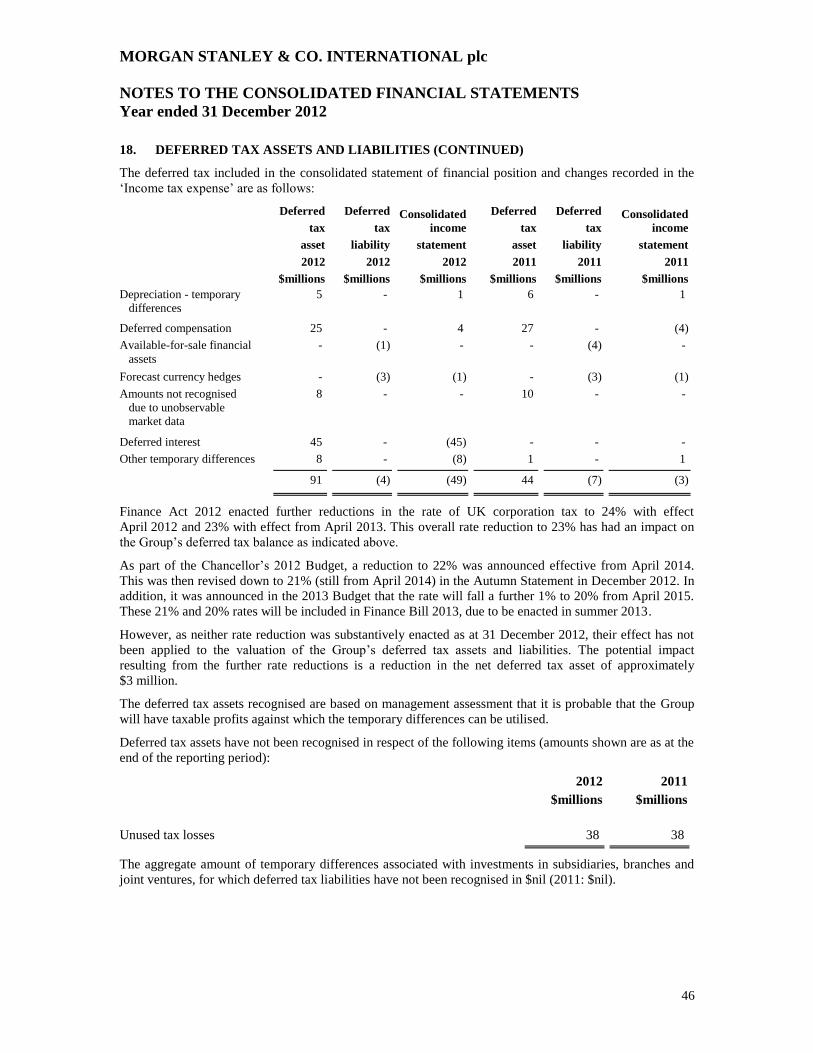
MORGAN STANLEY & CO. INTERNATIONAL plc
NOTES TO THE CONSOLIDATED FINANCIAL STATEMENTS
Year ended 31 December 2012
46
18. DEFERRED TAX ASSETS AND LIABILITIES (CONTINUED)
The deferred tax included in the consolidated statement of financial position and changes recorded in the
‘Income tax expense’ are as follows:
Deferred Deferred Consolidated Deferred Deferred Consolidated
tax tax income tax tax income
asset liability statement asset liability statement
2012 2012 2012 2011 2011 2011
$millions $millions $millions $millions $millions $millions
Depreciation - temporary
differences
5 - 1 6 - 1
Deferred compensation 25 - 4 27 - (4)
Available-for-sale financial
assets
- (1) - - (4) -
Forecast currency hedges - (3) (1) - (3) (1)
Amounts not recognised
due to unobservable
market data
8 - - 10 - -
Deferred interest 45 - (45) - - -
Other temporary differences 8 - (8) 1 - 1
91 (4) (49) 44 (7) (3)
Finance Act 2012 enacted further reductions in the rate of UK corporation tax to 24% with effect
April 2012 and 23% with effect from April 2013. This overall rate reduction to 23% has had an impact on
the Group’s deferred tax balance as indicated above.
As part of the Chancellor’s 2012 Budget, a reduction to 22% was announced effective from April 2014.
This was then revised down to 21% (still from April 2014) in the Autumn Statement in December 2012. In
addition, it was announced in the 2013 Budget that the rate will fall a further 1% to 20% from April 2015.
These 21% and 20% rates will be included in Finance Bill 2013, due to be enacted in summer 2013.
However, as neither rate reduction was substantively enacted as at 31 December 2012, their effect has not
been applied to the valuation of the Group’s deferred tax assets and liabilities. The potential impact
resulting from the further rate reductions is a reduction in the net deferred tax asset of approximately
$3 million.
The deferred tax assets recognised are based on management assessment that it is probable that the Group
will have taxable profits against which the temporary differences can be utilised.
Deferred tax assets have not been recognised in respect of the following items (amounts shown are as at the
end of the reporting period):
2012 2011
$millions $millions
Unused tax losses 38 38
The aggregate amount of temporary differences associated with investments in subsidiaries, branches and
joint ventures, for which deferred tax liabilities have not been recognised in $nil (2011: $nil).
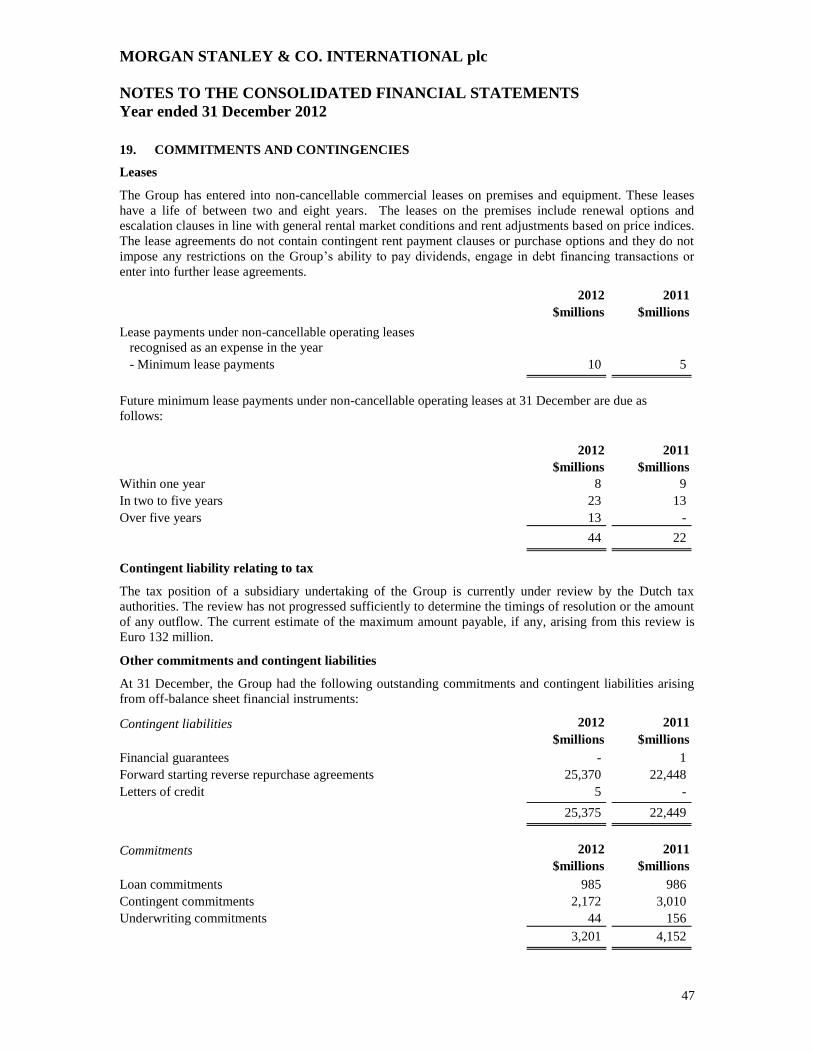
MORGAN STANLEY & CO. INTERNATIONAL plc
NOTES TO THE CONSOLIDATED FINANCIAL STATEMENTS
Year ended 31 December 2012
47
19. COMMITMENTS AND CONTINGENCIES
Leases
The Group has entered into non-cancellable commercial leases on premises and equipment. These leases
have a life of between two and eight years. The leases on the premises include renewal options and
escalation clauses in line with general rental market conditions and rent adjustments based on price indices.
The lease agreements do not contain contingent rent payment clauses or purchase options and they do not
impose any restrictions on the Group’s ability to pay dividends, engage in debt financing transactions or
enter into further lease agreements.
2012 2011
$millions $millions
Lease payments under non-cancellable operating leases
recognised as an expense in the year
- Minimum lease payments 10 5
Future minimum lease payments under non-cancellable operating leases at 31 December are due as
follows:
2012 2011
$millions $millions
Within one year 8 9
In two to five years 23 13
Over five years 13 -
44 22
Contingent liability relating to tax
The tax position of a subsidiary undertaking of the Group is currently under review by the Dutch tax
authorities. The review has not progressed sufficiently to determine the timings of resolution or the amount
of any outflow. The current estimate of the maximum amount payable, if any, arising from this review is
Euro 132 million.
Other commitments and contingent liabilities
At 31 December, the Group had the following outstanding commitments and contingent liabilities arising
from off-balance sheet financial instruments:
Contingent liabilities 2012 2011
$millions $millions
Financial guarantees - 1
Forward starting reverse repurchase agreements 25,370 22,448
Letters of credit 5 -
25,375 22,449
Commitments 2012 2011
$millions $millions
Loan commitments 985 986
Contingent commitments 2,172 3,010
Underwriting commitments 44 156
3,201 4,152
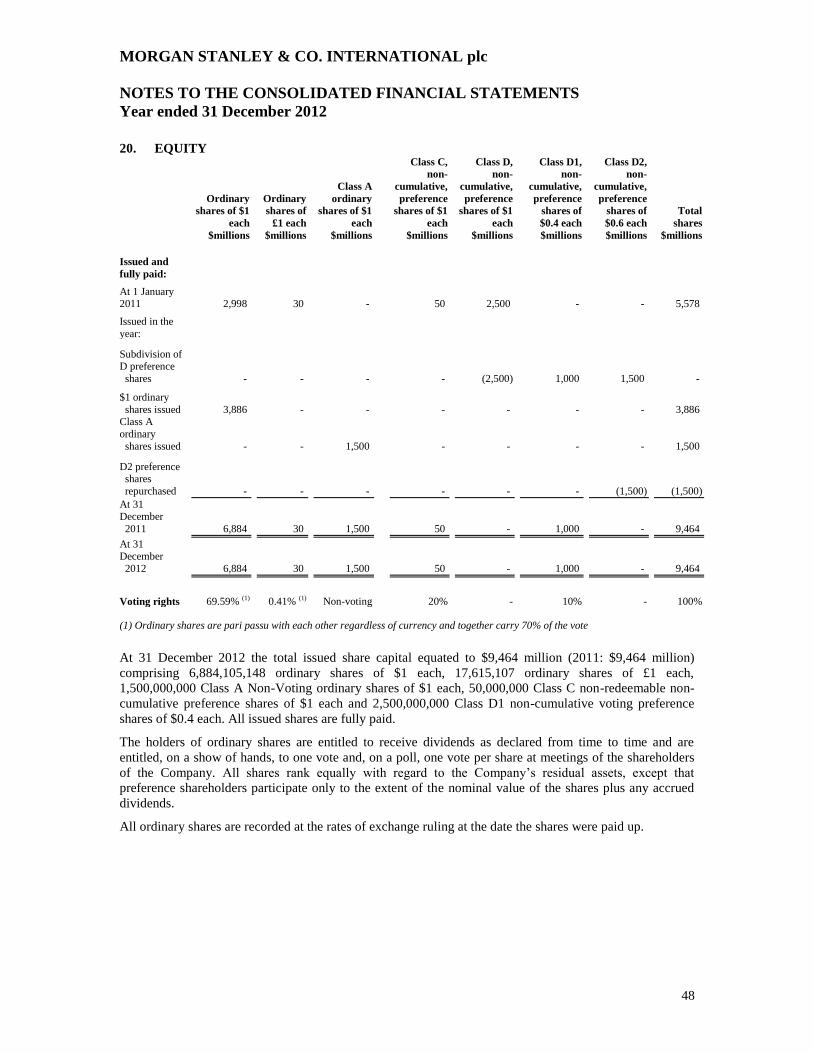
MORGAN STANLEY & CO. INTERNATIONAL plc
NOTES TO THE CONSOLIDATED FINANCIAL STATEMENTS
Year ended 31 December 2012
48
20. EQUITY
Ordinary
shares of $1
each
Ordinary
shares of
£1 each
Class A
ordinary
shares of $1
each
Class C,
non-
cumulative,
preference
shares of $1
each
Class D,
non-
cumulative,
preference
shares of $1
each
Class D1,
non-
cumulative,
preference
shares of
$0.4 each
Class D2,
non-
cumulative,
preference
shares of
$0.6 each
Total
shares
$millions $millions $millions $millions $millions $millions $millions $millions
Issued and
fully paid:
At 1 January 2011 2,998 30 - 50 2,500 - - 5,578
Issued in the
year:
Subdivision of D preference
shares - - - - (2,500) 1,000 1,500 -
$1 ordinary
shares issued 3,886 - - - - - - 3,886 Class A
ordinary
shares issued - - 1,500 - - - - 1,500
D2 preference shares
repurchased - - - - - - (1,500) (1,500)
At 31 December
2011 6,884 30 1,500 50 - 1,000 - 9,464
At 31 December
2012 6,884 30 1,500 50 - 1,000 - 9,464
Voting rights 69.59% (1) 0.41% (1) Non-voting 20% - 10% - 100%
(1) Ordinary shares are pari passu with each other regardless of currency and together carry 70% of the vote
At 31 December 2012 the total issued share capital equated to $9,464 million (2011: $9,464 million)
comprising 6,884,105,148 ordinary shares of $1 each, 17,615,107 ordinary shares of £1 each,
1,500,000,000 Class A Non-Voting ordinary shares of $1 each, 50,000,000 Class C non-redeemable non-
cumulative preference shares of $1 each and 2,500,000,000 Class D1 non-cumulative voting preference
shares of $0.4 each. All issued shares are fully paid.
The holders of ordinary shares are entitled to receive dividends as declared from time to time and are
entitled, on a show of hands, to one vote and, on a poll, one vote per share at meetings of the shareholders
of the Company. All shares rank equally with regard to the Company’s residual assets, except that
preference shareholders participate only to the extent of the nominal value of the shares plus any accrued
dividends.
All ordinary shares are recorded at the rates of exchange ruling at the date the shares were paid up.
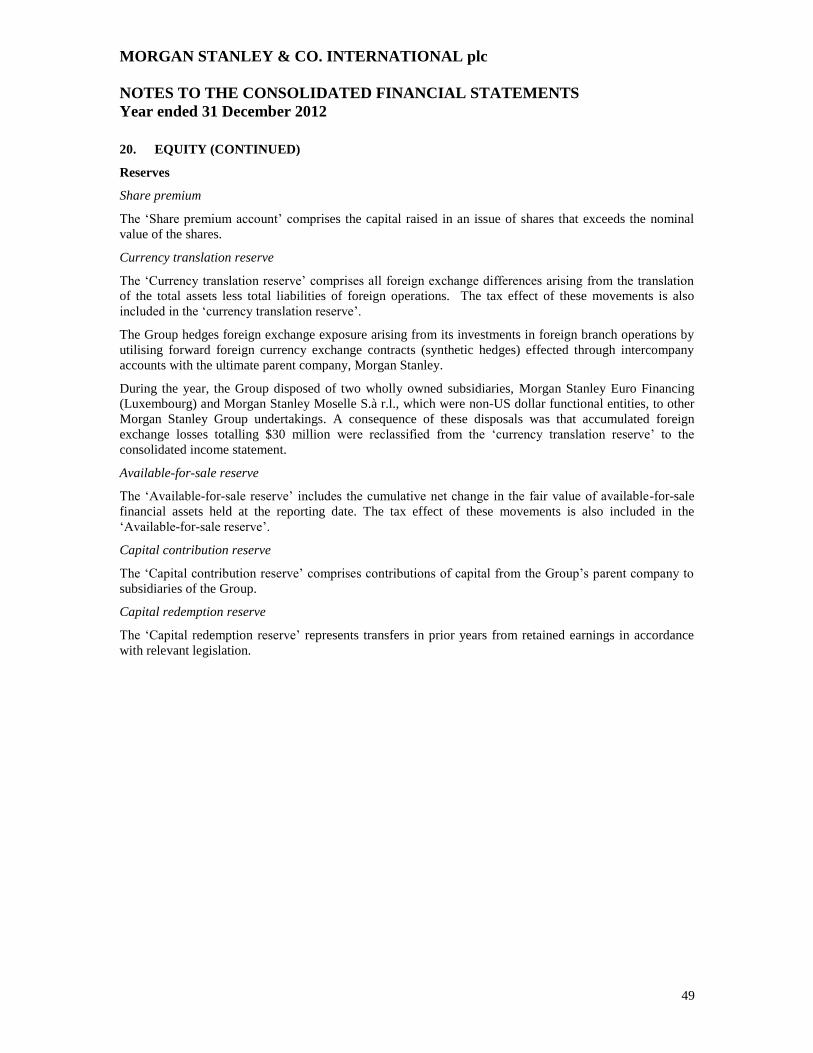
MORGAN STANLEY & CO. INTERNATIONAL plc
NOTES TO THE CONSOLIDATED FINANCIAL STATEMENTS
Year ended 31 December 2012
49
20. EQUITY (CONTINUED)
Reserves
Share premium
The ‘Share premium account’ comprises the capital raised in an issue of shares that exceeds the nominal
value of the shares.
Currency translation reserve
The ‘Currency translation reserve’ comprises all foreign exchange differences arising from the translation
of the total assets less total liabilities of foreign operations. The tax effect of these movements is also
included in the ‘currency translation reserve’.
The Group hedges foreign exchange exposure arising from its investments in foreign branch operations by
utilising forward foreign currency exchange contracts (synthetic hedges) effected through intercompany
accounts with the ultimate parent company, Morgan Stanley.
During the year, the Group disposed of two wholly owned subsidiaries, Morgan Stanley Euro Financing
(Luxembourg) and Morgan Stanley Moselle S.à r.l., which were non-US dollar functional entities, to other
Morgan Stanley Group undertakings. A consequence of these disposals was that accumulated foreign
exchange losses totalling $30 million were reclassified from the ‘currency translation reserve’ to the
consolidated income statement.
Available-for-sale reserve
The ‘Available-for-sale reserve’ includes the cumulative net change in the fair value of available-for-sale
financial assets held at the reporting date. The tax effect of these movements is also included in the
‘Available-for-sale reserve’.
Capital contribution reserve
The ‘Capital contribution reserve’ comprises contributions of capital from the Group’s parent company to
subsidiaries of the Group.
Capital redemption reserve
The ‘Capital redemption reserve’ represents transfers in prior years from retained earnings in accordance
with relevant legislation.
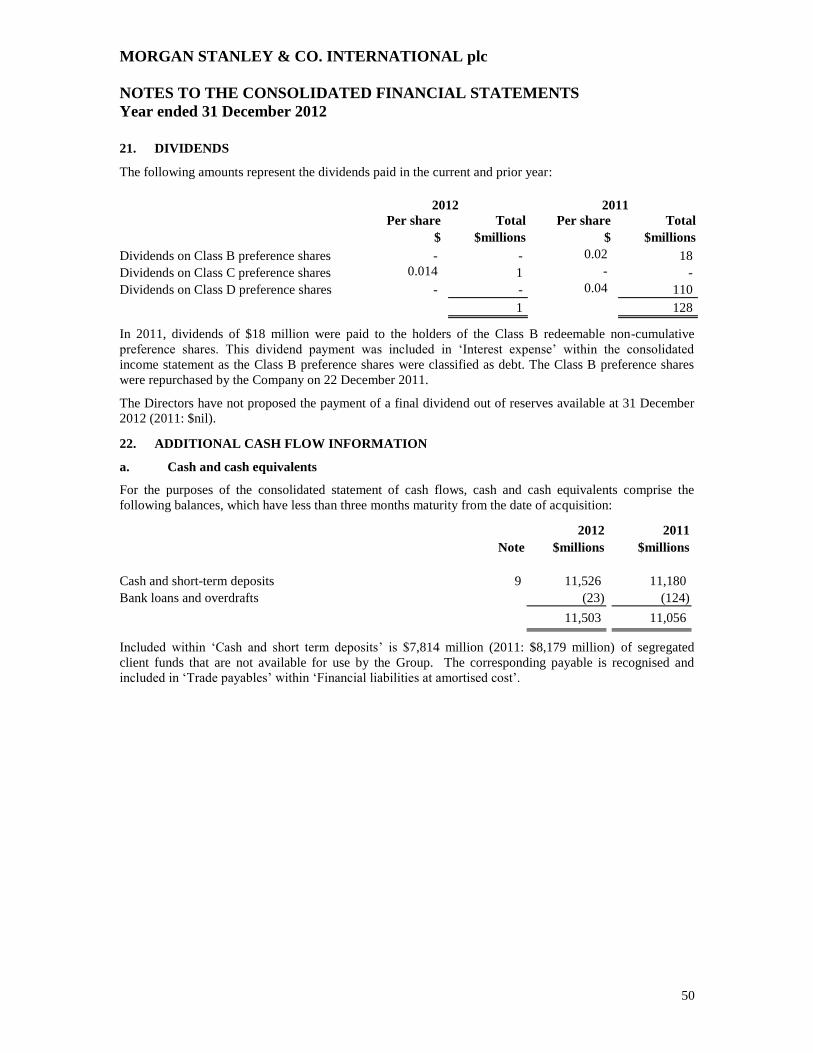
MORGAN STANLEY & CO. INTERNATIONAL plc
NOTES TO THE CONSOLIDATED FINANCIAL STATEMENTS
Year ended 31 December 2012
50
21. DIVIDENDS
The following amounts represent the dividends paid in the current and prior year:
2012 2011
Per share Total Per share Total
$ $millions $ $millions
Dividends on Class B preference shares - - 0.02 18
Dividends on Class C preference shares 0.014 1 - -
Dividends on Class D preference shares - - 0.04 110
1 128
In 2011, dividends of $18 million were paid to the holders of the Class B redeemable non-cumulative
preference shares. This dividend payment was included in ‘Interest expense’ within the consolidated
income statement as the Class B preference shares were classified as debt. The Class B preference shares
were repurchased by the Company on 22 December 2011.
The Directors have not proposed the payment of a final dividend out of reserves available at 31 December
2012 (2011: $nil).
22. ADDITIONAL CASH FLOW INFORMATION
a. Cash and cash equivalents
For the purposes of the consolidated statement of cash flows, cash and cash equivalents comprise the
following balances, which have less than three months maturity from the date of acquisition:
2012 2011
Note $millions $millions
Cash and short-term deposits 9 11,526 11,180
Bank loans and overdrafts (23) (124)
11,503 11,056
Included within ‘Cash and short term deposits’ is $7,814 million (2011: $8,179 million) of segregated
client funds that are not available for use by the Group. The corresponding payable is recognised and
included in ‘Trade payables’ within ‘Financial liabilities at amortised cost’.
MORGAN STANLEY & CO. INTERNATIONAL plc
NOTES TO THE CONSOLIDATED FINANCIAL STATEMENTS
Year ended 31 December 2012
51
22.
ADDITIONAL CASH FLOW INFORMATION (CONTINUED)
b. Reconciliation of cash flows from operating activities
2012 2011
Note $millions $millions
Profit for the year 9 573
Adjustments for:
Net gains on available-for-sale financial assets 4 (50) -
Non-UK capital gains tax recoverable 6 (150) -
Depreciation on property, plant and equipment 14 3 4
Interest income (2,596) (4,003)
Interest expense 3,033 3,990
Income tax expense 233 252
Loss/ (gain) on disposal of subsidiary / joint venture 34 30 (21)
Other expenses - 1
Operating cash flows before changes in operating assets and
liabilities 512 796
Changes in operating assets
(Increase)/ decrease in loans and receivables, excluding
cash and short term deposits (3,631) 16,093
Decrease/(increase) in financial assets classified as held for
trading 12,449 (83,149)
Decrease in financial assets designated at fair value
through profit or loss 971 797
9,789 (66,259)
Changes in operating liabilities
Increase/ (decrease) in financial liabilities at amortised cost,
excluding bank loans and overdrafts 7,402 (47,613)
(Decrease)/increase in financial liabilities classified as held for
trading (19,777) 113,032
Increase/ (decrease) in financial liabilities designated at fair value
through profit or loss 850 (2,003)
Increase/ (decrease) in provisions 72 (19)
(11,453) 63,397
Interest received 2,489 4,134
Interest paid (2,736) (3,853)
Income taxes paid (24) (387)
Effect of foreign exchange movements (96) (128)
Net cash flows used in operating activities (1,519) (2,300)
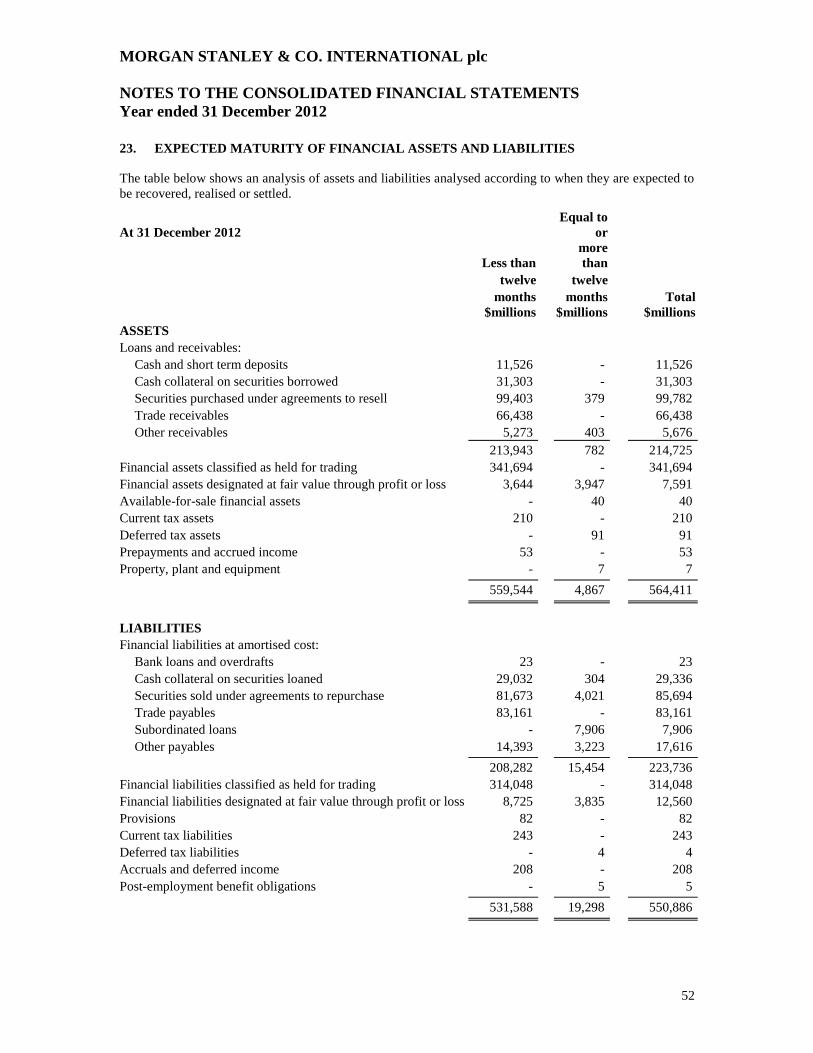
MORGAN STANLEY & CO. INTERNATIONAL plc
NOTES TO THE CONSOLIDATED FINANCIAL STATEMENTS
Year ended 31 December 2012
52
23. EXPECTED MATURITY OF FINANCIAL ASSETS AND LIABILITIES
The table below shows an analysis of assets and liabilities analysed according to when they are expected to
be recovered, realised or settled.
At 31 December 2012
Equal to
or
Less than
more
than
twelve twelve
months months Total
$millions $millions $millions
ASSETS
Loans and receivables:
Cash and short term deposits 11,526 - 11,526
Cash collateral on securities borrowed 31,303 - 31,303
Securities purchased under agreements to resell 99,403 379 99,782
Trade receivables 66,438 - 66,438
Other receivables 5,273 403 5,676
213,943 782 214,725
Financial assets classified as held for trading 341,694 - 341,694
Financial assets designated at fair value through profit or loss 3,644 3,947 7,591
Available-for-sale financial assets - 40 40
Current tax assets 210 - 210
Deferred tax assets - 91 91
Prepayments and accrued income 53 - 53
Property, plant and equipment - 7 7
559,544 4,867 564,411
LIABILITIES
Financial liabilities at amortised cost:
Bank loans and overdrafts 23 - 23
Cash collateral on securities loaned 29,032 304 29,336
Securities sold under agreements to repurchase 81,673 4,021 85,694
Trade payables 83,161 - 83,161
Subordinated loans - 7,906 7,906
Other payables 14,393 3,223 17,616
208,282 15,454 223,736
Financial liabilities classified as held for trading 314,048 - 314,048
Financial liabilities designated at fair value through profit or loss 8,725 3,835 12,560
Provisions 82 - 82
Current tax liabilities 243 - 243
Deferred tax liabilities - 4 4
Accruals and deferred income 208 - 208
Post-employment benefit obligations - 5 5
531,588 19,298 550,886
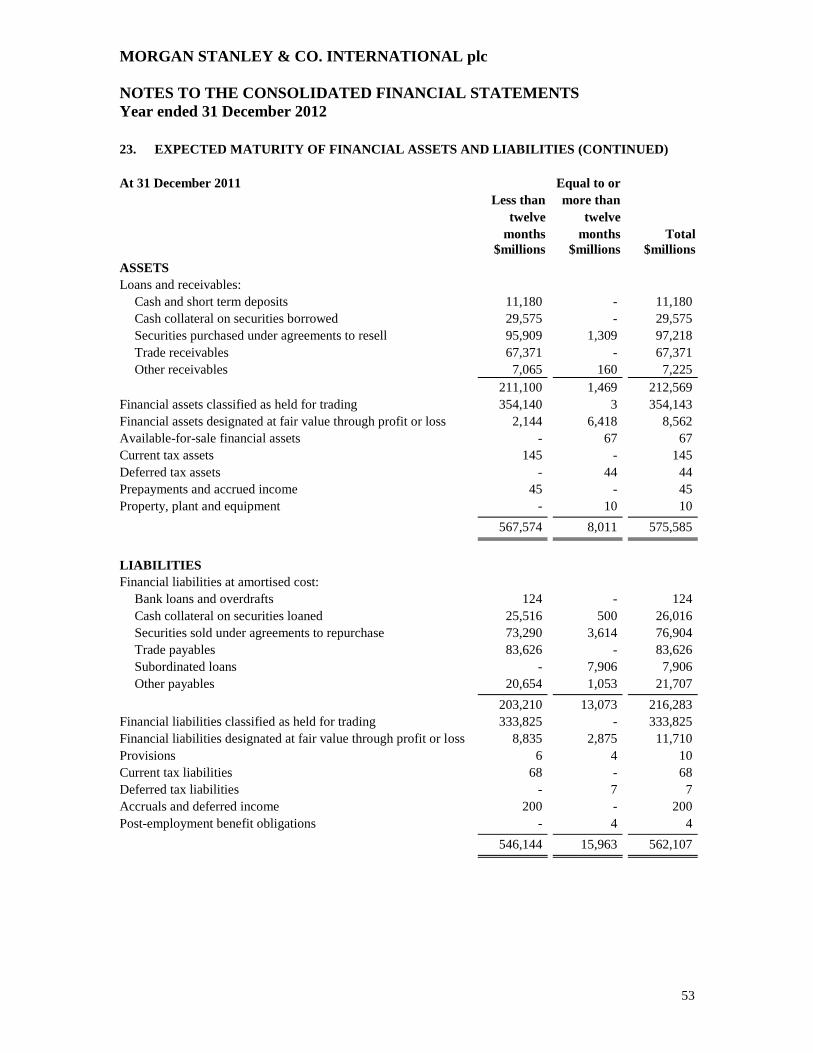
MORGAN STANLEY & CO. INTERNATIONAL plc
NOTES TO THE CONSOLIDATED FINANCIAL STATEMENTS
Year ended 31 December 2012
53
23. EXPECTED MATURITY OF FINANCIAL ASSETS AND LIABILITIES (CONTINUED)
At 31 December 2011 Equal to or
Less than more than
twelve twelve
months months Total
$millions $millions $millions
ASSETS
Loans and receivables:
Cash and short term deposits 11,180 - 11,180
Cash collateral on securities borrowed 29,575 - 29,575
Securities purchased under agreements to resell 95,909 1,309 97,218
Trade receivables 67,371 - 67,371
Other receivables 7,065 160 7,225
211,100 1,469 212,569
Financial assets classified as held for trading 354,140 3 354,143
Financial assets designated at fair value through profit or loss 2,144 6,418 8,562
Available-for-sale financial assets - 67 67
Current tax assets 145 - 145
Deferred tax assets - 44 44
Prepayments and accrued income 45 - 45
Property, plant and equipment - 10 10
567,574 8,011 575,585
LIABILITIES
Financial liabilities at amortised cost:
Bank loans and overdrafts 124 - 124
Cash collateral on securities loaned 25,516 500 26,016
Securities sold under agreements to repurchase 73,290 3,614 76,904
Trade payables 83,626 - 83,626
Subordinated loans - 7,906 7,906
Other payables 20,654 1,053 21,707
203,210 13,073 216,283
Financial liabilities classified as held for trading 333,825 - 333,825
Financial liabilities designated at fair value through profit or loss 8,835 2,875 11,710
Provisions 6 4 10
Current tax liabilities 68 - 68
Deferred tax liabilities - 7 7
Accruals and deferred income 200 - 200
Post-employment benefit obligations - 4 4
546,144 15,963 562,107
MORGAN STANLEY & CO. INTERNATIONAL plc
NOTES TO THE CONSOLIDATED FINANCIAL STATEMENTS
Year ended 31 December 2012
54
24. SEGMENT REPORTING
Segment information is presented in respect of the Group’s business and geographical segments. The
business segments and geographical segments are based on the Group’s management and internal reporting
structure. Transactions between business segments are on normal commercial terms and conditions.
Business segments
Morgan Stanley structures its business segments primarily based upon the nature of the financial products
and services provided to customers and Morgan Stanley’s internal management structure. The Group’s own
business segments are consistent with those of Morgan Stanley.
The Group has two reportable business segments; Institutional Securities, Asset Management Institutional
securities include the following activities: financial advisory and capital raising services; corporate lending;
sales, trading, financing and market-making activities in equity and fixed income securities and related
products, including foreign exchange and commodities; and investment activities. Asset management
include a range of alternative investment, real estate investing and merchant banking products for
institutional investors and high net worth individuals.
Selected financial information to reconcile segment information to the Group’s information is presented
below.
2012 Institutional
securities
Asset
management Other Total
$millions $millions $millions $millions
Consolidated income statement
information:
Net gains/ (losses) on financial instruments
classified as held for trading 3,577 - (6) 3,571
Net gains on financial instruments designated
at fair value through profit or loss 96 - - 96
Net gains on available-for-sale financial assets 50 - - 50
Net interest (438) - 1 (437)
Other income 345 41 8 394
External revenues net of interest 3,630 41 3 3,674
Other expense (3,334) (67) (1) (3,402)
Loss on disposal of subsidiaries (30) - - (30)
Profit/ (loss) before income tax 266 (26) 2 242
Income tax expense/ (credit) (239) 6 - (233)
Profit/ (loss) for the year 27 (20) 2 9
Consolidated statement of financial position
information:
Segment assets 560,049 4 4,358 564,411
Total assets 560,049 4 4,358 564,411
Segment liabilities 547,239 1 3,646 550,886
Total liabilities 547,239 1 3,646 550,886
Other segment information:
Capital expenditure 1 - - 1
Depreciation and amortisation 3 - - 3
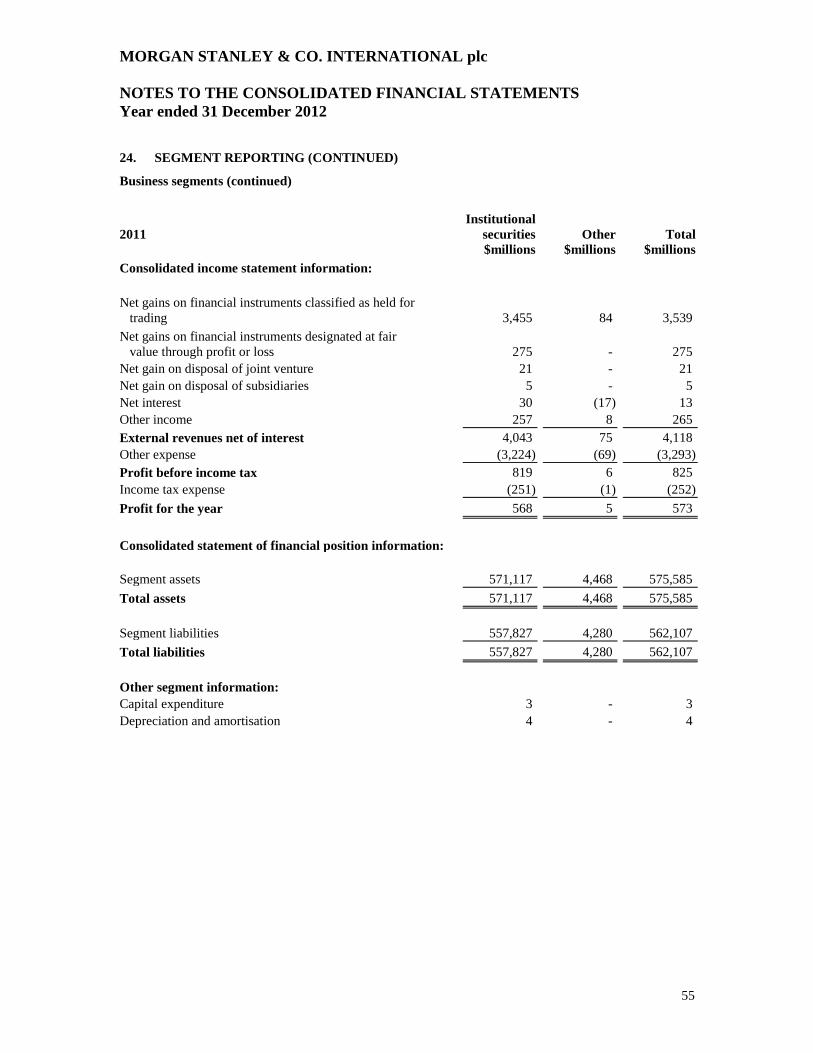
MORGAN STANLEY & CO. INTERNATIONAL plc
NOTES TO THE CONSOLIDATED FINANCIAL STATEMENTS
Year ended 31 December 2012
55
24. SEGMENT REPORTING (CONTINUED)
Business segments (continued)
2011 Institutional
securities Other Total
$millions $millions $millions
Consolidated income statement information:
Net gains on financial instruments classified as held for
trading 3,455 84 3,539
Net gains on financial instruments designated at fair
value through profit or loss 275 - 275
Net gain on disposal of joint venture 21 - 21
Net gain on disposal of subsidiaries 5 - 5
Net interest 30 (17) 13
Other income 257 8 265
External revenues net of interest 4,043 75 4,118
Other expense (3,224) (69) (3,293)
Profit before income tax 819 6 825
Income tax expense (251) (1) (252)
Profit for the year 568 5 573
Consolidated statement of financial position information:
Segment assets 571,117 4,468 575,585
Total assets 571,117 4,468 575,585
Segment liabilities 557,827 4,280 562,107
Total liabilities 557,827 4,280 562,107
Other segment information:
Capital expenditure 3 - 3
Depreciation and amortisation 4 - 4
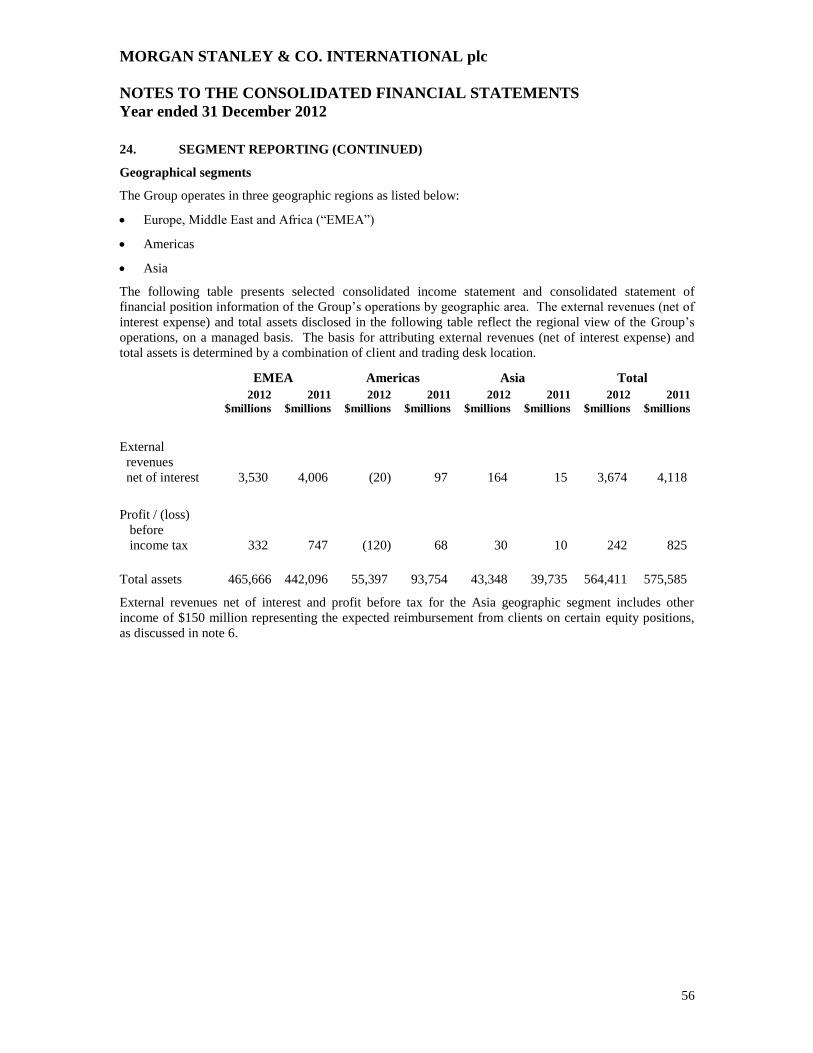
MORGAN STANLEY & CO. INTERNATIONAL plc
NOTES TO THE CONSOLIDATED FINANCIAL STATEMENTS
Year ended 31 December 2012
56
24. SEGMENT REPORTING (CONTINUED)
Geographical segments
The Group operates in three geographic regions as listed below:
Europe, Middle East and Africa (“EMEA”)
Americas
Asia
The following table presents selected consolidated income statement and consolidated statement of
financial position information of the Group’s operations by geographic area. The external revenues (net of
interest expense) and total assets disclosed in the following table reflect the regional view of the Group’s
operations, on a managed basis. The basis for attributing external revenues (net of interest expense) and
total assets is determined by a combination of client and trading desk location.
EMEA Americas Asia Total
2012 2011 2012 2011 2012 2011 2012 2011
$millions $millions $millions $millions $millions $millions $millions $millions
External
revenues
net of interest 3,530 4,006 (20) 97 164 15 3,674 4,118
Profit / (loss)
before
income tax 332 747 (120) 68 30 10 242 825
Total assets 465,666 442,096 55,397 93,754 43,348 39,735 564,411 575,585
External revenues net of interest and profit before tax for the Asia geographic segment includes other
income of $150 million representing the expected reimbursement from clients on certain equity positions,
as discussed in note 6.
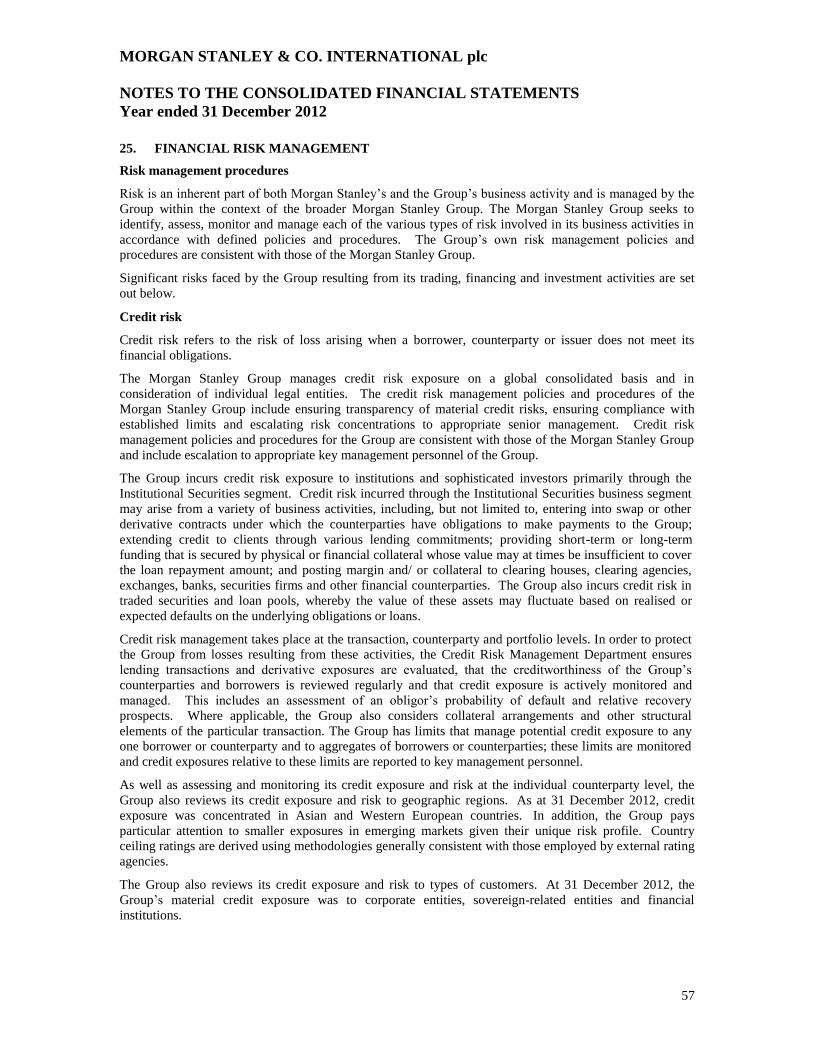
MORGAN STANLEY & CO. INTERNATIONAL plc
NOTES TO THE CONSOLIDATED FINANCIAL STATEMENTS
Year ended 31 December 2012
57
25. FINANCIAL RISK MANAGEMENT
Risk management procedures
Risk is an inherent part of both Morgan Stanley’s and the Group’s business activity and is managed by the
Group within the context of the broader Morgan Stanley Group. The Morgan Stanley Group seeks to
identify, assess, monitor and manage each of the various types of risk involved in its business activities in
accordance with defined policies and procedures. The Group’s own risk management policies and
procedures are consistent with those of the Morgan Stanley Group.
Significant risks faced by the Group resulting from its trading, financing and investment activities are set
out below.
Credit risk
Credit risk refers to the risk of loss arising when a borrower, counterparty or issuer does not meet its
financial obligations.
The Morgan Stanley Group manages credit risk exposure on a global consolidated basis and in
consideration of individual legal entities. The credit risk management policies and procedures of the
Morgan Stanley Group include ensuring transparency of material credit risks, ensuring compliance with
established limits and escalating risk concentrations to appropriate senior management. Credit risk
management policies and procedures for the Group are consistent with those of the Morgan Stanley Group
and include escalation to appropriate key management personnel of the Group.
The Group incurs credit risk exposure to institutions and sophisticated investors primarily through the
Institutional Securities segment. Credit risk incurred through the Institutional Securities business segment
may arise from a variety of business activities, including, but not limited to, entering into swap or other
derivative contracts under which the counterparties have obligations to make payments to the Group;
extending credit to clients through various lending commitments; providing short-term or long-term
funding that is secured by physical or financial collateral whose value may at times be insufficient to cover
the loan repayment amount; and posting margin and/ or collateral to clearing houses, clearing agencies,
exchanges, banks, securities firms and other financial counterparties. The Group also incurs credit risk in
traded securities and loan pools, whereby the value of these assets may fluctuate based on realised or
expected defaults on the underlying obligations or loans.
Credit risk management takes place at the transaction, counterparty and portfolio levels. In order to protect
the Group from losses resulting from these activities, the Credit Risk Management Department ensures
lending transactions and derivative exposures are evaluated, that the creditworthiness of the Group’s
counterparties and borrowers is reviewed regularly and that credit exposure is actively monitored and
managed. This includes an assessment of an obligor’s probability of default and relative recovery
prospects. Where applicable, the Group also considers collateral arrangements and other structural
elements of the particular transaction. The Group has limits that manage potential credit exposure to any
one borrower or counterparty and to aggregates of borrowers or counterparties; these limits are monitored
and credit exposures relative to these limits are reported to key management personnel.
As well as assessing and monitoring its credit exposure and risk at the individual counterparty level, the
Group also reviews its credit exposure and risk to geographic regions. As at 31 December 2012, credit
exposure was concentrated in Asian and Western European countries. In addition, the Group pays
particular attention to smaller exposures in emerging markets given their unique risk profile. Country
ceiling ratings are derived using methodologies generally consistent with those employed by external rating
agencies.
The Group also reviews its credit exposure and risk to types of customers. At 31 December 2012, the
Group’s material credit exposure was to corporate entities, sovereign-related entities and financial
institutions.
MORGAN STANLEY & CO. INTERNATIONAL plc
NOTES TO THE CONSOLIDATED FINANCIAL STATEMENTS
Year ended 31 December 2012
58
25. FINANCIAL RISK MANAGEMENT (CONTINUED)
Collateral and other credit enhancements
The amount and type of collateral required by the Group depends on an assessment of the credit risk of the
counterparty. Collateral held is managed in accordance with the Group’s guidelines and the relevant
underlying agreements. The market value of securities received as collateral is monitored on a daily basis
and securities received as collateral generally are not recognised on the consolidated statement of financial
position.
Securities purchased under agreements to resell and securities borrowed
The Group manages credit exposure arising from securities purchased under agreements to resell and
securities borrowed transactions by, in appropriate circumstances, entering into master netting agreements
and collateral arrangements with counterparties that provide the Group, in the event of a counterparty
default, the right to liquidate collateral and the right to offset a counterparty’s rights and obligations. Under
these securities purchased under agreements to resell and securities borrowed transactions, the Group
receives collateral, including US government and agency securities, other sovereign government
obligations, corporate and other debt and corporate equities. The Group also monitors the fair value of the
underlying securities as compared with the related receivable or payable, including accrued interest, and, as
necessary, requests additional collateral to ensure such transactions are adequately collateralised.
Derivatives
The Group may seek to mitigate credit risk from its derivatives transactions in multiple ways, including
collateral provisions, guarantees and hedges. At the transaction level, the Group seeks to mitigate risk
through management of key risk elements such as size, tenor, financial covenants, seniority and collateral.
The Group actively hedges its derivatives exposure through various financial instruments that may include
single-name, portfolio and structured credit derivatives. The Group may enter into master netting
agreements and collateral arrangements with counterparties. These master netting agreements and
collateral arrangements may provide the Group with the ability to demand collateral, as well as to liquidate
collateral and offset receivables and payables covered under the same master netting agreement in the
event of counterparty default. The Group monitors the creditworthiness of counterparties to these
transactions on an ongoing basis and requests additional collateral in accordance with collateral
arrangements when deemed necessary.
Exposure to credit risk
The maximum exposure to credit risk (“gross credit exposure”) of the Group as at 31 December 2012 is
disclosed below, based on the carrying amounts of the financial assets the Group believes are subject to
credit risk. Exposure arising from financial instruments not recognised on the consolidated statement of
financial position is measured as the maximum amount that the Group could have to pay, which may be
significantly greater than the amount that would be recognised as a liability. This table does not include
receivables arising from pending securities transactions with market counterparties. Where the Group
enters into credit enhancements, including receiving cash and security as collateral and master netting
agreements, to manage the credit exposure on these financial instruments the financial effect of the credit
enhancements is also disclosed below. The net credit exposure represents the credit exposure remaining
after the effect of the credit enhancements
Financial assets classified as held for trading, excluding derivatives, are subject to traded credit risk through
exposure to the issuer of the financial asset; the Group manages this issuer credit risk through its market
risk management infrastructure and this traded credit risk is incorporated within the Value at Risk (“VaR”)
-based risk measures included in the market risk disclosure.
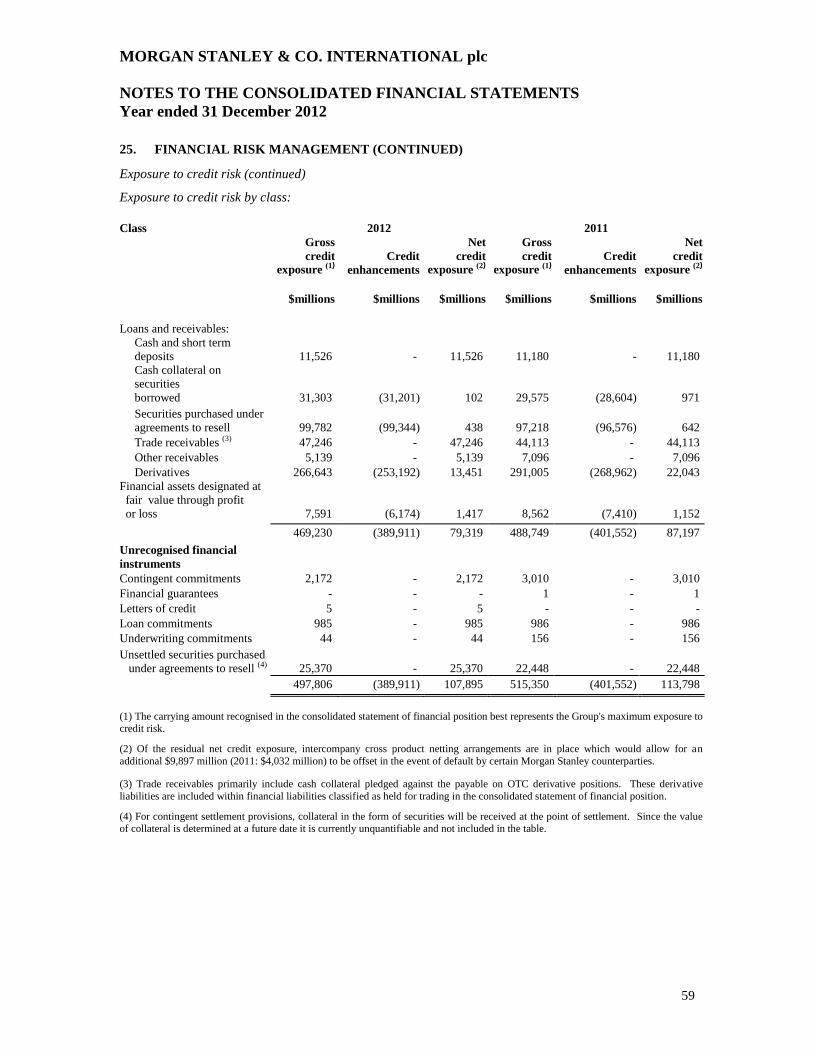
MORGAN STANLEY & CO. INTERNATIONAL plc
NOTES TO THE CONSOLIDATED FINANCIAL STATEMENTS
Year ended 31 December 2012
59
25. FINANCIAL RISK MANAGEMENT (CONTINUED)
Exposure to credit risk (continued)
Exposure to credit risk by class:
Class 2012 2011
Gross Net Gross Net
credit Credit credit credit Credit credit
exposure (1) enhancements exposure (2
) exposure (1
) enhancements exposure (2
)
$millions $millions $millions $millions $millions $millions
Loans and receivables:
Cash and short term
deposits 11,526 - 11,526 11,180 - 11,180
Cash collateral on
securities
borrowed 31,303 (31,201) 102 29,575 (28,604) 971
Securities purchased under
agreements to resell 99,782 (99,344) 438 97,218 (96,576) 642
Trade receivables (3) 47,246 - 47,246 44,113 - 44,113
Other receivables 5,139 - 5,139 7,096 - 7,096
Derivatives 266,643 (253,192) 13,451 291,005 (268,962) 22,043
Financial assets designated at
fair value through profit
or loss 7,591 (6,174) 1,417 8,562 (7,410) 1,152
469,230 (389,911) 79,319 488,749 (401,552) 87,197
Unrecognised financial
instruments
Contingent commitments 2,172 - 2,172 3,010 - 3,010
Financial guarantees - - - 1 - 1
Letters of credit 5 - 5 - - -
Loan commitments 985 - 985 986 - 986
Underwriting commitments 44 - 44 156 - 156
Unsettled securities purchased
under agreements to resell (4) 25,370 - 25,370 22,448 - 22,448
497,806 (389,911) 107,895 515,350 (401,552) 113,798
(1) The carrying amount recognised in the consolidated statement of financial position best represents the Group's maximum exposure to credit risk.
(2) Of the residual net credit exposure, intercompany cross product netting arrangements are in place which would allow for an
additional $9,897 million (2011: $4,032 million) to be offset in the event of default by certain Morgan Stanley counterparties.
(3) Trade receivables primarily include cash collateral pledged against the payable on OTC derivative positions. These derivative
liabilities are included within financial liabilities classified as held for trading in the consolidated statement of financial position.
(4) For contingent settlement provisions, collateral in the form of securities will be received at the point of settlement. Since the value of collateral is determined at a future date it is currently unquantifiable and not included in the table.
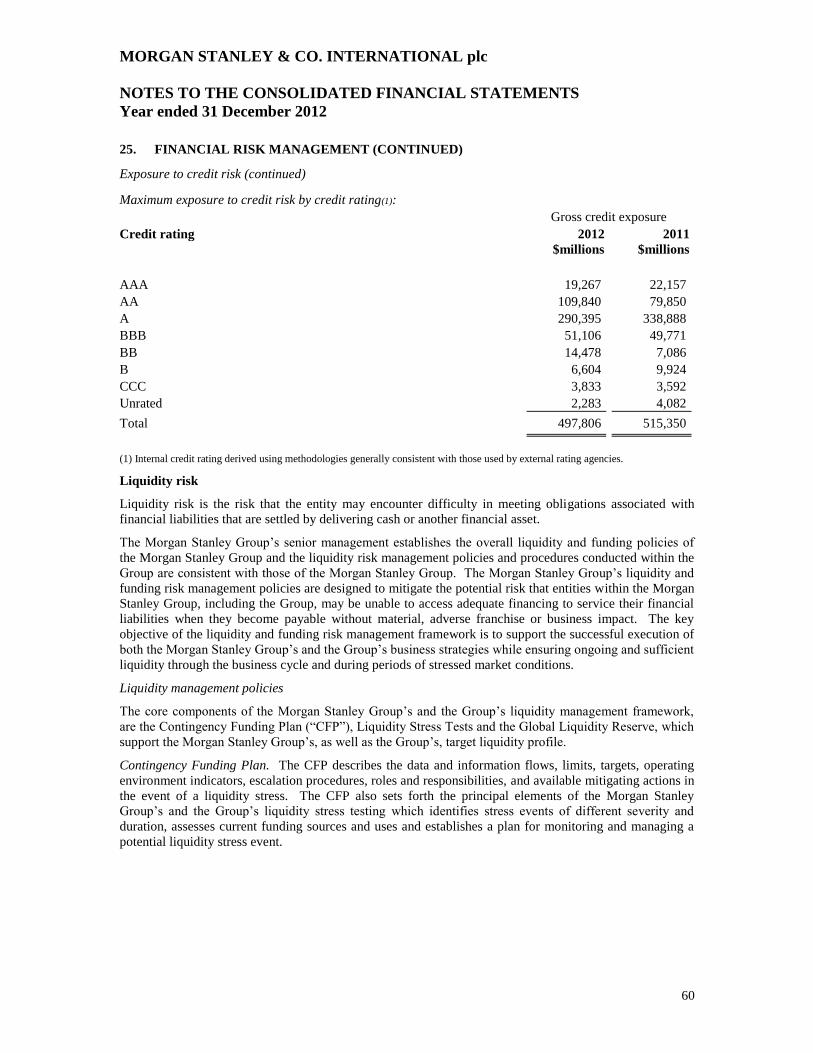
MORGAN STANLEY & CO. INTERNATIONAL plc
NOTES TO THE CONSOLIDATED FINANCIAL STATEMENTS
Year ended 31 December 2012
60
25. FINANCIAL RISK MANAGEMENT (CONTINUED)
Exposure to credit risk (continued) Maximum exposure to credit risk by credit rating(1):
Gross credit exposure
Credit rating 2012 2011
$millions $millions
AAA 19,267 22,157
AA 109,840 79,850
A 290,395 338,888
BBB 51,106 49,771
BB 14,478 7,086
B 6,604 9,924
CCC 3,833 3,592
Unrated 2,283 4,082
Total 497,806 515,350
(1) Internal credit rating derived using methodologies generally consistent with those used by external rating agencies.
Liquidity risk
Liquidity risk is the risk that the entity may encounter difficulty in meeting obligations associated with
financial liabilities that are settled by delivering cash or another financial asset.
The Morgan Stanley Group’s senior management establishes the overall liquidity and funding policies of
the Morgan Stanley Group and the liquidity risk management policies and procedures conducted within the
Group are consistent with those of the Morgan Stanley Group. The Morgan Stanley Group’s liquidity and
funding risk management policies are designed to mitigate the potential risk that entities within the Morgan
Stanley Group, including the Group, may be unable to access adequate financing to service their financial
liabilities when they become payable without material, adverse franchise or business impact. The key
objective of the liquidity and funding risk management framework is to support the successful execution of
both the Morgan Stanley Group’s and the Group’s business strategies while ensuring ongoing and sufficient
liquidity through the business cycle and during periods of stressed market conditions.
Liquidity management policies
The core components of the Morgan Stanley Group’s and the Group’s liquidity management framework,
are the Contingency Funding Plan (“CFP”), Liquidity Stress Tests and the Global Liquidity Reserve, which
support the Morgan Stanley Group’s, as well as the Group’s, target liquidity profile.
Contingency Funding Plan. The CFP describes the data and information flows, limits, targets, operating
environment indicators, escalation procedures, roles and responsibilities, and available mitigating actions in
the event of a liquidity stress. The CFP also sets forth the principal elements of the Morgan Stanley
Group’s and the Group’s liquidity stress testing which identifies stress events of different severity and
duration, assesses current funding sources and uses and establishes a plan for monitoring and managing a
potential liquidity stress event.
MORGAN STANLEY & CO. INTERNATIONAL plc
NOTES TO THE CONSOLIDATED FINANCIAL STATEMENTS
Year ended 31 December 2012
61
25. FINANCIAL RISK MANAGEMENT (CONTINUED)
Liquidity risk (continued)
Liquidity Stress Tests. The Morgan Stanley Group uses Liquidity Stress Tests to model liquidity outflows
across multiple scenarios over a range of time horizons.
The assumptions underpinning the Liquidity Stress Tests include, but not are limited to, the following: (i)
no government support; (ii) no access to unsecured debt markets; (iii) repayment of all unsecured debt
maturing within the stress horizon; (iv) higher haircuts and significantly lower availability of secured
funding; (v) additional collateral that would be required by trading counterparties and certain exchanges
and clearing organisations related to multi-notch credit rating downgrades; (vi) additional collateral that
would be required due to collateral substitutions, collateral disputes and uncalled collateral; (vii)
discretionary unsecured debt buybacks; (viii) drawdowns on unfunded commitments provided to third
parties; (ix) client cash withdrawals and reduction in customer short positions that fund long positions; (x)
limited access to the foreign exchange swap markets; (xi) return of securities borrowed on an
uncollateralised basis; and (xii) maturity roll-off of outstanding letters of credit with no further issuance.
The Liquidity Stress Tests are produced at the Morgan Stanley Group and major operating subsidiary level,
including the Group, as well as major currency levels, to capture specific cash requirements and cash
availability at various legal entities. The Liquidity Stress Tests assume that subsidiaries, including the
Group, will use their own liquidity first to fund their obligations before drawing liquidity from Morgan
Stanley. It is also assumed that Morgan Stanley does not have access to cash that may be held at certain
subsidiaries that are subject to regulatory, legal or tax constraints.
The CFP and Liquidity Stress Tests are evaluated on an on-going basis and reported to the Firm Risk
Committee, Asset/ Liability Management Committee, and other appropriate risk committees including the
Morgan Stanley International Limited Board Risk Committee.
Global Liquidity Reserve. The Morgan Stanley Group and the Group maintain sufficient liquidity reserves
(“the Global Liquidity Reserve”) to cover daily funding needs and meet strategic liquidity targets sized by
the CFP and Liquidity Stress Tests. These liquidity targets are based on the Morgan Stanley Group’s risk
tolerance, consolidated statement of financial position level and composition, subsidiary funding needs, and
upcoming debt maturities, which are subject to change dependent on market and firm-specific events.
The Global Liquidity Reserve is held within Morgan Stanley and the Morgan Stanley Group’s major
operating subsidiaries and consists of highly liquid and diversified cash and cash equivalents and
unencumbered securities (including US government securities, US agency securities, US agency mortgage-
backed securities, Federal Deposit Insurance Corporation - guaranteed corporate debt and non-US
government securities). In addition to the Global Liquidity Reserve, the Group maintains a locally managed
liquidity reserve which consists of cash and cash equivalents and central bank eligible unencumbered
securities. In addition to the liquidity reserve held by the Group, the Group has access to the Global
Liquidity Reserve.
Funding management policies
The Morgan Stanley Group manages its funding in a manner that reduces the risk of disruption to the
Morgan Stanley Group’s and the Group’s operations. The Morgan Stanley Group pursues a strategy of
diversification of secured and unsecured funding sources (by product, by investor and by region) and
attempts to ensure that the tenor of the Morgan Stanley Group’s, and the Group’s, liabilities equals or
exceeds the expected holding period of the assets being financed.
The Morgan Stanley Group funds its consolidated statement of financial position on a global basis through
diverse sources, which includes consideration of the funding risk of each legal entity. These sources may
include the Morgan Stanley Group’s equity capital, long-term debt, securities sold under agreements to
repurchase, securities lending, deposits, commercial paper, letters of credit and lines of credit. The Morgan
Stanley Group has active financing programs for both standard and structured products, targeting global
investors and currencies.
MORGAN STANLEY & CO. INTERNATIONAL plc
NOTES TO THE CONSOLIDATED FINANCIAL STATEMENTS
Year ended 31 December 2012
62
25. FINANCIAL RISK MANAGEMENT (CONTINUED)
Liquidity risk (continued)
In managing both the Morgan Stanley Group’s and the Group’s funding risk the composition and size of
the entire consolidated statement of financial position, not just financial liabilities, is monitored and
evaluated. A substantial portion of the Morgan Stanley Group’s total assets consists of liquid marketable
securities and short-term collateralised receivables arising from its Institutional Securities business
segment’s sales and trading activities. The liquid nature of these assets provides the Morgan Stanley Group
and the Group with flexibility in funding and managing their business.
Maturity analysis
In the following maturity analysis of financial liabilities, derivative contracts and other financial liabilities
held as part of the Group’s trading activities are disclosed as on demand and presented at fair value,
consistent with how these financial liabilities are managed. Derivatives not held as part of the Group’s
trading activities and financial liabilities designated at fair value through profit and loss are disclosed
according to their earliest contractual maturity; all such amounts are presented at their fair value, consistent
with how these financial liabilities are managed. All other amounts represent undiscounted cash flows
payable by the Group arising from its financial liabilities to earliest contractual maturities as at
31 December 2012. Repayments of financial liabilities that are subject to immediate notice are treated as if
notice were given immediately and are classified as on demand. This presentation is considered by the
Group to appropriately reflect the liquidity risk arising from those financial liabilities, presented in a way
that is consistent with how the liquidity risk on these financial liabilities is managed by the Group.
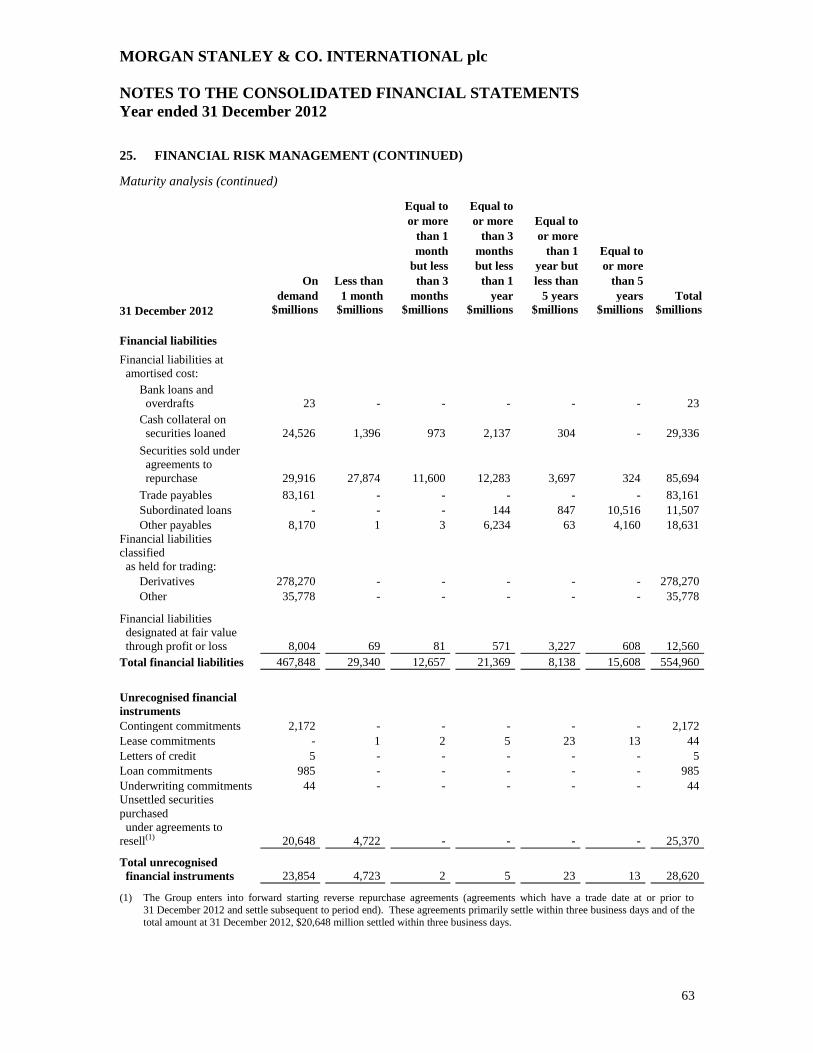
MORGAN STANLEY & CO. INTERNATIONAL plc
NOTES TO THE CONSOLIDATED FINANCIAL STATEMENTS
Year ended 31 December 2012
63
25. FINANCIAL RISK MANAGEMENT (CONTINUED)
Maturity analysis (continued) Equal to Equal to
or more or more Equal to
than 1 than 3 or more
month months than 1 Equal to
but less but less year but or more
On Less than than 3 than 1 less than than 5
demand 1 month months year 5 years years Total
31 December 2012 $millions $millions $millions $millions $millions $millions $millions
Financial liabilities
Financial liabilities at
amortised cost:
Bank loans and
overdrafts 23 - - - - - 23
Cash collateral on
securities loaned 24,526 1,396 973 2,137 304 - 29,336
Securities sold under
agreements to
repurchase 29,916 27,874 11,600 12,283 3,697 324 85,694
Trade payables 83,161 - - - - - 83,161
Subordinated loans - - - 144 847 10,516 11,507
Other payables 8,170 1 3 6,234 63 4,160 18,631
Financial liabilities
classified
as held for trading:
Derivatives 278,270 - - - - - 278,270
Other 35,778 - - - - - 35,778
Financial liabilities
designated at fair value
through profit or loss 8,004 69 81 571 3,227 608 12,560
Total financial liabilities 467,848 29,340 12,657 21,369 8,138 15,608 554,960
Unrecognised financial
instruments
Contingent commitments 2,172 - - - - - 2,172
Lease commitments - 1 2 5 23 13 44
Letters of credit 5 - - - - - 5
Loan commitments 985 - - - - - 985
Underwriting commitments 44 - - - - - 44
Unsettled securities
purchased
under agreements to
resell(1) 20,648 4,722 - - - - 25,370
Total unrecognised
financial instruments 23,854 4,723 2 5 23 13 28,620
(1) The Group enters into forward starting reverse repurchase agreements (agreements which have a trade date at or prior to
31 December 2012 and settle subsequent to period end). These agreements primarily settle within three business days and of the
total amount at 31 December 2012, $20,648 million settled within three business days.
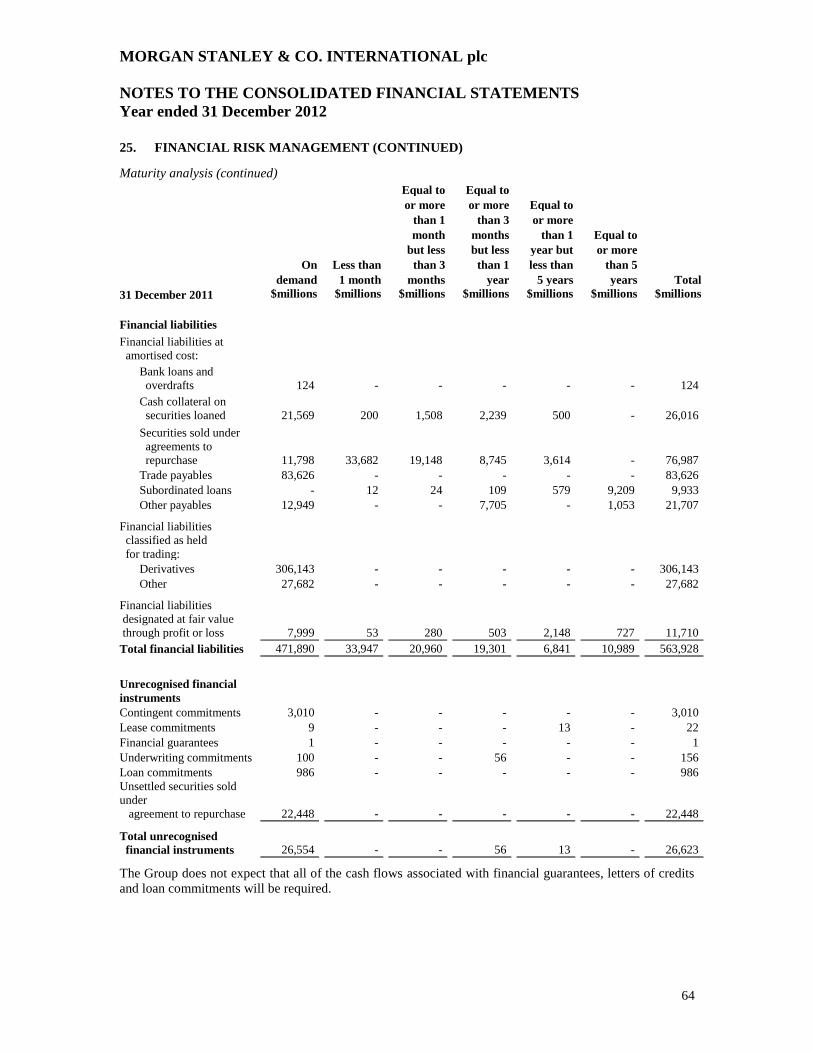
MORGAN STANLEY & CO. INTERNATIONAL plc
NOTES TO THE CONSOLIDATED FINANCIAL STATEMENTS
Year ended 31 December 2012
64
25. FINANCIAL RISK MANAGEMENT (CONTINUED)
Maturity analysis (continued)
Equal to Equal to
or more or more Equal to
than 1 than 3 or more
month months than 1 Equal to
but less but less year but or more
On Less than than 3 than 1 less than than 5
demand 1 month months year 5 years years Total
31 December 2011 $millions $millions $millions $millions $millions $millions $millions
Financial liabilities
Financial liabilities at
amortised cost:
Bank loans and
overdrafts 124 - - - - - 124
Cash collateral on
securities loaned 21,569 200 1,508 2,239 500 - 26,016
Securities sold under
agreements to
repurchase 11,798 33,682 19,148 8,745 3,614 - 76,987
Trade payables 83,626 - - - - - 83,626
Subordinated loans - 12 24 109 579 9,209 9,933
Other payables 12,949 - - 7,705 - 1,053 21,707
Financial liabilities
classified as held
for trading:
Derivatives 306,143 - - - - - 306,143
Other 27,682 - - - - - 27,682
Financial liabilities
designated at fair value
through profit or loss 7,999 53 280 503 2,148 727 11,710
Total financial liabilities 471,890 33,947 20,960 19,301 6,841 10,989 563,928
Unrecognised financial
instruments
Contingent commitments 3,010 - - - - - 3,010
Lease commitments 9 - - - 13 - 22
Financial guarantees 1 - - - - - 1
Underwriting commitments 100 - - 56 - - 156
Loan commitments 986 - - - - - 986
Unsettled securities sold
under
agreement to repurchase 22,448 - - - - - 22,448
Total unrecognised
financial instruments 26,554 - - 56 13 - 26,623
The Group does not expect that all of the cash flows associated with financial guarantees, letters of credits
and loan commitments will be required.
MORGAN STANLEY & CO. INTERNATIONAL plc
NOTES TO THE CONSOLIDATED FINANCIAL STATEMENTS
Year ended 31 December 2012
65
25. FINANCIAL RISK MANAGEMENT (CONTINUED)
Market risk
Market risk refers to the risk that a change in the level of one or more market prices, rates, indices, implied
volatilities (the price volatility of the underlying instrument imputed from option prices), correlations or
other market factors, such as market liquidity, will result in losses for a position or portfolio.
Sound market risk management is an integral part of the Group’s and the Morgan Stanley Group’s culture.
The Group is responsible for ensuring that market risk exposures are well-managed and prudent and more
broadly for ensuring transparency of material market risks, monitoring compliance with established limits,
and escalating risk concentrations to appropriate senior management.
To execute these responsibilities, the Morgan Stanley Group monitors the market risk of the firm against
limits on aggregate risk exposures, performs a variety of risk analyses, routinely reports risk summaries and
maintains the VaR and scenario systems. These limits are designed to control price and market liquidity
risk. Market risk is also monitored through various measures: using statistics (including VaR and related
analytical measures); by measures of position sensitivity; and through routine stress testing and scenario
analyses. The material risks identified by these processes are summarised and reported to senior
management.
The Group is managed within the Morgan Stanley Group’s global framework. The market risk management
policies and procedures of the Group are consistent with those of the Morgan Stanley Group, including
reporting of material risks identified to appropriate key management personnel of the Group.
Risk and capital management initiative
The Morgan Stanley Group frequently enhances its market and credit risk management framework to
address severe stresses that are observed in global markets during economic downturns. During 2012, the
Morgan Stanley Group expanded and improved its risk measurement processes, including stress tests and
scenario analysis, and further refined its market and credit risk limit framework. Stress Value-at-Risk (“S-
VaR”), a proprietary methodology that comprehensively measures the Group’s market and credit risks, was
further refined and continues to be an important metric used in establishing the Group’s risk appetite and its
capital allocation framework. S-VaR simulates many stress scenarios based on more than 25 years of
historical data and attempts to capture the different liquidities of various types of general and specific risks.
Additionally, S-VaR captures event and default risks that are particularly relevant for credit portfolios.
Primary market risk exposures and market risk management
During the year ended 31 December 2012, the Group had exposures to a wide range of interest rates, equity
prices, foreign exchange rates and commodity prices and the associated implied volatilities and spreads,
related to the global markets in which it conducts its trading activities.
The Group is exposed to interest rate and credit spread risk as a result of its market-making activities and
other trading in interest rate sensitive financial instruments (e.g. risk arising from changes in the level or
implied volatility of interest rates, the shape of the yield curve and credit spreads). The activities from
which those exposures arise and the markets in which the Group is active include, but are not limited to, the
following: corporate and government debt across both developed and emerging markets and asset-backed
debt (including mortgage-related securities).
The Group is exposed to equity price and implied volatility risk as a result of making markets in equity
securities and derivatives and maintaining other positions (including positions in non-public entities).
Positions in non-public entities may include, but are not limited to, exposures to private equity, venture
capital, private partnerships, real estate funds and other funds. Such positions are less liquid, have longer
investment horizons and are more difficult to hedge than listed equities.
The Group is exposed to foreign exchange rate and implied volatility risk as a result of making markets in
foreign currencies and foreign currency derivatives, from maintaining foreign exchange positions and from
holding non-US dollar-denominated financial instruments.
MORGAN STANLEY & CO. INTERNATIONAL plc
NOTES TO THE CONSOLIDATED FINANCIAL STATEMENTS
Year ended 31 December 2012
66
25. FINANCIAL RISK MANAGEMENT (CONTINUED)
Market risk (continued)
Primary market risk exposures and market risk management (continued)
The Group is exposed to commodity price and implied volatility risk as a result of market-making activities
and maintaining commodity positions in physical commodities (such as crude and refined oil products,
natural gas, electricity, and precious and base metals) and related derivatives. Commodity exposures are
subject to periods of high price volatility as a result of changes in supply and demand. These changes can
be caused by weather conditions, physical production, transportation and storage issues; or geopolitical and
other events that affect the available supply and level of demand for these commodities.
The Group, as part of the Morgan Stanley Group’s global market risk management framework manages its
trading positions by employing a variety of risk mitigation strategies. These strategies include
diversification of risk exposures and hedging. Hedging activities consist of the purchase or sale of positions
in related securities and financial instruments, including a variety of derivative products (e.g., futures,
forwards, swaps and options). Hedging activities may not always provide effective mitigation against
trading losses due to differences in the terms, specific characteristics or other basis risks that may exist
between the hedge instrument and the risk exposure that is being hedged. The Group manages the market
risk associated with its trading activities on an entity-wide basis, on a worldwide trading division level and
on an individual product strategy. The Group manages and monitors its market risk exposures in such a
way as to maintain a portfolio that the Group believes is well-diversified in the aggregate with respect to
market risk factors and that reflects the Group’s aggregate risk tolerance, as established by the Group’s
senior management.
Aggregate market risk limits have been approved for the Group, and major trading divisions worldwide, as
well as for the firm globally. Additional market risk limits are assigned to trading desks and, as appropriate,
products and regions. Trading division risk managers, desk risk managers, traders and the market risk
department monitor market risk measures against limits in accordance with policies set by senior
management.
VaR
The Group uses the statistical technique known as VaR as one of the tools used to measure, monitor and
review the market risk exposures of its trading portfolios. The Market Risk Department calculates and
distributes daily VaR-based risk measures to various levels of management.
VaR methodology, assumptions and limitations
The Group has enhanced its VaR model during 2012 to make it more responsive to current market
conditions while maintaining a longer-term perspective. This enhancement is consistent with regulatory
requirements. The current VaR model has been approved by the Group’s regulators for use in regulatory
capital calculations.
The Group estimates VaR using a model based on volatility adjusted historical simulation for general
market risk factors and Monte Carlo simulation for name-specific risk in corporate shares, bonds, loans and
related derivatives. The model constructs a distribution of hypothetical daily changes in the value of trading
portfolios based on the following: historical observation of daily changes in key market indices or other
market risk factors; and information on the sensitivity of the portfolio values to these market risk factor
changes. The Group’s current VaR model uses four years of historical data with a volatility adjustment to
reflect current market conditions. The Group’s prior VaR model also uses four years of historical data, but
does not make any volatility adjustments and is therefore less responsive to current market conditions. To
facilitate the transition to the current VaR model, results using both the current and prior VaR models are
included in the Trading Risks section below. The Group’s 95%/one-day VaR corresponds to the unrealised
loss in portfolio value that, based on historically observed market risk factor movements, would have been
exceeded with a frequency of 5%, or five times in every 100 trading days, if the portfolio were held
constant for one day.
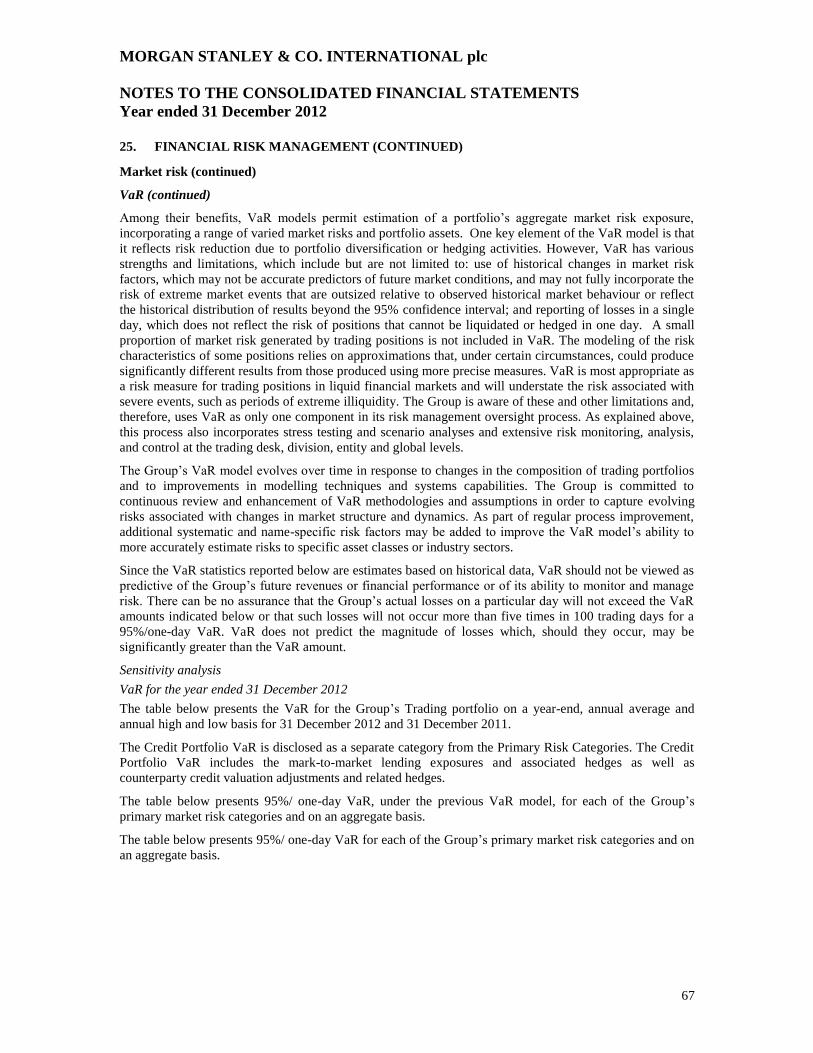
MORGAN STANLEY & CO. INTERNATIONAL plc
NOTES TO THE CONSOLIDATED FINANCIAL STATEMENTS
Year ended 31 December 2012
67
25. FINANCIAL RISK MANAGEMENT (CONTINUED)
Market risk (continued)
VaR (continued)
Among their benefits, VaR models permit estimation of a portfolio’s aggregate market risk exposure,
incorporating a range of varied market risks and portfolio assets. One key element of the VaR model is that
it reflects risk reduction due to portfolio diversification or hedging activities. However, VaR has various
strengths and limitations, which include but are not limited to: use of historical changes in market risk
factors, which may not be accurate predictors of future market conditions, and may not fully incorporate the
risk of extreme market events that are outsized relative to observed historical market behaviour or reflect
the historical distribution of results beyond the 95% confidence interval; and reporting of losses in a single
day, which does not reflect the risk of positions that cannot be liquidated or hedged in one day. A small
proportion of market risk generated by trading positions is not included in VaR. The modeling of the risk
characteristics of some positions relies on approximations that, under certain circumstances, could produce
significantly different results from those produced using more precise measures. VaR is most appropriate as
a risk measure for trading positions in liquid financial markets and will understate the risk associated with
severe events, such as periods of extreme illiquidity. The Group is aware of these and other limitations and,
therefore, uses VaR as only one component in its risk management oversight process. As explained above,
this process also incorporates stress testing and scenario analyses and extensive risk monitoring, analysis,
and control at the trading desk, division, entity and global levels.
The Group’s VaR model evolves over time in response to changes in the composition of trading portfolios
and to improvements in modelling techniques and systems capabilities. The Group is committed to
continuous review and enhancement of VaR methodologies and assumptions in order to capture evolving
risks associated with changes in market structure and dynamics. As part of regular process improvement,
additional systematic and name-specific risk factors may be added to improve the VaR model’s ability to
more accurately estimate risks to specific asset classes or industry sectors.
Since the VaR statistics reported below are estimates based on historical data, VaR should not be viewed as
predictive of the Group’s future revenues or financial performance or of its ability to monitor and manage
risk. There can be no assurance that the Group’s actual losses on a particular day will not exceed the VaR
amounts indicated below or that such losses will not occur more than five times in 100 trading days for a
95%/one-day VaR. VaR does not predict the magnitude of losses which, should they occur, may be
significantly greater than the VaR amount.
Sensitivity analysis
VaR for the year ended 31 December 2012
The table below presents the VaR for the Group’s Trading portfolio on a year-end, annual average and
annual high and low basis for 31 December 2012 and 31 December 2011.
The Credit Portfolio VaR is disclosed as a separate category from the Primary Risk Categories. The Credit
Portfolio VaR includes the mark-to-market lending exposures and associated hedges as well as
counterparty credit valuation adjustments and related hedges.
The table below presents 95%/ one-day VaR, under the previous VaR model, for each of the Group’s
primary market risk categories and on an aggregate basis.
The table below presents 95%/ one-day VaR for each of the Group’s primary market risk categories and on
an aggregate basis.
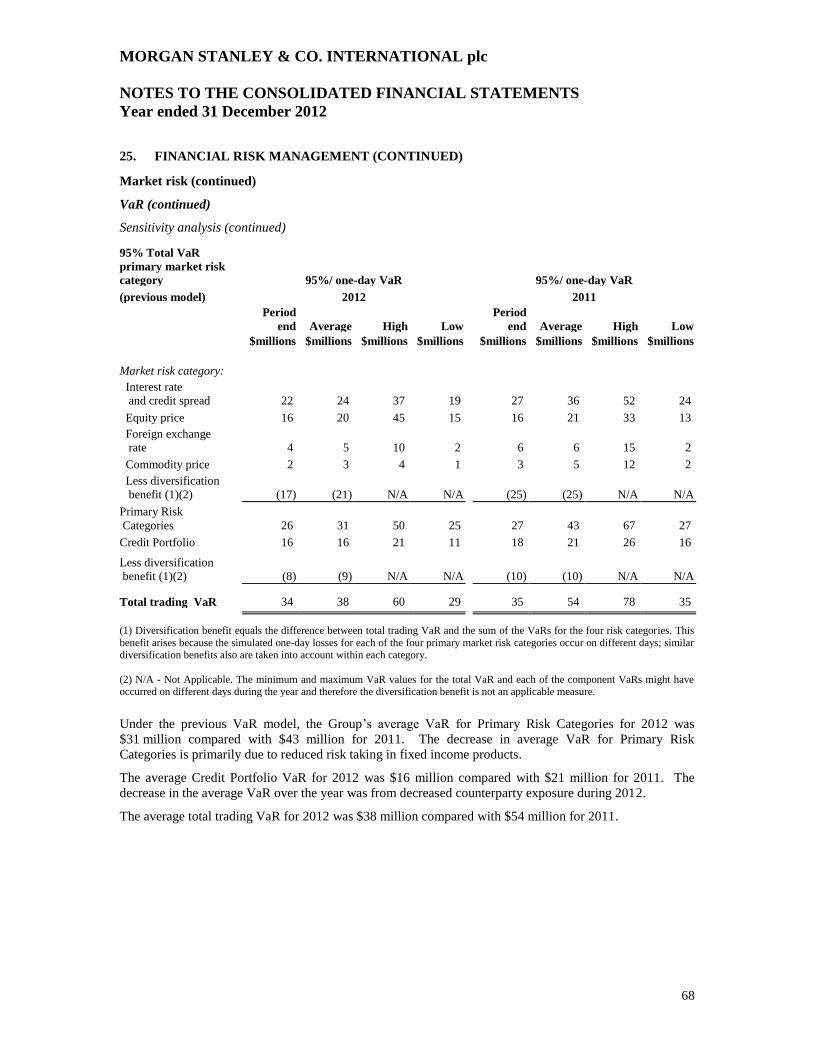
MORGAN STANLEY & CO. INTERNATIONAL plc
NOTES TO THE CONSOLIDATED FINANCIAL STATEMENTS
Year ended 31 December 2012
68
25. FINANCIAL RISK MANAGEMENT (CONTINUED)
Market risk (continued)
VaR (continued)
Sensitivity analysis (continued) 95% Total VaR
primary market risk
category 95%/ one-day VaR 95%/ one-day VaR
(previous model) 2012 2011
Period
end Average High Low
Period
end Average High Low
$millions $millions $millions $millions $millions $millions $millions $millions
Market risk category:
Interest rate
and credit spread 22 24 37 19 27 36 52 24
Equity price 16 20 45 15 16 21 33 13
Foreign exchange
rate 4 5 10 2 6 6 15 2
Commodity price 2 3 4 1 3 5 12 2
Less diversification
benefit (1)(2) (17) (21) N/A N/A (25) (25) N/A N/A
Primary Risk
Categories 26 31 50 25 27 43 67 27
Credit Portfolio 16 16 21 11 18 21 26 16
Less diversification
benefit (1)(2) (8) (9) N/A N/A (10) (10) N/A N/A
Total trading VaR 34 38 60 29 35 54 78 35 (1) Diversification benefit equals the difference between total trading VaR and the sum of the VaRs for the four risk categories. This
benefit arises because the simulated one-day losses for each of the four primary market risk categories occur on different days; similar diversification benefits also are taken into account within each category.
(2) N/A - Not Applicable. The minimum and maximum VaR values for the total VaR and each of the component VaRs might have occurred on different days during the year and therefore the diversification benefit is not an applicable measure.
Under the previous VaR model, the Group’s average VaR for Primary Risk Categories for 2012 was
$31 million compared with $43 million for 2011. The decrease in average VaR for Primary Risk
Categories is primarily due to reduced risk taking in fixed income products.
The average Credit Portfolio VaR for 2012 was $16 million compared with $21 million for 2011. The
decrease in the average VaR over the year was from decreased counterparty exposure during 2012.
The average total trading VaR for 2012 was $38 million compared with $54 million for 2011.
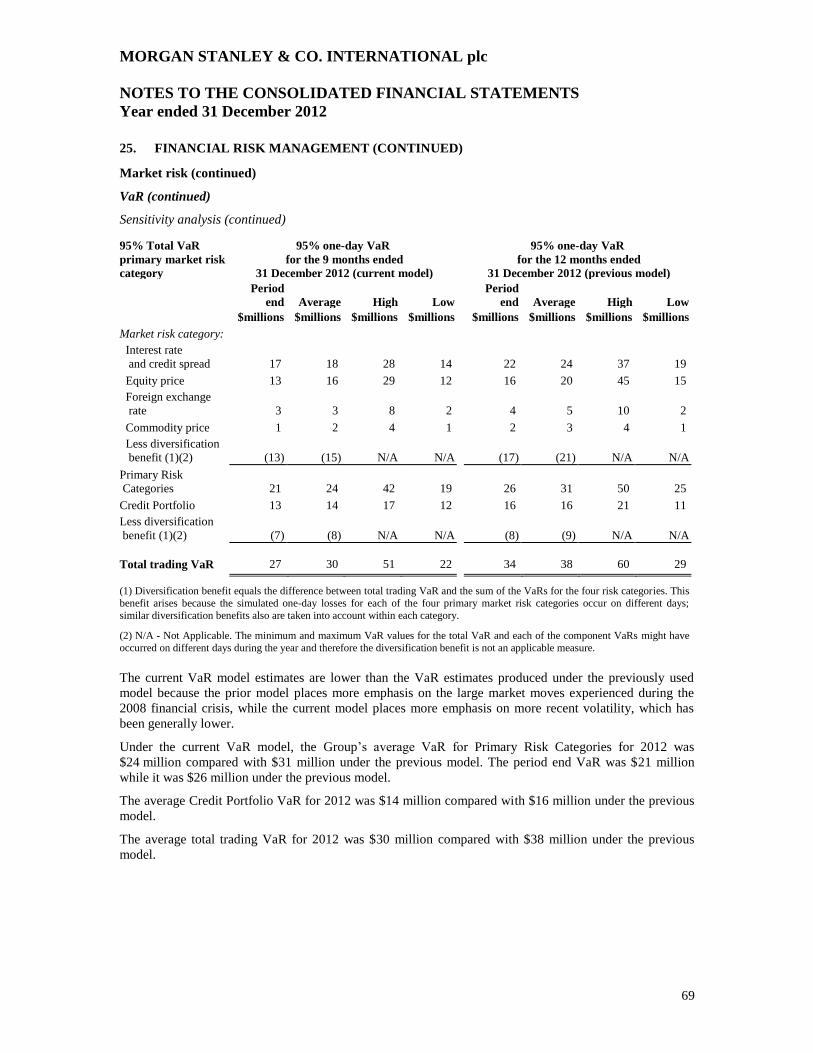
MORGAN STANLEY & CO. INTERNATIONAL plc
NOTES TO THE CONSOLIDATED FINANCIAL STATEMENTS
Year ended 31 December 2012
69
25. FINANCIAL RISK MANAGEMENT (CONTINUED)
Market risk (continued)
VaR (continued)
Sensitivity analysis (continued) 95% Total VaR
primary market risk
category
95% one-day VaR
for the 9 months ended
31 December 2012 (current model)
95% one-day VaR
for the 12 months ended
31 December 2012 (previous model)
Period
end Average High Low
Period
end Average High Low
$millions $millions $millions $millions $millions $millions $millions $millions
Market risk category:
Interest rate
and credit spread 17 18 28 14 22 24 37 19
Equity price 13 16 29 12 16 20 45 15
Foreign exchange
rate 3 3 8 2 4 5 10 2
Commodity price 1 2 4 1 2 3 4 1
Less diversification
benefit (1)(2) (13) (15) N/A N/A (17) (21) N/A N/A
Primary Risk
Categories 21 24 42 19 26 31 50 25
Credit Portfolio 13 14 17 12 16 16 21 11
Less diversification
benefit (1)(2) (7) (8) N/A N/A (8) (9) N/A N/A
Total trading VaR 27 30 51 22 34 38 60 29
(1) Diversification benefit equals the difference between total trading VaR and the sum of the VaRs for the four risk categories. This
benefit arises because the simulated one-day losses for each of the four primary market risk categories occur on different days;
similar diversification benefits also are taken into account within each category.
(2) N/A - Not Applicable. The minimum and maximum VaR values for the total VaR and each of the component VaRs might have
occurred on different days during the year and therefore the diversification benefit is not an applicable measure.
The current VaR model estimates are lower than the VaR estimates produced under the previously used
model because the prior model places more emphasis on the large market moves experienced during the
2008 financial crisis, while the current model places more emphasis on more recent volatility, which has
been generally lower.
Under the current VaR model, the Group’s average VaR for Primary Risk Categories for 2012 was
$24 million compared with $31 million under the previous model. The period end VaR was $21 million
while it was $26 million under the previous model.
The average Credit Portfolio VaR for 2012 was $14 million compared with $16 million under the previous
model.
The average total trading VaR for 2012 was $30 million compared with $38 million under the previous
model.
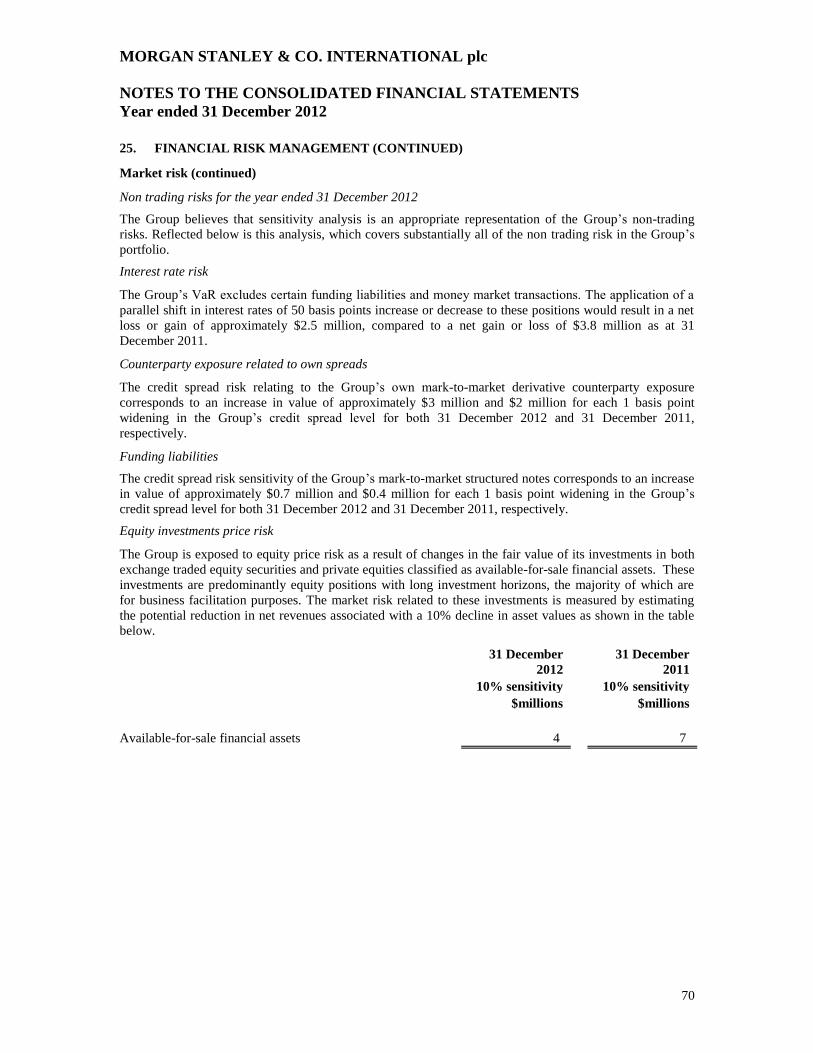
MORGAN STANLEY & CO. INTERNATIONAL plc
NOTES TO THE CONSOLIDATED FINANCIAL STATEMENTS
Year ended 31 December 2012
70
25. FINANCIAL RISK MANAGEMENT (CONTINUED)
Market risk (continued) Non trading risks for the year ended 31 December 2012
The Group believes that sensitivity analysis is an appropriate representation of the Group’s non-trading
risks. Reflected below is this analysis, which covers substantially all of the non trading risk in the Group’s
portfolio.
Interest rate risk
The Group’s VaR excludes certain funding liabilities and money market transactions. The application of a
parallel shift in interest rates of 50 basis points increase or decrease to these positions would result in a net
loss or gain of approximately $2.5 million, compared to a net gain or loss of $3.8 million as at 31
December 2011.
Counterparty exposure related to own spreads
The credit spread risk relating to the Group’s own mark-to-market derivative counterparty exposure
corresponds to an increase in value of approximately $3 million and $2 million for each 1 basis point
widening in the Group’s credit spread level for both 31 December 2012 and 31 December 2011,
respectively.
Funding liabilities
The credit spread risk sensitivity of the Group’s mark-to-market structured notes corresponds to an increase
in value of approximately $0.7 million and $0.4 million for each 1 basis point widening in the Group’s
credit spread level for both 31 December 2012 and 31 December 2011, respectively.
Equity investments price risk
The Group is exposed to equity price risk as a result of changes in the fair value of its investments in both
exchange traded equity securities and private equities classified as available-for-sale financial assets. These
investments are predominantly equity positions with long investment horizons, the majority of which are
for business facilitation purposes. The market risk related to these investments is measured by estimating
the potential reduction in net revenues associated with a 10% decline in asset values as shown in the table
below.
31 December
2012
31 December
2011
10% sensitivity 10% sensitivity
$millions $millions
Available-for-sale financial assets 4 7
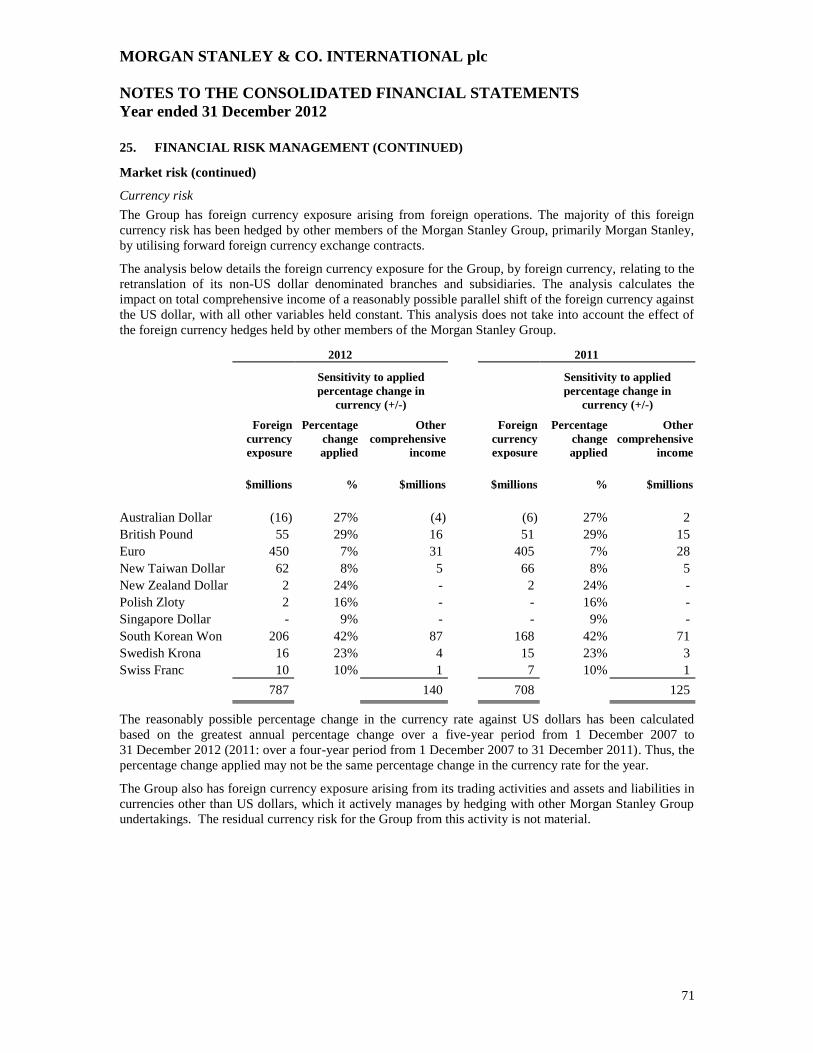
MORGAN STANLEY & CO. INTERNATIONAL plc
NOTES TO THE CONSOLIDATED FINANCIAL STATEMENTS
Year ended 31 December 2012
71
25. FINANCIAL RISK MANAGEMENT (CONTINUED)
Market risk (continued)
Currency risk
The Group has foreign currency exposure arising from foreign operations. The majority of this foreign
currency risk has been hedged by other members of the Morgan Stanley Group, primarily Morgan Stanley,
by utilising forward foreign currency exchange contracts.
The analysis below details the foreign currency exposure for the Group, by foreign currency, relating to the
retranslation of its non-US dollar denominated branches and subsidiaries. The analysis calculates the
impact on total comprehensive income of a reasonably possible parallel shift of the foreign currency against
the US dollar, with all other variables held constant. This analysis does not take into account the effect of
the foreign currency hedges held by other members of the Morgan Stanley Group.
2012 2011
Sensitivity to applied
percentage change in
currency (+/-)
Sensitivity to applied
percentage change in
currency (+/-)
Foreign
currency
exposure
Percentage
change
applied
Other
comprehensive
income
Foreign
currency
exposure
Percentage
change
applied
Other
comprehensive
income
$millions % $millions $millions % $millions
Australian Dollar (16) 27% (4) (6) 27% 2
British Pound 55 29% 16 51 29% 15
Euro 450 7% 31 405 7% 28
New Taiwan Dollar 62 8% 5 66 8% 5
New Zealand Dollar 2 24% - 2 24% -
Polish Zloty 2 16% - - 16% -
Singapore Dollar - 9% - - 9% -
South Korean Won 206 42% 87 168 42% 71
Swedish Krona 16 23% 4 15 23% 3
Swiss Franc 10 10% 1 7 10% 1
787 140 708 125
The reasonably possible percentage change in the currency rate against US dollars has been calculated
based on the greatest annual percentage change over a five-year period from 1 December 2007 to
31 December 2012 (2011: over a four-year period from 1 December 2007 to 31 December 2011). Thus, the
percentage change applied may not be the same percentage change in the currency rate for the year.
The Group also has foreign currency exposure arising from its trading activities and assets and liabilities in
currencies other than US dollars, which it actively manages by hedging with other Morgan Stanley Group
undertakings. The residual currency risk for the Group from this activity is not material.
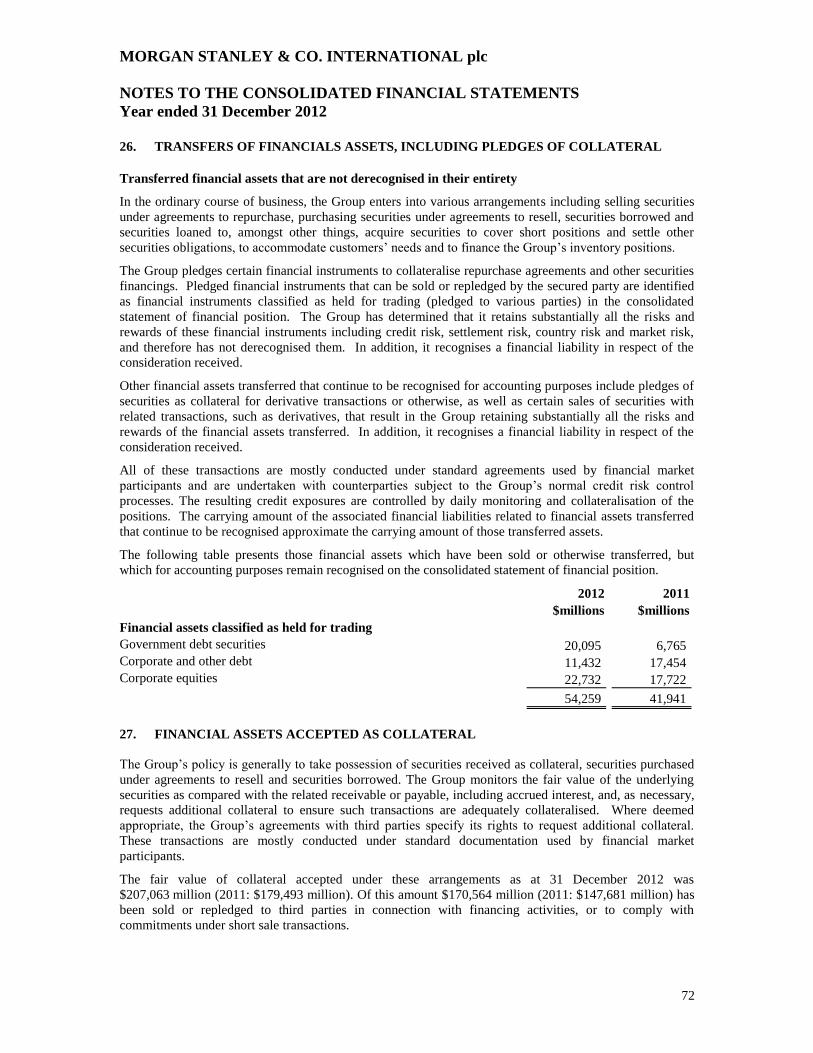
MORGAN STANLEY & CO. INTERNATIONAL plc
NOTES TO THE CONSOLIDATED FINANCIAL STATEMENTS
Year ended 31 December 2012
72
26. TRANSFERS OF FINANCIALS ASSETS, INCLUDING PLEDGES OF COLLATERAL
Transferred financial assets that are not derecognised in their entirety
In the ordinary course of business, the Group enters into various arrangements including selling securities
under agreements to repurchase, purchasing securities under agreements to resell, securities borrowed and
securities loaned to, amongst other things, acquire securities to cover short positions and settle other
securities obligations, to accommodate customers’ needs and to finance the Group’s inventory positions.
The Group pledges certain financial instruments to collateralise repurchase agreements and other securities
financings. Pledged financial instruments that can be sold or repledged by the secured party are identified
as financial instruments classified as held for trading (pledged to various parties) in the consolidated
statement of financial position. The Group has determined that it retains substantially all the risks and
rewards of these financial instruments including credit risk, settlement risk, country risk and market risk,
and therefore has not derecognised them. In addition, it recognises a financial liability in respect of the
consideration received.
Other financial assets transferred that continue to be recognised for accounting purposes include pledges of
securities as collateral for derivative transactions or otherwise, as well as certain sales of securities with
related transactions, such as derivatives, that result in the Group retaining substantially all the risks and
rewards of the financial assets transferred. In addition, it recognises a financial liability in respect of the
consideration received.
All of these transactions are mostly conducted under standard agreements used by financial market
participants and are undertaken with counterparties subject to the Group’s normal credit risk control
processes. The resulting credit exposures are controlled by daily monitoring and collateralisation of the
positions. The carrying amount of the associated financial liabilities related to financial assets transferred
that continue to be recognised approximate the carrying amount of those transferred assets.
The following table presents those financial assets which have been sold or otherwise transferred, but
which for accounting purposes remain recognised on the consolidated statement of financial position.
2012 2011
$millions $millions
Financial assets classified as held for trading
Government debt securities 20,095 6,765
Corporate and other debt 11,432 17,454
Corporate equities 22,732 17,722
54,259 41,941
27. FINANCIAL ASSETS ACCEPTED AS COLLATERAL
The Group’s policy is generally to take possession of securities received as collateral, securities purchased
under agreements to resell and securities borrowed. The Group monitors the fair value of the underlying
securities as compared with the related receivable or payable, including accrued interest, and, as necessary,
requests additional collateral to ensure such transactions are adequately collateralised. Where deemed
appropriate, the Group’s agreements with third parties specify its rights to request additional collateral.
These transactions are mostly conducted under standard documentation used by financial market
participants.
The fair value of collateral accepted under these arrangements as at 31 December 2012 was
$207,063 million (2011: $179,493 million). Of this amount $170,564 million (2011: $147,681 million) has
been sold or repledged to third parties in connection with financing activities, or to comply with
commitments under short sale transactions.
MORGAN STANLEY & CO. INTERNATIONAL plc
NOTES TO THE CONSOLIDATED FINANCIAL STATEMENTS
Year ended 31 December 2012
73
28. SPECIAL PURPOSE ENTITIES
The Group is involved with various entities in the normal course of business that may be deemed to be
special purpose entities (“SPEs”). The Group’s interests in SPEs include debt and equity interests and
derivative instruments, and these interests primarily arise from trading activity and structured transactions.
Consolidation of SPEs is determined in accordance with the Group’s accounting policies. As at
31 December 2012 the total assets of SPEs in which the Group has an interest, but which are not
consolidated by the Group, are $378 million (2011: $212 million) and the Group’s maximum exposure to
loss relating to such SPEs is $147 million (2011: $174 million). The Group’s consolidated statement of
financial position includes $1,933 million of assets arising from consolidated SPEs (2011: $2,904 million).
The Group’s maximum exposure to loss relating to these assets is $1,413 million (2011: $1,279 million).
29. FINANCIAL INSTRUMENTS MEASURED AT FAIR VALUE
a. Fair value hierarchy disclosure
Financial instruments recognised at fair value are broken down for disclosure purposes into a three level
fair value hierarchy based on the observability of inputs as follows:
Quoted prices (unadjusted) in an active market for identical assets or liabilities (Level 1) –
Valuations based on quoted prices in active markets for identical assets or liabilities that the Morgan
Stanley Group has the ability to access. Valuation adjustments and block discounts are not applied
to Level 1 instruments. Since valuations are based on quoted prices that are readily and regularly
available in an active market, valuation of these products does not entail a significant degree of
judgement.
Valuation techniques using observable inputs (Level 2) – Valuations based on one or more quoted
prices in markets that are not active or for which all significant inputs are observable, either directly
or indirectly.
Valuation techniques with significant unobservable inputs (Level 3) – Valuations based on inputs
that are unobservable and significant to the overall fair value measurement.
Fair value control processes
The Group employs control processes to validate the fair value of its financial instruments, including those
derived from pricing models. These control processes are designed to assure that the values used for
financial reporting are based on observable inputs wherever possible. In the event that observable inputs
are not available, the control processes are designed to assure that the valuation approach utilised is
appropriate and consistently applied and that the assumptions are reasonable. These control processes
include reviews of the pricing model’s theoretical soundness and appropriateness by Morgan Stanley Group
personnel with relevant expertise who are independent from the trading desks.
Additionally, groups independent from the trading divisions within the financial control, market risk and
credit risk management departments participate in the review and validation of the fair values generated
from pricing models, as appropriate. Where a pricing model is used to determine fair value, recently
executed comparable transactions and other observable market data are considered for purposes of
validating assumptions underlying the model.
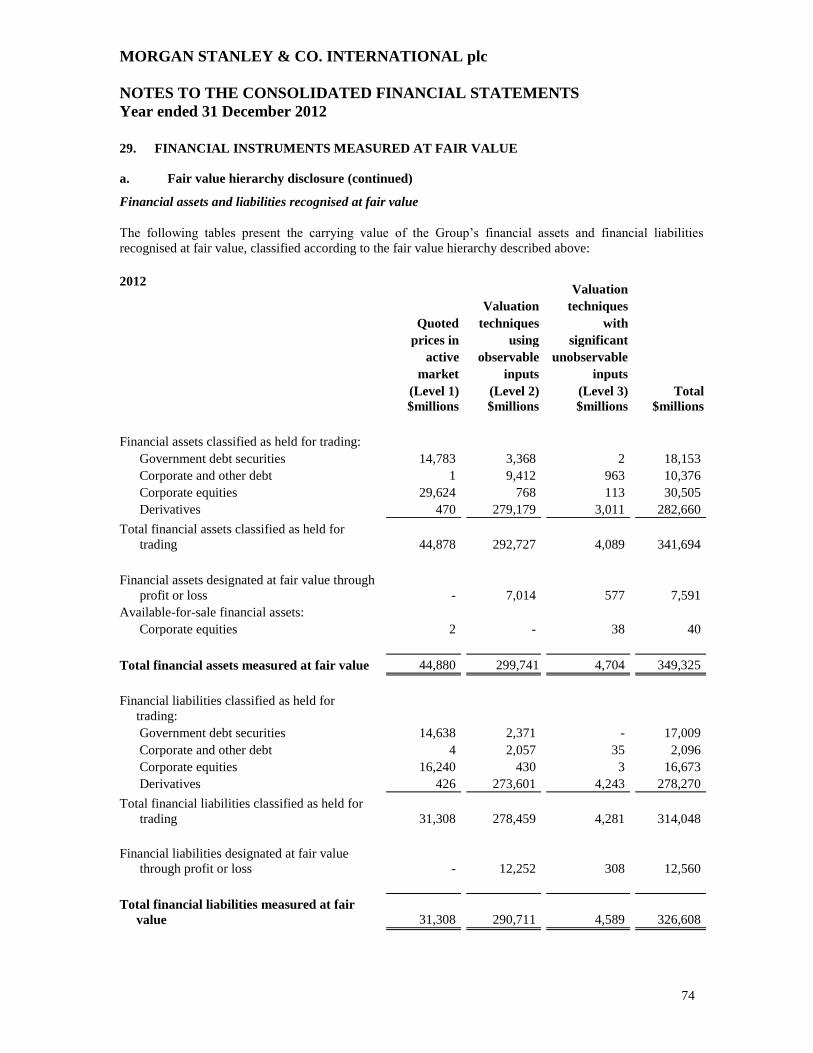
MORGAN STANLEY & CO. INTERNATIONAL plc
NOTES TO THE CONSOLIDATED FINANCIAL STATEMENTS
Year ended 31 December 2012
74
29. FINANCIAL INSTRUMENTS MEASURED AT FAIR VALUE
a. Fair value hierarchy disclosure (continued)
Financial assets and liabilities recognised at fair value
The following tables present the carrying value of the Group’s financial assets and financial liabilities
recognised at fair value, classified according to the fair value hierarchy described above:
2012 Valuation
Valuation techniques
Quoted techniques with
prices in using significant
active observable unobservable
market inputs inputs
(Level 1) (Level 2) (Level 3) Total
$millions $millions $millions $millions
Financial assets classified as held for trading:
Government debt securities 14,783 3,368 2 18,153
Corporate and other debt 1 9,412 963 10,376
Corporate equities 29,624 768 113 30,505
Derivatives 470 279,179 3,011 282,660
Total financial assets classified as held for
trading 44,878 292,727 4,089 341,694
Financial assets designated at fair value through
profit or loss - 7,014 577 7,591
Available-for-sale financial assets:
Corporate equities 2 - 38 40
Total financial assets measured at fair value 44,880 299,741 4,704 349,325
Financial liabilities classified as held for
trading:
Government debt securities 14,638 2,371 - 17,009
Corporate and other debt 4 2,057 35 2,096
Corporate equities 16,240 430 3 16,673
Derivatives 426 273,601 4,243 278,270
Total financial liabilities classified as held for
trading 31,308 278,459 4,281 314,048
Financial liabilities designated at fair value
through profit or loss - 12,252 308 12,560
Total financial liabilities measured at fair
value 31,308 290,711 4,589 326,608
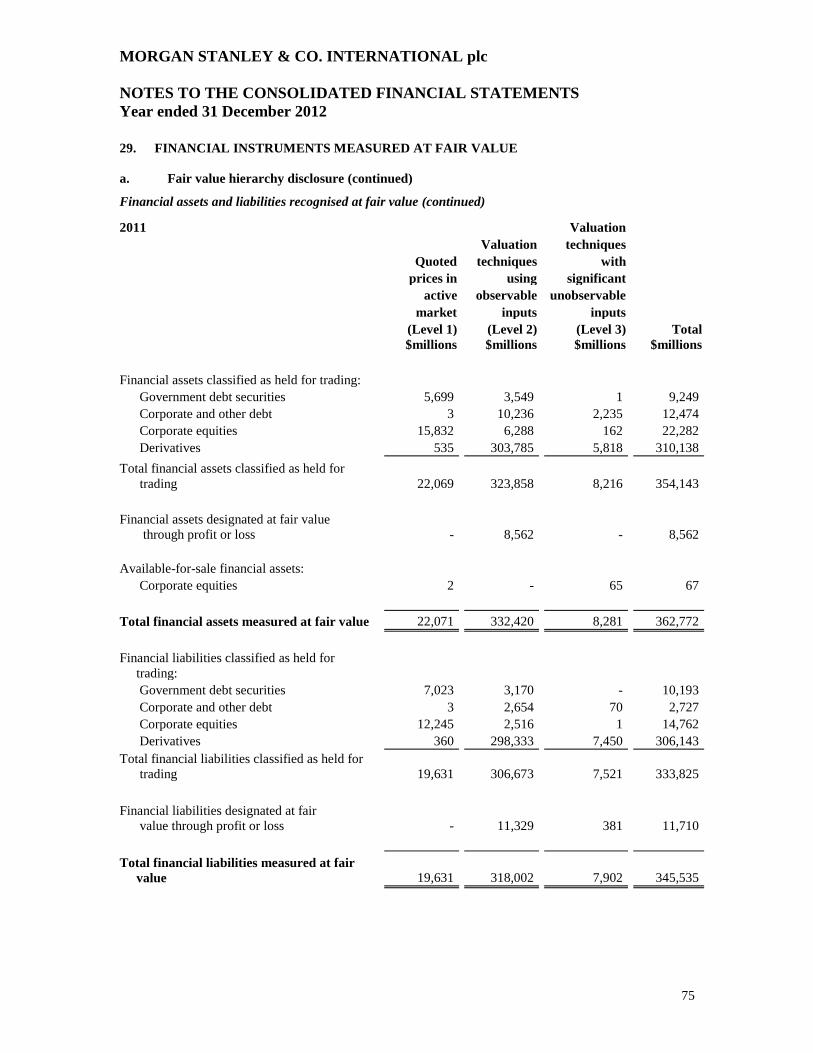
MORGAN STANLEY & CO. INTERNATIONAL plc
NOTES TO THE CONSOLIDATED FINANCIAL STATEMENTS
Year ended 31 December 2012
75
29. FINANCIAL INSTRUMENTS MEASURED AT FAIR VALUE
a. Fair value hierarchy disclosure (continued)
Financial assets and liabilities recognised at fair value (continued) 2011 Valuation
Valuation techniques
Quoted techniques with
prices in using significant
active observable unobservable
market inputs inputs
(Level 1) (Level 2) (Level 3) Total
$millions $millions $millions $millions
Financial assets classified as held for trading:
Government debt securities 5,699 3,549 1 9,249
Corporate and other debt 3 10,236 2,235 12,474
Corporate equities 15,832 6,288 162 22,282
Derivatives 535 303,785 5,818 310,138
Total financial assets classified as held for
trading 22,069 323,858 8,216 354,143
Financial assets designated at fair value
through profit or loss - 8,562 - 8,562
Available-for-sale financial assets:
Corporate equities 2 - 65 67
Total financial assets measured at fair value 22,071 332,420 8,281 362,772
Financial liabilities classified as held for
trading:
Government debt securities 7,023 3,170 - 10,193
Corporate and other debt 3 2,654 70 2,727
Corporate equities 12,245 2,516 1 14,762
Derivatives 360 298,333 7,450 306,143
Total financial liabilities classified as held for
trading 19,631 306,673 7,521 333,825
Financial liabilities designated at fair
value through profit or loss - 11,329 381 11,710
Total financial liabilities measured at fair
value 19,631 318,002 7,902 345,535
MORGAN STANLEY & CO. INTERNATIONAL plc
NOTES TO THE CONSOLIDATED FINANCIAL STATEMENTS
Year ended 31 December 2012
76
29. FINANCIAL INSTRUMENTS MEASURED AT FAIR VALUE (CONTINUED)
a. Fair value hierarchy disclosure (continued)
The Group’s valuation approach and fair value hierarchy categorisation for certain significant classes of
financial instruments recognised at fair value is as follows:
Financial assets and financial liabilities classified as held for trading and available-for-sale financial
assets
Government debt securities
US Treasury Securities. US Treasury Securities are valued using quoted market prices. Valuation
adjustments are not applied. Accordingly, US Treasury securities are generally categorised in Level 1 of
the fair value hierarchy.
US Agency Securities. US Agency Securities are comprised of three main categories consisting of agency
issued debt, agency mortgage pass-through pool securities and collateralised mortgage obligations. Non-
callable agency issued debt securities are generally valued using quoted market prices. Callable agency
issued debt securities are valued by benchmarking model-derived prices to quoted market prices and trade
data for identical or comparable securities. The fair value of agency mortgage pass-through pool securities
is model driven based on spreads of the comparable to-be-announced security. Collateralised mortgage
obligations are valued using quoted market prices and trade data adjusted by subsequent changes in related
indices for identical or comparable securities. Actively traded non-callable agency issued debt securities
are categorised in Level 1 of the fair value hierarchy. Callable agency issued debt securities, agency
mortgage pass-through pool securities and collateralised mortgage obligations are generally categorised in
Level 2 of the fair value hierarchy.
Non-US Sovereign Government Obligations. Non-US Sovereign Government obligations are valued using
quoted prices in active markets when available. To the extent quoted prices are not available, fair value is
determined based on a valuation model that has as inputs interest rate yield curves, cross-currency basis
index spreads, and country credit spreads for structures similar to the bond in terms of issuer, maturity and
seniority. These bonds are generally categorised in Levels 1 or 2 of the fair value hierarchy.
Corporate and other debt
US State and Municipal Securities. The fair value of state and municipal securities is estimated using
recently executed transactions, market price quotations and pricing models that factor in, where applicable,
interest rates, bond or credit default swap spreads and volatility. These bonds are generally categorised in
Level 2 of the fair value hierarchy.
Residential Mortgage-Backed Securities (“RMBS”). Commercial Mortgage-Backed Securities (“CMBS”),
and other Asset-Backed Securities (“ABS”). RMBS, CMBS and other ABS may be valued based on
external price or spread data obtained from observed transactions or independent external parties such as
vendors or brokers. When position-specific external price data are not observable, the fair value
determination may require benchmarking to similar instruments and/ or analysing expected credit losses,
default and recovery rates. In evaluating the fair value of each security, the Group considers security
collateral-specific attributes, including payment priority, credit enhancement levels, type of collateral,
delinquency rates and loss severity. In addition, for RMBS borrowers, Fair Isaac Corporation (“FICO”)
scores and the level of documentation for the loan are also considered. Market standard models, such as
Intex, Trepp or others, may be deployed to model the specific collateral composition and cash flow
structure of each transaction. Key inputs to these models are market spreads, forecasted credit losses,
default and prepayment rates for each asset category Valuation levels of RMBS and CMBS indices are
used as an additional data point for benchmarking purposes or to price outright index positions.
RMBS, CMBS and other ABS are generally categorised in Level 2 of the fair value hierarchy. If external
prices or spread inputs are unobservable or if the comparability assessment involves significant subjectivity
related to property type differences, cash flows, performance and other inputs, then RMBS, CMBS and
ABS are categorised in Level 3 of the fair value hierarchy.
MORGAN STANLEY & CO. INTERNATIONAL plc
NOTES TO THE CONSOLIDATED FINANCIAL STATEMENTS
Year ended 31 December 2012
77
29. FINANCIAL INSTRUMENTS MEASURED AT FAIR VALUE (CONTINUED)
a. Fair value hierarchy disclosure (continued)
Corporate and other debt (continued)
Corporate Bonds. The fair value of corporate bonds is estimated using recently executed transactions,
market price quotations (where observable), bond spreads or credit default swap spreads obtained from
independent external parties such as vendors and brokers adjusted for any basis difference between cash
and derivative instruments. The spread data used are for the same maturity as the bond. If the spread data
does not reference the issuer, then data that reference a comparable issuer are used. When position-specific
external price data are not observable, fair value is determined based on either benchmarking to similar
instruments or cash flow models with yield curves, bond or single name credit default swap spreads and
recovery rates as significant inputs. Corporate bonds are generally categorised in Level 2 of the fair value
hierarchy; in instances where prices, spreads or any other of the aforementioned key inputs are
unobservable, they are categorised in Level 3 of the fair value hierarchy.
Collateralised Debt Obligations (“CDOs”). The Group holds CDOs that typically reference a tranche of an
underlying synthetic portfolio of single name credit default swaps. The collateral is usually ABS or other
corporate bonds. Credit correlation, a primary input used to determine the fair value of a cash CDO, is
usually unobservable and derived using a benchmarking technique. The other model inputs such as credit
spreads, including collateral spreads, and interest rates are observable. CDOs are categorised in Level 2 of
the fair value hierarchy when the correlation input is insignificant. In instances where the correlation input
is deemed to be significant, these instruments are categorised in Level 3 of the fair value hierarchy.
Corporate Loans and Lending Commitments. The fair value of corporate loans is estimated using recently
executed transactions, market prices quotations (where observable), implied yields from comparable debt,
and market observable credit default swap spread levels obtained from independent external parties such as
vendors or brokers adjusted for any basis difference between cash and derivative instruments, along with
proprietary valuation models and default recovery analysis where such transactions and quotations are
unobservable. The fair value of contingent corporate lending commitments is determined by using
executed transactions on comparable loans and the anticipated market price based on pricing indications
from syndicate banks and customers. The valuation of loans and lending commitments also takes into
account fee income that is considered an attribute of the contract. Corporate loans and lending
commitments are generally categorised in Level 2 of the fair value hierarchy except in instances where
prices or significant spread inputs are unobservable, in which case they are categorised in Level 3 of the
fair value hierarchy.
Mortgage Loans. Mortgage loans are valued using observable prices based on transactional data or third
party pricing for identical or comparable instruments, where available. Where position-specific external
prices are not observable, the Group estimates fair value based on benchmarking to prices and rates
observed in the primary market for similar loan or borrower types, or based on the present value of
expected future cash flows using its best estimates of the key assumptions, including forecasted credit
losses, prepayment rates, forward yield curves and discount rates commensurate with the risks involved or
a methodology that utilises the capital structure and credit spreads of recent comparable securitisation
transactions. Mortgage loans valued based on observable market data for identical or comparable
instruments are categorised in Level 2 of the fair value hierarchy. Where observable prices are not
available, due to the subjectivity involved in comparability assessment related to mortgage loan vintage,
geographical concentration, prepayment speed and projected loss assumptions, mortgage loans are
classified in Level 3 of the fair value hierarchy.
Corporate Equities
Exchange-Traded Equity Securities. Exchange-traded equity securities are generally valued based on
quoted prices from the exchange. To the extent these securities are actively traded, valuation adjustments
are not applied, and they are categorised in Level 1 of the fair value hierarchy; otherwise, they are
categorised in Level 2 or Level 3 of the fair value hierarchy.
MORGAN STANLEY & CO. INTERNATIONAL plc
NOTES TO THE CONSOLIDATED FINANCIAL STATEMENTS
Year ended 31 December 2012
78
29. FINANCIAL INSTRUMENTS MEASURED AT FAIR VALUE (CONTINUED)
a. Fair value hierarchy disclosure (continued)
Corporate Equities (continued)
Investments (other than investments in other Morgan Stanley Group undertakings). The Group’s
investments include direct investments in equity securities as well as investments in private equity funds,
real estate funds and hedge funds, which include investments made in connection with certain employee
deferred compensation plans. Initially, the transaction price is generally considered by the Group as the
exit price and is the Group’s best estimate of fair value.
After initial recognition, in determining the fair value of internally and externally managed funds, the
Group generally considers the net asset value of the fund provided by the fund manager to be the best
estimate of fair value. For non-exchange-traded investments either held directly or held, within internally
managed funds, fair value after initial recognition is based on an assessment of each underlying investment,
considering rounds of financing third party transactions, discounted cash flow analyses and market-based
information, including comparable company transactions, trading multiples and changes in market outlook,
among other factors. Exchanged-traded direct equity investments are generally valued based on quoted
prices from the exchange.
Exchange-traded direct equity investments that are actively traded are categorised in Level 1 of the fair
value hierarchy. Non-exchange-traded direct equity investments and investments in private equity and real
estate funds are generally categorised in Level 3 of the fair value hierarchy. Investments in hedge funds
that are redeemable at the measurement date or in the near future, are categorised in Level 2 of the fair
value hierarchy; otherwise they are categorised in Level 3 of the fair value hierarchy.
Equity investments in other Morgan Stanley Group undertakings. Where the Group has equity investments
in other Morgan Stanley Group undertakings that are neither subsidiaries nor associates, the Group’s share
of the net asset value of the undertaking is considered the best representation of fair value for the
investment. These investments are included in Level 3 of the fair value hierarchy because net asset value
amounts are not considered observable.
Derivatives
Listed Derivative Contracts. Listed derivatives that are actively traded are valued based on quoted prices
from the exchange and are categorised in Level 1 of the fair value hierarchy. Listed derivatives that are not
actively traded are valued using the same approaches as those applied to OTC derivatives; they are
generally categorised in Level 2 of the fair value hierarchy.
OTC Derivative Contracts. OTC derivative contracts include forward, swap and option contracts related to
interest rates, foreign currencies, credit standing of reference entities, equity prices or commodity prices.
Depending on the product and the terms of the transaction, the fair value of OTC derivative products can be
either observed or modelled using a series of techniques, and model inputs from comparable benchmarks,
including closed-form analytic formulas, such as the Black-Scholes option-pricing model, and simulation
models or a combination thereof. Many pricing models do not entail material subjectivity because the
methodologies employed do not necessitate significant judgement, and the pricing inputs are observed from
actively quoted markets, as is the case for generic interest rate swaps, certain option contracts and certain
credit default swaps. In the case of more established derivative products, the pricing models used by the
Group are widely accepted by the financial services industry. A substantial majority of OTC derivative
products valued using pricing models fall into this category and are categorised within Level 2 of the fair
value hierarchy.
MORGAN STANLEY & CO. INTERNATIONAL plc
NOTES TO THE CONSOLIDATED FINANCIAL STATEMENTS
Year ended 31 December 2012
79
29. FINANCIAL INSTRUMENTS MEASURED AT FAIR VALUE (CONTINUED)
a. Fair value hierarchy disclosure (continued)
Derivatives (continued)
Other derivative products, including complex products that have become illiquid, require more judgement
in the implementation of the valuation technique applied due to the complexity of the valuation
assumptions and the reduced observability of inputs. This includes certain types of interest rate derivatives
with both volatility and correlation exposure and credit derivatives including mortgage-related CDO
securities, certain types of ABS credit default swaps, basket credit default swaps and CDO-squared
positions where direct trading activity or quotes are unobservable. These instruments involve significant
unobservable inputs and are categorised in Level 3 of the fair value hierarchy.
Derivative interests in complex mortgage-related CDOs and ABS credit default swaps, for which
observability of external price data is limited, are valued based on an evaluation of the market and model
input parameters sourced from similar positions as indicated by primary and secondary market activity.
Each position is evaluated independently taking into consideration available comparable market levels as
well as cash-synthetic basis, or the underlying collateral performance and pricing, behaviour of the tranche
under various cumulative loss and prepayment scenarios, deal structures (e.g., non-amortising reference
obligations, call features) and liquidity. While these factors may be supported by historical and actual
external observations, the determination of their value as it relates to specific positions nevertheless
requires significant judgement.
For basket credit default swaps and CDO-squared positions, the correlation input between reference credits
is unobservable for each specific swap or position and is benchmarked to standardised proxy baskets for
which correlation data are available. The other model inputs such as credit spread, interest rates and
recovery rates are observable. In instances where the correlation input is deemed to be significant, these
instruments are categorised in Level 3 of the fair value hierarchy; otherwise, the instruments are categorised
in Level 2 of the fair value hierarchy.
The Group trades various derivative structures with commodity underlyings. Depending on the type of
structure, the model inputs generally include interest rate yield curves, commodity underlier price curves,
implied volatility of the underlying commodities and, in some cases, the implied correlation between these
inputs. The fair value of these products is estimated using executed trades and broker and consensus data to
provide values for the aforementioned inputs. Where these inputs are unobservable, relationships to
observable commodities and data points, based on historic and/ or implied observations, are employed as a
technique to estimate the model input values. Commodity derivatives are generally categorised in Level 2
of the fair value hierarchy; in instances where significant inputs are unobservable, they are categorised in
Level 3 of the fair value hierarchy.
Financial assets and financial liabilities designated at fair value through profit or loss
Prepaid OTC contracts and issued structured notes designated as fair value through profit or loss
The Group issues structured notes and trades prepaid OTC derivatives that have coupons or repayment
terms linked to the performance of debt or equity securities, indices, currencies or commodities. The fair
value of structured notes and prepaid OTC derivatives is determined using valuation models for the
derivative and debt portions of the notes. These models incorporate observable inputs referencing identical
or comparable securities, including prices that the notes are linked to, interest rate yield curves, option
volatility and currency, commodity or equity rates. Independent, external and traded prices for the notes
are also considered. The impact of own credit spreads is also included based on observed secondary bond
market spreads. Most structured notes and prepaid OTC derivatives are categorised in Level 2 of the fair
value hierarchy.
MORGAN STANLEY & CO. INTERNATIONAL plc
NOTES TO THE CONSOLIDATED FINANCIAL STATEMENTS
Year ended 31 December 2012
80
29. FINANCIAL INSTRUMENTS MEASURED AT FAIR VALUE (CONTINUED)
a. Fair value hierarchy disclosure (continued)
Customer Loans
Corporate Loans and Lending commitments. The fair value of corporate loans is estimated using recently
executed transactions, market prices quotations (where observable), implied yields from comparable debt,
and market observable credit default swap spread levels obtained from independent external parties such as
vendors or brokers adjusted for any basis difference between cash and derivative instruments, along with
proprietary valuation models and default recovery analysis where such transactions and quotations are
unobservable. The fair value of contingent corporate lending commitments is determined by using
executed transactions on comparable loans and the anticipated market price based on pricing indications
from syndicate banks and customers. The valuation of loans and lending commitments also takes into
account fee income that is considered an attribute of the contract. Corporate loans and lending
commitments are generally categorised in Level 2 of the fair value hierarchy except in instances where
prices or significant spread inputs are unobservable, in which case they are categorised in Level 3 of the
fair value hierarchy.
Mortgage Loans. Mortgage loans are valued using observable prices based on transactional data or third
party pricing for identical or comparable instruments, where available. Where position-specific external
prices are not observable, the Group estimates fair value based on benchmarking to prices and rates
observed in the primary market for similar loan or borrower types, or based on the present value of
expected future cash flows using its best estimates of the key assumptions, including forecasted credit
losses, prepayment rates, forward yield curves and discount rates commensurate with the risks involved or
a methodology that utilises the capital structure and credit spreads of recent comparable securitisation
transactions. Mortgage loans valued based on observable market data for identical or comparable
instruments are categorised in Level 2 of the fair value hierarchy. Where observable prices are not
available, due to the subjectivity involved in comparability assessment related to mortgage loan vintage,
geographical concentration, prepayment speed and projected loss assumptions, mortgage loans are
classified in Level 3 of the fair value hierarchy.
b. Changes in Level 3 assets and liabilities measured at fair value
The following table presents the changes in the fair value of the Group’s Level 3 financial assets and
financial liabilities for the year ended 31 December 2012. Level 3 instruments may be hedged with
instruments classified in Level 1 and Level 2. As a result, the realised and unrealised gains (losses) for
assets and liabilities within the Level 3 category presented in the tables below do not reflect the related
realised and unrealised gains (losses) on hedging instruments that have been classified by the Group within
the Level 1 and/or Level 2 categories.
Additionally, both observable and unobservable inputs may be used to determine the fair value of positions
that the Group has classified within the Level 3 category. As a result, the unrealised gains/ (losses) during
the period for assets and liabilities within the Level 3 category presented in the tables below may include
changes in fair value during the period that were attributable to both observable (e.g., changes in market
interest rates) and unobservable (e.g., changes in unobservable long-dated volatilities) inputs.
The Morgan Stanley Group operates a number of intra-group policies to ensure that, where possible,
revenues and related costs are matched. Where the trading positions included in the below table are risk
managed using financial instruments held by other Morgan Stanley Group undertakings, these policies
potentially result in the recognition of offsetting gains or losses in the Group.
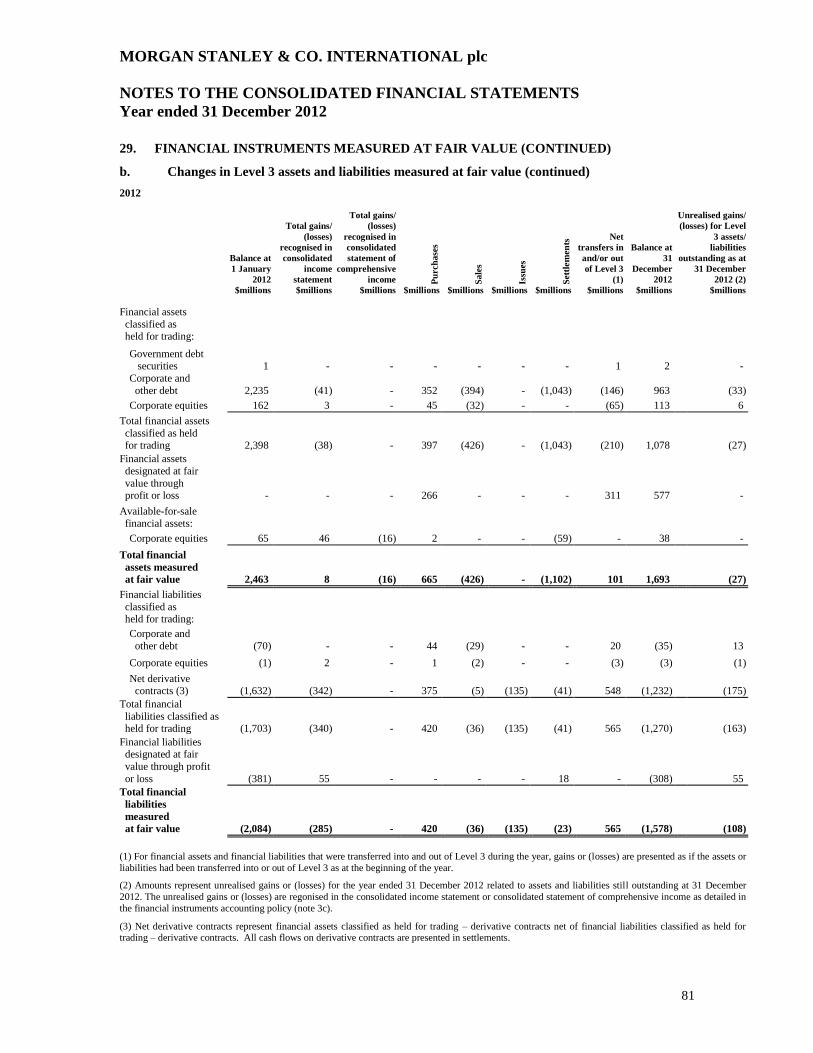
MORGAN STANLEY & CO. INTERNATIONAL plc
NOTES TO THE CONSOLIDATED FINANCIAL STATEMENTS
Year ended 31 December 2012
81
29. FINANCIAL INSTRUMENTS MEASURED AT FAIR VALUE (CONTINUED)
b. Changes in Level 3 assets and liabilities measured at fair value (continued)
2012
Balance at
1 January
2012
Total gains/
(losses)
recognised in
consolidated
income
statement
Total gains/
(losses)
recognised in
consolidated
statement of
comprehensive
income Pu
rch
ase
s
Sale
s
Issu
es
Sett
lem
en
ts Net
transfers in
and/or out
of Level 3
(1)
Balance at
31
December
2012
Unrealised gains/
(losses) for Level
3 assets/
liabilities
outstanding as at
31 December
2012 (2)
$millions $millions $millions $millions $millions $millions $millions $millions $millions $millions
Financial assets
classified as held for trading:
Government debt securities 1 - - - - - - 1 2 -
Corporate and
other debt 2,235 (41) - 352 (394) - (1,043) (146) 963 (33)
Corporate equities 162 3 - 45 (32) - - (65) 113 6
Total financial assets
classified as held for trading 2,398 (38) - 397 (426) - (1,043) (210) 1,078 (27)
Financial assets
designated at fair
value through profit or loss - - - 266 - - - 311 577 -
Available-for-sale
financial assets:
Corporate equities 65 46 (16) 2 - - (59) - 38 -
Total financial
assets measured
at fair value 2,463 8 (16) 665 (426) - (1,102) 101 1,693 (27)
Financial liabilities
classified as held for trading:
Corporate and
other debt (70) - - 44 (29) - - 20 (35) 13
Corporate equities (1) 2 - 1 (2) - - (3) (3) (1)
Net derivative contracts (3) (1,632) (342) - 375 (5) (135) (41) 548 (1,232) (175)
Total financial
liabilities classified as held for trading (1,703) (340) - 420 (36) (135) (41) 565 (1,270) (163)
Financial liabilities designated at fair
value through profit
or loss (381) 55 - - - - 18 - (308) 55
Total financial
liabilities
measured
at fair value (2,084) (285) - 420 (36) (135) (23) 565 (1,578) (108)
(1) For financial assets and financial liabilities that were transferred into and out of Level 3 during the year, gains or (losses) are presented as if the assets or
liabilities had been transferred into or out of Level 3 as at the beginning of the year.
(2) Amounts represent unrealised gains or (losses) for the year ended 31 December 2012 related to assets and liabilities still outstanding at 31 December
2012. The unrealised gains or (losses) are regonised in the consolidated income statement or consolidated statement of comprehensive income as detailed in
the financial instruments accounting policy (note 3c).
(3) Net derivative contracts represent financial assets classified as held for trading – derivative contracts net of financial liabilities classified as held for trading – derivative contracts. All cash flows on derivative contracts are presented in settlements.
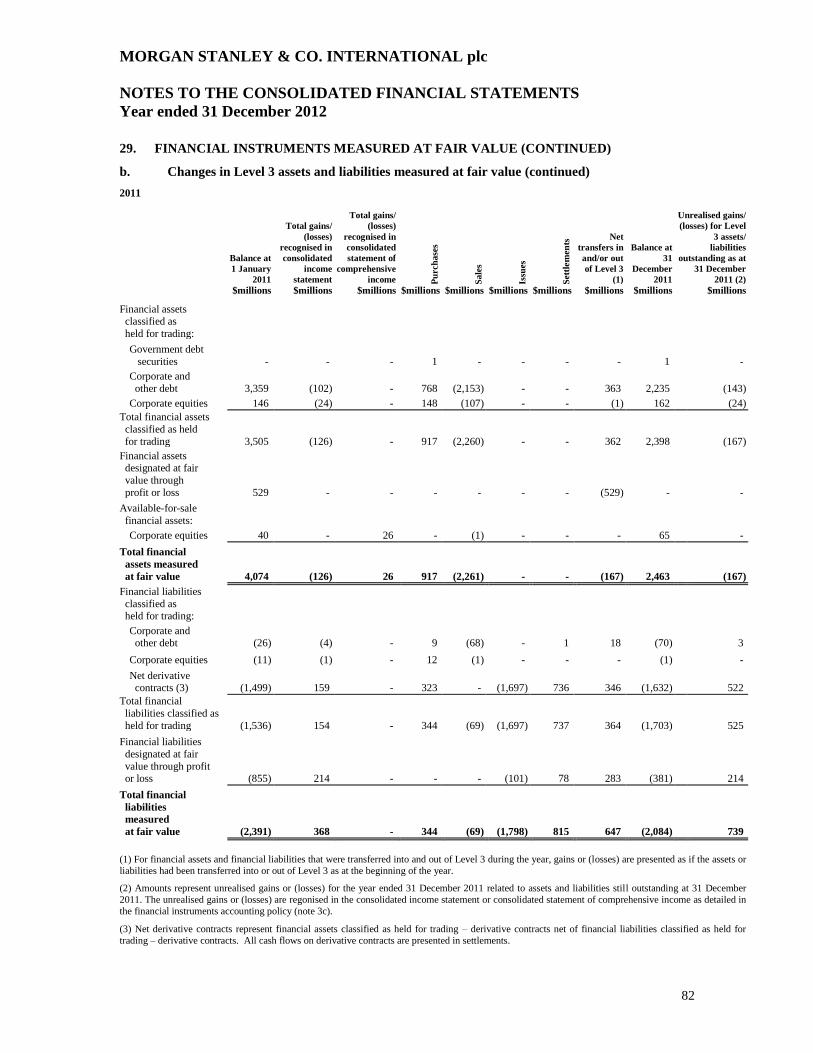
MORGAN STANLEY & CO. INTERNATIONAL plc
NOTES TO THE CONSOLIDATED FINANCIAL STATEMENTS
Year ended 31 December 2012
82
29. FINANCIAL INSTRUMENTS MEASURED AT FAIR VALUE (CONTINUED)
b. Changes in Level 3 assets and liabilities measured at fair value (continued)
2011
Balance at
1 January
2011
Total gains/
(losses)
recognised in
consolidated
income
statement
Total gains/
(losses)
recognised in
consolidated
statement of
comprehensive
income Pu
rch
ase
s
Sale
s
Issu
es
Sett
lem
en
ts Net
transfers in
and/or out
of Level 3
(1)
Balance at
31
December
2011
Unrealised gains/
(losses) for Level
3 assets/
liabilities
outstanding as at
31 December
2011 (2)
$millions $millions $millions $millions $millions $millions $millions $millions $millions $millions
Financial assets
classified as
held for trading:
Government debt
securities - - - 1 - - - - 1 -
Corporate and
other debt 3,359 (102) - 768 (2,153) - - 363 2,235 (143)
Corporate equities 146 (24) - 148 (107) - - (1) 162 (24)
Total financial assets
classified as held
for trading 3,505 (126) - 917 (2,260) - - 362 2,398 (167)
Financial assets designated at fair
value through
profit or loss 529 - - - - - - (529) - -
Available-for-sale
financial assets:
Corporate equities 40 - 26 - (1) - - - 65 -
Total financial
assets measured
at fair value 4,074 (126) 26 917 (2,261) - - (167) 2,463 (167)
Financial liabilities
classified as held for trading:
Corporate and other debt (26) (4) - 9 (68) - 1 18 (70) 3
Corporate equities (11) (1) - 12 (1) - - - (1) -
Net derivative contracts (3) (1,499) 159 - 323 - (1,697) 736 346 (1,632) 522
Total financial
liabilities classified as
held for trading (1,536) 154 - 344 (69) (1,697) 737 364 (1,703) 525
Financial liabilities
designated at fair
value through profit or loss (855) 214 - - - (101) 78 283 (381) 214
Total financial
liabilities
measured
at fair value (2,391) 368 - 344 (69) (1,798) 815 647 (2,084) 739
(1) For financial assets and financial liabilities that were transferred into and out of Level 3 during the year, gains or (losses) are presented as if the assets or
liabilities had been transferred into or out of Level 3 as at the beginning of the year.
(2) Amounts represent unrealised gains or (losses) for the year ended 31 December 2011 related to assets and liabilities still outstanding at 31 December
2011. The unrealised gains or (losses) are regonised in the consolidated income statement or consolidated statement of comprehensive income as detailed in
the financial instruments accounting policy (note 3c).
(3) Net derivative contracts represent financial assets classified as held for trading – derivative contracts net of financial liabilities classified as held for
trading – derivative contracts. All cash flows on derivative contracts are presented in settlements.
MORGAN STANLEY & CO. INTERNATIONAL plc
NOTES TO THE CONSOLIDATED FINANCIAL STATEMENTS
Year ended 31 December 2012
83
29. FINANCIAL INSTRUMENTS MEASURED AT FAIR VALUE (CONTINUED)
b. Changes in Level 3 assets and liabilities measured at fair value (continued)
During the year, the Group reclassified approximately $1,604 million (2011: $529 million) of derivative
assets and $2,152 million (2011: $nil) of derivative liabilities from Level 3 to Level 2. These
reclassifications were primarily related to hybrid contracts for which external prices became observable and
the remaining unobservable inputs were deemed insignificant to the overall measurement.
There were no significant transfers from Level 2 to Level 3 of the fair value hierarchy during the year
(2011: $nil).
c. Significant transfers between Level 1 and Level 2 of the fair value hierarchy
During the year, the Group reclassified approximately $2,700 million of derivative assets and
approximately $1,981 million of derivative liabilities from Level 2 to Level 1 as these listed derivatives
became actively traded and were valued based on quoted prices from the exchange. Also during the year,
the Group reclassified approximately $302 million of listed derivative assets from Level 1 to Level 2 as
transactions in these contracts did not occur with sufficient frequency and volume to constitute an active
market.
During 2011, the Group reclassified approximately $1,027 million of government debt security assets and
approximately $1,778 million of government debt security liabilities from Level 1 to Level 2. These
reclassifications primarily related to certain European peripheral government bonds as these securities
traded with a high degree of pricing volatility, dispersion and wider bid-ask spreads. The Group continues
to mark these securities to observable market price quotations.
d. Sensitivity of fair values to changing significant assumptions to reasonably possible
alternatives
All financial instruments are valued in accordance with the techniques outlined in the fair value hierarchy
disclosure above. Some of these techniques, including those used to value instruments categorised in Level
3 of the fair value hierarchy, are dependent on unobservable parameters and the fair value for these
financial instruments has been determined using parameters appropriate for the valuation methodology
based on prevailing market evidence. It is recognised that the unobservable parameters could have a range
of reasonably possible alternative values.
In estimating the change in fair value, the unobservable parameters were varied to the extremes of the
ranges of reasonably possible alternatives using statistical techniques, such as dispersion in comparable
observable external inputs for similar asset classes, historic data or judgement if a statistical technique is
not appropriate. Where a financial instrument has more than one unobservable parameter, the sensitivity
analysis reflects the greatest reasonably possible increase or decrease to fair value by varying the
assumptions individually. It is unlikely that all unobservable parameters would be concurrently at the
extreme range of possible alternative assumptions and therefore the sensitivity shown below is likely to be
greater than the actual uncertainty relating to the financial instruments.
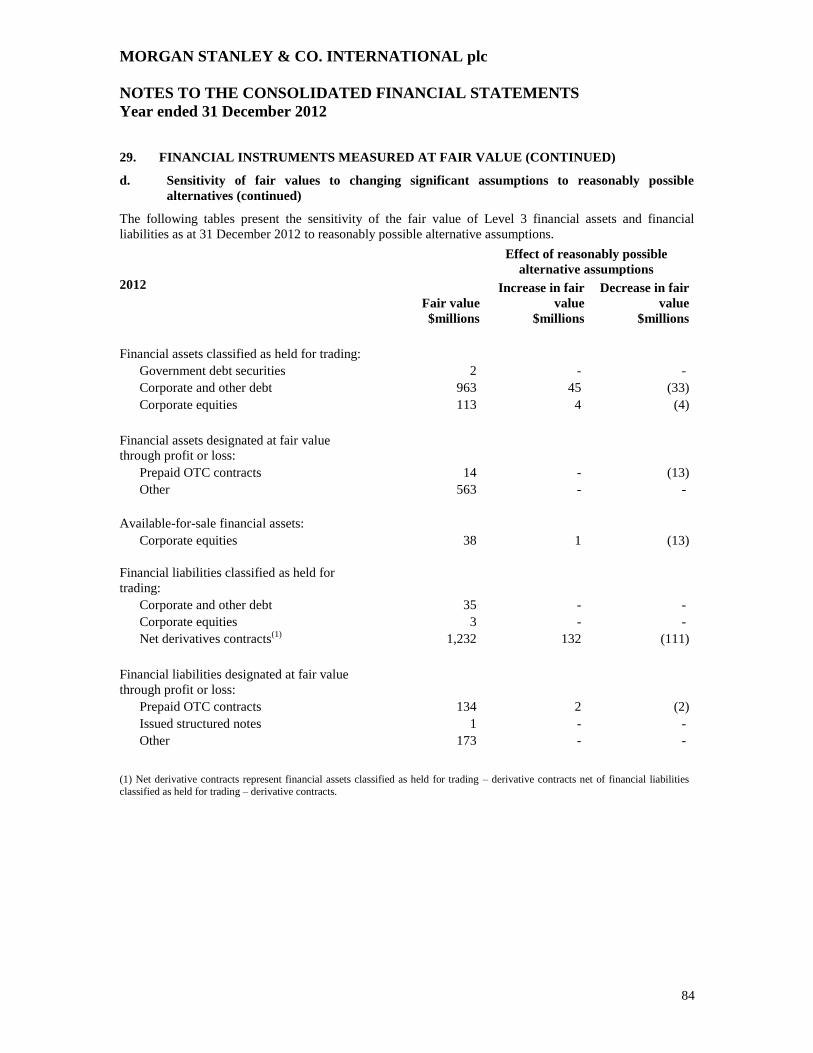
MORGAN STANLEY & CO. INTERNATIONAL plc
NOTES TO THE CONSOLIDATED FINANCIAL STATEMENTS
Year ended 31 December 2012
84
29. FINANCIAL INSTRUMENTS MEASURED AT FAIR VALUE (CONTINUED)
d. Sensitivity of fair values to changing significant assumptions to reasonably possible
alternatives (continued)
The following tables present the sensitivity of the fair value of Level 3 financial assets and financial
liabilities as at 31 December 2012 to reasonably possible alternative assumptions.
Effect of reasonably possible
alternative assumptions
2012
Fair value
Increase in fair
value
Decrease in fair
value
$millions $millions $millions
Financial assets classified as held for trading:
Government debt securities 2 - -
Corporate and other debt 963 45 (33)
Corporate equities 113 4 (4)
Financial assets designated at fair value
through profit or loss:
Prepaid OTC contracts 14 - (13)
Other 563 - -
Available-for-sale financial assets:
Corporate equities 38 1 (13)
Financial liabilities classified as held for
trading:
Corporate and other debt 35 - -
Corporate equities 3 - -
Net derivatives contracts(1)
1,232
132 (111)
Financial liabilities designated at fair value
through profit or loss:
Prepaid OTC contracts 134 2 (2)
Issued structured notes 1 - -
Other 173 - -
(1) Net derivative contracts represent financial assets classified as held for trading – derivative contracts net of financial liabilities
classified as held for trading – derivative contracts.
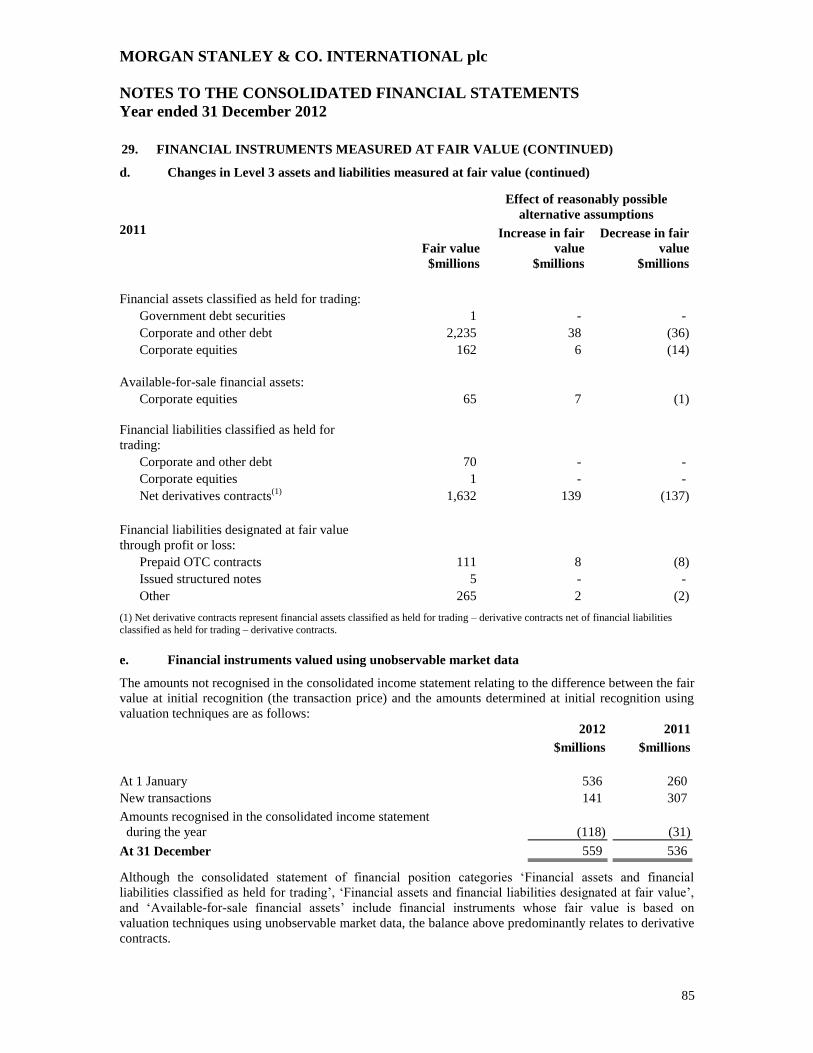
MORGAN STANLEY & CO. INTERNATIONAL plc
NOTES TO THE CONSOLIDATED FINANCIAL STATEMENTS
Year ended 31 December 2012
85
29. FINANCIAL INSTRUMENTS MEASURED AT FAIR VALUE (CONTINUED)
d. Changes in Level 3 assets and liabilities measured at fair value (continued)
Effect of reasonably possible
alternative assumptions
2011
Fair value
Increase in fair
value
Decrease in fair
value
$millions $millions $millions
Financial assets classified as held for trading:
Government debt securities 1 - -
Corporate and other debt 2,235 38 (36)
Corporate equities 162 6 (14)
Available-for-sale financial assets:
Corporate equities 65 7 (1)
Financial liabilities classified as held for
trading:
Corporate and other debt 70 - -
Corporate equities 1 - -
Net derivatives contracts(1)
1,632
139 (137)
Financial liabilities designated at fair value
through profit or loss:
Prepaid OTC contracts 111 8 (8)
Issued structured notes 5 - -
Other 265 2 (2)
(1) Net derivative contracts represent financial assets classified as held for trading – derivative contracts net of financial liabilities
classified as held for trading – derivative contracts.
e. Financial instruments valued using unobservable market data
The amounts not recognised in the consolidated income statement relating to the difference between the fair
value at initial recognition (the transaction price) and the amounts determined at initial recognition using
valuation techniques are as follows: 2012 2011
$millions $millions
At 1 January 536 260
New transactions 141 307
Amounts recognised in the consolidated income statement
during the year (118) (31)
At 31 December 559 536
Although the consolidated statement of financial position categories ‘Financial assets and financial
liabilities classified as held for trading’, ‘Financial assets and financial liabilities designated at fair value’,
and ‘Available-for-sale financial assets’ include financial instruments whose fair value is based on
valuation techniques using unobservable market data, the balance above predominantly relates to derivative
contracts.
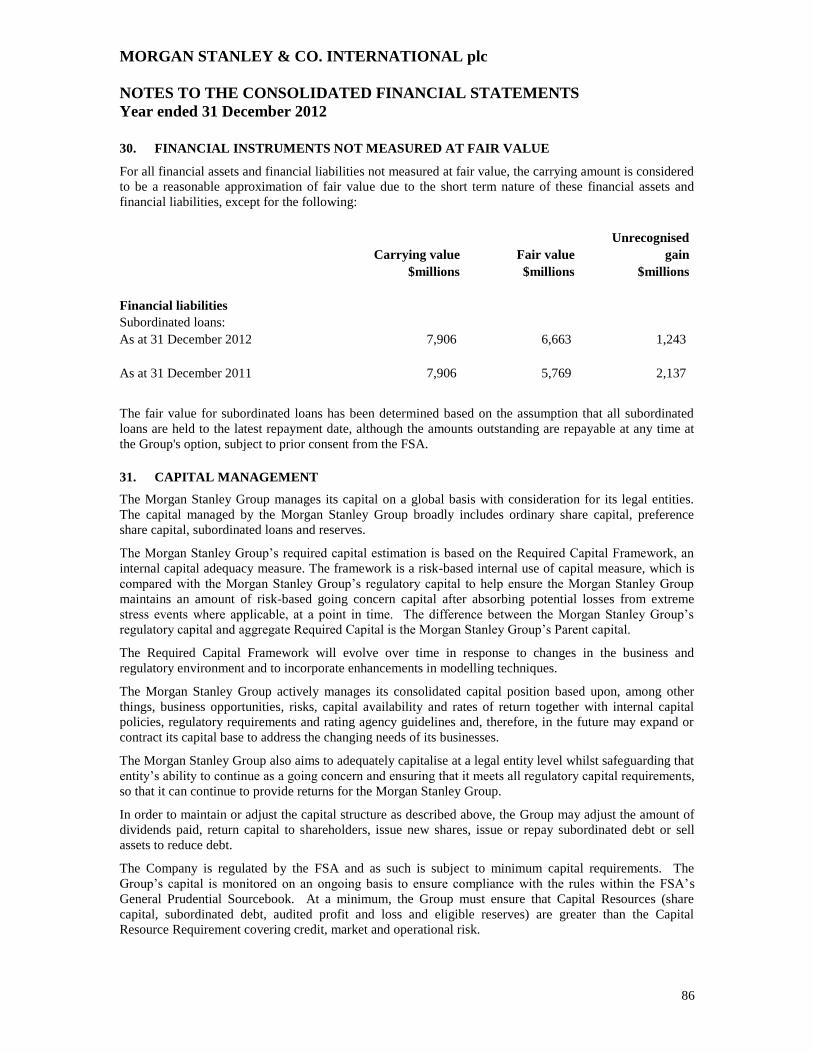
MORGAN STANLEY & CO. INTERNATIONAL plc
NOTES TO THE CONSOLIDATED FINANCIAL STATEMENTS
Year ended 31 December 2012
86
30. FINANCIAL INSTRUMENTS NOT MEASURED AT FAIR VALUE
For all financial assets and financial liabilities not measured at fair value, the carrying amount is considered
to be a reasonable approximation of fair value due to the short term nature of these financial assets and
financial liabilities, except for the following:
Unrecognised
Carrying value Fair value gain
$millions $millions $millions
Financial liabilities
Subordinated loans:
As at 31 December 2012 7,906 6,663 1,243
As at 31 December 2011 7,906 5,769 2,137
The fair value for subordinated loans has been determined based on the assumption that all subordinated
loans are held to the latest repayment date, although the amounts outstanding are repayable at any time at
the Group's option, subject to prior consent from the FSA.
31. CAPITAL MANAGEMENT
The Morgan Stanley Group manages its capital on a global basis with consideration for its legal entities.
The capital managed by the Morgan Stanley Group broadly includes ordinary share capital, preference
share capital, subordinated loans and reserves.
The Morgan Stanley Group’s required capital estimation is based on the Required Capital Framework, an
internal capital adequacy measure. The framework is a risk-based internal use of capital measure, which is
compared with the Morgan Stanley Group’s regulatory capital to help ensure the Morgan Stanley Group
maintains an amount of risk-based going concern capital after absorbing potential losses from extreme
stress events where applicable, at a point in time. The difference between the Morgan Stanley Group’s
regulatory capital and aggregate Required Capital is the Morgan Stanley Group’s Parent capital.
The Required Capital Framework will evolve over time in response to changes in the business and
regulatory environment and to incorporate enhancements in modelling techniques.
The Morgan Stanley Group actively manages its consolidated capital position based upon, among other
things, business opportunities, risks, capital availability and rates of return together with internal capital
policies, regulatory requirements and rating agency guidelines and, therefore, in the future may expand or
contract its capital base to address the changing needs of its businesses.
The Morgan Stanley Group also aims to adequately capitalise at a legal entity level whilst safeguarding that
entity’s ability to continue as a going concern and ensuring that it meets all regulatory capital requirements,
so that it can continue to provide returns for the Morgan Stanley Group.
In order to maintain or adjust the capital structure as described above, the Group may adjust the amount of
dividends paid, return capital to shareholders, issue new shares, issue or repay subordinated debt or sell
assets to reduce debt.
The Company is regulated by the FSA and as such is subject to minimum capital requirements. The
Group’s capital is monitored on an ongoing basis to ensure compliance with the rules within the FSA’s
General Prudential Sourcebook. At a minimum, the Group must ensure that Capital Resources (share
capital, subordinated debt, audited profit and loss and eligible reserves) are greater than the Capital
Resource Requirement covering credit, market and operational risk.
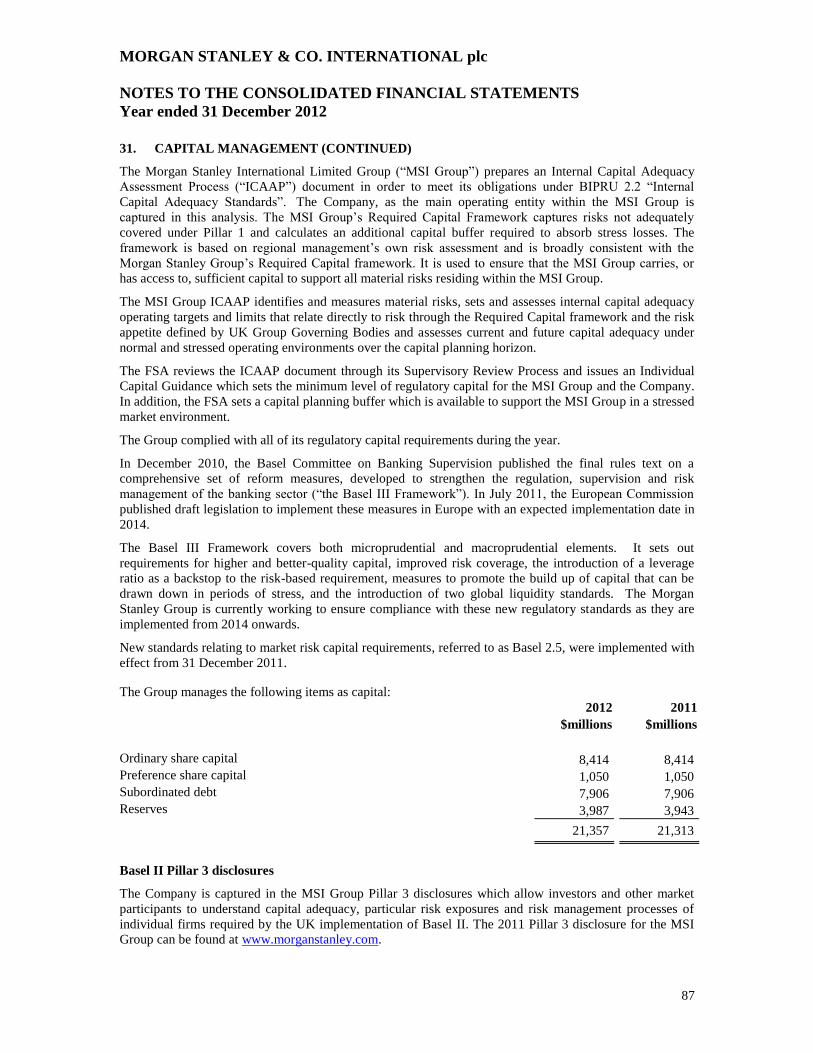
MORGAN STANLEY & CO. INTERNATIONAL plc
NOTES TO THE CONSOLIDATED FINANCIAL STATEMENTS
Year ended 31 December 2012
87
31. CAPITAL MANAGEMENT (CONTINUED)
The Morgan Stanley International Limited Group (“MSI Group”) prepares an Internal Capital Adequacy
Assessment Process (“ICAAP”) document in order to meet its obligations under BIPRU 2.2 “Internal
Capital Adequacy Standards”. The Company, as the main operating entity within the MSI Group is
captured in this analysis. The MSI Group’s Required Capital Framework captures risks not adequately
covered under Pillar 1 and calculates an additional capital buffer required to absorb stress losses. The
framework is based on regional management’s own risk assessment and is broadly consistent with the
Morgan Stanley Group’s Required Capital framework. It is used to ensure that the MSI Group carries, or
has access to, sufficient capital to support all material risks residing within the MSI Group.
The MSI Group ICAAP identifies and measures material risks, sets and assesses internal capital adequacy
operating targets and limits that relate directly to risk through the Required Capital framework and the risk
appetite defined by UK Group Governing Bodies and assesses current and future capital adequacy under
normal and stressed operating environments over the capital planning horizon.
The FSA reviews the ICAAP document through its Supervisory Review Process and issues an Individual
Capital Guidance which sets the minimum level of regulatory capital for the MSI Group and the Company.
In addition, the FSA sets a capital planning buffer which is available to support the MSI Group in a stressed
market environment.
The Group complied with all of its regulatory capital requirements during the year.
In December 2010, the Basel Committee on Banking Supervision published the final rules text on a
comprehensive set of reform measures, developed to strengthen the regulation, supervision and risk
management of the banking sector (“the Basel III Framework”). In July 2011, the European Commission
published draft legislation to implement these measures in Europe with an expected implementation date in
2014.
The Basel III Framework covers both microprudential and macroprudential elements. It sets out
requirements for higher and better-quality capital, improved risk coverage, the introduction of a leverage
ratio as a backstop to the risk-based requirement, measures to promote the build up of capital that can be
drawn down in periods of stress, and the introduction of two global liquidity standards. The Morgan
Stanley Group is currently working to ensure compliance with these new regulatory standards as they are
implemented from 2014 onwards.
New standards relating to market risk capital requirements, referred to as Basel 2.5, were implemented with
effect from 31 December 2011.
The Group manages the following items as capital:
2012 2011
$millions $millions
Ordinary share capital 8,414 8,414
Preference share capital 1,050 1,050
Subordinated debt 7,906 7,906
Reserves 3,987 3,943
21,357 21,313
Basel II Pillar 3 disclosures
The Company is captured in the MSI Group Pillar 3 disclosures which allow investors and other market
participants to understand capital adequacy, particular risk exposures and risk management processes of
individual firms required by the UK implementation of Basel II. The 2011 Pillar 3 disclosure for the MSI
Group can be found at www.morganstanley.com.
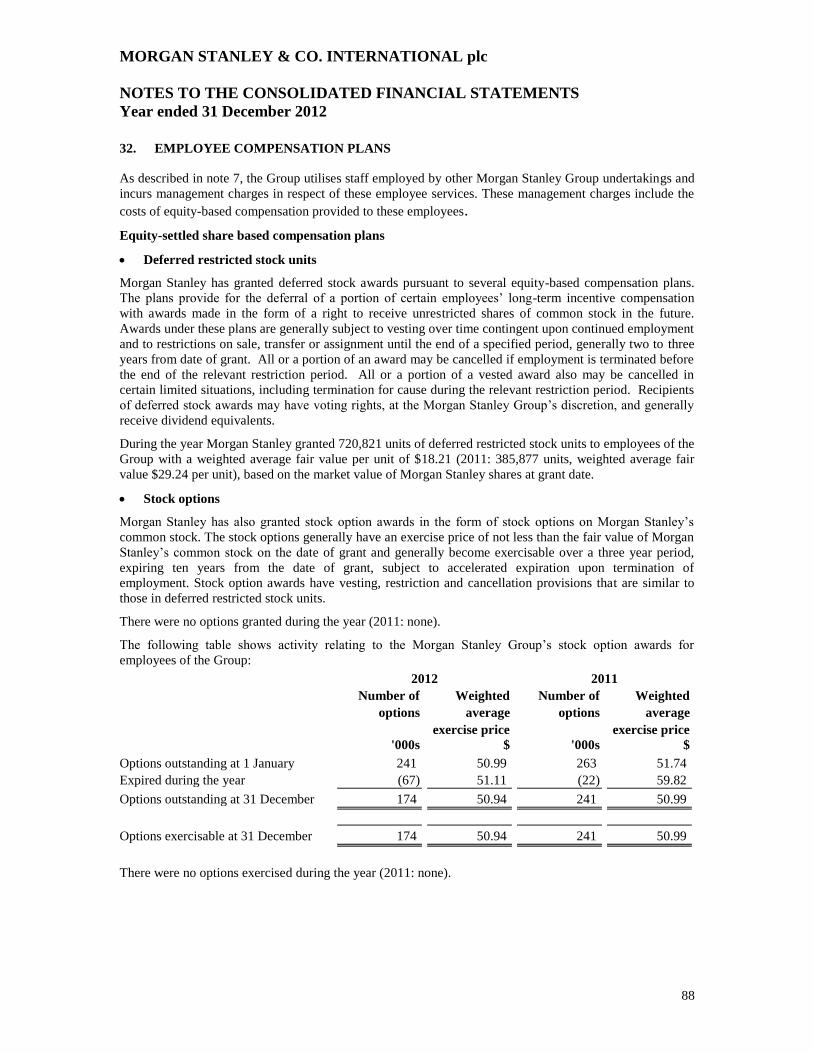
MORGAN STANLEY & CO. INTERNATIONAL plc
NOTES TO THE CONSOLIDATED FINANCIAL STATEMENTS
Year ended 31 December 2012
88
32. EMPLOYEE COMPENSATION PLANS
As described in note 7, the Group utilises staff employed by other Morgan Stanley Group undertakings and
incurs management charges in respect of these employee services. These management charges include the
costs of equity-based compensation provided to these employees.
Equity-settled share based compensation plans
Deferred restricted stock units
Morgan Stanley has granted deferred stock awards pursuant to several equity-based compensation plans.
The plans provide for the deferral of a portion of certain employees’ long-term incentive compensation
with awards made in the form of a right to receive unrestricted shares of common stock in the future.
Awards under these plans are generally subject to vesting over time contingent upon continued employment
and to restrictions on sale, transfer or assignment until the end of a specified period, generally two to three
years from date of grant. All or a portion of an award may be cancelled if employment is terminated before
the end of the relevant restriction period. All or a portion of a vested award also may be cancelled in
certain limited situations, including termination for cause during the relevant restriction period. Recipients
of deferred stock awards may have voting rights, at the Morgan Stanley Group’s discretion, and generally
receive dividend equivalents.
During the year Morgan Stanley granted 720,821 units of deferred restricted stock units to employees of the
Group with a weighted average fair value per unit of $18.21 (2011: 385,877 units, weighted average fair
value $29.24 per unit), based on the market value of Morgan Stanley shares at grant date.
Stock options
Morgan Stanley has also granted stock option awards in the form of stock options on Morgan Stanley’s
common stock. The stock options generally have an exercise price of not less than the fair value of Morgan
Stanley’s common stock on the date of grant and generally become exercisable over a three year period,
expiring ten years from the date of grant, subject to accelerated expiration upon termination of
employment. Stock option awards have vesting, restriction and cancellation provisions that are similar to
those in deferred restricted stock units.
There were no options granted during the year (2011: none).
The following table shows activity relating to the Morgan Stanley Group’s stock option awards for
employees of the Group:
2012 2011
Number of Weighted Number of Weighted
options average options average
exercise price exercise price
'000s $ '000s $
Options outstanding at 1 January 241 50.99 263 51.74
Expired during the year (67) 51.11 (22) 59.82
Options outstanding at 31 December 174 50.94 241 50.99
Options exercisable at 31 December 174 50.94 241 50.99
There were no options exercised during the year (2011: none).
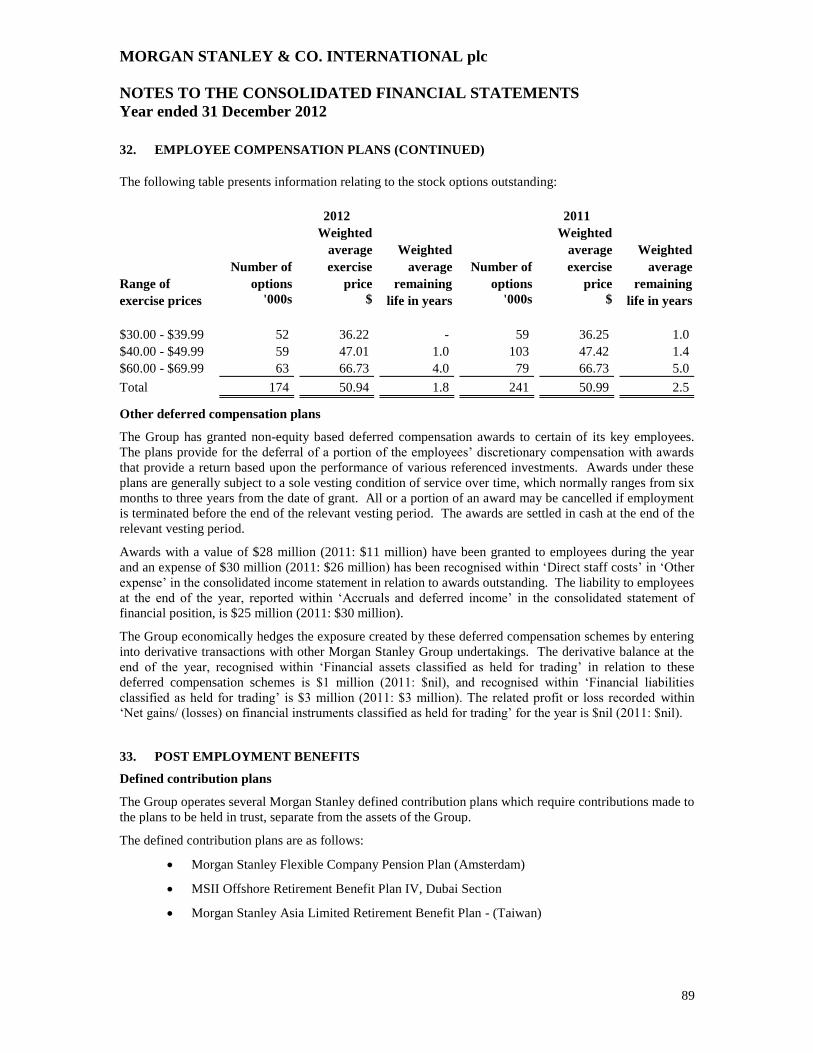
MORGAN STANLEY & CO. INTERNATIONAL plc
NOTES TO THE CONSOLIDATED FINANCIAL STATEMENTS
Year ended 31 December 2012
89
32. EMPLOYEE COMPENSATION PLANS (CONTINUED)
The following table presents information relating to the stock options outstanding:
2012 2011
Weighted Weighted
average Weighted average Weighted
Number of exercise average Number of exercise average
Range of options price remaining options price remaining
exercise prices '000s $ life in years '000s $ life in years
$30.00 - $39.99 52 36.22 - 59 36.25 1.0
$40.00 - $49.99 59 47.01 1.0 103 47.42 1.4
$60.00 - $69.99 63 66.73 4.0 79 66.73 5.0
Total 174 50.94 1.8 241 50.99 2.5
Other deferred compensation plans
The Group has granted non-equity based deferred compensation awards to certain of its key employees.
The plans provide for the deferral of a portion of the employees’ discretionary compensation with awards
that provide a return based upon the performance of various referenced investments. Awards under these
plans are generally subject to a sole vesting condition of service over time, which normally ranges from six
months to three years from the date of grant. All or a portion of an award may be cancelled if employment
is terminated before the end of the relevant vesting period. The awards are settled in cash at the end of the
relevant vesting period.
Awards with a value of $28 million (2011: $11 million) have been granted to employees during the year
and an expense of $30 million (2011: $26 million) has been recognised within ‘Direct staff costs’ in ‘Other
expense’ in the consolidated income statement in relation to awards outstanding. The liability to employees
at the end of the year, reported within ‘Accruals and deferred income’ in the consolidated statement of
financial position, is $25 million (2011: $30 million).
The Group economically hedges the exposure created by these deferred compensation schemes by entering
into derivative transactions with other Morgan Stanley Group undertakings. The derivative balance at the
end of the year, recognised within ‘Financial assets classified as held for trading’ in relation to these
deferred compensation schemes is $1 million (2011: $nil), and recognised within ‘Financial liabilities
classified as held for trading’ is $3 million (2011: $3 million). The related profit or loss recorded within
‘Net gains/ (losses) on financial instruments classified as held for trading’ for the year is $nil (2011: $nil).
33. POST EMPLOYMENT BENEFITS
Defined contribution plans
The Group operates several Morgan Stanley defined contribution plans which require contributions made to
the plans to be held in trust, separate from the assets of the Group.
The defined contribution plans are as follows:
Morgan Stanley Flexible Company Pension Plan (Amsterdam)
MSII Offshore Retirement Benefit Plan IV, Dubai Section
Morgan Stanley Asia Limited Retirement Benefit Plan - (Taiwan)
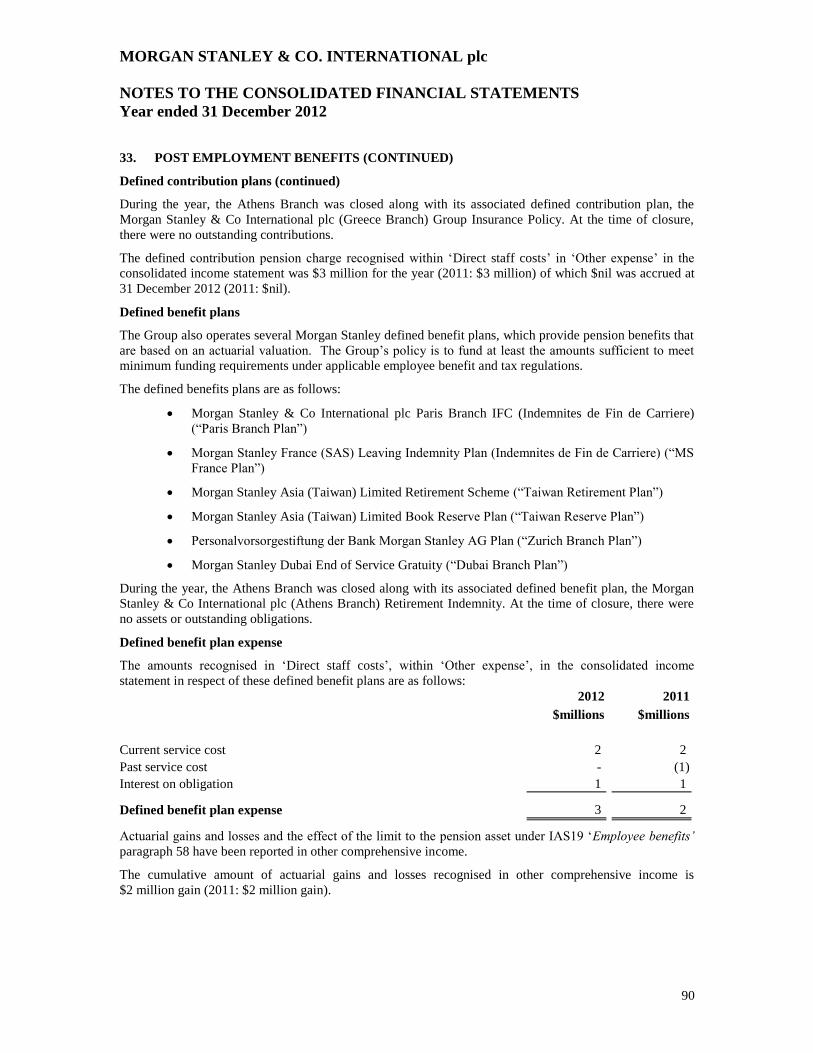
MORGAN STANLEY & CO. INTERNATIONAL plc
NOTES TO THE CONSOLIDATED FINANCIAL STATEMENTS
Year ended 31 December 2012
90
33. POST EMPLOYMENT BENEFITS (CONTINUED)
Defined contribution plans (continued)
During the year, the Athens Branch was closed along with its associated defined contribution plan, the
Morgan Stanley & Co International plc (Greece Branch) Group Insurance Policy. At the time of closure,
there were no outstanding contributions.
The defined contribution pension charge recognised within ‘Direct staff costs’ in ‘Other expense’ in the
consolidated income statement was $3 million for the year (2011: $3 million) of which $nil was accrued at
31 December 2012 (2011: $nil).
Defined benefit plans
The Group also operates several Morgan Stanley defined benefit plans, which provide pension benefits that
are based on an actuarial valuation. The Group’s policy is to fund at least the amounts sufficient to meet
minimum funding requirements under applicable employee benefit and tax regulations.
The defined benefits plans are as follows:
Morgan Stanley & Co International plc Paris Branch IFC (Indemnites de Fin de Carriere)
(“Paris Branch Plan”)
Morgan Stanley France (SAS) Leaving Indemnity Plan (Indemnites de Fin de Carriere) (“MS
France Plan”)
Morgan Stanley Asia (Taiwan) Limited Retirement Scheme (“Taiwan Retirement Plan”)
Morgan Stanley Asia (Taiwan) Limited Book Reserve Plan (“Taiwan Reserve Plan”)
Personalvorsorgestiftung der Bank Morgan Stanley AG Plan (“Zurich Branch Plan”)
Morgan Stanley Dubai End of Service Gratuity (“Dubai Branch Plan”)
During the year, the Athens Branch was closed along with its associated defined benefit plan, the Morgan
Stanley & Co International plc (Athens Branch) Retirement Indemnity. At the time of closure, there were
no assets or outstanding obligations.
Defined benefit plan expense
The amounts recognised in ‘Direct staff costs’, within ‘Other expense’, in the consolidated income
statement in respect of these defined benefit plans are as follows:
2012 2011
$millions $millions
Current service cost 2 2
Past service cost - (1)
Interest on obligation 1 1
Defined benefit plan expense 3 2
Actuarial gains and losses and the effect of the limit to the pension asset under IAS19 ‘Employee benefits’
paragraph 58 have been reported in other comprehensive income.
The cumulative amount of actuarial gains and losses recognised in other comprehensive income is
$2 million gain (2011: $2 million gain).
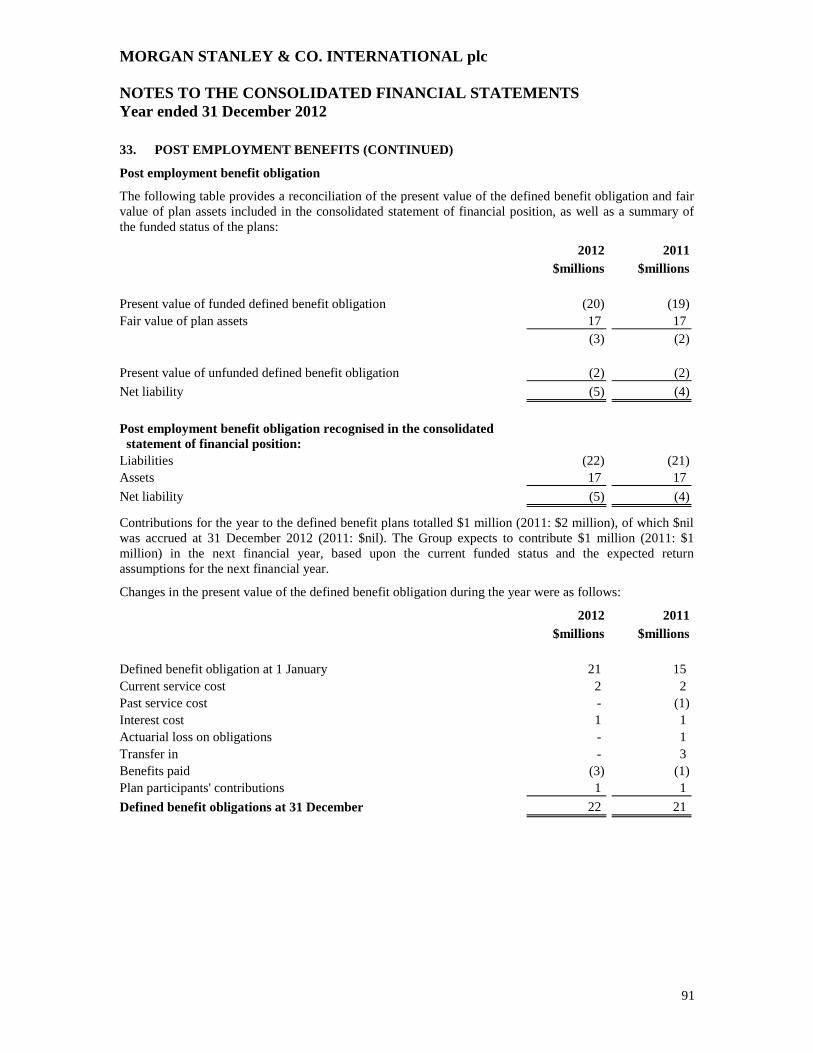
MORGAN STANLEY & CO. INTERNATIONAL plc
NOTES TO THE CONSOLIDATED FINANCIAL STATEMENTS
Year ended 31 December 2012
91
33. POST EMPLOYMENT BENEFITS (CONTINUED)
Post employment benefit obligation
The following table provides a reconciliation of the present value of the defined benefit obligation and fair
value of plan assets included in the consolidated statement of financial position, as well as a summary of
the funded status of the plans:
2012 2011
$millions $millions
Present value of funded defined benefit obligation (20) (19)
Fair value of plan assets 17 17
(3) (2)
Present value of unfunded defined benefit obligation (2) (2)
Net liability (5) (4)
Post employment benefit obligation recognised in the consolidated
statement of financial position:
Liabilities (22) (21)
Assets 17 17
Net liability (5) (4)
Contributions for the year to the defined benefit plans totalled $1 million (2011: $2 million), of which $nil
was accrued at 31 December 2012 (2011: $nil). The Group expects to contribute $1 million (2011: $1
million) in the next financial year, based upon the current funded status and the expected return
assumptions for the next financial year.
Changes in the present value of the defined benefit obligation during the year were as follows:
2012 2011
$millions $millions
Defined benefit obligation at 1 January 21 15
Current service cost 2 2
Past service cost - (1)
Interest cost 1 1
Actuarial loss on obligations - 1
Transfer in - 3
Benefits paid (3) (1)
Plan participants' contributions 1 1
Defined benefit obligations at 31 December 22 21
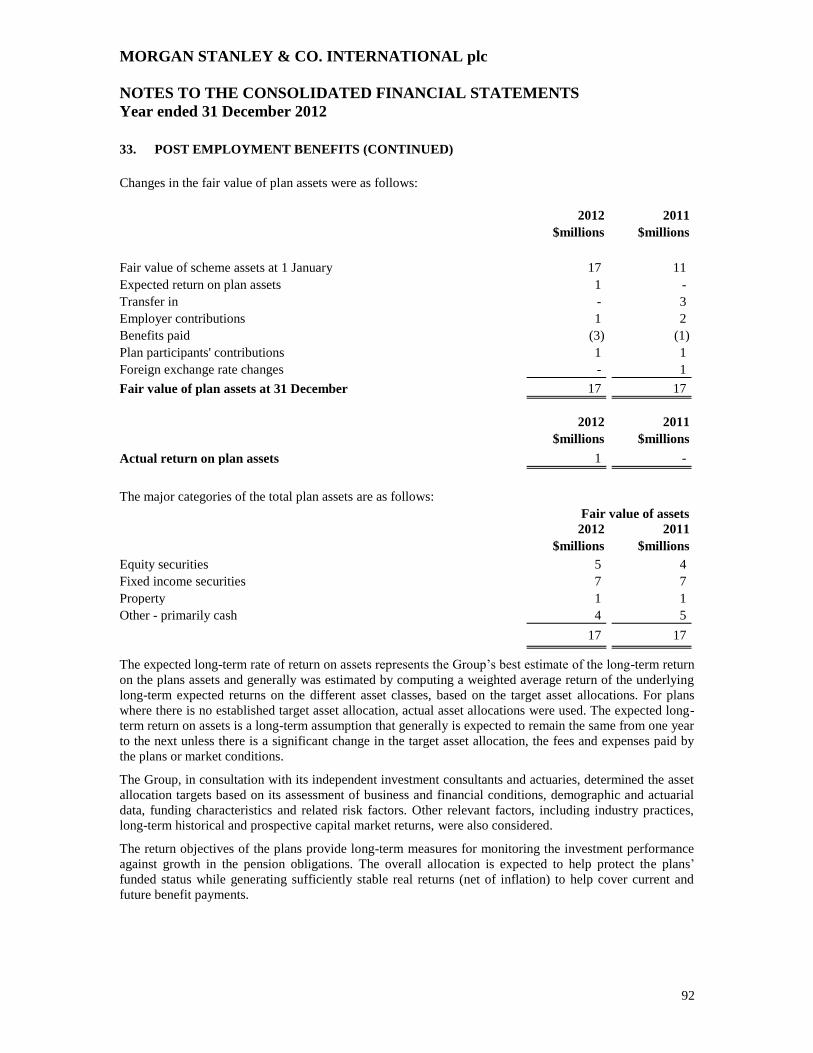
MORGAN STANLEY & CO. INTERNATIONAL plc
NOTES TO THE CONSOLIDATED FINANCIAL STATEMENTS
Year ended 31 December 2012
92
33. POST EMPLOYMENT BENEFITS (CONTINUED)
Changes in the fair value of plan assets were as follows:
2012 2011
$millions $millions
Fair value of scheme assets at 1 January 17 11
Expected return on plan assets 1 -
Transfer in - 3
Employer contributions 1 2
Benefits paid (3) (1)
Plan participants' contributions 1 1
Foreign exchange rate changes - 1
Fair value of plan assets at 31 December 17 17
2012 2011
$millions $millions
Actual return on plan assets 1 -
The major categories of the total plan assets are as follows: Fair value of assets
2012 2011
$millions $millions
Equity securities 5 4
Fixed income securities 7 7
Property 1 1
Other - primarily cash 4 5
17 17
The expected long-term rate of return on assets represents the Group’s best estimate of the long-term return
on the plans assets and generally was estimated by computing a weighted average return of the underlying
long-term expected returns on the different asset classes, based on the target asset allocations. For plans
where there is no established target asset allocation, actual asset allocations were used. The expected long-
term return on assets is a long-term assumption that generally is expected to remain the same from one year
to the next unless there is a significant change in the target asset allocation, the fees and expenses paid by
the plans or market conditions.
The Group, in consultation with its independent investment consultants and actuaries, determined the asset
allocation targets based on its assessment of business and financial conditions, demographic and actuarial
data, funding characteristics and related risk factors. Other relevant factors, including industry practices,
long-term historical and prospective capital market returns, were also considered.
The return objectives of the plans provide long-term measures for monitoring the investment performance
against growth in the pension obligations. The overall allocation is expected to help protect the plans’
funded status while generating sufficiently stable real returns (net of inflation) to help cover current and
future benefit payments.
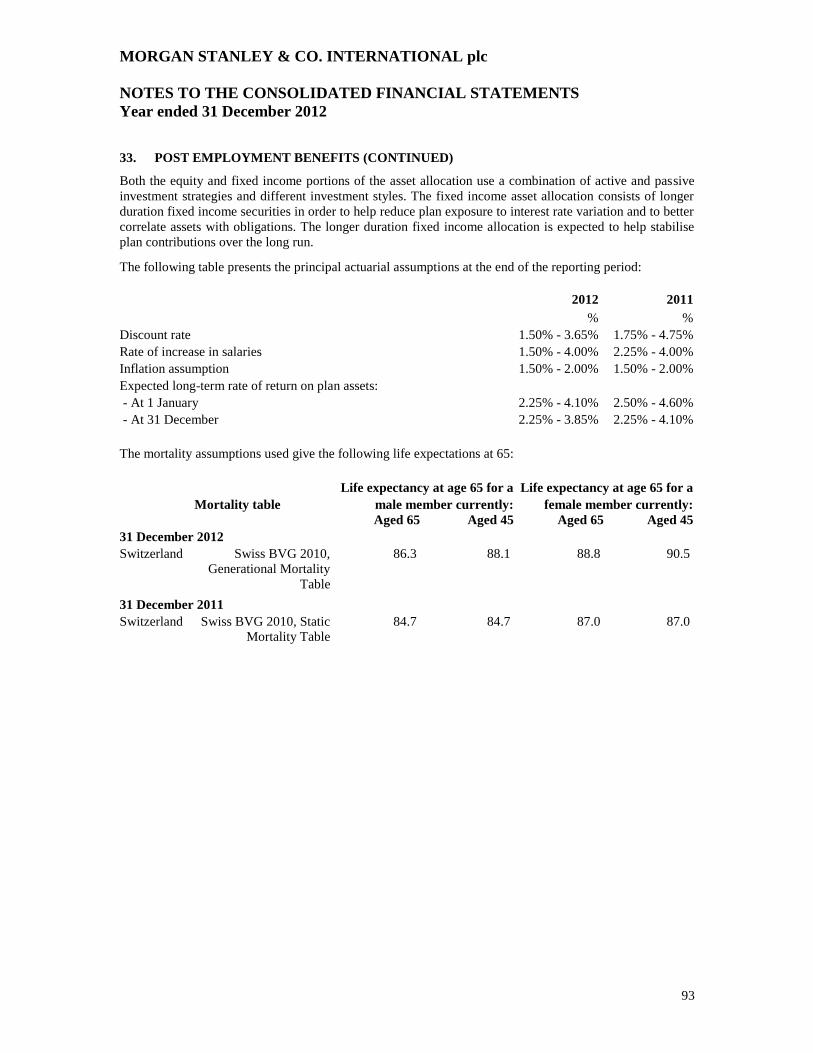
MORGAN STANLEY & CO. INTERNATIONAL plc
NOTES TO THE CONSOLIDATED FINANCIAL STATEMENTS
Year ended 31 December 2012
93
33. POST EMPLOYMENT BENEFITS (CONTINUED)
Both the equity and fixed income portions of the asset allocation use a combination of active and passive
investment strategies and different investment styles. The fixed income asset allocation consists of longer
duration fixed income securities in order to help reduce plan exposure to interest rate variation and to better
correlate assets with obligations. The longer duration fixed income allocation is expected to help stabilise
plan contributions over the long run.
The following table presents the principal actuarial assumptions at the end of the reporting period:
2012 2011
% %
Discount rate 1.50% - 3.65% 1.75% - 4.75%
Rate of increase in salaries 1.50% - 4.00% 2.25% - 4.00%
Inflation assumption 1.50% - 2.00% 1.50% - 2.00%
Expected long-term rate of return on plan assets:
- At 1 January 2.25% - 4.10% 2.50% - 4.60%
- At 31 December 2.25% - 3.85% 2.25% - 4.10%
The mortality assumptions used give the following life expectations at 65:
Life expectancy at age 65 for a Life expectancy at age 65 for a
Mortality table male member currently: female member currently:
Aged 65 Aged 45 Aged 65 Aged 45
31 December 2012
Switzerland Swiss BVG 2010,
Generational Mortality
Table
86.3 88.1 88.8 90.5
31 December 2011
Switzerland Swiss BVG 2010, Static
Mortality Table
84.7 84.7 87.0 87.0
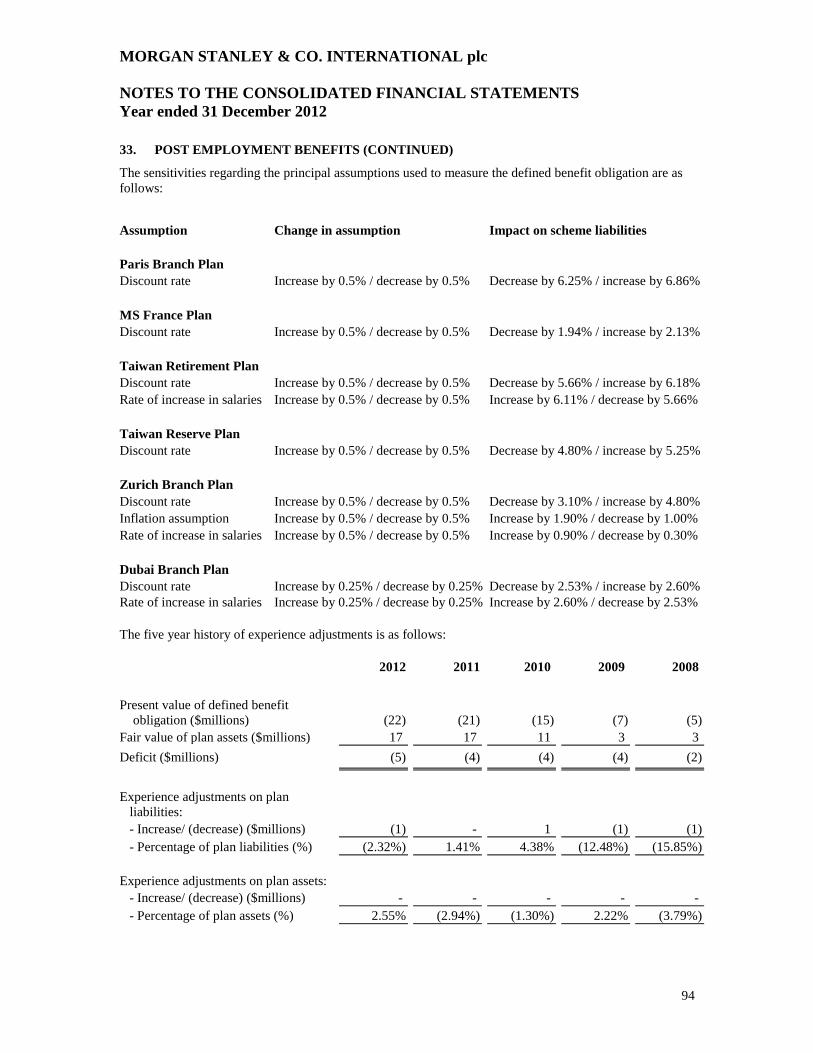
MORGAN STANLEY & CO. INTERNATIONAL plc
NOTES TO THE CONSOLIDATED FINANCIAL STATEMENTS
Year ended 31 December 2012
94
33. POST EMPLOYMENT BENEFITS (CONTINUED)
The sensitivities regarding the principal assumptions used to measure the defined benefit obligation are as
follows:
Assumption Change in assumption Impact on scheme liabilities
Paris Branch Plan
Discount rate Increase by 0.5% / decrease by 0.5% Decrease by 6.25% / increase by 6.86%
MS France Plan
Discount rate Increase by 0.5% / decrease by 0.5% Decrease by 1.94% / increase by 2.13%
Taiwan Retirement Plan
Discount rate Increase by 0.5% / decrease by 0.5% Decrease by 5.66% / increase by 6.18%
Rate of increase in salaries Increase by 0.5% / decrease by 0.5% Increase by 6.11% / decrease by 5.66%
Taiwan Reserve Plan
Discount rate Increase by 0.5% / decrease by 0.5% Decrease by 4.80% / increase by 5.25%
Zurich Branch Plan
Discount rate Increase by 0.5% / decrease by 0.5% Decrease by 3.10% / increase by 4.80%
Inflation assumption Increase by 0.5% / decrease by 0.5% Increase by 1.90% / decrease by 1.00%
Rate of increase in salaries Increase by 0.5% / decrease by 0.5% Increase by 0.90% / decrease by 0.30%
Dubai Branch Plan
Discount rate Increase by 0.25% / decrease by 0.25% Decrease by 2.53% / increase by 2.60%
Rate of increase in salaries Increase by 0.25% / decrease by 0.25% Increase by 2.60% / decrease by 2.53%
The five year history of experience adjustments is as follows:
2012 2011 2010 2009 2008
Present value of defined benefit
obligation ($millions) (22) (21) (15) (7) (5)
Fair value of plan assets ($millions) 17 17 11 3 3
Deficit ($millions) (5) (4) (4) (4) (2)
Experience adjustments on plan
liabilities:
- Increase/ (decrease) ($millions) (1) - 1 (1) (1)
- Percentage of plan liabilities (%) (2.32%) 1.41% 4.38% (12.48%) (15.85%)
Experience adjustments on plan assets:
- Increase/ (decrease) ($millions) - - - - -
- Percentage of plan assets (%) 2.55% (2.94%) (1.30%) 2.22% (3.79%)
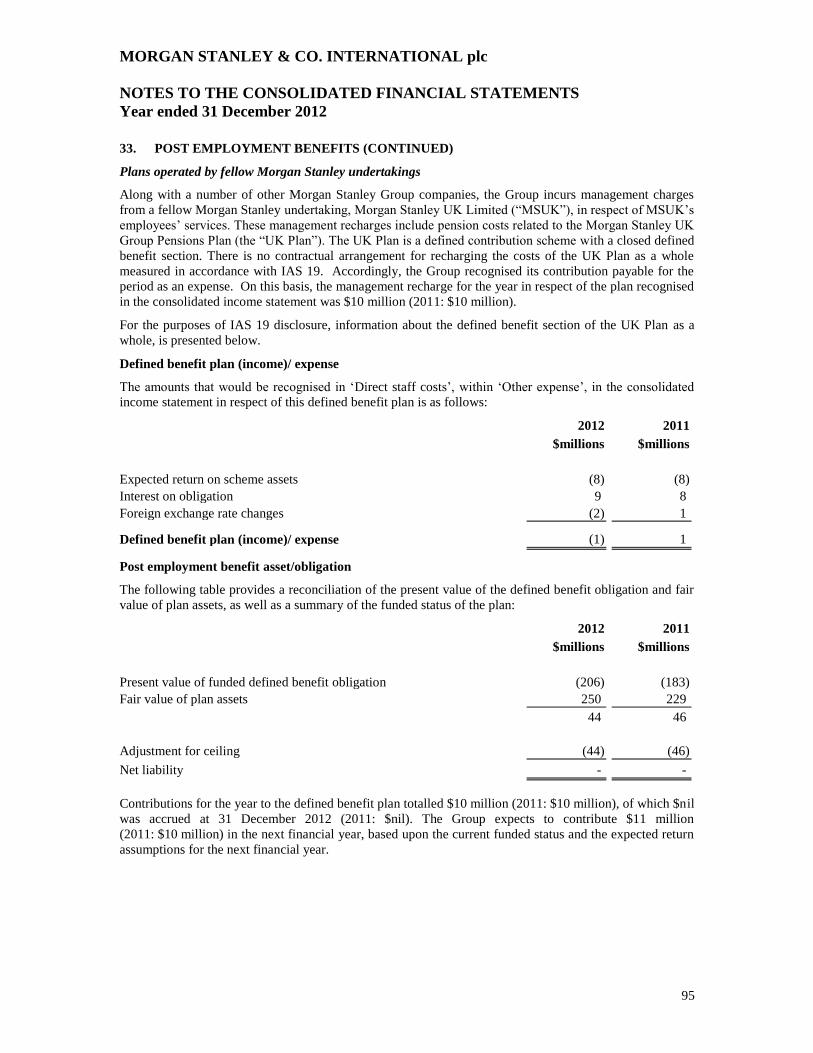
MORGAN STANLEY & CO. INTERNATIONAL plc
NOTES TO THE CONSOLIDATED FINANCIAL STATEMENTS
Year ended 31 December 2012
95
33. POST EMPLOYMENT BENEFITS (CONTINUED)
Plans operated by fellow Morgan Stanley undertakings
Along with a number of other Morgan Stanley Group companies, the Group incurs management charges
from a fellow Morgan Stanley undertaking, Morgan Stanley UK Limited (“MSUK”), in respect of MSUK’s
employees’ services. These management recharges include pension costs related to the Morgan Stanley UK
Group Pensions Plan (the “UK Plan”). The UK Plan is a defined contribution scheme with a closed defined
benefit section. There is no contractual arrangement for recharging the costs of the UK Plan as a whole
measured in accordance with IAS 19. Accordingly, the Group recognised its contribution payable for the
period as an expense. On this basis, the management recharge for the year in respect of the plan recognised
in the consolidated income statement was $10 million (2011: $10 million).
For the purposes of IAS 19 disclosure, information about the defined benefit section of the UK Plan as a
whole, is presented below.
Defined benefit plan (income)/ expense
The amounts that would be recognised in ‘Direct staff costs’, within ‘Other expense’, in the consolidated
income statement in respect of this defined benefit plan is as follows:
2012 2011
$millions $millions
Expected return on scheme assets (8) (8)
Interest on obligation 9 8
Foreign exchange rate changes (2) 1
Defined benefit plan (income)/ expense (1) 1
Post employment benefit asset/obligation
The following table provides a reconciliation of the present value of the defined benefit obligation and fair
value of plan assets, as well as a summary of the funded status of the plan:
2012 2011
$millions $millions
Present value of funded defined benefit obligation (206) (183)
Fair value of plan assets 250 229
44 46
Adjustment for ceiling (44) (46)
Net liability - -
Contributions for the year to the defined benefit plan totalled $10 million (2011: $10 million), of which $nil
was accrued at 31 December 2012 (2011: $nil). The Group expects to contribute $11 million
(2011: $10 million) in the next financial year, based upon the current funded status and the expected return
assumptions for the next financial year.
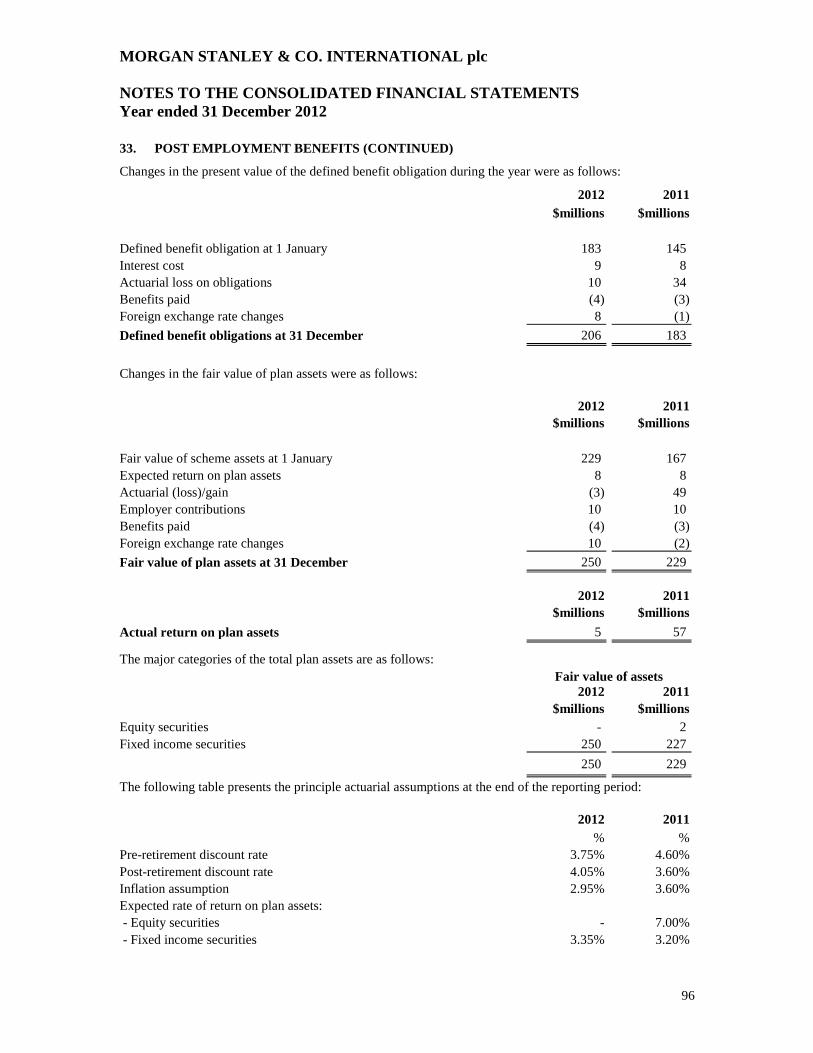
MORGAN STANLEY & CO. INTERNATIONAL plc
NOTES TO THE CONSOLIDATED FINANCIAL STATEMENTS
Year ended 31 December 2012
96
33. POST EMPLOYMENT BENEFITS (CONTINUED)
Changes in the present value of the defined benefit obligation during the year were as follows:
2012 2011
$millions $millions
Defined benefit obligation at 1 January 183 145
Interest cost 9 8
Actuarial loss on obligations 10 34
Benefits paid (4) (3)
Foreign exchange rate changes 8 (1)
Defined benefit obligations at 31 December 206 183
Changes in the fair value of plan assets were as follows:
2012 2011
$millions $millions
Fair value of scheme assets at 1 January 229 167
Expected return on plan assets 8 8
Actuarial (loss)/gain (3) 49
Employer contributions 10 10
Benefits paid (4) (3)
Foreign exchange rate changes 10 (2)
Fair value of plan assets at 31 December 250 229
2012 2011
$millions $millions
Actual return on plan assets 5 57
The major categories of the total plan assets are as follows: Fair value of assets
2012 2011
$millions $millions
Equity securities - 2
Fixed income securities 250 227
250 229
The following table presents the principle actuarial assumptions at the end of the reporting period:
2012 2011
% %
Pre-retirement discount rate 3.75% 4.60%
Post-retirement discount rate 4.05% 3.60%
Inflation assumption 2.95% 3.60%
Expected rate of return on plan assets:
- Equity securities - 7.00%
- Fixed income securities 3.35% 3.20%
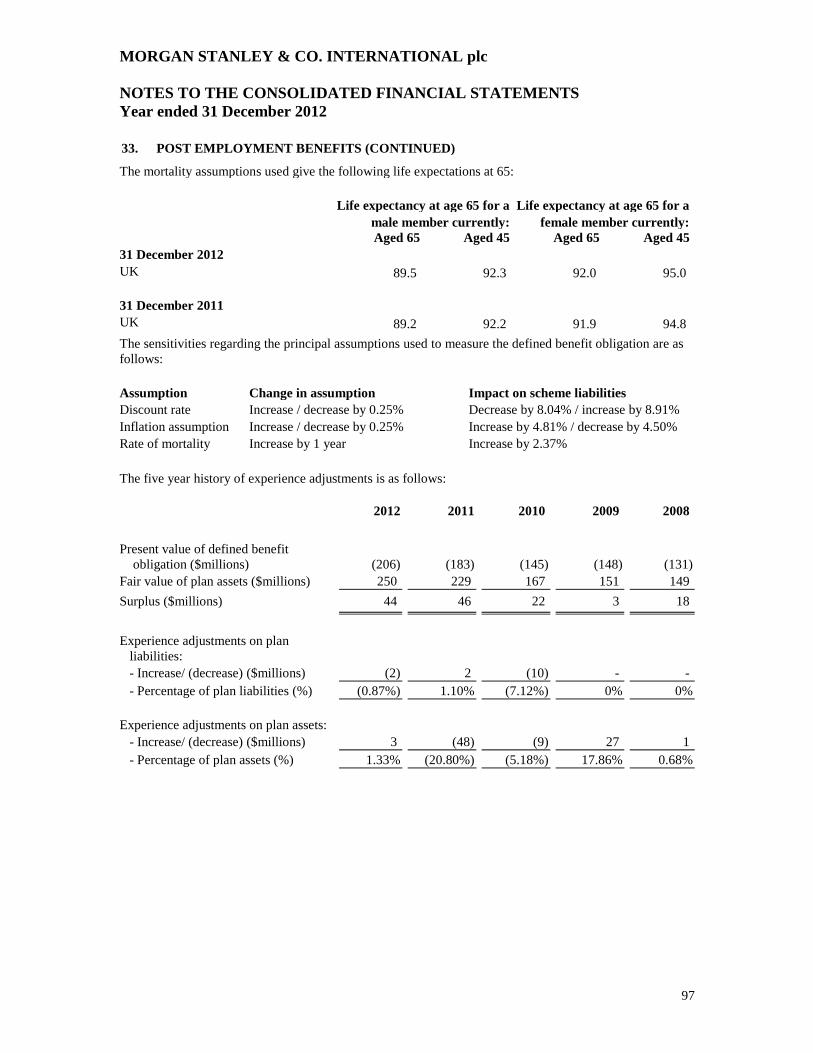
MORGAN STANLEY & CO. INTERNATIONAL plc
NOTES TO THE CONSOLIDATED FINANCIAL STATEMENTS
Year ended 31 December 2012
97
33. POST EMPLOYMENT BENEFITS (CONTINUED)
The mortality assumptions used give the following life expectations at 65:
Life expectancy at age 65 for a Life expectancy at age 65 for a
male member currently: female member currently:
Aged 65 Aged 45 Aged 65 Aged 45
31 December 2012
UK 89.5 92.3 92.0 95.0
31 December 2011
UK 89.2 92.2 91.9 94.8
The sensitivities regarding the principal assumptions used to measure the defined benefit obligation are as
follows:
Assumption Change in assumption Impact on scheme liabilities
Discount rate Increase / decrease by 0.25% Decrease by 8.04% / increase by 8.91%
Inflation assumption Increase / decrease by 0.25% Increase by 4.81% / decrease by 4.50%
Rate of mortality Increase by 1 year Increase by 2.37%
The five year history of experience adjustments is as follows:
2012 2011 2010 2009 2008
Present value of defined benefit
obligation ($millions) (206) (183) (145) (148) (131)
Fair value of plan assets ($millions) 250 229 167 151 149
Surplus ($millions) 44 46 22 3 18
Experience adjustments on plan
liabilities:
- Increase/ (decrease) ($millions) (2) 2 (10) - -
- Percentage of plan liabilities (%) (0.87%) 1.10% (7.12%) 0% 0%
Experience adjustments on plan assets:
- Increase/ (decrease) ($millions) 3 (48) (9) 27 1
- Percentage of plan assets (%) 1.33% (20.80%) (5.18%) 17.86% 0.68%
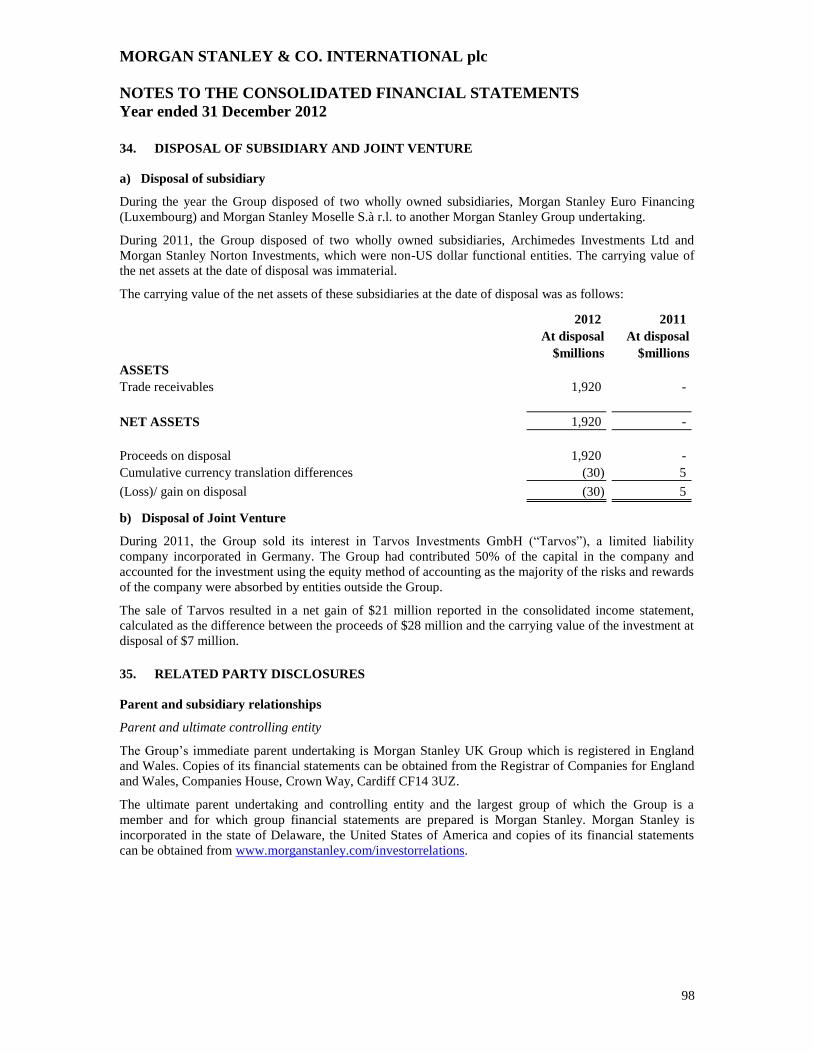
MORGAN STANLEY & CO. INTERNATIONAL plc
NOTES TO THE CONSOLIDATED FINANCIAL STATEMENTS
Year ended 31 December 2012
98
34. DISPOSAL OF SUBSIDIARY AND JOINT VENTURE
a) Disposal of subsidiary
During the year the Group disposed of two wholly owned subsidiaries, Morgan Stanley Euro Financing
(Luxembourg) and Morgan Stanley Moselle S.à r.l. to another Morgan Stanley Group undertaking.
During 2011, the Group disposed of two wholly owned subsidiaries, Archimedes Investments Ltd and
Morgan Stanley Norton Investments, which were non-US dollar functional entities. The carrying value of
the net assets at the date of disposal was immaterial.
The carrying value of the net assets of these subsidiaries at the date of disposal was as follows:
2012 2011
At disposal At disposal
$millions $millions
ASSETS
Trade receivables 1,920 -
NET ASSETS 1,920 -
Proceeds on disposal 1,920 -
Cumulative currency translation differences (30) 5
(Loss)/ gain on disposal (30) 5
b) Disposal of Joint Venture
During 2011, the Group sold its interest in Tarvos Investments GmbH (“Tarvos”), a limited liability
company incorporated in Germany. The Group had contributed 50% of the capital in the company and
accounted for the investment using the equity method of accounting as the majority of the risks and rewards
of the company were absorbed by entities outside the Group.
The sale of Tarvos resulted in a net gain of $21 million reported in the consolidated income statement,
calculated as the difference between the proceeds of $28 million and the carrying value of the investment at
disposal of $7 million.
35. RELATED PARTY DISCLOSURES
Parent and subsidiary relationships
Parent and ultimate controlling entity
The Group’s immediate parent undertaking is Morgan Stanley UK Group which is registered in England
and Wales. Copies of its financial statements can be obtained from the Registrar of Companies for England
and Wales, Companies House, Crown Way, Cardiff CF14 3UZ.
The ultimate parent undertaking and controlling entity and the largest group of which the Group is a
member and for which group financial statements are prepared is Morgan Stanley. Morgan Stanley is
incorporated in the state of Delaware, the United States of America and copies of its financial statements
can be obtained from www.morganstanley.com/investorrelations.
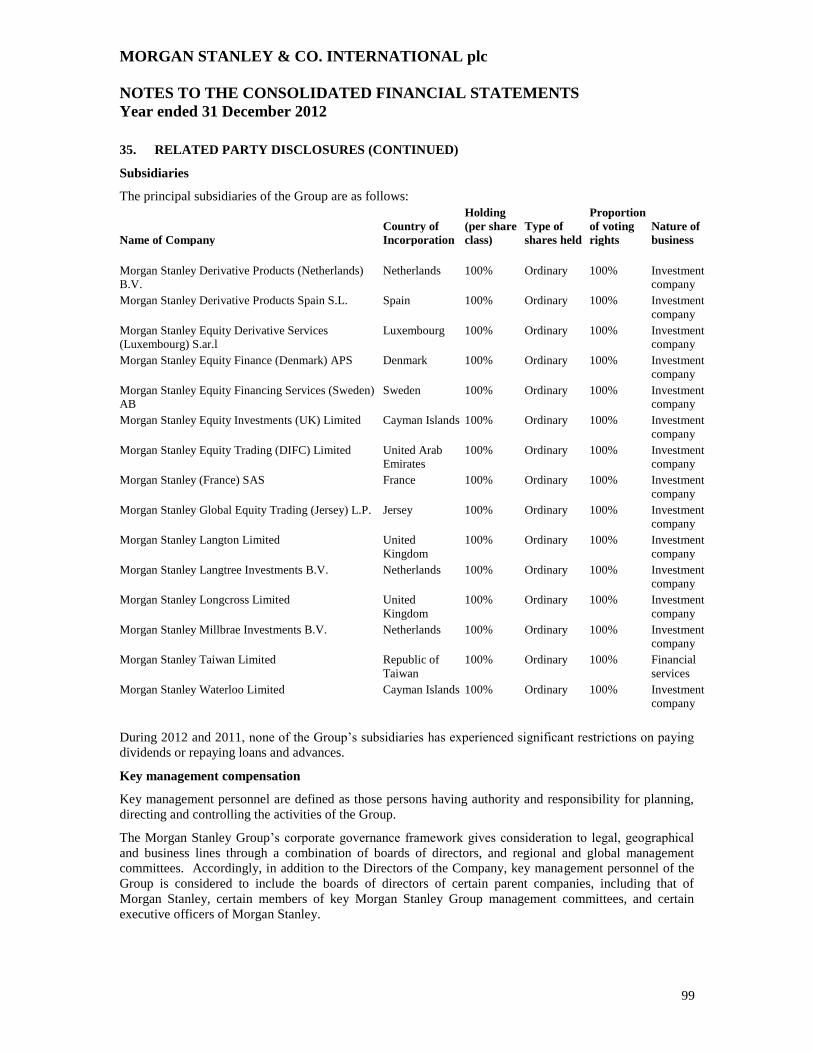
MORGAN STANLEY & CO. INTERNATIONAL plc
NOTES TO THE CONSOLIDATED FINANCIAL STATEMENTS
Year ended 31 December 2012
99
35. RELATED PARTY DISCLOSURES (CONTINUED)
Subsidiaries
The principal subsidiaries of the Group are as follows:
Name of Company
Country of
Incorporation
Holding
(per share
class)
Type of
shares held
Proportion
of voting
rights
Nature of
business
Morgan Stanley Derivative Products (Netherlands)
B.V.
Netherlands 100% Ordinary 100% Investment
company
Morgan Stanley Derivative Products Spain S.L. Spain 100% Ordinary 100% Investment
company
Morgan Stanley Equity Derivative Services
(Luxembourg) S.ar.l
Luxembourg 100% Ordinary 100% Investment
company
Morgan Stanley Equity Finance (Denmark) APS Denmark 100% Ordinary 100% Investment
company
Morgan Stanley Equity Financing Services (Sweden)
AB
Sweden 100% Ordinary 100% Investment
company
Morgan Stanley Equity Investments (UK) Limited Cayman Islands 100% Ordinary 100% Investment
company
Morgan Stanley Equity Trading (DIFC) Limited United Arab
Emirates
100% Ordinary 100% Investment
company
Morgan Stanley (France) SAS France 100% Ordinary 100% Investment
company
Morgan Stanley Global Equity Trading (Jersey) L.P. Jersey 100% Ordinary 100% Investment
company
Morgan Stanley Langton Limited United
Kingdom
100% Ordinary 100% Investment
company
Morgan Stanley Langtree Investments B.V. Netherlands 100% Ordinary 100% Investment
company
Morgan Stanley Longcross Limited United
Kingdom
100% Ordinary 100% Investment
company
Morgan Stanley Millbrae Investments B.V. Netherlands 100% Ordinary 100% Investment
company
Morgan Stanley Taiwan Limited Republic of
Taiwan
100% Ordinary 100% Financial
services
Morgan Stanley Waterloo Limited Cayman Islands 100% Ordinary 100% Investment
company
During 2012 and 2011, none of the Group’s subsidiaries has experienced significant restrictions on paying
dividends or repaying loans and advances.
Key management compensation
Key management personnel are defined as those persons having authority and responsibility for planning,
directing and controlling the activities of the Group.
The Morgan Stanley Group’s corporate governance framework gives consideration to legal, geographical
and business lines through a combination of boards of directors, and regional and global management
committees. Accordingly, in addition to the Directors of the Company, key management personnel of the
Group is considered to include the boards of directors of certain parent companies, including that of
Morgan Stanley, certain members of key Morgan Stanley Group management committees, and certain
executive officers of Morgan Stanley.
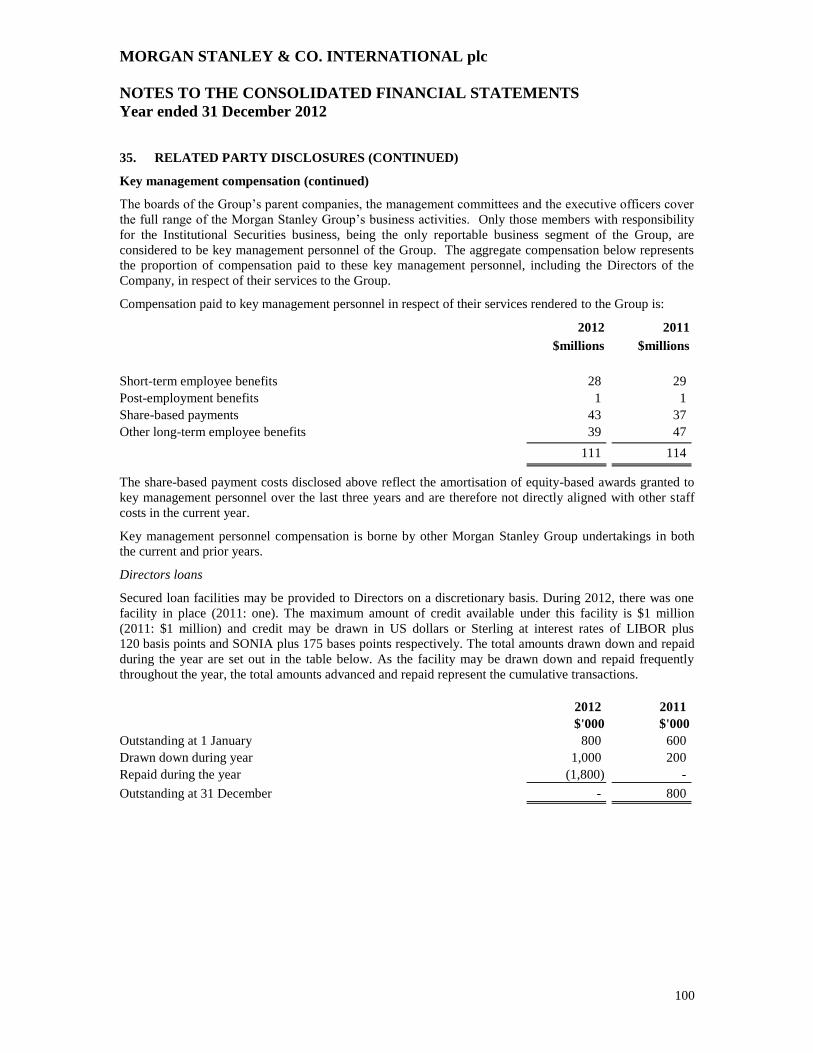
MORGAN STANLEY & CO. INTERNATIONAL plc
NOTES TO THE CONSOLIDATED FINANCIAL STATEMENTS
Year ended 31 December 2012
100
35. RELATED PARTY DISCLOSURES (CONTINUED)
Key management compensation (continued)
The boards of the Group’s parent companies, the management committees and the executive officers cover
the full range of the Morgan Stanley Group’s business activities. Only those members with responsibility
for the Institutional Securities business, being the only reportable business segment of the Group, are
considered to be key management personnel of the Group. The aggregate compensation below represents
the proportion of compensation paid to these key management personnel, including the Directors of the
Company, in respect of their services to the Group.
Compensation paid to key management personnel in respect of their services rendered to the Group is:
2012 2011
$millions $millions
Short-term employee benefits 28 29
Post-employment benefits 1 1
Share-based payments 43 37
Other long-term employee benefits 39 47
111 114
The share-based payment costs disclosed above reflect the amortisation of equity-based awards granted to
key management personnel over the last three years and are therefore not directly aligned with other staff
costs in the current year.
Key management personnel compensation is borne by other Morgan Stanley Group undertakings in both
the current and prior years.
Directors loans
Secured loan facilities may be provided to Directors on a discretionary basis. During 2012, there was one
facility in place (2011: one). The maximum amount of credit available under this facility is $1 million
(2011: $1 million) and credit may be drawn in US dollars or Sterling at interest rates of LIBOR plus
120 basis points and SONIA plus 175 bases points respectively. The total amounts drawn down and repaid
during the year are set out in the table below. As the facility may be drawn down and repaid frequently
throughout the year, the total amounts advanced and repaid represent the cumulative transactions.
2012 2011
$'000 $'000
Outstanding at 1 January 800 600
Drawn down during year 1,000 200
Repaid during the year (1,800) -
Outstanding at 31 December - 800
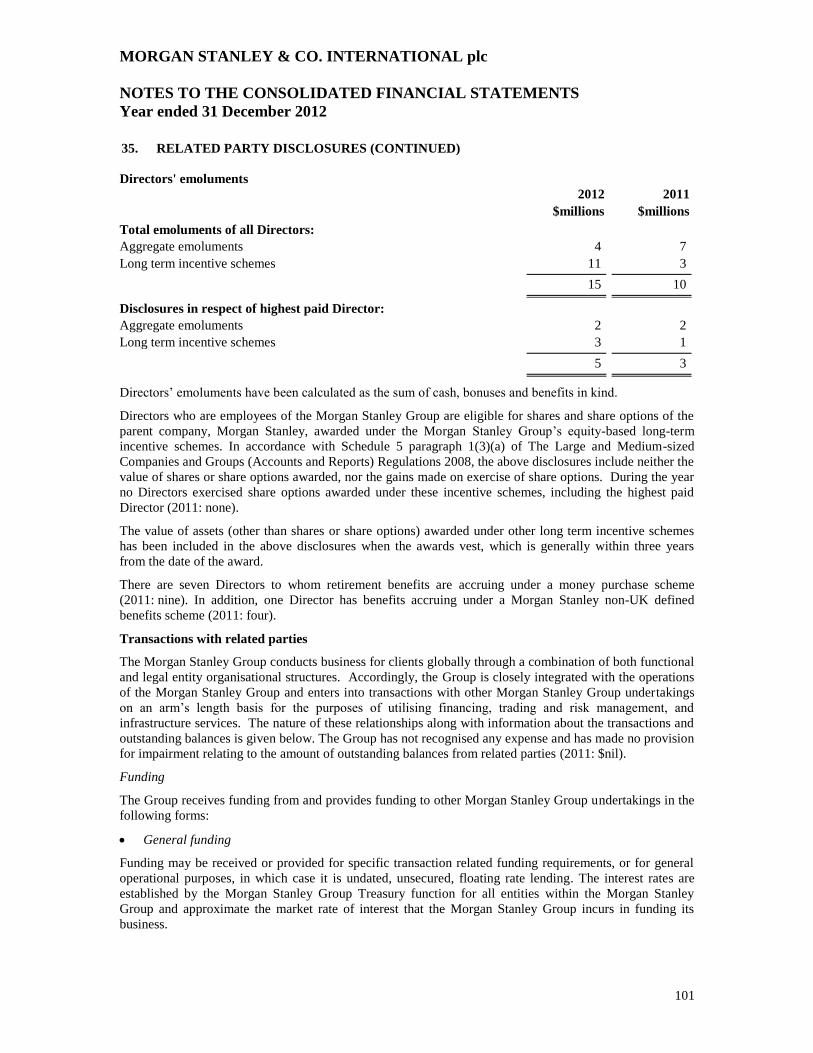
MORGAN STANLEY & CO. INTERNATIONAL plc
NOTES TO THE CONSOLIDATED FINANCIAL STATEMENTS
Year ended 31 December 2012
101
35. RELATED PARTY DISCLOSURES (CONTINUED)
Directors' emoluments
2012 2011
$millions $millions
Total emoluments of all Directors:
Aggregate emoluments 4 7
Long term incentive schemes 11 3
15 10
Disclosures in respect of highest paid Director:
Aggregate emoluments 2 2
Long term incentive schemes 3 1
5 3
Directors’ emoluments have been calculated as the sum of cash, bonuses and benefits in kind.
Directors who are employees of the Morgan Stanley Group are eligible for shares and share options of the
parent company, Morgan Stanley, awarded under the Morgan Stanley Group’s equity-based long-term
incentive schemes. In accordance with Schedule 5 paragraph 1(3)(a) of The Large and Medium-sized
Companies and Groups (Accounts and Reports) Regulations 2008, the above disclosures include neither the
value of shares or share options awarded, nor the gains made on exercise of share options. During the year
no Directors exercised share options awarded under these incentive schemes, including the highest paid
Director (2011: none).
The value of assets (other than shares or share options) awarded under other long term incentive schemes
has been included in the above disclosures when the awards vest, which is generally within three years
from the date of the award.
There are seven Directors to whom retirement benefits are accruing under a money purchase scheme
(2011: nine). In addition, one Director has benefits accruing under a Morgan Stanley non-UK defined
benefits scheme (2011: four).
Transactions with related parties
The Morgan Stanley Group conducts business for clients globally through a combination of both functional
and legal entity organisational structures. Accordingly, the Group is closely integrated with the operations
of the Morgan Stanley Group and enters into transactions with other Morgan Stanley Group undertakings
on an arm’s length basis for the purposes of utilising financing, trading and risk management, and
infrastructure services. The nature of these relationships along with information about the transactions and
outstanding balances is given below. The Group has not recognised any expense and has made no provision
for impairment relating to the amount of outstanding balances from related parties (2011: $nil).
Funding
The Group receives funding from and provides funding to other Morgan Stanley Group undertakings in the
following forms:
General funding
Funding may be received or provided for specific transaction related funding requirements, or for general
operational purposes, in which case it is undated, unsecured, floating rate lending. The interest rates are
established by the Morgan Stanley Group Treasury function for all entities within the Morgan Stanley
Group and approximate the market rate of interest that the Morgan Stanley Group incurs in funding its
business.
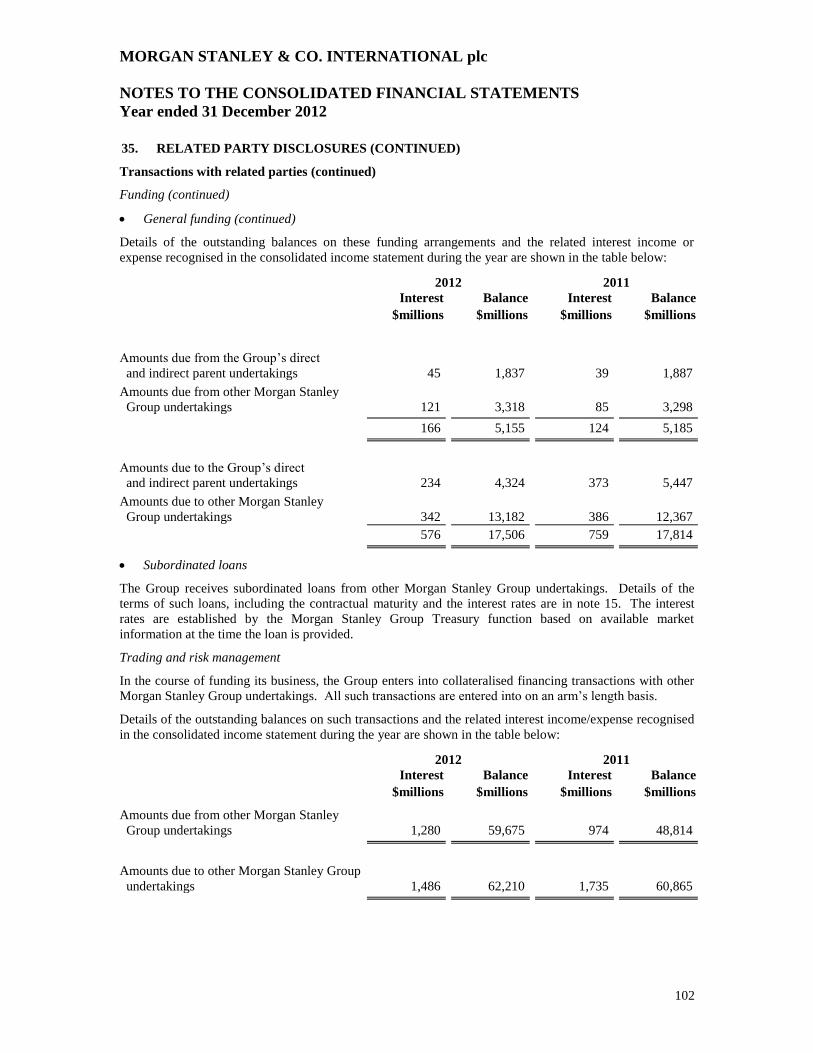
MORGAN STANLEY & CO. INTERNATIONAL plc
NOTES TO THE CONSOLIDATED FINANCIAL STATEMENTS
Year ended 31 December 2012
102
35. RELATED PARTY DISCLOSURES (CONTINUED)
Transactions with related parties (continued)
Funding (continued)
General funding (continued)
Details of the outstanding balances on these funding arrangements and the related interest income or
expense recognised in the consolidated income statement during the year are shown in the table below:
2012 2011
Interest Balance Interest Balance
$millions $millions $millions $millions
Amounts due from the Group’s direct
and indirect parent undertakings 45 1,837 39 1,887
Amounts due from other Morgan Stanley
Group undertakings 121 3,318 85 3,298
166 5,155 124 5,185
Amounts due to the Group’s direct
and indirect parent undertakings 234 4,324 373 5,447
Amounts due to other Morgan Stanley
Group undertakings 342 13,182 386 12,367
576 17,506 759 17,814
Subordinated loans
The Group receives subordinated loans from other Morgan Stanley Group undertakings. Details of the
terms of such loans, including the contractual maturity and the interest rates are in note 15. The interest
rates are established by the Morgan Stanley Group Treasury function based on available market
information at the time the loan is provided.
Trading and risk management
In the course of funding its business, the Group enters into collateralised financing transactions with other
Morgan Stanley Group undertakings. All such transactions are entered into on an arm’s length basis.
Details of the outstanding balances on such transactions and the related interest income/expense recognised
in the consolidated income statement during the year are shown in the table below:
2012 2011
Interest Balance Interest Balance
$millions $millions $millions $millions
Amounts due from other Morgan Stanley
Group undertakings 1,280 59,675 974 48,814
Amounts due to other Morgan Stanley Group
undertakings 1,486 62,210 1,735 60,865
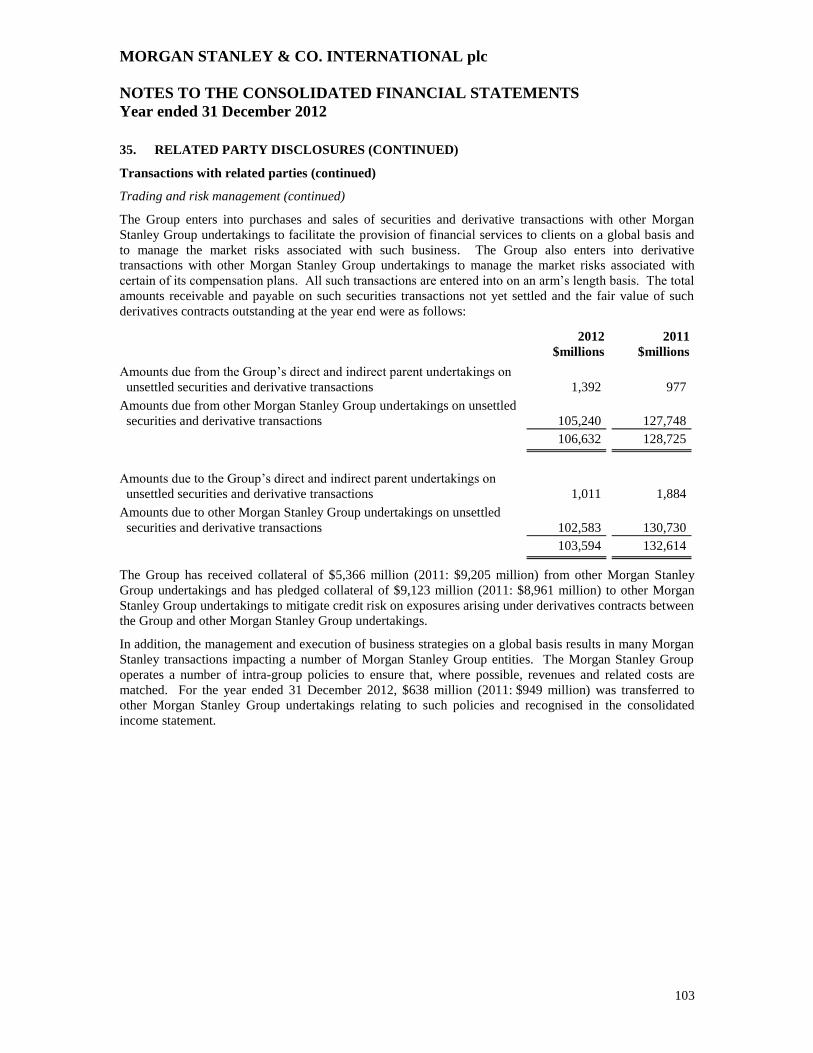
MORGAN STANLEY & CO. INTERNATIONAL plc
NOTES TO THE CONSOLIDATED FINANCIAL STATEMENTS
Year ended 31 December 2012
103
35. RELATED PARTY DISCLOSURES (CONTINUED)
Transactions with related parties (continued)
Trading and risk management (continued)
The Group enters into purchases and sales of securities and derivative transactions with other Morgan
Stanley Group undertakings to facilitate the provision of financial services to clients on a global basis and
to manage the market risks associated with such business. The Group also enters into derivative
transactions with other Morgan Stanley Group undertakings to manage the market risks associated with
certain of its compensation plans. All such transactions are entered into on an arm’s length basis. The total
amounts receivable and payable on such securities transactions not yet settled and the fair value of such
derivatives contracts outstanding at the year end were as follows:
2012 2011
$millions $millions
Amounts due from the Group’s direct and indirect parent undertakings on
unsettled securities and derivative transactions 1,392 977
Amounts due from other Morgan Stanley Group undertakings on unsettled
securities and derivative transactions 105,240 127,748
106,632 128,725
Amounts due to the Group’s direct and indirect parent undertakings on
unsettled securities and derivative transactions 1,011 1,884
Amounts due to other Morgan Stanley Group undertakings on unsettled
securities and derivative transactions 102,583 130,730
103,594 132,614
The Group has received collateral of $5,366 million (2011: $9,205 million) from other Morgan Stanley
Group undertakings and has pledged collateral of $9,123 million (2011: $8,961 million) to other Morgan
Stanley Group undertakings to mitigate credit risk on exposures arising under derivatives contracts between
the Group and other Morgan Stanley Group undertakings.
In addition, the management and execution of business strategies on a global basis results in many Morgan
Stanley transactions impacting a number of Morgan Stanley Group entities. The Morgan Stanley Group
operates a number of intra-group policies to ensure that, where possible, revenues and related costs are
matched. For the year ended 31 December 2012, $638 million (2011: $949 million) was transferred to
other Morgan Stanley Group undertakings relating to such policies and recognised in the consolidated
income statement.
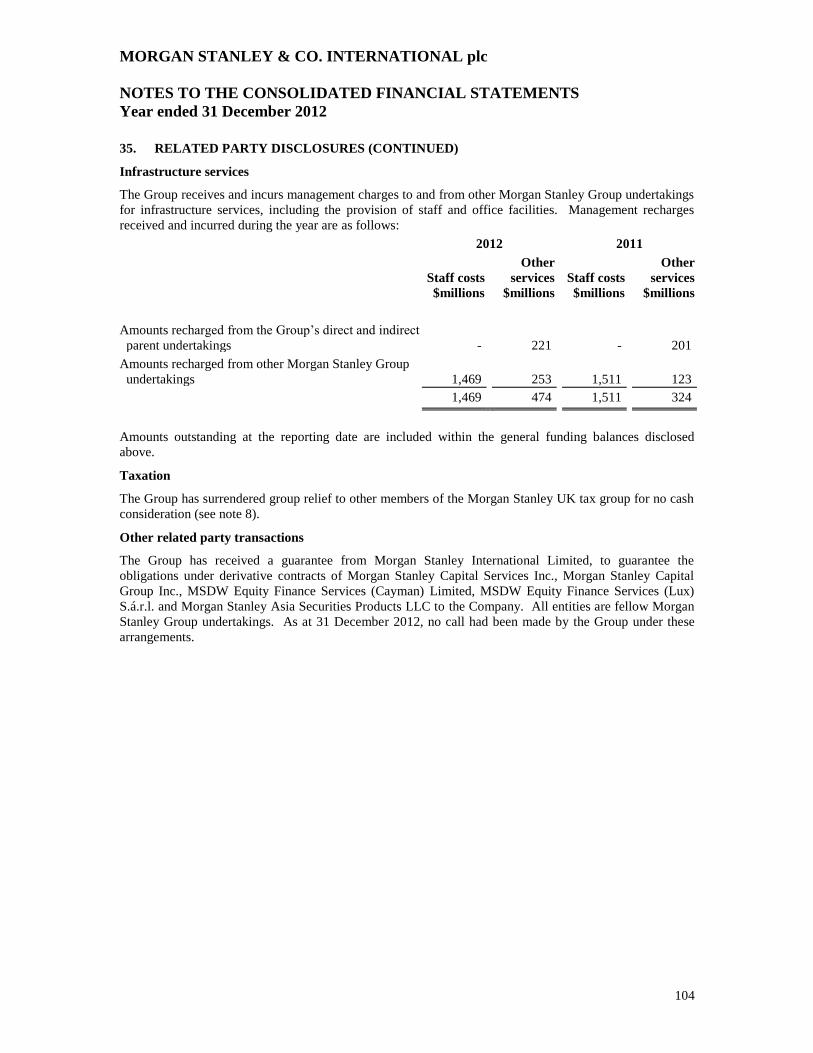
MORGAN STANLEY & CO. INTERNATIONAL plc
NOTES TO THE CONSOLIDATED FINANCIAL STATEMENTS
Year ended 31 December 2012
104
35. RELATED PARTY DISCLOSURES (CONTINUED)
Infrastructure services
The Group receives and incurs management charges to and from other Morgan Stanley Group undertakings
for infrastructure services, including the provision of staff and office facilities. Management recharges
received and incurred during the year are as follows: 2012 2011
Staff costs
Other
services Staff costs
Other
services
$millions $millions $millions $millions
Amounts recharged from the Group’s direct and indirect
parent undertakings - 221 - 201
Amounts recharged from other Morgan Stanley Group
undertakings 1,469 253 1,511 123
1,469 474 1,511 324
Amounts outstanding at the reporting date are included within the general funding balances disclosed
above.
Taxation
The Group has surrendered group relief to other members of the Morgan Stanley UK tax group for no cash
consideration (see note 8).
Other related party transactions
The Group has received a guarantee from Morgan Stanley International Limited, to guarantee the
obligations under derivative contracts of Morgan Stanley Capital Services Inc., Morgan Stanley Capital
Group Inc., MSDW Equity Finance Services (Cayman) Limited, MSDW Equity Finance Services (Lux)
S.á.r.l. and Morgan Stanley Asia Securities Products LLC to the Company. All entities are fellow Morgan
Stanley Group undertakings. As at 31 December 2012, no call had been made by the Group under these
arrangements.
MORGAN STANLEY & CO. INTERNATIONAL plc
NOTES TO THE CONSOLIDATED FINANCIAL STATEMENTS
Year ended 31 December 2012
105
36. EVENTS AFTER THE REPORTING PERIOD
Contribution of business from Morgan Stanley & Co. Limited
On 1 January 2013, the financial advisory business conducted by another Morgan Stanley Group
undertaking, Morgan Stanley & Co. Limited, was contributed to the Company. This new business is not
expected to have a significant impact on the Group’s results.
FSA Core Group
In accordance with the FSA’s Core Group regulations, on 27 March 2013, the Company entered into a
Deed of Agreement ("the agreement") whereby certain other Morgan Stanley Group undertakings, known
collectively as the Contributing Entities, undertook to provide additional capital resources to the Company
and certain other Morgan Stanley Group undertakings registered with the FSA (collectively the ‘Authorised
Firms’) if required in compliance with the regulatory requirements applicable to the members of a core UK
group.
In the event that the capital resources of the Company were to fall below its capital requirements as
determined by the FSA, the agreement gives the Company the unilateral right to demand a contribution of
capital resources from the Contributing Entities, in order to meet its capital requirements.
The amount of the contribution is limited to the Contributing Entities’ surplus capital, to the extent that
such capital is not required to repay that company’s liabilities, as defined in the agreement. The capital
resources may be provided in the form of a subscription and payment for shares or other capital
instruments; to the extent legally permissible through payment of dividends or other distributions of capital
resources or through such other legally permissible means as may be determined to be appropriate.
Entering into the agreement did not result in any adjustments to the Group’s consolidated statement of
financial position at 31 December 2012. The agreement will remain in force while the Company is an
Authorised Firm in Morgan Stanley's UK core group, as determined for regulatory purposes, subject to
earlier termination in certain circumstances.
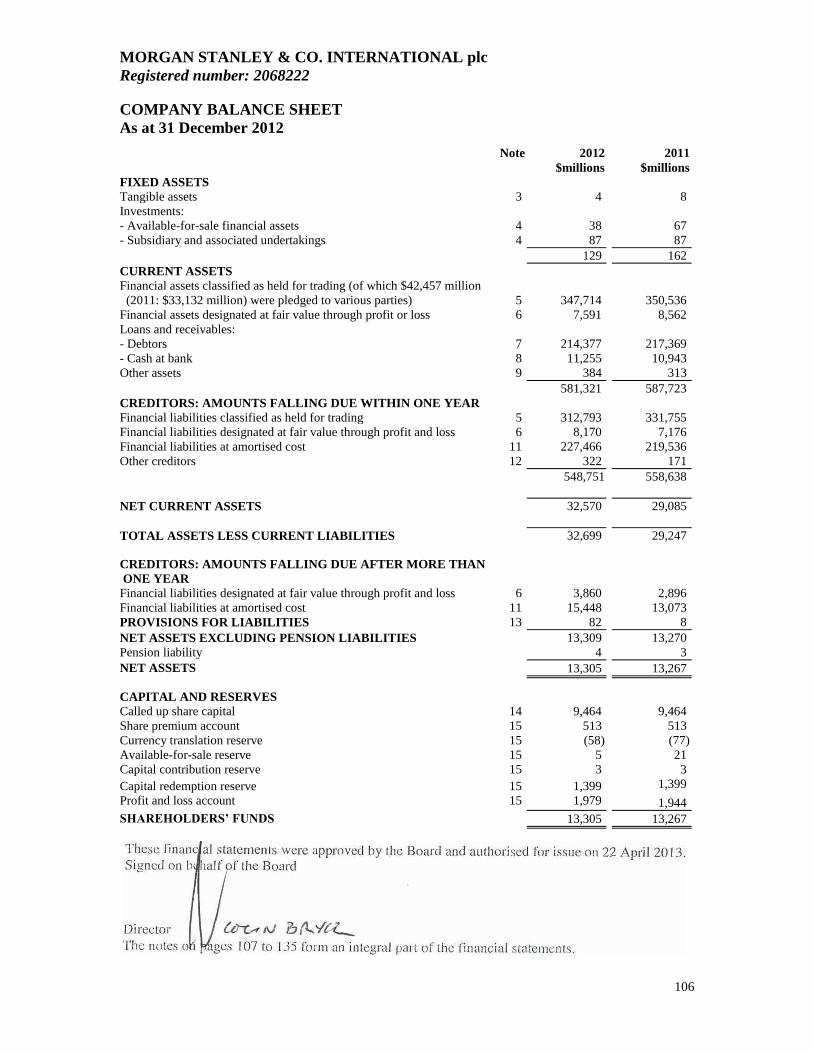
MORGAN STANLEY & CO. INTERNATIONAL plc
Registered number: 2068222
COMPANY BALANCE SHEET
As at 31 December 2012
106
Note 2012 2011
$millions $millions
FIXED ASSETS
Tangible assets 3 4 8
Investments:
- Available-for-sale financial assets 4 38 67
- Subsidiary and associated undertakings 4 87 87
129 162
CURRENT ASSETS
Financial assets classified as held for trading (of which $42,457 million
(2011: $33,132 million) were pledged to various parties) 5 347,714 350,536
Financial assets designated at fair value through profit or loss 6 7,591 8,562
Loans and receivables:
- Debtors 7 214,377 217,369
- Cash at bank 8 11,255 10,943
Other assets 9 384 313
581,321 587,723
CREDITORS: AMOUNTS FALLING DUE WITHIN ONE YEAR
Financial liabilities classified as held for trading 5 312,793 331,755
Financial liabilities designated at fair value through profit and loss 6 8,170 7,176
Financial liabilities at amortised cost 11 227,466 219,536
Other creditors 12 322 171
548,751 558,638
NET CURRENT ASSETS 32,570 29,085
TOTAL ASSETS LESS CURRENT LIABILITIES 32,699 29,247
CREDITORS: AMOUNTS FALLING DUE AFTER MORE THAN
ONE YEAR
Financial liabilities designated at fair value through profit and loss 6 3,860 2,896
Financial liabilities at amortised cost 11 15,448 13,073
PROVISIONS FOR LIABILITIES 13 82 8
NET ASSETS EXCLUDING PENSION LIABILITIES 13,309 13,270
Pension liability 4 3
NET ASSETS 13,305 13,267
CAPITAL AND RESERVES
Called up share capital 14 9,464 9,464
Share premium account 15 513 513
Currency translation reserve 15 (58) (77)
Available-for-sale reserve 15 5 21
Capital contribution reserve 15 3 3
Capital redemption reserve 15 1,399 1,399
Profit and loss account 15 1,979 1,944
SHAREHOLDERS’ FUNDS 13,305 13,267
MORGAN STANLEY & CO. INTERNATIONAL plc
NOTES TO THE COMPANY FINANCIAL STATEMENTS
Year ended 31 December 2012
107
1. ACCOUNTING POLICIES
The Company’s principal accounting policies are summarised below and have been applied consistently
throughout the current and preceding year.
a) Basis of preparation
The financial statements are prepared under the historical cost convention, modified by the inclusion of
financial instruments at fair value as described in note 1(e) below, and in accordance with applicable
United Kingdom company law and accounting standards.
The Company’s ultimate UK parent undertaking, Morgan Stanley International Limited, presents
information in accordance with FRS 29 Financial instruments: Disclosures. Accordingly, the Company is
exempt from the disclosure requirements of FRS 29.
b) The going concern assumption
The Company’s business activities, together with the factors likely to affect its future development,
performance and position, are reflected in the Business Review section of the Directors’ report on
pages 2 to 10.
As set out in the Directors’ report, retaining sufficient liquidity and capital to withstand market pressures
remains central to the Morgan Stanley Group’s and the Company’s strategy.
Taking all of these factors into consideration, the Directors believe it is reasonable to assume that the
Company will have access to adequate resources to continue in operational existence for the foreseeable
future. Accordingly, they continue to adopt the going concern basis in preparing the annual report and
financial statements.
c) Functional currency
Items included in the financial statements are measured and presented in US dollars, the currency of the
primary economic environment in which the Company operates.
All currency amounts in the financial statements and Directors’ report are rounded to the nearest million
US dollars.
d) Foreign currencies
All monetary assets and liabilities denominated in currencies other than US dollars are translated into US
dollars at the rates ruling at the balance sheet date. Transactions in currencies other than US dollars are
recorded at the rates prevailing at the dates of the transactions. Foreign exchange differences on financial
assets classified as available-for-sale are recorded in the ‘Available-for-sale reserve’ in equity, with the
exception of translation differences on the amortised cost of monetary available-for-sale assets, which are
recognised through the profit and loss account. Assets and liabilities of foreign operations are translated
into US dollars using the closing rate method. Translation differences arising from the net investments in
the foreign operations are taken to the ‘Foreign currency revaluation reserve’. All other translation
differences are taken through the profit and loss account. Exchange differences recognised in the profit and
loss account are presented in ‘Other income’ or ‘Other expense’, except where noted in 1(e) below.
On disposal of a foreign operation, the related cumulative gain or loss in the ‘Foreign currency revaluation
reserve’ attributable to the equity holders of the Company is reclassified to the profit and loss account and
recorded within gain or loss on disposal.
MORGAN STANLEY & CO. INTERNATIONAL plc
NOTES TO THE COMPANY FINANCIAL STATEMENTS
Year ended 31 December 2012
108
1. ACCOUNTING POLICIES (CONTINUED)
e) Financial instruments
The Company classifies its financial assets into the following categories on initial recognition: financial
assets classified as held for trading; financial assets designated at fair value through profit or loss;
available-for-sale financial assets; investments in subsidiary and associated undertakings and loans and
receivables.
The Company classifies its financial liabilities into the following categories on initial recognition: financial
liabilities classified as held for trading, financial liabilities designated at fair value through profit or loss
and financial liabilities at amortised cost.
More information regarding these classifications is included below:
i) Financial instruments classified as held for trading
With the exception of loans, financial instruments classified as held for trading, including all derivatives,
are initially recorded on trade date at fair value (see note 1(f) below). All subsequent changes in fair
value, foreign exchange differences, interest and dividends, are reflected in the profit and loss account in
‘Net gains/(losses) on financial instruments classified as held for trading’.
For loans classified as held for trading, from the date a loan’s terms are agreed (trade date), until the loan
is funded (settlement date), the Company recognises any unrealised fair value changes in the loan as
financial instruments classified as held for trading. On settlement date, the fair value of consideration
given is recognised as a financial asset classified as held for trading. All subsequent changes in fair value,
foreign exchange differences and interest are reflected in the profit and loss account in ‘Net
gains/ (losses) from financial instruments classified as held for trading’.
For all financial instruments classified as held for trading, transaction costs are excluded from the initial
fair value measurement of the financial instrument. These costs are recognised in the profit and loss
account in ‘Other expense’.
ii) Financial instruments designated at fair value through profit or loss
The Company has designated certain financial assets and financial liabilities at fair value through profit
or loss when:
• the financial assets or financial liabilities are managed, evaluated and reported internally on a fair
value basis;
• the designation at fair value eliminates or significantly reduces an accounting mismatch which
would otherwise arise; or
• the financial asset or financial liability contains an embedded derivative that significantly modifies
the cash flows that would otherwise be required under the contract.
From the date the transaction in a financial instrument designated at fair value is entered into (trade date)
until settlement date, the Company recognises any unrealised fair value changes in the contract as
financial instruments designated at fair value through profit or loss. On settlement date, the fair value of
consideration given or received is recognised as a financial instrument designated at fair value through
profit or loss (see note 1(f) below). All subsequent changes in fair value, foreign exchange differences,
interest and dividends are reflected in the profit and loss account in ‘Net gains/ (losses) on financial
instruments designated at fair value through profit or loss’.
Transaction costs are excluded from the initial fair value measurement of the financial instrument. These
costs are recognised in the profit and loss account in ‘Other expense’.
MORGAN STANLEY & CO. INTERNATIONAL plc
NOTES TO THE COMPANY FINANCIAL STATEMENTS
Year ended 31 December 2012
109
1. ACCOUNTING POLICIES (CONTINUED)
e) Financial instruments (continued)
iii) Available-for-sale fixed asset investments
Financial assets classified as available-for-sale are non-derivative financial assets that are either
designated in this category or not classified in any of the other categories of financial instruments.
Financial assets classified as available-for-sale are recorded on trade date and are initially recognised and
subsequently measured at fair value (see note 1(f) below).
Transaction costs that are directly attributable to the acquisition of the available-for-sale financial asset
are added to the fair value on initial recognition.
For debt instruments, interest calculated using the effective interest method (see note 1(e)(v) below),
impairment losses and reversals of impairment losses and foreign exchange differences on the amortised
cost of the asset are recognised in the profit and loss account in ‘Net gains/(losses) on fixed asset
investments in available-for-sale financial assets’. For equity instruments, dividend income and
impairment losses are recognised in the profit and loss account in ‘Net gains/(losses) on fixed asset
investments in available-for-sale financial assets’. All other gains and losses on debt and equity
instruments classified as available-for-sale are recognised in the ‘Available-for-sale reserve’ within
equity.
On disposal or impairment of an available-for-sale financial asset, the cumulative gain or loss in the
‘Available-for-sale reserve’ is reclassified to the profit and loss account and reported in ‘Net gains/
(losses) on fixed asset investments in available-for-sale financial assets’.
iv) Investments in subsidiary and associated undertakings
Investments in subsidiary and associated undertakings outside the scope of FRS 26 Financial
instruments: Recognition and measurement, are recorded within ‘Investments in subsidiary and
associated undertakings’ and are stated at cost, less provision for any impairment. Interest (recognised
on an accruals basis), dividend income (recognised when the Company’s right to receive payment is
established), impairment losses, reversals of impairment losses, and foreign exchange differences on
monetary investments are all reported in the profit and loss account in ‘Net gains/ (losses) on fixed asset
investments in subsidiary and associated undertakings’.
All other investments in Morgan Stanley Group undertakings are classified as available-for-sale fixed
asset investments and accounted for as described in note 1(e)(iii).
On disposal of an investment in a subsidiary, the cumulative gain or loss is reclassified to the profit and
loss account and reported in ‘Gain/ (loss) on disposal of subsidiary.
v) Loans and receivables and financial liabilities at amortised cost
Financial assets classified as loans and receivables are initially recognised on settlement date at fair value
(see note 1(f) below) and subsequently measured at amortised cost less allowance for impairment.
Interest is recognised in the profit and loss account in ‘Interest income’, using the effective interest rate
method as described below. Transaction costs that are directly attributable to the acquisition of the
financial asset are added to or deducted from the fair value on initial recognition. Impairment losses and
reversals of impairment losses on financial assets classified as loans and receivables are recognised in the
profit and loss account in ‘Other expense’.
Financial liabilities held at amortised cost are initially recognised on settlement date at fair value (see
note 1(f) below) and subsequently measured at amortised cost. Interest is recognised in the profit and
loss account in ‘Interest expense’ using the effective interest rate method as described below.
Transaction costs that are directly attributable to the issue of the financial liability are added to or
deducted from the fair value on initial recognition.
MORGAN STANLEY & CO. INTERNATIONAL plc
NOTES TO THE COMPANY FINANCIAL STATEMENTS
Year ended 31 December 2012
110
1. ACCOUNTING POLICIES (CONTINUED)
e) Financial instruments (continued)
v) Loans and receivables and financial liabilities at amortised cost (continued)
The effective interest rate method is a method of calculating the amortised cost of a financial asset or
financial liability (or a group of financial assets or financial liabilities) and of allocating the interest
income or interest expense over the expected life of the financial asset or financial liability. The
effective interest rate is the rate that exactly discounts the estimated future cash payments and receipts
through the expected life of the financial asset or financial liability (or, where appropriate a shorter
period) to the carrying amount of the financial asset or financial liability. The effective interest rate is
established on initial recognition of the financial asset and financial liability. The calculation of the
effective interest rate includes all fees and commissions paid or received, transaction costs, and discounts
or premiums that are an integral part of the effective interest rate. Transaction costs are incremental costs
that are directly attributable to the acquisition, issue or disposal of a financial asset or financial liability.
In the course of financing its business and as part of its trading activities, the Company enters into
arrangements which involve the sale of securities with agreements to repurchase, the purchase of
securities with resale agreements, the lending of securities with collateral received and the borrowing of
securities with collateral given. Cash collateral balances repayable and accrued interest arising under
repurchase agreements and securities lending arrangements are classified as ‘Financial liabilities at
amortised cost’ and the related securities, where owned by the Company, are included in ‘Financial
assets classified as held for trading’. Cash collateral balances receivable and accrued interest arising
under resale agreements and securities borrowing arrangements are classified as ‘Loans and receivables’.
Securities received by the Company under resale arrangements and securities borrowing arrangements
are generally not recognised on the balance sheet.
f) Fair value of financial instruments
Fair value measurement
Fair value is defined as the price that would be received to sell an asset or paid to transfer a liability (i.e. the
“exit price”) in an orderly transaction between market participants at the measurement date.
In determining fair value, the Company uses various valuation approaches and establishes a hierarchy for
inputs used in measuring fair value that maximises the use of relevant observable inputs and minimises the
use of unobservable inputs by requiring that the most observable inputs be used when available.
Observable inputs are inputs that market participants would use in pricing the asset or liability developed
based on market data obtained from sources independent of the Company. Unobservable inputs are inputs
that reflect the Company’s assumptions about the assumptions other market participants would use in
pricing the asset or liability, developed based on the best information available in the circumstances.
The availability of observable inputs can vary from product to product and is affected by a wide variety of
factors, including, for example, the type of product, whether the product is new and not yet established in
the marketplace, the liquidity of markets and other characteristics particular to the product. To the extent
that valuation is based on models or inputs that are less observable or unobservable in the market, the
determination of fair value requires more judgement.
The Company considers prices and inputs that are current as of the measurement date, including during
periods of market dislocation. In periods of market dislocation, the observability of prices and inputs may
be reduced for many instruments.
MORGAN STANLEY & CO. INTERNATIONAL plc
NOTES TO THE COMPANY FINANCIAL STATEMENTS
Year ended 31 December 2012
111
1. ACCOUNTING POLICIES (CONTINUED)
f) Fair value of financial instruments (continued)
Valuation techniques
Fair value for many cash and over-the-counter (“OTC”) contracts is derived using pricing models. Pricing
models take into account the contract terms (including maturity), as well as multiple inputs including,
where applicable, commodity prices, equity prices, interest rate yield curves, credit curves, correlation,
creditworthiness of the counterparty, option volatility and currency rates. Where appropriate, valuation
adjustments are made to account for various factors such as liquidity risk (bid-ask adjustments), credit
quality, model uncertainty and concentration risk.
Adjustments for liquidity risk adjust model-derived valuations of financial instruments for the bid-mid or
mid-ask spread required to properly reflect the exit price of a risk position. Bid-mid and mid-ask spreads
are marked to levels observed in trader activity, broker quotes or other external third-party data. Where
these spreads are unobservable for the particular position in question, spreads are derived from observable
levels of similar positions.
Credit valuation adjustments are applied to both cash instruments and OTC derivatives. For cash
instruments, the impact of changes in its own credit spreads is considered when measuring the fair value of
liabilities and the impact of changes in the counterparty’s credit spreads is considered when measuring the
fair value of assets. For OTC derivatives, the impact of changes in both the Company’s and the
counterparty’s credit standing is considered when measuring fair value. In determining the expected
exposure the Company simulates the distribution of the future exposure to a counterparty, then applies
market-based default probabilities to the future exposure, leveraging external third-party credit default
swap (“CDS”) spread data. Where CDS spread data are unavailable for a specific counterparty, bond
market spreads, CDS spread data based on the counterparty’s credit rating or CDS spread data that
reference a comparable counterparty may be utilised. The Company also considers collateral held and
legally enforceable master netting agreements that mitigate the Company’s exposure to each counterparty.
Adjustments for model uncertainty are taken for positions where underlying models are reliant on
significant inputs that are neither directly nor indirectly observable, hence requiring reliance on established
theoretical concepts in their derivation. These adjustments are derived by making assessments of the
possible degree of variability using statistical approaches and market-based information where possible.
The Company generally subjects all valuations and models to a review process initially and on a periodic
basis thereafter.
The Company may apply a concentration adjustment to certain of its OTC derivatives portfolios to reflect
the additional cost of closing out a particularly large risk exposure. Where possible, these adjustments are
based on observable market information but in many instances significant judgement is required to estimate
the costs of closing out concentrated risk exposures due to the lack of liquidity in the marketplace.
Fair value is a market-based measure considered from the perspective of a market participant rather than an
entity-specific measure. Therefore, even when market assumptions are not readily available, the
Company’s own assumptions are set to reflect those that the Company believes market participants would
use in pricing the asset or liability at the measurement date.
MORGAN STANLEY & CO. INTERNATIONAL plc
NOTES TO THE COMPANY FINANCIAL STATEMENTS
Year ended 31 December 2012
112
1. ACCOUNTING POLICIES (CONTINUED)
f) Fair value of financial instruments (continued)
Valuation process
The Valuation Review Group (“VRG”) within the Financial Control Group is responsible for the
Company’s fair value valuation policies, processes and procedures. VRG is independent of the business
units and reports to the Chief Financial Officer, who has final authority over the valuation of the
Company’s financial instruments. VRG implements valuation control processes to validate the fair value
of the Company’s financial instruments measured at fair value including those derived from pricing
models. These control processes are designed to assure that the values used for financial reporting are based
on observable inputs wherever possible. In the event that observable inputs are not available, the control
processes are designed to assure that the valuation approach utilised is appropriate and consistently applied
and the assumptions are reasonable.
The Company’s control processes apply to all financial instruments, unless otherwise noted. These control
processes include:
Model Review. VRG, in conjunction with the Market Risk Department and, where appropriate, the Credit
Risk Management Department, both of which report to the Chief Risk Officer, independently review the
valuation model’s theoretical soundness, the appropriateness of the valuation methodology and calibration
techniques developed by the business units using observable inputs. Where inputs are not observable, VRG
reviews the appropriateness of the proposed valuation methodology to ensure it is consistent with how a
market participant would arrive at the unobservable input. The valuation methodologies utilised in the
absence of observable inputs may include extrapolation techniques and the use of comparable observable
inputs. As part of the review, VRG develops a methodology to independently verify the fair value
generated by the business unit’s valuation model. Before trades are executed using new valuation models,
those models are required to be independently reviewed. All of the Company’s valuation models are
subject to an independent annual review.
Independent Price Verification. The business units are responsible for determining the fair value of
financial instruments using approved valuation models and valuation methodologies. Generally on a
monthly basis, VRG independently validates the fair values of financial instruments determined using
valuation models by determining the appropriateness of the inputs used by the business units and testing
compliance with the documented valuation methodologies approved in the model review process described
above.
VRG uses recently executed transactions, other observable market data such as exchange data, broker/
dealer quotes, third-party pricing vendors and aggregation services for validating the fair values of financial
instruments generated using valuation models. VRG assesses the external sources and their valuation
methodologies to determine if the external providers meet the minimum standards expected of a third-party
pricing source. Pricing data provided by approved external sources is evaluated using a number of
approaches; for example, by corroborating the external sources’ prices to executed trades, analysing the
methodology and assumptions used by the external source to generate a price and/ or by evaluating how
active the third-party pricing source (or originating sources used by the third-party pricing source) is in the
market. Based on this analysis, VRG generates a ranking of the observable market data to ensure that the
highest-ranked market data source is used to validate the business unit’s fair value of financial instruments.
For financial instruments where the fair value is based on unobservable inputs, VRG reviews the business
unit’s valuation techniques to ensure these are consistent with market participant assumptions.
The results of this independent price verification and any adjustments made by VRG to the fair value
generated by the business units are presented to management of the three business segments (i.e.,
Institutional Securities, Global Wealth Management Group and Asset Management), the CFO and the Chief
Risk Officer on a regular basis.
MORGAN STANLEY & CO. INTERNATIONAL plc
NOTES TO THE COMPANY FINANCIAL STATEMENTS
Year ended 31 December 2012
113
1. ACCOUNTING POLICIES (CONTINUED)
f) Fair value of financial instruments (continued)
Review of Transactions where the valuation is based on unobservable inputs. VRG reviews the model and
valuation methodology used to price all new material Level 3 transactions and both the Financial Control
Group and Market Risk Department management must approve the fair value of the trade that is initially
recognised.
Gains and losses on inception
In the normal course of business, the fair value of a financial instrument on initial recognition is the
transaction price (i.e. the fair value of the consideration given or received). In certain circumstances,
however, the fair value will be based on other observable current market transactions in the same
instrument, without modification or repackaging, or on a valuation technique whose variables include only
data from observable markets. When such evidence exists, the Company recognises a gain or loss on
inception of the transaction.
When unobservable market data has a significant impact on determining fair value at the inception of the
transaction, the entire initial gain or loss indicated by the valuation technique as at the transaction date is
not recognised immediately in the profit and loss account and is recognised instead when the market data
becomes observable.
g) Derecognition of financial assets and liabilities
The Company derecognises a financial asset only when the contractual rights to the cash flows from the
asset expire, or when it transfers the financial asset and substantially all the risk and rewards of ownership
of the asset.
The Company derecognises financial liabilities when the Company’s obligations are discharged, cancelled
or they expire.
h) Impairment of financial assets
At each balance sheet date, an assessment is made as to whether there is any objective evidence of
impairment in the value of financial assets classified as either available-for-sale, fixed asset investments,
other fixed asset investments or loans and receivables. Impairment losses are recognised if an event has
occurred which will have an adverse impact on the expected future cash flows of an asset and the expected
impact can be reliably estimated.
Impairment losses on available-for-sale financial assets are measured as the difference between cost (net of
any principal repayment and amortisation) and the current fair value. Where there is evidence that the
available-for-sale financial asset is impaired, the cumulative loss that had been previously recognised in
other comprehensive income is reclassified from the ‘Available-for-sale reserve’ and recognised in the
profit and loss account within ‘Net gains/(losses) on fixed asset investments in available-for-sale financial
assets’.
Impairment losses on fixed asset investments in subsidiary and associated undertakings are measured as the
difference between cost and the current estimated recoverable amount. When the recoverable amount is
less than the cost, an impairment is recognised within the profit and loss account in ‘Net gains/(losses) on
fixed asset investments in subsidiary and associated undertakings’ and is reflected against the carrying
amount of the impaired asset on the balance sheet.
Impairment losses on loans and receivables carried at amortised cost are measured as the difference
between the carrying amount of the financial asset and the present value of estimated cash flows discounted
at the asset’s original effective interest rate. Such impairment losses are recognised in the profit and loss
account within ‘Other expense’ and are recognised against the carrying amount of the impaired asset on the
balance sheet. Interest on the impaired asset continues to be accrued on the reduced carrying amount based
on the original effective interest rate of the asset.
MORGAN STANLEY & CO. INTERNATIONAL plc
NOTES TO THE COMPANY FINANCIAL STATEMENTS
Year ended 31 December 2012
114
1. ACCOUNTING POLICIES (CONTINUED)
h) Impairment of financial assets (continued)
Subsequent increases in fair value of previously impaired equity available-for-sale financial assets are
reported as fair value gains in the ‘Available-for-sale reserve’ through other comprehensive income and not
separately identified as an impairment reversal. For all other financial assets, if in a subsequent year, the
amount of the estimated impairment loss decreases because of an event occurring after the impairment was
recognised, the previously recognised impairment loss is reversed as detailed by financial asset in note
1(e)(iii) and (v). Any reversal is limited to the extent that the value of the asset may not exceed the original
amortised cost of the asset had no impairment occurred.
i) Fees and commissions
Fees and commissions classified within ‘Other income’ in the profit and loss account include account
servicing fees, investment management fees, sales commissions, placement fees, advisory fees and
syndication fees. Fees and commissions classified within ‘Other expense’ include transaction and service
fees. These amounts are recognised as the related services are performed or received.
j) Tangible fixed assets
Tangible fixed assets are stated at cost net of depreciation and any provision for impairment in value, which
are included within ‘Other expense’ in the profit and loss account. For assets in the course of construction,
interest that is directly attributable to the construction of the qualifying asset is capitalised as a cost of the
asset. The interest capitalisation rate is based on the Morgan Stanley Group’s blended funding rates.
For premises held under operating leases, a reinstatement provision is recognised for the estimated cost to
reinstate the premises at the end of the lease period. When the reinstatement provision is established and
included within ‘Provisions for liabilities’ in the balance sheet, an equivalent asset is recognised and
included in the cost of leasehold improvements at the initial present value of any reinstatement obligations.
The discount effect included in the reinstatement provision is reversed over time using a constant effective
yield method and included within ‘Interest expense’ in the profit and loss account. The reinstatement asset
is depreciated over the useful economic life of the relevant leasehold improvement asset and the
depreciation charge is included within ‘Other expense’.
Depreciation is provided on tangible fixed assets at rates calculated to write off the cost of the assets on a
straight line basis over their expected useful lives as follows:
Leasehold improvements, including reinstatement assets - shorter of remaining lease term and 25 years
Fixtures, fittings and equipment - 3 to 8 years
k) Operating leases
Rentals payable under operating leases are charged to ‘Other expense’ in the profit and loss account on a
straight-line basis over the lease term. Lease incentives are recognised as a reduction of rentals payable
and are allocated on a straight line basis over the shorter of the lease term and a period ending on a date
from which it is expected the market rent will be payable.
MORGAN STANLEY & CO. INTERNATIONAL plc
NOTES TO THE COMPANY FINANCIAL STATEMENTS
Year ended 31 December 2012
115
1. ACCOUNTING POLICIES (CONTINUED)
l) Taxation
UK corporation tax is provided at amounts expected to be paid/ recovered using the tax rates and laws that
have been enacted or substantively enacted at the balance sheet date.
Full provision has been made for deferred tax assets and liabilities arising from timing differences.
Deferred tax is measured using the average tax rates that are expected to apply in the periods in which the
timing differences are expected to reverse, based on tax rates and laws that have been enacted or
substantively enacted by the balance sheet date. Deferred tax assets are recognised to the extent that it is
regarded as more likely than not that they will be recovered. Deferred tax assets and liabilities are not
discounted.
Current tax assets are offset against current tax liabilities when there is a legally enforceable right to offset
current tax assets against current tax liabilities and when they relate to taxes levied by the same taxation
authority and the Company intends to settle its current tax assets and current tax liabilities on a net basis.
Deferred tax assets are offset against deferred tax liabilities to the extent that they relate to taxes levied by
the same tax authority and arise in the same taxable entity.
m) Employee compensation plans
i) Equity-settled share-based compensation plans
Morgan Stanley operates equity based compensation plans on behalf of the Company, in relation to
which, the Company pays Morgan Stanley in consideration of the procurement of the transfer of shares to
employees. The cost of equity based transactions with employees is measured based on the fair value of
the equity instruments at grant date. Fair value of stock unit awards is based on the market price of
Morgan Stanley shares and the fair value of stock option awards is estimated using the Black-Scholes
option pricing model, which takes into account the option’s exercise price, its expected term, the risk free
interest rate and the expected volatility of the market price of Morgan Stanley shares. Non-market
vesting conditions are not taken into account when measuring fair value, but are reflected by adjusting
over time the number of equity instruments included in the measurement of the transaction such that the
amount ultimately recognised reflects the number that actually vest. The expense for FRS 20 Share-
based payment (“FRS 20”) purposes is recorded within ‘Staff costs’ in ‘Other expense’ in the profit and
loss account; the corresponding credit to the profit and loss account is reduced to the extent that
payments are due to Morgan Stanley in respect of these awards.
ii) Other deferred compensation plans
Morgan Stanley also maintains deferred compensation plans for the benefit of certain employees that
provide a return to the participating employees based upon the performance of various referenced
investments. Liabilities for these awards, which are included within ‘Accruals and deferred income’ in
the balance sheet, are measured at fair value and recognised over time in accordance with the awards’
vesting conditions. The related expense is recorded within ‘Staff costs’ in ‘Other expense’. The
Company economically hedges the exposure created by these deferred compensation schemes by
entering into derivative transactions with other Morgan Stanley Group undertakings. The derivatives are
recognised within ‘Financial instruments classified as held for trading’ in the balance sheet and the
related gains and losses are recorded within ‘Net gains/(losses) on financial instruments classified as held
for trading’ in the profit and loss account.
MORGAN STANLEY & CO. INTERNATIONAL plc
NOTES TO THE COMPANY FINANCIAL STATEMENTS
Year ended 31 December 2012
116
1. ACCOUNTING POLICIES (CONTINUED)
n) Retirement benefits
The Company operates a defined contribution scheme and a defined benefit pension scheme.
Contributions due in relation to the Company’s defined contribution scheme are recognised in ‘Other
expense’ in the profit and loss account when payable.
For the Company’s defined benefit scheme, liabilities are measured on an actuarial basis using the
projected unit method and discounted at a rate that reflects the current rate of return on a high quality
corporate bond of equivalent term and currency to the scheme liabilities. Scheme assets are measured at
their fair value. A surplus of scheme assets over liabilities is recognised in the balance sheet as an asset
where recoverable. Where scheme liabilities exceed scheme assets, the deficit is recognised in the balance
sheet as a liability. The current service cost and any past service costs are charged to ‘Other expense’. The
expected return on scheme assets and the unwinding of the discount on the scheme liabilities are presented
net and recognised within either ‘Interest income’ or ‘Interest expense’. Actuarial gains and losses are
recognised in full in the period in which they occur in the statement of total recognised gains and losses.
Details of the plans are given in note 18 to these financial statements.
o) Cash flow statement
The Company’s ultimate parent undertaking produces consolidated financial statements in which the
Company is included and which are publicly available. Accordingly, the Company, which is a wholly-
owned subsidiary, has elected to avail itself of the exemption provided in FRS 1 (Revised 1996) Cash flow
statements and not present a cash flow statement.
2. PROFIT FOR THE YEAR
As permitted by section 408 of the Companies Act 2006, the Company has elected not to present its own
profit and loss account for the period. The Company reported a profit after tax of $39 million for the year
ended 31 December 2012 (2011: $547 million).
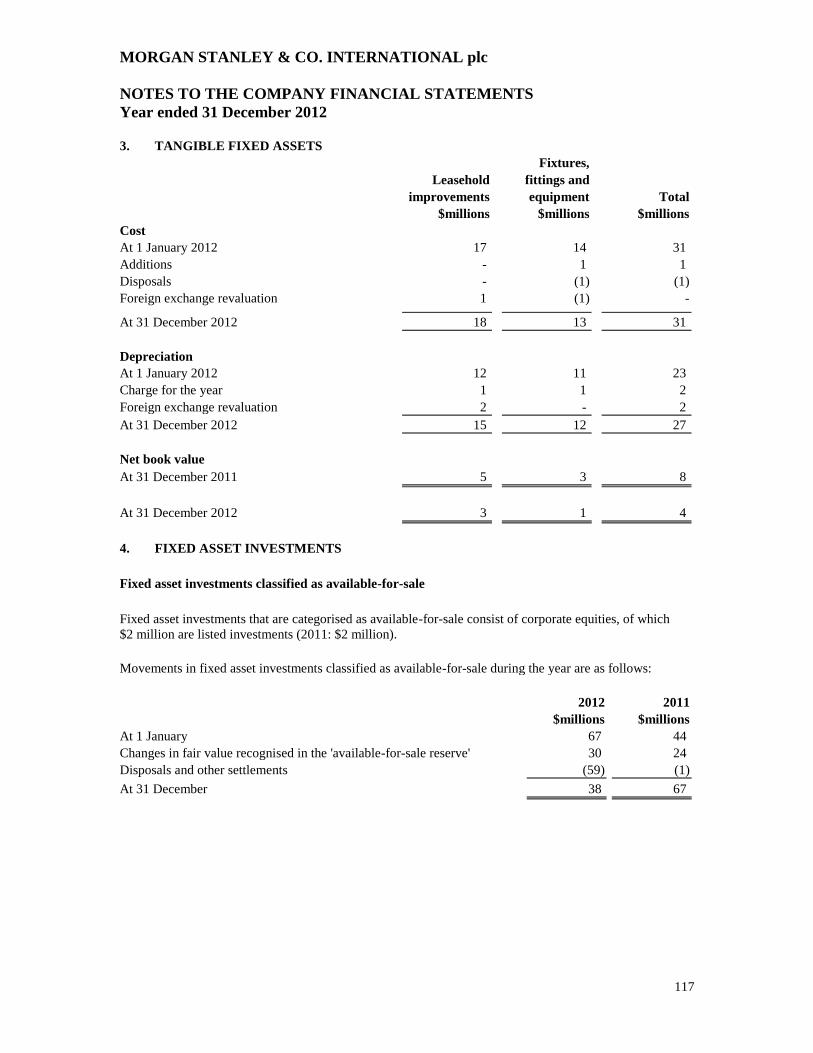
MORGAN STANLEY & CO. INTERNATIONAL plc
NOTES TO THE COMPANY FINANCIAL STATEMENTS
Year ended 31 December 2012
117
3. TANGIBLE FIXED ASSETS
Fixtures,
Leasehold fittings and
improvements equipment Total
$millions $millions $millions
Cost
At 1 January 2012 17 14 31
Additions - 1 1
Disposals - (1) (1)
Foreign exchange revaluation 1 (1) -
At 31 December 2012 18 13 31
Depreciation
At 1 January 2012 12 11 23
Charge for the year 1 1 2
Foreign exchange revaluation 2 - 2
At 31 December 2012 15 12 27
Net book value
At 31 December 2011 5 3 8
At 31 December 2012 3 1 4
4. FIXED ASSET INVESTMENTS
Fixed asset investments classified as available-for-sale
Fixed asset investments that are categorised as available-for-sale consist of corporate equities, of which
$2 million are listed investments (2011: $2 million).
Movements in fixed asset investments classified as available-for-sale during the year are as follows:
2012 2011
$millions $millions
At 1 January 67 44
Changes in fair value recognised in the 'available-for-sale reserve' 30 24
Disposals and other settlements (59) (1)
At 31 December 38 67
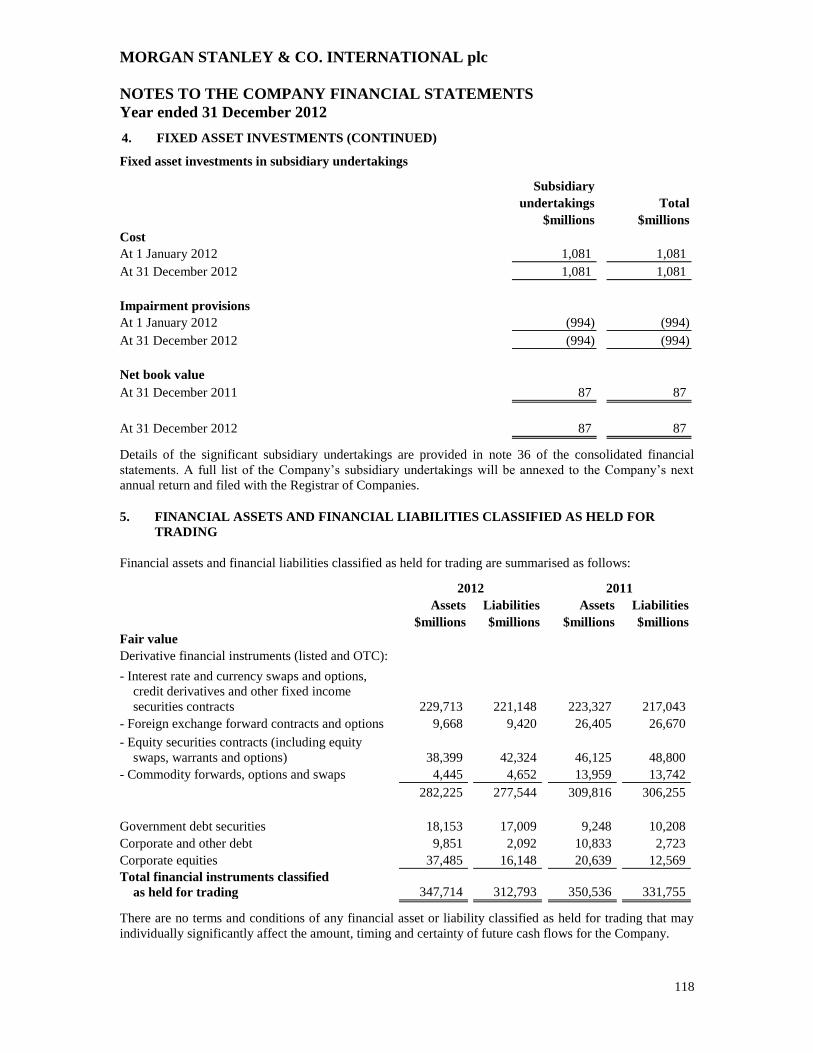
MORGAN STANLEY & CO. INTERNATIONAL plc
NOTES TO THE COMPANY FINANCIAL STATEMENTS
Year ended 31 December 2012
118
4. FIXED ASSET INVESTMENTS (CONTINUED)
Fixed asset investments in subsidiary undertakings
Subsidiary
undertakings Total
$millions $millions
Cost
At 1 January 2012 1,081 1,081
At 31 December 2012 1,081 1,081
Impairment provisions
At 1 January 2012 (994) (994)
At 31 December 2012 (994) (994)
Net book value
At 31 December 2011 87 87
At 31 December 2012 87 87
Details of the significant subsidiary undertakings are provided in note 36 of the consolidated financial
statements. A full list of the Company’s subsidiary undertakings will be annexed to the Company’s next
annual return and filed with the Registrar of Companies.
5. FINANCIAL ASSETS AND FINANCIAL LIABILITIES CLASSIFIED AS HELD FOR
TRADING
Financial assets and financial liabilities classified as held for trading are summarised as follows:
2012 2011
Assets Liabilities Assets Liabilities
$millions $millions $millions $millions
Fair value
Derivative financial instruments (listed and OTC):
- Interest rate and currency swaps and options,
credit derivatives and other fixed income
securities contracts 229,713 221,148 223,327 217,043
- Foreign exchange forward contracts and options 9,668 9,420 26,405 26,670
- Equity securities contracts (including equity
swaps, warrants and options) 38,399 42,324 46,125 48,800
- Commodity forwards, options and swaps 4,445 4,652 13,959 13,742
282,225 277,544 309,816 306,255
Government debt securities 18,153 17,009 9,248 10,208
Corporate and other debt 9,851 2,092 10,833 2,723
Corporate equities 37,485 16,148 20,639 12,569
Total financial instruments classified
as held for trading 347,714 312,793 350,536 331,755
There are no terms and conditions of any financial asset or liability classified as held for trading that may
individually significantly affect the amount, timing and certainty of future cash flows for the Company.
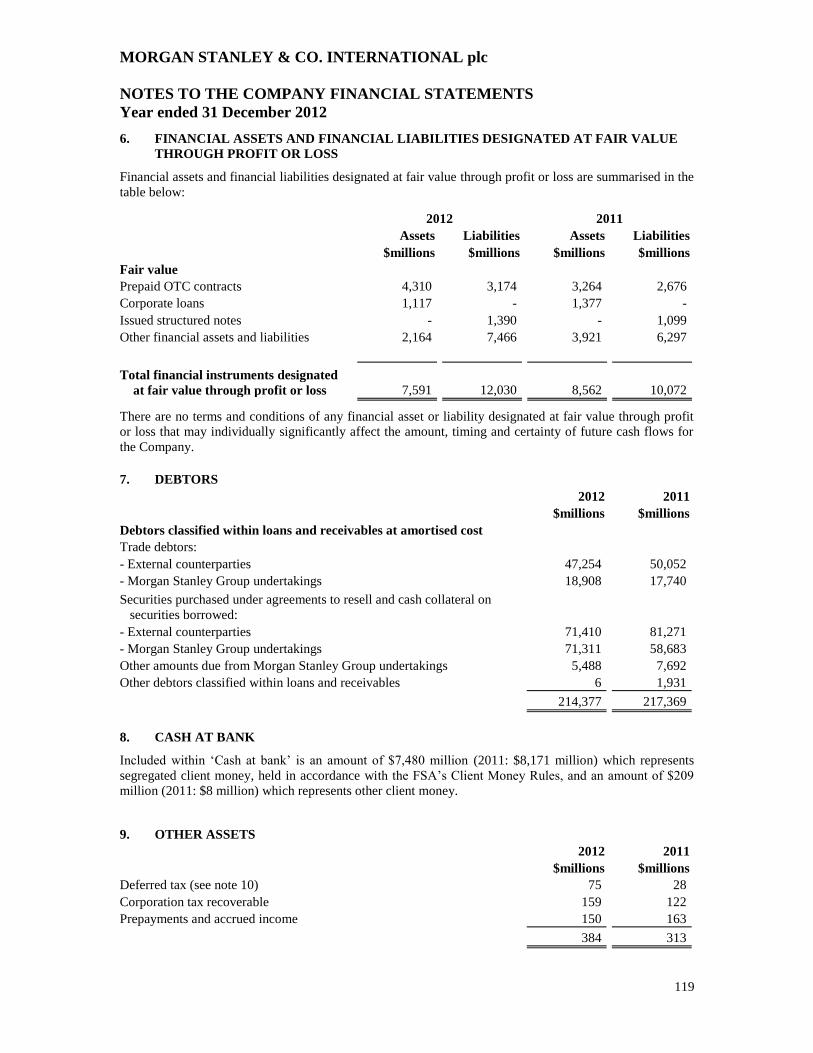
MORGAN STANLEY & CO. INTERNATIONAL plc
NOTES TO THE COMPANY FINANCIAL STATEMENTS
Year ended 31 December 2012
119
6. FINANCIAL ASSETS AND FINANCIAL LIABILITIES DESIGNATED AT FAIR VALUE
THROUGH PROFIT OR LOSS
Financial assets and financial liabilities designated at fair value through profit or loss are summarised in the
table below:
2012 2011
Assets Liabilities Assets Liabilities
$millions $millions $millions $millions
Fair value
Prepaid OTC contracts 4,310 3,174 3,264 2,676
Corporate loans 1,117 - 1,377 -
Issued structured notes - 1,390 - 1,099
Other financial assets and liabilities 2,164 7,466 3,921 6,297
Total financial instruments designated
at fair value through profit or loss 7,591 12,030 8,562 10,072
There are no terms and conditions of any financial asset or liability designated at fair value through profit
or loss that may individually significantly affect the amount, timing and certainty of future cash flows for
the Company.
7. DEBTORS
2012 2011
$millions $millions
Debtors classified within loans and receivables at amortised cost
Trade debtors:
- External counterparties 47,254 50,052
- Morgan Stanley Group undertakings 18,908 17,740
Securities purchased under agreements to resell and cash collateral on
securities borrowed:
- External counterparties 71,410 81,271
- Morgan Stanley Group undertakings 71,311 58,683
Other amounts due from Morgan Stanley Group undertakings 5,488 7,692
Other debtors classified within loans and receivables 6 1,931
214,377 217,369
8. CASH AT BANK
Included within ‘Cash at bank’ is an amount of $7,480 million (2011: $8,171 million) which represents
segregated client money, held in accordance with the FSA’s Client Money Rules, and an amount of $209
million (2011: $8 million) which represents other client money.
9. OTHER ASSETS
2012 2011
$millions $millions
Deferred tax (see note 10) 75 28
Corporation tax recoverable 159 122
Prepayments and accrued income 150 163
384 313
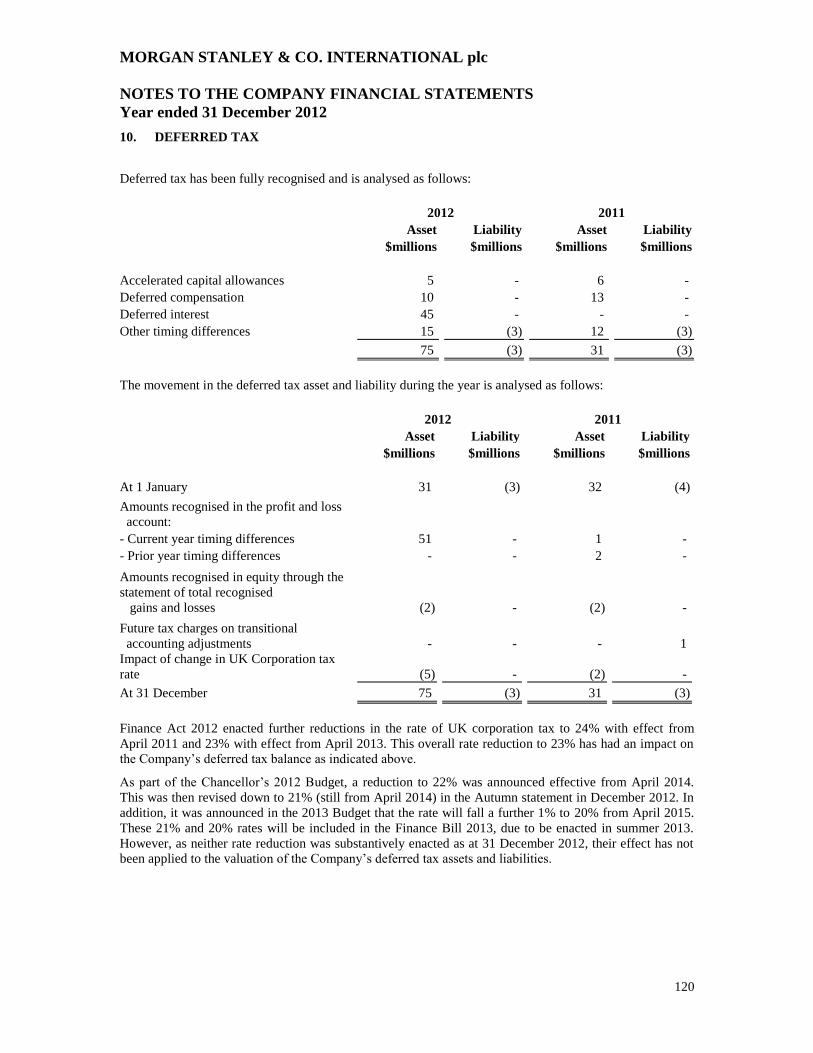
MORGAN STANLEY & CO. INTERNATIONAL plc
NOTES TO THE COMPANY FINANCIAL STATEMENTS
Year ended 31 December 2012
120
10. DEFERRED TAX
Deferred tax has been fully recognised and is analysed as follows:
2012 2011
Asset Liability Asset Liability
$millions $millions $millions $millions
Accelerated capital allowances 5 - 6 -
Deferred compensation 10 - 13 -
Deferred interest 45 - - -
Other timing differences 15 (3) 12 (3)
75 (3) 31 (3)
The movement in the deferred tax asset and liability during the year is analysed as follows:
2012 2011
Asset Liability Asset Liability
$millions $millions $millions $millions
At 1 January 31 (3) 32 (4)
Amounts recognised in the profit and loss
account:
- Current year timing differences 51 - 1 -
- Prior year timing differences - - 2 -
Amounts recognised in equity through the
statement of total recognised
gains and losses (2) - (2) -
Future tax charges on transitional
accounting adjustments - - - 1
Impact of change in UK Corporation tax
rate (5) - (2) -
At 31 December 75 (3) 31 (3)
Finance Act 2012 enacted further reductions in the rate of UK corporation tax to 24% with effect from
April 2011 and 23% with effect from April 2013. This overall rate reduction to 23% has had an impact on
the Company’s deferred tax balance as indicated above.
As part of the Chancellor’s 2012 Budget, a reduction to 22% was announced effective from April 2014.
This was then revised down to 21% (still from April 2014) in the Autumn statement in December 2012. In
addition, it was announced in the 2013 Budget that the rate will fall a further 1% to 20% from April 2015.
These 21% and 20% rates will be included in the Finance Bill 2013, due to be enacted in summer 2013.
However, as neither rate reduction was substantively enacted as at 31 December 2012, their effect has not
been applied to the valuation of the Company’s deferred tax assets and liabilities.
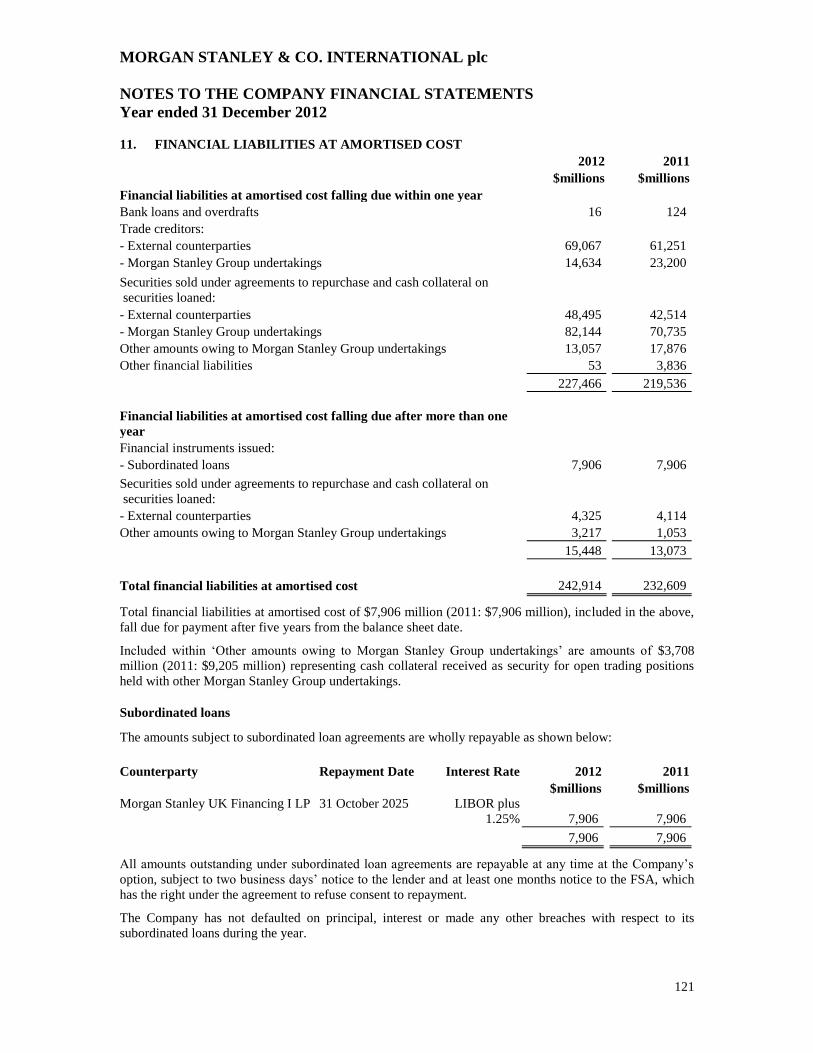
MORGAN STANLEY & CO. INTERNATIONAL plc
NOTES TO THE COMPANY FINANCIAL STATEMENTS
Year ended 31 December 2012
121
11. FINANCIAL LIABILITIES AT AMORTISED COST
2012 2011
$millions $millions
Financial liabilities at amortised cost falling due within one year
Bank loans and overdrafts 16 124
Trade creditors:
- External counterparties 69,067 61,251
- Morgan Stanley Group undertakings 14,634 23,200
Securities sold under agreements to repurchase and cash collateral on
securities loaned:
- External counterparties 48,495 42,514
- Morgan Stanley Group undertakings 82,144 70,735
Other amounts owing to Morgan Stanley Group undertakings 13,057 17,876
Other financial liabilities 53 3,836
227,466 219,536
Financial liabilities at amortised cost falling due after more than one
year
Financial instruments issued:
- Subordinated loans 7,906 7,906
Securities sold under agreements to repurchase and cash collateral on
securities loaned:
- External counterparties 4,325 4,114
Other amounts owing to Morgan Stanley Group undertakings 3,217 1,053
15,448 13,073
Total financial liabilities at amortised cost 242,914 232,609
Total financial liabilities at amortised cost of $7,906 million (2011: $7,906 million), included in the above,
fall due for payment after five years from the balance sheet date.
Included within ‘Other amounts owing to Morgan Stanley Group undertakings’ are amounts of $3,708
million (2011: $9,205 million) representing cash collateral received as security for open trading positions
held with other Morgan Stanley Group undertakings.
Subordinated loans
The amounts subject to subordinated loan agreements are wholly repayable as shown below:
Counterparty Repayment Date Interest Rate 2012 2011
$millions $millions
Morgan Stanley UK Financing I LP 31 October 2025 LIBOR plus
1.25% 7,906 7,906
7,906 7,906
All amounts outstanding under subordinated loan agreements are repayable at any time at the Company’s
option, subject to two business days’ notice to the lender and at least one months notice to the FSA, which
has the right under the agreement to refuse consent to repayment.
The Company has not defaulted on principal, interest or made any other breaches with respect to its
subordinated loans during the year.
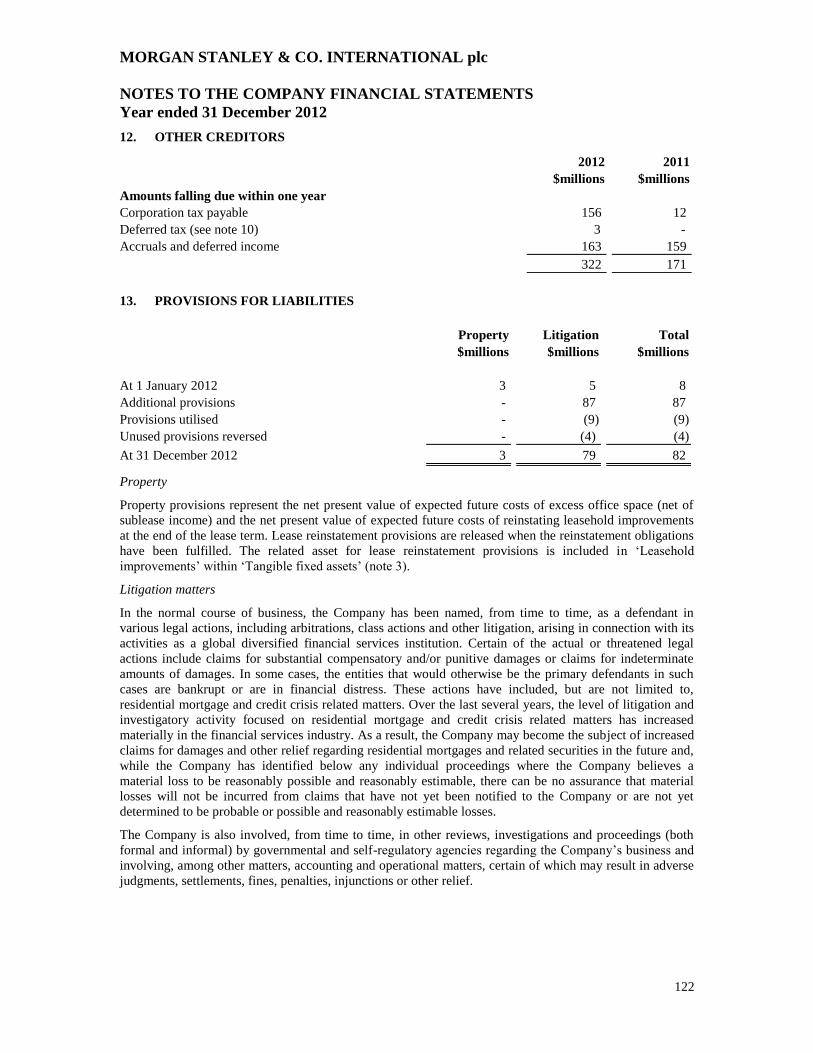
MORGAN STANLEY & CO. INTERNATIONAL plc
NOTES TO THE COMPANY FINANCIAL STATEMENTS
Year ended 31 December 2012
122
12. OTHER CREDITORS
2012 2011
$millions $millions
Amounts falling due within one year
Corporation tax payable 156 12
Deferred tax (see note 10) 3 -
Accruals and deferred income 163 159
322 171
13. PROVISIONS FOR LIABILITIES
Property Litigation Total
$millions $millions $millions
At 1 January 2012 3 5 8
Additional provisions - 87 87
Provisions utilised - (9) (9)
Unused provisions reversed - (4) (4)
At 31 December 2012 3 79 82
Property
Property provisions represent the net present value of expected future costs of excess office space (net of
sublease income) and the net present value of expected future costs of reinstating leasehold improvements
at the end of the lease term. Lease reinstatement provisions are released when the reinstatement obligations
have been fulfilled. The related asset for lease reinstatement provisions is included in ‘Leasehold
improvements’ within ‘Tangible fixed assets’ (note 3).
Litigation matters
In the normal course of business, the Company has been named, from time to time, as a defendant in
various legal actions, including arbitrations, class actions and other litigation, arising in connection with its
activities as a global diversified financial services institution. Certain of the actual or threatened legal
actions include claims for substantial compensatory and/or punitive damages or claims for indeterminate
amounts of damages. In some cases, the entities that would otherwise be the primary defendants in such
cases are bankrupt or are in financial distress. These actions have included, but are not limited to,
residential mortgage and credit crisis related matters. Over the last several years, the level of litigation and
investigatory activity focused on residential mortgage and credit crisis related matters has increased
materially in the financial services industry. As a result, the Company may become the subject of increased
claims for damages and other relief regarding residential mortgages and related securities in the future and,
while the Company has identified below any individual proceedings where the Company believes a
material loss to be reasonably possible and reasonably estimable, there can be no assurance that material
losses will not be incurred from claims that have not yet been notified to the Company or are not yet
determined to be probable or possible and reasonably estimable losses.
The Company is also involved, from time to time, in other reviews, investigations and proceedings (both
formal and informal) by governmental and self-regulatory agencies regarding the Company’s business and
involving, among other matters, accounting and operational matters, certain of which may result in adverse
judgments, settlements, fines, penalties, injunctions or other relief.
MORGAN STANLEY & CO. INTERNATIONAL plc
NOTES TO THE COMPANY FINANCIAL STATEMENTS
Year ended 31 December 2012
123
13. PROVISIONS FOR LIABILITIES (CONTINUED)
Litigation matters (continued)
The Company contests liability and/or the amount of damages as appropriate in each pending matter.
Where available information indicates that it is probable a liability had been incurred at the date of the
financial statements and the Company can reasonably estimate the amount of that loss, the Company
accrues the estimated loss by a charge to income. In many proceedings, however, it is inherently difficult to
determine whether any loss is probable or even possible or to estimate the amount of any loss. In addition,
even where loss is possible or an exposure to loss exists in excess of the liability already accrued with
respect to a previously recognized loss contingency, it is not always possible to reasonably estimate the size
of the possible loss or range of loss.
For certain legal proceedings, the Company cannot reasonably estimate such losses, particularly for
proceedings that are in their early stages of development or where plaintiffs seek substantial or
indeterminate damages. Numerous issues may need to be resolved, including through potentially lengthy
discovery and determination of important factual matters, determination of issues related to class
certification and the calculation of damages, and by addressing novel or unsettled legal questions relevant
to the proceedings in question, before a loss or additional loss or range of loss or additional loss can be
reasonably estimated for any proceeding.
For certain other legal proceedings, the Company can estimate reasonably possible losses, additional losses,
ranges of loss or ranges of additional loss in excess of amounts accrued, but does not believe, based on
current knowledge and after consultation with counsel, that such losses will have a material adverse effect
on the Company’s financial statements as a whole, other than the matters referred to in the following
paragraphs.
On 25 August 2008, the Morgan Stanley Group, the Company and two ratings agencies were named as
defendants in a purported class action related to securities issued by a structured investment vehicle
(“SIV”) called Cheyne Finance plc and Cheyne Finance LLC (together, the “Cheyne SIV”). The case is
styled Abu Dhabi Commercial Bank, et al. v. Morgan Stanley & Co. Inc., et al. and is pending in the United
States District Court for the Southern District of New York (“SDNY”). The complaint alleges, among other
things, that the ratings assigned to the securities issued by the Cheyne SIV were false and misleading,
including because the ratings did not accurately reflect the risks associated with the subprime residential
mortgage backed securities held by the Cheyne SIV. The plaintiffs currently assert allegations of aiding and
abetting fraud and negligent misrepresentation relating to approximately $852 million of securities issued
by the Cheyne SIV. The plaintiffs’ motion for class certification was denied in June 2010. The court
denied the Morgan Stanley Group’s and the Company’s motion for summary judgment on the aiding and
abetting fraud claim in August 2012. On 30 November 2012, the Morgan Stanley Group and the Company
filed a motion for summary judgment on the negligent misrepresentation claim. On 18 April 2013, the
Morgan Stanley Group and the Company have reached an agreement in principle to settle this matter.
MORGAN STANLEY & CO. INTERNATIONAL plc
NOTES TO THE COMPANY FINANCIAL STATEMENTS
Year ended 31 December 2012
124
13. PROVISIONS FOR LIABILITIES (CONTINUED)
Litigation matters (continued)
On 15 July 2010, China Development Industrial Bank (“CDIB”) filed a complaint against the Morgan
Stanley Group, which is styled China Development Industrial Bank v. Morgan Stanley & Co. Incorporated
et al. and is pending in the Supreme Court of the State of New York, New York County. The complaint
relates to a $275 million credit default swap referencing the super senior portion of the STACK 2006-1
CDO. The complaint asserts claims for common law fraud, fraudulent inducement and fraudulent
concealment and alleges that the Morgan Stanley Group misrepresented the risks of the STACK 2006-1
CDO to CDIB, and that the Morgan Stanley Group knew that the assets backing the CDO were of poor
quality when it entered into the credit default swap with CDIB. The complaint seeks compensatory
damages related to the approximately $228 million that CDIB alleges it has already lost under the credit
default swap, rescission of CDIB’s obligation to pay an additional $12 million, punitive damages, equitable
relief, fees and costs. On 28 February 2011, the court presiding over this action denied the Morgan Stanley
Group’s motion to dismiss the complaint. On 7 July 2011, the appellate court affirmed the lower court’s
decision denying the motion to dismiss. Based on currently available information, the Morgan Stanley
Group believes it could incur a loss of up to approximately $240 million plus pre- and post-judgment
interest, fees and costs.
In addition, the Company has identified the following proceeding:
On 10 June 2010, the Morgan Stanley Group and the Company was named as a new defendant in a pre-
existing purported class action related to securities issued by a SIV called Rhinebridge plc and Rhinebridge
LLC (together the “Rhinebridge SIV”). The case is styled King County, Washington, et al. v. IKB
Deutsche Industriebank AG, et al. and is pending in the SDNY before the same judge presiding over the
litigation concerning the Cheyne SIV, described above. The complaint alleges, among other things, that the
ratings assigned to the securities issued by the SIV were false and misleading, including because the ratings
did not accurately reflect the risks associated with the subprime RMBS held by the SIV. The court
dismissed plaintiffs’ claims for breach of fiduciary duty and negligence on 4 May 2012. On 7 September
2012 the Morgan Stanley Group and the Company moved for summary judgment with respect to the
remaining claims for fraud, negligent misrepresentation and aiding and abetting fraud. On 3 January 2013
the court granted the motion for summary judgment with respect to the fraud and negligent
misrepresentation claims and denied it with respect to the aiding and abetting fraud claim. On 18 April
2013, the Morgan Stanley Group and the Company have reached an agreement in principle to settle this
matter.
In addition to the matters disclosed above, on 2 October 2012, the United States Court of Appeals for the
Second Circuit affirmed the 27 June 2011 judgment of the SDNY in Citibank, N.A. v. Morgan Stanley &
Co. International plc in favour of Citibank, N.A. for $269 million plus post-judgment interest and costs.
The Company has satisfied the judgment. In compliance with certain intra-group policies of the Morgan
Stanley Group, all costs related to this matter were transferred to other Morgan Stanley Group
undertakings.
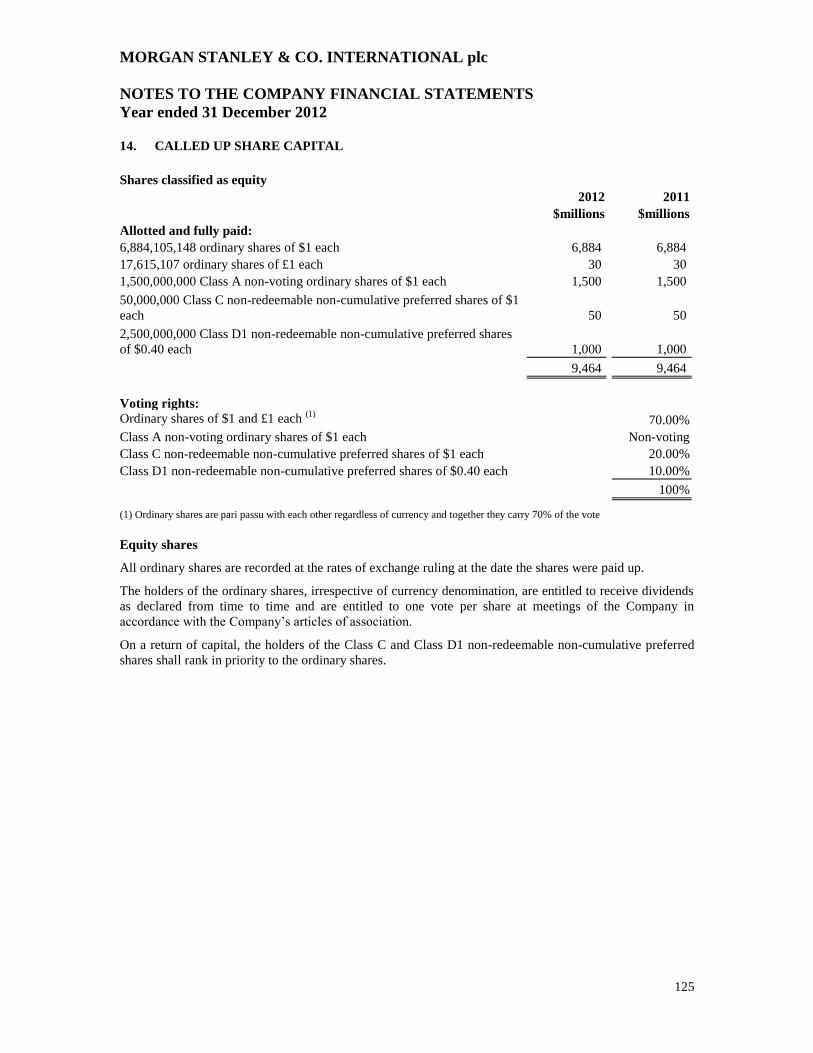
MORGAN STANLEY & CO. INTERNATIONAL plc
NOTES TO THE COMPANY FINANCIAL STATEMENTS
Year ended 31 December 2012
125
14. CALLED UP SHARE CAPITAL
Shares classified as equity
2012 2011
$millions $millions
Allotted and fully paid:
6,884,105,148 ordinary shares of $1 each 6,884 6,884
17,615,107 ordinary shares of £1 each 30 30
1,500,000,000 Class A non-voting ordinary shares of $1 each 1,500 1,500
50,000,000 Class C non-redeemable non-cumulative preferred shares of $1
each 50 50
2,500,000,000 Class D1 non-redeemable non-cumulative preferred shares
of $0.40 each 1,000 1,000
9,464 9,464
Voting rights:
Ordinary shares of $1 and £1 each (1)
70.00%
Class A non-voting ordinary shares of $1 each Non-voting
Class C non-redeemable non-cumulative preferred shares of $1 each 20.00%
Class D1 non-redeemable non-cumulative preferred shares of $0.40 each 10.00%
100%
(1) Ordinary shares are pari passu with each other regardless of currency and together they carry 70% of the vote
Equity shares
All ordinary shares are recorded at the rates of exchange ruling at the date the shares were paid up.
The holders of the ordinary shares, irrespective of currency denomination, are entitled to receive dividends
as declared from time to time and are entitled to one vote per share at meetings of the Company in
accordance with the Company’s articles of association.
On a return of capital, the holders of the Class C and Class D1 non-redeemable non-cumulative preferred
shares shall rank in priority to the ordinary shares.
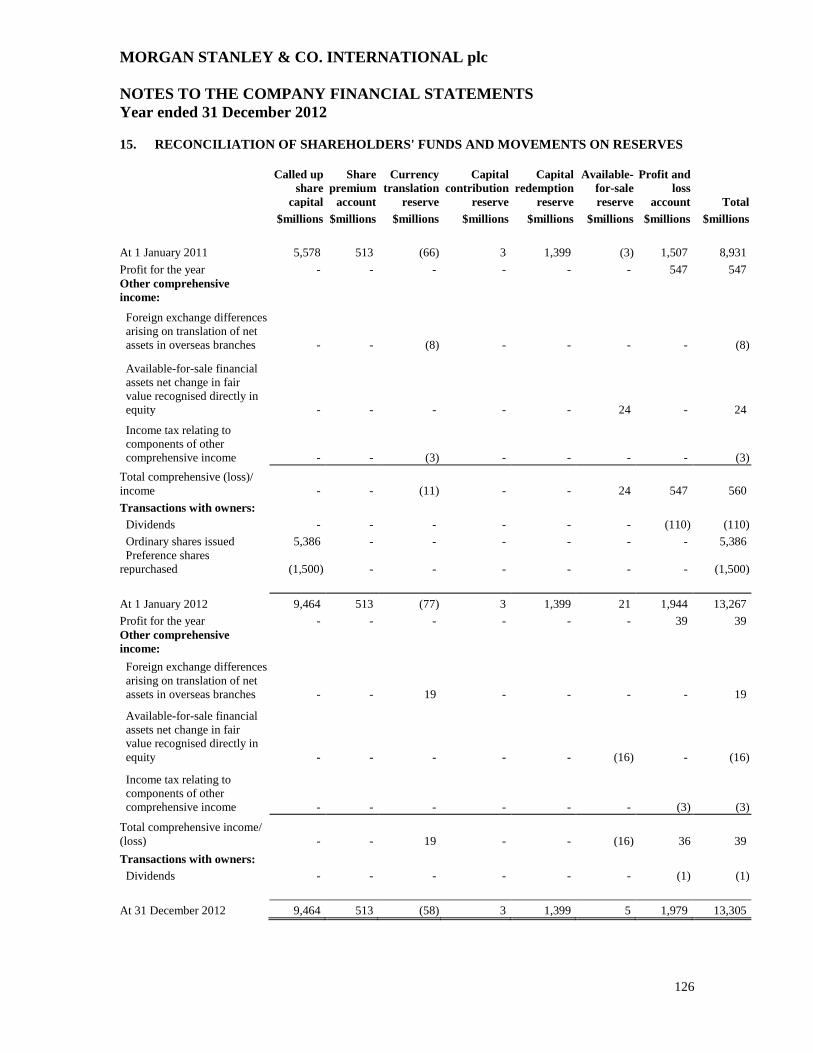
MORGAN STANLEY & CO. INTERNATIONAL plc
NOTES TO THE COMPANY FINANCIAL STATEMENTS
Year ended 31 December 2012
126
15.
RECONCILIATION OF SHAREHOLDERS' FUNDS AND MOVEMENTS ON RESERVES
Called up
share
capital
Share
premium
account
Currency
translation
reserve
Capital
contribution
reserve
Capital
redemption
reserve
Available-
for-sale
reserve
Profit and
loss
account Total
$millions $millions $millions $millions $millions $millions $millions $millions
At 1 January 2011 5,578 513 (66) 3 1,399 (3) 1,507 8,931
Profit for the year - - - - - - 547 547
Other comprehensive
income:
Foreign exchange differences
arising on translation of net
assets in overseas branches - - (8) - - - - (8)
Available-for-sale financial
assets net change in fair
value recognised directly in
equity - - - - - 24 - 24
Income tax relating to
components of other
comprehensive income - - (3) - - - - (3)
Total comprehensive (loss)/
income - - (11) - - 24 547 560
Transactions with owners:
Dividends - - - - - - (110) (110)
Ordinary shares issued 5,386 - - - - - - 5,386
Preference shares
repurchased (1,500) - - - - - - (1,500)
At 1 January 2012 9,464 513 (77) 3 1,399 21 1,944 13,267
Profit for the year - - - - - - 39 39
Other comprehensive
income:
Foreign exchange differences
arising on translation of net
assets in overseas branches - - 19 - - - - 19
Available-for-sale financial
assets net change in fair
value recognised directly in
equity - - - - - (16) - (16)
Income tax relating to
components of other
comprehensive income - - - - - - (3) (3)
Total comprehensive income/
(loss) - - 19 - - (16) 36 39
Transactions with owners:
Dividends - - - - - - (1) (1)
At 31 December 2012 9,464 513 (58) 3 1,399 5 1,979 13,305
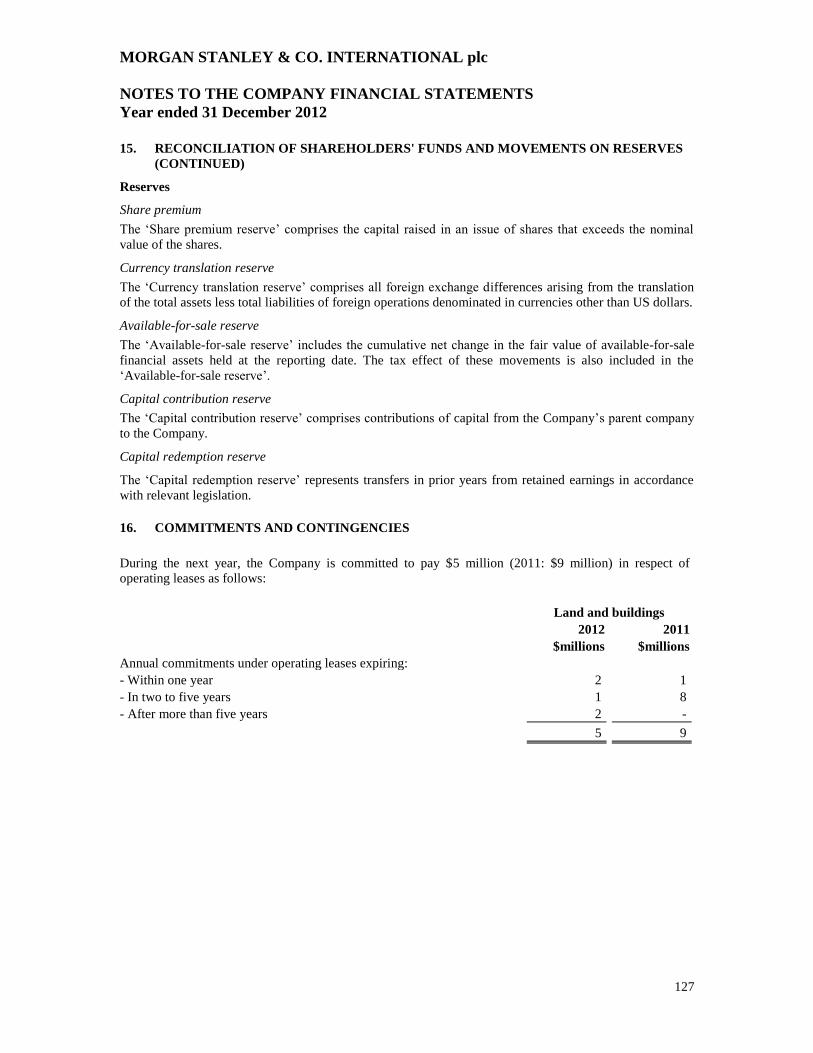
MORGAN STANLEY & CO. INTERNATIONAL plc
NOTES TO THE COMPANY FINANCIAL STATEMENTS
Year ended 31 December 2012
127
15. RECONCILIATION OF SHAREHOLDERS' FUNDS AND MOVEMENTS ON RESERVES
(CONTINUED)
Reserves
Share premium
The ‘Share premium reserve’ comprises the capital raised in an issue of shares that exceeds the nominal
value of the shares.
Currency translation reserve
The ‘Currency translation reserve’ comprises all foreign exchange differences arising from the translation
of the total assets less total liabilities of foreign operations denominated in currencies other than US dollars.
Available-for-sale reserve
The ‘Available-for-sale reserve’ includes the cumulative net change in the fair value of available-for-sale
financial assets held at the reporting date. The tax effect of these movements is also included in the
‘Available-for-sale reserve’.
Capital contribution reserve
The ‘Capital contribution reserve’ comprises contributions of capital from the Company’s parent company
to the Company.
Capital redemption reserve
The ‘Capital redemption reserve’ represents transfers in prior years from retained earnings in accordance
with relevant legislation.
16. COMMITMENTS AND CONTINGENCIES
During the next year, the Company is committed to pay $5 million (2011: $9 million) in respect of
operating leases as follows:
Land and buildings
2012 2011
$millions $millions
Annual commitments under operating leases expiring:
- Within one year 2 1
- In two to five years 1 8
- After more than five years 2 -
5 9
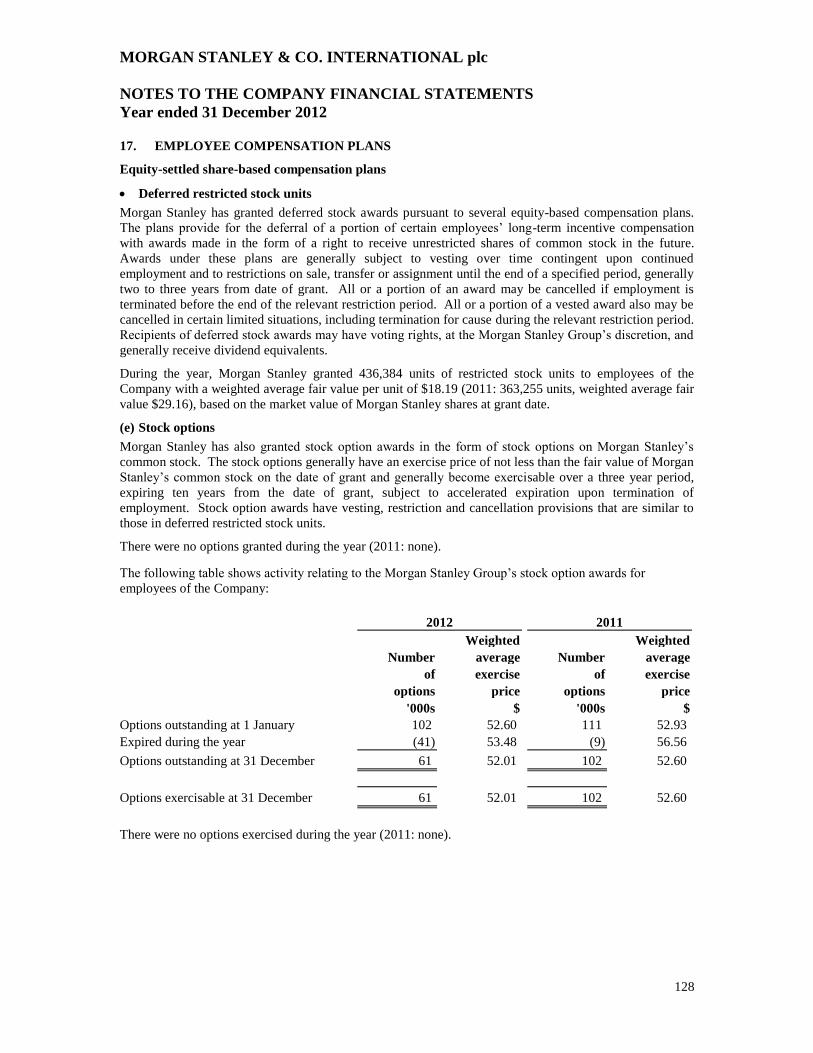
MORGAN STANLEY & CO. INTERNATIONAL plc
NOTES TO THE COMPANY FINANCIAL STATEMENTS
Year ended 31 December 2012
128
17. EMPLOYEE COMPENSATION PLANS
Equity-settled share-based compensation plans
Deferred restricted stock units
Morgan Stanley has granted deferred stock awards pursuant to several equity-based compensation plans.
The plans provide for the deferral of a portion of certain employees’ long-term incentive compensation
with awards made in the form of a right to receive unrestricted shares of common stock in the future.
Awards under these plans are generally subject to vesting over time contingent upon continued
employment and to restrictions on sale, transfer or assignment until the end of a specified period, generally
two to three years from date of grant. All or a portion of an award may be cancelled if employment is
terminated before the end of the relevant restriction period. All or a portion of a vested award also may be
cancelled in certain limited situations, including termination for cause during the relevant restriction period.
Recipients of deferred stock awards may have voting rights, at the Morgan Stanley Group’s discretion, and
generally receive dividend equivalents.
During the year, Morgan Stanley granted 436,384 units of restricted stock units to employees of the
Company with a weighted average fair value per unit of $18.19 (2011: 363,255 units, weighted average fair
value $29.16), based on the market value of Morgan Stanley shares at grant date.
(e) Stock options
Morgan Stanley has also granted stock option awards in the form of stock options on Morgan Stanley’s
common stock. The stock options generally have an exercise price of not less than the fair value of Morgan
Stanley’s common stock on the date of grant and generally become exercisable over a three year period,
expiring ten years from the date of grant, subject to accelerated expiration upon termination of
employment. Stock option awards have vesting, restriction and cancellation provisions that are similar to
those in deferred restricted stock units.
There were no options granted during the year (2011: none).
The following table shows activity relating to the Morgan Stanley Group’s stock option awards for
employees of the Company:
2012 2011
Weighted Weighted
Number average Number average
of exercise of exercise
options price options price
'000s $ '000s $
Options outstanding at 1 January 102 52.60 111 52.93
Expired during the year (41) 53.48 (9) 56.56
Options outstanding at 31 December 61 52.01 102 52.60
Options exercisable at 31 December 61 52.01 102 52.60
There were no options exercised during the year (2011: none).
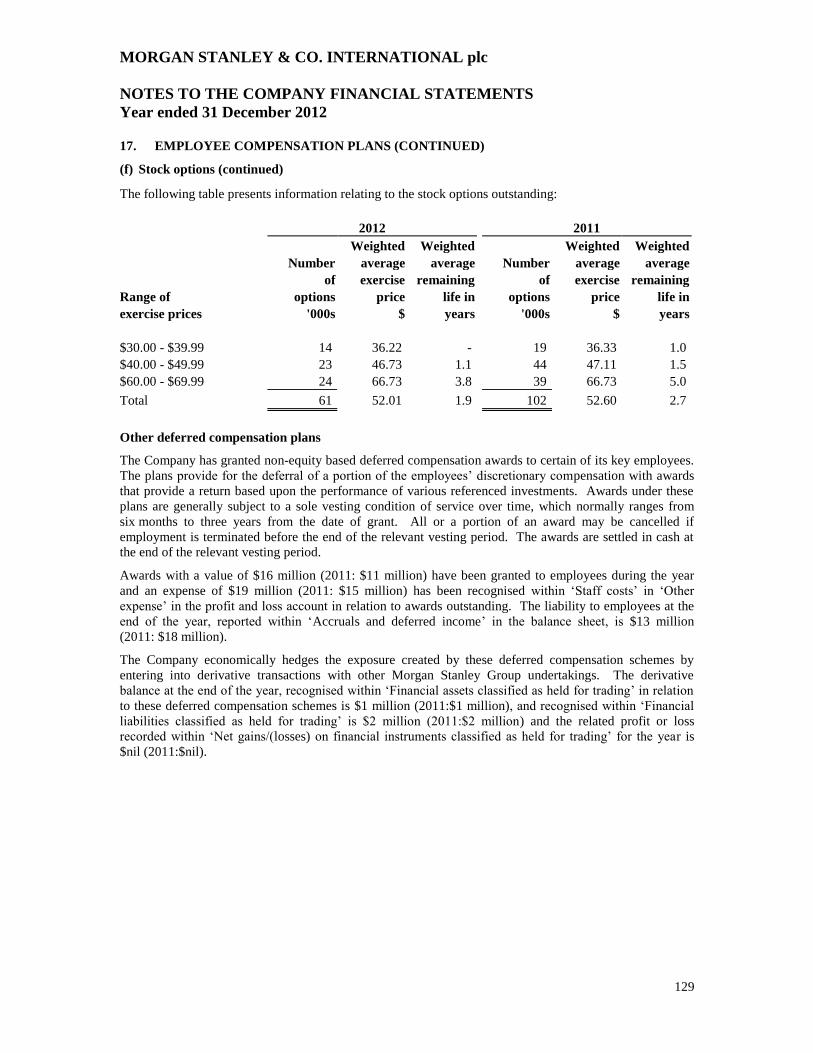
MORGAN STANLEY & CO. INTERNATIONAL plc
NOTES TO THE COMPANY FINANCIAL STATEMENTS
Year ended 31 December 2012
129
17. EMPLOYEE COMPENSATION PLANS (CONTINUED)
(f) Stock options (continued)
The following table presents information relating to the stock options outstanding:
2012 2011
Weighted Weighted Weighted Weighted
Number average average Number average average
of exercise remaining of exercise remaining
Range of options price life in options price life in
exercise prices '000s $ years '000s $ years
$30.00 - $39.99 14 36.22 - 19 36.33 1.0
$40.00 - $49.99 23 46.73 1.1 44 47.11 1.5
$60.00 - $69.99 24 66.73 3.8 39 66.73 5.0
Total 61 52.01 1.9 102 52.60 2.7
Other deferred compensation plans
The Company has granted non-equity based deferred compensation awards to certain of its key employees.
The plans provide for the deferral of a portion of the employees’ discretionary compensation with awards
that provide a return based upon the performance of various referenced investments. Awards under these
plans are generally subject to a sole vesting condition of service over time, which normally ranges from
six months to three years from the date of grant. All or a portion of an award may be cancelled if
employment is terminated before the end of the relevant vesting period. The awards are settled in cash at
the end of the relevant vesting period.
Awards with a value of $16 million (2011: $11 million) have been granted to employees during the year
and an expense of $19 million (2011: $15 million) has been recognised within ‘Staff costs’ in ‘Other
expense’ in the profit and loss account in relation to awards outstanding. The liability to employees at the
end of the year, reported within ‘Accruals and deferred income’ in the balance sheet, is $13 million
(2011: $18 million).
The Company economically hedges the exposure created by these deferred compensation schemes by
entering into derivative transactions with other Morgan Stanley Group undertakings. The derivative
balance at the end of the year, recognised within ‘Financial assets classified as held for trading’ in relation
to these deferred compensation schemes is $1 million (2011:$1 million), and recognised within ‘Financial
liabilities classified as held for trading’ is $2 million (2011:$2 million) and the related profit or loss
recorded within ‘Net gains/(losses) on financial instruments classified as held for trading’ for the year is
$nil (2011:$nil).
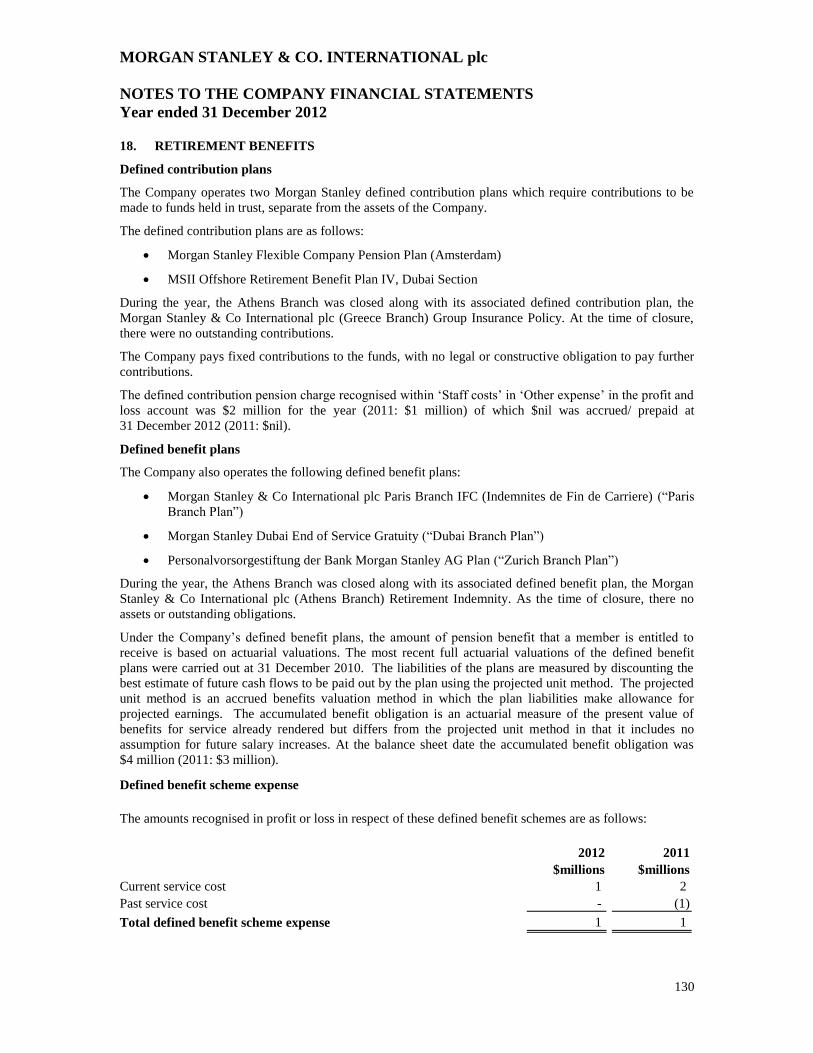
MORGAN STANLEY & CO. INTERNATIONAL plc
NOTES TO THE COMPANY FINANCIAL STATEMENTS
Year ended 31 December 2012
130
18. RETIREMENT BENEFITS
Defined contribution plans
The Company operates two Morgan Stanley defined contribution plans which require contributions to be
made to funds held in trust, separate from the assets of the Company.
The defined contribution plans are as follows:
Morgan Stanley Flexible Company Pension Plan (Amsterdam)
MSII Offshore Retirement Benefit Plan IV, Dubai Section
During the year, the Athens Branch was closed along with its associated defined contribution plan, the
Morgan Stanley & Co International plc (Greece Branch) Group Insurance Policy. At the time of closure,
there were no outstanding contributions.
The Company pays fixed contributions to the funds, with no legal or constructive obligation to pay further
contributions.
The defined contribution pension charge recognised within ‘Staff costs’ in ‘Other expense’ in the profit and
loss account was $2 million for the year (2011: $1 million) of which $nil was accrued/ prepaid at
31 December 2012 (2011: $nil).
Defined benefit plans
The Company also operates the following defined benefit plans:
Morgan Stanley & Co International plc Paris Branch IFC (Indemnites de Fin de Carriere) (“Paris
Branch Plan”)
Morgan Stanley Dubai End of Service Gratuity (“Dubai Branch Plan”)
Personalvorsorgestiftung der Bank Morgan Stanley AG Plan (“Zurich Branch Plan”)
During the year, the Athens Branch was closed along with its associated defined benefit plan, the Morgan
Stanley & Co International plc (Athens Branch) Retirement Indemnity. As the time of closure, there no
assets or outstanding obligations.
Under the Company’s defined benefit plans, the amount of pension benefit that a member is entitled to
receive is based on actuarial valuations. The most recent full actuarial valuations of the defined benefit
plans were carried out at 31 December 2010. The liabilities of the plans are measured by discounting the
best estimate of future cash flows to be paid out by the plan using the projected unit method. The projected
unit method is an accrued benefits valuation method in which the plan liabilities make allowance for
projected earnings. The accumulated benefit obligation is an actuarial measure of the present value of
benefits for service already rendered but differs from the projected unit method in that it includes no
assumption for future salary increases. At the balance sheet date the accumulated benefit obligation was
$4 million (2011: $3 million).
Defined benefit scheme expense
The amounts recognised in profit or loss in respect of these defined benefit schemes are as follows:
2012 2011
$millions $millions
Current service cost 1 2
Past service cost - (1)
Total defined benefit scheme expense 1 1
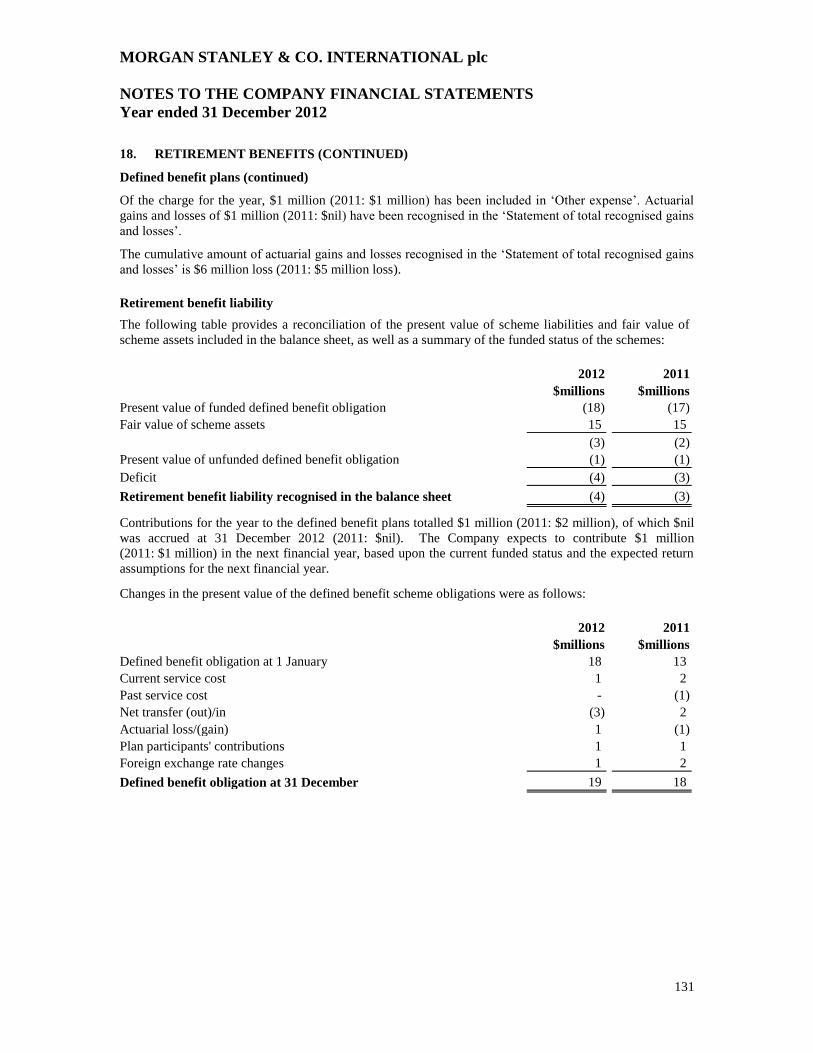
MORGAN STANLEY & CO. INTERNATIONAL plc
NOTES TO THE COMPANY FINANCIAL STATEMENTS
Year ended 31 December 2012
131
18. RETIREMENT BENEFITS (CONTINUED)
Defined benefit plans (continued)
Of the charge for the year, $1 million (2011: $1 million) has been included in ‘Other expense’. Actuarial
gains and losses of $1 million (2011: $nil) have been recognised in the ‘Statement of total recognised gains
and losses’.
The cumulative amount of actuarial gains and losses recognised in the ‘Statement of total recognised gains
and losses’ is $6 million loss (2011: $5 million loss).
Retirement benefit liability
The following table provides a reconciliation of the present value of scheme liabilities and fair value of
scheme assets included in the balance sheet, as well as a summary of the funded status of the schemes:
2012 2011
$millions $millions
Present value of funded defined benefit obligation (18) (17)
Fair value of scheme assets 15 15
(3) (2)
Present value of unfunded defined benefit obligation (1) (1)
Deficit (4) (3)
Retirement benefit liability recognised in the balance sheet (4) (3)
Contributions for the year to the defined benefit plans totalled $1 million (2011: $2 million), of which $nil
was accrued at 31 December 2012 (2011: $nil). The Company expects to contribute $1 million
(2011: $1 million) in the next financial year, based upon the current funded status and the expected return
assumptions for the next financial year.
Changes in the present value of the defined benefit scheme obligations were as follows:
2012 2011
$millions $millions
Defined benefit obligation at 1 January 18 13
Current service cost 1 2
Past service cost - (1)
Net transfer (out)/in (3) 2
Actuarial loss/(gain) 1 (1)
Plan participants' contributions 1 1
Foreign exchange rate changes 1 2
Defined benefit obligation at 31 December 19 18
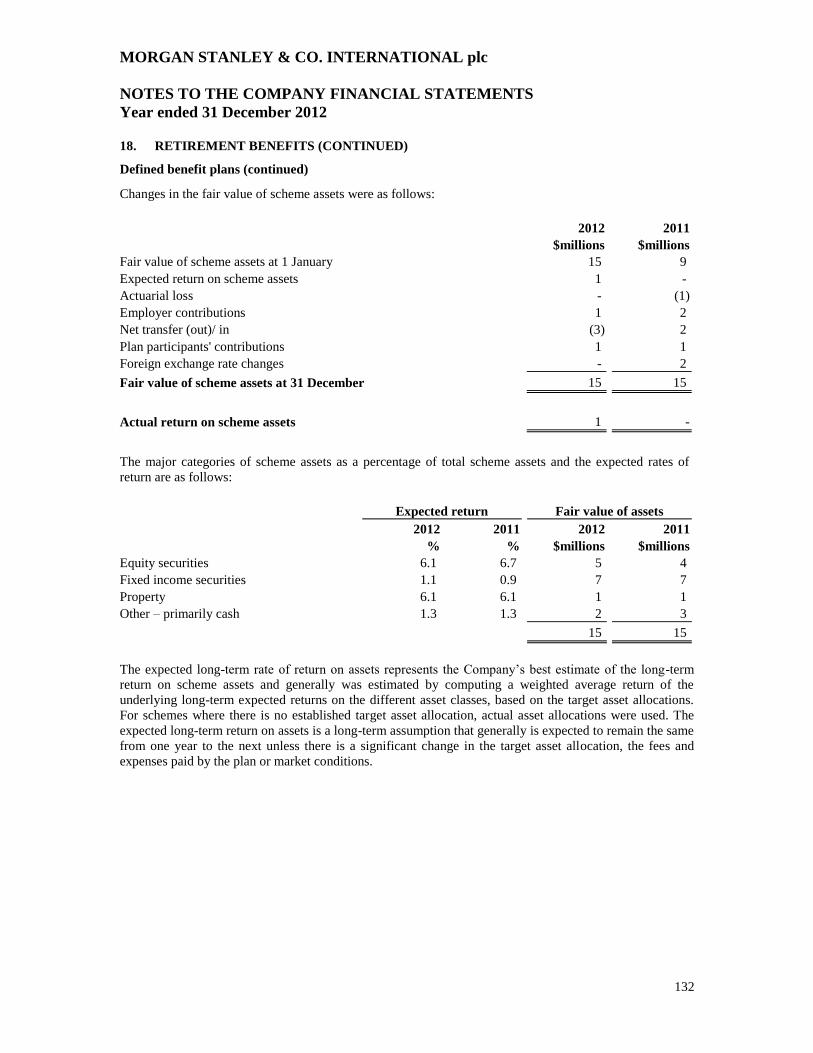
MORGAN STANLEY & CO. INTERNATIONAL plc
NOTES TO THE COMPANY FINANCIAL STATEMENTS
Year ended 31 December 2012
132
18. RETIREMENT BENEFITS (CONTINUED)
Defined benefit plans (continued)
Changes in the fair value of scheme assets were as follows:
2012 2011
$millions $millions
Fair value of scheme assets at 1 January 15 9
Expected return on scheme assets 1 -
Actuarial loss - (1)
Employer contributions 1 2
Net transfer (out)/ in (3) 2
Plan participants' contributions 1 1
Foreign exchange rate changes - 2
Fair value of scheme assets at 31 December 15 15
Actual return on scheme assets 1 -
The major categories of scheme assets as a percentage of total scheme assets and the expected rates of
return are as follows:
Expected return Fair value of assets
2012 2011 2012 2011
% % $millions $millions
Equity securities 6.1 6.7 5 4
Fixed income securities 1.1 0.9 7 7
Property 6.1 6.1 1 1
Other – primarily cash 1.3 1.3 2 3
15 15
The expected long-term rate of return on assets represents the Company’s best estimate of the long-term
return on scheme assets and generally was estimated by computing a weighted average return of the
underlying long-term expected returns on the different asset classes, based on the target asset allocations.
For schemes where there is no established target asset allocation, actual asset allocations were used. The
expected long-term return on assets is a long-term assumption that generally is expected to remain the same
from one year to the next unless there is a significant change in the target asset allocation, the fees and
expenses paid by the plan or market conditions.
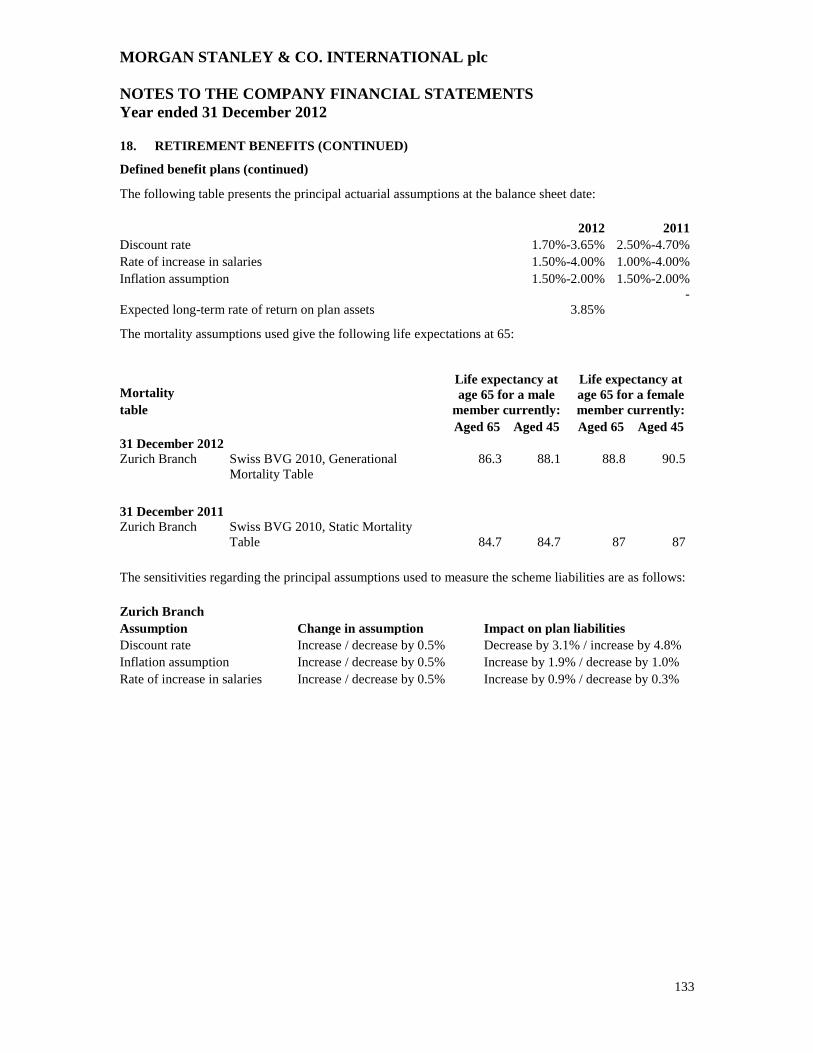
MORGAN STANLEY & CO. INTERNATIONAL plc
NOTES TO THE COMPANY FINANCIAL STATEMENTS
Year ended 31 December 2012
133
18. RETIREMENT BENEFITS (CONTINUED)
Defined benefit plans (continued)
The following table presents the principal actuarial assumptions at the balance sheet date:
2012 2011
Discount rate 1.70%-3.65% 2.50%-4.70%
Rate of increase in salaries 1.50%-4.00% 1.00%-4.00%
Inflation assumption 1.50%-2.00% 1.50%-2.00%
Expected long-term rate of return on plan assets 3.85%
-
The mortality assumptions used give the following life expectations at 65:
Life expectancy at
age 65 for a male
member currently:
Life expectancy at
age 65 for a female
member currently:
Mortality
table
Aged 65 Aged 45 Aged 65 Aged 45
31 December 2012
Zurich Branch Swiss BVG 2010, Generational
Mortality Table
86.3 88.1 88.8 90.5
31 December 2011
Zurich Branch Swiss BVG 2010, Static Mortality
Table 84.7 84.7 87 87
The sensitivities regarding the principal assumptions used to measure the scheme liabilities are as follows:
Zurich Branch
Assumption Change in assumption Impact on plan liabilities
Discount rate Increase / decrease by 0.5% Decrease by 3.1% / increase by 4.8%
Inflation assumption Increase / decrease by 0.5% Increase by 1.9% / decrease by 1.0%
Rate of increase in salaries Increase / decrease by 0.5% Increase by 0.9% / decrease by 0.3%
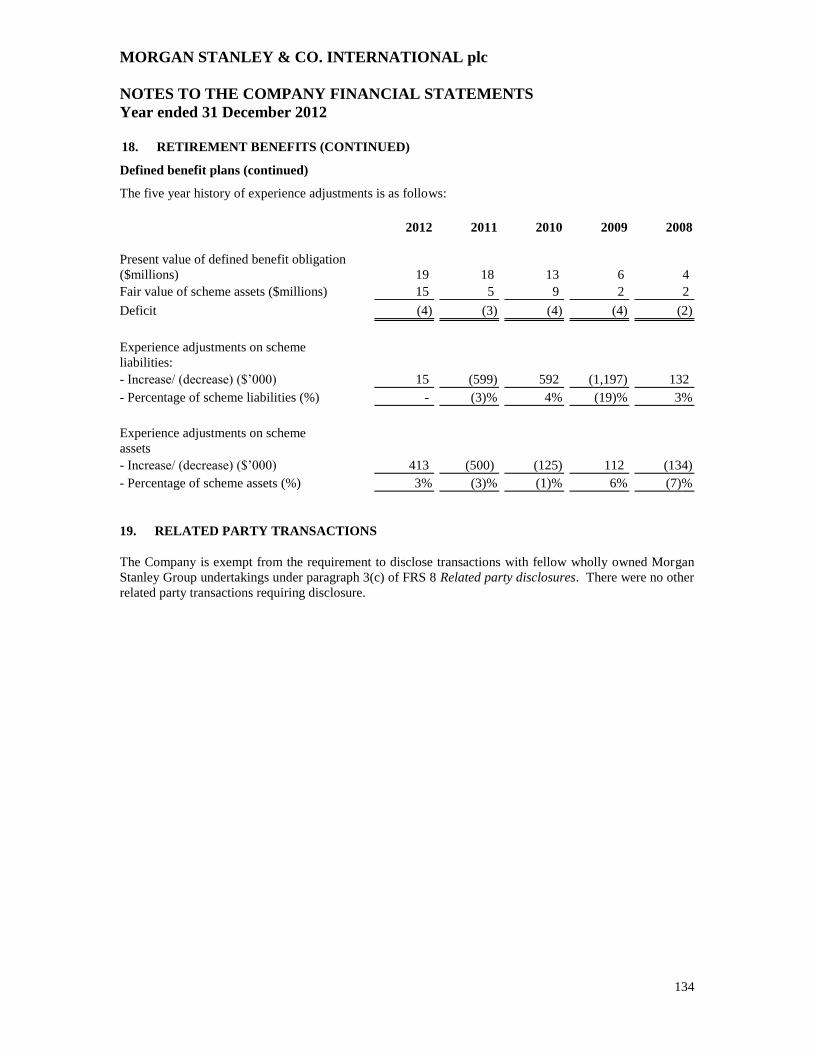
MORGAN STANLEY & CO. INTERNATIONAL plc
NOTES TO THE COMPANY FINANCIAL STATEMENTS
Year ended 31 December 2012
134
18. RETIREMENT BENEFITS (CONTINUED)
Defined benefit plans (continued)
The five year history of experience adjustments is as follows:
2012 2011 2010 2009 2008
Present value of defined benefit obligation
($millions) 19 18 13 6 4
Fair value of scheme assets ($millions) 15 5 9 2 2
Deficit (4) (3) (4) (4) (2)
Experience adjustments on scheme
liabilities:
- Increase/ (decrease) ($’000) 15 (599) 592 (1,197) 132
- Percentage of scheme liabilities (%) - (3)% 4% (19)% 3%
Experience adjustments on scheme
assets
- Increase/ (decrease) ($’000) 413 (500) (125) 112 (134)
- Percentage of scheme assets (%) 3% (3)% (1)% 6% (7)%
19. RELATED PARTY TRANSACTIONS
The Company is exempt from the requirement to disclose transactions with fellow wholly owned Morgan
Stanley Group undertakings under paragraph 3(c) of FRS 8 Related party disclosures. There were no other
related party transactions requiring disclosure.
MORGAN STANLEY & CO. INTERNATIONAL plc
NOTES TO THE COMPANY FINANCIAL STATEMENTS
Year ended 31 December 2012
135
20. POST BALANCE SHEET EVENTS
Contribution of business from Morgan Stanley & Co. Limited
On 1 January 2013, the financial advisory business conducted by another Morgan Stanley Group
undertaking, Morgan Stanley & Co. Limited, was contributed to the Company. This new business is not
expected to have a significant impact on the Company’s results.
FSA Core Group
In accordance with the FSA’s Core Group regulations, on 27 March 2013, the Company entered into a
Deed of Agreement ("the agreement") whereby certain other Morgan Stanley Group undertakings, known
collectively as the Contributing Entities, undertook to provide additional capital resources to the Company
and certain Morgan Stanley Group undertakings registered with the FSA (collectively the ‘Authorised
Firms’) if required in compliance with the regulatory requirements applicable to the members of a core UK
group.
In the event that the capital resources of the Company were to fall below its capital requirements as
determined by the FSA, the agreement gives the Company the unilateral right to demand a contribution of
capital resources from the Contributing Entities, in order to meet its capital requirements.
The amount of the contribution is limited to the Contributing Entities’ surplus capital, to the extent that
such capital is not required to repay that company’s liabilities, as defined in the agreement. The capital
resources may be provided in the form of a subscription and payment for shares or other capital
instruments; to the extent legally permissible through payment of dividends or other distributions of capital
resources or through such other legally permissible means as may be determined to be appropriate.
Entering into the agreement did not result in any adjustments to the Company’s balance sheet at
31 December 2012. The agreement will remain in force while the Company is an Authorised Firm in
Morgan Stanley's UK core group, as determined for regulatory purposes, subject to earlier termination in
certain circumstances.
21. PARENT UNDERTAKINGS
The ultimate parent undertaking and controlling entity and the largest group of which the Company is a
member and for which group financial statements are prepared is Morgan Stanley. Morgan Stanley is
incorporated in the state of Delaware, the United States of America and copies of its financial statements
can be obtained from www.morganstanley.com/investorrelations.
The Company’s immediate controlling party is Morgan Stanley UK Group which is registered in England
and Wales. Copies of its financial statements can be obtained from the Registrar of Companies for England
and Wales, Companies House, Crown Way, Cardiff CF14 3UZ.
The parent undertaking of the smallest group of companies for which group financial statements are drawn
up and of which the Company is a member is Morgan Stanley International Limited, which is registered in
England and Wales. Copies of its financial statements can be obtained from the Registrar of Companies for
England and Wales, Companies House, Crown Way, Cardiff CF14 3UZ.


