Registered number: 2068222 Registered office: 25 Cabot Square Canary Wharf London United Kingdom E14 4QA MORGAN STANLEY & CO. INTERNATIONAL plc Report and financial statements 31 December 2015
Transcript
Registered number: 2068222
Registered office: 25 Cabot Square Canary Wharf London United Kingdom E14 4QA
MORGAN STANLEY & CO. INTERNATIONAL plc
Report and financial statements
31 December 2015
MORGAN STANLEY & CO. INTERNATIONAL plc
CONTENTS PAGE Strategic report 1 Directors' report 15 Independent auditor's report 19 Consolidated income statement 21 Consolidated statement of comprehensive income 22 Consolidated statement of changes in equity 23 Consolidated statement of financial position 24 Consolidated statement of cash flows 25 Notes to the consolidated financial statements 26 Company statement of comprehensive income 118 Company statement of changes in equity 119 Company statement of financial position 120 Notes to the company financial statements 121 Appendix to the financial statements 159
MORGAN STANLEY & CO. INTERNATIONAL plc STRATEGIC REPORT
1
The Directors present their Strategic report for Morgan Stanley & Co. International plc (the “Company”) and all of its subsidiary undertakings (together “the Group”) for the year ended 31 December 2015.
PRINCIPAL ACTIVITY
The principal activity of the Group is the provision of financial services to corporations, governments and financial institutions.
The Company operates branches in the Dubai International Financial Centre, France, the Netherlands, Poland, the Qatar Financial Centre, South Korea and Switzerland.
There have not been any changes in the Group’s principal activity during the year and no significant change in the Group’s principal activity is expected. During the year the Institutional Securities business of Morgan Stanley Securities Limited (“MSSL”), a Morgan Stanley Group undertaking incorporated in the United Kingdom (“UK”), was transferred to the Group, with completion on 31 May 2015. This transferred business has had a positive impact on the Group’s net profit after tax for the year. Further details are provided within the business review section below.
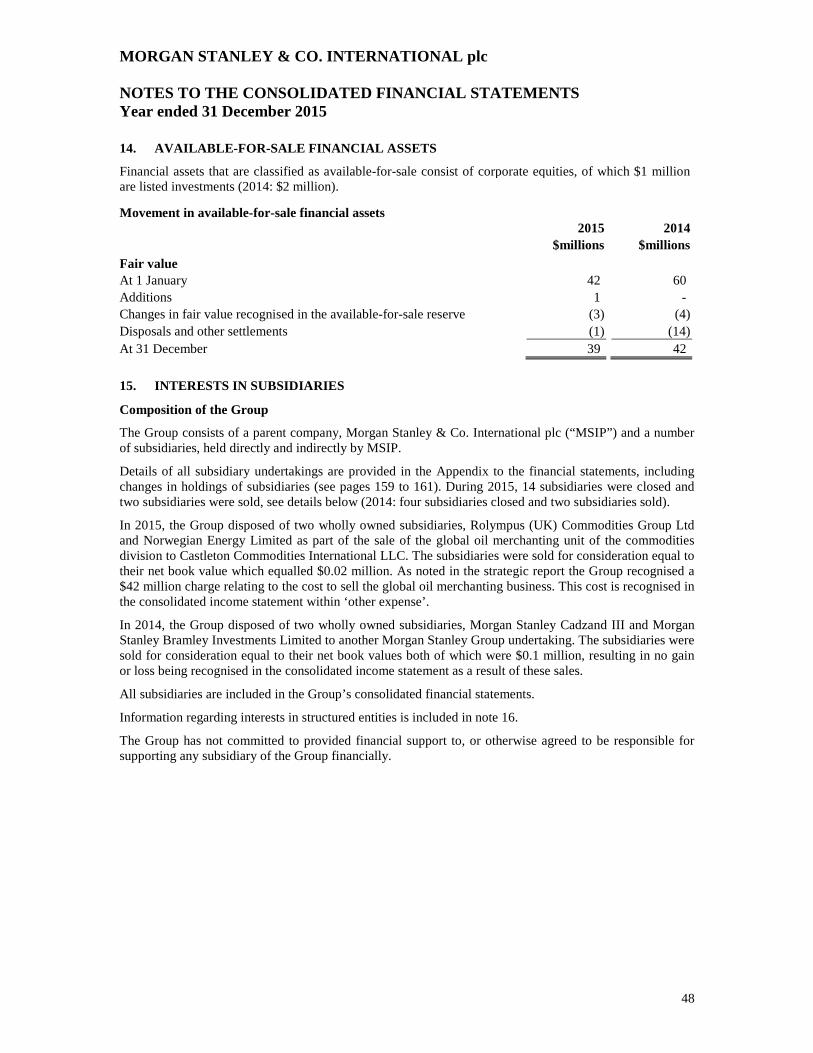
In addition, on 1 November 2015, Morgan Stanley completed the sale of the global oil merchanting unit of its commodities division to Castleton Commodities International LLC. As part of this transaction the oil merchanting unit operated within the Group was sold, resulting in the Group recognising a $42 million charge relating to the cost to sell the business (see note 15).
The Group’s ultimate parent undertaking and controlling entity is Morgan Stanley, which, together with the Group and Morgan Stanley’s other subsidiary undertakings, form the “Morgan Stanley Group”.
The Morgan Stanley Group is a global financial services firm that maintains significant market positions in each of its business segments: Institutional Securities, Wealth Management and Investment Management. The Morgan Stanley Group provides a wide variety of products and services to a large and diversified group of clients and customers, including corporations, governments, financial institutions and individuals. As a key contributor to the execution of the Morgan Stanley Group’s Institutional Securities strategy in Europe, the Middle East and Africa (“EMEA”), the Group provides capital raising; financial advisory services, including advice on mergers and acquisitions, restructurings, real estate and project finance; corporate lending; sales, trading, financing and market-making activities in equity and fixed income securities and related products, including foreign exchange and commodities; and investment activities.
REGULATION
The Company is authorised by the Prudential Regulation Authority (“PRA”) and regulated by the Financial Conduct Authority (“FCA”) and the PRA. In addition, the Company is a registered swap dealer and is regulated by the US Commodity Futures Trading Commission.
BUSINESS REVIEW
Global market and economic conditions
During the first half of 2015, global growth was supported by a rebound in the US and firmer growth in the eurozone and the UK economies, partially offset by sluggishness in major emerging market economies. During the second half of 2015, global growth slowed as a result of the continued sluggishness of emerging market economies, declines in energy prices, and the slowdown of China’s economic growth. Global real gross domestic product growth decelerated in 2015 from 2014. Growth in emerging market economies slowed for a fourth straight year, while growth in developed market economies was steady but sluggish. Notable trends during the year included falling oil and other commodity prices, an appreciating US dollar weighing on global trade flows and increasing policy challenges in a number of major emerging market economies, most notably China. The US Federal Reserve announced a rate increase in December 2015 based on cumulative labour market progress and rising confidence in achieving its inflation target. However, with Europe and Japan still struggling and China decelerating, the European Central Bank (“ECB”), the Bank of Japan and the People’s Bank of China acted to continue their targeted monetary policy easing measures.
MORGAN STANLEY & CO. INTERNATIONAL plc STRATEGIC REPORT
2
BUSINESS REVIEW (CONTINUED)
Global market and economic conditions (continued)
Subsequent to 31 December 2015, the Bank of Japan announced a program of Quantitative and Qualitative Monetary Easing (“QE”) with a negative interest rate that introduced a three tier policy rate system for bank reserves with a low rate of negative 0.1%. Additionally, in March 2016 the ECB announced a further QE program and reduced interest rates with the deposit facility rate falling from negative 0.3% to negative 0.4% and the benchmark interest rate falling from 0.05% to zero%.
Overview of 2015 Financial Results
The consolidated income statement for the year is set out on page 21. The Group reported a profit after tax for the year of $401 million, compared to a loss after tax of $713 million for the year ended 31 December 2014 as a result of increased revenues and reduced expenses.
The Group’s revenues are best reviewed across the aggregate of ‘Net gains on financial instruments classified as held for trading’, ‘Net gains on financial instruments designated at fair value through profit or loss’, ‘Net gains on available-for-sale financial assets’, ‘Interest income’, ‘Interest expense’ and ‘Other income’ (“aggregate revenues”). Aggregate revenues for the year increased by 15% to $4,451 million compared to $3,881 million in 2014.
The increase in aggregate revenues was primarily driven by increased sales and trading revenues in both the equities and fixed income and commodities divisions.
Equity sales and trading revenues increased during the year compared to 2014 partially due to the transfer of the MSSL business to the Group during the first half of the year resulting in increased cash equities and prime brokerage revenues. Prime brokerage revenues further strengthened as a result of increased client activity.
Fixed income and commodities sales and trading revenues increased during the year compared to 2014 with key drivers of the increase being a charge of $273 million in 2014 related to the implementation of Funding Valuation Adjustments (“FVA”) and increased oil related commodities revenues. Interest rate product revenues also increased during the year due to increased client activity and volatility, resulting from QE measures announced by the ECB in January 2015, which improved the operating environment. These increases were partially offset by reduced credit and securitised products revenues.
Aggregate revenues for the year exclude net day one gains of $43 million (2014: $26 million) not recognised upon initial recognition of financial instruments measured at fair value where valuation techniques include unobservable market data (see note 32 (e)).
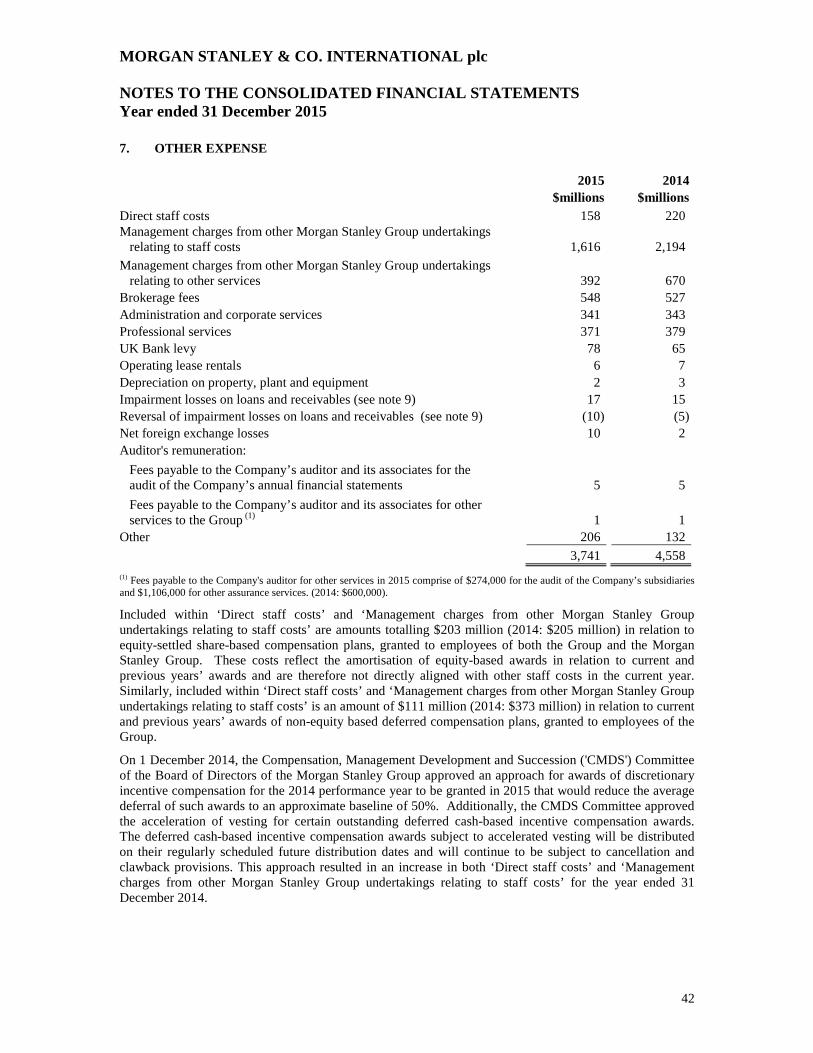
Other expense decreased by 18% from $4,558 million in 2014 to $3,741 million in 2015 split between decreases in staff related costs of 27% from $2,414 million in 2014 to $1,774 million in 2015 and in non-staff related expenses of 8% from $2,144 million in 2014 to $1,967 million in 2015.
The decrease in both staff costs borne directly by the Group and through management recharges from other Group undertakings was driven by the impact in 2014 of a decrease in the average deferral rate for discretionary incentive compensation awards and the acceleration of vesting for certain outstanding cash based incentive compensation awards (see note 7).
The decrease in non-staff related expenses is mainly due to reduced ‘management charges from other Morgan Stanley Group undertakings related to other services’ as a result of certain UK incorporated Morgan Stanley Group undertakings implementing the new UK accounting framework and due to adjustments relating to prior periods made in 2014 which resulted in higher recharged expenses in 2014.
Partially offsetting these drivers of reduced expense in 2015 was the impact of transferring MSSL’s business to the Group in the first half of the year, which increased the expense base of the Group.
MORGAN STANLEY & CO. INTERNATIONAL plc STRATEGIC REPORT
3
BUSINESS REVIEW (CONTINUED)
Overview of 2015 Financial Results (continued)
The Group incurred a tax expense of $309 million (2014: $36 million). This represents an effective tax rate of 43.5%, which is higher than the average standard rate of UK corporation tax of 20.25%. A key driver of the higher effective tax rate is the impact of adjustments in respect of prior years, as shown in note 8. These prior year adjustments include a provision against certain withholding tax reclaim balances.
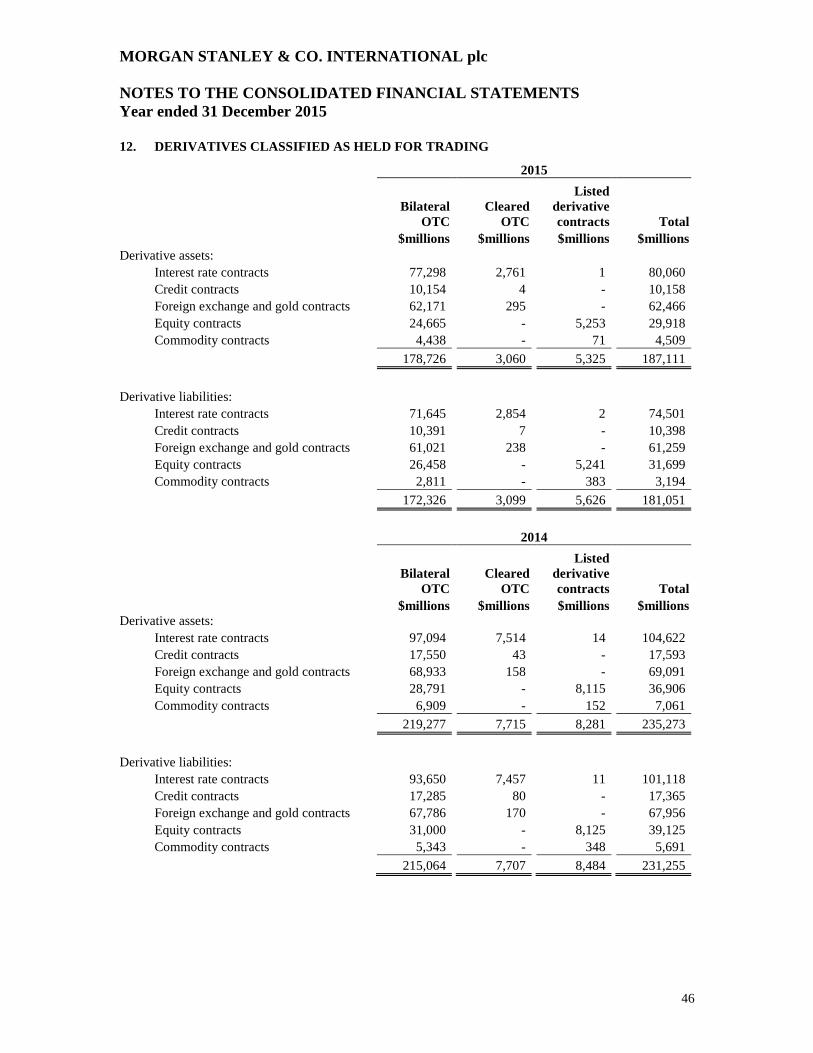
The Group’s total assets and liabilities decreased by $54,442 million and $54,781 million respectively, a decrease of 12% and 13% respectively as at 31 December 2015 when compared to the total assets and total liabilities as at 31 December 2014. The decrease in total assets and total liabilities is driven by decreases in financial assets classified as held for trading of $49,125 million and in financial liabilities classified as held for trading of $41,322 million and a decrease in securities sold under agreements to repurchase of $7,900 million. The decreases in financial assets classified as held for trading and financial liabilities classified as held for trading were mainly due to decreases in derivative assets and liabilities. Fixed income derivative assets and liabilities fell by $41,174 million and $42,778 million respectively with the biggest decrease being with respect to interest rate contracts, which fell mainly due to interest rate movements and efficiencies in the management of intercompany balances (see note 12).
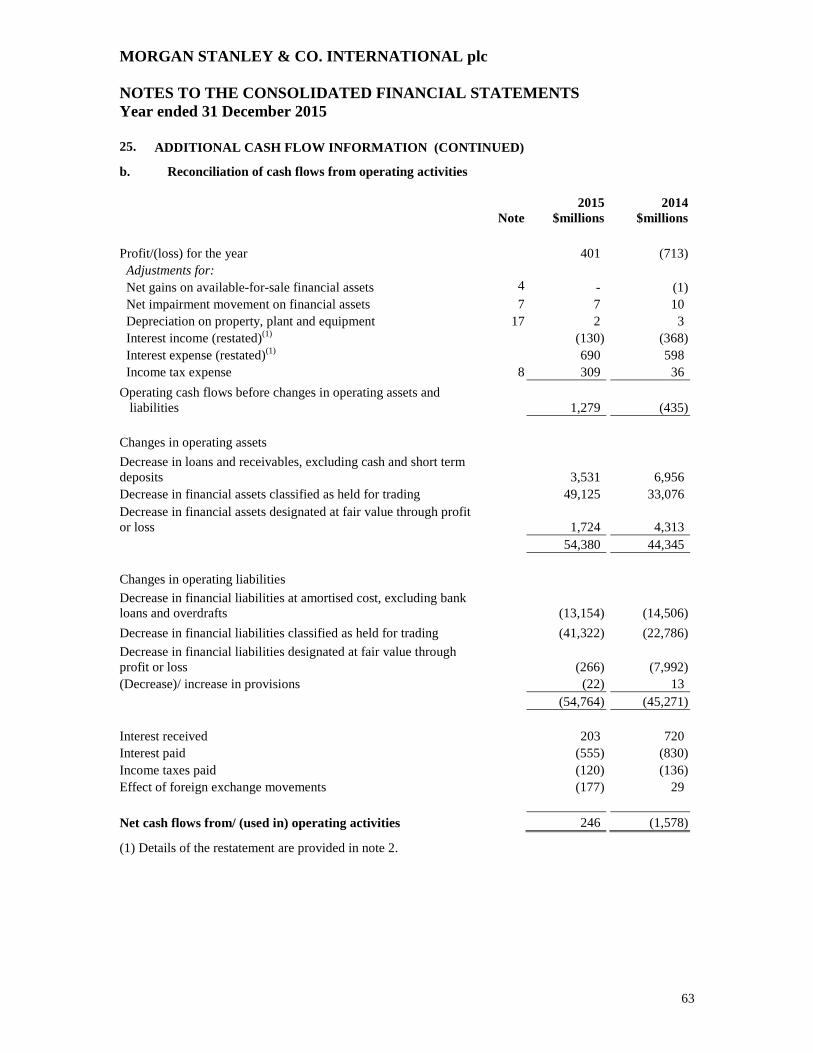
The consolidated statement of cash flows presented on page 25 shows a net increase in cash of $96 million during the year (2014: net decrease of $491 million). Net cash inflows from operating activities were $246 million (2014: $1,578 million net cash outflow), offset by net cash outflows from financing activities of $149 million (2014: $1,074 million net cash inflow).
Key performance indicators
The Board of directors monitors the results of the Group by reference to a range of performance and risk based metrics, including, but not limited to, the following:
Profitability metrics
Operating margin: The Group’s operating margin (defined as net profit/ loss before tax as a percentage of aggregate revenues) was 16.0% (2014: negative 17.4%).
Return on equity: The Group’s return on equity (profit/ loss for the year as a percentage of total equity at the beginning of the year) was 2.5% (2014: negative 4.6%)
Return on assets: The Group’s return on assets (profit/ loss for the year as a percentage of total assets at the beginning of the year) was 0.1% (2014: negative 0.2%).
Balance sheet assets
Total assets: Total assets of the Group continue to be closely monitored. The Group’s total assets, as disclosed on page 24, decreased by 12% to $394 billion at 31 December 2015.
Capital
The Group monitors its, and the Company’s capital position against a range of key metrics including the following:
Tier 1 regulatory capital: The Company’s Tier 1 capital as calculated in accordance with PRA rules which are based on the fourth European Union (“EU”) Capital Requirements Directive and EU Capital Requirements Regulation (“CRR”), collectively known as “CRD IV”, was $15,255 million (2014: $14,795 million) and its Tier 1 capital ratio was 15.5% (2014: 11.3%), which is in excess of the required minimum regulatory ratio. Tier 1 capital ratio is defined as Tier 1 capital divided by risk-weighted assets (“RWAs”).
MORGAN STANLEY & CO. INTERNATIONAL plc STRATEGIC REPORT
4
BUSINESS REVIEW (CONTINUED)
Key performance indicators (continued)
Capital (continued)
Leverage ratio: CRD IV, as amended by the European Commission Delegated Act, introduced a new minimum leverage ratio, which compares Tier 1 capital to a measure of leverage exposure. Leverage exposure is defined as the sum of adjusted assets less Tier 1 capital deductions plus off-balance sheet exposures. The minimum leverage ratio becomes effective for the Company on 1 January 2018, although public disclosure requirements are effective for reporting periods from 1 January 2015. As at 31 December 2015, the Company had a leverage ratio of 4.35%, which is above the proposed required regulatory ratio of 3%.
RISK MANAGEMENT
Risk is an inherent part of the Group’s business activity. The Group seeks to identify, assess, monitor and manage each of the various types of risk involved in its business activities, in accordance with defined policies and procedures. The Group has developed its own risk management policy framework, which leverages the risk management policies and procedures of the Morgan Stanley Group, and which include escalation to the Group’s Board of directors and to appropriate senior management personnel of the Group as well as oversight through the Group’s Board of directors and through a dedicated Risk Committee of non-executive directors that reports to the Board of Morgan Stanley International Limited (“MSI”), the Company’s ultimate UK parent undertaking.
Note 28 to the consolidated financial statements provides more detailed qualitative and quantitative disclosures about the Group’s management of and exposure to financial risks.
Set out below is an overview of the Group’s policies for the management of financial risk and other significant business risks.
Market risk
Market risk refers to the risk of losses for a position or portfolio due to changes in rates, foreign exchange, equities, implied volatilities, correlations or other market factors.
The Group manages the market risk associated with its trading activities at both a trading division and an individual product level, and includes consideration of market risk at the legal entity level.
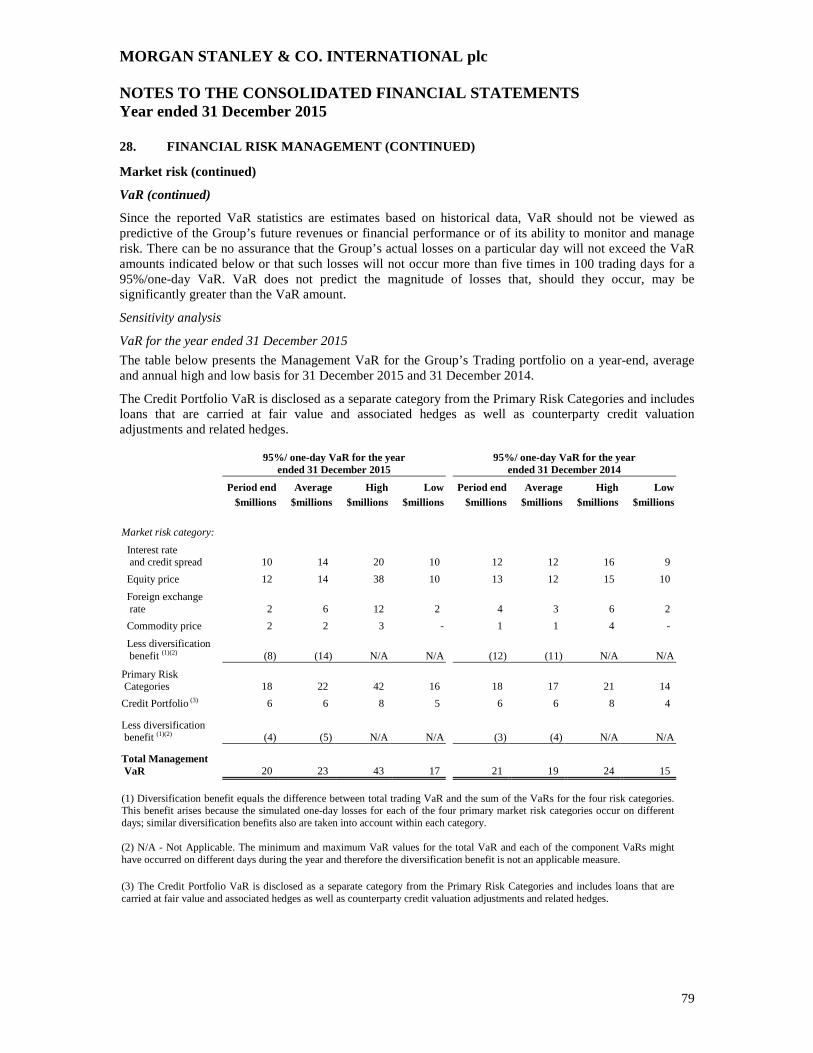
The average VaR for the Primary Risk Categories for 2015 was $22 million compared to $17 million for 2014, with the increase being mainly due to increased exposure to interest rates along with equity price risk. The average Credit Portfolio VaR for 2015 was $6 million, unchanged compared to 2014. The average total Management VaR for 2015 was $23 million, compared to $19 million for 2014.
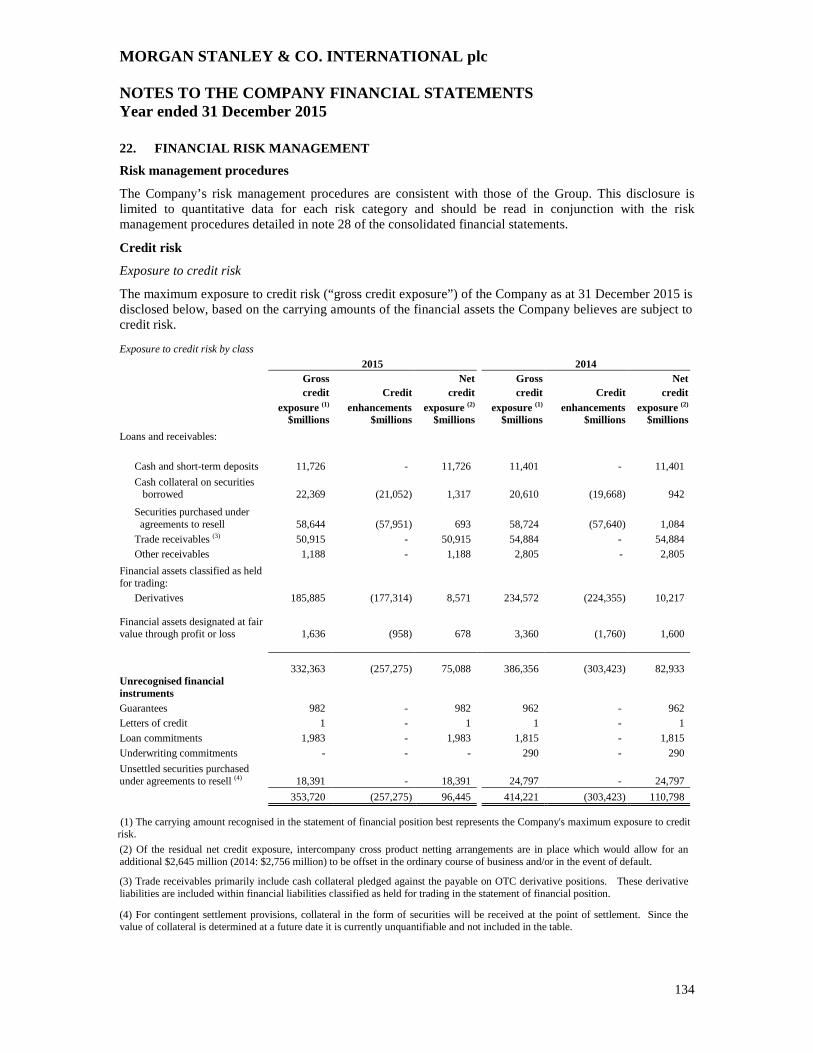
Credit risk
Credit risk refers to the risk of loss arising when a borrower, counterparty or issuer does not meet its financial obligations to the Group. Credit risk includes country risk, which is further described below. The Group primarily incurs credit risk exposure to institutions and sophisticated investors.
The Group leverages the credit risk management policies and procedures of the Morgan Stanley Group to establish the framework for ensuring transparency of material credit risks, ensuring compliance with established limits and escalation of risk concentrations to appropriate senior management.
MORGAN STANLEY & CO. INTERNATIONAL plc STRATEGIC REPORT
5
RISK MANAGEMENT (CONTINUED)
Credit risk (continued)
Country risk exposure
Country risk exposure is the risk that events in, or affecting, a foreign country might adversely affect the Group. “Foreign country” means any country other than the UK. Sovereign Risk, by contrast, is the risk that a government will be unwilling or unable to meet its debt obligations, or renege on the debt it guarantees. Sovereign risk is single-name risk for a sovereign government, its agencies and guaranteed entities.
Country risk exposure is measured in accordance with the Group’s internal risk management standards and includes obligations from sovereign governments, corporations, clearing houses and financial institutions. The Group actively manages country risk exposure through a comprehensive risk management framework that combines credit and market fundamentals and allows the Group to effectively identify, monitor and limit country risk. Country risk exposure before and after hedges is monitored and managed.
The Group’s obligor credit evaluation process may also identify indirect exposures whereby an obligor has vulnerability or exposure to another country or jurisdiction. Examples of indirect exposures include mutual funds that invest in a single country, offshore companies whose assets reside in another country to that of the offshore jurisdiction and finance company subsidiaries of corporations. Indirect exposures identified through the credit evaluation process may result in a reclassification of country risk.
The Group conducts periodic stress testing that seeks to measure the impact of the Group’s credit and market exposures of shocks stemming from negative economic or political scenarios. When deemed appropriate by the Group’s risk managers, the stress test scenarios include possible contagion effects. Second order risks such as the impact for core European banks of their exposures in the Peripheral European countries (Greece, Ireland, Italy, Portugal and Spain) may also be considered. The Group also conducts legal and documentation analysis of its exposures to obligors in Peripheral jurisdictions to identify the risk that such exposures could be redenominated into new currencies or subject to capital controls in the case of a country exit from the Eurozone. This analysis, and the results of the stress tests, may result in the amendment of limits or exposure mitigation.
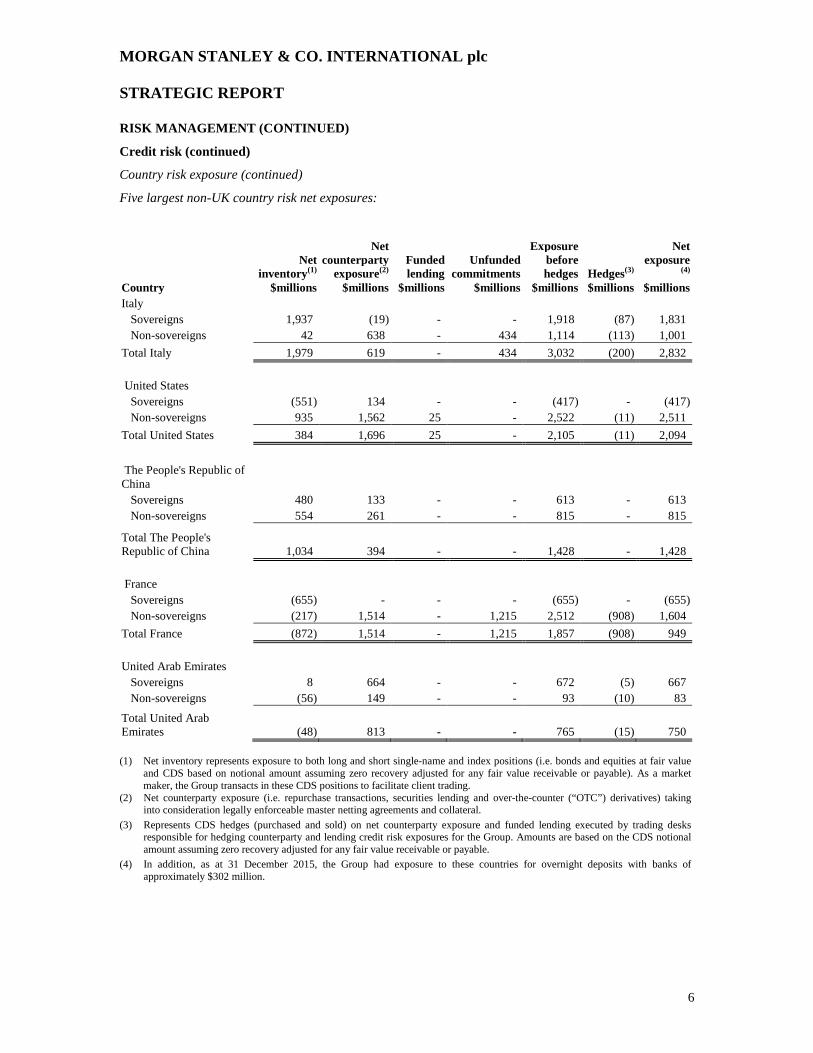
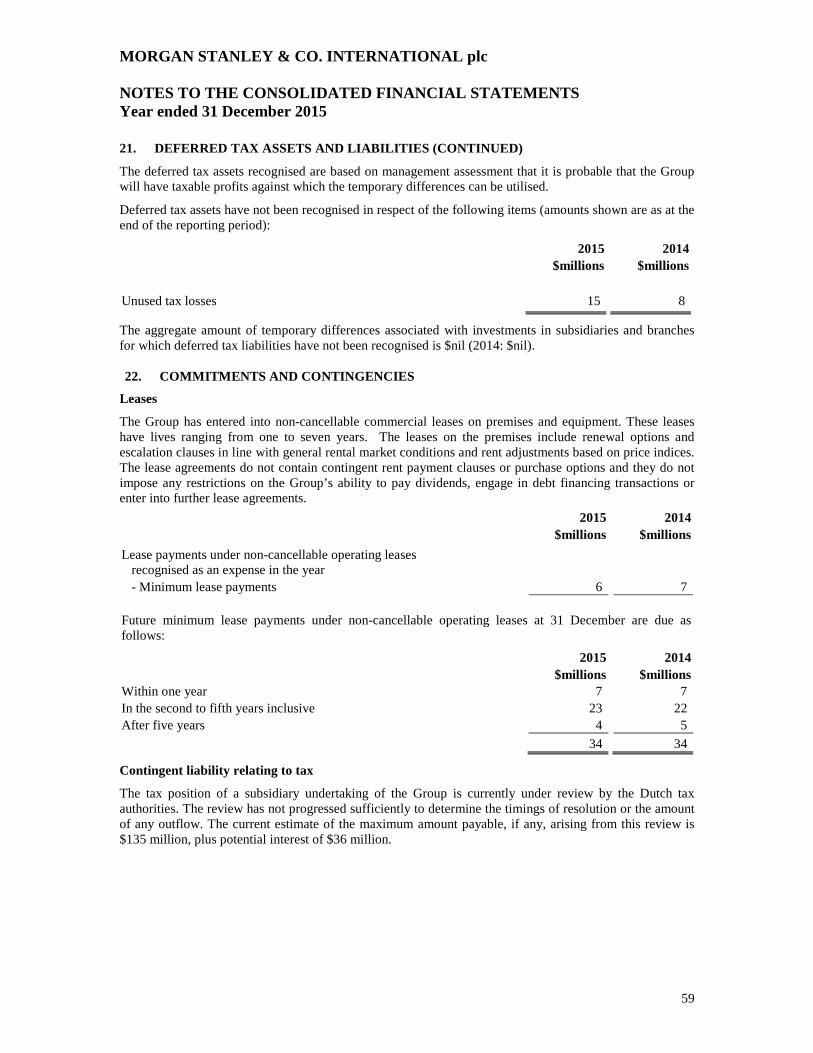
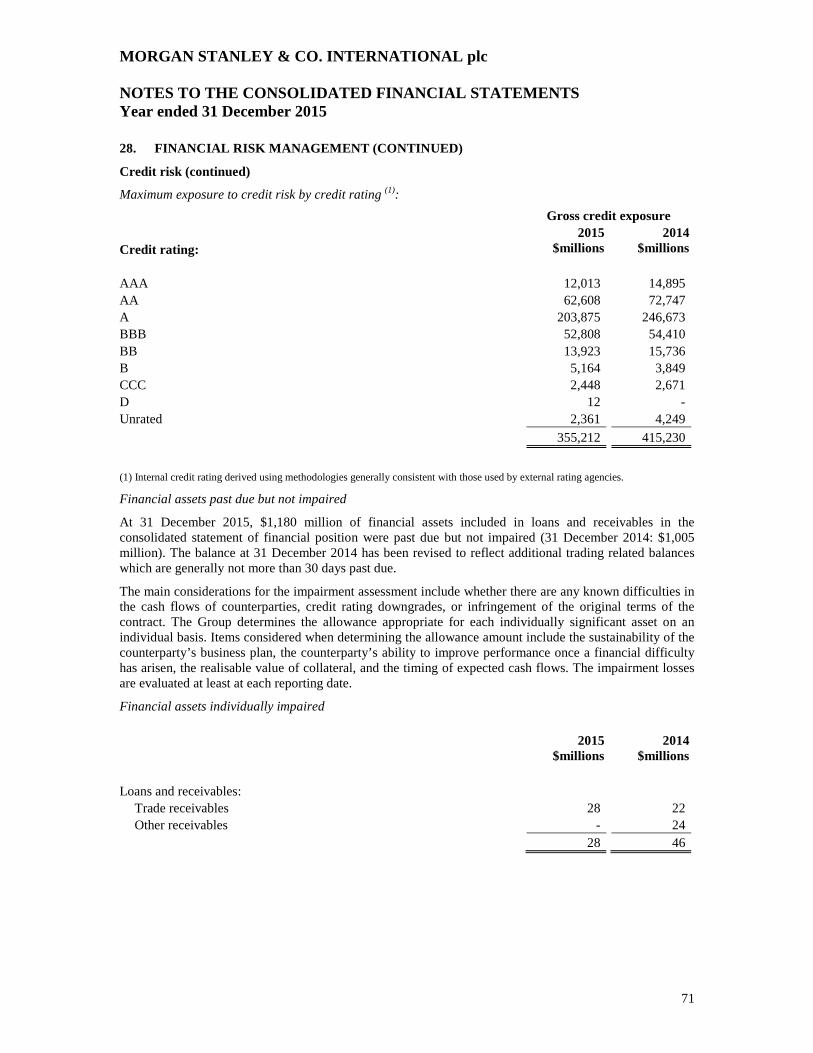
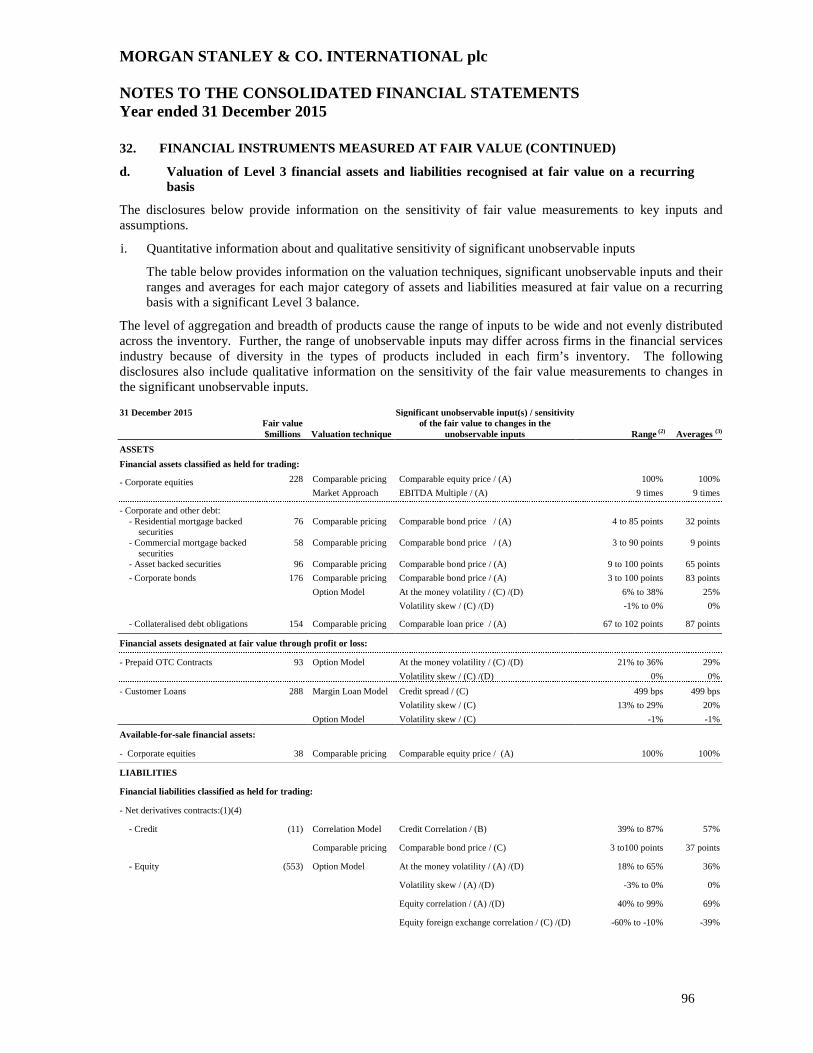
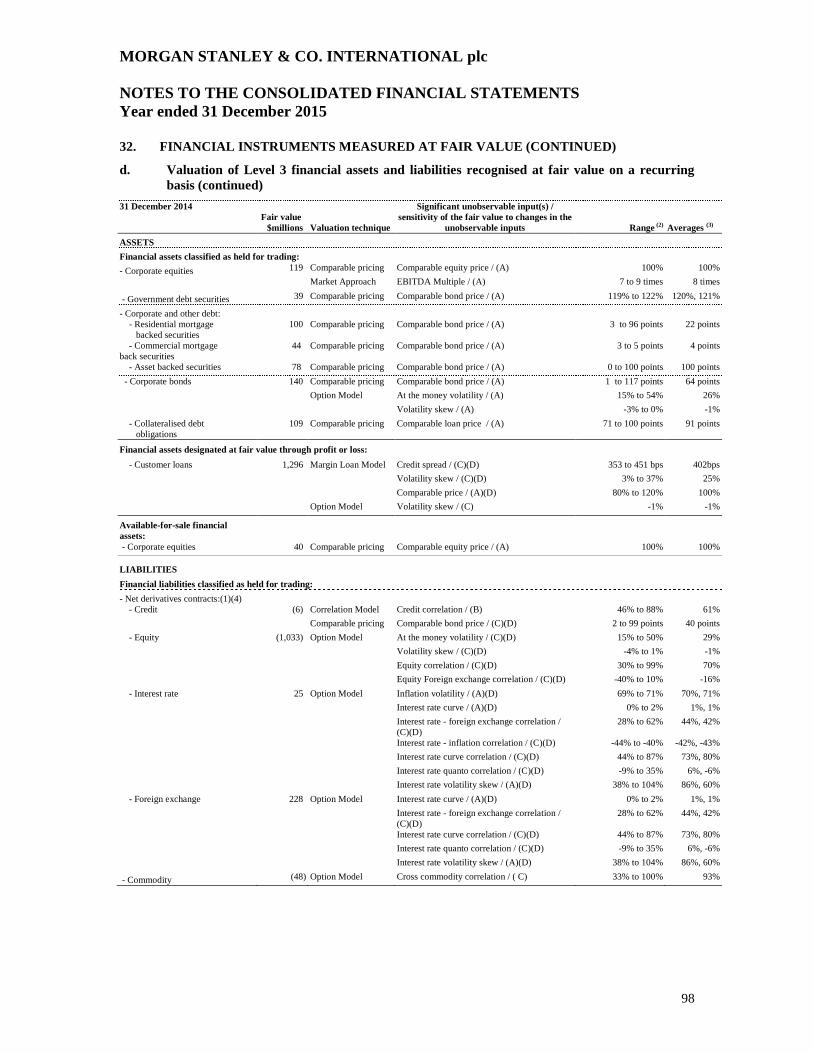
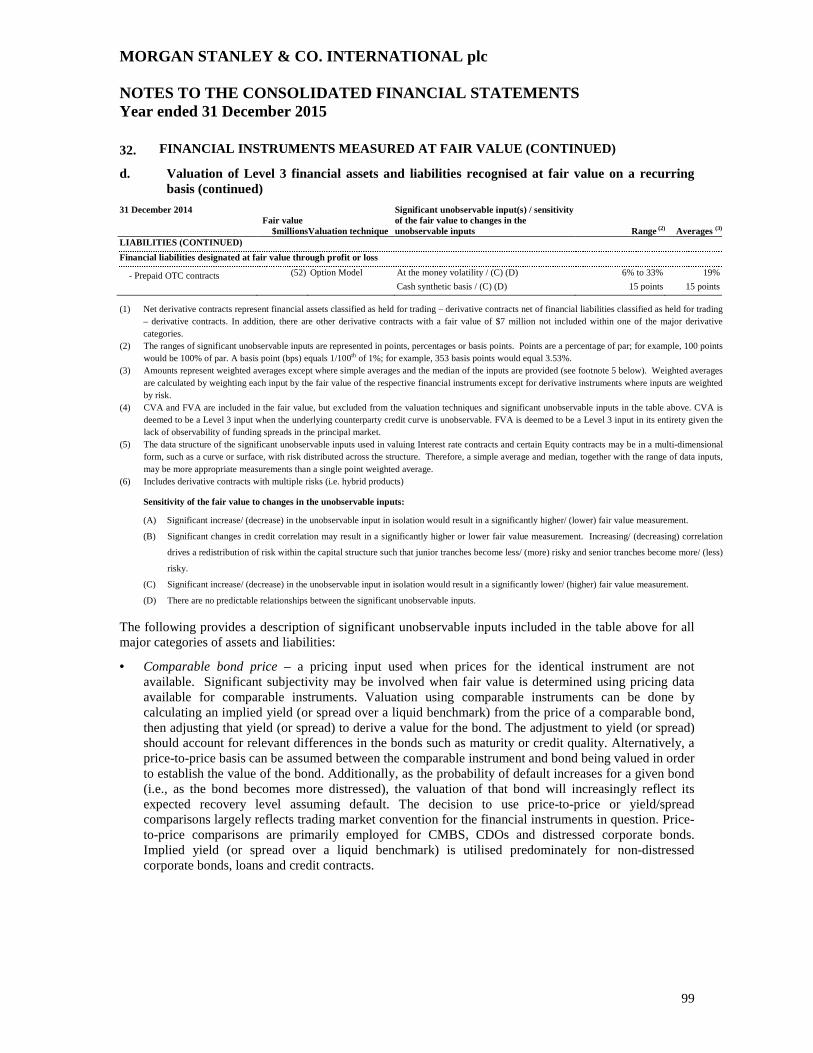
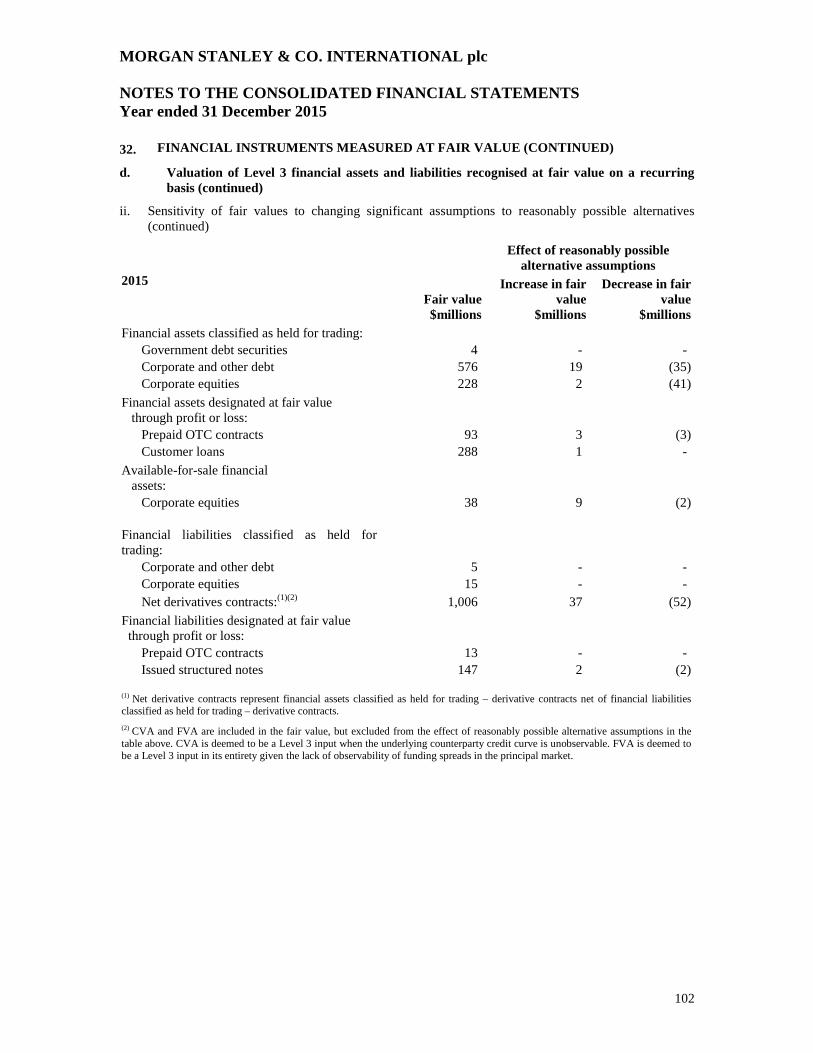
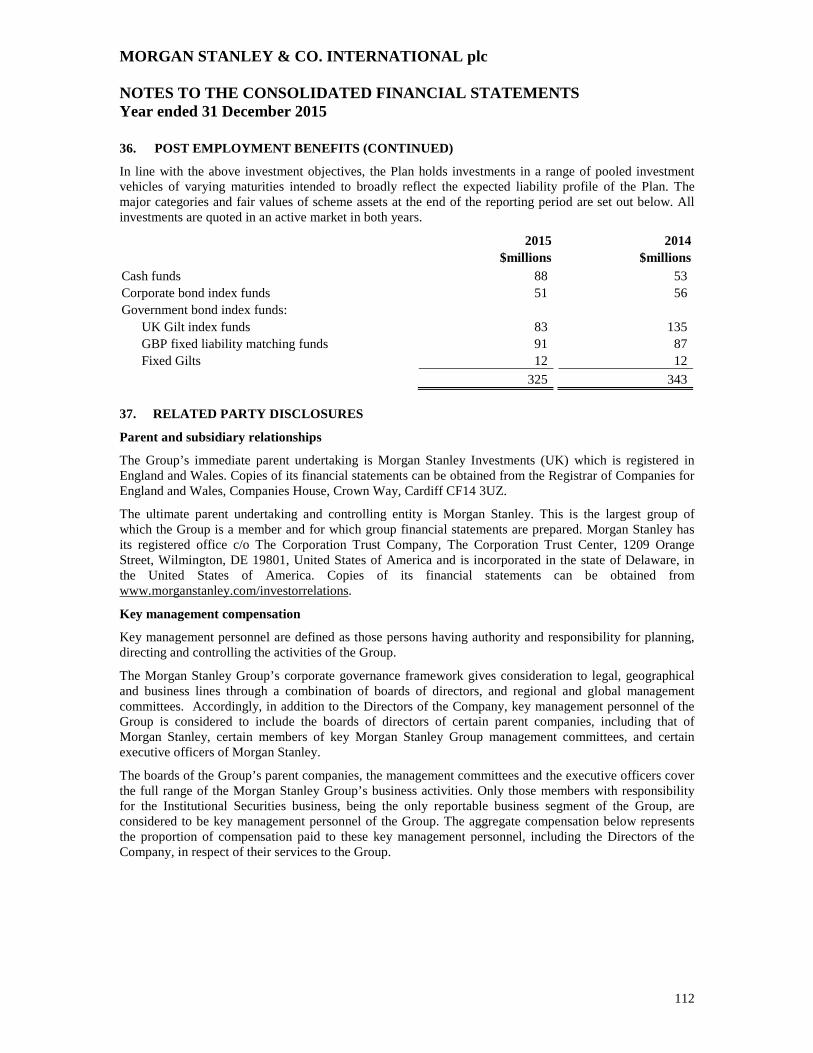
The Group’s sovereign exposures consist of financial instruments entered into with sovereign and local governments. Its non-sovereign exposures consist of exposures to primarily corporations and financial institutions. The table below shows the Group’s five largest non-UK country net exposures. Exposure to other Morgan Stanley Group undertakings has been excluded from this table.
Each reference entity within an index is allocated to that reference entity’s country of risk. Index exposures are allocated to the underlying reference entities in proportion to the notional weighting of each reference entity in the index, adjusted for any fair value receivable/payable for that reference entity. Where credit risk crosses multiple jurisdictions, for example, a credit default swap (“CDS”) purchased from an issuer in a specific country that references bonds issued by an entity in a different country, the fair value of the CDS is reflected in the Net counterparty exposure column based on the country of the CDS issuer. Further, the notional amount of the CDS, adjusted for the fair value of the receivable/ payable, is reflected in the Net inventory column, based on the country of the underlying reference entity.
MORGAN STANLEY & CO. INTERNATIONAL plc STRATEGIC REPORT
United Arab Emirates Sovereigns 8 664 - - 672 (5) 667 Non-sovereigns (56) 149 - - 93 (10) 83
Total United Arab Emirates (48) 813 - - 765 (15) 750
(1) Net inventory represents exposure to both long and short single-name and index positions (i.e. bonds and equities at fair value and CDS based on notional amount assuming zero recovery adjusted for any fair value receivable or payable). As a market maker, the Group transacts in these CDS positions to facilitate client trading.
(2) Net counterparty exposure (i.e. repurchase transactions, securities lending and over-the-counter (“OTC”) derivatives) taking into consideration legally enforceable master netting agreements and collateral.
(3) Represents CDS hedges (purchased and sold) on net counterparty exposure and funded lending executed by trading desks responsible for hedging counterparty and lending credit risk exposures for the Group. Amounts are based on the CDS notional amount assuming zero recovery adjusted for any fair value receivable or payable.
(4) In addition, as at 31 December 2015, the Group had exposure to these countries for overnight deposits with banks of approximately $302 million.
MORGAN STANLEY & CO. INTERNATIONAL plc STRATEGIC REPORT
7
RISK MANAGEMENT (CONTINUED)
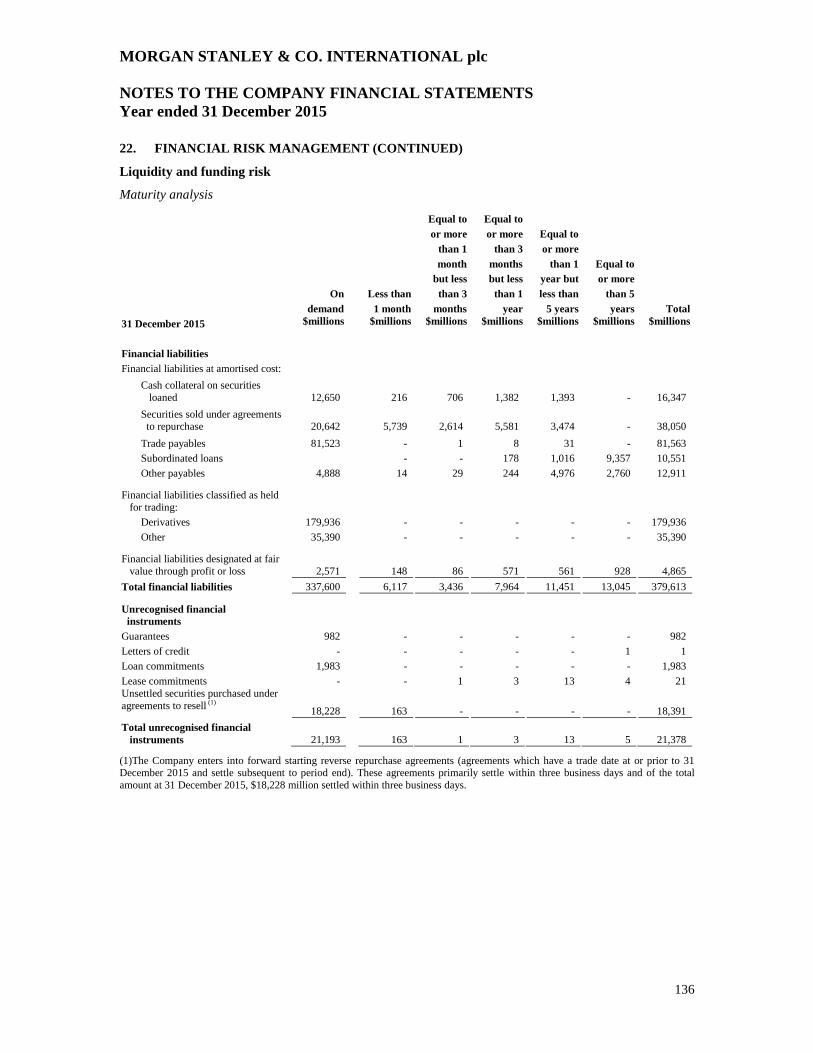
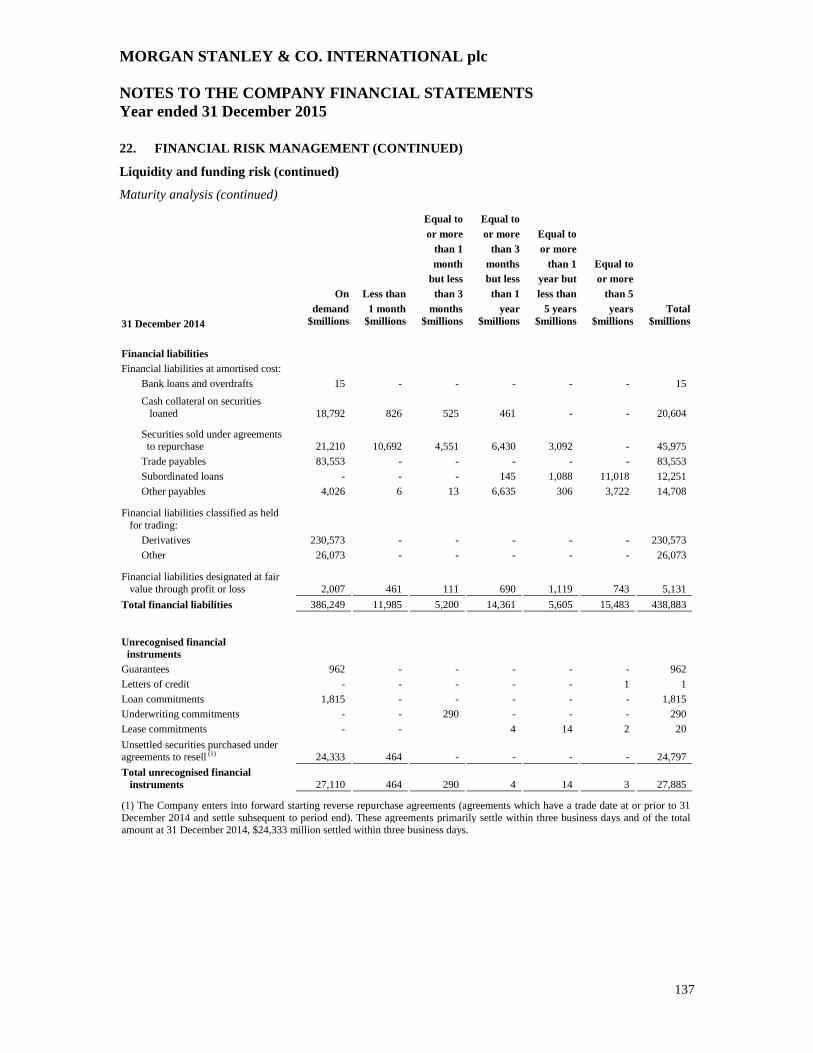
Liquidity and funding risk
Liquidity and funding risk refers to the risk that the Group will be unable to finance its operations due to a loss of access to the capital markets or difficulty in liquidating its assets. Liquidity and funding risk also encompasses the Group’s ability to meet its financial obligations without experiencing significant business disruption or reputational damage that may threaten its viability as a going concern.
The primary goal of the Group’s liquidity and funding risk management framework is to ensure that the Group has access to adequate funding across a wide range of market conditions. The framework is designed to enable the Group, to fulfil its financial obligations and support the execution of its business strategies. The Group’s key components of liquidity and funding risk management include its Required Liquidity Framework, Liquidity Stress Testing and Liquidity Reserve, which are further described in note 28.
The Group continues to actively manage its capital and liquidity position to ensure adequate resources are available to support its activities, to enable it to withstand market stresses, and to meet regulatory stress testing requirements proposed by its regulators globally. The Group’s capital and liquidity is deemed sufficient to exceed regulatory minimums under both a normal and in a stressed market environment for the foreseeable future. Additionally, the Group has access to further Morgan Stanley Group capital and liquidity as required.
Secured funding
A substantial portion of the Group’s total assets consists of liquid marketable securities and short term receivables arising principally from its sales and trading activities. The liquid nature of these assets provides the Group with flexibility in funding these assets with secured financing. The Group’s goal is to achieve an optimal mix of durable secured and unsecured financing. Secured financing investors principally focus on the quality of the eligible collateral posted. Accordingly, the Group actively manages its secured financing book based on the quality of the assets being funded.
The Group utilises shorter-term secured financing only for highly liquid assets and has established longer tenor limits for less liquid asset classes, for which funding may be at risk in the event of a market disruption. The Group defines highly liquid assets as government-issued or government-guaranteed securities with a high degree of fundability and less liquid assets as those that do not meet these criteria. At 31 December 2015, the weighted average maturity of the Company’s secured financing of less liquid assets was greater than 120 days. To further minimise the refinancing risk of secured financing for less liquid assets, the Group has established concentration limits to diversify its investor base and reduce the amount of monthly maturities for secured financing of less liquid assets. Furthermore, the Group obtains term secured funding liabilities in excess of less liquid inventory or “spare capacity”, as an additional risk mitigant to replace maturing trades in the event that secured financing markets or its ability to access them become limited. As a component of the Liquidity Risk Management Framework, the Group holds a portion of its Liquidity Reserve against the potential disruption to its secured financing capabilities.
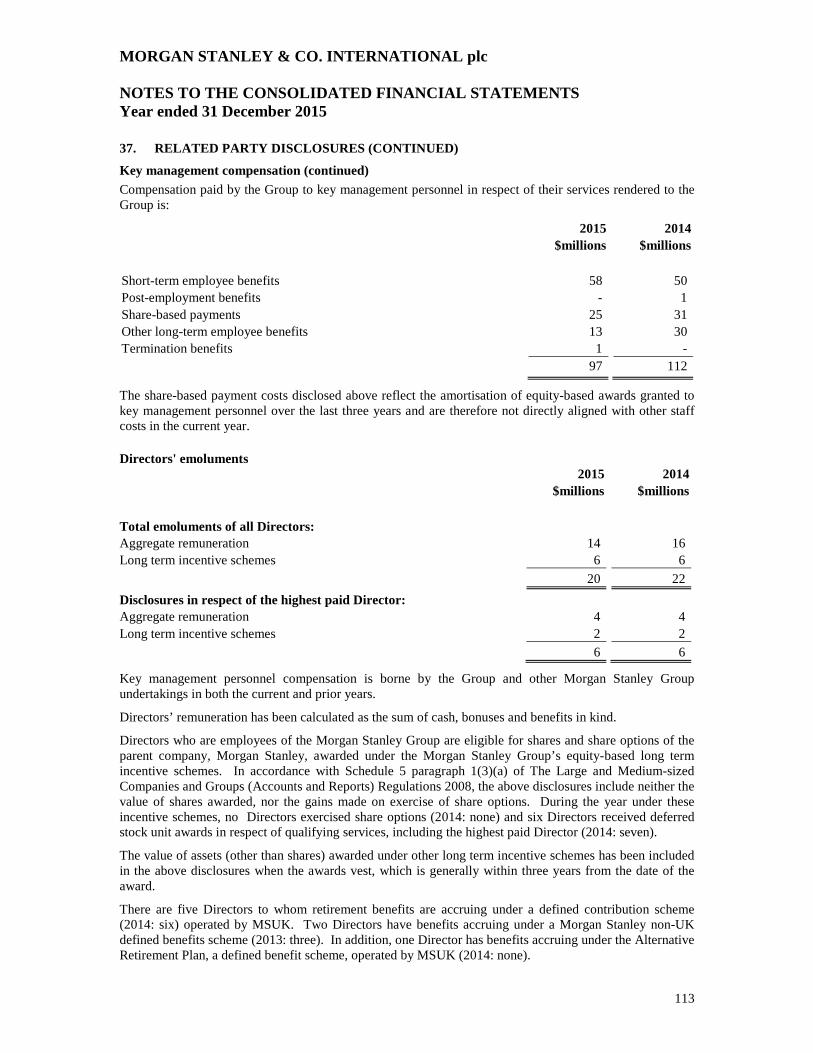
The table below presents the Group’s secured funding split between short term secured funding (with a maturity of less than one year remaining from 31 December) and long term secured funding (with a maturity of more than one year remaining from 31 December) consisting of securities sold under agreements to repurchase and cash collateral on securities loaned.
MORGAN STANLEY & CO. INTERNATIONAL plc STRATEGIC REPORT
8
RISK MANAGEMENT (CONTINUED)
Liquidity and funding risk (continued)
Secured funding (continued)
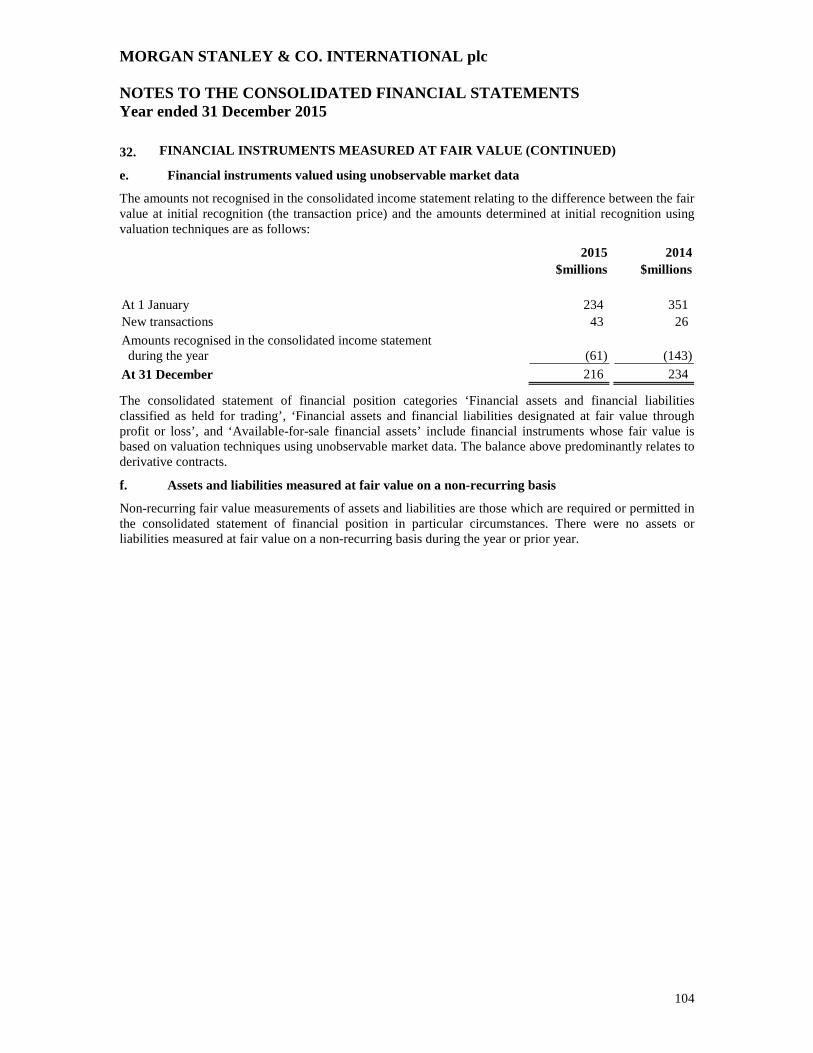
2015 2014 $millions $millions Short term secured funding: Cash collateral on securities loaned 14,875 17,499 Securities sold under agreements to repurchase 34,558 42,844 Total short term secured funding 49,433 60,343 Long term secured funding: Cash collateral on securities loaned 1,393 - Securities sold under agreements to repurchase 3,453 3,067 Total long term secured funding 4,846 3,067
Total secured funding 54,279 63,410
Credit ratings
The Company relies on external sources to finance a significant portion of its day-to-day operations. The cost and availability of financing generally are impacted by, among other variables, the Company’s credit ratings. In addition, the Company’s credit ratings can have an impact on certain trading revenues, particularly in those businesses where longer-term counterparty performance is a key consideration, such as OTC derivative transactions, including credit derivatives and interest rate swaps. Ratings agencies consider company-specific factors; other industry factors such as regulatory or legislative changes; the macroeconomic environment; and perceived levels of government support, among other things.
Some rating agencies have stated that they currently incorporate various degrees of credit rating uplift from non-governmental third party sources of potential support.
At 31 December 2015, the Company’s senior unsecured ratings were as follows:
Short- Term Long- Term Rating Debt Debt Outlook Moody's Investors Service, Inc ("Moody's") (1) P-1 A1 Stable
Standard & Poor's Rating Service ("S&P") (2) A-1 A Credit Watch Positive
(1) On 28 May 2015, Moody’s upgraded the long-term rating of the Company by two notches to A1 from A3 and revised the rating outlook to Stable.
(2) On 2 November 2015 S&P revised the Company’s rating outlook to Credit Watch Positive from Positive.
Collateral impact of a downgrade
In connection with certain OTC trading agreements and certain other agreements where the Company is a liquidity provider to certain financing vehicles, the Company may be required to provide additional collateral or immediately settle any outstanding liability balances with certain counterparties or pledge additional collateral to certain exchanges and clearing organisations in the event of a future credit rating downgrade irrespective of whether the Company is in a net asset or net liability position.
The additional collateral or termination payments that may be called in the event of a future credit rating downgrade vary by contract and can be based on ratings by either or both of Moody’s and S&P. As at 31 December 2015, the future potential collateral amounts and termination payments that could be called or required by counterparties or exchanges and clearing organisations, in the event of one-notch or two-notch downgrade scenarios, from the lowest of Moody’s or S&P ratings, based on the relevant contractual downgrade triggers, were $507 million and an incremental $647 million, respectively.
MORGAN STANLEY & CO. INTERNATIONAL plc STRATEGIC REPORT
9
RISK MANAGEMENT (CONTINUED)
Liquidity and funding risk (continued)
Collateral impact of a downgrade (continued)
While certain aspects of a credit rating downgrade are quantifiable pursuant to contractual provisions, the impact it would have on the Company’s business and results of operations in future periods is inherently uncertain and would depend on a number of interrelated factors, including, among others, the magnitude of the downgrade, the rating relative to peers, the rating assigned by the relevant agency pre-downgrade, individual client behaviour and future mitigating actions the Company might take. The liquidity impact of additional collateral requirements is included in the Group’s Liquidity Stress Tests.
Operational risk
Operational risk refers to the risk of loss, or of damage to the Group’s reputation, resulting from inadequate or failed processes, people and systems or from external events (e.g. fraud, theft, legal and compliance risks or damage to physical assets). Operational risk relates to the following risk event categories as defined by Basel Capital Standards: internal fraud; external fraud; employment practices and workplace safety; clients, products and business practices; business disruption and system failure; damage to physical assets; and execution, delivery and process management. The Group may incur operational risk across the full scope of its business activities, including revenue-generating activities (e.g. sales and trading) and support and control groups (e.g., information technology and trade processing). Legal and compliance risk is discussed below under “Legal, regulatory and compliance risk”.
The Group has established an operational risk framework to identify measure, monitor and control risk across the Group. This framework is consistent with the framework established by the Morgan Stanley Group and includes escalation to the Group’s Board of directors and appropriate senior management personnel. Effective operational risk management is essential to reducing the impact of operational risk incidents and mitigating legal and reputational risks. The framework is continually evolving to account for changes in the Group and to respond to the changing regulatory and business environment. The Group has implemented operational risk data and assessment systems to monitor and analyse internal and external operational risk events, to assess business environment and internal control factors and to perform scenario analysis. The collected data elements are incorporated in the operational risk capital model. The model encompasses both quantitative and qualitative elements. Internal loss data and scenario analysis results are direct inputs to the capital model, while external operational incidents, business environment and internal control factors are evaluated as part of the scenario analysis process.
In addition, the Group employs a variety of risk processes and mitigants to manage its operational risk exposures. These include a strong governance framework, a comprehensive risk management program and insurance. Operational risks and associated risk exposures are assessed relative to the risk tolerance established by the Board and are prioritised accordingly. The breadth and range of operational risk are such that the types of mitigating activities are wide-ranging. Examples of activities include enhancing defences against cyberattacks; use of legal agreements and contracts to transfer and/or limit operational risk exposures; due diligence; implementation of enhanced policies and procedures; exception management processing controls; and segregation of duties.
Primary responsibility for the management of operational risk is with the business segments, the control groups and the business managers therein. The business managers maintain processes and controls designed to identify, assess, manage, mitigate and report operational risk. Each of the business segments has a designated operational risk coordinator. The operational risk coordinator regularly reviews operational risk issues and reports to the Group’s senior management within each business. Each control group also has a designated operational risk coordinator and a forum for discussing operational risk matters with the Group’s senior management. Oversight of operational risk is provided by the Operational Risk Oversight Committee, regional risk committees and senior management. In the event of a merger; joint venture; divestiture; reorganisation; or creation of a new legal entity, a new product or a business activity, operational risks are considered, and any necessary changes in processes or controls are implemented.
The Operational Risk Department is independent of the business divisions and reports to the Chief Risk Officer. The Operational Risk Department provides oversight of operational risk management and independently assesses, measures and monitors operational risk. The Operational Risk Department works
MORGAN STANLEY & CO. INTERNATIONAL plc STRATEGIC REPORT
10
RISK MANAGEMENT (CONTINUED)
Operational risk (continued)
with the business divisions and control groups to help ensure a transparent, consistent and comprehensive framework for managing operational risk within each area and across the Group. The Operational Risk Department scope includes oversight of technology and data risks (e.g. cybersecurity) and a supplier management (vendor risk oversight and assessment) program. Furthermore, the Operational Risk Department supports the collection and reporting of operational risk incidents and the execution of operational risk assessments; provides the infrastructure needed for risk measurement and risk management; and ensures ongoing validation and verification of the Group’s advanced measurement approach for operational risk capital.
Business Continuity Management is responsible for identifying key risks and threats to the Group’s resiliency and planning to ensure that a recovery strategy and required resources are in place for the resumption of critical business functions following a disaster or other business interruption. Disaster recovery plans are in place for critical facilities and resources on a Group-wide basis, and redundancies are built into the systems as deemed appropriate. The key components of the Group’s Business Continuity Management Program include: crisis management; business recovery plans; applications/data recovery; work area recovery; and other elements addressing management, analysis, training and testing.
The Group maintains an information security program that coordinates the management of information security risks and is designed to address regulatory requirements. Information security policies are designed to protect the Group’s information assets against unauthorised disclosure, modification or misuse. These policies cover a broad range of areas, including: application entitlements, data protection, incident response, internet and electronic communications, remote access and portable devices. The Group has also established policies, procedures and technologies to protect its computers and other assets from unauthorised access.
In connection with its ongoing operations, the Group utilises the services of external vendors, which it anticipates will continue and may increase in the future. These services include, for example, outsourced processing and support functions and consulting and other professional services. The Group manages its exposures to these services through a variety of means such as the performance of due diligence, consideration of operational risk, implementation of service level and other contractual agreements, and ongoing monitoring of the vendors’ performance. The Group maintains a supplier risk management program with policies, procedures, organisation, governance and supporting technology that satisfies regulatory requirements. The program is designed to ensure that adequate risk management controls over the services exist, including, but not limited to information security, operational failure, financial stability, disaster recoverability, reputational risk, safeguards against corruption and termination.
Conduct risk
Conduct risk refers to the risk that the Group’s actions or behaviours do not adequately consider the impact on its clients, expected market users or the markets. Conduct risk is managed within the framework set out by the MSI Group and is managed and owned across business and control functions through policies, processes and controls within a designed framework.
Legal, regulatory and compliance risk Legal, regulatory and compliance risk includes the risk of legal or regulatory sanctions, material financial loss; including fines, penalties, judgements, damages and/ or settlements or loss to reputation the Group may suffer as a result of a failure to comply with laws, regulations, rules, related self-regulatory organisation standards and codes of conduct applicable to our business activities. This risk also includes contractual and commercial risk, such as the risk that a counterparty’s performance obligations will be unenforceable. It also includes compliance with Anti-Money Laundering and terrorist financing rules and regulations. The Group is generally subject to extensive regulation in the different jurisdictions in which it conducts its business.
MORGAN STANLEY & CO. INTERNATIONAL plc STRATEGIC REPORT
11
RISK MANAGEMENT (CONTINUED)
Legal, regulatory and compliance risk (continued)
The Group, principally through the Morgan Stanley Group’s Legal and Compliance Division, has established procedures based on legal and regulatory requirements on a worldwide basis that are designed to facilitate compliance with applicable statutory and regulatory requirements and to require that the Group’s policies relating to business conduct, ethics and practices are followed globally.
In addition, the Group has established procedures to mitigate the risk that a counterparty’s performance obligations will be unenforceable, including consideration of counterparty legal authority and capacity, adequacy of legal documentation, the permissibility of a transaction under applicable law and whether applicable bankruptcy or insolvency laws limit or alter contractual remedies. The heightened legal and regulatory focus on the financial services industry presents a continuing business challenge for the Group.
Culture, values and conduct of employees
All employees of the Morgan Stanley Group are accountable for conducting themselves in accordance with the Morgan Stanley Group’s core values Putting Clients First, Doing the Right Thing, Leading with Exceptional Ideas, and Giving Back. The Morgan Stanley Group is committed to establishing a strong culture anchored in these core values, and in its governance framework, which includes management oversight, effective risk management and controls, training and development programs, policies, procedures, and defined roles and responsibilities. The Morgan Stanley Group’s Code of Conduct (the “Code”) establishes standards for employee conduct that further reinforce the Morgan Stanley Group’s commitment to integrity and ethical conduct. Every new hire and every employee annually must attest to their understanding of and adherence to the Code. The annual employee performance appraisal process includes an evaluation of adherence to the Code and the Morgan Stanley Group’s core values. The Global Incentive Compensation Discretion Policy sets forth standards that specifically provide that managers must consider whether their employees effectively managed and/or supervised risk control practices during the performance year. The Morgan Stanley Group also has several mutually reinforcing processes to identify employee conduct that may have an impact on employment status, current year compensation and/or prior year compensation. The Morgan Stanley Group’s clawback and cancellation provisions permit recovery of deferred incentive compensation where an employee’s act or omission (including with respect to direct supervisory responsibilities) causes a restatement of the Morgan Stanley Group’s consolidated financial results, constitutes a violation of the Morgan Stanley Group’s global risk management principles, policies and standards, or causes a loss of revenues associated with a position on which the employee was paid and the employee operated outside of internal control policies.
CAPITAL MANAGEMENT
The Group views capital as an important source of financial strength. It actively manages and monitors its capital in line with established policies and procedures and in compliance with local regulatory requirements.
The Group, in line with Morgan Stanley Group’s capital management policies, manages its capital position based upon among other things, business opportunities, risk appetite, capital availability and rates of return together with internal capital policies, regulatory requirements and rating agency guidelines and, therefore, in the future may expand or contract its capital base to address the changing needs of its businesses. The appropriate level of capital is determined at a legal entity level to safeguard that entity’s ability to continue as a going concern and ensure that it meets all regulatory capital requirements. The key components of the capital management framework used by the Group are set out in the Capital Management Policy and include a point in time capital assessment, forward looking capital projections and stress testing.
MSI and all of its subsidiary undertakings (together “the MSI Group”) prepare an Internal Capital Adequacy Assessment Process (“ICAAP”) document in order to meet obligations under CRD IV and the requirements of the PRA. The Group forms part of the MSI Group.
The ICAAP is one of the key tools used to inform the MSI Group’s capital adequacy assessment, planning and management. The MSI Group ICAAP:
MORGAN STANLEY & CO. INTERNATIONAL plc STRATEGIC REPORT
12
CAPITAL MANAGEMENT (CONTINUED)
• Ensures the risks the MSI Group is exposed to are appropriately capitalised and risk managed, including those risks that are either not captured, or not fully captured under Pillar 1;
• Uses stress testing to size a capital buffer aimed at ensuring the MSI Group will continue to operate above regulatory requirements under a range of severe but plausible stress scenarios; and
• Assesses capital adequacy under normal and stressed operating environments over the 3 year capital planning horizon to ensure the MSI Group maintains a capital position in line with internal operating targets and above post stress minimum levels.
The key elements of the ICAAP are embedded in the MSI Group’s day-to-day management processes and decision making culture.
The PRA reviews the ICAAP document through its Supervisory Review Process and issues an Individual Capital Guidance which sets the minimum level of regulatory capital for the MSI Group and the Company. In addition, the PRA sets a capital planning buffer which is available to support the MSI Group in a stressed market environment.
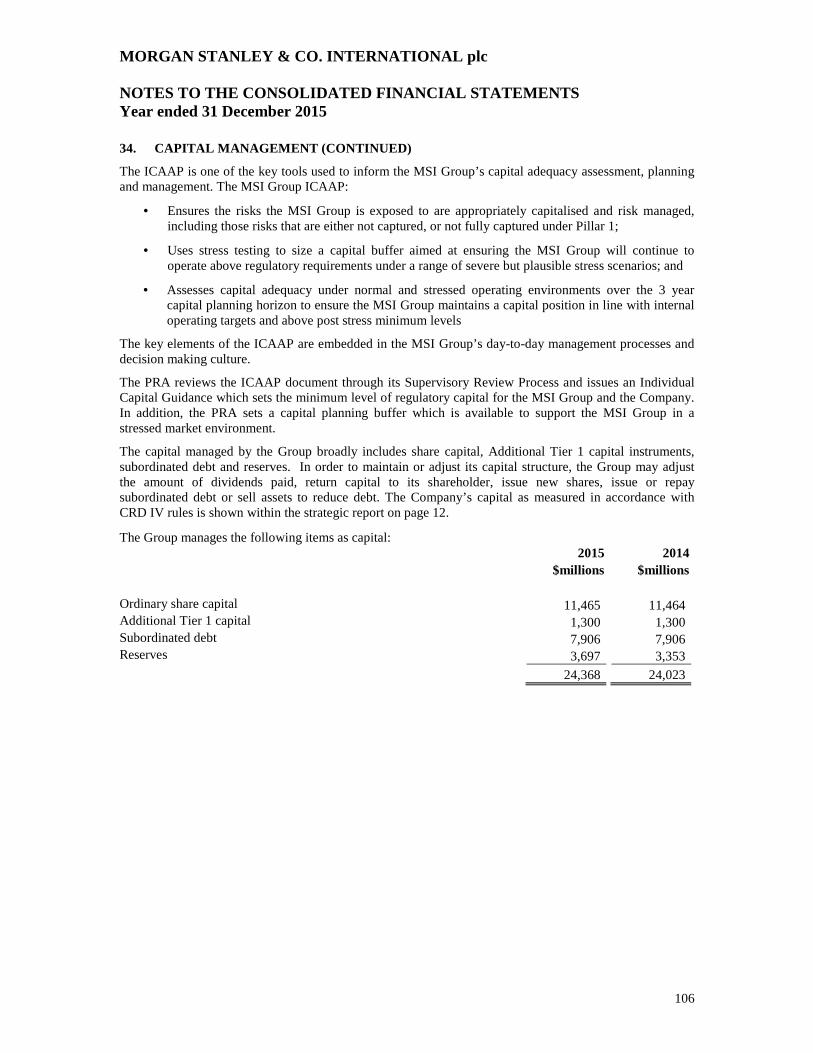
The capital managed by the Group broadly includes share capital, Additional Tier 1 capital instruments, subordinated debt and reserves (see note 34). In order to maintain or adjust its capital structure, the Group may adjust the amount of dividends paid, return capital to its shareholder, issue new shares, issue or repay subordinated debt or sell assets to reduce debt. The Company’s capital as measured in accordance with CRD IV rules is shown below.
REGULATORY REQUIREMENTS
Capital resources
The Group continues to actively manage its capital and liquidity position to ensure adequate resources are available to support its activities, to enable it to withstand market stresses, and to meet regulatory stress testing requirements proposed by its regulators globally.
The Company is regulated by the FCA and the PRA and as such is subject to minimum capital requirements. The Company’s capital is monitored on an ongoing basis to ensure compliance with these requirements. At a minimum, the Company must ensure that Capital Resources described in accordance with CRR as Own Funds, are greater than the Capital Resource Requirement covering credit, market and operational risk.
The Company complied with all of its regulatory capital requirements during the year.
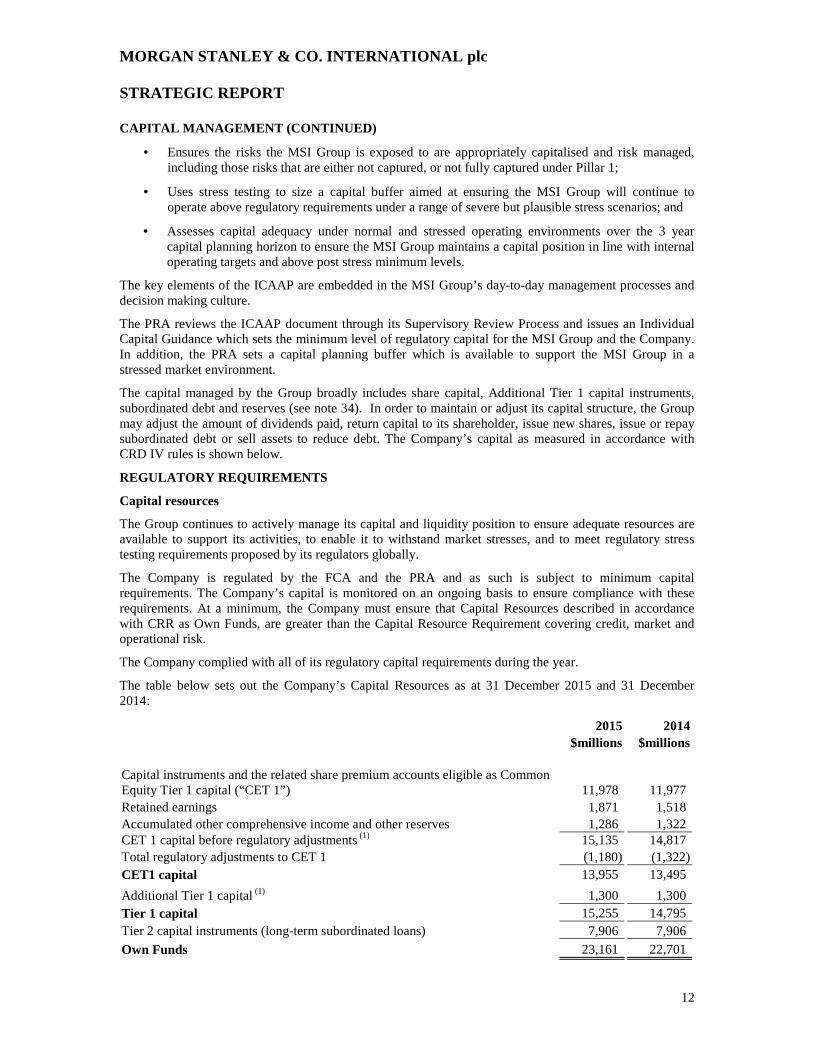
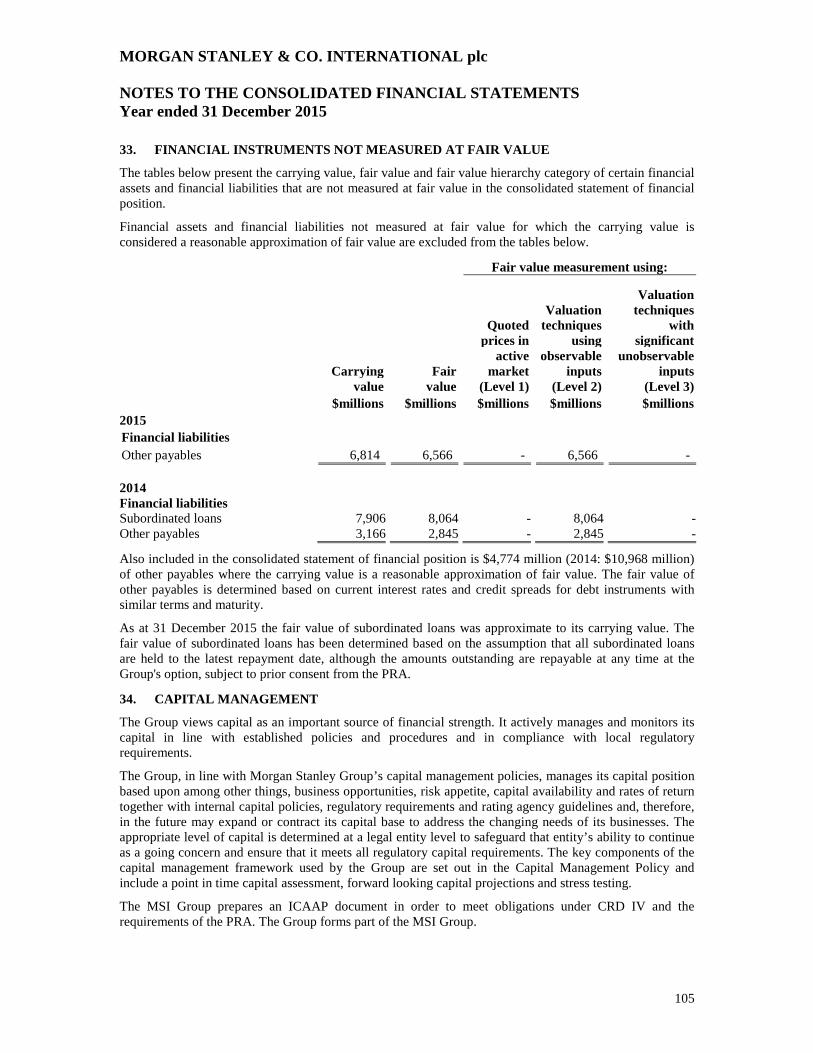
The table below sets out the Company’s Capital Resources as at 31 December 2015 and 31 December 2014:
2015 2014 $millions $millions Capital instruments and the related share premium accounts eligible as Common Equity Tier 1 capital (“CET 1”) 11,978 11,977 Retained earnings 1,871 1,518 Accumulated other comprehensive income and other reserves 1,286 1,322 CET 1 capital before regulatory adjustments (1) 15,135 14,817 Total regulatory adjustments to CET 1 (1,180) (1,322) CET1 capital 13,955 13,495
Additional Tier 1 capital (1) 1,300 1,300 Tier 1 capital 15,255 14,795 Tier 2 capital instruments (long-term subordinated loans) 7,906 7,906
Own Funds 23,161 22,701
MORGAN STANLEY & CO. INTERNATIONAL plc STRATEGIC REPORT
13
REGULATORY REQUIREMENTS (CONTINUED)
Capital resources (continued)
Movement in Own Funds of the Company was as follows: 2015 $millions Own Funds at 1 January 2015 22,701 Change in Tier 1 capital: CET 1 capital before regulatory adjustments 318 Regulatory adjustments to CET 1 142
Own Funds at 31 December 2015 23,161
(1) The sum of CET 1 capital before regulatory adjustments, Additional Tier 1 capital and Tier 2 capital agrees to the Company's managed capital as shown in note 28 of the Company’s financial statements, with the exception of $49 million of retained earnings which were not eligible as CET 1 capital as at 31 December 2015.
Basel Liquidity Framework
The Basel Committee on Banking Supervision (the “Basel Committee”) has developed two standards intended for use in liquidity risk supervision: the Liquidity Coverage Ratio (“LCR”) and the Net Stable Funding Ratio (“NSFR”).
Liquidity Coverage Ratio: The LCR was developed to ensure banking organisations have sufficient high quality liquid assets to cover net cash outflows arising from significant stress over 30 calendar days. The standard’s objective is to promote the short-term resilience of the liquidity risk profile of banking organisations. The Group was required to comply with LCR minimum standards from 1 October 2015. The Group is compliant with the minimum required LCR based on current interpretation. These minimum standards are increasing each year until 2018. The Group continues to evaluate the impact on its liquidity and funding requirements.
Net Stable Funding Ratio: The objective of the NSFR is to reduce funding risk over a one year horizon by requiring banking organisations to fund their activities with sufficiently stable sources of funding in order to mitigate the risk of future funding stress. In October 2014, the Basel Committee finalised revisions to the NSFR, which is expected to become effective on 1 January 2018. The Group continues to evaluate the NSFR and its potential impact on the Group’s current liquidity and funding requirements.
Recovery and resolution planning
Both the Morgan Stanley Group and the MSI Group, of which the Company is a part, prepare, on an annual basis, a recovery plan which identifies mitigation tools available to both groups in times of severe stress.
The Morgan Stanley Group has developed a resolution plan in accordance with the requirements of Section 165(d) of Title I of the Dodd-Frank Wall Street Reform and Consumer Protection Act and its implementing regulations adopted by the Federal Reserve Board and the Federal Deposit Insurance Corporation. The resolution plan presents the Firm’s strategy for resolution of the Firm upon material financial distress or failure in a severely adverse macroeconomic environment. The Company is a Material Operating Entity of the Morgan Stanley Group and is within the scope of the single point of entry resolution strategy adopted by the Morgan Stanley Group.
The EU Bank Recovery and Resolution Directive (“BRRD”) has established a recovery and resolution framework for EU credit institutions and investment firms. The MSI Group produces information required by the UK Resolution Authority in the form of a resolution pack and ad hoc regulatory submissions, as necessary under BRRD and UK regulatory requirements.
MORGAN STANLEY & CO. INTERNATIONAL plc STRATEGIC REPORT
14
GOING CONCERN
Business risks associated with the uncertain market and economic conditions are being actively monitored and managed by the Group. Retaining sufficient liquidity and capital to withstand these market pressures remains central to the Group’s strategy. In particular, the Group’s capital and liquidity is deemed sufficient to exceed regulatory minimums under both a normal and in a stressed market environment for the foreseeable future. Additionally, the Group has access to further Morgan Stanley Group capital and liquidity as required.
Taking all of these factors into consideration, the Directors believe it is reasonable to assume that the Group will have access to adequate resources to continue in operational existence for the foreseeable future. Accordingly they continue to adopt the going concern basis in preparing the annual reports and financial statements.
Approved by the Board and signed on its behalf by
C Castello
Director
21 April 2016
MORGAN STANLEY & CO. INTERNATIONAL plc DIRECTORS’ REPORT
15
The Directors present their report and consolidated financial statements of Morgan Stanley & Co. International plc (the “Company”) and all of its subsidiary undertakings (together “the Group”), which comprise the consolidated income statement, consolidated statement of comprehensive income, consolidated statement of changes in equity, consolidated statement of financial position, consolidated statement of cash flows and the related notes 1 to 37, together with the Company’s statement of comprehensive income, statement of changes in equity, statement of financial position and related notes 1 to 31 and the appendix to the financial statements for the year ended 31 December 2015.
RESULTS AND DIVIDENDS
The Group’s profit for the year, after tax, was $401 million (2014: $713 million loss after tax).
On 22 January 2015, the Directors approved a coupon payment on the Additional tier 1 capital instruments of $15 million (see note 24). No other dividends were proposed or paid during the year ended 31 December 2015.
During 2014, a dividend of $88 million was paid on the Class D1 preference shares although this dividend was declared, and therefore accrued, as at 31 December 2013.
REGULATION, RISK MANAGEMENT, BRANCHES AND FUTURE DE VELOPMENTS
Information regarding regulation, risk management, branches and future developments has been included in the Strategic report.
PILLAR 3 DISCLOSURES AND COUNTRY-BY-COUNTRY REPORTI NG
The Company is included in the MSI Group Pillar 3 disclosures which allow investors and other market participants to understand capital adequacy, particular risk exposures and risk management processes of individual firms required by the EU implementation of Basel capital standards.
The Company is also included in the MSI consolidated disclosure in order to comply with the provisions of Statutory Instrument 2013 No.3118 Capital Requirements (Country-by-Country Reporting) Regulations 2013, which implements in the UK the requirements set out in Article 89 of the Capital Requirements Directive (Directive 2013/36/EU).
The Pillar 3 disclosures and the Country-by-Country Reporting for the MSI Group for the year ended 31 December 2015 will be made available on the Morgan Stanley website at www.morganstanley.com/investorrelations.
DIRECTORS
The following Directors held office throughout the year and to the date of approval of this report (except where otherwise shown):
D O Cannon C Castello (appointed 21 January 2015) T Duhon (appointed 14 April 2016) Sir E J W Gieve (resigned 31 October 2015) L Guy T C Kelleher (resigned 5 February 2016) M C Phibbs I Plenderleith (Chairman) R P Rooney D A Russell C E Woodman (resigned 5 February 2016)
DIRECTORS’ AND OFFICERS’ LIABILITY INSURANCE
Directors’ and Officers’ Liability Insurance is taken out by Morgan Stanley, for the benefit of the Directors and Officers of the Group.
MORGAN STANLEY & CO. INTERNATIONAL plc DIRECTORS’ REPORT
16
DIRECTORS’ INDEMNITY
Qualifying third party indemnity provisions (as defined in section 234 of the Companies Act 2006) were in force during the year and up to and including the date of the Directors’ report for the benefit of the Directors of the Group.
AUDIT COMMITTEE
MSI, the Company’s ultimate UK parent undertaking, has an Audit Committee which assists the Boards of MSI, the Company, other MSI regulated subsidiary undertakings and certain other Morgan Stanley Group undertakings in meeting their responsibilities in ensuring an effective system of internal control and compliance, and in meeting their external financial reporting obligations. The Audit Committee meets regularly and reports to the MSI Board on at least a quarterly basis.
EMPLOYEES
Both the Group and the Morgan Stanley Group place considerable value on the investment in their employees and have continued their practice of keeping employees informed on matters affecting them. Employees are encouraged to present their suggestions and views on Morgan Stanley Group’s performance to management and employees participate directly in the success of the business through Morgan Stanley Group’s various compensation incentive plans.
Every effort is also made to ensure that disabled applicants, or those existing employees who are disabled or may have become disabled, are treated fairly on terms comparable with those of other employees. Appropriate training is arranged for disabled persons, including retraining for alternative work for employees who become disabled, to promote their career development within the organisation.
EMPLOYEE REMUNERATION
The Group employs staff directly, in addition to utilising staff employed by other Morgan Stanley Group undertakings. The Group’s policies are comparable and consistent with those of the Morgan Stanley Group, which include the deferral of significant portions of certain key employees’ discretionary compensation. Notes 7 and 35 to the consolidated financial statements provides additional information and disclosure regarding the Group’s compensation policies.
CHARITABLE CONTRIBUTIONS
During the year the Group made donations to various charities totalling $3.6 million (2014: $2.1 million), of which $1.8 million was donated to the Morgan Stanley International Foundation (2014: $1.5 million).
MORGAN STANLEY & CO. INTERNATIONAL plc DIRECTORS’ REPORT
17
AUDITOR
Deloitte LLP have expressed their willingness to continue in office as auditor of the Group and a resolution to re-appoint them will be proposed at the forthcoming annual general meeting.
Statement as to disclosure of information to the auditor
Each of the persons who are Directors of the Company at the date when this report is approved confirms that:
(a) so far as each of the Directors is aware, there is no relevant audit information (being information needed by the Group’s auditor in connection with preparing their report) of which the Group's auditor is unaware; and
(b) each of the Directors has taken all the steps that he/she ought to have taken as a Director to make himself/herself aware of any relevant audit information and to establish that the Group’s auditor is aware of that information.
This confirmation is given and should be interpreted in accordance with the provisions of section 418 of the Companies Act 2006.
Approved by the Board and signed on its behalf by
C Castello
Director
21 April 2016
MORGAN STANLEY & CO. INTERNATIONAL plc DIRECTORS’ REPORT
18
DIRECTORS’ RESPONSIBILITIES STATEMENT
The Directors are responsible for preparing the annual report and the financial statements in accordance with applicable law and regulations.
Company law requires the Directors to prepare financial statements for each financial year. Under that law the Directors have prepared the financial statements in accordance with International Financial Reporting Standards (“IFRS”) as adopted by the EU and Article 4 of the International Accounting Standards (“IAS”) Regulation and have elected to prepare the parent company financial statements in accordance with United Kingdom Generally Accepted Accounting Practice (United Kingdom Accounting Standards and applicable law), including FRS 101 “Reduced Disclosure Framework” (“FRS 101”). Under Company law the Directors must not approve the accounts unless they are satisfied that they give a true and fair view of the state of affairs of the Group and of the profit or loss of the Group for that period.
In preparing the Group financial statements, the Directors are required by IAS 1 ‘Presentation of financial statements’ (“IAS 1”) to:
(a) properly select and apply accounting policies; (b) present information, including accounting policies, in a manner that provides relevant, reliable,
comparable and understandable information; (c) provide additional disclosures when compliance with the specific requirements in IFRSs is insufficient
to enable users to understand the impact of particular transactions, other events and conditions on the entity’s financial position and financial performance; and
(d) make an assessment of the Group’s ability to continue as a going concern.
In preparing these financial statements, the Directors are required to:
• select suitable accounting policies and then apply them consistently; • make judgements and accounting estimates that are reasonable and prudent; • state whether applicable UK accounting standards have been followed; and • prepare the financial statements on the going concern basis unless it is inappropriate to presume that
the Company will continue in business.
The Directors are responsible for keeping adequate accounting records that are sufficient to show and explain the Group’s transactions and disclose with reasonable accuracy at any time the financial position of the Group and enable them to ensure that the financial statements comply with the Companies Act 2006. They are also responsible for safeguarding the assets of the Group and hence for taking reasonable steps for the prevention and detection of fraud and other irregularities.
The Directors, the names of whom are set out on page 15 of the Directors’ report, confirm to the best of their knowledge:
• in accordance with rule 4.1.12(3)(a) of the FCA’s Disclosure and Transparency Rules, the consolidated financial statements, which have been prepared in accordance with IFRSs as issued by the International Accounting Standards Board (“IASB”) and as endorsed by the EU, have been prepared in accordance with the applicable set of accounting standards and give a true and fair view of the assets, liabilities, financial position and profit or loss of the Group and the undertakings included in the consolidation taken as a whole; and
• the management report represented by the Strategic report has been prepared in accordance with rule 4.1.12(3)(b) of the FCA’s Disclosure and Transparency Rules, and includes a fair review of the development and performance of the business and the position of the Group and the undertakings included in the consolidation taken as a whole, together with a description of the principal risks and uncertainties that the Group faces.
Approved by the Board and signed on its behalf by
C Castello
Director
21 April 2016
INDEPENDENT AUDITOR’S REPORT TO THE MEMBERS OF MORG AN STANLEY & CO. INTERNATIONAL plc
19
We have audited the Group and Company financial statements of Morgan Stanley & Co. International plc for the year ended 31 December 2015 which comprise the Consolidated Income Statement, the Consolidated Statement of Comprehensive Income, the Consolidated Statement of Changes in Equity, the Consolidated Statement of Financial Position, the Consolidated Statement of Cash Flows and the Company’s Statement of Comprehensive Income, Statement of Changes in Equity, Statement of Financial position and the related notes 1 to 37 for the consolidated financial statements and the related notes 1 to 31 for the Company financial statements and the appendix to the financial statements. The financial reporting framework that has been applied in the preparation of the Group financial statements is applicable law and International Financial Reporting Standards (IFRSs) as adopted by the European Union. The financial reporting framework that has been applied in their preparation of the Company financial statements is applicable law and United Kingdom Accounting Standards (United Kingdom Generally Accepted Accounting Practice), including FRS 101.
This report is made solely to the Group’s members, as a body, in accordance with Chapter 3 of Part 16 of the Companies Act 2006. Our audit work has been undertaken so that we might state to the Group’s members those matters we are required to state to them in an auditor’s report and for no other purpose. To the fullest extent permitted by law, we do not accept or assume responsibility to anyone other than the Group and the Group’s members as a body, for our audit work, for this report, or for the opinions we have formed.
Respective responsibilities of Directors and auditor
As explained more fully in the Directors’ Responsibilities Statement, the Directors are responsible for the preparation of the financial statements and for being satisfied that they give a true and fair view. Our responsibility is to audit and express an opinion on the financial statements in accordance with applicable law and International Standards on Auditing (UK and Ireland). Those standards require us to comply with the Auditing Practices Board’s Ethical Standards for Auditors.
Scope of the audit of the financial statements
An audit involves obtaining evidence about the amounts and disclosures in the financial statements sufficient to give reasonable assurance that the financial statements are free from material misstatement, whether caused by fraud or error. This includes an assessment of: whether the accounting policies are appropriate to the Group’s and the Company’s circumstances and have been consistently applied and adequately disclosed; the reasonableness of significant accounting estimates made by the Directors; and the overall presentation of the financial statements. In addition, we read all the financial and non-financial information in the annual report to identify material inconsistencies with the audited financial statements and to identify any information that is apparently materially incorrect based on, or materially inconsistent with, the knowledge acquired by us in the course of performing the audit. If we become aware of any apparent material misstatements or inconsistencies, we consider the implications for our report
Opinion on financial statements
In our opinion:
• the financial statements give a true and fair view of the state of the Group’s and of the Company’s affairs as at 31 December 2015 and of the Group’s and the Company’s profit for the year then ended;
• the Group financial statements have been properly prepared in accordance with IFRSs as adopted by the European Union;
• the Company financial statements have been properly prepared in accordance with United Kingdom Generally Accepted Accounting Practice; and
• the financial statements have been prepared in accordance with the requirements of the Companies Act 2006; and, as regards the Group financial statements, Article 4 of the IAS Regulation.
INDEPENDENT AUDITOR’S REPORT TO THE MEMBERS OF MORG AN STANLEY & CO. INTERNATIONAL plc
20
Opinion on other matter prescribed by the Companies Act 2006
In our opinion, the information given in the Strategic Report and the Directors’ Report for the financial year for which the financial statements are prepared is consistent with the financial statements.
Matters on which we are required to report by exception
We have nothing to report in respect of the following matters where the Companies Act 2006 requires us to report to you if, in our opinion:
• adequate accounting records have not been kept, or returns adequate for our audit have not been received from branches not visited by us; or
• the financial statements are not in agreement with the accounting records and returns; or • certain disclosures of Directors’ remuneration specified by law are not made; or • we have not received all the information and explanations we require for our audit.
Robert Topley (Senior Statutory Auditor) for and on behalf of Deloitte LLP Chartered Accountants and Statutory Auditor London 21 April 2016
MORGAN STANLEY & CO. INTERNATIONAL plc CONSOLIDATED INCOME STATEMENT Year ended 31 December 2015
21
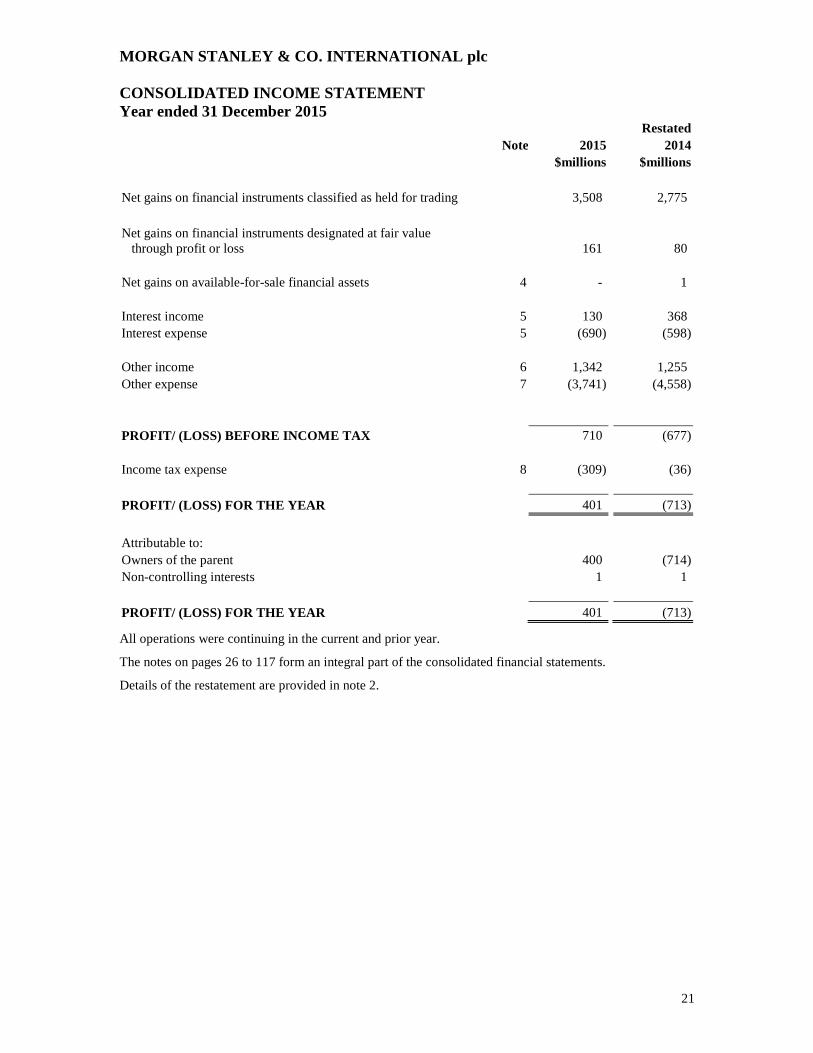
Restated Note 2015 2014 $millions $millions
Net gains on financial instruments classified as held for trading 3,508 2,775
Net gains on financial instruments designated at fair value through profit or loss 161 80 Net gains on available-for-sale financial assets 4 - 1 Interest income 5 130 368 Interest expense 5 (690) (598) Other income 6 1,342 1,255 Other expense 7 (3,741) (4,558) PROFIT/ (LOSS) BEFORE INCOME TAX 710 (677) Income tax expense 8 (309) (36)
PROFIT/ (LOSS) FOR THE YEAR 401 (713)
Attributable to: Owners of the parent 400 (714) Non-controlling interests 1 1
PROFIT/ (LOSS) FOR THE YEAR 401 (713)
All operations were continuing in the current and prior year.
The notes on pages 26 to 117 form an integral part of the consolidated financial statements.
Details of the restatement are provided in note 2.
MORGAN STANLEY & CO. INTERNATIONAL plc CONSOLIDATED STATEMENT OF COMPREHENSIVE INCOME Year ended 31 December 2015
22
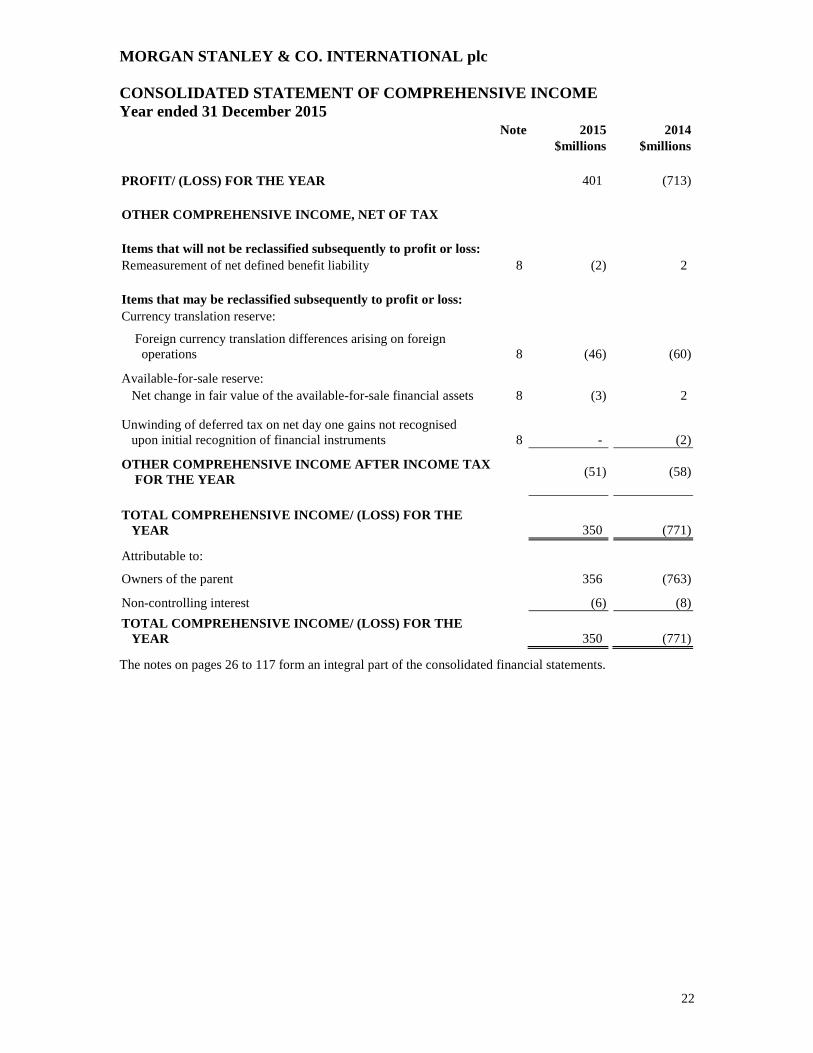
Note 2015 2014 $millions $millions PROFIT/ (LOSS) FOR THE YEAR 401 (713) OTHER COMPREHENSIVE INCOME, NET OF TAX Items that will not be reclassified subsequently to profit or loss: Remeasurement of net defined benefit liability 8 (2) 2 Items that may be reclassified subsequently to profit or loss: Currency translation reserve:
Foreign currency translation differences arising on foreign operations 8 (46) (60) Available-for-sale reserve: Net change in fair value of the available-for-sale financial assets 8 (3) 2 Unwinding of deferred tax on net day one gains not recognised upon initial recognition of financial instruments 8 - (2)
OTHER COMPREHENSIVE INCOME AFTER INCOME TAX FOR THE YEAR
(51) (58)
TOTAL COMPREHENSIVE INCOME/ (LOSS) FOR THE YEAR 350 (771)
Attributable to:
Owners of the parent 356 (763)
Non-controlling interest (6) (8)
TOTAL COMPREHENSIVE INCOME/ (LOSS) FOR THE YEAR 350 (771)
The notes on pages 26 to 117 form an integral part of the consolidated financial statements.
MORGAN STANLEY & CO. INTERNATIONAL plc CONSOLIDATED STATEMENT OF CHANGES IN EQUITY Year ended 31 December 2015
23
Note Equity
instruments
Share premium
account
Currency translation
reserve
Available-for-sale reserve
Capital contribution
reserve
Capital redemption
reserve Pension reserve
Retained earnings
Attributable to owners of the
parent
Non-controlling
interests Total
equity $millions $millions $millions $millions $millions $millions $millions $millions $millions $millions $millions Balance at 1 January 2014 11,464 513 78 4 3 1,400 - 2,118 15,580 79 15,659 Income/ (loss) for the year - - - - - - - (714) (714) 1 (713)
Other comprehensive income - - (51) 2 - - 2 (2) (49) (9) (58)
Issue of Additional Tier 1 capital 23 1,300 - - - - - - - 1,300 - 1,300
Balance at 31 December 2014 12,764 513 27 6 3 1,400 2 1,402 16,117 71 16,188
Profit for the year - - - - - - - 400 400 1 401
Other comprehensive income - - (39) (3) - - (2) - (44) (7) (51)
Total comprehensive income/ (loss) - - (39) (3) - - (2) 400 356 (6) 350 Transactions with owners: Issue of ordinary share capital 23 1 - - - - - - - 1 - 1
Dividends 24 - - - - - - - (12) (12) - (12)
Balance at 31 December 2015 12,765 513 (12) 3 3 1,400 - 1,790 16,462 65 16,527
The notes on pages 26 to 117 form an integral part of the consolidated financial statements.
MORGAN STANLEY & CO. INTERNATIONAL plc Registered number: 2068222
CONSOLIDATED STATEMENT OF FINANCIAL POSITION As at 31 December 2015
24
Note 2015 2014 $millions $millions ASSETS Loans and receivables: Cash and short term deposits 25 11,882 11,671 Cash collateral on securities borrowed 22,433 20,691 Securities purchased under agreements to resell 58,644 58,724 Trade receivables 50,940 54,944 Other receivables 10 1,891 3,317 145,790 149,347
Financial assets classified as held for trading (of which $39,718 million (2014: $43,572 million) were pledged to various parties) 11 246,273 295,398 Financial assets designated at fair value through profit or loss 13 1,636 3,360 Available-for-sale financial assets 14 39 42 Current tax assets 185 217 Deferred tax assets 21 120 86 Prepayments and accrued income 38 72 Property, plant and equipment 17 3 4 TOTAL ASSETS 394,084 448,526
LIABILITIES AND EQUITY Financial liabilities at amortised cost: Bank loans and overdrafts 25 - 15 Cash collateral on securities loaned 16,268 17,499 Securities sold under agreements to repurchase 38,011 45,911 Trade payables 82,065 83,561 Subordinated loans 18 7,906 7,906 Other payables 19 11,588 14,134 155,838 169,026 Financial liabilities classified as held for trading 11 216,506 257,828 Financial liabilities designated at fair value through profit or loss 13 4,865 5,131 Provisions 20 21 43 Current tax liabilities 101 105 Deferred tax liabilities 21 23 1 Accruals and deferred income 197 199 Post employment benefit obligations 35 6 5 TOTAL LIABILITIES 377,557 432,338
EQUITY Equity instruments 23 12,765 12,764 Share premium account 23 513 513 Currency translation reserve 23 (12) 27 Available-for-sale reserve 23 3 6 Capital contribution reserve 23 3 3 Capital redemption reserve 23 1,400 1,400 Pension reserve 23 - 2 Retained earnings 1,790 1,402 Equity attributable to the owners of the parent 16,462 16,117 Non-controlling interests 65 71 TOTAL EQUITY 16,527 16,188
TOTAL LIABILITIES AND EQUITY 394,084 448,526
These consolidated financial statements were approved by the Board and authorised for issue on 21 April 2016.
Signed on behalf of the Board
C Castello Director
The notes on pages 26 to 117 form an integral part of the consolidated financial statements.
MORGAN STANLEY & CO. INTERNATIONAL plc CONSOLIDATED STATEMENT OF CASH FLOWS Year ended 31 December 2015
25
Note 2015 2014 $millions $millions
NET CASH FLOWS FROM/ (USED IN) OPERATING ACTIVITIES 25b 246 (1,578) INVESTING ACTIVITIES Purchase of property, plant and equipment 17 (1) (2) Purchase of available-for-sale financial assets 14 (1) - Proceeds from disposal of available-for-sale financial assets 14 1 15
NET CASH FLOWS (USED IN)/ FROM INVESTING ACTIVITIES (1) 13 FINANCING ACTIVITIES Issue of equity instruments 23 1 1,300 Dividends paid 24 (12) (88) Interest on subordinated loan liabilities (138) (138)
NET CASH FLOWS (USED IN)/ FROM FINANCING ACTIVITIES (149) 1,074
NET INCREASE/ (DECREASE) IN CASH AND CASH EQUIVALENTS 96 (491)
Currency translation differences on foreign currency cash balances 130 (81)
CASH AND CASH EQUIVALENTS AT THE BEGINNING OF THE YEAR 25a 11,656 12,228
CASH AND CASH EQUIVALENTS AT THE END OF THE YEAR 25a 11,882 11,656
The notes on pages 26 to 117 form an integral part of the consolidated financial statements.
MORGAN STANLEY & CO. INTERNATIONAL plc NOTES TO THE CONSOLIDATED FINANCIAL STATEMENTS Year ended 31 December 2015
26
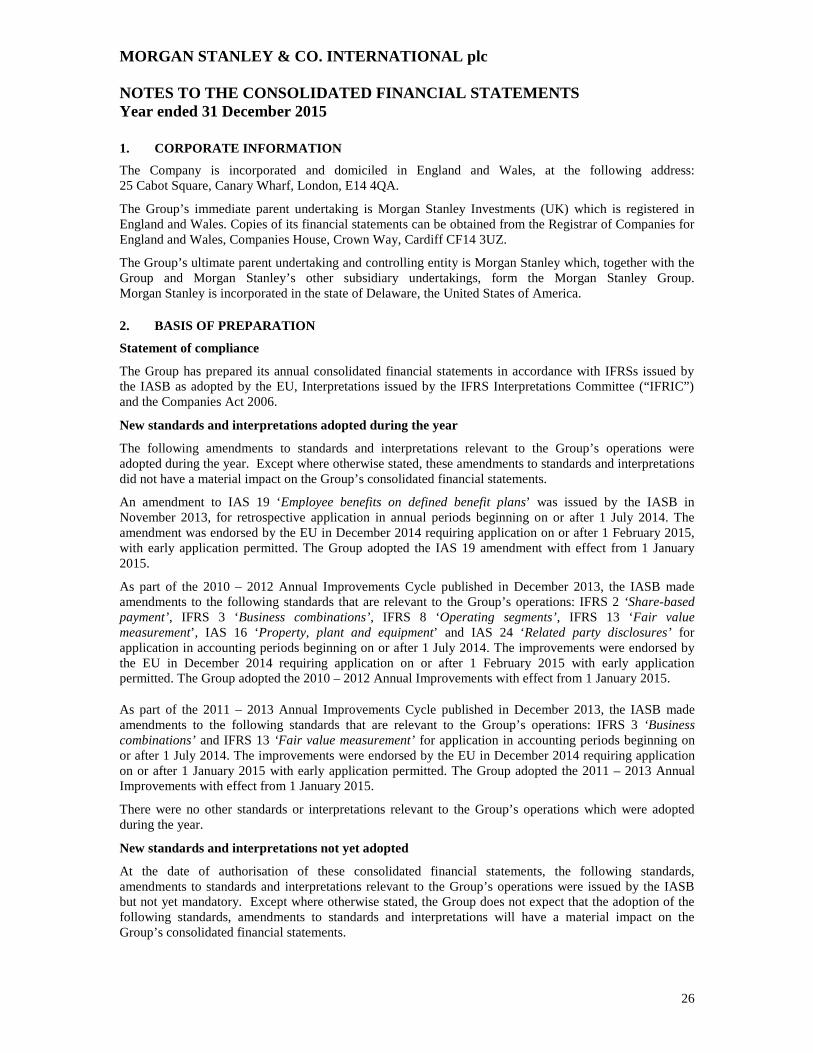
1. CORPORATE INFORMATION The Company is incorporated and domiciled in England and Wales, at the following address: 25 Cabot Square, Canary Wharf, London, E14 4QA.
The Group’s immediate parent undertaking is Morgan Stanley Investments (UK) which is registered in England and Wales. Copies of its financial statements can be obtained from the Registrar of Companies for England and Wales, Companies House, Crown Way, Cardiff CF14 3UZ.
The Group’s ultimate parent undertaking and controlling entity is Morgan Stanley which, together with the Group and Morgan Stanley’s other subsidiary undertakings, form the Morgan Stanley Group. Morgan Stanley is incorporated in the state of Delaware, the United States of America. 2. BASIS OF PREPARATION Statement of compliance
The Group has prepared its annual consolidated financial statements in accordance with IFRSs issued by the IASB as adopted by the EU, Interpretations issued by the IFRS Interpretations Committee (“IFRIC”) and the Companies Act 2006.
New standards and interpretations adopted during the year
The following amendments to standards and interpretations relevant to the Group’s operations were adopted during the year. Except where otherwise stated, these amendments to standards and interpretations did not have a material impact on the Group’s consolidated financial statements.
An amendment to IAS 19 ‘Employee benefits on defined benefit plans’ was issued by the IASB in November 2013, for retrospective application in annual periods beginning on or after 1 July 2014. The amendment was endorsed by the EU in December 2014 requiring application on or after 1 February 2015, with early application permitted. The Group adopted the IAS 19 amendment with effect from 1 January 2015.
As part of the 2010 – 2012 Annual Improvements Cycle published in December 2013, the IASB made amendments to the following standards that are relevant to the Group’s operations: IFRS 2 ‘Share-based payment’, IFRS 3 ‘Business combinations’, IFRS 8 ‘Operating segments’, IFRS 13 ‘Fair value measurement’, IAS 16 ‘Property, plant and equipment’ and IAS 24 ‘Related party disclosures’ for application in accounting periods beginning on or after 1 July 2014. The improvements were endorsed by the EU in December 2014 requiring application on or after 1 February 2015 with early application permitted. The Group adopted the 2010 – 2012 Annual Improvements with effect from 1 January 2015.
As part of the 2011 – 2013 Annual Improvements Cycle published in December 2013, the IASB made amendments to the following standards that are relevant to the Group’s operations: IFRS 3 ‘Business combinations’ and IFRS 13 ‘Fair value measurement’ for application in accounting periods beginning on or after 1 July 2014. The improvements were endorsed by the EU in December 2014 requiring application on or after 1 January 2015 with early application permitted. The Group adopted the 2011 – 2013 Annual Improvements with effect from 1 January 2015.
There were no other standards or interpretations relevant to the Group’s operations which were adopted during the year.
New standards and interpretations not yet adopted
At the date of authorisation of these consolidated financial statements, the following standards, amendments to standards and interpretations relevant to the Group’s operations were issued by the IASB but not yet mandatory. Except where otherwise stated, the Group does not expect that the adoption of the following standards, amendments to standards and interpretations will have a material impact on the Group’s consolidated financial statements.
MORGAN STANLEY & CO. INTERNATIONAL plc NOTES TO THE CONSOLIDATED FINANCIAL STATEMENTS Year ended 31 December 2015
27
2. BASIS OF PREPARATION (CONTINUED)
New standards and interpretations not yet adopted (continued)
An amendment to IAS 1 ‘Presentation of financial statements’ in relation to the ‘Disclosure initiative’ was issued by the IASB in December 2014, for application in annual periods beginning on or after 1 January 2016. The amendment was endorsed by the EU in December 2015.
An amendment to IAS 7 ‘Statement of Cash Flows’ was issued by the IASB in February 2016. The amendment is applicable for annual periods beginning on or after 1 January 2017. Early application is permitted.
An amendment to IAS 12 ‘Income Taxes’ was issued by the IASB in January 2016, for application in annual periods beginning on or after 1 January 2017. Early application is permitted.
Amendments to IAS 16 ‘Property, plant and equipment’ and IAS 38 ‘Intangible assets’ were issued by the IASB in May 2014, for prospective application in annual periods beginning on or after 1 January 2016. The amendments were endorsed by the EU in December 2015.
IFRS 9 ‘Financial instruments’ (“IFRS 9”) was issued by the IASB in November 2009, amended in November 2013, and revised and reissued by the IASB in July 2014. IFRS 9 is applicable retrospectively, except where otherwise prescribed by transitional provisions of the standard, and is effective for annual periods beginning on or after 1 January 2018. Early adoption, either in full or relating to own credit in isolation, is permitted. The Group is currently assessing the impact of IFRS 9 on its consolidated financial statements.
Amendments to IFRS 10 ‘Consolidation of financial statements’, IFRS 12 ‘Disclosure of interests in other entities’ and IAS 28 ‘Investments in associates’ in relation to ‘Investment entities: Applying the consolidation exemption’ were issued by the IASB in December 2014 for retrospective application in annual periods beginning on or after 1 January 2016.
IFRS 15 ‘Revenue from Contracts with Customers’ (“IFRS 15”) was issued by the IASB in May 2014 for retrospective application in annual periods beginning on or after 1 January 2018. The Group is currently assessing the impact of IFRS 15 on its consolidated financial statements.
IFRS 16 ‘Leases’ was issued by the IASB in January 2016, for retrospective application in annual periods beginning on or after 1 January 2019. The Group is currently assessing the impact of IFRS 16 on its consolidated financial statements.
As part of the 2012 – 2014 Annual Improvements Cycle published in September 2014, the IASB made amendments to the following standards that are relevant to the Group’s operations: IFRS 7 ‘Financial instruments: Disclosures’, IAS 19 ‘Employee benefits’ and IAS 34 ‘Interim financial reporting’ (for application in accounting periods beginning on or after 1 January 2016). The Improvements were endorsed by the EU in December 2015.
Basis of measurement
The consolidated financial statements of the Group are prepared under the historical cost basis, except for certain financial instruments that have been measured at fair value as explained in the accounting policies below.
Restatement of comparative amounts
The consolidated income statement includes a prior year adjustment in order to reduce both interest income and interest expense by $340 million. This relates to interest income and expense that was incorrectly presented gross. This error had no impact on the Group’s profit for the year. Notes 25(b) and 37 have been revised as a result of this restatement.
MORGAN STANLEY & CO. INTERNATIONAL plc NOTES TO THE CONSOLIDATED FINANCIAL STATEMENTS Year ended 31 December 2015
28
2. BASIS OF PREPARATION (CONTINUED)
Use of estimates and sources of uncertainty
The preparation of the Group’s consolidated financial statements requires management to make judgements, estimates and assumptions regarding the valuation of certain financial instruments, impairment of assets, deferred tax balances, pension obligations, the outcome of litigation, and other matters that affect the consolidated financial statements and related disclosures. The Group believes that the estimates utilised in preparing the consolidated financial statements are reasonable, relevant and reliable. Actual results could differ from these estimates.
For further details on the judgements used in determining fair value of certain assets and liabilities, see accounting policy note 3(d) and note 32.
For further details on the judgements used in determining whether the Group should consolidate a structured entity see note 16.
Basis of consolidation
The consolidated financial statements of the Group comprise the financial statements of the Company and its subsidiaries as at 31 December 2015. Subsidiaries are all entities over which the Group has control. The Group controls an entity when the Group is exposed to, or has rights to, variable returns from its involvement with the entity and has the ability to affect those returns through its power over the entity. The financial statements for the subsidiaries are prepared for the same reporting year as the Group, using consistent accounting policies. The financial statements of subsidiaries which have a non-US dollar reporting currency are translated into US dollars as described in note 3(b). Subsidiaries are consolidated from the date that the Group gains control until the date that control ceases.
In certain cases, the Group may exercise control over another entity on behalf of investors or other parties. In such cases it is necessary, as part of the assessment of whether it should consolidate the entity, for the Group to determine whether it exercises such control primarily as an agent for the other investors or whether it does so primarily as principal on its own behalf. In making such a determination, the Group will consider all relevant factors, including in particular:
• the scope of the Group’s decision-making authority over the investee;
• the rights, including removal rights, held by other parties;
• the remuneration to which the Group is entitled; and
• the significance of the Group’s exposure to variability of returns from its interests in the entity.
Intra-group balances, transactions, income and expenses and profits and losses resulting from intra-group transactions are eliminated in preparing the consolidated financial statements.
Non-controlling interests represent the portion of profit or loss and total equity not owned, directly or indirectly, by the Group and are presented separately in the consolidated income statement, consolidated statement of comprehensive income and within equity in the consolidated statement of financial position, separately from parent shareholders’ equity. The amount of non-controlling interest is measured at the non-controlling interest’s proportionate share of the identifiable net assets.
Details of the Group’s interests in other entities are given in note 16 to these financial statements.
The going concern assumption
The Group’s business activities, together with the factors likely to affect its future development, performance and position, are reflected in the Strategic report on pages 1 to 14. In addition, the notes to the consolidated financial statements include the Group’s objectives, policies and processes for managing its capital; its financial risk management objectives; details of its financial instruments; and its exposures to credit risk and liquidity risk.
MORGAN STANLEY & CO. INTERNATIONAL plc NOTES TO THE CONSOLIDATED FINANCIAL STATEMENTS Year ended 31 December 2015
29
2. BASIS OF PREPARATION (CONTINUED) The going concern assumption (continued)
As set out in the Strategic report, retaining sufficient liquidity and capital to withstand market pressures remains central to the Morgan Stanley Group’s and the Group’s strategy.
Taking all of these factors into consideration, the Directors believe it is reasonable to assume that the Group will have access to adequate resources to continue in operational existence for the foreseeable future. Accordingly, they continue to adopt the going concern basis in preparing the annual reports and consolidated financial statements.
3. SUMMARY OF SIGNIFICANT ACCOUNTING POLICIES
a. Functional currency
Items included in the consolidated financial statements are measured and presented in US dollars, the currency of the primary economic environment in which the Group operates.
All currency amounts in the consolidated financial statements, Strategic report and Directors’ report are rounded to the nearest million US dollars (unless otherwise stated).
b. Foreign currencies
All monetary assets and liabilities denominated in currencies other than US dollars are translated into US dollars at the rates ruling at the reporting date. Transactions and non-monetary assets and liabilities denominated in currencies other than US dollars are recorded at the rates prevailing at the dates of the transactions. Foreign exchange differences on available-for-sale financial assets are recorded in the ‘Available-for-sale reserve’ in equity, with the exception of translation differences on the amortised cost of monetary available-for-sale assets, which are recognised through the consolidated income statement. Assets and liabilities of operations which have a non-US dollar reporting currency are translated into US dollars using the closing rate method. Translation differences arising from net investments in non-US dollar reported operations are taken to the ‘currency translation reserve’. All other translation differences are taken through the consolidated income statement. Exchange differences recognised in the consolidated income statement are presented in ‘Other income’ or ‘Other expense’, except where noted in 3(c) below.
On disposal of a foreign operation, the related cumulative gain or loss in the ‘currency translation reserve’ attributable to the owners of the parent is reclassified to the consolidated income statement and recorded within ‘Net currency translation gain / (loss) on disposal of subsidiary’.
c. Financial instruments
The Group classifies its financial assets into the following categories on initial recognition: financial assets classified as held for trading; financial assets designated at fair value through profit or loss; available-for-sale financial assets; and loans and receivables.
The Group classifies its financial liabilities into the following categories on initial recognition: financial liabilities classified as held for trading; financial liabilities designated at fair value through profit or loss; and financial liabilities at amortised cost.
More information regarding these classifications is included below:
i) Financial instruments classified as held for trading
Purchases and sales of non-derivative financial instruments classified as held for trading are initially recognised on settlement date at fair value, including regular way securities transactions. For purchases of non-derivative financial instruments classified as held for trading, from the date that the terms are agreed (trade date) until the settlement date, the Group recognises any unrealised fair value in the consolidated statement of financial position as ‘Financial instruments classified as held for trading’
MORGAN STANLEY & CO. INTERNATIONAL plc NOTES TO THE CONSOLIDATED FINANCIAL STATEMENTS Year ended 31 December 2015
30
3. SUMMARY OF SIGNIFICANT ACCOUNTING POLICIES (CONT INUED)
c. Financial instruments (continued)
i) Financial instruments classified as held for trading (continued)
with corresponding profit or loss recognised within the consolidated income statement in ‘Net gains/ (losses) on financial instruments classified as held for trading’. For sales of non-derivative financial instruments unrealised fair value changes are no longer recognised in the consolidated income statement from trade date. Upon settlement date the resulting financial instrument is recognised or de-recognised from the consolidated statement of financial position.
Derivatives are initially recognised on trade date at fair value. All subsequent changes in fair value are reflected in the consolidated income statement in ‘Net gains/ (losses) on financial instruments classified as held for trading’.
All changes in fair value, foreign exchange differences, interest and dividends are reflected in the consolidated income statement in ‘Net gains/ (losses) on financial instruments classified as held for trading’. When interest is included as a component of the instruments’ fair value, interest is also reflected in the income statement in ‘Net gains/ (losses) on financial instruments classified as held for trading’, otherwise, it is included within ‘Interest income’.
For all financial instruments classified as held for trading, transaction costs are excluded from the initial fair value measurement of the financial instrument. These costs are recognised in the consolidated income statement in ‘Other expense’.
ii) Financial instruments designated at fair value through profit or loss
The Group has designated certain financial instruments at fair value through profit or loss when:
• the financial instruments are managed, evaluated and reported internally on a fair value basis;
• the designation at fair value eliminates or significantly reduces an accounting mismatch which would otherwise arise; or
• the financial instrument contains an embedded derivative that significantly modifies the cash flows that would otherwise be required under the contract.
From the date the transaction in a financial instrument designated at fair value through profit or loss is entered into (trade date) until settlement date, the Group recognises any unrealised fair value changes in the contract as financial instruments designated at fair value through profit or loss. On settlement date, the fair value of consideration given or received is recognised as a financial instrument designated at fair value through profit or loss (see note 3(d) below). All subsequent changes in fair value, foreign exchange differences, interest and dividends are reflected in the consolidated income statement in ‘Net gains/ (losses) on financial instruments designated at fair value through profit or loss’.
Transaction costs are excluded from the initial fair value measurement of the financial instrument. These costs are recognised in the consolidated income statement in ‘Other expense’.
iii) Available-for-sale financial assets
Financial assets classified as available-for-sale are non-derivative financial assets that are either designated in this category or not classified in any of the other categories of financial instruments. Financial assets classified as available-for-sale are recorded on trade date and are initially recognised and subsequently measured at fair value (see note 3(d) below).
Transaction costs that are directly attributable to the acquisition of an available-for-sale financial asset are added to the fair value on initial recognition.
For equity instruments, dividend income and impairment losses are recognised in the consolidated income statement in ‘Net gains/ (losses) on available-for-sale financial assets’. All other gains and losses on equity instruments classified as available-for-sale are recognised in the ‘Available-for-sale reserve’ within equity.
MORGAN STANLEY & CO. INTERNATIONAL plc NOTES TO THE CONSOLIDATED FINANCIAL STATEMENTS Year ended 31 December 2015
31
3. SUMMARY OF SIGNIFICANT ACCOUNTING POLICIES (CON TINUED) c. Financial instruments (continued)
On disposal or impairment of an available-for-sale financial asset, the cumulative gain or loss in the ‘Available-for-sale reserve’ is reclassified to the consolidated income statement and reported in ‘Net gains/ (losses) on available-for-sale financial assets’.
iv) Loans and receivables and financial liabilities at amortised cost
Financial assets classified as loans and receivables are recognised when the Group becomes a party to the contractual provisions of the instrument. They are initially measured at fair value (see note 3(d) below) and subsequently measured at amortised cost less allowance for impairment. Interest is recognised in the consolidated income statement in ‘Interest income’, using the effective interest rate method as described below. Transaction costs that are directly attributable to the acquisition of the financial asset are added to or deducted from the fair value on initial recognition. Impairment losses and reversals of impairment losses on financial assets classified as loans and receivables are recognised in the consolidated income statement in ‘Other expense’.
Financial liabilities at amortised cost are recognised when the Group becomes a party to the contractual provisions of the instrument. They are initially measured at fair value (see note 3(d) below) and subsequently measured at amortised cost. Interest is recognised in the consolidated income statement in ‘Interest expense’ using the effective interest rate method as described below. Transaction costs that are directly attributable to the issue of the financial liability are added to or deducted from the fair value on initial recognition.
The effective interest rate method is a method of calculating the amortised cost of a financial instrument (or a group of financial instruments) and of allocating the interest income or interest expense over the expected life of the financial instrument. The effective interest rate is the rate that exactly discounts the estimated future cash payments and receipts through the expected life of the financial instrument (or, where appropriate a shorter period) to the carrying amount of the financial instrument. The effective interest rate is established on initial recognition of the financial instrument. The calculation of the effective interest rate includes all fees and commissions paid or received, transaction costs, and discounts or premiums that are an integral part of the effective interest rate. Transaction costs are incremental costs that are directly attributable to the acquisition, issue or disposal of a financial instrument.
In the course of financing its business and as part of its trading activities, the Group enters into arrangements which involve the sale of securities with agreements to repurchase, the purchase of securities with resale agreements, the lending of securities with collateral received and the borrowing of securities with collateral given. Cash collateral balances repayable and accrued interest arising under repurchase agreements and securities lending arrangements are classified as ‘Financial liabilities at amortised cost’ and the related securities, where owned by the Group, are included in ‘Financial assets classified as held for trading’. Cash collateral balances receivable and accrued interest arising under resale agreements and securities borrowing arrangements are classified as ‘Loans and receivables’. Securities received by the Group under resale arrangements and securities borrowing arrangements are generally not recognised on the consolidated statement of financial position.
d. Fair value
Fair value measurement
Fair value is defined as the price that would be received to sell an asset or paid to transfer a liability (i.e. the “exit price”) in an orderly transaction between market participants at the measurement date.
Where the Group manages a group of financial assets and financial liabilities on the basis of its net exposure to either market or credit risk, the Group measures the fair value of that group of financial instruments consistently with how market participants would price the net risk exposure at the measurement date.
MORGAN STANLEY & CO. INTERNATIONAL plc NOTES TO THE CONSOLIDATED FINANCIAL STATEMENTS Year ended 31 December 2015
32
3. SUMMARY OF SIGNIFICANT ACCOUNTING POLICIES (CONTINUED)
d. Fair value (continued)
Fair value measurement (continued)
The fair value of a financial instrument on initial recognition is the transaction price (i.e. the fair value of the consideration given or received).
In determining fair value, the Group uses various valuation approaches and establishes a hierarchy for inputs used in measuring fair value that maximises the use of relevant observable inputs and minimises the use of unobservable inputs by requiring that the most observable inputs be used when available. Observable inputs are inputs that market participants would use in pricing the asset or liability developed based on market data obtained from sources independent of the Group. Unobservable inputs are inputs that reflect the Group’s assumptions about the assumptions other market participants would use in pricing the asset or liability, that are developed based on the best information available in the circumstances.
The hierarchy is broken down into three levels based on the observability of inputs as follows:
• Level 1 - Quoted prices (unadjusted) in an active market for identical assets or liabilities
Valuations based on quoted prices in active markets for identical assets or liabilities that the Group has the ability to access. Valuation adjustments and block discounts are not applied to Level 1 instruments. Since valuations are based on quoted prices that are readily and regularly available in an active market, valuation of these products does not entail a significant degree of judgement.
• Level 2 - Valuation techniques using observable inputs
Valuations based on one or more quoted prices in markets that are not active or for which all significant inputs are observable, either directly or indirectly.
• Level 3 - Valuation techniques with significant unobservable inputs
Valuations based on inputs that are unobservable and significant to the overall fair value measurement.
The availability of observable inputs can vary from product to product and is affected by a wide variety of factors, including, for example, the type of product, whether the product is new and not yet established in the marketplace, the liquidity of markets and other characteristics particular to the product. To the extent that valuation is based on models or inputs that are less observable or unobservable in the market, the determination of fair value requires more judgement. Accordingly, the degree of judgement exercised by the Group in determining fair value is greatest for instruments categorised in Level 3 of the fair value hierarchy.
The Group considers prices and inputs that are current as of the measurement date, including during periods of market dislocation. In periods of market dislocation, the observability of prices and inputs may be reduced for many instruments. This condition could cause an instrument to be reclassified from Level 1 to Level 2 or from Level 2 to Level 3 of the fair value hierarchy. In addition, a downturn in market conditions could lead to declines in the valuation of many instruments.
In certain cases, the inputs used to measure fair value may fall into different levels of the fair value hierarchy. In such cases, for disclosure purposes, the level in the fair value hierarchy within which the fair value measurement falls in its entirety is determined based on the lowest level input that is significant to the fair value measurement in its entirety.
MORGAN STANLEY & CO. INTERNATIONAL plc NOTES TO THE CONSOLIDATED FINANCIAL STATEMENTS Year ended 31 December 2015
33
3. SUMMARY OF SIGNIFICANT ACCOUNTING POLICIES (CONTINU ED)
d. Fair value (continued)
Fair value measurement (continued)
The Group incorporates FVA into the fair value measurements of OTC uncollateralised or partially collateralised derivatives, and in collateralised derivatives where the terms of the agreement do not permit the re-use of the collateral received. In general, FVA reflects a market funding risk premium inherent in the noted derivative instruments. The methodology for measuring FVA leverages the Group’s existing credit-related valuation adjustment calculation methodologies, which apply to both assets and liabilities.
Valuation techniques
Many cash instruments and OTC derivative contracts have bid and ask prices that can be observed in the marketplace. Bid prices reflect the highest price that a party is willing to pay for an asset. Ask prices represent the lowest price that a party is willing to accept for an asset. For financial instruments whose inputs are based on bid-ask prices, the Group does not require that the fair value estimate always be a predetermined point in the bid-ask range. The Group’s policy is to allow for mid-market pricing and to adjust to the point within the bid-ask range that meets the Group’s best estimate of fair value. For offsetting positions in the same financial instrument, the same price within the bid-ask spread is used to measure both the long and short positions.
Fair value for many cash instruments and OTC derivative contracts is derived using pricing models. Pricing models take into account the contract terms (including maturity), as well as multiple inputs including, where applicable, commodity prices, equity prices, interest rate yield curves, credit curves, correlation, creditworthiness of the counterparty, creditworthiness of the Group, option volatility and currency rates. Where appropriate, valuation adjustments are made to account for various factors such as liquidity risk (bid-ask adjustments), credit quality, model uncertainty and concentration risk.
Adjustments for liquidity risk adjust model-derived mid-market levels of Level 2 and Level 3 financial instruments for the bid-mid or mid-ask spread required to properly reflect the exit price of a risk position. Bid-mid and mid-ask spreads are marked to levels observed in trade activity, broker quotes or other external third-party data. Where these spreads are unobservable for the particular position in question, spreads are derived from observable levels of similar positions.
Credit valuation adjustments are applied to both short-term instruments and long-term borrowings (primarily structured notes) which are designated at fair value through profit or loss and to OTC derivatives. The impact of changes in own credit spreads based upon observations of secondary bond market spreads is considered when measuring the fair value for short-term and long-term borrowings. For OTC derivatives, the impact of changes in both the Group’s and the counterparty’s credit standing is considered when measuring fair value. In determining the expected exposure the Group simulates the distribution of the future exposure to a counterparty, then applies market-based default probabilities to the future exposure, leveraging external third-party credit default swap (“CDS”) spread data. Where CDS spread data are unavailable for a specific counterparty, bond market spreads, credit CDS spread data based on the counterparty’s credit rating or CDS spread data that reference a comparable counterparty may be utilised. The Group also considers collateral held and legally enforceable master netting agreements that mitigate the Group’s exposure to each counterparty.
Adjustments for model uncertainty are taken for positions whose underlying models are reliant on significant inputs that are neither directly nor indirectly observable, hence requiring reliance on established theoretical concepts in their derivation. These adjustments are derived by making assessments of the possible degree of variability using statistical approaches and market-based information where possible. The Group generally subjects all valuations and models to a review process initially and on a periodic basis thereafter.
MORGAN STANLEY & CO. INTERNATIONAL plc NOTES TO THE CONSOLIDATED FINANCIAL STATEMENTS Year ended 31 December 2015
34
3. SUMMARY OF SIGNIFICANT ACCOUNTING POLICIES (CONTINU ED)
d. Fair value (continued)
Valuation techniques (continued)
The Group may apply a concentration adjustment to certain of its OTC derivatives portfolios to reflect the additional cost of closing out a particularly large risk exposure. Where possible, these adjustments are based on observable market information but in many instances significant judgement is required to estimate the costs of closing out concentrated risk exposures due to the lack of liquidity in the marketplace.
Fair value is a market-based measure considered from the perspective of a market participant rather than an entity-specific measure. Therefore, even when market assumptions are not readily available, the Group’s own assumptions are set to reflect those that the Group believes market participants would use in pricing the asset or liability at the measurement date.
Valuation process
The Valuation Review Group (“VRG”) within the Financial Control Group (“FCG”) is responsible for the Group’s fair value valuation policies, processes and procedures. VRG is independent of the business units and reports to the Chief Financial Officer of the Morgan Stanley Group (“CFO”), who has final authority over the valuation of the Group’s financial instruments. VRG implements valuation control processes to validate the fair value of the Group’s financial instruments measured at fair value including those derived from pricing models. These control processes are designed to ensure that the values used for financial reporting are based on observable inputs wherever possible. In the event that observable inputs are not available, the control processes are designed to ensure that the valuation approach utilised is appropriate and consistently applied and that the assumptions are reasonable.
The Group’s control processes apply to all financial instruments, unless otherwise noted. These control processes include:
• Model Review. VRG, in conjunction with the Market Risk Department and, where appropriate, the Credit Risk Management Department, both of which report to the Chief Risk Officer of the Morgan Stanley Group (“CRO”), independently review valuation models’ theoretical soundness, the appropriateness of the valuation methodology and calibration techniques developed by the business units using observable inputs. Where inputs are not observable, VRG reviews the appropriateness of the proposed valuation methodology to ensure it is consistent with how a market participant would arrive at the unobservable input. The valuation methodologies utilised in the absence of observable inputs may include extrapolation techniques and the use of comparable observable inputs. As part of the review, VRG develops a methodology to independently verify the fair value generated by the business unit’s valuation models. Before trades are executed using new valuation models, those models are required to be independently reviewed. All of the Group’s valuation models are subject to an independent annual VRG review.
• Independent Price Verification. The business units are responsible for determining the fair value of financial instruments using approved valuation models and valuation methodologies. Generally on a monthly basis, VRG independently validates the fair values of financial instruments determined using valuation models by determining the appropriateness of the inputs used by the business units and by testing compliance with the documented valuation methodologies approved in the model review process described above.
VRG uses recently executed transactions, other observable market data such as exchange data, broker/ dealer quotes, third-party pricing vendors and aggregation services for validating the fair values of financial instruments generated using valuation models. VRG assesses the external sources and their valuation methodologies to determine if the external providers meet the minimum standards expected of a third-party pricing source. Pricing data provided by approved external sources are evaluated using a number of approaches; for example, by corroborating the external sources’ prices to executed trades, by analysing the methodology and assumptions used by the external source to generate a price and/ or by evaluating how active the third-party pricing source (or originating sources used by the third-party
MORGAN STANLEY & CO. INTERNATIONAL plc NOTES TO THE CONSOLIDATED FINANCIAL STATEMENTS Year ended 31 December 2015
35
3. SUMMARY OF SIGNIFICANT ACCOUNTING POLICIES (CONTINUED)
d. Fair value (continued)
Valuation process (continued)
pricing source) is in the market. Based on this analysis, VRG generates a ranking of the observable market data to ensure that the highest-ranked market data source is used to validate the business unit’s fair value of financial instruments.
For financial instruments where the fair value is based on unobservable inputs, VRG reviews the business unit’s valuation techniques to ensure these are consistent with market participant assumptions.
The results of this independent price verification and any adjustments made by VRG to the fair value generated by the business units are presented to management of the Morgan Stanley Group’s three business segments (i.e. Institutional Securities, Wealth Management and Investment Management), the CFO and the CRO on a regular basis.
• Review of Transactions where the valuation is based on unobservable inputs. VRG reviews the models and valuation methodology used to price all new material Level 3 transactions and both FCG and Market Risk Department management must approve the fair value of the trade that is initially recognised.
Gains and losses on inception
In the normal course of business, the fair value of a financial instrument on initial recognition is the transaction price (i.e. the fair value of the consideration given or received). In certain circumstances, however, the fair value will be based on other observable current market transactions in the same instrument, without modification or repackaging, or on a valuation technique whose variables include only data from observable markets. When such evidence exists, the Group recognises a gain or loss on inception of the transaction.
When the use of unobservable market data has a significant impact on determining fair value at the inception of the transaction, the entire initial gain or loss indicated by the valuation technique as at the transaction date is not recognised immediately in the consolidated income statement and is recognised instead when the market data becomes observable.
e. Derecognition of financial assets and liabilities
The Group derecognises a financial asset when the contractual rights to the cash flows from the asset expire, or when it transfers the financial asset and substantially all the risk and rewards of ownership of the asset.
The Group derecognises financial liabilities when the Group’s obligations are discharged, cancelled or they expire.
f. Impairment of financial assets
At each reporting date, an assessment is made as to whether there is any objective evidence of impairment in the value of a financial asset classified as either available-for-sale or loans and receivables. Impairment losses are recognised if an event has occurred which will have an adverse impact on the expected future cash flows of an asset and the expected impact can be reliably estimated.
Impairment losses on available-for-sale financial assets are measured as the difference between cost (net of any principal repayment and amortisation) and the current fair value (see note 3(d) above). Where there is evidence that the available-for-sale financial asset is impaired, the cumulative loss that had been previously recognised in other comprehensive income is reclassified from the ‘Available-for-sale reserve’ and recognised in the consolidated income statement within ‘Net gains/ (losses) on available-for-sale financial assets’.
MORGAN STANLEY & CO. INTERNATIONAL plc NOTES TO THE CONSOLIDATED FINANCIAL STATEMENTS Year ended 31 December 2015
36
3. SUMMARY OF SIGNIFICANT ACCOUNTING POLICIES (CONTINU ED)
f. Impairment of financial assets (continued)
Impairment losses on loans and receivables are measured as the difference between the carrying amount of the loans and receivables and the present value of estimated cash flows discounted at the asset’s original effective interest rate. Such impairment losses are recognised in the consolidated income statement within ‘Other expense’ and are recognised against the carrying amount of the impaired asset on the consolidated statement of financial position. Interest on the impaired asset continues to be accrued on the reduced carrying amount based on the original effective interest rate of the asset.
Subsequent increases in fair value of previously impaired equity available-for-sale financial assets are reported as fair value gains in the ‘Available-for-sale reserve’ through other comprehensive income and not separately identified as an impairment reversal. For all other financial assets, if in a subsequent year, the amount of the estimated impairment loss decreases because of an event occurring after the impairment was recognised, the previously recognised impairment loss is reversed as detailed by financial asset in note 3(c) (iv). Any reversal is limited to the extent that the value of the asset may not exceed the original amortised cost of the asset had no impairment occurred.
g. Impairment of non-financial assets
Non-financial assets that are subject to amortisation are reviewed for impairment whenever events or changes in circumstances indicate that the carrying amount may not be recoverable. An impairment loss is recognised for the amount by which the asset’s carrying amount exceeds its recoverable amount. The recoverable amount is the higher of an asset’s fair value less costs to sell and its value in use. For the purposes of assessing impairment, assets are grouped at the lowest levels for which there are separately identifiable cash flows (cash generating units). Non-financial assets, other than goodwill, that have suffered an impairment are reviewed for possible reversal of the impairment at the end of each reporting period. Such impairment losses are recognised in the consolidated income statement within ‘Other expense’ and are recognised against the carrying amount of the impaired asset on the consolidated statement of financial position.
h. Fees and commissions
Fees and commissions classified within ‘Other income’ in the consolidated income statement include account servicing fees, investment management fees, sales commissions, placement fees, advisory fees and syndication fees. Fees and commissions classified within ‘Other expense’ in the consolidated income statement include transaction and service fees. These amounts are recognised as the related services are performed or received.
i. Property, plant and equipment
Property, plant and equipment are stated at cost net of depreciation and any provision for impairment in value, which are included within ‘Other expense’ in the consolidated income statement.
For premises held under operating leases, a reinstatement provision is recognised for the estimated cost to reinstate the premises at the end of the lease period. When the reinstatement provision is established and included within ‘Provisions’ in the consolidated statement of financial position, an equivalent asset is recognised and included in the cost of leasehold improvements at the initial present value of any reinstatement obligations. The discount effect included in the reinstatement provision is reversed over time using a constant effective yield method and included within ‘Interest expense’ in the consolidated income statement. The reinstatement asset is depreciated over the useful economic life of the relevant leasehold improvement asset and the depreciation charge is included within ‘Other expense’ in the consolidated income statement.
Depreciation is provided on property, plant and equipment at rates calculated to write off the cost of the assets on a straight line basis over their expected useful lives as follows:
Leasehold improvements including reinstatement assets - shorter of remaining lease term and 25 years
Fixtures, fittings and equipment - 3 to 8 years
MORGAN STANLEY & CO. INTERNATIONAL plc NOTES TO THE CONSOLIDATED FINANCIAL STATEMENTS Year ended 31 December 2015
37
3. SUMMARY OF SIGNIFICANT ACCOUNTING POLICIES (CONTINU ED)
j. Business combinations and disposals.
i) Combination of businesses
Business combinations are accounted for using the acquisition method of accounting.
Consideration for each acquisition is measured at the date at which a business combination occurs (the “acquisition date”) at the fair value of the assets transferred, liabilities incurred (including any asset or liability resulting from a contingent consideration arrangement) and equity instruments issued by the Group in exchange for control of the acquiree.
Acquisition related costs are recognised in the consolidated income statement as incurred.
Identifiable assets acquired and liabilities (including contingent liabilities) assumed, which meet the conditions for recognition under IFRS 3, are recognised initially at acquisition-date fair values, with the exception that:
• deferred tax assets and liabilities are recognised and measured in accordance with IAS 12; • assets related to employee benefit arrangements are recognised and measured in accordance with
IAS 19; • liabilities or equity instruments related to the replacement of an acquiree’s share-based payment
award are measured in accordance with IFRS 2, and • acquired non-current assets or disposal groups that are classified as held for sale at the acquisition
date in accordance with IFRS 5 ‘Non-current assets held for sale and discontinued operations’ are reported at their fair value less cost to sell.
A contingent liability assumed is recognised where there is a present obligation that arises from past events and its fair value can be measured reliably, regardless of whether it is probable that an outflow of resources will be required to settle the obligation.
A non-controlling interest in the acquiree is recognised (in respect of any portion of the total assets less total liabilities of an acquired entity that is not owned by the Group) at fair value.
Any excess of the sum of the consideration and the amount of any non-controlling interest in the acquiree over the fair value of the identifiable assets acquired less liabilities assumed is recognised as goodwill. If the sum of the consideration and the amount of any non-controlling interest in the acquiree is less than the fair value of the identifiable assets acquired less liabilities assumed, the gain on acquisition is recognised in the consolidated income statement in the year of acquisition.
If the initial accounting for a business combination is incomplete by the end of the reporting period in which the combination occurred, the Group reports provisional amounts for the items for which the accounting is incomplete. The measurement period (which may not exceed one year) is the period from the date of acquisition to the date the Group obtains complete information about the facts and circumstances that existed as of the acquisition date. Provisional amounts may be adjusted during the measurement period, or additional assets or liabilities recognised, to reflect any new information obtained about the facts and circumstances that existed at the acquisition date that, if known, would have affected the amounts recognised at that date.
Subsequent changes to the fair value of any asset or liability resulting from a contingent consideration arrangement during the measurement period are adjusted against the cost of acquisition. Changes in the fair value of contingent consideration classified as equity are not recognised.
Post-acquisition, income received and expenses incurred by the entity or entities acquired are included in the consolidated income statement on a line-by-line basis in accordance with the accounting policies set out herein.
MORGAN STANLEY & CO. INTERNATIONAL plc NOTES TO THE CONSOLIDATED FINANCIAL STATEMENTS Year ended 31 December 2015
38
3. SUMMARY OF SIGNIFICANT ACCOUNTING POLICIES (CONTINU ED)
j. Business combinations and disposals (continued)
i) Combination of businesses (continued)
Disposal of subsidiaries
When subsidiaries are sold or the Group ceases to control an entity, the difference between the proceeds (plus the fair value of any investment retained), and the total assets less total liabilities disposed of, cumulative translation differences and unamortised goodwill, is recognised in the consolidated income statement within ‘Gain/ (loss) on disposal of subsidiary’. Where the disposal or loss of control over an entity includes a foreign operation, all foreign exchange differences accumulated in the ‘Currency translation reserve’ attributable to the equity holders of the parent are reclassified to the consolidated income statement within ‘Gain/ (loss) on disposal of subsidiary’.
ii) Combination of businesses under common control
Business combinations involving entities under common control, where all combining entities are ultimately controlled by the same entity before and after the business combination, are accounted for using the predecessor values method of accounting. This involves recognising assets and liabilities of the acquired business at the predecessors’ book value, without any change to reflect fair value of those assets and liabilities. Any difference between the cost of acquisition and the aggregate book value of the assets and liabilities as of the date of the transfer of the acquired entity is recorded as an adjustment to equity within the ‘Capital contribution reserve’. No additional goodwill is created by the business combination.
Post-acquisition, income received and expenses incurred by the entity or entities acquired are included in the consolidated income statement on a line-by-line basis in accordance with the accounting policies set out herein.
A non-controlling interest is recognised by the Group in respect of any portion of the total assets less total liabilities of an acquired entity or entities that is not owned by the Group.
When subsidiaries are sold or transferred to another entity under common control, any difference between the consideration received and the aggregate book value of the assets and liabilities of the disposed of business is recorded as an adjustment to equity within the ‘Capital contribution reserve’. Where the consideration for the transfer is received in the form of shares, these are recorded at the aggregate book value of the assets and liabilities disposed of.
k. Cash and cash equivalents
For the purposes of the consolidated statement of cash flows, cash and cash equivalents comprise cash and demand deposits with banks, net of outstanding bank overdrafts, along with highly liquid investments, with original maturities of three months or less, that are readily convertible to known amounts of cash and subject to insignificant risk of change in value.
l. Income tax
The tax expense represents the sum of the tax currently payable and deferred tax.
The tax currently payable is calculated based on taxable profit for the year. Taxable profit may differ from profit/ (loss) before income tax as reported in the consolidated income statement because it excludes items of income or expense that are taxable or deductible in other years and it further excludes items that are never taxable or deductible. The Group’s liability for current tax is calculated using tax rates that have been enacted or substantively enacted by the reporting date. Current tax is charged or credited in the consolidated income statement, except when it relates to items charged or credited directly to other comprehensive income or equity, in which case the current tax is also recorded within other comprehensive income or equity respectively.
MORGAN STANLEY & CO. INTERNATIONAL plc NOTES TO THE CONSOLIDATED FINANCIAL STATEMENTS Year ended 31 December 2015
39
3. SUMMARY OF SIGNIFICANT ACCOUNTING POLICIES (CONT INUED)
l. Income tax (continued)
Deferred tax is the tax expected to be payable or recoverable on differences between the carrying amounts of assets and liabilities in the consolidated financial statements and the corresponding tax bases used in the computation of taxable profit, and is accounted for using the balance sheet liability method. Deferred tax liabilities are generally recognised for all taxable temporary differences and deferred tax assets are recognised to the extent that it is probable that taxable profits will be available against which deductible temporary differences can be utilised.
Deferred tax liabilities are recognised for taxable temporary differences arising on investments in subsidiaries, except where the Group is able to control the reversal of the temporary difference and it is probable that the temporary difference will not reverse in the foreseeable future.
The carrying amount of deferred tax assets is reviewed at each reporting date and limited to the extent that it is probable that sufficient taxable profits will be available to allow all or part of the asset to be recovered.
Deferred tax is calculated at the tax rates that are expected to apply in the period when the liability is settled or the asset is realised. Deferred tax is charged or credited in the consolidated income statement, except when it relates to items charged or credited directly to other comprehensive income or equity, in which case the deferred tax is reflected within other comprehensive income or equity, respectively.
Current tax assets are offset against current tax liabilities when there is a legally enforceable right to set off current tax assets against current tax liabilities and the Group intends to settle its current tax assets and current tax liabilities on a net basis or to realise the asset and settle the liability simultaneously. Deferred tax assets and liabilities are offset when there is a legally enforceable right to set off current tax assets against current tax liabilities and when they relate to income taxes levied by the same taxation authority and the Group intends to settle its current tax assets and current tax liabilities on a net basis.
m. Operating leases
Rentals payable under operating leases are charged to ‘Other expense’ in the consolidated income statement on a straight line basis over the lease term. Lease incentives are allocated on a straight line basis over the lease term as a reduction to rental expense.
Rentals receivable under operating leases are credited to ‘Other income’ in the consolidated income statement on a straight line basis over the lease term. Initial direct costs incurred in negotiating and arranging the lease are added to the carrying amount of the leased asset and recognised in the consolidated income statement on a straight line basis over the lease term. Lease incentives are allocated on a straight line basis over the lease term.
n. Provisions
Provisions are recognised when the Group has a present obligation as a result of a past event, when it is probable that an outflow of resources embodying economic benefits will be required to settle the obligation and when a reliable estimate can be made of the amount of the obligation.
The amount recognised as a provision is the best estimate of the consideration required to settle the present obligation at the year end date, taking into account the risks and uncertainties surrounding the obligation. Where a provision is measured using the cash flows estimated to settle the present obligation, its carrying amount is the present value of those cash flows.
MORGAN STANLEY & CO. INTERNATIONAL plc NOTES TO THE CONSOLIDATED FINANCIAL STATEMENTS Year ended 31 December 2015
40
3. SUMMARY OF SIGNIFICANT ACCOUNTING POLICIES (CONTINU ED)
o. Employee compensation plans
i) Equity-settled share-based compensation plans
Morgan Stanley operates equity-based compensation plans on behalf of the Group in relation to which, the Group pays Morgan Stanley in consideration of the procurement of the transfer of shares to employees. The cost of equity-based transactions with employees is measured based on the fair value of the equity instruments at grant date. Fair value of stock unit awards is based on the market price of Morgan Stanley shares and fair value of stock option awards is estimated using the Black-Scholes valuation model, which takes into account the option’s exercise price, its expected term, the risk free interest rate and the expected volatility of the market price of Morgan Stanley shares. Non-market vesting conditions are not taken into account when measuring fair value, but are reflected by adjusting over time the number of equity instruments included in the measurement of the transaction such that the amount ultimately recognised reflects the number that actually vest. The expense is recorded within ‘Staff costs’ in ‘Other expense’ in the consolidated income statement; the corresponding credit to retained earnings is reduced to the extent that payments are due to Morgan Stanley in respect of these awards.
ii) Other deferred compensation plans
Morgan Stanley also maintains deferred compensation plans on behalf of the Group for the benefit of certain employees that provide a return to the participating employees based upon the performance of various referenced investments. Liabilities for these awards, which are included within ‘Accruals and deferred income’ in the consolidated statement of financial position, are measured at fair value and recognised over time in accordance with the awards’ vesting conditions. The related expense is recorded within ‘Staff costs’ in ‘Other expense’. The Group economically hedges the exposure created by these deferred compensation schemes by entering into derivative transactions with other Morgan Stanley Group undertakings. The derivatives are recognised within ‘Financial instruments classified as held for trading’ in the consolidated statement of financial position and the related gains and losses are recorded within ‘Net gains/ (losses) on financial instruments classified as held for trading’ in the consolidated income statement.
p. Post-employment benefits
The Group operates defined contribution and defined benefit post-employment plans.
Contributions due in relation to the Group’s defined contribution post-employment plan are recognised in ‘Other expense’ in the consolidated income statement when payable.
For the Group’s defined benefit post-employment plan, the plan obligations are measured on an actuarial basis in accordance with the advice of an independent qualified actuary using the projected unit credit method and discounted at a rate that reflects the current rate of return on a high quality corporate bond of equivalent term and currency to the plan liabilities. Plan assets are measured at their fair value at the reporting date. A surplus or deficit of plan assets over liabilities is recognised in the consolidated statement of financial position as an asset or a liability respectively. If the fair value of the plan assets is higher than the present value of the defined benefit obligation, the measurement of the resulting defined benefit asset is limited to the present value of economic benefits available in the form of refunds from the plan or reductions in future contributions to the plan. The current service cost and any past service costs together with the net interest on the net defined benefit obligation/ asset is charged to ‘Staff costs’ within ‘Other expense’ in the consolidated income statement. Remeasurements that arise in calculating the Group’s obligation in respect of a plan are recognised in other comprehensive income, in the period in which they occur.
Details of the plans are given in note 36 to these consolidated financial statements.
MORGAN STANLEY & CO. INTERNATIONAL plc NOTES TO THE CONSOLIDATED FINANCIAL STATEMENTS Year ended 31 December 2015
41
3. SUMMARY OF SIGNIFICANT ACCOUNTING POLICIES (CONTINU ED)
q. Offsetting of financial assets and financial liabilities
Where there is a currently legally enforceable right to set off the recognised amounts and an intention to either settle on a net basis or to realise the asset and the liability simultaneously, financial assets and financial liabilities are offset and the net amount is presented on the consolidated statement of financial position. In the absence of such conditions, financial assets and financial liabilities are presented on a gross basis.
4. NET GAINS ON AVAILABLE-FOR-SALE FINANCIAL ASSETS 2015 2014 $millions $millions
Net fair value gains reclassified from the available-for-sale reserve on disposal of assets
- 1
5. INTEREST INCOME AND INTEREST EXPENSE ‘Interest income’ represents total interest generated from financial assets whilst ‘interest expense’ represents total interest generated from financial liabilities with the exception that:
(a) when interest is included as a component of the instruments fair value, interest is reflected in ‘net gains/ (losses) on financial instruments classified as held for trading’; and
(b) interest expense generated from ‘financial liabilities classified as held for trading’ is reported as a reduction in ‘interest income’.
‘Interest income’ also includes fees paid on securities borrowed transactions and ‘interest expense’ includes fees received on securities loaned balances and from prime brokerage customers for stock loan transactions incurred to cover customers’ short positions.
No other gains or losses have been recognised in respect of loans and receivables other than as disclosed as ‘Interest income’, and foreign exchange differences and impairment losses and reversals of impairment losses disclosed in ‘Other expense’ (note 7).
6. OTHER INCOME 2015 2014 $millions $millions Fee and commission income:
Advisory fees 507 454 Underwriting fees 701 810 Trust and other fiduciary activities 53 29 Non-UK capital gains tax recoverable 18 (105) Other 63 67 1,342 1,255
The non-UK capital gains tax recoverable amount for the year ended 31 December 2014 represents a reduction to the expected reimbursement from clients on certain equity transactions. Contractually the clients are legally bound to reimburse the Group for any tax, levy, duty, charge, assessment or fee, directly or indirectly, in connection with or arising from these equity transactions. A reduction in tax expense incurred by the Group in relation to these equity transactions was reflected in ‘Income tax expense’ within the consolidated income statement for the year ended 31 December 2014 (see note 8).
MORGAN STANLEY & CO. INTERNATIONAL plc NOTES TO THE CONSOLIDATED FINANCIAL STATEMENTS Year ended 31 December 2015
42
7. OTHER EXPENSE 2015 2014 $millions $millions Direct staff costs 158 220 Management charges from other Morgan Stanley Group undertakings relating to staff costs 1,616 2,194
Management charges from other Morgan Stanley Group undertakings relating to other services 392 670 Brokerage fees 548 527 Administration and corporate services 341 343 Professional services 371 379 UK Bank levy 78 65 Operating lease rentals 6 7 Depreciation on property, plant and equipment 2 3 Impairment losses on loans and receivables (see note 9) 17 15 Reversal of impairment losses on loans and receivables (see note 9) (10) (5) Net foreign exchange losses 10 2 Auditor's remuneration:
Fees payable to the Company’s auditor and its associates for the audit of the Company’s annual financial statements 5 5
Fees payable to the Company’s auditor and its associates for other services to the Group (1) 1 1
Other 206 132
3,741 4,558
(1) Fees payable to the Company's auditor for other services in 2015 comprise of $274,000 for the audit of the Company’s subsidiaries and $1,106,000 for other assurance services. (2014: $600,000).
Included within ‘Direct staff costs’ and ‘Management charges from other Morgan Stanley Group undertakings relating to staff costs’ are amounts totalling $203 million (2014: $205 million) in relation to equity-settled share-based compensation plans, granted to employees of both the Group and the Morgan Stanley Group. These costs reflect the amortisation of equity-based awards in relation to current and previous years’ awards and are therefore not directly aligned with other staff costs in the current year. Similarly, included within ‘Direct staff costs’ and ‘Management charges from other Morgan Stanley Group undertakings relating to staff costs’ is an amount of $111 million (2014: $373 million) in relation to current and previous years’ awards of non-equity based deferred compensation plans, granted to employees of the Group.
On 1 December 2014, the Compensation, Management Development and Succession ('CMDS') Committee of the Board of Directors of the Morgan Stanley Group approved an approach for awards of discretionary incentive compensation for the 2014 performance year to be granted in 2015 that would reduce the average deferral of such awards to an approximate baseline of 50%. Additionally, the CMDS Committee approved the acceleration of vesting for certain outstanding deferred cash-based incentive compensation awards. The deferred cash-based incentive compensation awards subject to accelerated vesting will be distributed on their regularly scheduled future distribution dates and will continue to be subject to cancellation and clawback provisions. This approach resulted in an increase in both ‘Direct staff costs’ and ‘Management charges from other Morgan Stanley Group undertakings relating to staff costs’ for the year ended 31 December 2014.
MORGAN STANLEY & CO. INTERNATIONAL plc NOTES TO THE CONSOLIDATED FINANCIAL STATEMENTS Year ended 31 December 2015
43
7. OTHER EXPENSE (CONTINUED)
Also included within ‘Direct staff costs’ and ‘Management charges from other Morgan Stanley Group undertakings relating to staff costs’ are amounts totalling $60 million (2014: $76 million) in relation to pension plans (see note 36).
The average number of employees of the Group, including the Directors, is analysed below:
Number Year ended Year ended 31 December 31 December 2015 2014 Company and institutional securities infrastructure 145 137 Business units and other 191 163
336 300
2015 2014 $millions $millions Wages and salaries 140 185 Social security costs 14 28 Pension costs 4 7
158 220
The Group paid no remuneration to its Directors during the current or prior year but incurred management recharges in respect of Directors’ qualifying services provided to the Group which are included within ‘Management charges from other Morgan Stanley Group undertakings relating to staff costs’ within ‘Other expense’. The amount of remuneration received by Directors in respect of their qualifying services to the Group is disclosed in note 37.
8. INCOME TAX EXPENSE 2015 2014 $millions $millions Current tax expense
United Kingdom corporation tax charge
- current year 126 24 - adjustments in respect of prior years 44 (54) Double taxation relief
- current year (93) - - adjustments in respect of prior years (37) 29 Overseas tax
- current year 166 119 - adjustments in respect of prior years 114 (105) 320 13 Deferred tax (benefit)/ expense Origination and reversal of temporary differences 37 (1) Adjustment in respect of prior years (20) 23 Effect of changes in tax rates (28) 1 (11) 23
Income tax expense 309 36
MORGAN STANLEY & CO. INTERNATIONAL plc NOTES TO THE CONSOLIDATED FINANCIAL STATEMENTS Year ended 31 December 2015
44
8. INCOME TAX EXPENSE (CONTINUED)
Reconciliation of effective tax rate
The main differences between the Group’s tax charge and the tax charge that would have been calculated from applying the average standard rate of corporation tax in the UK for the year of 20.25% (2014: 21.49%) are explained below:
2015 2014 $millions $millions Profit/ (loss) before income tax 710 (677) Income tax expense/ (credit) using the average standard rate of corporation tax in the UK of 20.25% (2014: 21.49%) 144 (145)
Impact on tax of: Expenses not deductible for tax purposes: UK bank levy 16 14 Other expenses 4 3 Carry forward of prior years' tax losses 2 1 Group relief surrendered for no cash consideration 8 115 Effect of tax rates in foreign jurisdictions 58 10 Currency translation on tax - 2 Impact of change in deferred tax rate (28) - Prior year impact of withholding tax reclaims 71 - Other prior year adjustments 30 6 Reversal of tax reserves in respect of prior years (2) (13) Other 6 43
Total income tax expense in the consolidated income statement 309 36
The Group has a policy of surrendering tax-deductible losses (‘group relief’) for no cash consideration to other members of the Morgan Stanley UK tax group, which consists of entities within the Group and the wider Morgan Stanley Group. Within the Group, a number of subsidiary companies generate tax-deductible losses which are surrendered to Morgan Stanley companies outside the Group.
Finance Act 2013 enacted a reduction to the UK corporation tax rate to 20% with effect from 1 April 2015. This reduction in the tax rate impacted the current tax charge in 2015.
Finance (No. 2) Act 2015 enacted reductions in the UK corporation tax rate to 19% with effect from 1 April 2017 and 18% with effect from 1 April 2020. These reductions in the tax rate will impact the current tax charge in future periods. In addition Finance (No. 2) Act 2015 introduced an 8% corporation tax surcharge on the profits of banking companies with effect from 1 January 2016 which will impact the current tax charge of the Company in future periods.
The aggregate amount of current and deferred tax charged to other comprehensive income was $nil in 2015. In 2014 a $2 million tax expense was charged to other comprehensive income related to the unwinding of deferred tax on net day one gains not recognised upon initial recognition of financial instruments.
MORGAN STANLEY & CO. INTERNATIONAL plc NOTES TO THE CONSOLIDATED FINANCIAL STATEMENTS Year ended 31 December 2015
45
9. LOANS AND RECEIVABLES 2015 2014 $millions $millions Loans and receivables 145,818 149,393 Less impairment losses (28) (46)
145,790 149,347
A reconciliation of impairment losses for loans and advances is as follows: At 1 January 46 45 Charge for the year (see note 7) 17 15 Reversal of impairment losses (see note 7) (10) (5) Amounts written off (2) (8) Foreign exchange revaluation - (1) Reclassification of provision (23) -
At 31 December 28 46
During the year impairment losses of $23 million related to certain withholding tax reclaim balances were reclassified from loans and receivables to current tax assets. 10. OTHER RECEIVABLES 2015 2014 $millions $millions Amounts held at exchanges 592 514 Amounts due from other Morgan Stanley Group undertakings 1,209 2,702 Other amounts receivable 90 101
1,891 3,317 11. FINANCIAL ASSETS AND FINANCIAL LIABILITIES CLAS SIFIED AS HELD FOR
TRADING 2015 2014 Assets Liabilities Assets Liabilities $millions $millions $millions $millions Government debt securities 11,365 10,747 10,881 8,923 Corporate and other debt 6,969 1,284 11,251 2,219 Corporate equities 40,828 23,424 37,993 15,431 Derivatives (see note 12) 187,111 181,051 235,273 231,255
246,273 216,506 295,398 257,828
There are no terms and conditions of any financial asset or liability classified as held for trading that may individually significantly affect the amount, timing and certainty of future cash flows for the Group.
MORGAN STANLEY & CO. INTERNATIONAL plc NOTES TO THE CONSOLIDATED FINANCIAL STATEMENTS Year ended 31 December 2015
46
12. DERIVATIVES CLASSIFIED AS HELD FOR TRADING 2015
Financial instruments designated at fair value through profit or loss consist primarily of the following financial assets and financial liabilities:
Prepaid OTC contracts: The risk on these financial instruments, both financial assets and financial liabilities, is primarily hedged using financial instruments classified as held for trading including equity securities and interest rate swaps. These prepaid OTC contracts are designated at fair value through profit or loss as such contracts, as well as the financial instruments with which they are hedged, are risk managed on a fair value basis as part of the Group’s trading portfolio and the risk is reported to key management personnel on this basis.
Corporate loans: Certain loans to customers are designated at fair value through profit or loss because either the risks of the loans have been matched with other financial instrument contracts accounted for at fair value and such a designation reduces an accounting mismatch; or as part of a documented risk management strategy the risks of the loan are managed on a fair value basis as part of the Group’s trading portfolio and the risk is reported to key management personnel on this basis; or because the loan contract itself contains an embedded derivative that must otherwise be separated and measured at fair value.
Issued structured notes: These relate to financial liabilities which arise from selling structured products generally in the form of notes or certificates. These structured notes are designated at fair value through profit or loss as the risks to which the Group is a contractual party are risk managed on a fair value basis as part of the Group’s trading portfolio and the risk is reported to key management personnel on this basis.
Other financial assets and liabilities: These include financial assets and liabilities such as those that arise upon the consolidation of certain special purpose entities and those that arise as a result of continuing recognition of certain financial assets and the simultaneous recognition of an associated financial liability. These financial assets and liabilities are designated at fair value as the risks to which the Group is a contractual party are risk managed on a fair value basis as part of the Group’s trading portfolio and the risk is reported to key management personnel on this basis.
The maximum exposure to credit risk of corporate loans as at 31 December 2015 is $436 million (2014: $1,296 million). The cumulative change in fair value of loans attributable to changes in credit risk amounts to $nil (2014: gain of $1 million) and the change for the current year is a loss of $1 million (2014: gain of $5 million). This change is determined as the amount of change in fair value that is not attributable to changes in market conditions that give rise to market risk.
The change in fair value recognised through the consolidated income statement attributable to own credit risk for financial liabilities designated at fair value during the year is a gain of $33 million (2014: gain of $31 million) and cumulatively is a loss of $4 million (2014: loss of $37 million). This change is determined as the amount of change in fair value that is not attributable to changes in market conditions that give rise to market risk.
The carrying amount of financial liabilities designated at fair value was $14 million lower than the contractual amount due at maturity (2014: $45 million lower).
MORGAN STANLEY & CO. INTERNATIONAL plc NOTES TO THE CONSOLIDATED FINANCIAL STATEMENTS Year ended 31 December 2015
48
14. AVAILABLE-FOR-SALE FINANCIAL ASSETS
Financial assets that are classified as available-for-sale consist of corporate equities, of which $1 million are listed investments (2014: $2 million).
Movement in available-for-sale financial assets 2015 2014 $millions $millions Fair value At 1 January 42 60 Additions 1 - Changes in fair value recognised in the available-for-sale reserve (3) (4) Disposals and other settlements (1) (14) At 31 December 39 42
15. INTERESTS IN SUBSIDIARIES Composition of the Group
The Group consists of a parent company, Morgan Stanley & Co. International plc (“MSIP”) and a number of subsidiaries, held directly and indirectly by MSIP.
Details of all subsidiary undertakings are provided in the Appendix to the financial statements, including changes in holdings of subsidiaries (see pages 159 to 161). During 2015, 14 subsidiaries were closed and two subsidiaries were sold, see details below (2014: four subsidiaries closed and two subsidiaries sold).
In 2015, the Group disposed of two wholly owned subsidiaries, Rolympus (UK) Commodities Group Ltd and Norwegian Energy Limited as part of the sale of the global oil merchanting unit of the commodities division to Castleton Commodities International LLC. The subsidiaries were sold for consideration equal to their net book value which equalled $0.02 million. As noted in the strategic report the Group recognised a $42 million charge relating to the cost to sell the global oil merchanting business. This cost is recognised in the consolidated income statement within ‘other expense’.
In 2014, the Group disposed of two wholly owned subsidiaries, Morgan Stanley Cadzand III and Morgan Stanley Bramley Investments Limited to another Morgan Stanley Group undertaking. The subsidiaries were sold for consideration equal to their net book values both of which were $0.1 million, resulting in no gain or loss being recognised in the consolidated income statement as a result of these sales.
All subsidiaries are included in the Group’s consolidated financial statements.
Information regarding interests in structured entities is included in note 16.
The Group has not committed to provided financial support to, or otherwise agreed to be responsible for supporting any subsidiary of the Group financially.
MORGAN STANLEY & CO. INTERNATIONAL plc NOTES TO THE CONSOLIDATED FINANCIAL STATEMENTS Year ended 31 December 2015
49
16. INTERESTS IN STRUCTURED ENTITIES The Group is involved with various special purpose entities (“SPE”) in the normal course of business. In most cases, these entities are deemed to be structured entities.
A structured entity is an entity that has been designed such that voting or similar rights are not the dominant factor in deciding who controls the entity. The party that consolidates the structured entity is the investor that controls the structured entity. An investor controls a structured entity when it is exposed, or has the rights, to variable returns from its involvement with the structured entity and has the ability to affect those returns through its power over the structured entity. The Group consolidates structured entities it controls.
The Group’s interests in structured entities include certain debt and equity interests, commitments, guarantees, derivative instruments and certain fees arrangements. The Group’s involvement with structured entities arises primarily from:
• Loans made to and investments in structured entities that hold debt, equity, real estate or other assets;
• Interests purchased in connection with market-making activities and retained interests held as a result of securitisation activities;
• Structuring of asset-repackaged notes designed to meet the investment objectives of clients; and • Certain derivatives entered into with structured entities.
The Group determines whether it controls, and therefore should consolidate, a structured entity upon its initial involvement with the structured entity and reassesses whether it should continue to consolidate on an ongoing basis as long as it has any continuing involvement with the structured entity. This determination is based upon an analysis of the design of the structured entity, including the structured entity’s structure and activities; assessment of the significance of the powers to make economic decisions which are held by the Group and its related parties and whether such powers may be used to affect its investor returns; and consideration of the significance of direct and indirect interests in the structured entity which are held by the Group and its related parties.
The power to make the most significant economic decisions may take a number of different forms. The Group considers servicing or collateral management decisions as generally representing the power to make the most significant economic decisions in transactions such as securitisations or collateralised debt obligations (“CDOs”). As a result, the Group does not consolidate securitisations or CDOs for which it does not act as the servicer or collateral manager unless it holds certain other rights to replace the servicer or collateral manager or to require the liquidation of the entity. In fund structures, the power to appoint or direct the fund manager is generally the most significant power.
For certain structured entities, such as entities which issued Credit Linked Notes (“CLNs”) and other asset-repackaged notes, there are no significant economic decisions made on an ongoing basis. In these cases, the Group focuses its analysis on decision making powers relating to liquidation of the entity or unwinding or termination of the transaction structure. Based upon factors, which include an analysis of the nature of the assets, including whether the assets were issued in a transaction sponsored by the Group and the extent of the information available to the Group and to investors, the number, nature and involvement of investors, other rights held by the Group and investors, the standardisation of the legal documentation and the level of the continuing involvement by the Group, including the amount and type of interests owned by the Group and by other investors, the Group concluded in some of these transactions that decisions made prior to the initial closing were shared between the Group and the initial investors. The Group focused its control decision on any right held by the Group or investors related to the termination of the structured entity. Many CLNs and other asset repackaged notes have no such termination rights.
The assets owned by many consolidated structured entities cannot be removed unilaterally by the Group and are not generally available to the Group. The related liabilities issued by many consolidated structured entities are non-recourse to the Group. In certain other consolidated structured entities, the Group has the unilateral right to remove assets or provide additional recourse through derivatives such as total return swaps, guarantees or other forms of involvement.
MORGAN STANLEY & CO. INTERNATIONAL plc NOTES TO THE CONSOLIDATED FINANCIAL STATEMENTS Year ended 31 December 2015
50
16. INTERESTS IN STRUCTURED ENTITIES (CONTINUED)
The Group accounts for the assets held by structured entities primarily in ‘Financial assets classified as held for trading – corporate and other debt’ and the liabilities of the structured entities as ‘Financial liabilities designated at fair value’ in the consolidated statement of financial position.
The usage of structured entities is described below.
Securitisation Activities. In a securitisation transaction, the Group transfers assets (generally commercial or residential mortgage loans) to a structured entity, sells to investors most of the beneficial interests, such as notes or certificates, issued by the structured entity, and in many cases, retains other beneficial interests. The purchase of the transferred assets by the structured entity is financed through the sale of these interests. In many securitisations, particularly those involving residential mortgage loans, the Group also enters into derivative transactions, primarily interest rate swaps or interest rate caps with a senior payment priority, with the structured entity.
Credit Protection Purchased through CLNs. In a CLN transaction, the Group transfers reference assets (generally high-quality securities or money market investments) to a structured entity, enters into a derivative transaction in which the structured entity writes protection on an unrelated reference asset or group of assets, through a credit default swap, a total return swap or similar instrument, and sells to investors the securities issued by the structured entity. In some transactions, the Group may also enter into interest rate or currency swaps with the structured entity. The purchase of the transferred assets by the structured entity is financed through the sale of the securities issued. Upon the occurrence of a credit event related to the reference asset, the structured entity will deliver collateral securities as the payment to the Group. The Group is generally exposed to price changes on the collateral securities in the event of a credit event and subsequent sale. These transactions are designed to provide investors with exposure to certain credit risk on the reference asset. The structure of the transaction determines the accounting treatment. In some transactions, the assets and liabilities of the structured entity are recognised in the Group’s consolidated financial statements. In other transactions, the transfer of the collateral securities is accounted for as a sale of assets, and the structured entity is not consolidated. CLNs are included in ‘Other’ in the tables below.
Collateralised Loan and Debt Obligations. A collateralised loan obligation (“CLO”) or a CDO is a structured entity that purchases a pool of assets, consisting of corporate loans, corporate bonds, asset-backed securities or synthetic exposures on similar assets through derivatives, and issues multiple tranches of debt and equity securities to investors. The purchase of the assets by the structured entity is financed through the issuance of the tranches of securities. The Group underwrites the securities issued in CLO transactions on behalf of unaffiliated sponsors and provides advisory services to these unaffiliated sponsors. The Group sells corporate loans to many of these structured entities, in some cases representing a significant portion of the total assets purchased. If necessary, the Group may retain unsold securities issued in these transactions. Although not obligated, the Group generally makes a market in the securities issued by structured entities in these transactions. These beneficial interests are included in Financial assets classified as held for trading.
Equity-Linked Notes. In an equity-linked note transaction the Group typically transfers to a structured entity either a note issued by the Group, the payments on which are linked to the performance of a specific equity security, equity index or other index, or debt securities issued by other companies and a derivative contract, the terms of which will relate to the performance of a specific equity security, equity index or other index. These transactions are designed to provide investors with exposure to certain risks related to the specific equity security, equity index or other index. The purchase of the transferred note or debt securities by the structured entity is financed through the sale of equity interests to investors. Equity-linked notes are included in ‘Other’ in the tables below.
Fund Investments. In a fund investment structure the Group provides clients with indirect access to specified underlying investments through total return swaps. The investments are purchased and held by a structured entity in which the Group holds an interest. The structured entity is financed through the sale of notes to investors.
MORGAN STANLEY & CO. INTERNATIONAL plc NOTES TO THE CONSOLIDATED FINANCIAL STATEMENTS Year ended 31 December 2015
51
16. INTERESTS IN STRUCTURED ENTITIES (CONTINUED)
Consolidated structured entities
As at 31 December 2015 the Group did not have any structured entities that it consolidated (2014: nil).
Unconsolidated structured entities
The Group has interests in structured entities that the Group does not control and are therefore not consolidated.
The Group’s transactions with unconsolidated structured entities primarily include securitisations, credit protection purchased through CLNs, other structured financings and collateralised loan and debt obligations. The Group’s interests in structured entities that it does not consolidate can include ownership of retained interests in Group-sponsored transactions, interests purchased in the secondary market (both for Group-sponsored transactions and transactions sponsored by third parties), and certain derivatives with securitisation structured entities. The risks associated with derivatives entered into with structured entities are essentially the same as similar derivatives with non-structured entity counterparties and are managed as part of the Group’s overall exposure.
The table below shows certain non-consolidated structured entities in which the Group had an interest at 31 December 2015 and at 31 December 2014. The tables include all structured entities in which the Group has determined that its maximum exposure to loss is greater than specific thresholds or meets certain other criteria. Most of the structured entities included in the tables below are sponsored by unrelated parties; the Group’s involvement generally is the result of the Group’s secondary market-making activities.
Mortgage and asset-backed
securitisations
Collateralised debt
obligations Fund
investments Other Total
$millions $millions $millions $millions $millions 31 December 2015
Structured entity assets that the Group does not consolidate (unpaid principal balance) 10,351 4,637 2,791 74 17,853
Maximum exposure to loss: Debt and equity interests 488 116 - 28 632 Derivative and other contracts - - 2,791 39 2,830 Total maximum exposure to loss 488 116 2,791 67 3,462
Carrying value of exposure to loss - assets (1): Debt and equity interests 488 116 - 28 632 Derivative and other contracts - - 8 5 13 Total carrying value of exposure to loss - assets 488 116 8 33 645
Carrying value of exposure to loss - liabilities (1): Derivative and other contracts - - 12 - 12
Total carrying value of exposure to loss - liabilities - - 12 - 12
(1) Amounts are recognised in the consolidated statement of financial position in financial assets or liabilities classified as held for trading – derivatives or financial assets or liabilities classified as held for trading – corporate and other debt.
MORGAN STANLEY & CO. INTERNATIONAL plc NOTES TO THE CONSOLIDATED FINANCIAL STATEMENTS Year ended 31 December 2015
52
16. INTERESTS IN STRUCTURED ENTITIES (CONTINUED)
Unconsolidated structured entities (continued)
Mortgage and asset-backed
securitisations
Collateralised debt
obligations Fund
investments Other Total $millions $millions $millions $millions $millions 31 December 2014
Structured entity assets that the Group does not consolidate (unpaid principal balance) 18,375 4,106 2,576 95 25,152
Maximum exposure to loss: Debt and equity interests 922 124 - 16 1,062 Derivative and other contracts - - 2,576 35 2,611 Total maximum exposure to loss 922 124 2,576 51 3,673
Carrying value of exposure to loss - assets (1): Debt and equity interests 922 124 - 16 1,062
Total carrying value of exposure to loss - assets 922 124 - 16 1,062
Carrying value of exposure to loss - liabilities (1): Derivative and other contracts - - 13 2 15
Total carrying value of exposure to loss - liabilities - - 13 2 15
(1) Amounts are recognised in the consolidated statement of financial position in financial assets or liabilities classified as held for trading – derivatives or financial assets or liabilities classified as held for trading – corporate and other debt.
The Group’s maximum exposure to loss often differs from the carrying value of the interests held by the Group. The maximum exposure to loss is dependent on the nature of the Group’s interest in the structured entities and is limited to the notional amounts of certain liquidity facilities, other credit support, total return swaps, written put options, and the fair value of certain other derivatives and investments the Group has made in the structured entities. Liabilities issued by structured entities generally are non-recourse to the Group. Where notional amounts are utilised in quantifying maximum exposure related to derivatives, such amounts do not reflect fair value write downs already recorded by the Group.
The Group’s maximum exposure to loss does not include the offsetting benefit of any financial instruments that the Group may utilise to hedge these risks associated with the Group’s interests. In addition, the Group’s maximum exposure to loss is not reduced by the amount of collateral held as part of a transaction with the structured entity or any party to the structured entity directly against a specific exposure to loss.
MORGAN STANLEY & CO. INTERNATIONAL plc NOTES TO THE CONSOLIDATED FINANCIAL STATEMENTS Year ended 31 December 2015
53
16. INTERESTS IN STRUCTURED ENTITIES (CONTINUED)
Unconsolidated structured entities (continued)
Securitisation transactions generally involve structured entities. Primarily as a result of its secondary market-making activities, the Group owned additional securities issued by securitisation structured entities for which the maximum exposure to loss is less than specific thresholds. These additional securities which were retained in connection with transfers of assets by the Group totalled $527 million at 31 December 2015 (2014: $513 million). Details of the type of securities retained are shown in the table below.
2015 2014 $millions $millions Securities backed by: Residential mortgage loans 275 262 Commercial mortgage loans 41 86 CDOs or other CLOs 142 100 Other consumer loans 69 65 527 513
The Group’s primary risk exposure is to the securities issued by the structured entity owned by the Group, with the risk highest on the most subordinate class of beneficial interests. These securities generally are included in Financial assets classified as held for trading – corporate and other debt. The Group does not provide additional support in these transactions through contractual facilities, such as liquidity facilities, guarantees or similar derivatives. The Group’s maximum exposure to loss generally equals the fair value of the securities owned.
The Group has not provided financial support to, or otherwise agreed to be responsible for supporting any unconsolidated structured entity financially.
Sponsored unconsolidated structured entities
The Group considers itself the sponsor of certain non-consolidated structured entities where it was primarily involved in the establishment of a structured entity and additionally where the Group has been involved in the transfer of assets; servicer of the assets; ability to access the assets; marketing; managing activities; purchasing protection or providing explicit guarantees; when Morgan Stanley’s name is associated with the structured entity or where market participants may generally expect Morgan Stanley to be associated with the structured entity.
In some sponsored entities, the Group has been involved with the structured entity through establishing the structured entity, marketing of products associated with the structured entity in its own name, and/ or through involvement in the design of the structured entity, however the Group has no interest in these entities as at 31 December 2015 (2014: none).
The gain related to sponsored entities issuing equity linked notes during 2015 was $2 million (2014: loss of $0.7 million). Gains/ (losses) are reported under ‘Net gains on financial instruments classified as held for trading’ in the consolidated income statement. No assets were transferred to sponsored structured entities during 2015 (2014: $nil).
MORGAN STANLEY & CO. INTERNATIONAL plc NOTES TO THE CONSOLIDATED FINANCIAL STATEMENTS Year ended 31 December 2015
54
17. PROPERTY, PLANT AND EQUIPMENT 2015 Fixtures, Leasehold fittings and improvements equipment Total $millions $millions $millions
At 31 December 2015 20 19 39 Depreciation At 1 January 2015 20 18 38 Charge for the year 1 1 2 Foreign exchange revaluation (2) (3) (5) Disposals - 1 1 At 31 December 2015 19 17 36 Carrying amount At 31 December 2015 1 2 3
2014 Fixtures, Leasehold fittings and improvements equipment Total $millions $millions $millions
At 31 December 2014 21 21 42 Depreciation At 1 January 2014 23 20 43 Charge for the year 2 1 3 Foreign exchange revaluation (2) (2) (4) Disposals (3) (1) (4)
At 31 December 2014 20 18 38 Carrying amount At 31 December 2014 1 3 4
MORGAN STANLEY & CO. INTERNATIONAL plc NOTES TO THE CONSOLIDATED FINANCIAL STATEMENTS Year ended 31 December 2015
Morgan Stanley UK Financing I LP 31 October 2025 LIBOR(1) plus
1.475%
7,906 7,906
(1) London Interbank Offered Rate ("LIBOR")
The amount outstanding under the subordinated loan agreement is repayable at any time at the Group’s option, subject to appropriate notice to the lender and at least three months’ notice to the PRA.
The Group has not defaulted on principal, interest or made any other breaches with respect to its subordinated loan during the year.
19. OTHER PAYABLES 2015 2014 $millions $millions Amounts due to other Morgan Stanley Group undertakings 11,397 13,870 Other amounts payable 191 264
Property provisions represent the net present value of expected future costs of excess office space (net of sublease income) and the net present value of expected future costs of reinstating leasehold improvements at the end of the lease term. Lease reinstatement provisions are released when the reinstatement obligations have been fulfilled. The related asset for lease reinstatement provisions is included in ‘Leasehold improvements’ within ‘Property, plant and equipment’ (note 17).
Litigation matters
In addition to the matters described below, in the normal course of business, the Group has been named, from time to time, as a defendant in various legal actions, including arbitrations, class actions and other litigation, arising in connection with its activities as a global diversified financial services institution. Certain of the actual or threatened legal actions include claims for substantial compensatory and/or punitive damages or claims for indeterminate amounts of damages. In some cases, the entities that would otherwise be the primary defendants in such cases are bankrupt or in financial distress.
MORGAN STANLEY & CO. INTERNATIONAL plc NOTES TO THE CONSOLIDATED FINANCIAL STATEMENTS Year ended 31 December 2015
56
20. PROVISIONS (CONTINUED)
Litigation matters (continued)
The Group is also involved, from time to time, in other reviews, investigations and proceedings (both formal and informal) by governmental and self-regulatory agencies regarding the Group’s business, and involving, among other matters, sales and trading activities, financial products or offerings sponsored, underwritten or sold by the Group, and accounting and operational matters, certain of which may result in adverse judgments, settlements, fines, penalties, injunctions or other relief.
The Group contests liability and/or the amount of damages as appropriate in each pending matter. Where available information indicates that it is probable a liability had been incurred at the date of the consolidated financial statements and the Group can reasonably estimate the amount of that loss, the Group accrues the estimated loss by a charge to income. The Group’s future legal expenses may fluctuate from period to period, given the current environment regarding government investigations and private litigation affecting global financial services firms, including the Group.
In many proceedings and investigations, however, it is inherently difficult to determine whether any loss is probable or even possible, or to estimate the amount of any loss. The Group cannot predict with certainty if, how or when such proceedings or investigations will be resolved or what the eventual settlement, fine, penalty or other relief, if any, may be, particularly for proceedings and investigations where the factual record is being developed or contested or where plaintiffs or government entities seek substantial or indeterminate damages, restitution, disgorgement or penalties. Numerous issues may need to be resolved, including through potentially lengthy discovery and determination of important factual matters, determination of issues related to class certification and the calculation of damages or other relief, and by addressing novel or unsettled legal questions relevant to the proceedings or investigations in question, before a loss or additional loss or range of loss or additional loss can be reasonably estimated for a proceeding or investigation. Subject to the foregoing, the Group believes, based on current knowledge and after consultation with counsel, that the outcome of such proceedings and investigations will not have a material adverse effect on the consolidated financial condition of the Group, although the outcome of such proceedings or investigations could be material to the Group’s operating results and cash flows for a particular period depending on, among other things, the level of the Group’s revenues or income for such period.
Over the last several years, the level of litigation and investigatory activity (both formal and informal) by government and self-regulatory agencies has increased materially in the financial services industry. As a result, the Group expects that it may become the subject of increased claims for damages and other relief and, while the Group has identified below certain proceedings that the Group believes to be material, individually or collectively, there can be no assurance that additional material losses will not be incurred from claims that have not yet been asserted or are not yet determined to be material.
On 15 July 2010, China Development Industrial Bank (“CDIB”) filed a complaint against the Group and another Morgan Stanley Group undertaking, styled China Development Industrial Bank v. Morgan Stanley & Co. Incorporated et al., which is pending in the Supreme Court of the State of New York, New York County. The complaint relates to a $275 million credit default swap referencing the super senior portion of the STACK 2006-1 CDO. The complaint asserts claims for common law fraud, fraudulent inducement and fraudulent concealment and alleges that the Group and another Morgan Stanley Group undertaking misrepresented the risks of the STACK 2006-1 CDO to CDIB, and that the Group and another Morgan Stanley Group undertaking knew that the assets backing the CDO were of poor quality when it entered into the credit default swap with CDIB. The complaint seeks compensatory damages related to the approximately $228 million that CDIB alleges it has already lost under the credit default swap, rescission of CDIB’s obligation to pay an additional $12 million, punitive damages, equitable relief, fees and costs. On 28 February 2011, the court denied the Group’s and another Morgan Stanley Group undertaking’s motion to dismiss the complaint.
MORGAN STANLEY & CO. INTERNATIONAL plc NOTES TO THE CONSOLIDATED FINANCIAL STATEMENTS Year ended 31 December 2015
57
20. PROVISIONS (CONTINUED)
Litigation matters (continued)
On 1 July 2013, the European Commission (“EC”) issued a Statement of Objections (“SO”) addressed to twelve financial firms (including the Group), the International Swaps and Derivatives Association, Inc. and Markit Group Limited and various other Morgan Stanley Group undertakings alleging that, between 2006 and 2009, the recipients breached European Union competition law by taking and refusing to take certain actions in an effort to prevent the development of exchange traded credit default swap products. The Group, other Morgan Stanley Group undertakings and the other recipients of the SO filed a response to the SO on 21 January 2014, and attended oral hearings before the EC during the period 12-19 May 2014. On 4 December 2015, the EC announced that it had closed its antitrust investigation into the twelve financial firms, including the Group and the other Morgan Stanley Group undertakings.
In May 2014, the California Attorney General’s Office (“CAAG”), which is one of the members of the Residential Mortgage-Backed Securities (“RMBS”) Working Group, indicated that it has made certain preliminary conclusions that the Morgan Stanley Group made knowing and material misrepresentations regarding RMBS and that it knowingly caused material misrepresentations to be made regarding the Cheyne SIV, which issued securities marketed to the California Public Employees Retirement System. The CAAG has further indicated that it believes the Morgan Stanley Group’s conduct violated California law and that it may seek treble damages, penalties and injunctive relief. The Morgan Stanley Group does not agree with these conclusions and has presented defences to them to the CAAG.
The Group is also responding to a number of regulatory and governmental inquiries in the UK, the US and elsewhere related to its foreign exchange business.
Beginning in December 2013, several foreign exchange dealers (including certain Morgan Stanley Group undertakings) were named as defendants in multiple purported antitrust class actions most of which have now been consolidated into a single proceeding in the United States District Court for the Southern District of New York styled In Re Foreign Exchange Benchmark Rates Antitrust Litigation. On 16 July 2015, plaintiffs filed an amended complaint (which included the Group as a named defendant) generally alleging that defendants engaged in a conspiracy to fix, maintain or make artificial prices for key benchmark rates, to manipulate bid/ask spreads, and, by their behaviour in the OTC market, to thereby cause corresponding manipulation in the foreign exchange futures market. Plaintiffs seek declaratory relief as well as treble damages in an unspecified amount. Defendants filed a motion to dismiss the amended complaint on 30 November 2015.
Other provisions
Provisions have been raised in relation to certain matters that the Group may be required to settle on behalf of clients or in relation to its own account. The amount of these provisions reflect the most likely estimate within an identified range of possible outcomes.
MORGAN STANLEY & CO. INTERNATIONAL plc NOTES TO THE CONSOLIDATED FINANCIAL STATEMENTS Year ended 31 December 2015
58
21. DEFERRED TAX ASSETS AND LIABILITIES Deferred taxes are calculated on all temporary differences under the liability method. The movement in the deferred tax account is as follows: 2015 2014 Deferred Deferred Deferred Deferred tax tax tax tax asset liability asset liability $millions $millions $millions $millions At 1 January 86 (1) 115 (3)
Amount recognised in the consolidated income statement 10 (22) (24) 1 Amount recognised in other comprehensive income (1) - (2) 1
Impact of changes in tax rates recognised in the consolidated income statement 28 - (1) -
Impact of changes in tax rates recognised in other comprehensive income - - - - Foreign exchange adjustment (3) - (2) -
At 31 December 120 (23) 86 (1)
For the purpose of presentation in the consolidated statement of financial position, certain deferred tax assets and liabilities have been offset. The deferred tax included in the consolidated statement of financial position and changes recorded in ‘Income tax expense’ are as follows:
Finance (No. 2) Act 2015 enacted reductions in the UK corporation tax rate to 19% with effect from 1 April 2017 and 18% with effect from 1 April 2020 and also introduced an 8% corporation tax surcharge on the profits of banking companies with effect from 1 January 2016. These changes to corporation tax rates impacted the deferred tax charge and closing deferred tax position for 2015.
MORGAN STANLEY & CO. INTERNATIONAL plc NOTES TO THE CONSOLIDATED FINANCIAL STATEMENTS Year ended 31 December 2015
59
21. DEFERRED TAX ASSETS AND LIABILITIES (CONTINUED)
The deferred tax assets recognised are based on management assessment that it is probable that the Group will have taxable profits against which the temporary differences can be utilised.
Deferred tax assets have not been recognised in respect of the following items (amounts shown are as at the end of the reporting period):
2015 2014 $millions $millions Unused tax losses 15 8 The aggregate amount of temporary differences associated with investments in subsidiaries and branches for which deferred tax liabilities have not been recognised is $nil (2014: $nil). 22. COMMITMENTS AND CONTINGENCIES
Leases
The Group has entered into non-cancellable commercial leases on premises and equipment. These leases have lives ranging from one to seven years. The leases on the premises include renewal options and escalation clauses in line with general rental market conditions and rent adjustments based on price indices. The lease agreements do not contain contingent rent payment clauses or purchase options and they do not impose any restrictions on the Group’s ability to pay dividends, engage in debt financing transactions or enter into further lease agreements.
2015 2014 $millions $millions
Lease payments under non-cancellable operating leases recognised as an expense in the year - Minimum lease payments 6 7 Future minimum lease payments under non-cancellable operating leases at 31 December are due as follows: 2015 2014 $millions $millions Within one year 7 7 In the second to fifth years inclusive 23 22 After five years 4 5
34 34
Contingent liability relating to tax
The tax position of a subsidiary undertaking of the Group is currently under review by the Dutch tax authorities. The review has not progressed sufficiently to determine the timings of resolution or the amount of any outflow. The current estimate of the maximum amount payable, if any, arising from this review is $135 million, plus potential interest of $36 million.
MORGAN STANLEY & CO. INTERNATIONAL plc NOTES TO THE CONSOLIDATED FINANCIAL STATEMENTS Year ended 31 December 2015
60
22. COMMITMENTS AND CONTINGENCIES (CONTINUED)
Other commitments and contingent liabilities
At 31 December, the Group had the following outstanding commitments and contingent liabilities arising from off-balance sheet financial instruments: Contingent liabilities 2015 2014 $millions $millions Guarantees 982 962 Letters of credit 1 1
(1) Forward starting reverse repurchase agreements represent the value of unsettled securities purchased under agreements to resell, which have a trade date at or prior to 31 December 2015 and settle subsequent to period end.
(2) Forward starting repurchase agreements represent the value of unsettled securities under agreement to repurchase, which have a trade date at or prior to 31 December 2015 and settle subsequent to period end.
23. EQUITY
Ordi nary shares of $1
each
Ordinary shares of £1
each
Class A ordinary
shares of $1 each
Additional Tier 1 capital
Total equity instruments
$millions $millions $millions $millions $millions
Issued and fully paid:
At 1 January 2014 9,934 30 1,500 - 11,464
Issued in the year:
Additional Tier 1 capital - - - 1,300 1,300
At 31 December 2014 9,934 30 1,500 1,300 12,764
At 1 January 2015 9,934 30 1,500 1,300 12,764
Issued in the year:
Ordinary shares of $1 each issued 1 - - - 1
At 31 December 2015 9,935 30 1,500 1,300 12,765
Voting rights at 31 December 2015 99.7% (1) 0.3% (1) Non-voting Non-voting 100%
(1) Ordinary shares are pari passu with each other regardless of currency and together carry 100% of the voting rights (2014: 100%)
MORGAN STANLEY & CO. INTERNATIONAL plc NOTES TO THE CONSOLIDATED FINANCIAL STATEMENTS Year ended 31 December 2015
61
23. EQUITY (CONTINUED)
Equity instruments
On 20 January 2015 1,000,000 ordinary shares of $1 each were issued at par, to the Company’s immediate parent undertaking for cash consideration.
At 31 December 2015 the total equity instruments in issue of the Company equated to $12,765 million (2014: $12,764 million) comprising 9,935,105,148 (2014: 9,934,105,148) ordinary shares of $1 each, 17,615,107 (2014: 17,615,107) ordinary shares of £1 each, 1,500,000,000 (2014: 1,500,000,000) Class A Non-voting ordinary shares of $1 each and Additional Tier 1 capital instruments of $1,300,000,000 (2014: $1,300,000,000). All equity instruments are fully paid.
Ordinary shares
The holders of the ordinary shares are entitled to receive dividends as declared from time to time and are entitled, on a show of hands, to one vote and, on a poll, one vote per share at meetings of the shareholders of the Company. All shares rank equally with regard to the Company’s residual net assets.
All ordinary shares are recorded at the rates of exchange ruling at the date the shares were paid up.
Additional Tier 1 capital
The Additional Tier 1 capital instruments (the “Instruments”) include a trigger mechanism whereby, if the Common Equity Tier 1 capital ratio of the Company falls below a pre-determined level, the Group will write-down the outstanding principal amount of the Instruments, together with any accrued interest coupon. In this situation, Morgan Stanley UK Group, the purchaser of the Instruments, would have no further rights against the Group in respect of the Instruments. The Instruments have no defined maturity, are callable at the Group’s discretion after five years from their date of issuance and are subordinated to senior creditors and subordinated loan creditors of the Group. The Instruments are not entitled to any participation in the residual net assets of the Group. Coupons on the Instruments are non-cumulative and payable at a fixed rate of 9% per annum following an initial rate of interest of 8.75% per annum, applied up to and including 31 January 2015. Payment of the coupon is wholly at the discretion of the Group.
A payment of coupon interest was approved by the Board of Directors on 22 January 2015 (see note 24).
Reserves Share premium
The ‘share premium account’ comprises the capital raised in an issue of shares that exceeds the nominal value of the shares.
Currency translation reserve
The ‘currency translation reserve’ comprises all foreign exchange differences arising from the translation of the total assets less total liabilities of foreign operations. The tax effect of these movements is also included in the ‘currency translation reserve’.
The Group hedges foreign exchange exposure arising from its investments in foreign branch operations by utilising forward foreign currency exchange contracts effected through intercompany accounts with another Morgan Stanley Group undertaking.
Available-for-sale reserve
The ‘available-for-sale reserve’ includes the cumulative net change in the fair value of available-for-sale financial assets held at the reporting date. The tax effect of these movements is also included in the ‘available-for-sale reserve’.
MORGAN STANLEY & CO. INTERNATIONAL plc NOTES TO THE CONSOLIDATED FINANCIAL STATEMENTS Year ended 31 December 2015
62
23. EQUITY (CONTINUED)
Reserves (continued)
Capital contribution reserve
The ‘capital contribution reserve’ comprises contributions of capital from the Group’s parent company to subsidiaries of the Group.
Capital redemption reserve
The ‘capital redemption reserve’ represents transfers in prior years from retained earnings in accordance with relevant legislation.
Pension reserve
The ‘pension reserve’ comprises cumulative actuarial gains or losses on scheme assets and obligations net of current tax and the impact of the asset surplus ceiling (see note 36).
24. DIVIDENDS
On 22 January 2015, the Directors approved a coupon payment on the Additional Tier 1 capital instruments of $14,850,694 out of reserves available for distribution at 31 December 2014. The coupon was paid on 30 January 2015, and resulted in a tax benefit of $3,103,649. The payment was reflected in the Group’s consolidated financial statements for the year ended 31 December 2015 as it became due during 2015.
The Directors have not proposed the payment of a final dividend out of reserves available at 31 December 2015 (2014: $nil).
25. not
ADDITIONAL CASH FLOW INFORMATION a. Cash and cash equivalents
For the purposes of the consolidated statement of cash flows, cash and cash equivalents comprise the following balances, which have less than three months maturity from the date of acquisition:
2015 2014 $millions $millions Cash and short-term deposits 11,882 11,671 Bank loans and overdrafts - (15)
11,882 11,656
Included within ‘Cash and short term deposits’ is $9,497 million (2014: $8,384 million) of segregated client money, held in accordance with the FCA’s Client Money Rules, and an amount of $534 million (2014: $747 million) which represents other client money, that is not available for use by the Group. The corresponding payable is recognised and included in ‘Trade payables’ within ‘Financial liabilities at amortised cost’.
MORGAN STANLEY & CO. INTERNATIONAL plc NOTES TO THE CONSOLIDATED FINANCIAL STATEMENTS Year ended 31 December 2015
63
25. not
ADDITIONAL CASH FLOW INFORMATION (CONTINUED)
b. Reconciliation of cash flows from operating activities
2015 2014 Note $millions $millions Profit/(loss) for the year 401 (713) Adjustments for:
Net gains on available-for-sale financial assets 4 - (1) Net impairment movement on financial assets 7 7 10 Depreciation on property, plant and equipment 17 2 3 Interest income (restated)(1) (130) (368) Interest expense (restated)(1) 690 598 Income tax expense 8 309 36
Operating cash flows before changes in operating assets and liabilities 1,279 (435) Changes in operating assets
Decrease in loans and receivables, excluding cash and short term deposits 3,531 6,956 Decrease in financial assets classified as held for trading 49,125 33,076 Decrease in financial assets designated at fair value through profit or loss 1,724 4,313 54,380 44,345 Changes in operating liabilities
Decrease in financial liabilities at amortised cost, excluding bank loans and overdrafts (13,154) (14,506)
Decrease in financial liabilities classified as held for trading (41,322) (22,786)
Decrease in financial liabilities designated at fair value through profit or loss (266) (7,992) (Decrease)/ increase in provisions (22) 13 (54,764) (45,271) Interest received 203 720 Interest paid (555) (830) Income taxes paid (120) (136) Effect of foreign exchange movements (177) 29
Net cash flows from/ (used in) operating activities 246 (1,578)
(1) Details of the restatement are provided in note 2.
MORGAN STANLEY & CO. INTERNATIONAL plc NOTES TO THE CONSOLIDATED FINANCIAL STATEMENTS Year ended 31 December 2015
64
26. EXPECTED MATURITY OF ASSETS AND LIABILITIES The table below shows an analysis of assets and liabilities analysed according to when they are expected to be recovered, realised or settled.
At 31 December 2015 Less than or equal More than to twelve twelve months months Total $millions $millions $millions ASSETS
Loans and receivables: Cash and short term deposits 11,882 - 11,882 Cash collateral on securities borrowed 22,433 - 22,433 Securities purchased under agreements to resell 58,609 35 58,644 Trade receivables 50,940 - 50,940 Other receivables 1,299 592 1,891 145,163 627 145,790 Financial assets classified as held for trading 246,273 - 246,273 Financial assets designated at fair value through profit or loss 1,091 545 1,636 Available-for-sale financial assets - 39 39 Current tax assets 185 - 185 Deferred tax assets - 120 120 Prepayments and accrued income 38 - 38 Property, plant and equipment - 3 3
392,750 1,334 394,084
LIABILITIES Financial liabilities at amortised cost: Cash collateral on securities loaned 14,875 1,393 16,268 Securities sold under agreements to repurchase 34,558 3,453 38,011 Trade payables 82,065 - 82,065 Subordinated loans - 7,906 7,906 Other payables 4,570 7,018 11,588 136,068 19,770 155,838 Financial liabilities classified as held for trading 216,506 - 216,506 Financial liabilities designated at fair value through profit or loss 3,376 1,489 4,865 Provisions - 21 21 Current tax liabilities 101 - 101 Deferred tax liabilities - 23 23 Accruals and deferred income 197 - 197 Post-employment benefit obligations - 6 6 356,248 21,309 377,557
MORGAN STANLEY & CO. INTERNATIONAL plc NOTES TO THE CONSOLIDATED FINANCIAL STATEMENTS Year ended 31 December 2015
65
26. EXPECTED MATURITY OF ASSETS AND LIABILITIE S (CONTINUED)
At 31 December 2014 Less than or equal More than to twelve twelve months months Total $millions $millions $millions ASSETS
Loans and receivables: Cash and short term deposits 11,671 - 11,671 Cash collateral on securities borrowed 20,691 - 20,691 Securities purchased under agreements to resell 58,724 - 58,724 Trade receivables 54,944 - 54,944 Other receivables 2,803 514 3,317 148,833 514 149,347 Financial assets classified as held for trading 295,398 - 295,398 Financial assets designated at fair value through profit or loss 2,589 771 3,360 Available-for-sale financial assets - 42 42 Current tax assets 217 - 217 Deferred tax assets - 86 86 Prepayments and accrued income 72 - 72 Property, plant and equipment - 4 4
447,109 1,417 448,526
LIABILITIES Financial liabilities at amortised cost: Bank loans and overdrafts 15 - 15 Cash collateral on securities loaned 17,499 - 17,499 Securities sold under agreements to repurchase 42,844 3,067 45,911 Trade payables 83,561 - 83,561 Subordinated loans - 7,906 7,906 Other payables 10,968 3,166 14,134 154,887 14,139 169,026 Financial liabilities classified as held for trading 257,828 - 257,828 Financial liabilities designated at fair value through profit or loss 3,269 1,862 5,131 Provisions - 43 43 Current tax liabilities 105 - 105 Deferred tax liabilities - 1 1 Accruals and deferred income 199 - 199 Post-employment benefit obligations - 5 5 416,288 16,050 432,338
MORGAN STANLEY & CO. INTERNATIONAL plc NOTES TO THE CONSOLIDATED FINANCIAL STATEMENTS Year ended 31 December 2015
66
27. SEGMENT REPORTING Segment information is presented in respect of the Group’s business and geographical segments. The business segments and geographical segments are based on the Group’s management and internal reporting structure. Transactions between business segments are on normal commercial terms and conditions.
Business segment
Morgan Stanley structures its business segments primarily based upon the nature of the financial products and services provided to customers and Morgan Stanley’s internal management structure. The Group’s own business segments are consistent with those of Morgan Stanley.
Consistent with the year ended 2014, the Group has one reportable business segment, Institutional Securities, which includes provides financial advisory and capital raising services; corporate lending; sales, trading, financing and market-making activities in equity and fixed income securities and related products, including foreign exchange and commodities; and investment activities.
Geographical segments
The Group operates in three geographic regions being EMEA, the Americas and Asia.
The following table presents selected consolidated income statement and consolidated statement of financial position information of the Group’s operations by geographic area. The external revenues (net of interest expense) and total assets disclosed in the following table reflect the regional view of the Group’s operations, on a managed basis. The basis for attributing external revenues (net of interest expense) and total assets is determined by a combination of client and trading desk location.
EMEA Americas Asia Total 2015 2014 2015 2014 2015 2014 2015 2014 $millions $millions $millions $millions $millions $millions $millions $millions External revenues net of interest 4,284 3,850 57 21 110 10 4,451 3,881 Profit / (loss) before income tax 633 (599) 42 (18) 35 (60) 710 (677) Total assets 284,119 306,460 59,102 89,042 50,863 53,024 394,084 448,526
MORGAN STANLEY & CO. INTERNATIONAL plc NOTES TO THE CONSOLIDATED FINANCIAL STATEMENTS Year ended 31 December 2015
Risk is an inherent part of the Group’s business activity. The Group seeks to identify, assess, monitor and manage each of the various types of risk involved in its business activities in accordance with defined policies and procedures. The Group has developed its own risk management policy framework, which is consistent with and leverages the risk management policies and procedures of the Morgan Stanley Group and which include escalation to the Group’s Board of Directors and to appropriate senior management personnel of the Group.
Significant risks faced by the Group resulting from its trading, financing and investment activities are set out below.
Credit risk
Credit risk refers to the risk of loss arising when a borrower, counterparty or issuer does not meet its financial obligations to the Group.
Credit risk management policies and procedures establish the framework for ensuring transparency of material credit risks, ensuring compliance with established limits and escalation of risk concentrations to appropriate senior management.
The Group primarily incurs credit risk exposure to institutions primarily through its Institutional Securities segment. This risk may be incurred through a variety of activities, including, but not limited to, the following:
• entering into derivative contracts under which counterparties have obligations to make payments to the Group;
• extending credit to clients through lending commitments; • providing short or long-term funding that is secured by physical or financial collateral whose
value may at times be insufficient to fully cover the loan repayment amount; • posting margin and/ or collateral to clearing houses, clearing agencies, exchanges, banks,
securities firms and other financial counterparties; • placing funds on deposit at other financial institutions to support the Group’s clearing and
settlement obligations; and • investing or trading in securities and loan pools, whereby the value of these assets may fluctuate
based on realised or expected defaults on the underlying obligations or loans.
Monitoring and control
In order to help protect the Group from losses, the Credit Risk Management Department establishes firm-wide practices to evaluate, monitor and control credit risk exposure at the transaction, obligor and portfolio levels. The Credit Risk Management Department approves extensions of credit, evaluates the creditworthiness of the Group’s counterparties and borrowers on a regular basis, and ensures that credit exposure is actively monitored and managed. The evaluation of counterparties and borrowers includes an assessment of the probability that an obligor will default on its financial obligations and any subsequent losses that may occur when an obligor defaults. In addition, credit risk exposure is actively managed by credit professionals and committees within the Credit Risk Management Department and through various risk committees, whose membership includes individuals from the Credit Risk Management Department.
A Credit Limits Framework is utilised to manage credit risk levels across the Group. The Credit Limits Framework is calibrated within the Group’s risk tolerance and includes single-name limits and portfolio concentration limits by country, industry and product type. The Credit Risk Management Department ensures transparency of material credit risks, compliance with established limits and escalation of risk concentrations to appropriate senior management.
MORGAN STANLEY & CO. INTERNATIONAL plc NOTES TO THE CONSOLIDATED FINANCIAL STATEMENTS Year ended 31 December 2015
68
28. FINANCIAL RISK MANAGEMENT (CONTINUED)
Credit risk (continued)
The Credit Risk Management Department also works closely with the Market Risk Department and applicable business units to monitor risk exposures and to perform stress tests to identify, analyse and control credit risk concentrations arising in the Group’s lending and trading activities. The stress tests shock market factors (e.g. interest rates, commodity prices, credit spreads), risk parameters (e.g. default probabilities and loss given default), recovery rates and expected losses in order to assess the impact of stresses on exposures, profit and loss, and the Group’s capital position. Stress and scenario tests are conducted in accordance with established Group policies and procedures.
Credit Evaluation
The evaluation of corporate and institutional counterparties includes assigning obligor credit ratings, which reflect an assessment of an obligor’s probability of default and loss given default. Credit evaluations typically involve the assessment of financial statements, leverage, liquidity, capital strength, asset composition and quality, market capitalisation, access to capital markets, the adequacy of collateral, if applicable, and in the case of certain loans, cash flow projections and debt service requirements. The Credit Risk Management Department also evaluates strategy, market position, industry dynamics, management and other factors that could affect the obligor’s risk profile. Additionally, the Credit Risk Management Department evaluates the relative position of the Group’s exposure in the borrower’s capital structure and relative recovery prospects, as well as adequacy of collateral (if applicable) and other structural elements of the particular transaction.
In addition to assessing and monitoring its credit exposure and risk at the individual obligor level, the Group also reviews its credit exposure and risk to geographic regions. As at December 2015, credit exposure was concentrated in North American, Asian and Western European countries. In addition, the Group pays particular attention to smaller exposures in emerging markets given their unique risk profile. Country ceiling ratings are derived using methodologies generally consistent with those employed by external rating agencies.
The Group also reviews its credit exposure and risk to certain types of customers. At 31 December 2015, the Group’s material credit exposure was to central clearing counterparties, corporate entities, sovereign-related entities and financial institutions.
Risk Mitigation
The Credit Risk Management Department may seek to mitigate credit risk from its lending and trading activities in multiple ways, including collateral provisions, guarantees and hedges. At the transaction level, the Credit Risk Management Department seeks to mitigate risk through management of key risk elements such as size, tenor, financial covenants, seniority and collateral. The Group actively hedges its lending and derivatives exposure through various financial instruments that may include single-name, portfolio and structured credit derivatives. Additionally, the Group may sell, assign or syndicate funded loans and lending commitments in the primary and secondary loan market. In connection with its derivatives trading activities, the Group generally enters into master netting agreements and collateral arrangements with counterparties. These agreements provide the Group with the ability to demand collateral, as well as to liquidate collateral and offset receivables and payables covered under the same master agreement in the event of a counterparty default.
MORGAN STANLEY & CO. INTERNATIONAL plc NOTES TO THE CONSOLIDATED FINANCIAL STATEMENTS Year ended 31 December 2015
69
28. FINANCIAL RISK MANAGEMENT (CONTINUED)
Credit risk (continued)
• Securities purchased under agreements to resell and securities borrowed The Group manages credit exposure arising from securities purchased under agreements to resell and securities borrowed transactions by, in appropriate circumstances, entering into master netting agreements and collateral agreements with counterparties that provide the Group, in the event of a counterparty default, with the right to net a counterparty’s rights and obligations under such agreement and liquidate and set off collateral held by the Group against the net amount owed by the counterparty. Under these securities purchased under agreements to resell and securities borrowed transactions, the Group receives collateral, including US government and agency securities, other sovereign government obligations, corporate and other debt and corporate equities. The Group also monitors the fair value of the underlying securities as compared with the related receivable or payable, including accrued interest, and, as necessary, requests additional collateral to ensure such transactions are adequately collateralised.
• Derivatives
The Group may seek to mitigate credit risk from its derivatives transactions in multiple ways, including documentation, collateral provisions, guarantees and hedges. At the transaction level, the Group seeks to mitigate risk through management of key risk elements such as size, tenor, financial covenants, seniority and collateral. The Group actively hedges its derivatives exposure through various financial instruments that may include single-name, portfolio and structured credit derivatives. The Group may enter into master netting agreements and collateral arrangements with counterparties. These master netting agreements and collateral arrangements may provide the Group with the ability to demand collateral, as well as to liquidate collateral and offset receivables and payables covered under the same master netting agreement in the event of counterparty default. The Group monitors the creditworthiness of counterparties to these transactions on an ongoing basis and requests additional collateral in accordance with collateral arrangements when deemed necessary.
Exposure to credit risk
The maximum exposure to credit risk (“gross credit exposure”) of the Group as at 31 December 2015 is disclosed below, based on the carrying amounts of the financial assets the Group believes are subject to credit risk. Exposure arising from financial instruments not recognised on the consolidated statement of financial position is measured as the maximum amount that the Group could have to pay, which may be significantly greater than the amount that would be recognised as a liability. Where the Group enters into credit enhancements, including receiving cash and security as collateral and master netting agreements, to manage the credit exposure on these financial instruments the financial effect of the credit enhancements is also disclosed below. The net credit exposure represents the credit exposure remaining after the effect of the credit enhancements. The “unrated” balance in the ‘Maximum exposure to credit risk by credit rating’ represents the pool of counterparties that either do not require a rating or are under review in accordance with the Group’s rating policies. These counterparties individually generate no material credit exposure and this pool is highly diversified, monitored and subject to limits.
Financial assets classified as held for trading, excluding derivatives, are subject to traded credit risk through exposure to the issuer of the financial asset; the Group manages this issuer credit risk through its market risk management infrastructure and this traded credit risk is incorporated within the VaR based risk measures included in the market risk disclosure.
MORGAN STANLEY & CO. INTERNATIONAL plc NOTES TO THE CONSOLIDATED FINANCIAL STATEMENTS Year ended 31 December 2015
70
28. FINANCIAL RISK MANAGEMENT (CONTINUED)
Credit risk (continued)
Exposure to credit risk by class: 2015 2014
Gross Net Gross Net credit Credit credit credit Credit credit
(1) The carrying amount recognised in the consolidated statement of financial position best represents the Group's maximum exposure to credit risk.
(2) Of the residual net credit exposure, intercompany cross product netting arrangements are in place which would allow for an additional $2,716 million (2014: $2,928 million) to be offset in the event of default by certain Morgan Stanley counterparties.
(3) Trade receivables primarily include cash collateral pledged against the payable on OTC derivative positions. These derivative liabilities are included within financial liabilities classified as held for trading in the consolidated statement of financial position.
(4) For unsettled securities purchased under agreement to resell, collateral in the form of securities will be received at the point of settlement. Since the value of collateral is determined at a future date it is currently unquantifiable and not included in the table.
The impact of master netting arrangements and similar agreements on the Group’s ability to offset financial assets and financial liabilities is further disclosed in note 31.
MORGAN STANLEY & CO. INTERNATIONAL plc NOTES TO THE CONSOLIDATED FINANCIAL STATEMENTS Year ended 31 December 2015
71
28. FINANCIAL RISK MANAGEMENT (CONTINUED)
Credit risk (continued)
Maximum exposure to credit risk by credit rating (1):
Gross credit exposure 2015 2014 Credit rating: $millions $millions AAA 12,013 14,895 AA 62,608 72,747 A 203,875 246,673 BBB 52,808 54,410 BB 13,923 15,736 B 5,164 3,849 CCC 2,448 2,671 D 12 - Unrated 2,361 4,249
355,212 415,230
(1) Internal credit rating derived using methodologies generally consistent with those used by external rating agencies.
Financial assets past due but not impaired
At 31 December 2015, $1,180 million of financial assets included in loans and receivables in the consolidated statement of financial position were past due but not impaired (31 December 2014: $1,005 million). The balance at 31 December 2014 has been revised to reflect additional trading related balances which are generally not more than 30 days past due.
The main considerations for the impairment assessment include whether there are any known difficulties in the cash flows of counterparties, credit rating downgrades, or infringement of the original terms of the contract. The Group determines the allowance appropriate for each individually significant asset on an individual basis. Items considered when determining the allowance amount include the sustainability of the counterparty’s business plan, the counterparty’s ability to improve performance once a financial difficulty has arisen, the realisable value of collateral, and the timing of expected cash flows. The impairment losses are evaluated at least at each reporting date.
MORGAN STANLEY & CO. INTERNATIONAL plc NOTES TO THE CONSOLIDATED FINANCIAL STATEMENTS Year ended 31 December 2015
72
28. FINANCIAL RISK MANAGEMENT (CONTINUED)
Liquidity and funding risk Liquidity and funding risk refers to the risk that the Group will be unable to finance its operations due to a loss of access to the capital markets or difficulty in liquidating its assets. Liquidity and funding risk also encompasses the Group’s ability to meet its financial obligations without experiencing significant business disruption or reputational damage that may threaten the Group’s viability as a going concern. Market or idiosyncratic stress events may negatively affect the Group’s liquidity and may impact its ability to raise new funding. Generally, the Group incurs liquidity and funding risk as a result of its trading, investing and client facilitation activities.
The Morgan Stanley Group’s Liquidity Risk Management Framework is critical to helping ensure that the Group maintains sufficient liquidity reserves and durable funding sources to meet its daily obligations and to withstand unanticipated stress events. In 2015, the Morgan Stanley Group established the Liquidity Risk Department as a distinct area in Risk Management to oversee and monitor liquidity and funding risk. The Liquidity Risk Department is independent of the business units and reports to the Chief Risk Officer. The Liquidity Risk Department ensures transparency of material liquidity and funding risks, compliance with established risk limits and escalation of risk concentrations to appropriate senior management. To execute these responsibilities, the Liquidity Risk Department:
• establishes limits in line with the Morgan Stanley Group’s risk appetite;
• identifies and analyses emerging liquidity and funding risks to ensure such risks are appropriately mitigated;
• monitors and reports risk exposures against metrics and limits, and;
• reviews the methodologies and assumptions underpinning the Morgan Stanley Group’s Liquidity Stress Tests to ensure sufficient liquidity and funding under a range of adverse scenarios.
The liquidity and funding risks identified by these processes are summarised in reports produced by the Liquidity Risk Department that are circulated to and discussed with the EMEA Assets/ Liability Management Committee (“ALCO”), EMEA Risk Committee and the MSI Risk Committee as appropriate.
The Treasury Department and applicable business units have primary responsibility for evaluating, monitoring and controlling the liquidity and funding risks arising from the Morgan Stanley Group’s business activities, and maintain processes and controls to manage the key risks inherent in their respective areas. The Liquidity Risk Department coordinates with the Treasury Department and the business units to help ensure a consistent and comprehensive framework for managing liquidity and funding risk across the Morgan Stanley Group.
The Group’s liquidity and funding risk management policies and procedures are consistent with those of the Morgan Stanley Group. The Board of Directors of the Group is ultimately responsible for establishing the liquidity risk tolerance and ensuring the Group’s liquidity risk is appropriately managed. In addition to the internal liquidity risk management framework, the Group is locally subject to the liquidity regulations prescribed by the PRA. The Group has daily monitoring and reporting processes in place to ensure compliance with its regulatory requirements.
The primary goal of the Group’s liquidity risk and funding management framework is to ensure that the Group has access to adequate funding across a wide range of market conditions. The framework is designed to enable the Group to fulfil its financial obligations and support the execution of its business strategies.
The following principles guide the Group’s liquidity and funding risk management framework:
• Sufficient liquid assets should be maintained to cover maturing liabilities and other planned and contingent outflows;
• Maturity profile of assets and liabilities should be aligned, with limited reliance on short-term funding;
MORGAN STANLEY & CO. INTERNATIONAL plc NOTES TO THE CONSOLIDATED FINANCIAL STATEMENTS Year ended 31 December 2015
73
28. FINANCIAL RISK MANAGEMENT (CONTINUED)
Liquidity and funding risk (continued)
• Source, counterparty, currency, region, and term of funding should be diversified; and • Liquidity Stress Tests should anticipate, and account for, periods of limited access to funding.
The core components of the Group’s liquidity and funding risk management framework, are the Required Liquidity Framework, Liquidity Stress Tests and the Liquidity Reserve (as defined below), which supports its target liquidity profile.
Required Liquidity Framework
The Required Liquidity Framework reflects the amount of liquidity the Group must hold in both normal and stressed environments to ensure that its financial condition and overall soundness is not adversely affected by an inability (or perceived inability) to meet its financial obligations in a timely manner. The Required Liquidity Framework considers the most constraining liquidity requirement to satisfy all regulatory and internal limits at a Morgan Stanley Group and legal entity level.
Liquidity Stress Tests
The Group uses Liquidity Stress Tests to model liquidity inflows and outflows across multiple scenarios over a range of time horizons. These scenarios contain various combinations of idiosyncratic and systemic stress events of different severity and duration. The methodology, implementation, production and analysis of the Group’s Liquidity Stress Tests are important components of the Required Liquidity Framework.
The assumptions underpinning the Liquidity Stress Tests include, but are not limited to, the following:
• no government support;
• no access to equity and unsecured debt markets;
• repayment of all unsecured debt maturing within the stress horizon;
• higher haircuts and significantly lower availability of secured funding;
• additional collateral that would be required by trading counterparties, certain exchanges and clearing organisations related to credit rating downgrades;
• additional collateral that would be required due to collateral substitutions, collateral disputes and uncalled collateral;
• discretionary unsecured debt buybacks;
• drawdowns on lending commitments provided to third parties;
• client cash withdrawals and reduction in customer short positions that fund long positions;
• limited access to the foreign exchange swap markets; and
• maturity roll-off of outstanding letters of credit with no further issuance.
Liquidity Stress Tests are produced for the Group, to capture specific cash requirements and cash availability. The Liquidity Stress Tests assume that a legal entity will use its own liquidity first to fund its obligations before drawing liquidity from its ultimate parent undertaking, Morgan Stanley. Morgan Stanley will support its subsidiaries and will not have access to subsidiaries’ liquidity reserves that are subject to any regulatory, legal or tax constraints. In addition to the assumptions underpinning the Liquidity Stress Tests, the Group takes into consideration the settlement risk related to intra-day settlement and clearing of securities and financing activities.
At 31 December 2015 and 31 December 2014, the Group maintained sufficient liquidity to meet current and contingent funding obligations as modelled in its Liquidity Stress Tests.
MORGAN STANLEY & CO. INTERNATIONAL plc NOTES TO THE CONSOLIDATED FINANCIAL STATEMENTS Year ended 31 December 2015
74
28. FINANCIAL RISK MANAGEMENT (CONTINUED)
Liquidity and funding risk (continued) Liquidity Reserve
The Group maintains sufficient liquidity reserves (“Liquidity Reserve”) to cover daily funding needs and to meet strategic liquidity targets sized by the Required Liquidity Framework and Liquidity Stress Tests. The size of the Liquidity Reserve is actively managed by the Group. The following components are considered in sizing the Liquidity Reserve: unsecured debt maturity profile, balance sheet size and composition, funding needs in a stressed environment inclusive of contingent cash outflows and collateral requirements. In addition, the Group’s Liquidity Reserve includes a discretionary surplus based on risk tolerance and is subject to change dependent on market and firm-specific events.
The Group holds its own Liquidity Reserve which is composed of diversified cash and cash equivalents and unencumbered highly liquid securities. Eligible unencumbered highly liquid securities include highly liquid non-US government securities in addition to US government securities and other highly liquid investment grade securities.
Funding Management
The Group manages its funding in a manner that reduces the risk of disruption to the Group’s operations. The Group pursues a strategy of diversification of secured and unsecured funding sources (by product, by investor and by region) and attempts to ensure that the tenor of the Group’s liabilities equals or exceeds the expected holding period of the assets being financed.
The Group funds itself through diverse sources. These sources may include equity capital, long-term debt, securities sold under agreements to repurchase, securities lending, deposits, commercial paper, letters of credit and lines of credit. The Group has active financing programmes for both standard and structured products, targeting global investors and currencies.
Balance sheet management
In managing both the Morgan Stanley Group’s and the Group’s funding risk the composition and size of the entire statement of financial position, not just financial liabilities, is monitored and evaluated. A substantial portion of the Morgan Stanley Group’s total assets consists of liquid marketable securities and short-term receivables arising principally from the Institutional Securities business segment’s sales and trading activities. The liquid nature of these assets provides the Morgan Stanley Group and the Group with flexibility in managing the size of its statement of financial position.
Maturity analysis In the following maturity analysis of financial liabilities, derivative contracts and other financial liabilities held as part of the Group’s trading activities are presented at fair value, consistent with how these financial liabilities are managed, and disclosed as on demand. Derivatives not held as part of the Group’s trading activities and financial liabilities designated at fair value through profit or loss are disclosed according to their earliest contractual maturity; all such amounts are presented at their fair value, consistent with how these financial liabilities are managed. All other amounts represent undiscounted cash flows payable by the Group arising from its financial liabilities to earliest contractual maturities as at 31 December 2015 and 31 December 2014. Repayments of financial liabilities that are subject to immediate notice are treated as if notice were given immediately and are classified as on demand. This presentation is considered by the Group to appropriately reflect the liquidity risk arising from those financial liabilities, presented in a way that is consistent with how the liquidity risk on these financial liabilities is managed by the Group.
MORGAN STANLEY & CO. INTERNATIONAL plc NOTES TO THE CONSOLIDATED FINANCIAL STATEMENTS Year ended 31 December 2015
75
28. FINANCIAL RISK MANAGEMENT (CONTINUED)
Liquidity and funding risk (continued)
Equals to Equal to or more or more Equal to than 1 than 3 or more month months than 1 Equal to but less but less year but or more On Less than than 3 than 1 less than than 5 demand 1 month months year 5 years years Total 31 December 2015 $millions $millions $millions $millions $millions $millions $millions
Financial liabilities Financial liabilities at amortised cost:
(1) The Group enters into forward starting reverse repurchase agreements (agreements which have a trade date at or prior to 31 December 2015 and settle subsequent to period end). These agreements primarily settle within three business days and of the total amount at 31 December 2015, $18,228 million settled within three business days.
MORGAN STANLEY & CO. INTERNATIONAL plc NOTES TO THE CONSOLIDATED FINANCIAL STATEMENTS Year ended 31 December 2015
76
28. FINANCIAL RISK MANAGEMENT (CONTINUED)
(1) The Group enters into forward starting reverse repurchase agreements (agreements which have a trade date at or prior to 31 December 2014 and settle subsequent to period end). These agreements primarily settle within three business days and of the total amount at 31 December 2014, $24,333 million settled within three business days.
The Group does not expect that all of the cash flows associated with financial guarantees, letters of credits and loan commitments will be required.
Market risk
Market risk refers to the risk of losses for a position or portfolio due to changes in rates, foreign exchange, equities, implied volatilities, correlations or other market factors.
Sound market risk management is an integral part of the Group’s culture. The Group is responsible for ensuring that market risk exposures are well-managed and monitored. The Group also ensures transparency of material market risks, monitors compliance with established limits, and escalates risk concentrations to appropriate senior management.
Liquidity and funding risk (continued)
Equal to or more
Equal to or more Equal to
than 1 than 3 or more month months than 1 Equal to but less but less year but or more On Less than than 3 than 1 less than than 5 demand 1 month months year 5 years years Total 31 December 2014 $millions $millions $millions $millions $millions $millions $millions Financial liabilities Financial liabilities at amortised cost:
MORGAN STANLEY & CO. INTERNATIONAL plc NOTES TO THE CONSOLIDATED FINANCIAL STATEMENTS Year ended 31 December 2015
77
28. FINANCIAL RISK MANAGEMENT (CONTINUED)
Market risk (continued)
To execute these responsibilities, the Group monitors its market risk against limits on aggregate risk exposures, performs a variety of risk analyses, routinely reports risk summaries and maintains the VaR and scenario analysis methodologies. These limits are designed to control market risk. Market risk is also monitored through various measures: using statistics (including VaR and related analytical measures); by measures of position sensitivity; and through routine stress testing and scenario analyses. The material risks identified by these processes are summarised and reported to senior management.
The market risk management policies and procedures for the Group are consistent with those of the Morgan Stanley Group and include escalation to the Group’s Board of Directors and appropriate management personnel.
Primary market risk exposures and market risk management
During the year, the Group had exposures to a wide range of market risk factors related to the global markets in which it conducts its trading activities. These market risk factors include interest rate and credit spread risk, equity prices, foreign exchange rates and commodity prices and the associated implied volatilities.
The Group is exposed to interest rate and credit spread risk as a result of its market making activities and other trading in interest rate sensitive financial instruments (e.g. risk arising from changes in the level of interest rates, the shape of the yield curve and credit spreads). The activities from which those exposures arise and the markets in which the Group is active include, but are not limited to, the following: corporate and government debt across both developed and emerging markets and asset-backed debt (including mortgage-related securities).
The Group is exposed to equity price and implied volatility risk as a result of making markets in equity securities and derivatives and maintaining other positions (including positions in non-public entities). Positions in non-public entities may include, but are not limited to, exposures to private equity, venture capital, private partnerships, real estate funds and other funds. Such positions are less liquid, have longer investment horizons and are more difficult to hedge than listed equities.
The Group is exposed to foreign exchange rate and implied volatility risk as a result of making markets in foreign currencies and foreign currency derivatives, from maintaining foreign exchange positions and from holding non-US dollar-denominated financial instruments.
The Group is exposed to commodity price and implied volatility risk as a result of market-making activities and maintaining commodity positions (such as in crude and refined oil products, natural gas, electricity, and precious and base metals). Commodity exposures are subject to periods of high price volatility as a result of changes in supply and demand. These changes can be caused by weather conditions, physical production, and transportation; or geopolitical and other events that affect the available supply and level of demand for these commodities.
The Group manages its trading positions by employing a variety of risk mitigation strategies. These strategies include diversification of risk exposures and hedging. Hedging activities consist of the purchase or sale of positions in related securities and financial instruments, including a variety of derivative products (e.g., futures, forwards, swaps and options). Hedging activities may not always provide effective mitigation against trading losses due to differences in the terms, specific characteristics or other basis risks that may exist between the hedge instrument and the risk exposure that is being hedged. The Group manages and monitors its market risk exposures in such a way as to maintain a portfolio that the Group believes is well-diversified in the aggregate with respect to market risk factors and that reflects the Group’s aggregate risk tolerance, as established by the Group’s Board of Directors.
MORGAN STANLEY & CO. INTERNATIONAL plc NOTES TO THE CONSOLIDATED FINANCIAL STATEMENTS Year ended 31 December 2015
78
28. FINANCIAL RISK MANAGEMENT (CONTINUED)
Market risk (continued)
Aggregate market risk limits have been approved for the Group. Additional market risk limits are assigned, as appropriate, to trading desks, products and/ or regions. The trading division and the Market Risk Department monitor market risk measures against limits in accordance with policies set by the Board of directors and senior management.
VaR
The Group uses the statistical technique known as VaR as one of the tools used to measure, monitor and review the market risk exposures of its trading portfolios. The Market Risk Department calculates and distributes daily VaR-based risk measures to various levels of management.
VaR methodology, assumptions and limitations
The Group estimates VaR using a model based on volatility adjusted historical simulation for general market risk factors and Monte Carlo simulation for name-specific risk in corporate shares, bonds, loans and related derivatives. The model constructs a distribution of hypothetical daily changes in the value of trading portfolios based on the following: historical observation of daily changes in key market indices or other market risk factors; and information on the sensitivity of the portfolio values to these market risk factor changes. The Group’s VaR model uses four years of historical data with a volatility adjustment to reflect current market conditions. A set of internal processes and controls ensure that all trading positions booked by the Group are being included in VaR. Management VaR is computed at a 95% level of confidence over a one day time horizon, which is a useful indicator of possible trading losses resulting from adverse daily market moves. The 95%/one-day VaR corresponds to the unrealised loss in portfolio value that, based on historically observed market risk factor movements, could have been exceeded with a frequency of 5%, or five times in every 100 trading days, if the portfolio were held constant for one day.
The Group uses VaR as one of a range of risk management tools. Among their benefits, VaR models permit estimation of a portfolio’s aggregate market risk exposure, incorporating a range of varied market risks and portfolio assets. One key element of the VaR model is that it reflects risk reduction due to portfolio diversification or hedging activities. However, VaR has various limitations, which include but are not limited to: use of historical changes in market risk factors, which may not be accurate predictors of future market conditions, and may not fully incorporate the risk of extreme market events that are outsized relative to observed historical market behaviour or reflect the historical distribution of results beyond the 95% confidence interval; and reporting of losses in a single day, which does not reflect the risk of positions that cannot be liquidated or hedged in one day. A small proportion of market risk generated by trading positions is not included in VaR. The modeling of the risk characteristics of some positions relies on approximations that, under certain circumstances, could produce significantly different results from those produced using more precise measures. VaR is most appropriate as a risk measure for trading positions in liquid financial markets and will understate the risk associated with severe events, such as periods of extreme illiquidity. The Group is aware of these and other limitations and, therefore, uses VaR as only one component in its risk management oversight process. This process also incorporates stress testing and scenario analyses and extensive risk monitoring, analysis, and control at the trading desk, division, entity and global levels.
The Group’s VaR model evolves over time in response to changes in the composition of trading portfolios and to improvements in modelling techniques and systems capabilities. The Group is committed to continuous review and enhancement of VaR methodologies and assumptions in order to capture evolving risks associated with changes in market structure and dynamics. As part of regular process improvement, additional systematic and name-specific risk factors may be added to improve the VaR model’s ability to more accurately estimate risks to specific asset classes or industry sectors.
MORGAN STANLEY & CO. INTERNATIONAL plc NOTES TO THE CONSOLIDATED FINANCIAL STATEMENTS Year ended 31 December 2015
79
28. FINANCIAL RISK MANAGEMENT (CONTINUED)
Market risk (continued)
VaR (continued)
Since the reported VaR statistics are estimates based on historical data, VaR should not be viewed as predictive of the Group’s future revenues or financial performance or of its ability to monitor and manage risk. There can be no assurance that the Group’s actual losses on a particular day will not exceed the VaR amounts indicated below or that such losses will not occur more than five times in 100 trading days for a 95%/one-day VaR. VaR does not predict the magnitude of losses that, should they occur, may be significantly greater than the VaR amount.
Sensitivity analysis
VaR for the year ended 31 December 2015 The table below presents the Management VaR for the Group’s Trading portfolio on a year-end, average and annual high and low basis for 31 December 2015 and 31 December 2014.
The Credit Portfolio VaR is disclosed as a separate category from the Primary Risk Categories and includes loans that are carried at fair value and associated hedges as well as counterparty credit valuation adjustments and related hedges.
95%/ one-day VaR for the year
ended 31 December 2015 95%/ one-day VaR for the year
ended 31 December 2014
Period end Average High Low Period end Average High Low $millions $millions $millions $millions $millions $millions $millions $millions
(1) Diversification benefit equals the difference between total trading VaR and the sum of the VaRs for the four risk categories. This benefit arises because the simulated one-day losses for each of the four primary market risk categories occur on different days; similar diversification benefits also are taken into account within each category. (2) N/A - Not Applicable. The minimum and maximum VaR values for the total VaR and each of the component VaRs might have occurred on different days during the year and therefore the diversification benefit is not an applicable measure. (3) The Credit Portfolio VaR is disclosed as a separate category from the Primary Risk Categories and includes loans that are carried at fair value and associated hedges as well as counterparty credit valuation adjustments and related hedges.
MORGAN STANLEY & CO. INTERNATIONAL plc NOTES TO THE CONSOLIDATED FINANCIAL STATEMENTS Year ended 31 December 2015
80
28. FINANCIAL RISK MANAGEMENT (CONTINUED)
Market risk (continued)
VaR (continued)
The Group’s average VaR for Primary Risk Categories for 2015 was $22 million compared with $17 million for 2014. The increase in average VaR for Primary Risk Categories is primarily due to increased exposure to interest rate along with equity price risk.
The average Credit Portfolio VaR for 2015 was $6 million unchanged compared with 2014.
The average total VaR for 2015 was $23 million compared with $19 million for 2014.
Non-trading risks for the year ended 31 December 2015
The Group believes that sensitivity analysis is an appropriate representation of the Group’s non-trading risks. Reflected below is this analysis, which covers substantially all of the non-trading risks in the Group’s portfolio.
Interest rate risk The Group’s VaR excludes certain funding liabilities and money market transactions. The application of a parallel shift in interest rates of 50 basis points increase or decrease to these positions, would result in a net gain or loss of approximately $1.8 million as at 31 December 2015, compared to a net loss or gain of $2.7 million as at 31 December 2014.
Counterparty exposure related to own spreads The credit spread risk relating to the Group’s own mark-to-market derivative counterparty exposure is managed within the VaR from 2015. The credit spread risk sensitivity of this exposure corresponded to an increase in value of approximately $2.7 million for each 1 basis point widening in the Group’s credit spread level as at 31 December 2014.
Funding liabilities
The credit spread risk sensitivity of the Group’s mark-to-market funding liabilities corresponds to an increase in value of approximately $0.3 million and $0.1 million for each 1 basis point widening in the Group’s credit spread level at 31 December 2015 and 31 December 2014 respectively.
Equity investments price risk
The Group is exposed to equity price risk as a result of changes in the fair value of its investments in listed and private equities classified as available-for-sale financial assets. These investments are predominantly equity positions with long investment horizons, the majority of which are for business facilitation purposes. The market risk related to these investments is measured by estimating the potential reduction in net revenues associated with a 10% decline in asset values as shown in the table below.
31 December 2015 31 December 2014 10% sensitivity 10% sensitivity
$millions $millions
Available-for-sale financial assets 4 4
MORGAN STANLEY & CO. INTERNATIONAL plc NOTES TO THE CONSOLIDATED FINANCIAL STATEMENTS Year ended 31 December 2015
81
28. FINANCIAL RISK MANAGEMENT (CONTINUED)
Market risk (continued)
Currency risk The Group has foreign currency exposure arising from foreign operations. The majority of this foreign currency risk has been hedged by other members of the Morgan Stanley Group, primarily Morgan Stanley, by utilising forward foreign currency exchange contracts.
The Group also has foreign currency exposure arising from its trading activities in currencies other than US dollars. It actively manages this exposure by hedging with other Morgan Stanley Group undertakings.
The analysis below details the foreign currency exposure for the Group, by foreign currency, relating to the retranslation of its non-US dollar denominated branches and subsidiaries. The analysis calculates the impact on total comprehensive income of a reasonably possible parallel shift of the foreign currency in relation to the US dollar, with all other variables held constant. This analysis does not take into account the effect of the foreign currency hedges held by other members of the Morgan Stanley Group.
2015 2014
Sensitivity to applied percentage change in
currency (+/-)
Sensitivity to applied percentage change in
currency (+/-)
Foreign currency exposure
Percentage change applied
Other comprehensive
income
Foreign currency exposure
Percentage change applied
Other comprehensive
income $millions % $millions $millions % $millions Australian Dollar (35) 14% (5) (52) 14% (7) British Pound (85) 6% (5) (29) 6% (2) Euro 248 12% 30 264 12% 32 Taiwan New Dollar 68 6% 4 67 8% 6 Polish Zloty 2 17% - 3 17% 1 South Korean Won 191 8% 15 205 8% 17 Swedish Krona 13 21% 3 14 21% 3 Swiss Franc 11 12% 1 9 12% 1
413 43 481 51
The reasonably possible percentage change in the currency rate in relation to US dollars has been calculated based on the greatest annual percentage change over the 5 year period from 1 January 2011 to 31 December 2015 (2014: 1 January 2010 to 31 December 2014). Thus, the percentage change applied may not be the same percentage as the actual change in the currency rate for year ended 31 December 2015, or for the year ended 31 December 2014.
The Group also has foreign currency exposure arising from its trading activities and assets and liabilities in currencies other than US dollars, which it actively manages by hedging with other Morgan Stanley Group undertakings.
MORGAN STANLEY & CO. INTERNATIONAL plc NOTES TO THE CONSOLIDATED FINANCIAL STATEMENTS Year ended 31 December 2015
82
29. TRANSFERS OF FINANCIAL ASSETS, INCLUDING PLEDGE S OF COLLATERAL Transferred financial assets that are not derecognised in their entirety
In the ordinary course of business, the Group enters into various arrangements including selling securities under agreements to repurchase, purchasing securities under agreements to resell, securities borrowed and securities loaned to, amongst other things, acquire securities to cover short positions and settle other securities obligations, to accommodate customers’ needs and to finance the Group’s inventory positions.
The Group pledges certain financial instruments to collateralise repurchase agreements and other securities financings. Pledged financial instruments that can be sold or repledged by the secured party are identified as financial instruments classified as held for trading (pledged to various parties) in the consolidated statement of financial position. The Group has determined that it retains substantially all the risks and rewards of these financial instruments including credit risk, settlement risk, country risk and market risk, and therefore has not derecognised them. In addition, it recognises a financial liability in respect of the consideration received.
Other financial assets transferred that continue to be recognised for accounting purposes include pledges of securities as collateral for derivative transactions or otherwise, as well as certain sales of securities with related transactions, such as derivatives, that result in the Group retaining substantially all the risks and rewards of the financial assets transferred. In such cases the Group recognises a financial liability in respect of the consideration received.
These transactions are mostly conducted under standard agreements used by financial market participants and are undertaken with counterparties subject to the Group’s normal credit risk control processes. The resulting credit exposures are controlled by daily monitoring and collateralisation of the positions. The carrying amount of the associated financial liabilities related to financial assets transferred that continue to be recognised is $41,269 million (2014: $45,953 million).
The following table presents those financial assets which have been sold or otherwise transferred, but which for accounting purposes remain recognised on the consolidated statement of financial position. Positions presented below are shown prior to the impact of offsetting assets and liabilities of the same type, whilst the consolidated statement of financial position is presented after the impact of offsetting such positions.
2015 2014 $millions $millions Financial assets classified as held for trading Government debt securities 13,088 14,568 Corporate and other debt 1,657 5,625 Corporate equities 32,044 30,548
46,789 50,741
MORGAN STANLEY & CO. INTERNATIONAL plc NOTES TO THE CONSOLIDATED FINANCIAL STATEMENTS Year ended 31 December 2015
83
30. FINANCIAL ASSETS ACCEPTED AS COLLATERAL The Group’s policy is generally to take possession of securities received as collateral, securities purchased under agreements to resell and securities borrowed. The Group monitors the fair value of the underlying securities as compared with the related receivable or payable, including accrued interest, and, as necessary, requests additional collateral to ensure such transactions are adequately collateralised. Where deemed appropriate, the Group’s agreements with third parties specify its rights to request additional collateral. These transactions are mostly conducted under standard documentation used by financial market participants.
The fair value of collateral accepted under these arrangements as at 31 December 2015 was $182,810 million (2014: $188,375 million). Of this amount $151,318 million (2014: $139,243 million) has been sold or repledged to third parties in connection with financing activities, or to comply with commitments under short sale transactions.
31. FINANCIAL ASSETS AND FINANCIAL LIABILITIES SUB JECT TO OFFSETTING
In order to manage credit exposure arising from its business activities, the Group applies various credit risk management policies and procedures, see note 28 for further details. Primarily in connection with securities purchased under agreements to resell and securities sold under agreements to repurchase, securities borrowed and securities loaned transactions and derivative transactions, the Group enters into master netting arrangements and collateral arrangements with its counterparties. These agreements provide the Group with the right, in the ordinary course of business and/ or in the event of a counterparty default (such as bankruptcy or a counterparty’s failure to pay or perform), to net a counterparty’s rights and obligations under such agreement and, in the event of counterparty default, set off collateral held by the Group against the net amount owed by the counterparty. However, in certain circumstances, the Group may not have such an agreement in place; the relevant insolvency regime (which is based on type of counterparty entity and the jurisdiction of organisation of the counterparty) may not support the enforceability of the agreement; or the Group may not have sought legal advice to support the enforceability of the agreement. In cases where the Group has not determined an agreement to be enforceable, the related amounts are not offset in the tabular disclosures. The Group’s policy is generally to take possession of securities purchased under agreements to resell and securities borrowed, and to receive securities and cash posted as collateral (with rights of rehypothecation), although in certain cases the Group may agree for such collateral to be posted to a third party custodian under a tri-party arrangement that enables the Group to take control of such collateral in the event of a counterparty default. The enforceability of the master netting agreement is taken into account in the Group’s risk management practices and application of counterparty credit limits. The Group also monitors the fair value of the underlying securities as compared with the related receivable or payable, including accrued interest, and, as necessary, requests additional collateral as provided under the applicable agreement to ensure such transactions are adequately collateralised.
In the consolidated statement of financial position, financial assets and financial liabilities are only offset and presented on a net basis where there is a current legally enforceable right to set off the recognised amounts and an intention to either settle on a net basis or to realise the asset and the liability simultaneously. In the absence of such conditions, financial assets and financial liabilities are presented on a gross basis.
The following tables present information about the offsetting of financial instruments and related collateral amounts. The tables do not include information about financial instruments that are subject only to a collateral agreement. The effect of master netting arrangements, collateral agreements and other credit enhancements, on the Group’s exposure to credit risk is disclosed in note 28.
MORGAN STANLEY & CO. INTERNATIONAL plc NOTES TO THE CONSOLIDATED FINANCIAL STATEMENTS Year ended 31 December 2015
84
31. FINANCIAL ASSETS AND FINANCIAL LIABILITIES SUB JECT TO OFFSETTING (CONTINUED)
Amounts
offset in the consolidated statement of
financial position
(2) (3)
Net amounts presented in the
consolidated statement of
financial position
Amounts not offset in the consolidated statement of
financial position (4) (5)
Gross amounts (1)
Financial Cash Net exposure (6) instruments collateral
Securities sold under agreement to repurchase 57,585 (19,574) 38,011 (35,808) - 2,203 Financial liabilities classified as held for trading: Derivatives 223,016 (41,965) 181,051 (147,725) (23,139) 10,187
TOTAL 311,577 (76,247) 235,330 (199,767) (23,139) 12,424
(1) Amounts include $773 million of cash collateral on securities borrowed, $450 million of securities purchased under agreements to resell, $2,786 million of financial assets classified as held for trading - derivatives, $10 million of cash collateral on securities loaned, $2,038 million of securities sold under agreements to repurchase and $2,908 million of financial liabilities classified as held for trading – derivatives which are either not subject to master netting agreements or collateral agreements or are subject to such agreements but the Group has not determined the agreements to be legally enforceable.
(2) Amounts are reported on a net basis in the consolidated statements of financial position when there is a legally enforceable master netting arrangement that provides for a current right of offset and there is an intention to either settle on a net basis or to realise the asset and liability simultaneously.
(3) Amounts include $4,351 million of cash collateral related to financial assets classified as held for trading – derivatives and $1,258 million of cash collateral related to financial liabilities classified as held for trading – derivatives, recognised in amounts offset in the consolidated statement of financial positions for assets and liabilities respectively.
(4) Amounts relate to master netting arrangements and collateral arrangements which have been determined by the Group to be legally enforceable but do not meet all criteria required for net presentation within the consolidated statement of financial position.
(5) The cash collateral not offset is recognised in the consolidated statement of financial position within trade receivables and payables respectively.
(6) Of the residual net exposure, intercompany cross-product legally enforceable netting arrangements are in place which would allow for an additional $2,716 million to be offset in the ordinary course of business and/ or in the event of default.
MORGAN STANLEY & CO. INTERNATIONAL plc NOTES TO THE CONSOLIDATED FINANCIAL STATEMENTS Year ended 31 December 2015
85
31. FINANCIAL ASSETS AND FINANCIAL LIABILITIES SUB JECT TO OFFSETTING (CONTINUED)
Amounts offset in the
consolidated statement of
financial position
(2) (3)
Net amounts presented in the
consolidated statement of
financial position
Amounts not offset in the consolidated statement of financial position (4) (5) (6)
Gross amounts (1)
Financial Cash Net exposure (7) instruments collateral
TOTAL 394,689 (100,024) 294,665 (254,842) (24,015) 15,808
(1) Amounts include $697 million of cash collateral on securities borrowed, $1,080 million of securities purchased under agreements to resell, $4,602 million of financial assets classified as held for trading - derivatives, $60 million of cash collateral on securities loaned, $3,359 million of securities sold under agreements to repurchase and $3,920 million of financial liabilities classified as held for trading – derivatives which are either not subject to master netting agreements or collateral agreements or are subject to such agreements but the Group has not determined the agreements to be legally enforceable.
(2) Amounts are reported on a net basis in the consolidated statements of financial position when there is a legally enforceable master netting arrangement that provides for a current right of offset and there is an intention to either settle on a net basis or to realise the asset and liability simultaneously.
(3) Amounts include $9,272 million of cash collateral related to financial assets classified as held for trading – derivatives and $1,153 million of cash collateral related to financial liabilities classified as held for trading – derivatives, recognised in amounts offset in the consolidated statement of financial positions for assets and liabilities respectively.
(4) Amounts relate to master netting arrangements and collateral arrangements which have been determined by the Group to be legally enforceable but do not meet all criteria required for net presentation within the consolidated statement of financial position.
(5) The cash collateral not offset is recognised in the consolidated statement of financial position within trade receivables and payables respectively.
(6) Certain financial assets and financial liabilities designated at fair value through profit or loss have legally enforceable master netting arrangements in place; however, these are not eligible for netting within the consolidated statement of financial position. $2 million not presented net within the consolidated statement of financial position have legally enforceable netting arrangements in place and can be offset in the ordinary course of business and/ or in the event of default.
(7) Of the residual net exposure, intercompany cross-product legally enforceable netting arrangements are in place which would allow for an additional $2,928 million to be offset in the ordinary course of business and / or in the event of default.
MORGAN STANLEY & CO. INTERNATIONAL plc NOTES TO THE CONSOLIDATED FINANCIAL STATEMENTS Year ended 31 December 2015
86
32. FINANCIAL INSTRUMENTS MEASURED AT FAIR VALUE a. Financial assets and liabilities recognised at fair value on a recurring basis
The following tables present the carrying value of the Group’s financial assets and financial liabilities recognised at fair value on a recurring basis, classified according to the fair value hierarchy.
2015 Valuation Valuation techniques Quoted techniques with prices in using significant active observable unobservable market inputs inputs (Level 1) (Level 2) (Level 3) Total $millions $millions $millions $millions Financial assets classified as held for trading: Government debt securities 7,282 4,079 4 11,365 Corporate and other debt - 6,393 576 6,969 Corporate equities 40,364 236 228 40,828 Derivatives: Interest rate contracts - 79,813 247 80,060 Credit contracts - 9,890 268 10,158 Foreign exchange and gold contracts - 62,014 452 62,466 Equity contracts 566 27,450 1,902 29,918 Commodity contracts 8 4,495 6 4,509
Total financial assets classified as held for trading 48,220 194,370 3,683 246,273
Financial assets designated at fair value through profit or loss - 1,255 381 1,636 Available-for-sale financial assets: Corporate equities 1 - 38 39
Total financial assets measured at fair value 48,221 195,625 4,102 247,948
Financial liabilities classified as held for trading: Government debt securities 8,451 2,296 - 10,747 Corporate and other debt - 1,279 5 1,284 Corporate equities 23,372 37 15 23,424 Derivatives: Interest rate contracts - 73,572 929 74,501 Credit contracts - 10,119 279 10,398 Foreign exchange and gold contracts - 61,047 212 61,259 Equity contracts 183 29,061 2,455 31,699 Commodity contracts 14 3,174 6 3,194
Total financial liabilities classified as held for trading 32,020 180,585 3,901 216,506 Financial liabilities designated at fair value through profit or loss - 4,705 160 4,865
Total financial liabilities measured at fair value 32,020 185,290 4,061 221,371
MORGAN STANLEY & CO. INTERNATIONAL plc NOTES TO THE CONSOLIDATED FINANCIAL STATEMENTS Year ended 31 December 2015
87
32. FINANCIAL INSTRUMENTS MEASURED AT FAIR VALU E (CONTINUED)
a. Financial assets and liabilities recognised at fair value on a recurring basis (continued)
2014 Valuation
Valuation
techniques Quoted techniques with prices in using significant active observable unobservable market inputs inputs (Level 1) (Level 2) (Level 3) Total $millions $millions $millions $millions Financial assets classified as held for trading: Government debt securities 7,350 3,492 39 10,881 Corporate and other debt 1 10,754 496 11,251 Corporate equities 37,192 682 119 37,993 Derivatives: Interest rate contracts 19 103,044 1,559 104,622 Credit contracts - 17,251 342 17,593 Foreign exchange and gold contracts - 68,777 314 69,091 Equity contracts 309 34,655 1,942 36,906 Commodity contracts 53 6,996 12 7,061
Total financial assets classified as held for trading 44,924 245,651 4,823 295,398
Financial assets designated at fair value through profit or loss - 2,044 1,316 3,360 Available-for-sale financial assets: Corporate equities 2 - 40 42
Total financial assets measured at fair value 44,926 247,695 6,179 298,800
Financial liabilities classified as held for trading: Government debt securities 7,094 1,829 - 8,923 Corporate and other debt - 2,213 6 2,219 Corporate equities 15,351 77 3 15,431 Derivatives: Interest rate contracts 16 99,568 1,534 101,118 Credit contracts - 17,017 348 17,365 Foreign exchange and gold contracts - 67,870 86 67,956 Equity contracts 181 35,969 2,975 39,125 Commodity contracts 55 5,576 60 5,691 Total financial liabilities classified as held for trading 22,697 230,119 5,012 257,828
Financial liabilities designated at fair value through profit or loss - 5,062 69 5,131
Total financial liabilities measured at fair value 22,697 235,181 5,081 262,959
MORGAN STANLEY & CO. INTERNATIONAL plc NOTES TO THE CONSOLIDATED FINANCIAL STATEMENTS Year ended 31 December 2015
88
32. FINANCIAL INSTRUMENTS MEASURED AT FAIR VALU E (CONTINUED)
a. Financial assets and liabilities recognised at fair value on a recurring basis (continued)
The Group’s valuation approach and fair value hierarchy categorisation for certain significant classes of financial instruments recognised at fair value on a recurring basis is as follows:
Financial assets and financial liabilities classified as held for trading and available-for-sale financial assets
US Treasury Securities Fair value is determined using quoted market prices; valuation adjustments are not applied.
• Generally Level 1
Non-US Sovereign Government Obligations
Fair value is determined using quoted prices in active markets when available.
• Generally Level 1 • Level 2 – if the market is less active or prices are dispersed • Level 3 – in instances where the inputs are unobservable Corporate and Other Debt
Residential Mortgage-Backed Securities (“RMBS”), Commercial Mortgage-Backed Securities (“CMBS”) and other Asset-Backed Securities (“ABS”)
RMBS, CMBS and other ABS may be valued based on price or spread data obtained from observed transactions or independent external parties such as vendors or brokers.
• Generally Level 2
When position-specific external price data are not observable, the fair value determination may require benchmarking to similar instruments, and/or analysing expected credit losses, default and recovery rates, and/or applying discounted cash flow techniques. In evaluating the fair value of each security, the Group considers security collateral-specific attributes, including payment priority, credit enhancement levels, type of collateral, delinquency rates and loss severity. In addition, for RMBS borrowers, Fair Isaac Corporation (“FICO”) scores and the level of documentation for the loan are considered.
• Level 3 - if external prices or significant spread inputs are unobservable or if the comparability assessment involves significant subjectivity related to property type differences, cash flows, performance and other inputs
Corporate Bonds Fair value is determined using: - recently executed transactions - market price quotations (where observable) - bond spreads - credit default swap spreads - at the money volatility and/or volatility skew
obtained from independent external parties such as vendors and brokers adjusted for any basis difference between cash and derivative instruments
The spread data used are for the same maturity as the bond. If the spread data do not reference the issuer, then data that reference a comparable issuer are used. When position-specific external price data are not observable, fair value is determined based on either benchmarking to similar instruments or cash flow models with yield curves, bond or single name credit default swap spreads and recovery rates as significant inputs.
• Generally Level 2 • Level 3 - if prices, spreads or any of the other aforementioned key inputs are unobservable
MORGAN STANLEY & CO. INTERNATIONAL plc NOTES TO THE CONSOLIDATED FINANCIAL STATEMENTS Year ended 31 December 2015
89
32. FINANCIAL INSTRUMENTS MEASURED AT FAIR VALU E (CONTINUED)
a. Financial assets and liabilities recognised at fair value on a recurring basis (continued)
Financial assets and financial liabilities classified as held for trading and available-for-sale financial assets (continued)
Collateralised Debt Obligations (“CDO”) and Collateralised Loan Obligations (“CLO”)
The Group holds cash CDOs/CLOs that typically reference a tranche of an underlying synthetic portfolio of single name credit default swap spreads collateralised by corporate bonds (“credit-linked notes”) or cash portfolio of asset-backed securities/loans (“asset-backed CDOs/CLOs”).
Credit correlation, a primary input used to determine the fair value of credit-linked notes, is usually unobservable and derived using a benchmarking technique. The other credit-linked note model inputs such as credit spreads, including collateral spreads, and interest rates are typically observable.
Asset-backed CDOs/CLOs are valued based on an evaluation of the market and model input parameters sourced from similar positions as indicated by primary and secondary market activity. Each asset-backed CDO/CLO position is evaluated independently taking into consideration available comparable market levels, underlying collateral performance and pricing, deal structures and liquidity.
• Level 2 - when either the credit correlation input is insignificant or comparable market transactions are observable • Level 3 - when either the credit correlation input is deemed to be significant or comparable market transactions are unobservable
Corporate loans and Lending Commitments
Fair value of corporate loans is determined using: - recently executed transactions - market price quotations (where observable) - implied yields from comparable debt - market observable credit default swap
spread levels obtained from independent external parties such as vendors and brokers adjusted for any basis difference between cash and derivative instruments, along with proprietary valuation models and default recovery analysis where such transactions and quotations are unobservable
• Level 2 - if value based on observable market data for identical or comparable instruments • Level 3 - in instances where prices or significant spread inputs are unobservable
The fair value of contingent corporate lending commitments is determined by using executed transactions on comparable loans and the anticipated market price based on pricing indications from syndicate banks and customers. The valuation of loans and lending commitments also takes into account fee income that is considered an attribute of the contract.
MORGAN STANLEY & CO. INTERNATIONAL plc NOTES TO THE CONSOLIDATED FINANCIAL STATEMENTS Year ended 31 December 2015
90
32. FINANCIAL INSTRUMENTS MEASURED AT FAIR VAL UE (CONTINUED)
a. Financial assets and liabilities recognised at fair value on a recurring basis (continued)
Financial assets and financial liabilities classified as held for trading and available-for-sale financial assets (continued)
Fair value is generally determined based on quoted prices from the exchange. To the extent these securities are actively traded, valuation adjustments are not applied.
• Level 1 - if actively traded
Unlisted Equity Securities
Fair value is determined based on an assessment of each underlying security, considering rounds of financing and third-party transactions, discounted cash flow analyses and market-based information, including comparable company transactions, trading multiples and changes in market outlook, among other factors.
• Level 2 or Level 3 - if not actively traded • Generally Level 3
Fund Units
Listed fund units are generally marked to the exchange-traded price.
Listed fund units if not actively traded and unlisted fund units are generally marked to net asset value.
• Level 1 - listed fund units if actively traded on an exchange
• Level 3 – if not actively traded
Available-for-sale (“AFS”) financial assets
AFS financial assets are composed of Corporate Equities.
For further information on the determination of fair value, refer to the corresponding asset valuation technique described above.
For further information on AFS financial assets, see note 14.
• Generally Level 3
Derivatives and Other Contracts
Listed derivative contracts Listed derivatives that are actively traded are valued based on quoted prices from the exchange. Listed derivatives that are not actively traded are valued using the same approaches as those applied to OTC derivatives.
• Level 1 - listed derivatives that are actively traded • Level 2 - listed derivatives that are not actively traded
OTC derivative contracts OTC derivative contracts include forward, swap and option contracts related to interest rates, foreign currencies, credit standing of reference entities, equity prices or commodity prices. Depending on the product and the terms of the transaction, the fair value of OTC derivative products can be either observed or modelled using a series of techniques and model inputs from comparable benchmarks, including closed-form analytic formulas, such as the Black-Scholes option-pricing model, and simulation models or a combination thereof. Many pricing models do not entail material subjectivity because the methodologies employed do not necessitate significant judgement, and the pricing inputs are observed from actively quoted markets, as is the case for generic interest rate swaps, certain option contracts and certain credit default swaps. In the case of more established derivative products, the pricing models used by the Group are widely accepted by the financial services industry.
• Generally Level 2 - OTC derivative products valued using pricing models; basket credit default swaps if the correlation input is not deemed to be significant; commodity derivatives • Level 3 - OTC derivative products with significant unobservable inputs; basket credit default swaps if the correlation input is deemed to be significant; commodity derivatives in instances where significant inputs are unobservable
MORGAN STANLEY & CO. INTERNATIONAL plc NOTES TO THE CONSOLIDATED FINANCIAL STATEMENTS Year ended 31 December 2015
91
32. FINANCIAL INSTRUMENTS MEASURED AT FAIR VALUE (CONTI NUED)
a. Financial assets and liabilities recognised at fair value on a recurring basis (continued)
Financial assets and financial liabilities classified as held for trading and available-for-sale financial assets (continued)
Other derivative products, including complex products that have become illiquid, require more judgement in the implementation of the valuation technique applied due to the complexity of the valuation assumptions and the reduced observability of inputs. This includes certain types of interest rate derivatives with both volatility and correlation exposure and credit derivatives, including credit default swaps on certain mortgage-backed or asset-backed securities, basket credit default swaps where direct trading activity or quotes are unobservable. Derivative interests in credit default swaps on certain mortgage-backed or asset-backed securities, for which observability of external price data is limited, are valued based on an evaluation of the market and model input parameters sourced from similar positions as indicated by primary and secondary market activity. Each position is evaluated independently taking into consideration available comparable market levels as well as a cash synthetic basis or the underlying collateral performance and pricing, behaviour of the tranche under various cumulative loss and prepayment scenarios, deal structures (e.g., non-amortising reference obligations, call features, etc.) and liquidity. While these factors may be supported by historical and actual external observations, the determination of their value as it relates to specific positions nevertheless requires significant judgement.
For basket credit default swaps the correlation input between reference credits is unobservable for each specific swap or position and is benchmarked to standardised proxy baskets for which correlation data are available. The other model inputs such as credit spread, interest rates and recovery rates are observable.
The Group trades various derivative structures with commodity underlyings. Depending on the type of structure, the model inputs generally include interest rate yield curves, commodity underlier price curves, implied volatility of the underlying commodities and, in some cases, the implied correlation between these inputs. The fair value of these products is determined using executed trades and broker and consensus data to provide values for the aforementioned inputs. Where these inputs are unobservable, relationships to observable commodities and data points, based on historic and/or implied observations, are employed as a technique to estimate the model input values. For further information on the valuation techniques for OTC derivative products, see note 3.
MORGAN STANLEY & CO. INTERNATIONAL plc NOTES TO THE CONSOLIDATED FINANCIAL STATEMENTS Year ended 31 December 2015
92
a. Financial assets and liabilities recognised at fair value on a recurring basis (continued)
Financial assets and financial liabilities classified at fair value through profit and loss
Prepaid OTC contracts and issued structured notes designated at fair value through profit and loss
The Group issues structured notes and trades prepaid OTC contracts that have coupon or repayment terms linked to the performance of debt or equity securities, indices, currencies or commodities. Fair value of structured notes and trades prepaid OTC contracts is determined using valuation models for the derivative and debt portions of the notes and trades prepaid OTC contracts. These models incorporate observable inputs referencing identical or comparable securities, including:
- prices to which the notes are linked - interest rate yield curves - option volatility and currency - commodity or equity prices
Independent, external and traded prices for the notes are considered as well. The impact of the Group’s own credit spreads is also included based on observed secondary bond market spreads.
• Generally Level 2
Corporate loans Fair value of corporate loans is determined using:
- market observable credit default swap spread levels obtained from independent external parties such as vendors and brokers adjusted for any basis difference between cash and derivative instruments, along with proprietary valuation models and default recovery analysis where such transactions and quotations are unobservable.
• Level 2 - if value based on observable market data for identical or comparable instruments • Level 3 - in instances where prices or significant spread inputs are unobservable
The fair value of contingent corporate lending commitments is determined by using executed transactions on comparable loans and the anticipated market price based on pricing indications from syndicate banks and customers. The valuation of loans and lending commitments also takes into account fee income that is considered an attribute of the contract.
32. FINANCIAL INSTRUMENTS MEASURED AT FAIR VALUE (CONTI NUED)
MORGAN STANLEY & CO. INTERNATIONAL plc NOTES TO THE CONSOLIDATED FINANCIAL STATEMENTS Year ended 31 December 2015
93
b. Transfers between Level 1 and Level 2 of the fair value hierarchy for financial assets and liabilities recognised at fair value on a recurring basis
There were no material transfers between Level 1 to Level 2 of the fair value hierarchy during the year (2014: $nil).
c. Changes in Level 3 financial assets and liabilities recognised at fair value on a recurring basis
The following tables present the changes in the fair value of the Group’s Level 3 financial assets and financial liabilities for the year ended 31 December 2015. Level 3 instruments may be hedged with instruments classified in Level 1 and Level 2. As a result, the realised and unrealised gains/ (losses) for assets and liabilities within the Level 3 category presented in the tables below do not reflect the related realised and unrealised gains/ (losses) on hedging instruments that have been classified by the Group within the Level 1 and/or Level 2 categories.
Additionally, both observable and unobservable inputs may be used to determine the fair value of positions that the Group has classified within the Level 3 category. As a result, the unrealised gains/ (losses) during the period for assets and liabilities within the Level 3 category presented in the tables below may include changes in fair value during the period that were attributable to both observable (e.g., changes in market interest rates) and unobservable (e.g., changes in unobservable long-dated volatilities) inputs.
The Morgan Stanley Group operates a number of intra-group policies to ensure that, where possible, revenues and related costs are matched. Where the trading positions included in the below table are risk managed using financial instruments held by other Morgan Stanley Group undertakings, these policies potentially result in the recognition of offsetting gains or losses in the Group.
32. FINANCIAL INSTRUMENTS MEASURED AT FAIR VALUE (C ONTINUED)
MORGAN STANLEY & CO. INTERNATIONAL plc NOTES TO THE CONSOLIDATED FINANCIAL STATEMENTS Year ended 31 December 2015
94
32.
c.
FINANCIAL INSTRUMENTS MEASURED AT FAIR VALUE (CONTI NUED)
Changes in Level 3 financial assets and liabilities recognised at fair value on a recurring basis (continued)
Total financial assets classified as held for trading 654 27 - 505 (526) - (2) 150 808 25 Financial assets designated at fair value through profit or loss 1,316 (14) - 93 (737) - (263) (14) 381 (14)
Available-for-sale financial assets:
Corporate equities 40 - (3) 1 - - - - 38 - Total financial assets measured at fair value 2,010 13 (3) 599 (1,263) - (265) 136 1,227 11
Financial liabilities classified as held for trading:
Total financial liabilities classified as held for trading 843 331 - (2,685) 110 2,667 (83) 505 1,026 180 Financial liabilities designated at fair value through profit or loss 69 2 - - - 141 (43) (5) 160 2 Total financial liabilities measured at fair value 912 333 - (2,685) 110 2,808 (126) 500 1,186 182
(1) For financial assets and financial liabilities that were transferred into and out of Level 3 during the year, gains or (losses) are presented as if the assets or liabilities had been transferred into or out of Level 3 as at the beginning of the year.
(2) Amounts represent unrealised gains or (losses) for the year ended 31 December 2015 related to assets and liabilities still outstanding at 31 December 2015. The unrealised gains or (losses) are recognised in the consolidated income statement or consolidated statement of comprehensive income as detailed in the financial instruments accounting policy (note 3c).
(3) Net derivative contracts represent Financial liabilities classified as held for trading – derivative contracts net of Financial assets classified as held for trading – derivative contracts.
MORGAN STANLEY & CO. INTERNATIONAL plc NOTES TO THE CONSOLIDATED FINANCIAL STATEMENTS Year ended 31 December 2015
95
There were no material transfers from Level 2 to Level 3 or from Level 3 to Level 2 of the fair value hierarchy during the year (2014: $nil).
32. FINANCIAL INSTRUMENTS MEASURED AT FAIR VALUE (CONTI NUED)
c. Changes in Level 3 financial assets and liabilities recognised at fair value on a recurring basis (continued)
Total financial assets classified as held for trading 790 47 - 364 (394) - (209) 56 654 (3) Financial assets designated at fair value through profit or loss 1,598 (12) - 935 - - (1,333) 128 1,316 (11)
Corporate equities 58 - (5) - (13) - - - 40 - Total financial assets measured at fair value 2,446 35 (5) 1,299 (407) - (1,542) 184 2,010 (14)
Financial liabilities classified as held for trading:
Corporate and other debt 47 (11) - (23) 11 - - (40) 6 (2)
Total financial liabilities classified as held for trading 584 (31) - (1,107) 62 946 395 (68) 843 (4) Financial liabilities designated at fair value through profit or loss 257 - - - - 70 (247) (11) 69 1 Total financial liabilities measured at fair value 841 (31) - (1,107) 62 1,016 148 (79) 912 (3)
(1) For financial assets and financial liabilities that were transferred into and out of Level 3 during the year, gains or (losses) are presented as if the assets or liabilities had been transferred into or out of Level 3 as at the beginning of the year.
(2) Amounts represent unrealised gains or (losses) for the year ended 31 December 2014 related to assets and liabilities still outstanding at 31 December 2014. The unrealised gains or (losses) are recognised in the consolidated income statement or consolidated statement of comprehensive income as detailed in the financial instruments accounting policy (note 3c).
(3) Net derivative contracts represent Financial liabilities classified as held for trading – derivative contracts net of Financial assets classified as held for trading – derivative contracts.
(4) During 2014, the Group incurred a charge for approximately $273 million related to the implementation of FVA, which was recognised within 'net gains on financial instruments classified as held for trading' in the consolidated income statement.
MORGAN STANLEY & CO. INTERNATIONAL plc NOTES TO THE CONSOLIDATED FINANCIAL STATEMENTS Year ended 31 December 2015
96
32. FINANCIAL INSTRUMENTS MEASURED AT FAIR VALUE (CONTI NUED)
d. Valuation of Level 3 financial assets and liabilities recognised at fair value on a recurring basis
The disclosures below provide information on the sensitivity of fair value measurements to key inputs and assumptions.
i. Quantitative information about and qualitative sensitivity of significant unobservable inputs
The table below provides information on the valuation techniques, significant unobservable inputs and their ranges and averages for each major category of assets and liabilities measured at fair value on a recurring basis with a significant Level 3 balance.
The level of aggregation and breadth of products cause the range of inputs to be wide and not evenly distributed across the inventory. Further, the range of unobservable inputs may differ across firms in the financial services industry because of diversity in the types of products included in each firm’s inventory. The following disclosures also include qualitative information on the sensitivity of the fair value measurements to changes in the significant unobservable inputs.
31 December 2015 Fair value $millions Valuation technique
Significant unobservable input(s) / sensitivity of the fair value to changes in the
Financial liabilities designated at fair value through profit or loss
- Issued structured notes (147) Option Model At the money volatility / (C) /(D) 26% to 38% 31%
Volatility skew / (C) /(D) -1% to 0% 0%
Equity correlation / (C) /(D) 42% to 97% 67%
Equity FX correlation / (A) /(D) -54% to -6% -44%
(1) Net derivative contracts represent financial assets classified as held for trading – derivative contracts net of financial liabilities classified as held for trading – derivative contracts. In addition, there are other derivative contracts with a fair value of $nil (2014: $7 million) not included within one of the major derivative categories.
(2) The ranges of significant unobservable inputs are represented in points, percentages or basis points. Points are a percentage of par; for example, 100 points would be 100% of par. A basis point (bps) equals 1/100th of 1%; for example, 353 basis points would equal 3.53%.
(3) Amounts represent weighted averages except where simple averages and the median of the inputs are provided (see footnote 5 below). Weighted averages are calculated by weighting each input by the fair value of the respective financial instruments except for derivative instruments where inputs are weighted by risk.
(4) CVA and FVA are included in the fair value, but excluded from the valuation techniques and significant unobservable inputs in the table above. CVA is deemed to be a Level 3 input when the underlying counterparty credit curve is unobservable. FVA is deemed to be a Level 3 input in its entirety given the lack of observability of funding spreads in the principal market.
(5) The data structure of the significant unobservable inputs used in valuing Interest rate contracts and certain Equity contracts may be in a multi-dimensional form, such as a curve or surface, with risk distributed across the structure. Therefore, a simple average and median, together with the range of data inputs, may be more appropriate measurements than a single point weighted average.
(6) Includes derivative contracts with multiple risks (i.e. hybrid products)
Sensitivity of the fair value to changes in the unobservable inputs:
(A) Significant increase/ (decrease) in the unobservable input in isolation would result in a significantly higher/ (lower) fair value measurement.
(B) Significant changes in credit correlation may result in a significantly higher or lower fair value measurement. Increasing/ (decreasing) correlation
drives a redistribution of risk within the capital structure such that junior tranches become less/ (more) risky and senior tranches become more/ (less)
risky.
(C) Significant increase/ (decrease) in the unobservable input in isolation would result in a significantly lower/ (higher) fair value measurement.
(D) There are no predictable relationships between the significant unobservable inputs.
MORGAN STANLEY & CO. INTERNATIONAL plc NOTES TO THE CONSOLIDATED FINANCIAL STATEMENTS Year ended 31 December 2015
98
32. FINANCIAL INSTRUMENTS MEASURED AT FAIR VA LUE (CONTINUED)
d. Valuation of Level 3 financial assets and liabilities recognised at fair value on a recurring basis (continued)
31 December 2014 Fair value
$millions Valuation technique
Significant unobservable input(s) / sensitivity of the fair value to changes in the
(1) Net derivative contracts represent financial assets classified as held for trading – derivative contracts net of financial liabilities classified as held for trading – derivative contracts. In addition, there are other derivative contracts with a fair value of $7 million not included within one of the major derivative categories.
(2) The ranges of significant unobservable inputs are represented in points, percentages or basis points. Points are a percentage of par; for example, 100 points would be 100% of par. A basis point (bps) equals 1/100th of 1%; for example, 353 basis points would equal 3.53%.
(3) Amounts represent weighted averages except where simple averages and the median of the inputs are provided (see footnote 5 below). Weighted averages are calculated by weighting each input by the fair value of the respective financial instruments except for derivative instruments where inputs are weighted by risk.
(4) CVA and FVA are included in the fair value, but excluded from the valuation techniques and significant unobservable inputs in the table above. CVA is deemed to be a Level 3 input when the underlying counterparty credit curve is unobservable. FVA is deemed to be a Level 3 input in its entirety given the lack of observability of funding spreads in the principal market.
(5) The data structure of the significant unobservable inputs used in valuing Interest rate contracts and certain Equity contracts may be in a multi-dimensional form, such as a curve or surface, with risk distributed across the structure. Therefore, a simple average and median, together with the range of data inputs, may be more appropriate measurements than a single point weighted average.
(6) Includes derivative contracts with multiple risks (i.e. hybrid products)
Sensitivity of the fair value to changes in the unobservable inputs:
(A) Significant increase/ (decrease) in the unobservable input in isolation would result in a significantly higher/ (lower) fair value measurement.
(B) Significant changes in credit correlation may result in a significantly higher or lower fair value measurement. Increasing/ (decreasing) correlation
drives a redistribution of risk within the capital structure such that junior tranches become less/ (more) risky and senior tranches become more/ (less)
risky.
(C) Significant increase/ (decrease) in the unobservable input in isolation would result in a significantly lower/ (higher) fair value measurement.
(D) There are no predictable relationships between the significant unobservable inputs.
The following provides a description of significant unobservable inputs included in the table above for all major categories of assets and liabilities:
• Comparable bond price – a pricing input used when prices for the identical instrument are not available. Significant subjectivity may be involved when fair value is determined using pricing data available for comparable instruments. Valuation using comparable instruments can be done by calculating an implied yield (or spread over a liquid benchmark) from the price of a comparable bond, then adjusting that yield (or spread) to derive a value for the bond. The adjustment to yield (or spread) should account for relevant differences in the bonds such as maturity or credit quality. Alternatively, a price-to-price basis can be assumed between the comparable instrument and bond being valued in order to establish the value of the bond. Additionally, as the probability of default increases for a given bond (i.e., as the bond becomes more distressed), the valuation of that bond will increasingly reflect its expected recovery level assuming default. The decision to use price-to-price or yield/spread comparisons largely reflects trading market convention for the financial instruments in question. Price-to-price comparisons are primarily employed for CMBS, CDOs and distressed corporate bonds. Implied yield (or spread over a liquid benchmark) is utilised predominately for non-distressed corporate bonds, loans and credit contracts.
32. FINANCIAL INSTRUMENTS MEASURED AT FAIR VALUE (CONTI NUED)
MORGAN STANLEY & CO. INTERNATIONAL plc NOTES TO THE CONSOLIDATED FINANCIAL STATEMENTS Year ended 31 December 2015
100
32. FINANCIAL INSTRUMENTS MEASURED AT FAIR VAL UE (CONTINUED)
d. Valuation of Level 3 financial assets and liabilities recognised at fair value on a recurring basis (continued)
• Comparable equity price—a price derived from equity raises, share buybacks and external bid levels, etc. A discount or premium may be included in the fair value estimate.
• Correlation – a pricing input where the payoff is driven by more than one underlying risk. Correlation is a measure of the relationship between the movements of two variables (i.e., how the change in one variable influences a change in the other variable). Credit correlation, for example, is the factor that describes the relationship between the probability of individual entities to default on obligations and the joint probability of multiple entities to default on obligations. The correlation ranges may be wide since any two underlying inputs may be highly correlated (either positively or negatively) or weakly correlated.
• Credit spread – the difference in yield between different securities due to differences in credit quality. The credit spread reflects the additional net yield an investor can earn from a security with more credit risk relative to one with less credit risk. The credit spread of a particular security is often quoted in relation to the yield on a credit risk-free benchmark security or reference rate, typically either US Treasury or LIBOR.
• EBITDA multiple—the ratio of the Enterprise Value to earnings before interest, taxes, depreciation and amortisation (“EBITDA”), where the Enterprise Value is the aggregate value of equity and debt minus cash and cash equivalents. The EBITDA multiple reflects the value of the company in terms of its full-year EBITDA and allows comparison between companies from an operational perspective as the effect of capital structure, taxation and depreciation/amortization is excluded.
• Interest rate curve—the term structure of interest rates (relationship between interest rates and the time to maturity) and a market’s measure of future interest rates at the time of observation. An interest rate curve is used to set interest rate and foreign exchange derivative cash flows and is a pricing input used in the discounting of any OTC derivative cash flow.
• Volatility – the measure of the variability in possible returns for an instrument given how much that instrument changes in value over time. Volatility is a pricing input for options and, generally, the lower the volatility, the less risky the option. The level of volatility used in the valuation of a particular option depends on a number of factors, including the nature of the risk underlying that option (e.g., the volatility of a particular underlying equity security may be significantly different from that of a particular underlying commodity index), the tenor and the strike price of the option.
• Volatility skew – the measure of the difference in implied volatility for options with identical underliers and expiry dates but with different strikes. The implied volatility for an option with a strike price that is above or below the current price of an underlying asset will typically deviate from the implied volatility for an option with a strike price equal to the current price of that same underlying asset.
MORGAN STANLEY & CO. INTERNATIONAL plc NOTES TO THE CONSOLIDATED FINANCIAL STATEMENTS Year ended 31 December 2015
101
d. Valuation of Level 3 financial assets and liabilities recognised at fair value on a recurring basis (continued)
ii. Sensitivity of fair values to changing significant assumptions to reasonably possible alternatives
All financial instruments are valued in accordance with the techniques outlined in the fair value hierarchy. Some of these techniques, including those used to value instruments categorised in Level 3 of the fair value hierarchy, are dependent on unobservable parameters and the fair value for these financial instruments has been determined using parameters appropriate for the valuation methodology based on prevailing market evidence. It is recognised that the unobservable parameters could have a range of reasonably possible alternative values.
In estimating the change in fair value, to provide information about the variability of the fair value measurement, the unobservable parameters were varied to the extremes of the ranges of reasonably possible alternatives using statistical techniques, such as dispersion in comparable observable external inputs for similar asset classes, historic data or judgement if a statistical technique is not appropriate. Where a financial instrument has more than one unobservable parameter, the sensitivity analysis reflects the greatest reasonably possible increase or decrease to fair value by varying the assumptions individually. It is unlikely that all unobservable parameters would be concurrently at the extreme range of possible alternative assumptions and therefore the sensitivity shown below is likely to be greater than the actual uncertainty relating to the financial instruments.
The following tables present the sensitivity of the fair value of Level 3 financial assets and financial liabilities to reasonably possible alternative assumptions, providing quantitative information on the potential variability of the fair value measurement.
32. FINANCIAL INSTRUMENTS MEASURED AT FAIR VALUE (CONTI NUED)
MORGAN STANLEY & CO. INTERNATIONAL plc NOTES TO THE CONSOLIDATED FINANCIAL STATEMENTS Year ended 31 December 2015
102
d. Valuation of Level 3 financial assets and liabilities recognised at fair value on a recurring basis (continued)
ii. Sensitivity of fair values to changing significant assumptions to reasonably possible alternatives (continued)
Effect of reasonably possible
alternative assumptions 2015
Fair value Increase in fair
value Decrease in fair
value $millions $millions $millions Financial assets classified as held for trading: Government debt securities 4 - - Corporate and other debt 576 19 (35) Corporate equities 228 2 (41)
Financial assets designated at fair value through profit or loss: Prepaid OTC contracts 93 3 (3) Customer loans 288 1 -
Available-for-sale financial assets: Corporate equities 38 9 (2) Financial liabilities classified as held for trading: Corporate and other debt 5 - - Corporate equities 15 - - Net derivatives contracts:(1)(2) 1,006 37 (52)
Financial liabilities designated at fair value through profit or loss: Prepaid OTC contracts 13 - - Issued structured notes 147 2 (2) (1) Net derivative contracts represent financial assets classified as held for trading – derivative contracts net of financial liabilities classified as held for trading – derivative contracts.
(2) CVA and FVA are included in the fair value, but excluded from the effect of reasonably possible alternative assumptions in the table above. CVA is deemed to be a Level 3 input when the underlying counterparty credit curve is unobservable. FVA is deemed to be a Level 3 input in its entirety given the lack of observability of funding spreads in the principal market.
32. FINANCIAL INSTRUMENTS MEASURED AT FAIR VALUE (CONTI NUED)
MORGAN STANLEY & CO. INTERNATIONAL plc NOTES TO THE CONSOLIDATED FINANCIAL STATEMENTS Year ended 31 December 2015
103
d. Valuation of Level 3 financial assets and liabilities recognised at fair value on a recurring basis (continued)
ii. Sensitivity of fair values to changing significant assumptions to reasonably possible alternatives (continued)
32. FINANCIAL INSTRUMENTS MEASURED AT FAIR VALUE (CONTI NUED)
Effect of reasonably possible
alternative assumptions 2014
Fair value Increase in fair
value Decrease in fair
value $millions $millions $millions Financial assets classified as held for trading: Government debt securities 39 - - Corporate and other debt 496 19 (16) Corporate equities 119 2 (9)
Financial assets designated at fair value through profit or loss: Prepaid OTC contracts 20 - - Customer loans 1,296 2 (3)
Available-for-sale financial assets: Corporate equities 40 9 (2) Financial liabilities classified as held for trading: Corporate and other debt 6 - - Corporate equities 3 - - Net derivatives contracts:(1)(2) 834 152 (163)
Financial liabilities designated at fair value through profit or loss: Prepaid OTC contracts 52 2 (1) Issued structured notes 17 - - (1) Net derivative contracts represent financial assets classified as held for trading – derivative contracts net of financial liabilities classified as held for trading – derivative contracts.
(2) CVA and FVA are included in the fair value, but excluded from the effect of reasonably possible alternative assumptions in the table above. CVA is deemed to be a Level 3 input when the underlying counterparty credit curve is unobservable. FVA is deemed to be a Level 3 input in its entirety given the lack of observability of funding spreads in the principal market.
MORGAN STANLEY & CO. INTERNATIONAL plc NOTES TO THE CONSOLIDATED FINANCIAL STATEMENTS Year ended 31 December 2015
104
e. Financial instruments valued using unobservable market data
The amounts not recognised in the consolidated income statement relating to the difference between the fair value at initial recognition (the transaction price) and the amounts determined at initial recognition using valuation techniques are as follows:
2015 2014 $millions $millions At 1 January 234 351 New transactions 43 26
Amounts recognised in the consolidated income statement during the year (61) (143)
At 31 December 216 234
The consolidated statement of financial position categories ‘Financial assets and financial liabilities classified as held for trading’, ‘Financial assets and financial liabilities designated at fair value through profit or loss’, and ‘Available-for-sale financial assets’ include financial instruments whose fair value is based on valuation techniques using unobservable market data. The balance above predominantly relates to derivative contracts.
f. Assets and liabilities measured at fair value on a non-recurring basis
Non-recurring fair value measurements of assets and liabilities are those which are required or permitted in the consolidated statement of financial position in particular circumstances. There were no assets or liabilities measured at fair value on a non-recurring basis during the year or prior year.
32. FINANCIAL INSTRUMENTS MEASURED AT FAIR VALUE (CONTI NUED)
MORGAN STANLEY & CO. INTERNATIONAL plc NOTES TO THE CONSOLIDATED FINANCIAL STATEMENTS Year ended 31 December 2015
105
33. FINANCIAL INSTRUMENTS NOT MEASURED AT FAIR VALU E
The tables below present the carrying value, fair value and fair value hierarchy category of certain financial assets and financial liabilities that are not measured at fair value in the consolidated statement of financial position.
Financial assets and financial liabilities not measured at fair value for which the carrying value is considered a reasonable approximation of fair value are excluded from the tables below.
Also included in the consolidated statement of financial position is $4,774 million (2014: $10,968 million) of other payables where the carrying value is a reasonable approximation of fair value. The fair value of other payables is determined based on current interest rates and credit spreads for debt instruments with similar terms and maturity.
As at 31 December 2015 the fair value of subordinated loans was approximate to its carrying value. The fair value of subordinated loans has been determined based on the assumption that all subordinated loans are held to the latest repayment date, although the amounts outstanding are repayable at any time at the Group's option, subject to prior consent from the PRA.
34. CAPITAL MANAGEMENT
The Group views capital as an important source of financial strength. It actively manages and monitors its capital in line with established policies and procedures and in compliance with local regulatory requirements.
The Group, in line with Morgan Stanley Group’s capital management policies, manages its capital position based upon among other things, business opportunities, risk appetite, capital availability and rates of return together with internal capital policies, regulatory requirements and rating agency guidelines and, therefore, in the future may expand or contract its capital base to address the changing needs of its businesses. The appropriate level of capital is determined at a legal entity level to safeguard that entity’s ability to continue as a going concern and ensure that it meets all regulatory capital requirements. The key components of the capital management framework used by the Group are set out in the Capital Management Policy and include a point in time capital assessment, forward looking capital projections and stress testing.
The MSI Group prepares an ICAAP document in order to meet obligations under CRD IV and the requirements of the PRA. The Group forms part of the MSI Group.
MORGAN STANLEY & CO. INTERNATIONAL plc NOTES TO THE CONSOLIDATED FINANCIAL STATEMENTS Year ended 31 December 2015
106
34. CAPITAL MANAGEMENT (CONTINUED)
The ICAAP is one of the key tools used to inform the MSI Group’s capital adequacy assessment, planning and management. The MSI Group ICAAP:
• Ensures the risks the MSI Group is exposed to are appropriately capitalised and risk managed, including those risks that are either not captured, or not fully captured under Pillar 1;
• Uses stress testing to size a capital buffer aimed at ensuring the MSI Group will continue to operate above regulatory requirements under a range of severe but plausible stress scenarios; and
• Assesses capital adequacy under normal and stressed operating environments over the 3 year capital planning horizon to ensure the MSI Group maintains a capital position in line with internal operating targets and above post stress minimum levels
The key elements of the ICAAP are embedded in the MSI Group’s day-to-day management processes and decision making culture.
The PRA reviews the ICAAP document through its Supervisory Review Process and issues an Individual Capital Guidance which sets the minimum level of regulatory capital for the MSI Group and the Company. In addition, the PRA sets a capital planning buffer which is available to support the MSI Group in a stressed market environment.
The capital managed by the Group broadly includes share capital, Additional Tier 1 capital instruments, subordinated debt and reserves. In order to maintain or adjust its capital structure, the Group may adjust the amount of dividends paid, return capital to its shareholder, issue new shares, issue or repay subordinated debt or sell assets to reduce debt. The Company’s capital as measured in accordance with CRD IV rules is shown within the strategic report on page 12.
The Group manages the following items as capital: 2015 2014 $millions $millions Ordinary share capital 11,465 11,464 Additional Tier 1 capital 1,300 1,300 Subordinated debt 7,906 7,906 Reserves 3,697 3,353
24,368 24,023
MORGAN STANLEY & CO. INTERNATIONAL plc NOTES TO THE CONSOLIDATED FINANCIAL STATEMENTS Year ended 31 December 2015
107
35. EMPLOYEE COMPENSATION PLANS
Morgan Stanley maintains various deferred compensation plans for the benefit of its employees. Two principal forms of deferred compensation are granted under equity-settled share-based compensation and deferred cash based compensation plans.
Equity-settled share-based compensation plans
• Restricted stock units
Morgan Stanley has granted restricted stock unit awards pursuant to several equity-based compensation plans. The plans provide for the deferral of a portion of certain employees’ incentive compensation with awards made in the form of restricted common stock or in the right to receive unrestricted shares of common stock in the future. Awards under these plans are generally subject to vesting over time contingent upon continued employment and to restrictions on sale, transfer or assignment until the end of a specified period, generally one to three years from the date of grant. All or a portion of an award may be cancelled if employment is terminated before the end of the relevant restriction period. All or a portion of a vested award also may be cancelled in certain limited situations, including termination for cause during the relevant restriction period. Recipients of stock-based awards may have voting rights, at the Morgan Stanley Group’s discretion, and generally receive dividend equivalents.
During the year, Morgan Stanley granted 417,228 (2014: 524,558) of restricted stock units to employees of the Group with a weighted average fair value per unit of $34.59 (2014: $32.58), based on the market value of Morgan Stanley shares at grant date.
Included within ‘Direct staff costs’ within the ‘Other expense’ note is an amount of $17 million (2014: $17 million) in relation to restricted stock units equity based compensation plans, granted to employees of the Group.
• Stock options
Morgan Stanley has also granted stock option awards pursuant to several equity-based compensation plans. The plans provide for the deferral of a portion of certain key employees’ incentive compensation with awards made in the form of stock options generally having an exercise price not less than the fair value of Morgan Stanley’s common stock on the date of grant. Such stock option awards generally become exercisable over a three year period and expire five to ten years from the date of grant, subject to accelerated expiration upon termination of employment. Stock option awards have vesting, restriction and cancellation provisions that are generally similar to those in restricted stock units.
The following table shows activity relating to the Morgan Stanley stock option awards for employees of the Group:
2015 2014 Number of Weighted Number of Weighted options average options average exercise price exercise price '000s $ '000s $ Options outstanding at 1 January 61 65.73 118 56.81 Expired during the year (3) 43.15 (57) 47.19
Options outstanding and exercisable at 31 December 58 66.73 61 65.73
MORGAN STANLEY & CO. INTERNATIONAL plc NOTES TO THE CONSOLIDATED FINANCIAL STATEMENTS Year ended 31 December 2015
2015 2014 Weighted Weighted average Weighted average Weighted
Number of exercise average Number of exercise average Range of options price remaining options price remaining exercise prices '000s $ life in years '000s $ life in years $40.00 - $49.99 - - - 3 43.15 - $60.00 - $69.99 58 66.73 1.0 58 66.73 1.9
Total 58 66.73 1.0 61 65.73 1.9
Deferred cash-based compensation plans
The Group has granted non-equity based deferred compensation awards to certain of its key employees. The plans provide for the deferral of a portion of the employees’ discretionary compensation with awards that provide a return based upon the performance of various referenced investments. Awards under these plans are generally subject to a sole vesting condition of service over time, which normally ranges from six months to three years from the date of grant. All or a portion of an award may be cancelled if employment is terminated before the end of the relevant vesting period. The awards are settled in cash at the end of the relevant vesting period.
Awards with a value of $8 million (2014: $17 million) were granted to employees during the year and an expense of $4 million (2014: $25 million) has been recognised within ‘Direct staff costs’ in ‘Other expense’ in the consolidated income statement in relation to current and previous years’ awards. The liability to employees at the end of the year, reported within ‘Accruals and deferred income’ in the consolidated statement of financial position, is $23 million (2014: $26 million).
The Group economically hedges the exposure created by these deferred compensation schemes by entering into derivative transactions with other Morgan Stanley Group undertakings. The derivative balance at the end of the year recognised within ‘Financial liabilities classified as held for trading’ is $3 million (2014: $3 million). The related loss recorded within ‘Net gains on financial instruments classified as held for trading’ for the year is $nil (2014: $nil).
Plans operated by fellow Morgan Stanley undertakings
As described in note 7, the Group utilises staff employed by other Morgan Stanley Group undertakings and incurs management charges in respect of these employee services. These management charges include the costs of equity-based compensation provided to these employees.
36. POST EMPLOYMENT BENEFITS
Defined contribution plans
The Group operates several Morgan Stanley defined contribution plans, which require contributions to be made to funds held in trust, separate from the assets of the Group.
The defined contribution plans are as follows:
• Morgan Stanley Flexible Company Pension Plan (Amsterdam);
• MSII Offshore Retirement Benefit Plan IV, Dubai Section;
• Morgan Stanley Asia Limited Retirement Benefit Plan (Taiwan); and
• Morgan Stanley & Co International plc Seoul Branch Defined Contribution Plan.
MORGAN STANLEY & CO. INTERNATIONAL plc NOTES TO THE CONSOLIDATED FINANCIAL STATEMENTS Year ended 31 December 2015
109
36. POST EMPLOYMENT BENEFITS (CONTINUED)
Defined contribution plans (continued)
The defined contribution pension charge in relation to the above schemes recognised within ‘Staff costs’ in ‘Other expense’ in the consolidated income statement was $3 million for the year (2014: $3 million) of which $nil was accrued at 31 December 2015 (2014: $nil).
Defined benefit plans
The Group also operates several Morgan Stanley defined benefit plans, which provide post-employment benefits that are based on length of service and salary. The Group’s policy is to fund at least the amounts sufficient to meet minimum funding requirements under applicable employee benefit and tax regulations.
The defined benefits plans are as follows:
• Morgan Stanley & Co International plc Paris Branch IFC (Indemnites de Fin de Carriere);
• Morgan Stanley France (SAS) Leaving Indemnity Plan (Indemnites de Fin de Carriere);
• Morgan Stanley Asia (Taiwan) Limited Retirement Scheme;
• Morgan Stanley Asia (Taiwan) Limited Book Reserve Plan;
• Morgan Stanley & Co International plc Zurich Branch Base and Top-up Plan (formerly Personalvorsorgestiftung der Bank Morgan Stanley AG Plan). During the year the obligations and assets of the Personalvorsorgestiftung der Bank Morgan Stanley AG Plan were fully transferred to two new plans which provide substantially the same benefits as the former plan; and
• Morgan Stanley Dubai End of Service Gratuity.
The defined benefit pension charge in relation to the above plans recognised in ‘Staff costs’ in ‘Other expense’ in the consolidated income statement was $2 million for the year (2014: $2 million). The cumulative amount of actuarial gains and losses recognised in other comprehensive income is a $2 million gain (2014: $3 million gain). A net liability of $6 million (2014: $5 million) is recognised in the Group’s consolidated statement of financial position in respect of these plans.
Plans operated by fellow Morgan Stanley undertakings
In addition to the above, along with a number of other Morgan Stanley Group companies, the Group incurs management charges from a fellow Morgan Stanley undertaking, Morgan Stanley UK Limited (‘MSUK’), in respect of MSUK’s employees’ services. These management recharges include pension costs related to the Morgan Stanley UK Group Pension Plan (‘the Plan’). The Plan is a defined contribution scheme with a closed defined benefit section.
Defined contribution scheme
The management recharge for the year in respect of the defined contribution scheme recognised within ‘Management charges from other Morgan Stanley Group undertakings relating to staff costs’ in ‘Other expense’ was $54 million (2014: $58 million).
Defined benefit section
The defined benefit section of the Plan has been closed to new members since 1996. The Plan was previously open to permanent employees employed in the UK, and with the consent of the Trustees, other Morgan Stanley employees located outside the UK who had previously been employed in the UK and who at some point had been members of the Plan. The amount of pension benefit that a member is entitled to receive on retirement is dependent on years of service and salary at the time of closure of the Plan in 1996.
The Plan assets are held in a separate Trustee-administered fund to meet long-term pension liabilities. The Trustees of the fund are required to act in the best interests of the fund’s beneficiaries. The appointment of Trustees to the Plan is determined by the Plan’s trust documentation. MSUK has a policy that one third of Trustees should be nominated by members of the fund.
MORGAN STANLEY & CO. INTERNATIONAL plc NOTES TO THE CONSOLIDATED FINANCIAL STATEMENTS Year ended 31 December 2015
110
36. POST EMPLOYMENT BENEFITS (CONTINUED)
Plans operated by fellow Morgan Stanley undertakings (continued)
Defined benefit section (continued)
A full actuarial valuation of the defined benefit section of the Plan is conducted at least every three to four years. The most recent full actuarial valuation of the Plan was carried out during 2013 with a valuation date as at 31 December 2012.
The full actuarial valuation provides a funding basis for the Plan. The funding basis varies from the valuation for accounting purposes as it is determined using assumptions reflective of the cost of securing the benefits built up in the Plan with an insurance company. The position is reviewed each year as part of the annual funding update.
There is no contractual arrangement for recharging the net defined benefit cost of the Plan as a whole measured in accordance with relevant accounting standards. The Group recognises its contribution payable for the period as an expense. On this basis, the management recharge for the year in respect of the defined benefit plan recognised within ‘Management charges from other Morgan Stanley Group undertakings relating to staff costs’ in ‘Other expense’ was $1 million (2014: $11 million).
The full actuarial valuation at 31 December 2012 indicated a deficit on a funding basis of $22 million. A schedule of contributions was agreed by the Trustees and MSUK on 31 October 2013 on the basis of the funding deficit. The final payment under the schedule of contributions was made in January 2015. As at 31 December 2015 no new schedule of contributions has been agreed. Future contributions may be agreed following the next valuation during 2016.
The Group’s exposure to the Plan is limited to the management recharges from MSUK in respect of the contributions paid. These recharges are recognised as an expense in the consolidated income statement.
On an accounting basis, the Plan has a surplus of assets over liabilities. The full actuarial valuation as at 31 December 2012, adjusted as appropriate for the requirements of accounting standards, was updated by a qualified actuary at 31 December 2015 to allow for changes in market conditions and actuarial assumptions. The liabilities of the Plan are measured by discounting the best estimate of future cash flows to be paid out by the Plan using the projected unit method. Under this method, each participant’s benefits under the Plan are attributed to years of service, taking into consideration the Plan’s benefit allocation formula. For the defined benefit section of the Plan, accrual of future benefits ceased in 1996 and no further benefit has been attributed to service during subsequent reporting periods. The accumulated benefit obligation is therefore an actuarial measure of the present value of benefits for service already rendered and includes no assumption for future salary increases. An assumption for revaluation in deferment is built into the valuation of the scheme. This revaluation preserves the benefits accrued and prevents the benefit diminishing over time through the effects of inflation.
The following table provides a summary of the present value of the defined benefit obligation and fair value of plan assets:
2015 2014 $millions $millions Present value of the funded defined benefit obligation (243) (264) Fair value of plan assets 325 343 Surplus of the funded defined benefit plan 82 79 Impact of asset ceiling (82) (79)
Net asset - -
The asset ceiling restricts the surplus recognised on the MSUK Statement of Financial Position to the amount that is recoverable by MSUK.
MORGAN STANLEY & CO. INTERNATIONAL plc NOTES TO THE CONSOLIDATED FINANCIAL STATEMENTS Year ended 31 December 2015
111
36. POST EMPLOYMENT BENEFITS (CONTINUED)
Plans operated by fellow Morgan Stanley undertakings (continued)
Defined benefit section (continued)
Actuarial assumptions
The following table presents the principal actuarial assumptions used in the valuation of the Plan:
2015 2014 % % Pre retirement discount rate 3.6 3.3 Post retirement discount rate 2.9 2.9 Inflation 3.1 3.1 Revaluation in deferment 2.1 2.1 The mortality assumptions used give the following life expectations: Life expectancy at age 65 for a Life expectancy at age 65 for a male member currently: female member currently: Aged 65 Aged 45 Aged 65 Aged 45 31 December 2015 UK 90.1 92.2 92.2 94.6 31 December 2014 UK 90.0 92.1 92.1 94.5
Plan assets
MSUK and the Trustees, in consultation with their independent investment consultants and actuaries, determine the asset allocation targets based on their assessment of business and financial conditions, demographic and actuarial data, funding characteristics and related risk factors. Other relevant factors, including industry practices and long-term historical and prospective capital market returns, are also considered. The overall investment objective is expected to minimise the volatility of the Plan’s surplus or deficit.
Specific risks which are managed through the asset allocation targets include:
• Interest rate and inflation risk – Plan liabilities will change in response to changes in interest rates and inflation. The policy is to hedge this risk as far as possible;
• Asset volatility – investment in asset classes such as equities gives rise to volatility in the value of the assets. The policy is to invest in asset classes which closely match the Plan’s liabilities;
• Credit risk – any default or downgrade in instruments such as corporate bonds and money market instruments may result in losses. The policy is to partially mitigate this risk by investment in a range of different credit instruments via pooled funds;
• Liquidity risk – the liquidity of investments may change over time which may have an impact on the expected transaction costs. The Trustees and MSUK have reviewed the likely cash requirements of the Plan and are satisfied that the investment arrangements provide sufficient liquidity; and
• Longevity risk – the longevity experience may differ from expectations and expectations may change over time. The purchase of annuities for pensioners mitigates a substantial portion of this risk.
MORGAN STANLEY & CO. INTERNATIONAL plc NOTES TO THE CONSOLIDATED FINANCIAL STATEMENTS Year ended 31 December 2015
112
36. POST EMPLOYMENT BENEFITS (CONTINUED)
In line with the above investment objectives, the Plan holds investments in a range of pooled investment vehicles of varying maturities intended to broadly reflect the expected liability profile of the Plan. The major categories and fair values of scheme assets at the end of the reporting period are set out below. All investments are quoted in an active market in both years.
2015 2014 $millions $millions Cash funds 88 53 Corporate bond index funds 51 56 Government bond index funds: UK Gilt index funds 83 135 GBP fixed liability matching funds 91 87 Fixed Gilts 12 12 325 343
37. RELATED PARTY DISCLOSURES
Parent and subsidiary relationships
The Group’s immediate parent undertaking is Morgan Stanley Investments (UK) which is registered in England and Wales. Copies of its financial statements can be obtained from the Registrar of Companies for England and Wales, Companies House, Crown Way, Cardiff CF14 3UZ.
The ultimate parent undertaking and controlling entity is Morgan Stanley. This is the largest group of which the Group is a member and for which group financial statements are prepared. Morgan Stanley has its registered office c/o The Corporation Trust Company, The Corporation Trust Center, 1209 Orange Street, Wilmington, DE 19801, United States of America and is incorporated in the state of Delaware, in the United States of America. Copies of its financial statements can be obtained from www.morganstanley.com/investorrelations.
Key management compensation
Key management personnel are defined as those persons having authority and responsibility for planning, directing and controlling the activities of the Group.
The Morgan Stanley Group’s corporate governance framework gives consideration to legal, geographical and business lines through a combination of boards of directors, and regional and global management committees. Accordingly, in addition to the Directors of the Company, key management personnel of the Group is considered to include the boards of directors of certain parent companies, including that of Morgan Stanley, certain members of key Morgan Stanley Group management committees, and certain executive officers of Morgan Stanley.
The boards of the Group’s parent companies, the management committees and the executive officers cover the full range of the Morgan Stanley Group’s business activities. Only those members with responsibility for the Institutional Securities business, being the only reportable business segment of the Group, are considered to be key management personnel of the Group. The aggregate compensation below represents the proportion of compensation paid to these key management personnel, including the Directors of the Company, in respect of their services to the Group.
MORGAN STANLEY & CO. INTERNATIONAL plc NOTES TO THE CONSOLIDATED FINANCIAL STATEMENTS Year ended 31 December 2015
113
37. RELATED PARTY DISCLOSURES (CONTINUED) Key management compensation (continued) Compensation paid by the Group to key management personnel in respect of their services rendered to the Group is:
2015 2014 $millions $millions Short-term employee benefits 58 50 Post-employment benefits - 1 Share-based payments 25 31 Other long-term employee benefits 13 30 Termination benefits 1 - 97 112 The share-based payment costs disclosed above reflect the amortisation of equity-based awards granted to key management personnel over the last three years and are therefore not directly aligned with other staff costs in the current year.
Directors' emoluments 2015 2014 $millions $millions Total emoluments of all Directors: Aggregate remuneration 14 16 Long term incentive schemes 6 6
20 22
Disclosures in respect of the highest paid Director: Aggregate remuneration 4 4 Long term incentive schemes 2 2
6 6
Key management personnel compensation is borne by the Group and other Morgan Stanley Group undertakings in both the current and prior years.
Directors’ remuneration has been calculated as the sum of cash, bonuses and benefits in kind.
Directors who are employees of the Morgan Stanley Group are eligible for shares and share options of the parent company, Morgan Stanley, awarded under the Morgan Stanley Group’s equity-based long term incentive schemes. In accordance with Schedule 5 paragraph 1(3)(a) of The Large and Medium-sized Companies and Groups (Accounts and Reports) Regulations 2008, the above disclosures include neither the value of shares awarded, nor the gains made on exercise of share options. During the year under these incentive schemes, no Directors exercised share options (2014: none) and six Directors received deferred stock unit awards in respect of qualifying services, including the highest paid Director (2014: seven).
The value of assets (other than shares) awarded under other long term incentive schemes has been included in the above disclosures when the awards vest, which is generally within three years from the date of the award.
There are five Directors to whom retirement benefits are accruing under a defined contribution scheme (2014: six) operated by MSUK. Two Directors have benefits accruing under a Morgan Stanley non-UK defined benefits scheme (2013: three). In addition, one Director has benefits accruing under the Alternative Retirement Plan, a defined benefit scheme, operated by MSUK (2014: none).
MORGAN STANLEY & CO. INTERNATIONAL plc NOTES TO THE CONSOLIDATED FINANCIAL STATEMENTS Year ended 31 December 2015
114
37. RELATED PARTY DISCLOSURES (CONTINUED)
Transactions with related parties
The Morgan Stanley Group conducts business for clients globally through a combination of both functional and legal entity organisational structures. Accordingly, the Group is closely integrated with the operations of the Morgan Stanley Group and enters into transactions with other Morgan Stanley Group undertakings on an arm’s length basis for the purposes of utilising financing, trading and risk management, and infrastructure services. The nature of these relationships along with information about the transactions and outstanding balances is given below. The Group has not recognised any expense and has made no provision for impairment relating to the amount of outstanding balances from related parties (2014: $nil).
Cash
The Group places cash with other Morgan Stanley Group undertakings. All such transactions are entered into on an arm’s length basis.
Amounts due from other Morgan Stanley Group undertakings - 34 - 19
Funding
The Group receives funding from and provides funding to other Morgan Stanley Group undertakings in the following forms:
• General funding
General funding is unsecured, floating rate lending. Funding may be received or provided for specific transaction related funding requirements, or for general operational purposes. The interest rates are established by the Morgan Stanley Group Treasury function for all entities within the Morgan Stanley Group and approximate the market rate of interest that the Morgan Stanley Group incurs in funding its business.
Details of the outstanding balances on these funding arrangements and the related interest income or expense recognised in the consolidated income statement during the year are shown in the table below:
Amounts due from the Group’s direct and indirect parent undertakings 7 119 4 548
Amounts due from other Morgan Stanley Group undertakings (restated) (1) 31 1,090 38 2,154
38 1,209 42 2,702
Amounts due to the Group’s direct and indirect parent undertakings 232 4,367 167 5,968
Amounts due to other Morgan Stanley Group undertakings (restated) (1) 152 6,929 346 7,902 384 11,296 513 13,870
(1) Details of the restatement are provided in note 2.
MORGAN STANLEY & CO. INTERNATIONAL plc NOTES TO THE CONSOLIDATED FINANCIAL STATEMENTS Year ended 31 December 2015
115
37. RELATED PARTY DISCLOSURES (CONTINUED)
Transactions with related parties (continued)
• Subordinated loans
The Group received a subordinated loan from another Morgan Stanley Group undertaking. Details of the terms of the loan, including the contractual maturity and the interest rate are shown in note 18. The interest rate is established by the Morgan Stanley Group Treasury function based on available market information at the time the loan is provided or subsequently amended.
Trading and risk management
In the course of funding its business, the Group enters into collateralised financing transactions with other Morgan Stanley Group undertakings. All such transactions are entered into on an arm’s length basis.
Details of the outstanding balances included in cash collateral on securities borrowed/ loaned and securities purchased/ sold under agreements to resell/ repurchase in the consolidated statement of financial position on such transactions and the related interest income or expense recognised in the consolidated income statement during the year are shown in the table below:
Amounts due from the Group’s direct and indirect parent undertakings (1) - 1 -
Amounts due from other Morgan Stanley Group undertakings (restated) (1) (148) 26,759 (62) 36,082
(149) 26,759 (61) 36,082
Amounts due to the Group’s direct and indirect parent undertakings 22 12,122 16 8,930
Amounts due to other Morgan Stanley Group Undertakings (restated) (1) 178 15,061 53 20,406
200 27,183 69 29,336
(1) Details of the restatement are provided in note 2.
The Group enters into purchases and sales of securities and derivative transactions with other Morgan Stanley Group undertakings to facilitate the provision of financial services to clients on a global basis and to manage the market risks associated with such business. The Group also enters into derivative transactions with other Morgan Stanley Group undertakings to manage the market risks associated with certain of its compensation plans. All such transactions are entered into on an arm’s length basis. The fair value of such derivatives contracts outstanding is included in financial assets/ liabilities classified as held for trading in the consolidated statement of financial position at the year end were as follows:
MORGAN STANLEY & CO. INTERNATIONAL plc NOTES TO THE CONSOLIDATED FINANCIAL STATEMENTS Year ended 31 December 2015
116
37. RELATED PARTY DISCLOSURES (CONTINUED)
Transactions with related parties (continued)
Trading and risk management (continued)
2015 2014 $millions $millions
Amounts due from the Group’s direct and indirect parent undertakings on securities and derivative transactions 2,158 4,918
Amounts due from other Morgan Stanley Group undertakings on securities and derivative transactions 49,000 63,757
51,158 68,675 2015 2014 $millions $millions
Amounts due to the Group’s direct and indirect parent undertakings on securities and derivative transactions 925 4,269
Amounts due to other Morgan Stanley Group undertakings on securities and derivative transactions 48,115 58,805
49,040 63,074
The Group has received collateral from derivative transactions of $1,764 million (2014: $nil) from the Group’s direct and indirect parent undertaking and $1,883 million (2014: $1,978 million) from other Morgan Stanley Group undertakings. The Group has pledged collateral of $20,021 million (2014: $21,272 million) to other Morgan Stanley Group undertakings to mitigate credit risk on exposures arising under derivatives contracts between the Group and other Morgan Stanley Group undertakings. The total amounts receivable and payable from such transactions are included within trade receivables and trade payables in the consolidated statement of financial position.
In addition, the management and execution of business strategies on a global basis results in many Morgan Stanley transactions impacting a number of Morgan Stanley Group entities. The Morgan Stanley Group operates a number of intra-group policies to ensure that, where possible, revenues and related costs are matched. For the year ended 31 December 2015, a net loss of $1,798 million was transferred to other Morgan Stanley Group undertakings relating to such revenue transfer pricing policies and recognised in the consolidated income statement arising from such policies (2014: net loss of $1,134 million).
MORGAN STANLEY & CO. INTERNATIONAL plc NOTES TO THE CONSOLIDATED FINANCIAL STATEMENTS Year ended 31 December 2015
117
37. RELATED PARTY DISCLOSURES (CONTINUED)
Transactions with related parties (continued)
Trading and risk management (continued)
For certain business strategies transacted by the Group, where that business strategy has incurred a loss on another Morgan Stanley Group entity, policies are in place such that losses are only transferred to the Group to the extent that the losses are offset by profits arising on the same business strategy after the loss was incurred. During 2014, this resulted in losses being incurred on other Morgan Stanley Group entities that would otherwise be transferred to the Group. These losses were transferred to the Group during 2015.
For policies for certain business strategies transacted by other Morgan Stanley Group undertakings, where that business strategy has booked positions on the Group, any losses on these positions are netted across all business strategies on each loss bearing entity and are only transferred to the relevant Morgan Stanley Group undertakings to the extent that the losses are offset by profits arising from the same population of business strategies within the other Morgan Stanley Group undertakings. For the year ended 31 December 2014 this resulted in losses being incurred by the Group that would otherwise have been transferred to other Morgan Stanley Group undertakings. These losses were transferred to other Morgan Stanley Group undertakings in 2015.
Infrastructure services
The Group receives and incurs management charges to and from other Morgan Stanley Group undertakings for infrastructure services, including the provision of staff and office facilities. Management recharges received and incurred during the year are as follows:
2015 2014
Staff costs Other
services Staff costs Other
services $millions $millions $millions $millions
Amounts recharged from the Group’s direct and indirect parent undertakings 408 319 94 303
Amounts recharged from other Morgan Stanley Group undertakings 1,208 73 2,100 367
1,616 392 2,194 670
Amounts outstanding at the reporting date related to management charges to and from other Morgan Stanley Group undertakings for infrastructure services are included within the general funding balances disclosed above.
Taxation
The Group has surrendered group relief to other members of the Morgan Stanley UK tax group for no cash consideration (see note 8).
Other related party transactions
The Group has received a guarantee from MSI, to guarantee the obligations under derivative contracts of certain fellow Morgan Stanley Group undertakings to the Company. As at 31 December 2015, no call had been made by the Group under these arrangements.
MORGAN STANLEY & CO. INTERNATIONAL plc
COMPANY FINANCIAL STATEMENTS
31 December 2015
MORGAN STANLEY & CO. INTERNATIONAL plc
COMPANY STATEMENT OF COMPREHENSIVE INCOME
Year ended 31 December 2015
118
Note 2015 2014 $millions $millions PROFIT/ (LOSS) FOR THE YEAR 3 414 (616) OTHER COMPREHENSIVE INCOME, NET OF TAX Items that will not be reclassified subsequently to profit or loss: Remeasurement of net defined benefit liability (1) 1 Items that may be reclassified subsequently to profit or loss: Currency translation reserve:
Foreign currency translation differences arising on foreign operations (32) (44)
Available-for-sale reserve: Net change in fair value of available-for-sale financial assets 10 (3) 1 Unwinding of deferred tax on net day one gains not recognised upon initial recognition of financial instruments - (2) OTHER COMPREHENSIVE INCOME AFTER INCOME TAX FOR THE YEAR (36) (44) TOTAL COMPREHENSIVE INCOME/ (LOSS) FOR THE YEAR 378 (660)
The notes on pages 121 to 158 form an integral part of the financial statements.
Balance at 1 January 2014 11,464 513 (44) 5 3 1,400 - 2,136 15,477
Loss for the year - - - - - - - (616) (616)
Other comprehensive income - - (44) 1 - - 1 (2) (44) Total comprehensive income/ (loss) - - (44) 1 - - 1 (618) (660) Transactions with owners: Issue of Additional Tier 1 capital 1,300 - - - - - - - 1,300
Balance at 31 December 2014 12,764 513 (88) 6 3 1,400 1 1,518 16,117
Profit for the year - - - - - - - 414 414
Other comprehensive income - - (32) (3) - - (1) - (36) Total comprehensive income/ (loss) - - (32) (3) - - (1) 414 378
Transactions with owners:
Issue of ordinary share capital 18 1 - - - - - - - 1
Dividends 19 - - - - - - - (12) (12)
Balance at 31 December 2015 12,765 513 (120) 3 3 1,400 - 1,920 16,484
The notes on pages 121 to 158 form an integral part of the financial statements.
MORGAN STANLEY & CO. INTERNATIONAL plc Registered number: 2068222
COMPANY STATEMENT OF FINANCIAL POSITION As at 31 December 2015
120
Note 2015 2014
$millions $millions
ASSETS Loans and receivables: Cash and short term deposits 4 11,726 11,401 Cash collateral on securities borrowed 22,369 20,610 Securities purchased under agreements to resell 58,644 58,724 Trade receivables 50,915 54,884 Other receivables 6 1,854 3,412
145,508 149,031
Financial assets classified as held for trading (of which $40,579 million (2014: $43,572 million) were pledged to various parties) 7 245,124 297,284 Financial assets designated at fair value through profit or loss 9 1,636 3,360 Available-for-sale financial assets 10 35 38 Current tax assets 182 210 Deferred tax assets 16 110 70 Prepayments and accrued income 38 70 Investments in subsidiaries 11 85 85 Property, plant and equipment 12 3 2
TOTAL ASSETS 392,721 450,150
LIABILITIES AND EQUITY
Financial liabilities at amortised cost: Bank loans and overdrafts - 15 Cash collateral on securities loaned 16,347 20,604 Securities sold under agreements to repurchase 38,011 45,911 Trade payables 81,523 83,553 Subordinated loans 13 7,906 7,906 Other payables 14 12,023 14,003 155,810 171,992 Financial liabilities classified as held for trading 7 215,328 256,646 Financial liabilities designated at fair value through profit or loss 9 4,865 5,131 Provisions 15 21 43 Current tax liabilities 43 58 Deferred tax liabilities 16 1 1 Accruals and deferred income 166 160 Post employment benefit obligations 29 3 2
TOTAL EQUITY ATTRIBUTABLE TO THE OWNER OF THE COMPA NY 16,484 16,117
TOTAL LIABILITIES AND EQUITY 392,721 450,150
These financial statements were approved by the Board and authorised for issue on 21 April 2016.
Signed on behalf of the Board
C Castello Director
The notes on pages 121 to 158 form an integral part of the financial statements.
MORGAN STANLEY & CO. INTERNATIONAL plc NOTES TO THE COMPANY FINANCIAL STATEMENTS Year ended 31 December 2015
121
1. BASIS OF PREPARATION
These financial statements contain information about the Company as an individual company and do not contain consolidated financial information as the parent of a group.
Statement of compliance
The financial statements have been prepared in accordance with FRS 101 and therefore the Company has adopted the following standards issued by the Financial Reporting Council, with effect from 1 January 2015:
- FRS 100 Application of Financial Reporting Requirements (“FRS 100”) - FRS 101 (as issued in August 2014) - Amendments to FRS 101 (Reduced Disclosure Framework 2014/15 cycle review) and other minor
amendments Included within the amendments to FRS 101 above are amendments arising for consistency with company law which have been early adopted with effect from 1 January 2015.
There were no material adjustments to any period presented on adoption of FRS 101. Certain items have been reclassified in order to conform to the current year presentation.
The Company meets the definition of a qualifying entity and is a Financial Institution as defined in FRS 100. The Company has taken advantage of the following disclosure exemptions under FRS 101:
(1) The requirements of paragraphs 45(b) and 46-52 of IFRS 2 Share Based Payment; (2) The requirements of paragraphs 91-99 of IFRS 13 to the extent that they apply to assets and
liabilities other than financial instruments; (3) The requirement in paragraph 38 of IAS 1 Presentation of Financial Statements (“IAS 1”) to
present comparative information in respect of: a. Paragraph 79(a)(iv) of IAS 1 b. Paragraph 73(e) of IAS 16 Property, Plant and Equipment
(4) The requirements of paragraph 10(d), 16, 38A, 38B, 38C, 38D and 111of IAS 1; (5) The requirements of IAS 7 Statement of Cash Flows; (6) The requirements of paragraphs 30 and 31 of IAS 8 Accounting Policies, Changes in Accounting
Estimates and Errors; (7) The requirements of paragraphs 17 and 18A of IAS 24 Related Party Disclosures (“IAS 24”); (8) The requirements in IAS 24 to disclose related party transactions entered into between two or
more members of a group, provided that any subsidiary which is a party to the transaction is wholly owned by such a member; and
(9) The requirements of paragraph 6 and 21 of IFRS 1 First-time Adoption of International Financial Reporting Standards;
Where relevant, equivalent disclosures have been provided in the Group accounts in which the Company is consolidated.
New standards and interpretations adopted during the year
As noted in the Statement of compliance above, the Company has adopted FRS 101 for the first time in the current year. There were no material amendments to any period presented on adoption of FRS 101, other than the reclassification of certain items in order to conform with the current year format in the statement of financial position and related notes.
MORGAN STANLEY & CO. INTERNATIONAL plc NOTES TO THE COMPANY FINANCIAL STATEMENTS Year ended 31 December 2015
122
1. BASIS OF PREPARATION (CONTINUED)
Basis of measurement
The financial statements of the Company are prepared under the historical cost basis except for certain financial instruments that have been measured at fair value as explained in the accounting policies below.
Use of estimates and sources of uncertainty
The preparation of the Company’s financial statements requires management to make judgements, estimates and assumptions regarding the valuation of certain financial instruments, impairment of assets, deferred tax, pension obligations, the outcome of litigation, and other matters that affect the financial statements and related disclosures. The Company believes that the estimates utilised in preparing the financial statements are reasonable, relevant and reliable. Actual results could differ from these estimates.
For further details on the judgements used in determining fair value of certain assets and liabilities, see note 26.
The going concern assumption
The Company’s business activities, together with the factors likely to affect its future development, performance and position, are reflected in the Business Review section of the Strategic report on pages 1 to 14. In addition, the notes to the financial statements include the Company’s objectives, policies and processes for managing its capital; its financial risk management objectives; details of its financial instruments; and its exposures to credit risk and liquidity risk.
As set out in the Strategic report, retaining sufficient liquidity and capital to withstand market pressures remains central to the Morgan Stanley Group’s and the Company’s strategy.
Taking all of these factors into consideration, the Directors believe it is reasonable to assume that the Company will have access to adequate resources to continue in operational existence for the foreseeable future. Accordingly, they continue to adopt the going concern basis in preparing the annual report and financial statements.
2. SUMMARY OF SIGNIFICANT ACCOUNTING POLICIES
The accounting policies of the Company are the same as those of the Group which are set out in note 3 to the consolidated financial statements, except that policy 3(j) on business combinations and disposals is not applicable to the Company and investments in subsidiaries held by the company are carried at historical cost, less provision for impairment in accordance with the policy below.
(a) Investments in subsidiaries
Subsidiaries are entities over which the Company has control. The Company controls an entity when it is exposed to, or has rights to, variable returns from its involvement with the entity and has the ability to affect those returns through its power over the entity.
Investments in subsidiaries are stated at cost, less provision for any impairment (see note 2(b) below). Dividends, impairment losses and reversals of impairment losses are recognised in total profit or loss. Dividends from investments which would be classified as financial liabilities by the investee are classified as interest and recognised in total profit or loss.
(b) Impairment of subsidiaries
Impairment losses on investment in subsidiaries are measured as the difference between cost and the current estimated recoverable amount. When the recoverable amount is less than the cost, an impairment is recognised within total profit or loss and is reflected against the carrying amount of the impaired asset on the statement of financial position. Investments in subsidiaries which have suffered an impairment are reviewed for possible reversal of the impairment at the end of each reporting period.
MORGAN STANLEY & CO. INTERNATIONAL plc NOTES TO THE COMPANY FINANCIAL STATEMENTS Year ended 31 December 2015
123
3. PROFIT OR LOSS FOR THE YEAR
As permitted by section 408 of the Companies Act 2006, the Company has elected not to present its own income statement for the period. The Company reported a profit after tax of $414 million for the year ended 31 December 2015 (2014: $616 million loss after tax).
4. CASH AND SHORT TERM DEPOSITS
Included within cash and short term deposits is an amount of $9,497 million (2014: $8,384 million) which represents segregated client money, held in accordance with the FCA’s Client Money Rules, and an amount of $494 million (2014: $718 million) which represents other client money.
5. LOANS AND RECEIVABLES 2015 2014 $millions $millions Loans and receivables 145,536 149,069 Less impairment losses (28) (38)
145,508 149,031
A reconciliation of impairment losses for loans and receivables is as follows: 2015 2014 $millions $millions At 1 January 38 36 Charge for the year 17 15 Reversal of impairment losses (10) (5) Amounts written off (2) (7) Interest accrued on impaired loans and advances - (1) Reclassification of other receivables (15) -
At 31 December 28 38
During 2015 impairment losses of $15 million related to certain withholding tax reclaim balances were reclassified from loans and receivables to current tax assets. 6. OTHER RECEIVABLES 2015 2014 $millions $millions Amounts held at exchanges 592 514 Amounts due from other Morgan Stanley Group undertakings 1,188 2,805 Other amounts receivable 74 93
1,854 3,412
MORGAN STANLEY & CO. INTERNATIONAL plc NOTES TO THE COMPANY FINANCIAL STATEMENTS Year ended 31 December 2015
124
7. FINANCIAL ASSETS AND FINANCIAL LIABILITIES CLASS IFIED AS HELD FOR TRADING
2015 2014 Assets Liabilities Assets Liabilities $millions $millions $millions $millions Government debt securities 11,365 10,747 10,881 8,923 Corporate and other debt 6,965 1,281 11,248 2,215 Corporate equities 40,909 23,364 40,583 14,935 Derivatives (see note 8) 185,885 179,936 234,572 230,573
245,124 215,328 297,284 256,646
There are no terms and conditions of any financial asset or liability classified as held for trading that may individually significantly affect the amount, timing and certainty of future cash flows for the Company. 8. DERIVATIVES CLASSIFIED AS HELD FOR TRADING
A description of financial instruments designated at fair value through profit and loss is provided in note 13 of the consolidated financial statements and consists of the following:
The maximum exposure to credit risk of corporate loans which are designated at fair value through profit or loss as at 31 December 2015 is $436 million (2014: $1,296 million). The cumulative change in fair value of loans attributable to changes in credit risk amounts to $nil (2014: gain of $1 million) and the change for the current year is a loss of $1 million (2014: gain of $5 million). This change is determined as the amount of change in fair value that is not attributable to changes in market conditions that give rise to market risk.
The change in fair value recognised through the income statement attributable to own credit risk for financial liabilities designated at fair value during the year is a gain of $33 million (2014: gain of $31 million) and cumulatively is a loss of $4 million (2014: loss of $37 million). This change is determined as the amount of change in fair value that is not attributable to changes in market conditions that give rise to market risk.
The carrying amount of financial liabilities designated at fair value was $14 million lower than the contractual amount due at maturity (2014: $45 million lower).
MORGAN STANLEY & CO. INTERNATIONAL plc NOTES TO THE COMPANY FINANCIAL STATEMENTS Year ended 31 December 2015
126
10. AVAILABLE-FOR-SALE FINANCIAL ASSETS
Financial assets that are classified as available-for-sale consists of corporate equities, of which $1 million are listed investments (2014: $2 million). All other investments classified as available-for-sale financial assets are unlisted.
Movement in available-for-sale financial assets: 2015 2014 $millions $millions Fair value
At 1 January 38 56 Additions 1 - Changes in fair value recognised in the available-for-sale reserve (3) (4) Disposals and other settlements (1) (14)
At 31 December 35 38 11. INVESTMENTS IN SUBSIDIARIES
Subsidiary undertakings
$millions
Cost At 1 January 2015 1,081 At 31 December 2015 1,081 Impairment provisions At 1 January 2015 (996) At 31 December 2015 (996) Carrying amounts At 31 December 2014 85
At 31 December 2015 85
Details of all subsidiary undertakings (including indirect subsidiaries) of the Company at 31 December 2015 and 31 December 2014 are provided in the Appendix to the financial statements (see pages 159 to 161).
MORGAN STANLEY & CO. INTERNATIONAL plc NOTES TO THE COMPANY FINANCIAL STATEMENTS Year ended 31 December 2015
127
12. PROPERTY, PLANT AND EQUIPMENT Fixtures, Leasehold fittings and improvement
At 31 December 2015 13 12 25 Depreciation At 1 January 2015 13 11 24 Charge for the year 1 1 2 Foreign exchange revaluation (2) (2) (4) At 31 December 2015 12 10 22 Carrying amount At 31 December 2015 1 2 3
Morgan Stanley UK Finance I LP 31 October 2025 LIBOR(1) plus
1.475% 7,906 7,906
(1) London Interbank Offered Rate ("LIBOR")
The amount outstanding under the subordinated loan agreement is repayable at any time at the Company’s option, subject to appropriate notice to the lender and at least three months’ notice to the PRA.
The Company has not defaulted on principal, interest or made any other breaches with respect to its subordinated loan during the year.
14. OTHER PAYABLES 2015 2014 $millions $millions Amounts due to other Morgan Stanley Group undertakings 11,846 13,769 Other amounts payable 177 234
12,023 14,003
MORGAN STANLEY & CO. INTERNATIONAL plc NOTES TO THE COMPANY FINANCIAL STATEMENTS Year ended 31 December 2015
Property provisions represent the net present value of expected future costs of excess office space (net of sublease income) and the net present value of expected future costs of reinstating leasehold improvements at the end of the lease term. Lease reinstatement provisions are released when the reinstatement obligations have been fulfilled. The related asset for lease reinstatement provisions is included in ‘Leasehold improvements’ within ‘Property, plant and equipment’ (note 12).
Litigation matters and other provisions
Litigation matters and other provisions related to the Company are the same as the Group. Refer to note 20 of the consolidated financial statements for a description of these matters and provisions.
16. DEFERRED TAX Deferred taxes are calculated on all temporary differences under the liability method. The movement in the deferred tax account is as follows:
2015 2014 Deferred Deferred Deferred Deferred tax tax tax tax asset liability asset liability $millions $millions $millions $millions At 1 January 70 (1) 78 (2) Amount recognised in the income statement - Current year timing differences (24) 1 - - - Prior year timing differences 37 - (6) - Amount recognised in other comprehensive income (1) - (2) - Future tax charges on transitional accounting adjustments - - - 1 Impact of change in tax rates 28 (1) - -
At 31 December 110 (1) 70 (1)
MORGAN STANLEY & CO. INTERNATIONAL plc NOTES TO THE COMPANY FINANCIAL STATEMENTS Year ended 31 December 2015
liability $millions $millions $millions $millions Accelerated capital allowances 4 - 5 - Deferred compensation 6 - 8 - Deferred interest 95 - 54 - Other temporary differences 5 (1) 3 (1) 110 (1) 70 (1) Finance (No. 2) Act 2015 enacted reductions in the UK corporation tax rate to 19% with effect from 1 April 2017 and 18% with effect from 1 April 2020 and also introduced an 8% corporation tax surcharge on the profits of banking companies with effect from 1 January 2016. These changes to corporation tax rates impacted the deferred tax charge and closing deferred tax position for 2015.
The deferred tax assets recognised are based on management assessment that it is probable that the Company will have taxable profits against which the temporary differences can be utilised.
17. COMMITMENTS AND CONTINGENCIES
Leases
The Company has entered into non-cancellable commercial leases on premises and equipment. These leases have an average life of between one to seven years. The leases on the premises include renewal options and escalation clauses in line with general rental market conditions and rent adjustments based on price indices. The lease agreements do not contain contingent rent payment clauses or purchase options and they do not impose any restrictions on the Company’s ability to pay dividends, engage in debt financing transactions or enter into further lease agreements. Future minimum lease payments under non-cancellable operating leases as at 31 December are due as shown below. Such amounts are stated net of future minimum sub-lease receivables of $13 million (2014: $16 million). 2015 2014 $millions $millions Within one year 4 4 In the second to fifth years inclusive 13 14 After five years 4 2
21 20
MORGAN STANLEY & CO. INTERNATIONAL plc NOTES TO THE COMPANY FINANCIAL STATEMENTS Year ended 31 December 2015
130
17. COMMITMENTS AND CONTINGENCIES (CONTINUED)
Other commitments and contingent liabilities
At 31 December, the Company had the following outstanding commitments and contingent liabilities arising from off-balance sheet financial instruments: Contingent liabilities 2015 2014 $millions $millions Guarantees 982 962 Letters of credit 1 1
(1) Forward starting reverse repurchase agreements represent the value of unsettled securities purchased under agreements to resell, which have a trade date at or prior to 31 December 2015 and settle subsequent to period end.
(2) Forward starting repurchase agreements represent the value of unsettled securities under agreement to repurchase, which have a trade date at or prior to 31 December 2015 and settle subsequent to period end. 18. EQUITY
Ordinary shares of
$1 each
Ordinary shares of
£1 each
Class A ordinary shares of
$1 each
Additional Tier 1
capital
Total equity
instruments $millions $millions $millions $millions $millions Issued and fully paid up: At 1 January 2015 9,934 30 1,500 1,300 12,764 Issued in the year:
Ordinary shares of $1 each issued 1 - - - 1
At 31 December 2015 9,935 30 1,500 1,300 12,765 Voting rights as 31 December 2015 99.7% (1) 0.3% (1) Non-voting Non-voting 100%
(1) Ordinary shares are pari passu with each other regardless of currency and together carry 100% of the voting rights (2014: 100%).
Details of equity instruments and each reserve are provided in note 23 of the consolidated financial statements.
19. DIVIDENDS
On 22 January 2015, the Directors approved a coupon payment on the Additional Tier 1 capital instruments of $14,850,694 out of reserves available for distribution at 31 December 2014. The coupon was paid on 30 January 2015 and resulted in a tax benefit of $3,103,649. The payment was reflected in the Company’s financial statements for the year ended 31 December 2015 as it became due during 2015.
The Directors have not proposed the payment of a final dividend out of reserves available at 31 December 2015 (2014: $nil).
MORGAN STANLEY & CO. INTERNATIONAL plc NOTES TO THE COMPANY FINANCIAL STATEMENTS Year ended 31 December 2015
131
20. EXPECTED MATURITY OF ASSETS AND LIABILITIES
The table below shows an analysis of assets and liabilities analysed according to when they are expected to be recovered, realised or settled.
At 31 December 2015 Less than or equal to More than twelve twelve months months Total $millions $millions $millions ASSETS
Loans and receivables: Cash and short-term deposits 11,726 - 11,726 Cash collateral on securities borrowed 22,369 - 22,369 Securities purchased under agreements to resell 58,609 35 58,644 Trade receivables 50,915 - 50,915 Other receivables 1,262 592 1,854 144,881 627 145,508 Financial assets classified as held for trading 245,124 - 245,124 Financial assets designated at fair value through profit or loss 1,091 545 1,636 Available-for-sale financial assets - 35 35 Current tax assets 182 - 182 Deferred tax assets - 110 110 Prepayments and accrued income 38 - 38 Investments in subsidiaries - 85 85 Property, plant and equipment - 3 3
391,316 1,405 392,721
LIABILITIES Financial liabilities at amortised cost: Cash collateral on securities loaned 14,954 1,393 16,347 Securities sold under agreements to repurchase 34,558 3,453 38,011 Trade payables 81,523 - 81,523 Subordinated loans - 7,906 7,906 Other payables 5,005 7,018 12,023 136,040 19,770 155,810 Financial liabilities classified as held for trading 215,328 - 215,328 Financial liabilities designated at fair value through profit or loss 3,376 1,489 4,865 Provisions - 21 21 Current tax liabilities 43 - 43 Deferred tax liabilities - 1 1 Accruals and deferred income 166 - 166 Post-employment benefit obligations - 3 3 354,953 21,284 376,237
MORGAN STANLEY & CO. INTERNATIONAL plc NOTES TO THE COMPANY FINANCIAL STATEMENTS Year ended 31 December 2015
132
20. EXPECTED MATURITY OF ASSETS AND LIABILITIES (CO NTINUED)
At 31 December 2014 Less than or equal to More than twelve twelve months months Total $millions $millions $millions ASSETS Loans and receivables: Cash and short term deposits 11,401 - 11,401 Cash collateral on securities borrowed 20,610 - 20,610 Securities purchased under agreements to resell 58,724 - 58,724 Trade receivables 54,884 - 54,884 Other receivables 2,898 514 3,412 148,517 514 149,031 Financial assets classified as held for trading 297,284 - 297,284 Financial assets designated at fair value through profit or loss 2,589 771 3,360 Available-for-sale financial assets - 38 38 Current tax assets 210 - 210 Deferred tax assets - 70 70 Prepayments and accrued income 70 - 70 Investment in subsidiaries - 85 85 Property, plant and equipment - 2 2
448,670 1,480 450,150
LIABILITIES Financial liabilities at amortised cost: Bank loans and overdrafts 15 - 15 Cash collateral on securities loaned 20,604 - 20,604
Securities sold under agreements to repurchase 42,844 3,067 45,911
Trade payables 83,553 83,553
Subordinated loans - 7,906 7,906 Other payables 10,837 3,166 14,003 157,853 14,139 171,992 Financial liabilities classified as held for trading 256,646 - 256,646 Financial liabilities designated at fair value through profit or loss 3,269 1,862 5,131 Provisions - 43 43 Current tax liabilities 58 - 58
Deferred tax liabilities - 1 1
Accruals and deferred income 160 - 160 Post-employment benefit obligations - 2 2 417,986 16,047 434,033
MORGAN STANLEY & CO. INTERNATIONAL plc NOTES TO THE COMPANY FINANCIAL STATEMENTS Year ended 31 December 2015
133
21. SEGMENT REPORTING
Segment information is presented in respect to the Company’s business and geographical segments. The Company operates in the same business and geographical segments as the Group. Refer to note 27 of the consolidated financial statements for details of business and geographical segments.
Business segments
In 2015 and 2014, the Company had one reportable business segment, Institutional Securities.
Geographical segments
The Company operates in three geographical regions being, EMEA, the Americas and Asia. The following table presents total assets of the Company’s operations by geographic area.
The Company’s risk management procedures are consistent with those of the Group. This disclosure is limited to quantitative data for each risk category and should be read in conjunction with the risk management procedures detailed in note 28 of the consolidated financial statements.
Credit risk
Exposure to credit risk
The maximum exposure to credit risk (“gross credit exposure”) of the Company as at 31 December 2015 is disclosed below, based on the carrying amounts of the financial assets the Company believes are subject to credit risk.
Exposure to credit risk by class
2015 2014 Gross Net Gross Net credit Credit credit credit Credit credit
(1) The carrying amount recognised in the statement of financial position best represents the Company's maximum exposure to credit risk. (2) Of the residual net credit exposure, intercompany cross product netting arrangements are in place which would allow for an additional $2,645 million (2014: $2,756 million) to be offset in the ordinary course of business and/or in the event of default.
(3) Trade receivables primarily include cash collateral pledged against the payable on OTC derivative positions. These derivative liabilities are included within financial liabilities classified as held for trading in the statement of financial position.
(4) For contingent settlement provisions, collateral in the form of securities will be received at the point of settlement. Since the value of collateral is determined at a future date it is currently unquantifiable and not included in the table.
MORGAN STANLEY & CO. INTERNATIONAL plc NOTES TO THE COMPANY FINANCIAL STATEMENTS Year ended 31 December 2015
135
22. FINANCIAL RISK MANAGEMENT (CONTINUED)
Credit risk (continued)
Maximum exposure to credit risk by credit rating(1)
Credit rating 2015 2014 $millions $millions AAA 12,004 14,958 AA 62,579 72,499 A 202,679 246,256 BBB 52,652 54,168 BB 13,912 15,756 B 5,214 3,846 CCC 2,447 2,668 D 12 - Unrated 2,221 4,070
Total 353,720 414,221 (1) Internal credit rating derived using methodologies generally consistent with those used by external agencies
Financial assets past due but not impaired
At 31 December 2015, $1,180 million of financial assets included in trade receivables in the statement of financial position were past due but not impaired (31 December 2014: $1,005 million).
MORGAN STANLEY & CO. INTERNATIONAL plc NOTES TO THE COMPANY FINANCIAL STATEMENTS Year ended 31 December 2015
136
22. FINANCIAL RISK MANAGEMENT (CONTINUED)
Liquidity and funding risk
Maturity analysis
Equal to Equal to or more or more Equal to than 1 than 3 or more month months than 1 Equal to but less but less year but or more On Less than than 3 than 1 less than than 5 demand 1 month months year 5 years years Total 31 December 2015 $millions $millions $millions $millions $millions $millions $millions
(1)The Company enters into forward starting reverse repurchase agreements (agreements which have a trade date at or prior to 31 December 2015 and settle subsequent to period end). These agreements primarily settle within three business days and of the total amount at 31 December 2015, $18,228 million settled within three business days.
MORGAN STANLEY & CO. INTERNATIONAL plc NOTES TO THE COMPANY FINANCIAL STATEMENTS Year ended 31 December 2015
137
22. FINANCIAL RISK MANAGEMENT (CONTINUED)
Liquidity and funding risk (continued)
Maturity analysis (continued)
Equal to Equal to or more or more Equal to than 1 than 3 or more month months than 1 Equal to but less but less year but or more On Less than than 3 than 1 less than than 5 demand 1 month months year 5 years years Total 31 December 2014 $millions $millions $millions $millions $millions $millions $millions
Financial liabilities Financial liabilities at amortised cost:
(1) The Company enters into forward starting reverse repurchase agreements (agreements which have a trade date at or prior to 31 December 2014 and settle subsequent to period end). These agreements primarily settle within three business days and of the total amount at 31 December 2014, $24,333 million settled within three business days.
MORGAN STANLEY & CO. INTERNATIONAL plc NOTES TO THE COMPANY FINANCIAL STATEMENTS Year ended 31 December 2015
138
22. FINANCIAL RISK MANAGEMENT (CONTINUED)
Market risk
Sensitivity analysis
VaR for the year ended 31 December 2015 and 31 December 2014 95%/ one-day VaR for the year
ended 31 December 2015 95%/ one-day VaR for the year
ended 31 December 2014
2015 2014
Period end Average High Low Period end Average High Low
(1) Diversification benefit equals the difference between total Management VaR and the sum of the VaRs for the four risk categories. This benefit arises because the simulated one-day losses for each of the four primary market risk categories occur on different days; similar diversification benefits also are taken into account within each category.
(2) N/A - Not Applicable. The minimum and maximum VaR values for the total VaR and each of the component VaRs might have occurred on different days during the year and therefore the diversification benefit is not an applicable measure.
(3) The Credit Portfolio VaR is disclosed as a separate category from the Primary Risk Categories and includes loans that are carried at fair value and associated hedges as well as counterparty credit valuation adjustments and related hedges.
The Company’s average VaR for Primary Risk Categories for 2015 was $22 million compared with $17 million for 2014. The increase in average VaR for Primary Risk Categories is primarily due to increased exposure to interest rate and credit spread along with equity price risk.
The average Credit Portfolio VaR for 2015 was $6 million, unchanged compared with 2014.
The average total VaR for 2015 was $23 million compared with $19 million for 2014.
Non trading risks for the year ended 31 December 2015
The Company believes that sensitivity analysis is an appropriate representation of the Company’s non-trading risks. Reflected below is this analysis, which covers substantially all of the non-trading risk in the Company’s portfolio.
MORGAN STANLEY & CO. INTERNATIONAL plc NOTES TO THE COMPANY FINANCIAL STATEMENTS Year ended 31 December 2015
139
22. FINANCIAL RISK MANAGEMENT (CONTINUED)
Market risk (continued)
Interest rate risk
The Company’s VaR excludes certain funding liabilities and money market transactions. The application of a parallel shift in market interest rates of 50 basis points increase or decrease to these positions would result in a net gain or loss of approximately $1.8 million, compared to a net gain or loss of $2.7 million as at 31 December 2014.
Counterparty exposure related to own spreads
The credit spread risk relating to the Company’s own mark-to-market derivative counterparty exposure has been managed within VaR from 2015. The credit spread risk sensitivity of this exposure corresponds to an increase in value of approximately $2.7 million for each 1 basis point widening in the Company’s credit spread level as at 31 December 2014.
Funding liabilities
The credit spread risk sensitivity of the Company’s mark-to-market funding liabilities corresponds to an increase in value of approximately $0.3 million and $0.1 million for each 1 basis point widening in the Company’s credit spread level for both 31 December 2015 and 31 December 2014.
Equity investments price risk
The Company is exposed to equity price risk as a result of changes in the fair value of its investments in listed equity securities and private equities classified as available-for-sale financial assets. These investments are predominantly equity positions with long investment horizons, the majority of which are for business facilitation purposes. The market risk related to these investments is measured by estimating the potential reduction in net revenues associated with a 10% decline in asset values as shown in the table below.
31 December 2015 31 December 2014 10% sensitivity 10% sensitivity
The analysis below details the foreign currency exposure for the Company, by foreign currency, relating to the retranslation of its non-US dollar denominated branches. The analysis calculates the impact on total comprehensive income of a reasonably possible parallel shift of the foreign currency in relation to the US dollar, with all other variables held constant. This analysis does not take into account the effect of the foreign currency hedges held by other members of the Morgan Stanley Group.
MORGAN STANLEY & CO. INTERNATIONAL plc NOTES TO THE COMPANY FINANCIAL STATEMENTS Year ended 31 December 2015
140
22. FINANCIAL RISK MANAGEMENT (CONTINUED)
Currency risk (continued)
2015 2014
Foreign currency exposure
Percentage change applied
Other comprehensive
income
Foreign currency exposure
Percentage change applied
Other comprehensive
income $millions % $millions $millions % $millions
Euro 86 12% 10 103 12% 12
Polish Zloty 2 17% - 3 17% 1 South Korean Won 191 8% 15 205 8% 17
Swiss Franc 11 12% 1 9 12% 1
290 26 320 31
The reasonably possible percentage change in the currency rate in relation to US dollars has been calculated based on the greatest annual percentage change over the 5 year period from 1 January 2011 to 31 December 2015 (2014: from 1 January 2010 to 31 December 2015). Thus, the percentage change applied may not be the same percentage as the actual change in the currency rate for the year.
23. TRANSFERS OF FINANCIALS ASSETS, INCLUDING PLEDGES OF COLLATERAL
Transferred financial assets that are not derecognised in their entirety
The following table presents those financial assets which have been sold or otherwise transferred, but which for accounting purposes remain recognised in the statement of financial position. Positions presented below are shown prior to the impact of offsetting assets and liabilities of the same type, whilst the statement of financial position is presented after the impact of offsetting such positions.
2015 2014 $millions $millions Financial assets classified as held for trading Government debt securities 13,088 14,568 Corporate and other debt 1,657 5,625 Corporate equities 32,905 34,369 47,650 54,562
The carrying amount of the associated financial liabilities related to financial assets transferred that continue to be recognised is $42,047 million (2014: $45,953 million).
24. FINANCIAL ASSETS ACCEPTED AS COLLATERAL
The fair value of collateral accepted as at 31 December 2015 was $180,648 million (2014: $188,236 million). Of this amount $146,964 million (2014: $140,277 million) has been sold or repledged to third parties in connection with financing activities, or to comply with commitments under short sale transactions.
MORGAN STANLEY & CO. INTERNATIONAL plc NOTES TO THE COMPANY FINANCIAL STATEMENTS Year ended 31 December 2015
141
25. FINANCIAL ASSETS AND FINANCIAL LIABILITIES SUBJ ECT TO OFFSETTING
In the statement of financial position, financial assets and financial liabilities are only offset and presented on a net basis where there is a current legally enforceable right to set off the recognised amounts and an intention to either settle on a net basis or to realise the asset and the liability simultaneously. In the absence of such conditions, financial assets and financial liabilities are presented on a gross basis.
The following tables present information about the offsetting of financial instruments and related collateral amounts. It does not include information about financial instruments that are subject only to a collateral agreement. The effect of master netting arrangements, collateral agreements and other credit enhancements, on the Company’s exposure to credit risk is disclosed in note 22.
Amounts offset
in the statement of financial
position (2) (3)
Net amounts presented in the
statement of financial position
Amounts not offset in the statement of financial
position (4) (5)
Gross amounts (1)
Financial Cash Net exposure (6) instruments collateral
$millions $millions $millions $millions $millions $millions 31 December 2015
Assets
Loans and receivables:
Cash collateral on securities borrowed 37,077 (14,708) 22,369 (21,052)
- 1,317
Securities purchased under agreement to resell 78,218 (19,574) 58,644 (57,951)
TOTAL 310,541 (76,247) 234,294 (199,116) (22,909) 12,269
(1) Amounts include $773 million of cash collateral on securities borrowed, $450 million of securities purchased under agreements to resell, $2,787 million of financial assets classified as held for trading - derivatives, $10 million of cash collateral on securities loaned, $2,038 million of securities sold under agreements to repurchase and $2,922 million of financial liabilities classified as held for trading – derivatives which are either not subject to master netting agreements or collateral agreements or are subject to such agreements but the Company has not determined the agreements to be legally enforceable.
(2) Amounts are reported on a net basis in the statements of financial position when there is a legally enforceable master netting arrangement that provides for a current right of offset and there is an intention to either settle on a net basis or to realise the asset and liability simultaneously.
(3) Amounts include $4,351 million of cash collateral related to financial assets classified as held for trading – derivatives and $1,258 million cash collateral related to financial liabilities classified as held for trading – derivatives, recognised in amounts offset in the statement of financial positions for assets and liabilities respectively.
(4) Amounts relate to master netting arrangements and collateral arrangements which have been determined by the Company to be legally enforceable but do not meet all criteria required for net presentation within the statement of financial position.
(5) The cash collateral is recognised in the statement of financial position within trade receivables and payables respectively. (6) Of the residual net exposure, intercompany cross-product legally enforceable netting arrangements are in place which would
allow for an additional $2,645 million to be offset in the ordinary course of business and / or in the event of default.
MORGAN STANLEY & CO. INTERNATIONAL plc NOTES TO THE COMPANY FINANCIAL STATEMENTS Year ended 31 December 2015
142
25. FINANCIAL ASSETS AND FINANCIAL LIABILITIES SUBJ ECT TO OFFSETTING (CONTINUED)
Amounts offset in the statement
of financial position
(2) (3)
Net amounts presented in
the statement of financial
position
Amounts not offset in the statement of financial
position (4) (5) (6)
Gross amounts (1)
Financial Cash Net exposure (7) instruments collateral
TOTAL 397,112 (100,024) 297,088 (257,186) (23,879) 16,023
(1) Amounts include $697 million of cash collateral on securities borrowed, $1,080 million of securities purchased under agreements to resell, $4,589 million of financial assets classified as held for trading - derivatives, $60 million of cash collateral on securities loaned, $3,359 million of securities sold under agreements to repurchase and $3,942 million of financial liabilities classified as held for trading – derivatives which are either not subject to master netting agreements or collateral agreements or are subject to such agreements but the Company has not determined the agreements to be legally enforceable.
(2) Amounts are reported on a net basis in the statement of financial position when there is a legally enforceable master netting arrangement that provides for a current right of offset and there is an intention to either settle on a net basis or to realise the asset and liability simultaneously.
(3) Amounts include $9,613 million of cash collateral related to financial assets classified as held for trading – derivatives and $1,433 million of cash collateral related to financial liabilities classified as held for trading – derivatives recognised in amounts offset in the statement of financial positions for assets and liabilities respectively.
(4) Amounts relate to master netting arrangements and collateral arrangements which have been determined by the Company to be legally enforceable but do not meet all criteria required for net presentation within the statement of financial position.
(5) The cash collateral not offset is recognised in the statement of financial position within trade receivables and trade payables respectively.
(6) Certain financial assets and financial liabilities designated at fair value through profit or loss have legally enforceable master netting arrangements in place; however, these are not eligible for netting within the consolidated statement of financial position. $2 million not presented net within the statement of financial position have legally enforceable netting arrangements in place and can be offset in the ordinary course of business and/ or in the event of default.
(7) Of the residual net exposure, intercompany cross-product legally enforceable netting arrangements are in place which would allow for an additional $2,756 million to be offset in the ordinary course of business and / or in the event of default.
MORGAN STANLEY & CO. INTERNATIONAL plc NOTES TO THE COMPANY FINANCIAL STATEMENTS Year ended 31 December 2015
143
26. ASSETS AND LIABILITIES MEASURED AT FAIR VALUE
a. Financial assets and liabilities recognised at fair value on a recurring basis
The following tables present the carrying value of the Company’s financial assets and financial liabilities recognised at fair value on a recurring basis, classified according to the fair value hierarchy.
2015 Valuation Valuation Quoted techniques techniques prices in using with active observable significant market inputs unobservable
(Level 1) (Level 2) inputs
(Level 3) Total $millions $millions $millions $millions Financial assets classified as held for trading: Government debt securities 7,282 4,079 4 11,365 Corporate and other debt - 6,389 576 6,965 Corporate equities 40,445 236 228 40,909 Derivatives: Interest rate contracts - 79,317 247 79,564 Credit contracts - 9,890 268 10,158 Foreign exchange and gold contracts - 61,332 452 61,784 Equity contracts 566 27,402 1,902 29,870 Commodity contracts 8 4,495 6 4,509
Total financial assets classified as held for trading 48,301 193,140 3,683 245,124
Financial assets designated at fair value through profit or loss - 1,255 381 1,636 Available-for-sale financial assets: Corporate equities 1 - 34 35
Total financial assets measured at fair value 48,302 194,395 4,098 246,795 Financial liabilities classified as held for trading:
Total financial liabilities classified as held for trading 31,959 179,468 3,901 215,328 Financial liabilities designated at fair value through profit or loss - 4,705 160 4,865
Total financial liabilities measured at fair value 31,959 184,173 4,061 220,193
MORGAN STANLEY & CO. INTERNATIONAL plc NOTES TO THE COMPANY FINANCIAL STATEMENTS Year ended 31 December 2015
144
26. ASSETS AND LIABILITIES MEASURED AT FAIR VALUE (CONTINUED)
a. Financial assets and liabilities recognised at fair value on a recurring basis (continued)
2014 Valuation Valuation techniques Quoted techniques with prices in using significant active observable unobservable market inputs inputs (Level 1) (Level 2) (Level 3) Total $millions $millions $millions $millions Financial assets classified as held for trading: Government debt securities 7,350 3,492 39 10,881 Corporate and other debt 1 10,751 496 11,248 Corporate equities 39,785 679 119 40,583 Derivatives: Interest rate contracts 19 102,586 1,561 104,166 Credit contracts - 17,249 342 17,591 Foreign exchange and gold contracts - 68,446 313 68,759 Equity contracts 309 34,744 1,943 36,996 Commodity contracts 53 6,995 12 7,060
Total financial assets classified as held for trading 47,517 244,942 4,825 297,284
Financial assets designated at fair value through profit or loss - 2,044 1,316 3,360 Available-for-sale financial assets: Corporate equities 2 - 36 38 Total financial assets measured at fair value 47,519 246,986 6,177 300,682
Financial liabilities classified as held for trading: Government debt securities 7,094 1,829 - 8,923 Corporate and other debt - 2,209 6 2,215 Corporate equities 14,855 77 3 14,935 Derivatives: Interest rate contracts 16 99,197 1,536 100,749 Credit contracts - 17,015 348 17,363 Foreign exchange and gold contracts - 67,492 85 67,577 Equity contracts 181 36,037 2,976 39,194 Commodity contracts 55 5,575 60 5,690 Total financial liabilities classified as held for trading 22,201 229,431 5,014 256,646
Financial liabilities designated at fair value through profit or loss - 5,062 69 5,131 Total financial liabilities measured at fair value 22,201 234,493 5,083 261,777
MORGAN STANLEY & CO. INTERNATIONAL plc NOTES TO THE COMPANY FINANCIAL STATEMENTS Year ended 31 December 2015
145
26. ASSETS AND LIABILITIES MEASURED AT FAIR VALUE (CONT INUED)
a. Financial assets and liabilities recognised at fair value on a recurring basis (continued)
The Company’s valuation approach and fair value hierarchy categorisation for certain significant classes of financial instruments recognised at fair value on a recurring basis are consistent with those disclosed for the Group. Refer to note 32 of the consolidated financial statements for details.
b. Transfers between Level 1 and Level 2 of the fair value hierarchy for financial assets and liabilities recognised at fair value on a recurring basis
There were no material transfers between Level 1 and Level 2 of the fair value hierarchy during the year (2014: $nil).
c. Changes in Level 3 financial assets and liabilities recognised at fair value on a recurring basis
The following tables present the changes in the fair value of the Company’s Level 3 financial assets and financial liabilities for the years ended 31 December 2015 and 31 December 2014. Level 3 instruments may be hedged with instruments classified in Level 1 and Level 2. As a result, the realised and unrealised gains/ (losses) for assets and liabilities within the Level 3 category presented in the tables below do not reflect the related realised and unrealised gains/ (losses) on hedging instruments that have been classified by the Company within the Level 1 and/ or Level 2 categories.
Additionally, both observable and unobservable inputs may be used to determine the fair value of positions that the Company has classified within the Level 3 category. As a result, the unrealised gains/ (losses) during the period for assets and liabilities within the Level 3 category presented in the tables below may include changes in fair value during the period that were attributable to both observable (e.g., changes in market interest rates) and unobservable (e.g., changes in unobservable long-dated volatilities) inputs.
The Morgan Stanley Group operates a number of intra-group policies to ensure that, where possible, revenues and related costs are matched. Where the trading positions are included in the below table are risk managed using financial instruments held by other Morgan Stanley Group undertakings, these policies potentially result in the recognition of offsetting gains or losses in the Company.
MORGAN STANLEY & CO. INTERNATIONAL plc NOTES TO THE COMPANY FINANCIAL STATEMENTS Year ended 31 December 2015
146
26. ASSETS AND LIABILITIES MEASURED AT FAIR VALU E (CONTINUED)
c. Changes in Level 3 financial assets and liabilities recognised at fair value on a recurring basis (continued) 2015
Total financial assets classified as held for trading 654 27 - 505 (526) - (2) 150 808 25 Financial assets designated at fair value through profit or loss 1,316 (14) - 93 (737) - (263) (14) 381 (14) Available-for-sale financial assets:
Corporate equities 36 - (2) - - - - - 34 - Total financial assets measured at fair value 2,006 13 (2) 598 (1,263) - (265) 136 1,223 11
Financial liabilities classified as held for trading:
Total financial liabilities classified as held for trading 843 331 - (2,683) 108 2,667 (83) 505 1,026 180 Financial liabilities designated at fair value through profit or loss 69 2 - - - 141 (43) (5) 160 2
Total financial liabilities measured at fair value 912 333 - (2,683) 108 2,808 (126) 500 1,186 182
(1) For financial assets and financial liabilities that were transferred into and out of Level 3 during the year, gains or (losses) are presented as if the assets or liabilities had been transferred into or out of Level 3 as at the beginning of the year.
(2) Amounts represent unrealised gains or (losses) for the year ended 31 December 2015 related to assets and liabilities still outstanding at 31 December 2015. The unrealised gains or (losses) are recognised in the profit for the year and statement of comprehensive income as detailed in the financial instruments accounting policy (note 3c) of the consolidated financial statements.
(3) Net derivative contracts represent Financial assets classified as held for trading – derivative contracts net of Financial liabilities classified as held for trading – derivative contracts.
MORGAN STANLEY & CO. INTERNATIONAL plc NOTES TO THE COMPANY FINANCIAL STATEMENTS Year ended 31 December 2015
147
26. ASSETS AND LIABILITIES MEASURED AT FAIR VALU E (CONTINUED)
c. Changes in Level 3 financial assets and liabilities recognised at fair value on a recurring basis (continued)
Corporate and other debt 714 27 - 262 (315) - (209) 17 496 (1)
Corporate equities 68 19 - 65 (72) - - 39 119 (2)
Total financial assets classified as held for trading 790 47 - 364 (394) - (209) 56 654 (3) Financial assets designated at fair value through profit or loss 1,598 (12) - 935 - - (1,333) 128 1,316 (11) Available-for-sale financial assets:
Corporate equities 54 - (5) - (13) - - - 36 - Total financial assets measured at fair value 2,442 35 (5) 1,299 (407) - (1,542) 184 2,006 (14)
Financial liabilities classified as held for trading:
Corporate and other debt 47 (11) - (23) 11 - - (40) 6 (2)
Corporate equities 7 2 - (55) 51 - - 2 3 2
Net derivatives contracts (3)
(4) 530 (22) - (1,029) - 946 395 (30) 834 (4)
Total financial liabilities classified as held for trading 584 (31) - (1,107) 62 946 395 (68) 843 (4) Financial liabilities designated at fair value through profit or loss 258 - - - - 69 (247) (11) 69 1
Total financial liabilities measured at fair value 842 (31) - (1,107) 62 1,015 148 (79) 912 (3)
(1) For financial assets and financial liabilities that were transferred into and out of Level 3 during the year, gains or (losses) are presented as if the assets or liabilities had been transferred into or out of Level 3 as at the beginning of the year.
(2) Amounts represent unrealised gains or (losses) for the year ended 31 December 2014 related to assets and liabilities still outstanding at 31 December 2014. The unrealised gains or (losses) are recognised in the loss for the year and statement of comprehensive income as detailed in the financial instruments accounting policy (note 3c) of the consolidated financial statements.
(3) Net derivative contracts represent Financial assets classified as held for trading – derivative contracts net of Financial liabilities classified as held for trading – derivative contracts.
(4) During the year, the Company incurred a charge of approximately $273 million related to the implementation of FVA, which was recognised within total loss for the year.
MORGAN STANLEY & CO. INTERNATIONAL plc NOTES TO THE COMPANY FINANCIAL STATEMENTS Year ended 31 December 2015
148
26. ASSETS AND LIABILITIES MEASURED AT FAIR VALUE (CONT INUED)
d. Valuation of Level 3 financial assets and liabilities recognised at fair value on a recurring basis
The disclosures below provide information on the sensitivity of fair value measurements to key inputs and assumptions.
i. Quantitative information about and qualitative sensitivity of significant unobservable inputs
The table below provides information on the valuation techniques, significant unobservable inputs and their ranges and averages for each major category of assets and liabilities measured at fair value on a recurring basis with a significant Level 3 balance.
The level of aggregation and breadth of products cause the range of inputs to be wide and not evenly distributed across the inventory. Further, the range of unobservable inputs may differ across firms in the financial services industry because of diversity in the types of products included in each firm’s inventory. The following disclosures also include qualitative information on the sensitivity of the fair value measurements to changes in the significant unobservable inputs.
31 December 2015
Fair value $millions
Valuation technique
Significant unobservable input(s) / sensitivity of the fair
value to changes in the unobservable inputs Range (2) Averages (3)
Financial liabilities designated at fair value through profit or loss - Issued structured notes (147) Option Model At the money volatility / (C)/(D) 26% to 38% 31%
Volatility skew / (C)/(D) -1% to 0% 0%
Equity correlation / (C)/(D) 42% to 97% 67%
Equity FX correlation / (A)/(D) -54% to -6% -44%
(1) Net derivative contracts represent financial assets classified as held for trading – derivative contracts net of financial liabilities classified as held for trading – derivative contracts. In addition, there are other derivative contracts with a fair value of $nil (2014: $7 million) not included within one of the major derivative categories.
(2) The ranges of significant unobservable inputs are represented in points, percentages or basis points. Points are a percentage of par; for example, 100 points would be 100% of par. A basis point (bps) equals 1/100th of 1%; for example, 353 basis points would equal 3.53%.
(3) Amounts represent weighted averages except where simple averages and the median of the inputs are provided (see footnote 5 below). Weighted averages are calculated by weighting each input by the fair value of the respective financial instruments except for derivative instruments where inputs are weighted by risk.
(4) CVA and FVA are included in the fair value, but excluded from the valuation techniques and significant unobservable inputs in the table above. CVA is deemed to be a Level 3 input when the underlying counterparty credit curve is unobservable. FVA is deemed to be a Level 3 input in its entirety given the lack of observability of funding spreads in the principal market.
(5) The data structure of the significant unobservable inputs used in valuing Interest rate contracts and certain Equity contracts may be in a multi-dimensional form, such as a curve or surface, with risk distributed across the structure. Therefore, a simple average and median, together with the range of data inputs, may be more appropriate measurements than a single point weighted average.
(6) Includes derivative contracts with multiple risks (i.e. hybrid products).
Sensitivity of the fair value to changes in the unobservable inputs: (A) Significant increase/ (decrease) in the unobservable input in isolation would result in a significantly higher/ (lower) fair value measurement.
(B) Significant changes in credit correlation may result in a significantly higher or lower fair value measurement. Increasing/ (decreasing)
correlation drives a redistribution of risk within the capital structure such that junior tranches become less/ (more) risky and senior tranches
become more/ (less) risky.
(C) Significant increase/ (decrease) in the unobservable input in isolation would result in a significantly lower/ (higher) fair value measurement.
(D) There are no predictable relationships between the significant unobservable inputs.
31 December 2015
Fair value $millions Valuation technique
Significant unobservable inputs / sensitivity of the fair value to changes in the unobservable
inputs
Range (2)
Averages (3)
LIABILITIES (CONTINUED)
Financial liabilities classified as held for trading (continued):
- Net derivatives contracts (continued):(1)(4) - Interest rate (682) Option Model Inflation Volatility / (C)/(D) 58% 58%, 58%
Financial liabilities classified as held for trading:
- Net derivatives contracts:(1)(4)
- Credit (6) Correlation Model Credit correlation / (B) 46% to 88% 61%
Comparable pricing Comparable bond price / (C)(D) 2 to 99 points 40 points - Equity (1,033) Option Model At the money volatility / (C)(D) 15% to 50% 29%
Volatility skew / (C)(D) -4% to 1% -1%
Equity correlation / (C)(D) 30% to 99% 70%
Equity Foreign exchange correlation / (C)(D)
-40% to 10% -16%
MORGAN STANLEY & CO. INTERNATIONAL plc NOTES TO THE COMPANY FINANCIAL STATEMENTS Year ended 31 December 2015
151
26. ASSETS AND LIABILITIES MEASURED AT FAIR VALUE (CONTINUED)
d. Valuation of Level 3 financial assets and liabilities recognised at fair value on a recurring basis (continued)
i. Quantitative information about and qualitative sensitivity of significant unobservable inputs (continued) 31 December 2014
Fair value $millions
Valuation technique
Significant unobservable inputs / sensitivity of the fair value to changes
in the unobservable inputs
Range (2)
Averages (3) LIABILITIES (CONTINUED)
Financial liabilities classified as held for trading (continued):
- Net derivatives contracts (continued):(1)(4)
- Interest rate 25 Option Model Inflation volatility / (A)(D) 69% to 71% 70%, 71%
(1) Net derivative contracts represent financial assets classified as held for trading – derivative contracts net of financial liabilities classified as held for trading – derivative contracts. In addition, there are other derivative contracts with a fair value of $7 million not included within one of the major derivative categories.
(2) The ranges of significant unobservable inputs are represented in points, percentages or basis points. Points are a percentage of par; for example, 100 points would be 100% of par. A basis point (bps) equals 1/100th of 1%; for example, 353 basis points would equal 3.53%.
(3) Amounts represent weighted averages except where simple averages and the median of the inputs are provided (see footnote 5 below). Weighted averages are calculated by weighting each input by the fair value of the respective financial instruments except for derivative instruments where inputs are weighted by risk.
(4) CVA and FVA are included in the fair value, but excluded from the valuation techniques and significant unobservable inputs in the table above. CVA is deemed to be a Level 3 input when the underlying counterparty credit curve is unobservable. FVA is deemed to be a Level 3 input in its entirety given the lack of observability of funding spreads in the principal market.
(5) The data structure of the significant unobservable inputs used in valuing Interest rate contracts and certain Equity contracts may be in a multi-dimensional form, such as a curve or surface, with risk distributed across the structure. Therefore, a simple average and median, together with the range of data inputs, may be more appropriate measurements than a single point weighted average.
(6) Includes derivative contracts with multiple risks (i.e. hybrid products)
Sensitivity of the fair value to changes in the unobservable inputs:
(A) Significant increase/ (decrease) in the unobservable input in isolation would result in a significantly higher/ (lower) fair value measurement.
(B) Significant changes in credit correlation may result in a significantly higher or lower fair value measurement. Increasing/ (decreasing)
correlation drives a redistribution of risk within the capital structure such that junior tranches become less/ (more) risky and senior tranches
become more/ (less) risky.
(C) Significant increase/ (decrease) in the unobservable input in isolation would result in a significantly lower/ (higher) fair value measurement.
(D) There are no predictable relationships between the significant unobservable inputs.
MORGAN STANLEY & CO. INTERNATIONAL plc NOTES TO THE COMPANY FINANCIAL STATEMENTS Year ended 31 December 2015
152
26. ASSETS AND LIABILITIES MEASURED AT FAIR VALUE (CONT INUED)
d. Valuation of Level 3 financial assets and liabilities recognised at fair value on a recurring basis (continued)
A description of significant unobservable inputs included in the table above for all major categories of assets and liabilities is included within note 32 of the consolidated financial statements.
ii. Sensitivity of fair values to changing significant assumptions to reasonably possible alternatives
All financial instruments are valued in accordance with the techniques outlined in the fair value hierarchy. Some of these techniques, including those used to value instruments categorised in Level 3 of the fair value hierarchy, are dependent on unobservable parameters and the fair value for these financial instruments has been determined using parameters appropriate for the valuation methodology based on prevailing market evidence. It is recognised that the unobservable parameters could have a range of reasonably possible alternative values.
In estimating the change in fair value, to provide information about the variability of the fair value measurement, the unobservable parameters were varied to the extremes of the ranges of reasonably possible alternatives using statistical techniques, such as dispersion in comparable observable external inputs for similar asset classes, historic data or judgement if a statistical technique is not appropriate. Where a financial instrument has more than one unobservable parameter, the sensitivity analysis reflects the greatest reasonably possible increase or decrease to fair value by varying the assumptions individually. It is unlikely that all unobservable parameters would be concurrently at the extreme range of possible alternative assumptions and therefore the sensitivity shown below is likely to be greater than the actual uncertainty relating to the financial instruments.
The following tables present the sensitivity of the fair value of Level 3 financial assets and financial liabilities to reasonably possible alternative assumptions, providing quantitative information on the potential variability of the fair value measurement.
MORGAN STANLEY & CO. INTERNATIONAL plc NOTES TO THE COMPANY FINANCIAL STATEMENTS Year ended 31 December 2015
153
26. ASSETS AND LIABILITIES MEASURED AT FAIR VALUE (CONT INUED)
d. Valuation of Level 3 financial assets and liabilities recognised at fair value on a recurring basis (continued)
ii. Sensitivity of fair values to changing significant assumptions to reasonably possible alternatives (continued)
Effect of reasonably possible
alternative assumptions 2015
Fair value Increase in fair
value Decrease in fair
value $millions $millions $millions Financial assets classified as held for trading: Government debt securities 4 - - Corporate and other debt 576 19 (35) Corporate equities 228 2 (41)
Financial assets designated at fair value through profit or loss: Prepaid OTC contracts 93 3 (3) Customer loans 288 1 - Available-for-sale financial assets: Corporate equities 34 8 (2) Financial liabilities classified as held for trading: Corporate and other debt 5 - - Corporate equities 15 - - Net derivatives contracts:(1)(2) 1,006 37 (52)
Financial liabilities designated at fair value through profit or loss: Prepaid OTC contracts 13 - - Issued structured notes 147 2 (2) (1) Net derivative contracts represent financial assets classified as held for trading – derivative contracts net of financial liabilities classified as held for trading – derivative contracts.
(2) CVA and FVA are included in the fair value, but excluded from the effect of reasonably possible alternative assumptions in the table above. CVA is deemed to be a Level 3 input when the underlying counterparty credit curve is unobservable. FVA is deemed to be a Level 3 input in its entirety given the lack of observability of funding spreads in the principal market.
MORGAN STANLEY & CO. INTERNATIONAL plc NOTES TO THE COMPANY FINANCIAL STATEMENTS Year ended 31 December 2015
154
26. ASSETS AND LIABILITIES MEASURED AT FAIR VALUE (CONT INUED)
d. Valuation of Level 3 financial assets and liabilities recognised at fair value on a recurring basis (continued)
ii. Sensitivity of fair values to changing significant assumptions to reasonably possible alternatives (continued)
Effect of reasonably possible
alternative assumptions 2014
Fair value Increase in fair
value Decrease in fair
value $millions $millions $millions Financial assets classified as held for trading: Government debt securities 39 - - Corporate and other debt 496 19 (16) Corporate equities 119 2 (9) Financial assets designated at fair value through profit or loss: Prepaid OTC contracts 20 - - Customer loans 1,296 2 (3) Available-for-sale financial assets: Corporate equities 36 8 (2) Financial liabilities classified as held for trading: Corporate and other debt 6 - - Corporate equities 3 - - Net derivatives contracts (1) (2) 834 152 (163) Financial liabilities designated at fair value through profit or loss: Prepaid OTC contracts 52 2 (1) Other 17 - - (1) Net derivative contracts represent financial assets classified as held for trading – derivative contracts net of financial liabilities classified as held for trading – derivative contracts. (2) CVA and FVA are included in the fair value, but excluded from the effect of reasonably possible alternative assumptions in the table above. CVA is deemed to be a Level 3 input when the underlying counterparty credit curve is unobservable. FVA is deemed to be a Level 3 input in its entirety given the lack of observability of funding spreads in the principal market.
MORGAN STANLEY & CO. INTERNATIONAL plc NOTES TO THE COMPANY FINANCIAL STATEMENTS Year ended 31 December 2015
155
26. ASSETS AND LIABILITIES MEASURED AT FAIR VALUE (CONT INUED)
e. Financial instruments valued using unobservable market data
The amounts not recognised in the income statement relating to the difference between the fair value at initial recognition (the transaction price) and the amounts determined at initial recognition using valuation techniques are as follows:
2015 2014 $millions $millions At 1 January 234 351 New transactions 43 26 Amounts recognised in the income statement during the year (61) (143)
At 31 December 216 234
The statement of financial position categories ‘Financial assets and financial liabilities classified as held for trading’, ‘Financial assets and financial liabilities designated at fair value through profit or loss’ and ‘Available-for-sale financial assets’ include financial instruments whose fair value is based on valuation techniques using unobservable market data. The balance above predominately relates to derivative contracts.
f. Assets and liabilities measured at fair value on a non-recurring basis
Non-recurring fair value measurements of assets and liabilities are those which are required or permitted in the statement of financial position in particular circumstances. There were no assets or liabilities measured at fair value on a non-recurring basis during the year or prior year.
27. ASSETS AND LIABILITIES NOT MEASURED AT FAIR VAL UE
The tables below present the carrying value, fair value and fair value hierarchy category of certain financial assets and financial liabilities that are not measured at fair value in the statement of financial position.
Financial assets and financial liabilities not measured at fair value for which the carrying value is considered a reasonable approximation of fair value are excluded from the tables below.
Fair value measurements using: Valuation Valuation techniques Quoted techniques with prices in using significant active observable unobservable Carrying market inputs inputs value Fair value (Level 1) (Level 2) (Level 3) $millions $millions $millions $millions $millions 2015 Financial liabilities Other payables 6,814 6,566 - 6,566 - 2014 Financial liabilities Subordinated loans 7,906 8,064 - 8,064 -Other payables 3,166 2,845 - 2,845 -
Also included in the statement of financial position is $5,210 million of other payables where the carrying value is a reasonable approximation of fair value (2014: $10,837 million). Refer to note 33 of the consolidated financial statements for further information related to the fair value of other payables and subordinated loans.
MORGAN STANLEY & CO. INTERNATIONAL plc NOTES TO THE COMPANY FINANCIAL STATEMENTS Year ended 31 December 2015
156
28. CAPITAL MANAGEMENT
The Company views capital as an important source of financial strength. Capital management procedures of the Company are consistent with those of the Group as detailed in note 34 of the consolidated financial statements.
The capital managed by the Company broadly includes share capital, Additional Tier 1 capital instruments, subordinated loans and reserves, as outlined below:
Morgan Stanley maintains various deferred compensation plans for the benefit of its employees. The two principal forms of deferred compensation are granted under equity-settled share-based compensation and deferred cash based compensation plans.
Equity-settled share-based compensation plans
• Restricted stock units Morgan Stanley has granted restricted stock unit awards pursuant to several equity-based compensation plans. The plans provide for the deferral of a portion of certain employees’ incentive compensation with awards made in the form of restricted common stock or in the right to receive unrestricted shares of common stock in the future. Awards under these plans are generally subject to vesting over time contingent upon continued employment and to restrictions on sale, transfer or assignment until the end of a specified period, generally one to three years from the date of grant. All or a portion of an award may be cancelled if employment is terminated before the end of the relevant restriction period. All or a portion of a vested award also may be cancelled in certain limited situations, including termination for cause during the relevant restriction period. Recipients of stock-based awards may have voting rights, at the Morgan Stanley Group’s discretion, and generally receive dividend equivalents.
During the year, Morgan Stanley granted 224,563 units (2014: 297,951 units) of restricted stock units to employees of the Company with a weighted average fair value per unit of $34.60 (2014: $32.57), based on the market value of Morgan Stanley shares at grant date.
An expense of $8 million (2014: $9 million) was incurred through the Company’s total profit for the year in relation to restricted stock units equity based compensation plans, granted to employees of the Company.
• Stock options
Morgan Stanley has also granted stock option awards pursuant to several equity-based compensation plans. The plans provide for the deferral of a portion of certain key employees’ incentive compensation with awards made in the form of stock options generally having an exercise price not less than the fair value of Morgan Stanley’s common stock on the date of grant. Such stock option awards generally become exercisable over a three year period and expire five to ten years from the date of grant, subject to accelerated expiration upon termination of employment. Stock option awards have vesting, restriction and cancellation provisions that are generally similar to those in restricted stock units.
There we no stock options granted during the year (2014: none) and no amount (2014: $nil) was incurred in the Company’s profit for the year in relation to stock option equity based compensation plans, granted to employees of the Company. There were no options exercised during the year (2014: none).
MORGAN STANLEY & CO. INTERNATIONAL plc NOTES TO THE COMPANY FINANCIAL STATEMENTS Year ended 31 December 2015
The following table shows activity relating to the Morgan Stanley stock option awards for employees of the Company:
2015 2014
Number of options
Weighted average exercise
price Number of
options
Weighted average exercise
price ‘000 $ ‘000 $
Options outstanding at 1 January 22 63.93 42 55.88 Expired during the year (3) 43.15 (20) 47.19 Options outstanding and exercisable at 31 December 19 66.73 22 63.93 The following table presents information relating to the stock options outstanding: 2015 2014 Weighted Weighted average Weighted average Weighted
Number of exercise average Number of exercise average Range of options price remaining options price remaining exercise prices '000s $ life in years '000s $ life in years $40.00 - $49.99 - - - 3 43.15 - $60.00 - $69.99 19 66.73 1.0 19 66.73 2.0 Total 19 66.73 1.0 22 63.93 1.7
Deferred cash-based compensation plans
The Company has granted non-equity based deferred compensation awards to certain of its key employees. The plans provide for the deferral of a portion of the employees’ discretionary compensation with awards that provide a return based upon the performance of various referenced investments. Awards under these plans are generally subject to a sole vesting condition of service over time, which normally ranges from six months to three years from the date of grant. All or a portion of an award may be cancelled if employment is terminated before the end of the relevant vesting period. The awards are settled in cash at the end of the relevant vesting period.
Awards with a value of $4 million (2014: $10 million) have been granted to employees during the year and an expense of $2 million (2014: $14 million) has been recognised in total profit for the year in relation to current and previous years’ awards. The liability to employees at the end of the year, reported within ‘Accruals and deferred income’ in the statement of financial position, is $13 million (2014: $12 million).
The Company economically hedges the exposure created by these deferred compensation schemes by entering into derivative transactions with other Morgan Stanley Group undertakings. The derivative balance at the end of the year recognised within ‘Financial assets classified as held for trading’ in relation to these deferred compensation schemes is $nil (2014: $nil) and recognised within ‘Financial liabilities classified as held for trading’ is $2 million (2014: $2 million). The related profit recorded within total profit for the year is $nil (2014: $nil).
MORGAN STANLEY & CO. INTERNATIONAL plc NOTES TO THE COMPANY FINANCIAL STATEMENTS Year ended 31 December 2015
158
30. POST-EMPLOYMENT BENEFITS
Defined contribution plans
The Company operates three Morgan Stanley defined contribution plans, which require contributions to be made to funds held separately from the assets of the Company, under the control of a trustee.
The defined contribution plans are as follows:
• Morgan Stanley Flexible Company Pension Plan (Amsterdam); • MSII Offshore Retirement Benefit Plan IV, Dubai Section; and • Morgan Stanley & Co International plc Seoul Branch Defined Contribution Plan.
The Company pays fixed contributions to the funds, with no legal or constructive obligation to pay further contributions.
The defined contribution pension charge recognised in total profit was $2 million for the year (2014: $3 million) of which $nil was accrued at 31 December 2015 (2014: $nil).
Defined benefit plans
The Company also operates defined benefit plans, which provide pension benefits that are based on length of service and salary. The Company’s policy is to fund at least the amounts sufficient to meet minimum funding requirements under applicable employee benefit and tax regulations.
The defined benefit plans are as follows:
• Morgan Stanley & Co International plc Paris Branch IFC (Indemnites de Fin de Carriere); • Morgan Stanley & Co International plc Zurich Branch Base and Top-up Plan (formerly
Personalvorsorgestiftung der Bank Morgan Stanley AG Plan). During the year the obligations and assets of the Personalvorsorgestiftung der Bank Morgan Stanley AG Plan were fully transferred to two new plans which provide substantially the same benefits as the former plan; and
• Morgan Stanley Dubai End of Service Gratuity.
A net liability of $3 million (2014: $2 million) is recognised in the statement of financial position in respect of these plans.
31. PARENT UNDERTAKINGS
Refer to note 37 of the consolidated financial statements for information on the Company’s immediate and ultimate parent undertaking.
The parent undertaking of the smallest group of companies for which group financial statements are drawn up and of which the Company is a member is Morgan Stanley & Co. International plc, which is registered in England and Wales. Copies of its financial statements can be obtained from the Registrar of Companies for England and Wales, Companies House, Crown Way, Cardiff CF14 3UZ.
MORGAN STANLEY & CO. INTERNATIONAL plc
APPENDIX TO THE FINANCIAL STATEMENTS Year ended 31 December 2015
159
List of subsidiaries, including indirect subsidiaries, as at 31 December 2015 and 31 December 2014:
Proportion of shares held by the Group (1)(3)
Name of Company Address of undertaking’s registered office (2) 2015 2014 Nature of Business
Morgan Stanley (France) SAS 61 Rue De Monceau, 75008, Paris, France 100% 100% Financial Services
Morgan Stanley Taiwan Limited 14th & 22nd Floors, Taipei Metro, 207 Tun Hwa South Road, Sec. 2, Taipei, 106, Taiwan
100% 100% Financial Services
Morgan Stanley Strategic Investments Limited
100% 100% Financial Services
Morgan Stanley Turnberry Limited 100% 100% Holding company
Morgan Stanley Mallard Investments Limited
100% 100% Holding company
Morgan Stanley Montgomerie Investments Limited
100% 100% Holding company
Morgan Stanley Northcote Investments Limited
100% 100% Holding company
Morgan Stanley Silvermere Limited 100% 100% Holding company
Morgan Stanley Equity Trading (DIFC) Limited
Level 7, The Gate, Dubai International Financial Centre, Sheik Zayed Road, PO Box 506501, Dubai, United Arab Emirates
Morgan Stanley Hoxne 57/63 Line Wall Road, Gibraltar
0% 100% Holding Company
Morgan Stanley Ostburg B.V 0% 100% Financial Services
Morgan Stanley Weaver S.A.R.L 46A, Avenue J.F. Kennedy, L-1855, Luxembourg 0% 100% Financial Services
Morgan Stanley Elz Gmbh Junghofstrasse 13-15, 60311, Frankfurt am Main, Germany 0% 100% Financial Services
Morgan Stanley Propus 57/63 Line Wall Road, Gibraltar
0% 100% Financial Services
Morgan Stanley Hampstead Limited Maples Corporate Services Limited PO Box 309, Ugland House, Grand Cayman, KY1-1104 Cayman Islands
0% 100% Financial Services
(1) The proportion of voting rights held by the Group is the same as the proportion of shares held by the Group unless otherwise stated
(2) All entities have a registered address of 20 Bank Street, Canary Wharf, London, E14 4AD, United Kingdom, unless otherwise stated.
(3) All shares held in each Company are ordinary shares with the exception of Shavano Cooperative U.A where €1 C membership shares are held and Morgan Stanley Millbrae Investments B.V. where ordinary and preference shares are held.