39
Morgan Stanley Conference Robin Freestone Chief Financial Officer 19 November 2008

Morgan Stanley Conference
Robin FreestoneChief Financial Officer
19 November 2008

Forward-looking statements
Except for the historical information contained herein, the matters discussed in this presentation include forward-looking statements. In particular, all statements that express forecasts, expectations and projections with respect to future matters, including trends in results of operations, margins, growth rates, overall market trends, the impact of interest or exchange rates, the availability of financing, anticipated costs savings and synergies and the execution of Pearson's strategy, are forward looking statements. By their nature, forward looking statements involve risks and uncertainties because they relate to events and depend on circumstances that will occur in future. There are a number of factors which could cause actual results and developments to differ materially from those expressed or implied by these forward looking statements, including a number of factors outside Pearson's control. These include international, national and local conditions, as well as competition. They also include other risks detailed from time to time in the company's publicly-filed documents. Any forward looking statements speak only as of the date they are made, and Pearson gives no undertaking to update forward-looking statements to reflect any changes in its expectations with regard thereto or any changes to events, conditions or circumstances on which any such statement is based.

Agenda
Strategy & performance
Resilience
Growth

Diversified Revenue Mix
Europe 12%
US School Curriculum14%
ROW 3%Asia 8%
Europe27%
North America 62%
Revenue by Business Revenue by Geography
North AmericanEducation
41%
InternationalEducation
18%Pro
fessional 5%
Penguin
20%
FT Group
16%Assessment &
Information10%
US Higher Education
14%
Canada 3%
Advertising 5%
Content 11%
RoW 6%
UK 4%
US 10%
Testing 3%Publishing 2%
Asia 3%Americas 2%
Middle East & Africa 1%

The largest education publishing & services company
CengageLearning
HMH
McGraw-Hill
Pearson
CengageLearning
SanomaWSOY
InfinitasLearning
McGraw-Hill
Prisa
Lagardere
Pearson*5.6
2.7
2.5
1.90.3
0.4
0.4
0.7
0.8
1.6
0.2
#1 in Global education publishing & servicesLargest education publisher in the world (US$ revenue in billions, 2007)
#1 in Intl education publishing & servicesLargest education publisher ex-US(US$ revenue in billions, 2007)
Source: Pearson, Company Accounts, Analyst estimates * Pro forma to include Harcourt International
(1) Pearson excludes Government Solutions & Scanners andincludes Harcourt Assessment & International and eCollege.(2) Houghton Mifflin Harcourt (HMH) including HM Riverdeep andHarcourt US Basal & Supplemental.(3) Cengage Learning includes Houghton Mifflin Higher Education

Unique breadth of our education business
Professional testing
International Education*
CengageLearning
Higher Education
School Enterprise Software
Curriculum Software
School Assessment
School Basal & Supplemental
HMHMcGraw-
HillPearsonMarket share
* Non-US Market leader Market participant

The FT Group
Global market for Evaluated Pricing Data by Vendor (2007)
Source: Interactive Data investor day presentation
S&P9%
Interactive Data 63%
Others14%
Reuters 7%
Bear Stearns 5% Telekurs 2%
0 10 20 30
Business Week
Fortune
Forbes
WSJ
The Economist
Financial Times
US % C-Suite readership
Source: Mendelsohn Survey

Penguin
0.8
0.8
0.8
1.2
1.3
1.7
1.9
2.5
Simon & Schuster
De Agostini
Holtzbrinck
Scholastic
HarperCollins
Penguin
Lagardere
Random House
Trade publishing revenues, 2006 ($bn)
Source: Pearson, Company Accounts, Analyst estimates$ amounts converted at the average exchange rate for the year

Content +
Technology and services
International expansion
Efficiency
Business priorities

Sustained financial progress
Operating profit
55--year CAGR: 15% at constant exchange ratesyear CAGR: 15% at constant exchange rates
Margin 10.8% 10.8% 12.4% 13.4% 15.0%
£/$ 1.63 1.83 1.81 1.84 2.00

Margin improvement
Margins
£m 2007 2006 2005 2004
School 13.2% 12.6% 11.4% 9.9%
Higher Education 20.3% 20.3% 20.0% 17.7%
Professional 11.3% 9.6% 7.6% 7.9%
FT Publishing 16.3% 8.7% 6.3% 1.3%
Interactive Data 28.2% 26.8% 26.9% 24.9%
Penguin 8.7% 7.8% 7.5% 6.6%
Pearson 15.0% 13.4% 12.4% 10.8%
Reported margins

Strong cash generation
Operating cash flow
Cash Conversion 71% 98% 113% 97% 108%FCF per share (p) 40.0 52.5 71.4 72.0 85.8
55--year CAGR: 21%year CAGR: 21%

Improvement in ROIC
Return on invested capital

Cash and working capital disciplineAverage working capital/sales
Includes capitalised pre-publication costs and author advances
31.9%30.7% 30.6%
29.4%27.4% 26.3% 25.6%

Capital allocation: dividend growth
Pence per share
17.4 18.8 20.1 21.4 22.3 23.4 24.2 25.427
29.331.6
1997 1998 1999 2000 2001 2002 2003 2004 2005 2006 2007

Capital allocation: organic investment
Education pre-publication expenditure, $m
283 303 319 344 364421
2002 2003 2004 2005 2006 2007
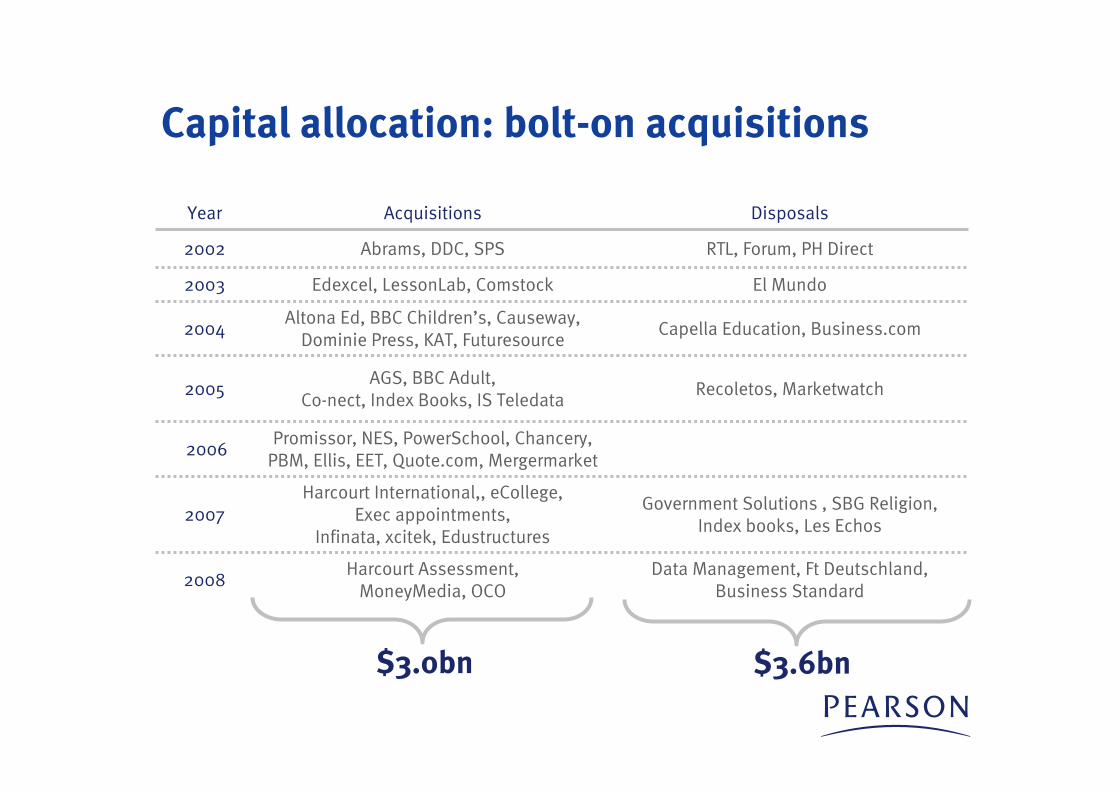
Capital allocation: bolt-on acquisitions
Government Solutions , SBG Religion, Index books, Les Echos
Harcourt International,, eCollege, Exec appointments,
Infinata, xcitek, Edustructures2007
Data Management, Ft Deutschland, Business Standard
Harcourt Assessment, MoneyMedia, OCO
2008
Promissor, NES, PowerSchool, Chancery, PBM, Ellis, EET, Quote.com, Mergermarket
2006
Year Acquisitions Disposals
2002 Abrams, DDC, SPS RTL, Forum, PH Direct
2003 Edexcel, LessonLab, Comstock El Mundo
2004Altona Ed, BBC Children’s, Causeway,
Dominie Press, KAT, FuturesourceCapella Education, Business.com
2005AGS, BBC Adult,
Co-nect, Index Books, IS TeledataRecoletos, Marketwatch
$3.0bn $3.6bn

9 month trading update
Trading in-line with expectations
Sales up 8% and operating profit up 11% at constant exchange rates
Strengthening dollar means eps likely to be towards the top of the consensus rate
“Pearson's strong performance continues. We're naturally cautious about the global economic conditions, but we have
good trading momentum, innovative products, resilient businesses and a strong balance sheet. With those advantages, we believe we are in good shape to prosper and strengthen our
company, even through these turbulent times.”

$ sensitivity
EPS 5¢ change in average rate = +/- 1p
2.00
1.99
2007
1.84
1.96
2006
1.81
1.72
2005
1.631.83Average rate
1.791.92Year end rate
20032004$:£

Resilience:Diversified Revenue Mix
Europe 12%
US School Curriculum14%
ROW 3%Asia 8%
Europe27%
North America 62%
Revenue by Business Revenue by Geography
North AmericanEducation
41%
InternationalEducation
18%Pro
fessional 5%
Penguin
20%
FT Group
16%Assessment &
Information10%
US Higher Education
14%
Canada 3%
Advertising 5%
Content 11%
RoW 6%
UK 4%
US 10%
Testing 3%Publishing 2%
Asia 3%Americas 2%
Middle East & Africa 1%

Resilience: Less exposure to advertising and tech publishing
2000 2007
£3.9bn @ £/$ 1.52 £4.2bn @ £/$ 2.00
Technology Publishing
Advertising
Other
AdvertisingTechnology Publishing
Other

Resilience: More diverse advertiser base
Growth Stable Cyclical
FT Newspaper advertising revenues 1997-2007

25%
30%
35%
40%
45%
50%
55%
60%
65%
2000 2001 2002 2003 2004 2005 2006 2007
Resilience: More diverse revenue base
Advertising revenues
Digital revenues

Resilience: Sustained growth in US educationYear-on-year US publishing industry sales growth
Sources: Pearson, AAP
Higher Education School
01 03 05 079997 01 03 05 079997
New adoptions down 20%+
CAGR = 7% CAGR = 5%

Resilience: fundingEnacted State revenue changes, $bn
(10)
(5)
0
5
10
15
20
1979 1982 1985 1988 1991 1994 1997 2000 2003 2006
Fiscal 1979 to Fiscal 2008 - US$bn
Source: NASBO

Resilience: balance sheet
Net debt/EBITDA Interest cover
1.3x
3.9x
2000 2007
3.1x
7.4x
2000 2007

Resilience: balance sheetDebt maturity profile
850852
350350500
1,750
2009 2010 2011 2012 2013 2014 2015 2016 2017 2018
US$m
Source: NASBO

Growth - Education
US Unemployment Rate, % (2007) US Median Weekly Earnings, $ (2007)
0 500 1,000 1,500
< high schooldiploma
High-schoolgraduate
Some college, nodegree
Associate degree
Bachelor'sdegree
Master's degree
Professionaldegree
Doctoral degree
Source: US Department of Labor
0 2 4 6 8
< high schooldiploma
High-schoolgraduate
Some college,no degree
Associatedegree
Bachelor'sdegree
Master'sdegree
Professionaldegree
Doctoraldegree

Global trends: Participation Number of pupils (m)
Source: UNESCO, World Bank
Primary
Secondary
Tertiary
317
50368
132
598 687
1991 2004

Global trends: Investment
Increase in public expenditure on education, 1991 - 2005 (1991=100)
118152 153 169
214253
320
547
UnitedStates
UnitedArab
Emirates
SouthKorea
Poland
Source: World Bank

Technology & Services: Education
Harcourt Assessment
Worldwide School & Professional testing revenues, $m

Technology & Services: Education
MyLab registrations, m
1.4
1.8
2.2
2.9
2004 2005 2006 2007
0.20.3
0.50.7
1.3
1.9
2002 2003 2004 2005 2006 2007
eCollege enrolments, m
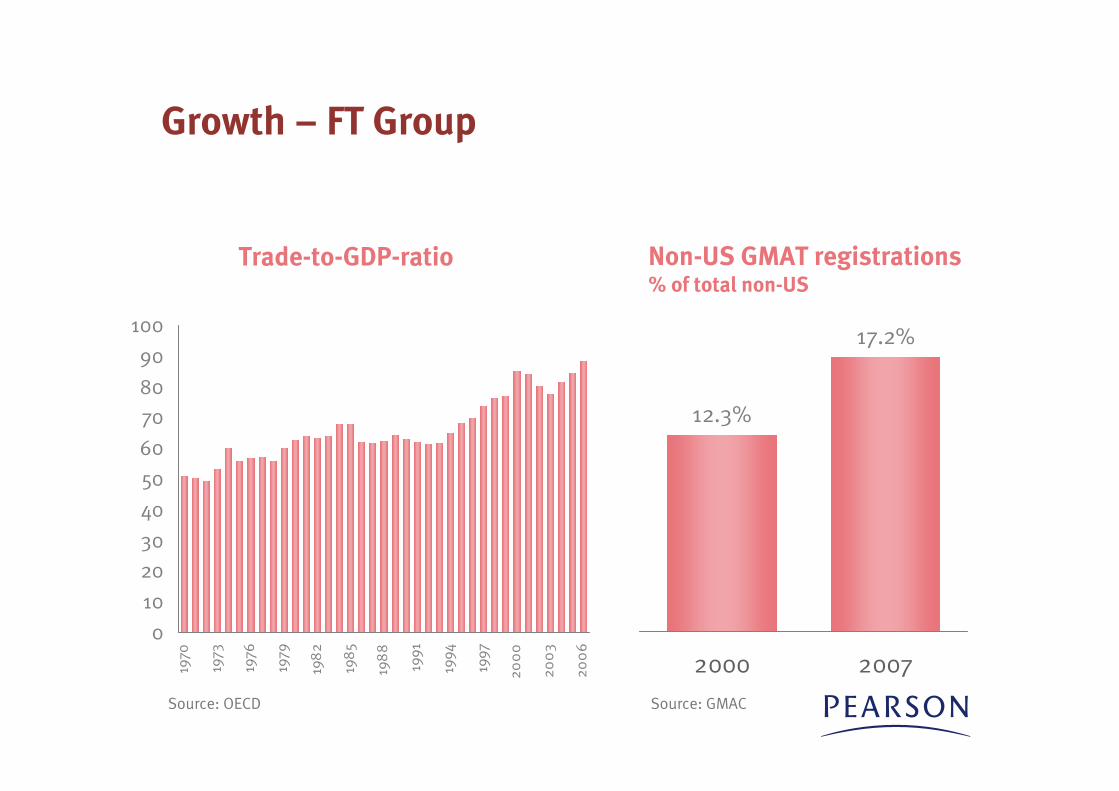
Growth – FT Group
Non-US GMAT registrations% of total non-US
17.2%
12.3%
2000 20070
10
20
30
40
50
60
70
80
90
100
1970
1973
1976
1979
198
2
198
5
198
8
1991
1994
1997
200
0
200
3
200
6
Trade-to-GDP-ratio
Source: OECD Source: GMAC

1997 2007
329,000
541,000
UK
Europe
FT.comAsia
International growth opportunities: FT Group
US
Sources: Audit Bureau of Circulation, Interactive Data
Europe
North America
Interactive Data sales by geography
Asia
Financial Times circulationby geography

Growth - Penguin
25.122.5
18.916.415.6
2000 2010 2020 2030 2040
% UK population aged 65+ years old
Source: US Census Bureau

International growth opportunities: Penguin
Rising literacy in IndiaPopulation (m); Literacy rate (%)
Rising book retail space in India Sq ft (top 3 book stores)
Sources: Ministry of Home Affairs, Office of the Registrar General
Source: Pearson

Technology & services: PenguinE-book units sold by month (US)
Jan-04 Jan-05 Jan-06 Jan-07 Jan-08
Amazon Kindle launched

Conclusions
Strong market positions
Clear strategy; strong record of performance
Resilient; strong financial position
Good long-term growth markets

Morgan Stanley Conference


