22
Morningstar Guide to Investing How we can help you achieve your financial goals
Morningstar Guide to InvestingHow we can help you achieve your financial goals
Page 9 | How we can help you achieve your financial goals Page 10 | Discover new investments Page 15 | How to evaluate investments Page 19 | Track and monitor your investments
© 2018 Morningstar, Inc. All rights reserved. Neither Morningstar, its affiliates, nor the content providers guarantee the data or content contained herein to be accurate, complete or timely nor will they have any liability for its use or distribution. Any general advice or ‘class service’ have been prepared by Morningstar Australasia Pty Ltd (ABN: 95 090 665 544, AFSL: 240892) and/or Morningstar Research Ltd, subsidiaries of Morningstar, Inc, without reference to your objectives, financial situation or needs. Refer to our Financial Services Guide (FSG) for more information at www.morningstar.com.au/s/fsg.pdf. You should consider the advice in light of these matters and if applicable, the relevant Product Disclosure Statement before making any decision to invest. Our publications, ratings and products should be viewed as an additional investment resource, not as your sole source of information. Past performance does not necessarily indicate a financial product’s future performance. To obtain advice tailored to your situation, contact a professional financial adviser. Some material is copyright and published under licence from ASX Operations Pty Ltd ACN 004 523 782.
Page 3 | Investing product overview
This guide is intended to serve as an introduction to Morningstar, a description of our investment philosophy, definitions of some key investing concepts and a guide on how to use our website.
While we have made this guide publicly available, many of the links point to Premium content on our website. Those links can be accessed by becoming a Morningstar Premium member. If you’re already a Premium member, please log in.
Non-Premium members can sign-up for a free 4-week trial.

3
Investing product overview
Now that you have learned some of the foundational concepts of investing, you are ready to continue your journey towards becoming a Morningstar investor.
Morningstar provides independent, fundamental analysis of a wide range of investments including equities, managed funds, ETFs, and LICs. We have a dedicated team of over 30 equity, credit, and manager research analysts in Sydney covering the local market and a global team of 270 analysts. Worldwide we cover 1,600 stocks, 700 debt issuers, and 4,380 funds and ETFs.
We have provided a brief description of each asset class and described our research methodology and where to access our research.

4
Buying an equity gives you partial ownership of a company. As a partial owner, you have a share of any assets owned by the company, earnings generated by selling products, as well as any liabilities the company may have. If you owned Apple stock before they invented the iPhone, you benefited from the resulting success of the product. At the same time, if you invest in a company that performs poorly or is adversely impacted by global trends or events, you share in the downside. In the case of the company you own going out of business, this can result in a complete loss of your investment.
At Morningstar, we believe buying shares of superior businesses and allowing them to compound over time is the surest way to create wealth in the stock market. The long-term fundamentals of businesses, such as cash flow, competition, economic cycles, and stewardship, are our primary focus areas because history has shown that market sentiment is fleeting, momentum can quickly reverse, and the herd is sometimes a dangerous crowd.
Our focus is on the intrinsic value of a security. Occasionally, this approach causes our recommendations to appear out of step, but willingness to be contrarian is an important source of outperformance and a benefit of Morningstar’s independence.
There are three key components that go into our fundamental analysis of equity securities:� Economic moat: The economic moat concept
is a cornerstone of Morningstar’s investment philosophy and is used to distinguish high-quality companies. An economic moat is a structural feature that allows a firm to sustain excess returns on invested capital over a long period. Without a moat, profits are more susceptible to competition. We have identified five sources of economic moats: intangible assets, switching costs, network effect, cost advantage, and efficient scale.
� Fair value estimate: Our fair value estimate is primarily based on Morningstar’s proprietary three-stage discounted cash-flow model. We’re looking well beyond next quarter to determine the cash-generating ability of a company’s assets because history has shown the market price of a security will migrate towards the firm’s intrinsic value over time.
� Uncertainty rating: The Morningstar uncertainty rating demonstrates our assessment of a firm’s cash-flow predictability, or valuation risk. From this rating, we determine appropriate margins of safety: the higher the uncertainty, the wider the margin of safety around our fair value estimate before our recommendations are triggered.
Equities
5
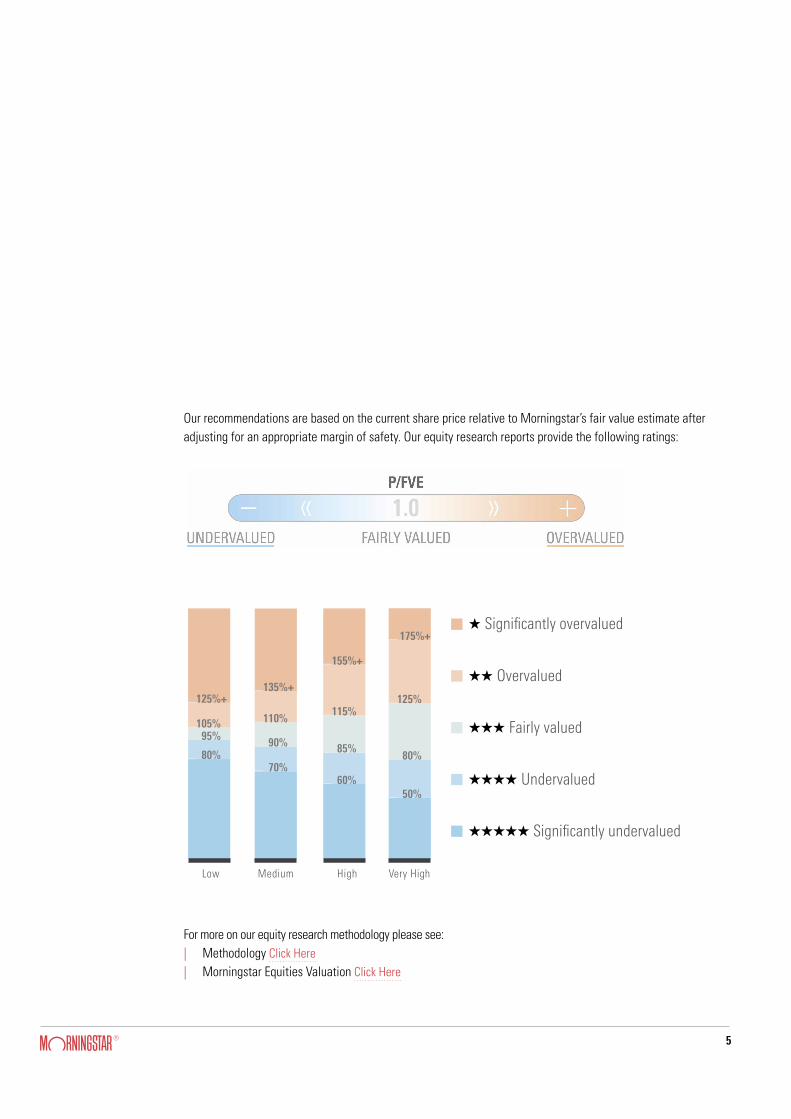
Our recommendations are based on the current share price relative to Morningstar’s fair value estimate after adjusting for an appropriate margin of safety. Our equity research reports provide the following ratings:
For more on our equity research methodology please see:| Methodology Click Here| Morningstar Equities Valuation Click Here
—
—
—
—
—
—
MediumLow
Q Significantly overvalued
QQ Overvalued
QQQ Fairly valued
QQQQ Undervalued
QQQQQ Significantly undervalued
—
—
— —
—
High
—
—
—
—
—
Very High
—
—
—
—
125%+
105%95%
80%
135%+
110%
90%
70%
155%+
115%
85%
60%
175%+
125%
80%
50%
6
Pooled investment vehicles offer a diversified portfolio, managed by a professional fund manager, in a single investment. They come in three main types: managed funds, exchange-traded funds (ETFs), and listed investment companies (LICs).
These vehicles cover various asset classes including bonds, property, and stocks. The investment strategies
Managed funds, ETFs and LICs
range from simple, low-cost, index strategies all the way to higher cost, active approaches, and also include some complex options that employ derivatives and other methods. There is a huge array of investment choices, so Morningstar offers several tools to help investors narrow down which investments may be appropriate for them, and just as importantly, which investments should be avoided or treated with caution.

7
The two most visible tools are the Morningstar Analyst Rating (qualitative) and the Morningstar Star Rating (quantitative).
The quantitative Star Rating analyses the historical performance of a fund, looking backwards. It ranks funds from one to five stars, based on past performance--both return and risk (volatility). It uses focused comparison groups to better measure fund manager skill. As always, the Morningstar Rating is intended for use as one step in the fund evaluation process. A high rating alone is not a sufficient basis for investment decisions.
The qualitative Morningstar Analyst Rating is the summary of our forward-looking view of a fund. It is the outcome of a collaborative process based on a site visit, manager questionnaire, quantitative and holdings-based analysis of the portfolio, and an assessment of key issues identified by our analysts.
Morningstar’s qualitative manager research aims to determine which investments deserve the attention of investors and which do not. Morningstar assesses investment managers based on how we believe they will perform in the future over an economic cycle, against both peers and accepted benchmarks. Our model rewards managers that are open and transparent, have a well-run investment process and, importantly, are good fiduciaries of investors’ monies.
We have identified five areas that we believe are crucial to predicting the future success of funds: People, Parent, Process, Performance, and Price. Based on our evaluation of these components, our analysts assign a Morningstar Analyst Rating to funds using a five-point scale ranging from “Gold” to “Negative”. The top three ratings of Gold, Silver, and Bronze all indicate that our analysts think highly of a fund; the difference between them corresponds to differences in the level of analyst conviction in a fund’s ability to outperform its benchmark and peers through time, within the context of the level of risk taken. The Analyst Rating does not express a view on a given asset class or peer group; rather, it seeks to evaluate each fund within the context of its objective, an appropriate benchmark, and peer group.
We publish Star ratings on ETFs and managed funds (as the returns are calculated using the same methodology) but not LICs, which have a unique methodology for calculating their performance. We publish Analyst Ratings on ETFs, managed funds, and LICs.
In essence, think of the Star Rating as a report card of past performance, the Analyst Rating as an aptitude test of its future performance.
Morningstar Analyst Rating and Morningstar Star Rating

8
Morningstar’s manager research teamMorningstar has a network of more than 110 manager research analysts located across the firm’s offices in Sydney, Chicago, London, and Hong Kong. In Sydney, our team of more than 10 manager research analysts have more than a decade of experience on average. These analysts share global insights, analysis, and investment data.
ETFsETFs share three qualities: they’re pooled investment vehicles, their shares trade on stock exchanges, and they have a daily share creation and redemption mechanism. An ETF can be thought of as a managed fund whose shares happen to trade on stock exchanges. The largest and oldest ETFs are passive investments, which merely try to replicate the behaviour of a market or market segment.
For more on our ETF research methodology please see:
| Exchange Traded Fund Methodology Click Here
Managed fundsManaged funds pool the money of individuals for investment by a professional fund manager. They are not listed on the exchange, and investors apply to invest or redeem directly with fund managers, or via investment platforms or the ASX’s mFunds service. Investments in managed funds are processed through
the creation and redemption of fund shares at the end of each trading day. Through this process the managed fund will always trade at the net asset value of the underlying assets within the fund.
For more on our manager research methodology please see:
| Manager Research Methodology Click Here
Listed investment companies (LICs)LICs are a form of managed investments that allow investors to access a diverse and professionally managed portfolio of assets which can include shares, property, and interest-bearing deposits. The fundamental difference between a LIC and a managed fund is that the LIC trades on an exchange rather than issuing and redeeming shares at the end of the trading day. This difference means LICs can trade at prices that are higher or lower than the underlying value of the assets in the portfolio.
For more on our LIC research methodology please see:
| LICs Research Methodology Click Here

9
Morningstar’s core mission is to help individual investors make better financial decisions. The following section outlines how we help investors achieve better financial outcomes. These links can be accessed by becoming a Morningstar Premium member. If you’re already a Premium member, please log in. Non-Premium members can sign-up for a free 4-week trial.
How we can help you achieve your financial goals
10
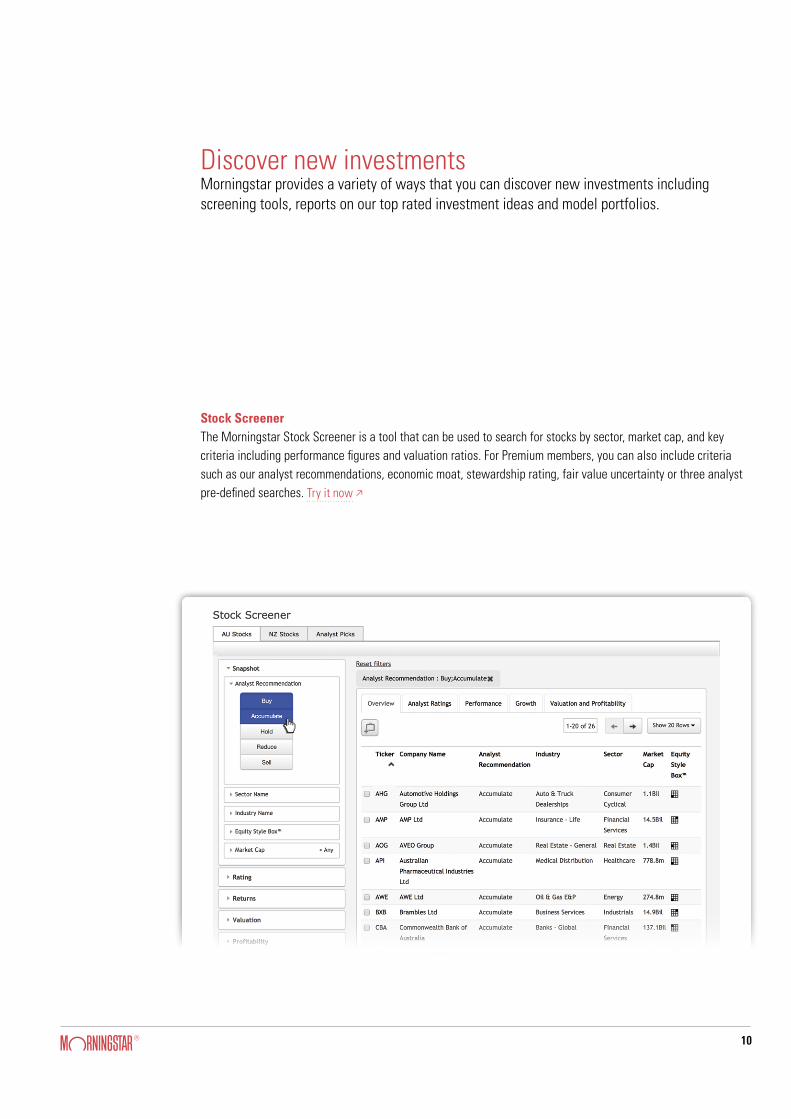
Discover new investments Morningstar provides a variety of ways that you can discover new investments including screening tools, reports on our top rated investment ideas and model portfolios.
Stock ScreenerThe Morningstar Stock Screener is a tool that can be used to search for stocks by sector, market cap, and key criteria including performance figures and valuation ratios. For Premium members, you can also include criteria such as our analyst recommendations, economic moat, stewardship rating, fair value uncertainty or three analyst pre-defined searches. Try it now w
11
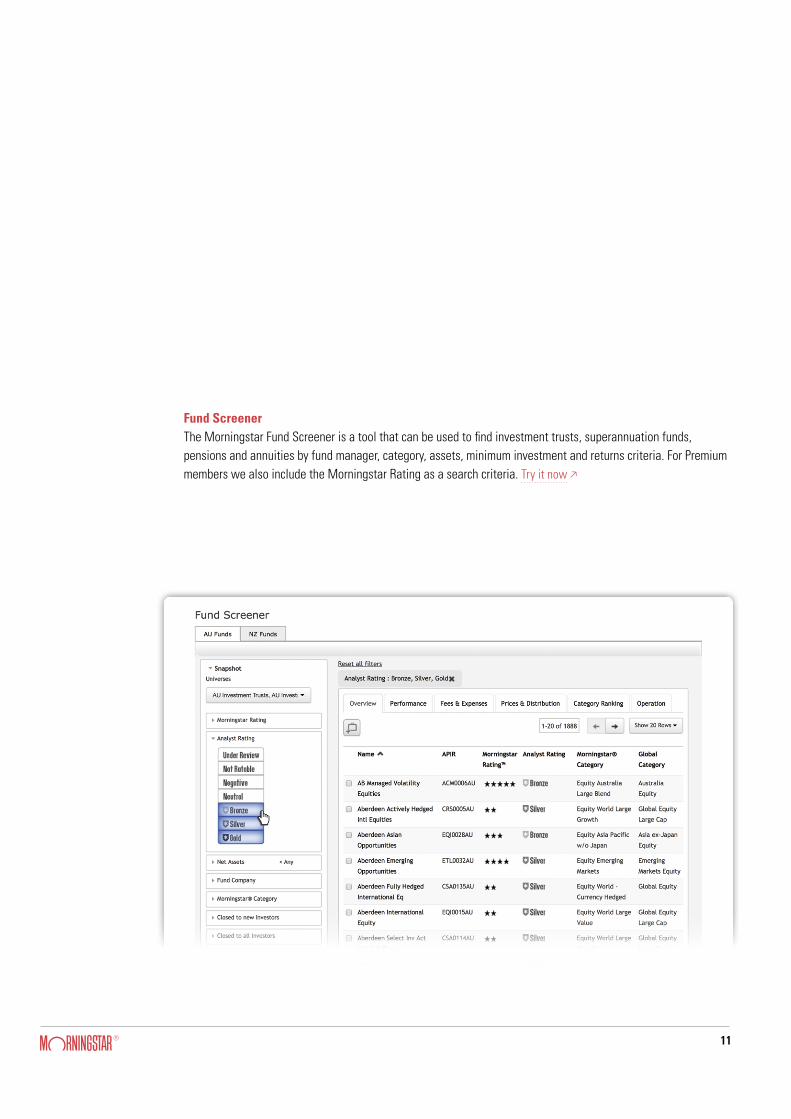
Fund ScreenerThe Morningstar Fund Screener is a tool that can be used to find investment trusts, superannuation funds, pensions and annuities by fund manager, category, assets, minimum investment and returns criteria. For Premium members we also include the Morningstar Rating as a search criteria. Try it now w
12
November 2017
Global Equity Best Ideas
Michael Holt, CFAHead of Global Equity Research
Alex Morozov, CFADirector of Equity Research, Europe
Elizabeth Collins, CFADirector of Equity Research, Americas
Lorraine Tan, CFADirector of Equity Research, Asia
Best Ideas2
Best Ideas Rationale6
Removals Rationale31
Research Methodology32
Research Disclosure34
Table of Contents
Adam Fleck, CFADirector of Equity Research, Australia
About the Best Ideas36
Interactive web-based models are available for our Best Ideas picks at Trefis . Excel-based models are available for all 1,500 companies we cover at select.morningstar.com .
Company MorningstarRating
EconomicMoat
UncertaintyRating
Discount /(Premium)
to FV
Fair ValueEstimate
RECENT ADDITIONS
Narrow Medium33%Shire PLC (SHPG) 218
Narrow Medium24%Hostess Brands Inc (TWNK) 15.3
Wide High23%Enbridge Inc (ENB) 64
Narrow Medium23%Telstra Corp Ltd (TLS) 4.6
Wide Medium19%Guidewire Software Inc (GWRE) 95
None Medium18%AVEO Group (AOG) 3.1
Wide Low17%Enterprise Products Partners LP (EPD) 30
Narrow Medium15%Vertex Pharmaceuticals Inc (VRTX) 175
Narrow High14%Crown Resorts Ltd (CWN) 13.5
Narrow Medium13%Royal Philips NV (PHIA) 40
RECENT REMOVALS
Wide Medium13%Comcast Corp (CMCSA) 42
Narrow Medium7%Contact Energy Ltd (CEN) 6.2
Wide Medium6%Microsoft Corp (MSFT) 89
Wide Medium4%Anheuser-Busch InBev SA/NV (BUD) 126
Wide Medium(2%)Emerson Electric Co (EMR) 66
Narrow High(3%)HollyFrontier Corp (HFC) 36
Data as of October 31, 2017 | UR = Under Review
© Morningstar 2017. All Rights Reserved. Unless otherwise provided in a separate agreement, you may use this report only in the country in which its original distributor is based. The information, data, analyses and opinions presented herein do not constitute investment advice; are provided solely for informational purposes and therefore are not an offer to buy or sell a security; and are not warranted to be correct, complete or accurate. The opinions expressed are as of the date written and are subject to change without notice. Except as otherwise required by law, Morningstar shall not be responsible for any trading decisions, damages or other losses resulting from, or related to, the information, data, analyses or opinions or their use. The information contained herein is the proprietary property of Morningstar and may not be reproduced, in whole or in part, or used in any manner, without the prior written consent of Morningstar. To order reprints or to license the research, please contact your local Morningstar office. Please see important disclosures at the end of this report.
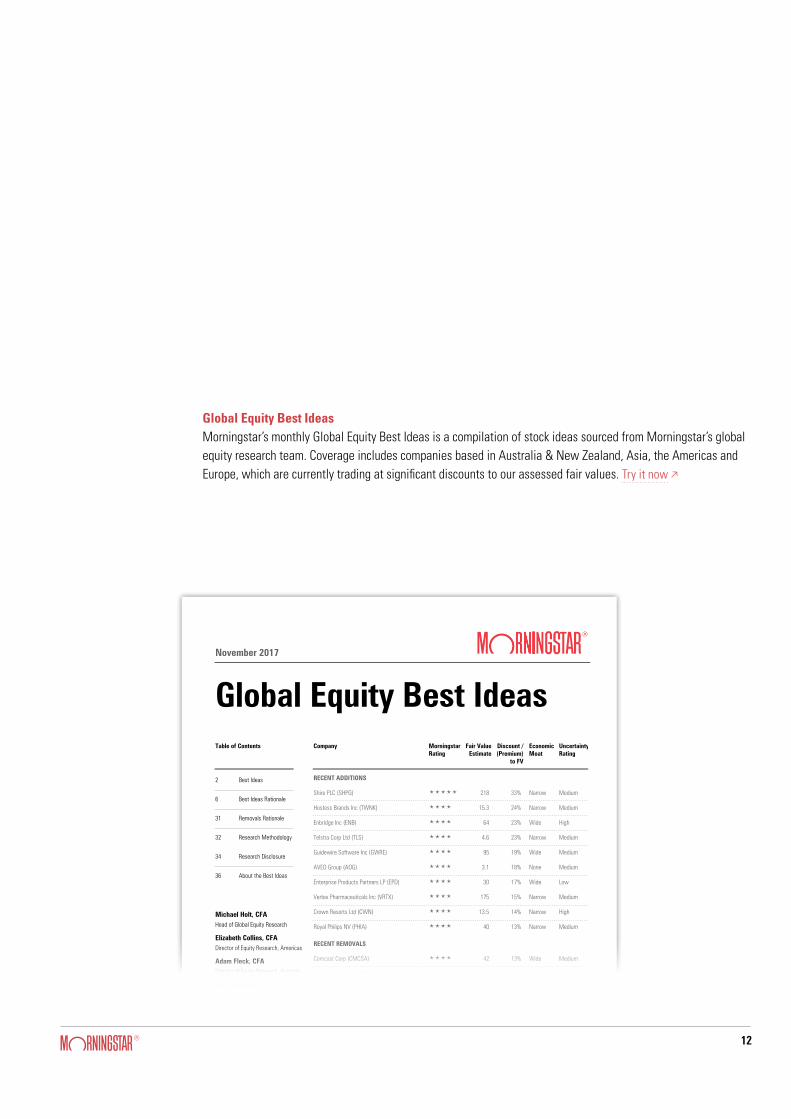
Global Equity Best IdeasMorningstar’s monthly Global Equity Best Ideas is a compilation of stock ideas sourced from Morningstar’s global equity research team. Coverage includes companies based in Australia & New Zealand, Asia, the Americas and Europe, which are currently trading at significant discounts to our assessed fair values. Try it now w

13
1 Your Money Weekly 12 October 2017 2
Portfolio Holdings Morningstar Ratings T= Shares Added Y= Shares Sold E= New Holding UR = Under Review
Stock Name % of Portfolio Morningstar Recommendation Morningstar Style Box Uncertainty Rating Moat Rating Stewardship Rating Code Fair Value ($) Price ($) Price/Fair Value EPS (c) DPS (c) Franking (%) (est) Price/Earnings (x) Forecast Div Yield (%) Market Cap ($m)
Cash Account 12.29 Medibank Private 5.88 ■ Hold È Medium Narrow Standard MPL 2.90 2.92 1.01 15.9 12.0 100.0 18.4 4.1 8,042 Sydney Airport 5.82 ■ Hold É Medium Narrow Standard SYD 6.80 7.11 1.05 17.8 38.7 0.0 40.1 5.4 16,008 Telstra 5.81 ■ Accumulate Ç Medium Narrow Standard TLS 4.60 3.49 0.76 32.7 22.0 100.0 10.7 6.3 41,508 Wesfarmers 5.19 ■ Hold È Medium Narrow Exemplary WES 39.00 41.33 1.06 253.4 223.0 100.0 16.3 5.4 46,862
Crown Resorts 4.94 ■ Hold É High Narrow Standard CWN 13.50 11.31 0.84 58.0 60.7 60.0 19.5 5.4 7,791 Vicinity Centres 4.40 ■ Hold Ç Medium Narrow Standard VCX 2.70 2.66 0.99 18.2 16.6 0.0 14.6 6.2 10,463 Platinum Asset Mngment 4.38 ■ Reduce Ë Medium Narrow Standard PTM 5.50 6.06 1.10 28.8 27.0 100.0 21.1 4.5 3,555 National Australia Bank 4.38 ■ Hold Ç Medium Wide Standard NAB 31.00 31.50 1.02 242.8 195.0 100.0 13.0 6.2 84,592 carsales.com 4.35 ■ Hold Ì Medium Narrow Standard CAR 13.00 12.83 0.99 53.1 42.0 100.0 24.2 3.3 3,105
Scentre Group 4.26 ■ Hold È Medium Narrow Standard SCG 4.00 3.93 0.98 24.8 22.2 0.0 15.8 5.6 20,924 Westpac Bank 3.86 ■ Hold Ç Medium Wide Exemplary WBC 35.00 31.92 0.91 250.5 188.0 100.0 12.7 5.9 108,348 Coca-Cola Amatil 3.83 ■ Accumulate Ê Medium Narrow Standard CCL 9.40 7.73 0.82 58.2 47.0 70.0 13.3 6.1 5,823 Commonwealth Bank 3.79 ■ Accumulate Ç Medium Wide Standard CBA 85.00 75.25 0.89 587.4 436.0 100.0 12.8 5.8 130,330 Sonic Healthcare 3.65 ■ Hold É Medium Narrow Standard SHL 24.00 20.91 0.87 127.8 89.0 20.0 16.4 4.3 8,781
AMP 3.49 ■ Hold È Medium Narrow Standard AMP 5.50 4.83 0.88 36.6 30.0 90.0 13.2 6.2 14,096 QBE Insurance Group 3.45 ■ Accumulate É High Narrow Standard QBE 13.00 10.01 0.77 94.8 58.0 30.0 10.6 5.8 13,679 Westfield 3.30 ■ Accumulate È Medium Narrow Standard WFD 8.70 7.84 0.90 48.8 33.9 0.0 16.1 4.3 16,292 Brambles 2.95 ■ Accumulate É Medium Wide Standard BXB 11.20 9.00 0.80 54.4 29.0 30.0 16.5 3.2 14,316 Virtus Health 2.81 ■ Accumulate Í High None Standard VRT 6.50 5.58 0.86 39.9 28.8 100.0 14.0 5.2 449
Spark New Zealand 2.69 ■ Hold Ê Medium Narrow Standard SPK 3.40 3.33 0.98 20.4 23.4 0.0 16.3 7.0 6,107 Woodside Petroleum 2.58 ■ Accumulate É High None Standard WPL 35.50 29.10 0.82 134.5 107.6 100.0 21.6 3.7 24,515 MYOB Group 1.91 ■ Accumulate Ì Medium Narrow Standard MYO 3.95 3.44 0.87 21.0 12.6 50.0 16.4 3.7 2,086
Grand Total 0.93 62.3 18.0 4.6
5.0
4.0
3.0
2.0
1.0
0.0
-1.0
Total Return (x)
Portfolio S&P/ASX 200 Accum. Index
09-0
1
09-0
2
09-0
3
09-0
4
09-0
5
09-0
6
09-0
7
09-0
8
09-0
9
09-1
0
09-1
1
09-1
2
09-1
3
09-1
4
09-1
5
09-1
6
09-1
7
Portfolio Returns (%)
CAGR except 1 Year and YTD PortfolioS&P/ASX 200 Accum. Index
YTD -0.99 3.86
1 Year 2.82 9.25
3 Year 6.15 7.08
5 Year 10.95 10.09
10 Year 4.47 3.09
Since Inception 11.18 7.98
y Financial Services 29.4
u Real Estate 12.0
s Consumer Defensive 9.0
Industrials 8.8
i Comm. Services 8.6
Value Core Growth
25 25 27 Larg
e
7 5 7 Med
3 0 0 Smal
l
Style Breakdown (%)Portfolio Distributions* (%)
Top Five Sectors (%)
-100
0
100
200
300
400
500
Morningstar Model Income Equity PortfolioPerformance and Allocation as at 30 September 2017
Moat Rating
Stewardship Rating
Uncertainty Rating
Price/Fair Value†
79%
9% 9%
61%30%
p Wide
p Narrow
p None
p Exemplary
p Standard
p High
p Medium
p Discount
p Fairly Valued
p Premium
■ 0–10
■ 10–25
■ 25–50
■ 51–100
* Weighted ex-cash, hence <100%.
74%
14%
67%
15%5%
What is the Morningstar Model Income Equity Portfolio? We started the Morningstar Model Income Equity Portfolio in 2001 as a model (theoretical) portfolio to demonstrate the returns potentially achievable (on the basis described below) from a concentrated portfolio of high quality income-producing shares. The target dividend yield for stocks in the model portfolio is greater than the benchmark S&P/ASX 200 Accum Index (the ‘Benchmark Index’), which is also effectively a model equities portfolio with reinvestment of dividends. The Morningstar Model Income Equity Portfolio aims to have 15–30 holdings with limited trading. Companies with narrow or wide economic moats and low or medium uncertainty feature heavily in the model because of their more predictable cash flows, more stable dividends, and generally lower share price volatility.
How do Income Portfolio stocks compare with the Benchmark Index?The Morningstar Model Income Equity Portfolio is generally invested in similar classes of equities as the (model) Benchmark Index in terms of investment objectives, types of investments, countries and markets/sectors covered. Both the model portfolio and the benchmark are therefore exposed to some normal investment risks such as foreign exchange, sector, manager and liquidity risk, but not to risks such as derivatives. As both represent equity investments,
they are likely to experience volatility common with the asset class, although it is our goal to generate less risk than the benchmark in the long-run. We have achieved this historically by focusing on high quality, undervalued, sustainable dividend yield investments, but cannot guarantee future success.
How is performance calculated?Performance for both the Morningstar Model Income Equity Portfolio and the benchmark is expressed on the following basis and assumptions so that we are comparing ‘apples with apples’: 3 before deduction of fees (ie entry, exit, performance or
management fees), costs and taxes payable by either the Portfolio/benchmark or the investor; 3 without allowing for franking credits or interest earned
on cash balances; and 3 dividends that would notionally be received are
theoretically reinvested without any tax deduction.
Where this model is offered as an investable option by third party providers, management fees of between 0.44% and 0.85% (inclusive of GST) will be charged. There may also be performance fees (ranging from 10%–15% of outperformance) charged. Third party providers may also charge their own fees which will vary between providers. K
DisclaimerPerformance results represent modelled performance only. Past performance of any investment is not a reliable indicator of future performance and the performance described here is of a theoretical model. The model performance will differ from actual performance which follows that model depending on actual fees, taxes and other factors including transaction timing and divergence from constituent weightings, rounding adjustments and minimum trade sizes.
The opinions in this report are those of the Morningstar Investment Management group and these may differ from the view of other business units of Morningstar, including Morningstar Equity Research.
Any Morningstar ratings/recommendations contained in this report are based on the full research report available at www.morningstar.com.au.
Morningstar Valuation & Fundamentals
© 2017 Morningstar, Inc. All rights reserved. Neither Morningstar, its affiliates, nor the content providers guarantee the data or content contained herein to be accurate, complete or timely nor will they have any liability for its use or distribution. Any general advice has been prepared by Morningstar Investment Management Australia Limited (ABN 54 071 808 501, AFS Licence No. 228986), a subsidiary of Morningstar, Inc, without reference to an individual investor’s objectives, financial situation or needs. You should consider the advice in light of these matters and, if applicable, the relevant disclosure document before making any decision to invest. Past performance of any investment is not a reliable indicator of future performance. To obtain advice tailored to an individual’s situation, contact a professional financial adviser. Our publications, ratings and products should be viewed as an additional investment resource, not as your sole source of information. Some material is copyright and published under licence from ASX Operations Pty Ltd ACN 004 523 782 (“ASXO”).
Morningstar’s Model Income PortfolioMorningstar’s Model Income Equity Portfolio is an actively managed concentrated portfolio consisting of stocks in the S&P/ASX 200 Index. Model holdings primarily consist of companies with greater than average sustainable net yield expectations. Try it now w
?
Morningstar Model Income Equity Portfolio Transaction Alert
Trade Summary
Action Ticker Previous
Weight % New
Weight %
Remove BWP-AU 2.287 0.000
Increase CCL-AU 2.989 4.500
Increase SCG-AU 2.546 4.500
Remove SKI-AU 3.611 0.000
Increase VCX-AU 3.467 4.500
Add WFD-AU 0.000 3.500
Remove WOW-AU 2.411 0.000
*based on prices as of June 7, 2017
Portfolio Objective
The objective of the Morningstar Model Income Equity Portfolio (Australia & New Zealand) is to provide attractive net and gross dividend yields while outperforming the S&P/ASX 200 Accumulation Index over a complete cycle. The portfolio is actively managed and concentrated, mostly consisting of companies with sustainable distributions, franking credits, and trading at discounts to intrinsic value according to our large research team. All else equal, we also strive to own companies with economic moats, as high quality companies tend to provide attractive returns with reduced volatility. Total return will generally be driven more by income than capital appreciation, although both are desirable.
Trade Analysis
We've made a few trades in the portfolio that improve its overall valuation, quality, and dividend yield, as is our constant goal. Expected return improves slightly as indicated by a greater discount to our fair value estimates, and quality improves as the share of moat and lower uncertainty companies in the portfolio increases. Net dividend yield remains steady at 4.9% and gross yield at 6.2%, both ahead of the S&P/ASX 200 index. Importantly, we believe this yield is more diversified and sustainable than the bank-dominated payout of the benchmark. Our general aim when trading is to methodically rotate from expensive to attractively priced stocks while sustaining an attractive dividend yield and being mindful of tax implications, and that's true of this update.
The total number of holdings falls to 22 from 24, as we exited three holdings (BWP Trust, Spark Infrastructure, and Woolworths) and initiated one (Westfield). We also increased our position sizes in three companies (Coca-Cola Amatil, Scentre Group, and Vicinity Centres). Taking all of this together, our cash position remains about 10% which is our maximum, indicating we still see the Australian equity market as generally on the expensive side.
Our motivation for transactions in this portfolio is always bottoms-up, fundamentally-driven analysis of individual companies. But as a check, it's instructive to consider any set of trades together and be mindful of thematics that emerge to ensure they seem sensical and more importantly don't overly expose the portfolio to concentrated risks. Probably the largest thematic of the portfolio today, at least relative to the benchmark index, is that we have no exposure to basic materials. We simply see the space as expensive and generally unfit for income. By not owning an expensive sector, the portfolio is more likely to deviate from benchmark performance, but we believe drawdown risk is reduced, a trade-off we're happy to accept.
Another theme to highlight is we've shifted some of our interest-sensitive exposure to retail property as those stocks have underperformed their office and industry property peers as well as most utility stocks. Consumers have slowed their spending, have too much debt on average, and may soon be spoilt for choice at compelling prices with the entry of Amazon. We're aware of this and agree, but we also think these challenges are at least partly reflected in share prices. Recognising headwinds is the first step, but assessing 'what's priced-in' is important too.
The rationale for each trade is provided below. Substantially more analysis on every portfolio holding is available through Morningstar Equity Research.
08062017All data and information as of June 7, 2017
Any Morningstar ratings/recommendations contained in this report are based on the full research report available at www.morningstar.com.au.
© 2017 Morningstar, Inc. All rights reserved. Neither Morningstar, its affiliates, nor the content providers guarantee the data or content contained herein to be accurate, complete or timely nor will they have any liability for its use or distribution. Any general advice has been prepared by Morningstar Investment Management Australia Limited (ABN 54 071 808 501, AFS Licence No. 228986), a subsidiary of Morningstar, Inc, without reference to an individual investor’s objectives, financial situation or needs. You should consider the advice in light of these matters and, if applicable, the relevant disclosure document before making any decision to invest. Past performance of any investment is not a reliable indicator of future performance. To obtain advice tailored to an individual’s situation, contact a professional financial adviser. Our publications, ratings and products should be viewed as an additional investment resource, not as your sole source of information. Some material is copyright and published under licence from ASX Operations Pty Ltd ACN 004 523 782 ("ASXO").

14
Time Horizon
7 Years
Objective
CPI + 3.5% paPortfolio Date: 30/06/2017
Growth/Defensive
70/30
Morningstar ETF Growth Model Portfolio
Asset Allocation%
International Equity 34.0
Australian Equity 23.0
Fixed Interest 18.0
Cash 12.0
Australian Listed Property 6.0
International Listed Property 7.0
Total 100.0
Equity Sectors (GICS)%
Energy 3.4
Materials 7.2
Industrials 5.2
Consumer Discretionary 8.4
Consumer Staples 7.8
Healthcare 6.8
Financials 20.1
Information Technology 14.6
Telecom Services 2.2
Utilities 1.6
Real Estate 22.6
Risk ProfileThis suits investors with a minimum seven-year timeframe or those who are willing to accept higher levels of investment value volatility in return for higher potential investment performance. Some capital stability is still desired, but the primary concern is a higher return, hence the 70.0 percent exposure to growth assets (shares and listed property).
OverviewThe Morningstar ETF Model Portfolios are constructed using the risk and return attributes of the Morningstar Risk Profiles. Underpinning these attributes is a set of investment objectives and time horizons that differentiate the three model portfolios across the risk/return spectrum.
Each of the Morningstar ETF Model Portfolios aims to be appropriately diversified by ETF issuer and asset class while adhering to a long-term strategic asset allocation setting. This setting has been devised using Morningstar’s strategic asset allocation framework and long-term capital market assumptions.
Since Inception Date: 30/06/2014
1Mth % 3Mth % 6Mth % 1Yr % Incp %p.a
Morningstar ETF Growth Model Portfolio
Australia Fund Multisector Growth (index) -0.57 1.00 8.85 6.153.34
-1.42 0.70 3.01 8.97 7.88
Portfolio Returns¹
ContributionTime Period: 1/04/2017 to 30/06/2017
International Equity Fixed Interest International Listed Property
Cash Australian Listed Property
Australian Equity-0.5
0.0
0.5
1.0
1.5
Contribution analysis attributes the total return of the portfolio to each asset class. It has been calculated based on NAV returns of the underlying ETFs.
Time Period: 1/07/2014 to 30/06/2017
12/2014 06/2015 12/2015 06/2016 12/2016 06/201710,000.0
10,500.0
11,000.0
11,500.0
12,000.0
12,500.0
13,000.0
Morningstar ETF Growth Model Portfolio Australia Fund Multisector Growth
Growth of $10,000 (after fees, before tax)¹
EquityStyleBox
PortfolioWeighting %
ManagementFee
3 MoTotalRet
6 MoTotalRet
1 YrTotalRet
2 YrTotalRet
(Ann)
3 YrTotalRet
(Ann)
SPDR® S&P/ASX 200 ETF
Magellan Global Equities
Vanguard MSCI Index Intl (Hdg) ETF
BetaShares Aus High Interest Cash ETF
iShares Core Composite Bond ETF
BetaShares FTSE RAFI Australia 200 ETF
SPDR® Dow Jones Global Real Estate ETF
iShares MSCI Emerging Markets ETF
Vanguard Australian Property Secs ETF
Vanguard Intl Fxd Intr Idx (Hdg) ETF
È 16.00 0.18
É 14.00 1.25
È 14.00 0.21
12.00 0.18
12.00 0.24
Ç 7.00 0.30
Ë 7.00 0.50
È 6.00 0.68
É 6.00 0.25
6.00 0.20
2.21 3.75 13.06 6.13
-2.92 1.83 20.20 7.95 7.38
-3.27 -3.08 -5.55 8.52 11.95
2.70 8.44 21.30 8.12
1.84 -3.44 -4.81 4.78 10.58
0.51 1.05 2.09 2.30 2.55
4.73 10.52 19.23 4.08 7.45
0.86 1.09 -1.30
0.93 2.16 0.02 3.35 4.03
-1.67 3.01 14.17 6.83 6.21
Holdings²
Past Performance is not a reliable indicator of future performance. Please see back page for important information on how performance is calculated.© 2017 Morningstar, Inc. All rights reserved. Neither Morningstar, its affiliates, nor the content providers guarantee the data or content contained herein to be accurate, complete or timely nor will they have any liability for its use or distribution.
Time Horizon
5 Years
Objective
CPI + 2.5% paPortfolio Date: 30/06/2017
Growth/Defensive
50/50
Morningstar ETF Balanced Model Portfolio
Asset Allocation%
Fixed Interest 30.0
International Equity 23.0
Cash 20.0
Australian Equity 16.0
Australian Listed Property 7.0
International Listed Property 4.0
Total 100.0
Equity Sectors (GICS)%
Energy 3.0
Materials 6.6
Industrials 4.9
Consumer Discretionary 8.3
Consumer Staples 7.9
Healthcare 7.2
Financials 18.4
Information Technology 14.4
Telecom Services 1.8
Utilities 1.5
Real Estate 26.1
Risk ProfileThis suits investors with a minimum five-year timeframe or those who seek both income and capital growth. This portfolio suits investors who desire a modest level of capital stability but are willing to accept moderate investment value volatility in return for commensurate potential investment performance, hence the 50.0 percent exposure to growth (shares and listed property) and 50.0 percent exposure to income (cash and fixed interest) assets.
OverviewThe Morningstar ETF Model Portfolios are constructed using the risk and return attributes of the Morningstar Risk Profiles. Underpinning these attributes is a set of investment objectives and time horizons that differentiate the three model portfolios across the risk/return spectrum.
Each of the Morningstar ETF Model Portfolios aims to be appropriately diversified by ETF issuer and asset class while adhering to a long-term strategic asset allocation setting. This setting has been devised using Morningstar’s strategic asset allocation framework and long-term capital market assumptions.
Since Inception Date: 30/06/2014
1Mth % 3Mth % 6Mth % 1Yr % Incp %p.a
Morningstar ETF Balanced Model Portfolio
Australia Fund Multisector Balanced (index) -0.50 6.750.82 2.72 5.47
-1.16 0.51 2.31 6.19 6.70
Portfolio Returns¹
ContributionTime Period: 1/04/2017 to 30/06/2017
International Equity Fixed Interest Cash International Listed Property
Australian Listed Property
Australian Equity-0.8
-0.3
0.3
0.8
Contribution analysis attributes the total return of the portfolio to each asset class. It has been calculated based on NAV returns of the underlying ETFs.
Time Period: 1/07/2014 to 30/06/2017
12/2014 06/2015 12/2015 06/2016 12/2016 06/201710,000.0
10,500.0
11,000.0
11,500.0
12,000.0
12,500.0
Morningstar ETF Balanced Model Portfolio Australia Fund Multisector Balanced
Growth of $10,000 (after fees, before tax)¹
EquityStyleBox
PortfolioWeighting %
ManagementFee
3 MoTotalRet
6 MoTotalRet
1 YrTotalRet
2 YrTotalRet
(Ann)
3 YrTotalRet
(Ann)
BetaShares Aus High Interest Cash ETF
iShares Core Composite Bond ETF
Magellan Global Equities
SPDR® S&P/ASX 200 ETF
Vanguard MSCI Index Intl (Hdg) ETF
Vanguard Australian Property Secs ETF
Vanguard Intl Fxd Intr Idx (Hdg) ETF
BetaShares FTSE RAFI Australia 200 ETF
SPDR® Dow Jones Global Real Estate ETF
Vanguard Intl Credit Secs Idx (Hdg) ETF
20.00 0.18
19.00 0.24
É 12.00 1.25
È 11.00 0.18
È 11.00 0.21
É 7.00 0.25
7.00 0.20
Ç 5.00 0.30
Ë 4.00 0.50
4.00 0.30
0.93 2.16 0.02 3.35 4.03
-1.67 3.01 14.17 6.83 6.21
1.46 2.75 2.52
0.51 1.05 2.09 2.30 2.55
2.70 8.44 21.30 8.12
0.86 1.09 -1.30
-2.92 1.83 20.20 7.95 7.38
-3.27 -3.08 -5.55 8.52 11.95
2.21 3.75 13.06 6.13
1.84 -3.44 -4.81 4.78 10.58
Holdings²
Past Performance is not a reliable indicator of future performance. Please see back page for important information on how performance is calculated.© 2017 Morningstar, Inc. All rights reserved. Neither Morningstar, its affiliates, nor the content providers guarantee the data or content contained herein to be accurate, complete or timely nor will they have any liability for its use or distribution.
Time Horizon
3 Years
Objective
CPI + 1.0% paPortfolio Date: 30/06/2017
Growth/Defensive
30/70
Morningstar ETF Moderate Model Portfolio
Asset Allocation%
Fixed Interest 40.0
Cash 30.0
International Equity 12.0
Australian Equity 9.0
Australian Listed Property 6.0
International Listed Property 3.0
Total 100.0
Equity Sectors (GICS)%
Energy 2.5
Materials 5.9
Industrials 4.7
Consumer Discretionary 7.3
Consumer Staples 6.6
Healthcare 6.8
Financials 16.5
Information Technology 12.3
Telecom Services 1.8
Utilities 1.4
Real Estate 34.1
Risk ProfileThis suits investors with a minimum three-year timeframe or those who primarily seek income with some potential for capital growth. This portfolio also suits investors seeking a low level of investment value volatility, and therefore willing to accept lower potential investment performance, hence the 70.0 percent exposure to income assets (cash and fixed interest).
OverviewThe Morningstar ETF Model Portfolios are constructed using the risk and return attributes of the Morningstar Risk Profiles. Underpinning these attributes is a set of investment objectives and time horizons that differentiate the three model portfolios across the risk/return spectrum.
Each of the Morningstar ETF Model Portfolios aims to be appropriately diversified by ETF issuer and asset class while adhering to a long-term strategic asset allocation setting. This setting has been devised using Morningstar’s strategic asset allocation framework and long-term capital market assumptions.
Since Inception Date: 30/06/2014
1Mth % 3Mth % 6Mth % 1Yr % Incp %p.a
Morningstar ETF Moderate Model Portfolio
Australia Fund Multisector Moderate (index) -0.48 0.81 2.22 3.76 4.02
-0.82 0.58 1.87 3.48 5.50
Portfolio Returns¹
ContributionTime Period: 1/04/2017 to 30/06/2017
Fixed Interest International Equity Cash International Listed Property
Australian Equity Australian Listed Property
-0.5
0.0
0.5
Contribution analysis attributes the total return of the portfolio to each asset class. It has been calculated based on NAV returns of the underlying ETFs.
Time Period: 1/07/2014 to 30/06/2017
12/2014 06/2015 12/2015 06/2016 12/2016 06/201710,000.0
10,250.0
10,500.0
10,750.0
11,000.0
11,250.0
11,500.0
11,750.0
12,000.0
Morningstar ETF Moderate Model Portfolio Australia Fund Multisector Moderate
Growth of $10,000 (after fees, before tax)¹
EquityStyleBox
PortfolioWeighting %
ManagementFee
3 MoTotalRet
6 MoTotalRet
1 YrTotalRet
2 YrTotalRet
(Ann)
3 YrTotalRet
(Ann)
BetaShares Aus High Interest Cash ETF
iShares Core Composite Bond ETF
SPDR® S&P/ASX 200 ETF
Vanguard Intl Fxd Intr Idx (Hdg) ETF
Magellan Global Equities
Vanguard Australian Property Secs ETF
Vanguard Intl Credit Secs Idx (Hdg) ETF
Vanguard MSCI Index Intl (Hdg) ETF
SPDR® Dow Jones Global Real Estate ETF
30.00 0.18
25.00 0.24
È 9.00 0.18
9.00 0.20
É 6.00 1.25
É 6.00 0.25
6.00 0.30
È 6.00 0.21
Ë 3.00 0.50
0.93 2.16 0.02 3.35 4.03
1.84 -3.44 -4.81 4.78 10.58
0.51 1.05 2.09 2.30 2.55
2.21 3.75 13.06 6.13
-1.67 3.01 14.17 6.83 6.21
2.70 8.44 21.30 8.12
1.46 2.75 2.52
0.86 1.09 -1.30
-3.27 -3.08 -5.55 8.52 11.95
Holdings²
Past Performance is not a reliable indicator of future performance. Please see back page for important information on how performance is calculated.© 2017 Morningstar, Inc. All rights reserved. Neither Morningstar, its affiliates, nor the content providers guarantee the data or content contained herein to be accurate, complete or timely nor will they have any liability for its use or distribution.
Morningstar’s ETF Model PortfoliosMorningstar’s ETF Model Portfolios are a series of diversified, model portfolios that are designed for varying investor risk and return profiles. Asset allocations have been devised using Morningstar’s strategic asset allocation framework and long-term capital market assumptions. ETF selection relies on Morningstar’s qualitative and quantitative ETF research. Try it now w

15
How to evaluate investmentsAs a leading independent provider of investment research, Morningstar provides our readers with support in assessing new investment ideas, reviewing current portfolio holdings and / or validating third-party advice.
Morningstar’s Equity Research ReportsMorningstar’s Equity Research Reports provide a comprehensive view of each security that we cover. We provide an overall recommendation based on our calculated intrinsic value compared to the current price of the security. The key to our evaluation of each security is our assessment of the four key components of our fundamental analysis: the fair value estimate, uncertainty rating, economic moat and stewardship rating. Our analyst report also includes, our full investment thesis and comments on the valuation and risk of the security. Research Reports w | Recommendation Changes w
16
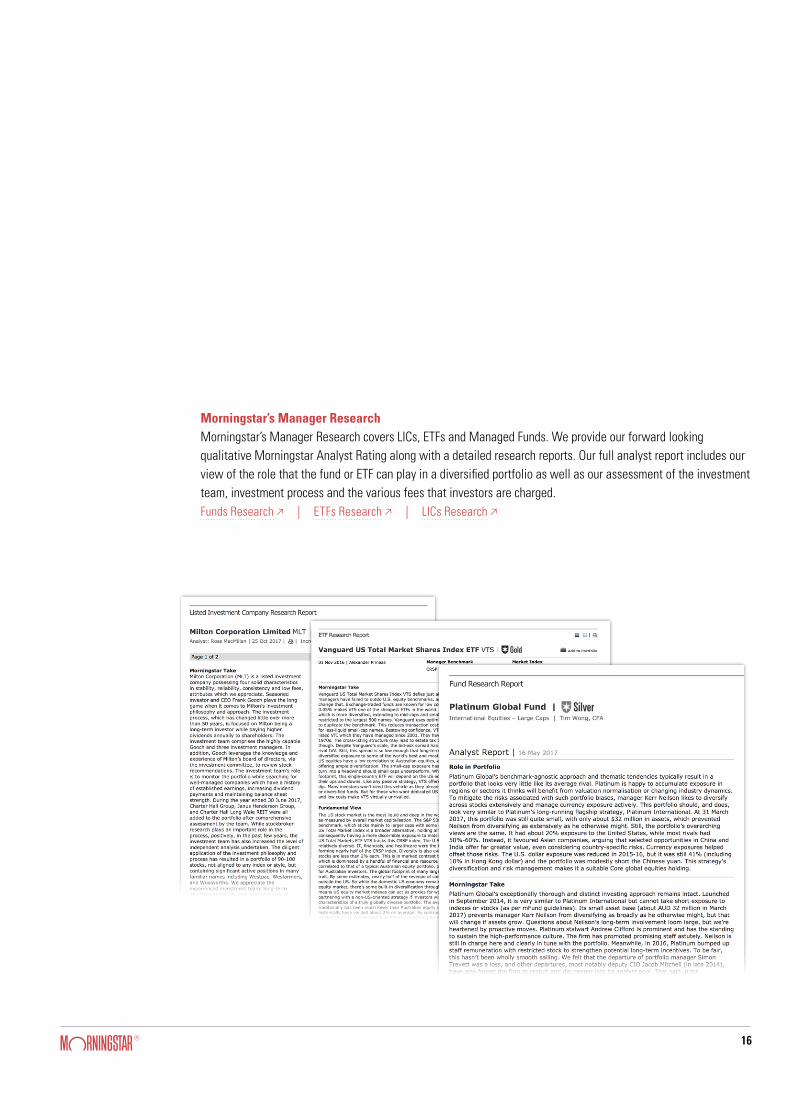
Morningstar’s Manager ResearchMorningstar’s Manager Research covers LICs, ETFs and Managed Funds. We provide our forward looking qualitative Morningstar Analyst Rating along with a detailed research reports. Our full analyst report includes our view of the role that the fund or ETF can play in a diversified portfolio as well as our assessment of the investment team, investment process and the various fees that investors are charged.Funds Research w | ETFs Research w | LICs Research w
17
Page 1 of 7 | Morningstar Credit Research
© 2017 Morningstar, Inc. All rights reserved. Neither Morningstar, its affiliates, nor the content providers guarantee the data or content contained herein to be accurate, complete or timely nor will they have any liability for its use or distribution. Any general advice or ‘class service’ have been prepared by Morningstar Australasia Pty Ltd (ABN: 95 090 665 544, AFSL: 240892) and/or Morningstar Research Ltd, subsidiaries of Morningstar, Inc, without reference to your objectives, financial situation or needs. Refer to our Financial Services Guide (FSG) for more information at www.morningstar.com.au/s/fsg.pdf. You should consider the advice in light of these matters and if applicable, the relevant Product Disclosure Statement (Australian products) before making any decision to invest. Our publications, ratings and products should be viewed as an additional investment resource, not as your sole source of information. Past performance does not necessarily indicate a financial product’s future performance. To obtain advice tailored to your situation, contact a professional financial adviser. Some material is copyright and published under licence from ASX Operations Pty Ltd ACN 004 523 782 ("ASXO").
NABPA NAB Convertible Preference Shares Security Investment Risk Medium Leader of the NAB Pack
Recommendation: Accumulate NABPA continues to look attractive, with a 2.55% trading margin, paying a gross running yield of 4.95% and gross yield to reset of 4.29%. We maintain our Accumulate recommendation. Investment Summary NABPA are fully-paid, convertible, transferrable, redeemable, subordinated, perpetual, unsecured preference shares with an AUD 100 face value and scheduled conversion date of 22 March 2021. This is subject to exchange conditions, unless it is exchanged earlier because of a trigger event or National Australia Bank exercising an option to call the security two years early on 20 March 2021. Distributions are discretionary, noncumulative and fully franked with a dividend stopper. Distributions are paid quarterly in arrears, based on the 90-day bank bill swap, or BBSW, rate plus a margin of 3.20%.
Issuer Description The Melbourne-based major Australian bank is a diversified financial services group, traditionally focused on business banking, with a strong presence in wealth. Offshore operations in New Zealand round out the group. The Australian and New Zealand banking franchise covers consumer, small business, corporate, and institutional sectors. National Australia Bank is currently the third-largest bank by market capitalisation and benefits from a large national branch network and improving market share in home loans and retail deposits. Issuer Bull/Bear Case Bull case: Management's focus on the successful, lower-risk, and profitable domestic banking and wealth management businesses provides confidence in the earnings outlook. Growing economies of scale, improving market positions, pricing power, a strong balance sheet, and high credit ratings provide a robust platform to drive growth. As Australia's biggest business bank, National Australia Bank has the most to gain from the rebound in demand for business credit. High-profile marketing campaigns, combined with product and fee initiatives, have delivered solid volume growth in home loans, improved customer satisfaction, and market share gains. Bear case: A slowdown in core earnings growth could resurface because of slower-than-expected business loan growth, margin compression, slower growth in banking fee income, subdued wealth and markets income, and a worse-than-expected cost outcome. The cost of wholesale funding remains elevated, and pressure on lending and deposit rates is likely to reduce net interest margins over the medium term. If stress returns to global credit markets, wholesale funding costs could increase, and availability of funding could be reduced. The focus on loan growth has delivered strong market share gains, but when loan growth exceeds deposit growth, more-expensive wholesale funding is required to fill the funding gap. Execution risk is increasing as the group's repositioning strategy unfolds, and National Australia Bank needs to successfully deliver on its turnaround strategy.
Issuer Name National Australia Bank Limited
Issuer Economic Moat Rating Wide
Issuer Stewardship Rating Standard
Sector Banks
Issue Date 20 March 2013
Issue Size AUD 1,541 million
Call Date 20 March 2019
Scheduled Conversion 22 March 2021
Issue Price AUD 100.00
Coupon Margin 3.20%
Base Rate 90-day bank-bill swap
Franking 100%
Distribution Frequency: Quarterly Ex-Date: December 4, 2017 Payment Amount AUD 0.8569
Snapshot Last Price AUD 101.37
Running Yield inc. Franking % 4.95
Running Yield ex. Franking % 3.47
Yield to Reset inc. Franking % 4.29
Yield to Reset ex. Franking % 2.67
Analyst John Likos, CFA
Date 26 October 2017
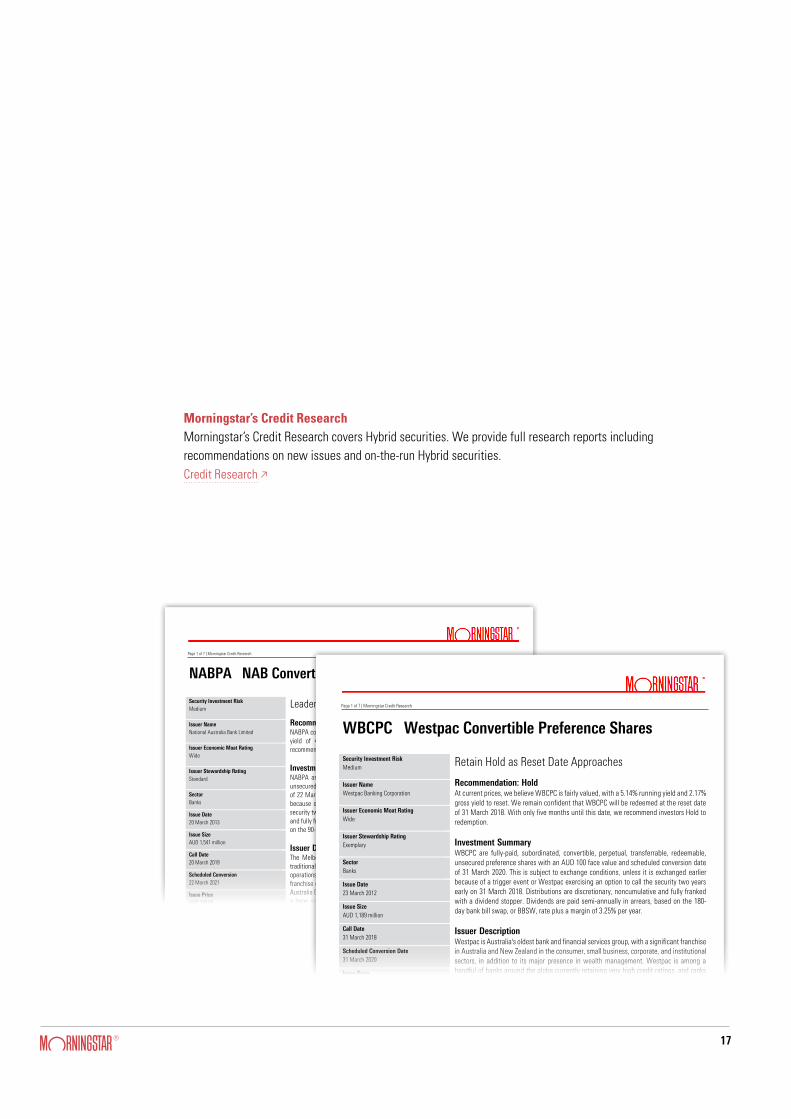
Morningstar’s Credit ResearchMorningstar’s Credit Research covers Hybrid securities. We provide full research reports including recommendations on new issues and on-the-run Hybrid securities.Credit Research w
Page 1 of 7 | Morningstar Credit Research
© 2016 Morningstar, Inc. All rights reserved. Neither Morningstar, its affiliates, nor the content providers guarantee the data or content contained herein to be accurate, complete or timely nor will they have any liability for its use or distribution. Any general advice or ‘class service’ have been prepared by Morningstar Australasia Pty Ltd (ABN: 95 090 665 544, AFSL: 240892) and/or Morningstar Research Ltd, subsidiaries of Morningstar, Inc, without reference to your objectives, financial situation or needs. Refer to our Financial Services Guide (FSG) for more information at www.morningstar.com.au/s/fsg.pdf. You should consider the advice in light of these matters and if applicable, the relevant Product Disclosure Statement (Australian products) or Investment Statement (New Zealand products) before making any decision to invest. Our publications, ratings and products should be viewed as an additional investment resource, not as your sole source of information. Past performance does not necessarily indicate a financial product’s future performance. To obtain advice tailored to your situation, contact a professional financial adviser. Some material is copyright and published under licence from ASX Operations Pty Ltd ACN 004 523 782 ("ASXO").
WBCPC Westpac Convertible Preference Shares Security Investment Risk Medium Retain Hold as Reset Date Approaches
Recommendation: Hold At current prices, we believe WBCPC is fairly valued, with a 5.14% running yield and 2.17% gross yield to reset. We remain confident that WBCPC will be redeemed at the reset date of 31 March 2018. With only five months until this date, we recommend investors Hold to redemption.
Investment Summary WBCPC are fully-paid, subordinated, convertible, perpetual, transferrable, redeemable, unsecured preference shares with an AUD 100 face value and scheduled conversion date of 31 March 2020. This is subject to exchange conditions, unless it is exchanged earlier because of a trigger event or Westpac exercising an option to call the security two years early on 31 March 2018. Distributions are discretionary, noncumulative and fully franked with a dividend stopper. Dividends are paid semi-annually in arrears, based on the 180-day bank bill swap, or BBSW, rate plus a margin of 3.25% per year.
Issuer Description Westpac is Australia's oldest bank and financial services group, with a significant franchise in Australia and New Zealand in the consumer, small business, corporate, and institutional sectors, in addition to its major presence in wealth management. Westpac is among a handful of banks around the globe currently retaining very high credit ratings, and ranks third in assets across the four major Australian banks. The bank benefits from a large national branch network and significant market share, particularly in home loans and retail deposits. Issuer Bull/Bear Case Bull case: Good operating momentum from core retail and business banking franchises, impressive cost/income performance, and solid economic conditions underpin consistent profit growth with a lower-risk domestic business model. Economies of scale, dominant market positions, pricing power, a superior balance sheet, and high credit ratings provide a strong platform to drive growth. The balance sheet is built around consumer banking, which provides the retail-oriented bank with earnings diversity to complement the more volatile returns generated from business and wholesale banking activities. Bear case: Slow core earnings growth could resurface because of margin compression, subdued wealth and markets income, lower banking fee income, and a worse-than-expected outcome on costs. Increasing pressure on stressed global credit markets could increase wholesale funding costs and reduce wholesale funding availability. Recouping higher funding costs by increasing lending rates is more difficult because of tougher pricing competition between the major banks. The credit cycle has turned from historical lows and bad debts will continue to increase over the coming years.
Issuer Name Westpac Banking Corporation
Issuer Economic Moat Rating Wide
Issuer Stewardship Rating Exemplary
Sector Banks
Issue Date 23 March 2012
Issue Size AUD 1,189 million
Call Date 31 March 2018
Scheduled Conversion Date 31 March 2020
Issue Price AUD 100.00
Coupon Margin 3.25%
Base Rate 180-day bank-bill swap
Franking 100%
Distribution Frequency: Semi-annual Ex-Date: March 22, 2018 Payment Amount AUD 1.8011
Snapshot Last Price AUD 101.60
Running Yield inc. Franking % 5.14
Running Yield ex. Franking % 3.60
Yield to Reset inc. Franking % 2.17
Yield to Reset ex. Franking % 0.45
Analyst John Likos, CFA
Date 20 October 2017
18
?
Any Morningstar ratings/recommendations contained in this report are based on the full research report available from Morningstar or your adviser. © 2017 Morningstar, Inc. All rights reserved. Neither Morningstar, its affiliates, nor the content providers guarantee the data or content contained herein to be accurate, complete or timely nor will they have any liability for its use or distribution. Any general advice or 'class service' have been prepared by Morningstar Australasia Pty Ltd (ABN: 95 090 665 544, AFSL: 240892) and/or Morningstar Research Ltd, subsidiaries of Morningstar, Inc, without reference to your objectives, financial situation or needs. Refer to our Financial Services Guide (FSG) for more information at www.morningstar.com.au/s/fsg.pdf. You should consider the advice in light of these matters and if applicable, the relevant Product Disclosure Statement (Australian products) or Investment Statement (New Zealand products) before making any decision to invest. Our publications, ratings and products should be viewed as an additional investment resource, not as your sole source of information. Past performance does not necessarily indicate a financial product's future performance. To obtain advice tailored to your situation, contact a professional financial adviser. Some material is copyright and published under licence from ASX Operations Pty Ltd ACN 004 523 782 ("ASXO").
Australian Credit Monthly October 2017
Government Bond & Money Markets A mixed bag of data among leading developed economies during October has seen a relatively uneventful month with respect to global bond yields. The exception was the United States, where stronger inflation of 2.20% and the lowest jobless rate since 2001 has cemented expectations of the Federal Reserve’s tightening trajectory. Discussion around the next Federal Reserve Chair raised uncertainty in global bond markets as speculation of the possible appointment of the hawkish John Taylor caused bond yields to rise. At the time of writing, Federal Reserve Board Member Jerome Powell has just been confirmed, barely moving yields in the process. Powell is expected to continue the gradual monetary tightening pursued by Janet Yellen. In Australia, strong employment data was overshadowed by slower than expected inflation which once again put a halt to near term cash rate increase discussion. Current ASX cash rate futures have adjusted to these inflation numbers by pushing their next cash rate hike expectation five months on to September 2018. We have even seen renewed discussion in the media towards a possible cash rate cut – not our base case scenario. The Reserve Bank of Australia meets next week, and we expect the committee to maintain their optimistic tone and leave the cash rate at 1.50% Exhibit 1: ASX 30 Day Interbank Cash Rate Futures Implied Yield Curve as at Oct. 31
Source: Australian Securities Exchange, Morningstar
1.30%
1.40%
1.50%
1.60%
1.70%
1.80%
1.90%
2.00%
Implied Yield as at Sept. 29 Implied Yield as at Oct. 31 Official Cash Rate
Morningstar Credit Research 3 November 2017
John Likos, CFA Director, Equity & Credit Research, Australia +61 2-9276-4444 [email protected] Ella McAlister Associate Analyst, Australia + 61 2-9276-4444 [email protected]
Any Morningstar ratings/recommendations contained in this report are based on the full research report available from Morningstar or your adviser. © 2017 Morningstar, Inc. All rights reserved. Neither Morningstar, its affiliates, nor the content providers guarantee the data or content contained herein to be accurate, complete or timely nor will they have any liability for its use or distribution. Any general advice or ‘class service’ have been prepared by Morningstar Australasia Pty Ltd (ABN: 95 090 665 544, AFSL: 240892) and/or Morningstar Research Ltd, subsidiaries of Morningstar, Inc, without reference to your objectives, financial situation or needs. Refer to our Financial Services Guide (FSG) for more information at www.morningstar.com.au/s/fsg.pdf. You should consider the advice in light of these matters and if applicable, the relevant Product Disclosure Statement (Australian products) or Investment Statement (New Zealand products) before making any decision to invest. Our publications, ratings and products should be viewed as an additional investment resource, not as your sole source of information. Past performance does not necessarily indicate a financial product’s future performance. To obtain advice tailored to your situation, contact a professional financ ial adviser. Some material is copyright and published under licence from ASX Operations Pty Ltd ACN 004 523 782 ("ASXO").
18 August 2017
A plethora of cash, short-term and floating rate ETFs launched
recently, all offering parking spots for your money. It’s tempting to
simply pick the fund with the highest yield, but the products are
not interchangeable. Fees and investments vary, and the old rule
of “the higher the return, the higher the risk” remains relevant.
These funds are conservative versus equity and longer-dated bond
ETFs, but even so, investors need to know what they’re getting
into. Let’s take a look.
Don’t Compare Apples with Oranges or Yields Exhibit 1 offers a snapshot of each of the new products. However
we take yield figures with a grain of salt because the numbers
quoted by fund managers are often not directly comparable. We
checked the factsheets and found some quoted “running yield,”
while others quoted “yield to maturity”. There shouldn’t be much
difference because the funds are extremely low duration and high
credit quality, but even so we are wary, because the funds are so
Exhibit 1 – Cash and ‘Yield’ ETFs
Source: Morningstar Direct and Fund Manager Factsheets and
Correspondence.
new that there is no track record of returns or income available to
cross-check, with the exception of BetaShares High Interest
Cash ETF AAA, which launched in 2012. Furthermore, some
managers quoted net figures, and some used gross (that is, they
didn’t include fees in their calculation). Some factsheets quoted
no yield numbers at all and we had to email the fund managers for
clarification.
The average credit rating methodologies vary too, for example
some using the short-term rating scale (A-1, A-2 and so on) and
others quoting long-term credit ratings (AAA, AA etc).
You Get What You DON’T Pay For The old saying “you get what you pay for” is not so true in the
investing world. After all, you invest to earn a return, and any
reduction in fee adds to the return, straight into your pocket. So
you could argue “you get what you don’t pay for.” Unlike equity
funds, cash has no upside risk, so fees come straight off your
return. We wouldn’t advocate investing in a cheap fund that didn’t
have the skills to pay the bills, but if two funds are equally good,
we’d choose the cheaper one.
Peter WarnesHead of Equities Research
Morningstar Equities Research | September 2017
Earnings Season Insights | September 2017One-stop shop for over 90 results
Despite some upbeat comments on the reporting season, with a focus on 60% of companies increasing dividends, overall results were mildly disappointing. Certainly, if the three major iron ore miners, BHP Billiton (BHP), Rio Tinto (RIO), and Fortescue (FMG) were excluded, overall profit growth was mid-single-digit at best. The adjusted profits of the three major miners increased by a whopping US$9bn (A$11.7bn based on a 30 June A$/US$ exchange rate of 0.769).
While there were distractions, mostly of a geopolitical nature, during August the S&P/ASX 200 Index was flat and the Accumulation Index was up 0.7%. The Australian Bureau of Statistics revealed June quarter company profits fell 4.5% on the March quarter as commodity prices eased. The total adjusted NPAT of Australian listed companies covered by Morningstar totalled $78.3bn. This figure excludes those companies with non-30 June or 31 December balance dates, for example, the three major banks--Australian and New Zealand Banking Group (ANZ), National Australia Bank (NAB), and Westpac (WBC)--and Macquarie (MQG). BHP, FMG and RIO (half year) contributed $18.6bn or 24% of the total.
Guidance for FY18 was cautious, and while some commentators have focused on higher future capital expenditure intentions, I am a little sceptical. I believe many companies have trimmed back on maintenance or stay-in-business capex over the past couple of years to help in cost control and support earnings. There needs to be a catch up, starting in FY18. A breakdown between maintenance and growth capex intentions would be more helpful and should, I believe, be compulsory for companies to provide.
Using a 5% movement in the share price on the day of the announcement as a guide, more large companies disappointed than pleased. Sectors to disappoint included Insurance, with Insurance Group of Australia (IAG), QBE Insurance (QBE), and Suncorp (SUN) making up an unenviable trifecta, Healthscope (HSO), Ramsay Health Care
(RHC), and ResMed Inc. (RMD the Healthcare trifecta, and Telstra (TLS) and Vocus (VOC) the telecommunications quinella. Other large companies to join the band of disappointments included BlueScope Steel (BSL), James Hardie (JHX), REA Group (REA), and News Corporation (NWS). Positive results from large companies were few, including Cochlear (COH) and Origin Energy (ORG). Medium-sized disappointments included Domino’s Pizza (DMP), IRESS (IRE), Pact Group (PGH), and Automotive Holdings (AHG). Positives included ARB Corporation (ARB), Aveo (AOG), Bendigo & Adelaide Bank (BEN), Breville (BRG), G8 Education (GEM), IOOF (IFL), Medibank Private (MPL), Monadelphous (MND), Orora (ORA), Perpetual (PPT), Platinum Asset Management (PTM), and Super Retail (SUL).
CBA met expectations but was subsequently overwhelmed by deficiencies in reporting cash transactions. ANZ and NAB reported 2Q17 trading updates which generally satisfied investors.
REITs were solid with most meeting guidance. Non-cash revaluations were a highlight, benefiting from lower capitalisation rates. The consensus is capitalisation rates have either bottomed or are near bottom, with the revaluation tailwinds abating. Office portfolios outperformed retail as subdued consumer spending tests rental resilience. Strong residential development activity boosted both Mirvac (MGR) and Stockland (SGP).
While the negative share price reaction of some healthcare stocks surprised, Ansell (ANN), Healthscope (HSO), and Primary (PRY) were the only companies reporting lower adjusted profits. CSL Limited (CSL) subsequently recovered strongly from its announcement day selloff.
In retail land, Coles and DMP disappointed while Woolworths’ (WOW) strong comparable sales growth surprised on the upside, although the massive investment in price dulled much of the volume-sensitive earnings improvement. Bunnings Continued on page 2
Contact DetailsTel: 1800 03 44 55Email: [email protected]: Lvl 36, 264 George St Sydney NSW 2000www.morningstar.com.au
Iron ore miners feature in a lacklustre reporting season – some big names disappoint
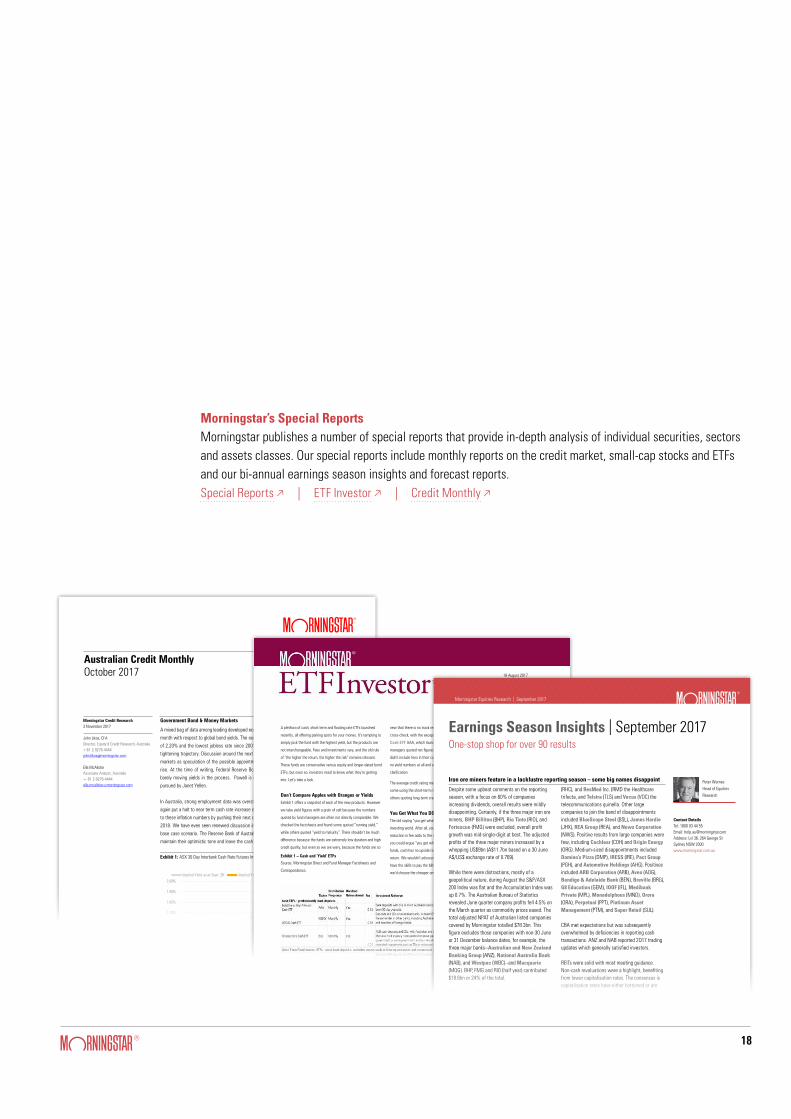
Morningstar’s Special ReportsMorningstar publishes a number of special reports that provide in-depth analysis of individual securities, sectors and assets classes. Our special reports include monthly reports on the credit market, small-cap stocks and ETFs and our bi-annual earnings season insights and forecast reports.Special Reports w | ETF Investor w | Credit Monthly w

19
Track and monitor your investmentsAvoidance is the one financial strategy that is guaranteed to fail. We have the tools, commentary and insights to allow our readers to stay on top of their investment portfolios.
Portfolio ManagerMorningstar’s Portfolio Manager allows users to create multiple watch lists and transaction portfolios to track security prices, company news and investment performance. The tool is fully integrated with Morningstar’s data and research and allows users to easily obtain the latest analyst reports on holdings.Try it now w
20
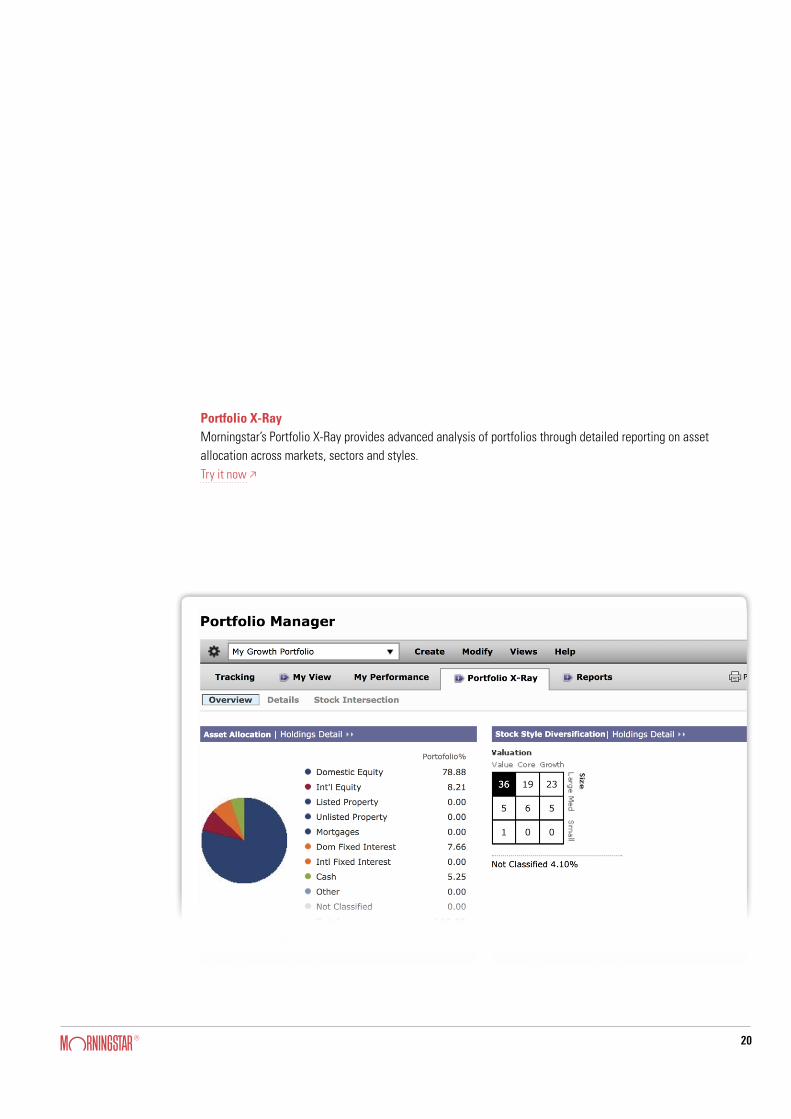
Portfolio X-RayMorningstar’s Portfolio X-Ray provides advanced analysis of portfolios through detailed reporting on asset allocation across markets, sectors and styles.Try it now w

21
Stock IntersectionMorningstar’s Stock Intersection is a tool that is specially designed for managed fund investors. A key input into portfolio construction decisions, the tool provides a look through to the underlying holdings in each managed fund to enable investors to track asset allocation across a portfolio.Try it now w


