Page 1
THIS REPORT CONTAINS ASSESSMENTS OF COMMODITY AND TRADE ISSUES MADE BY
USDA STAFF AND NOT NECESSARILY STATEMENTS OF OFFICIAL U.S. GOVERNMENT
POLICY
Date:
GAIN Report Number:
Approved By:
Prepared By:
Report Highlights:
Post forecasts that MY 2015/16 orange production in Morocco will increase by 5 percent compared to
the previous year, registering 918,120 MT on a planted area of about 55,804 hectares;
tangerine/mandarin production will increase by 5 percent totaling 1,055,241 MT on a planted area of
62,181 hectares; and lemon and lime production will increase by 8 percent totaling 35,500 MT on a
planted area of 3,750 hectares. Most of the production increases are due to rejuvenation of citrus
orchards, improved irrigation, and increases in harvested areas. Post projects total orange exports for
MY 2015/16 to reach around 135,000 MT, tangerine/mandarin exports will increase by 10 percent to
reach approximately 380,820MT, and lemon/lime exports will increase to 7,200 MT. The rise in
exports is mostly due to high demand in Russia market, as tensions mount between Moscow and
Mohamed Fardaoussi, Agricultural Specialist
Sarah Hanson, Agricultural Attaché
2015 Morocco Citrus Annual Report
Citrus Annual
Morocco
MO1515
12/10/2015
Required Report - public distribution
Page 2
Foreign Agricultural Service 2 | P a g e
Ankara.
The Moroccan citrus industry is planning to continue its strong focus on the Russian market this season,
but warns coordination will be needed to avoid poor prices.
Harmonized System (HS) Codes:
Oranges 080510
Tangerines/Mandarins 080520
Limons 080550
Orange Juice 200911, 200912, 200919
Abbreviations used in this report:
ASPAM Moroccan Citrus Producers Association
EU European Union
EACCE Etablissement Autonomous of Control and Export Coordination
GTA Global Trade Atlas
MT Metric ton (1,000 kg)
MMT Million Metric Tons
MoA Moroccan Ministry of Agriculture
MOC Moroccan Office of Changes
MY Marketing year
PS&D Production, Supply and Demand
Key Sources
Name of source Website
Maroc Citrus http://maroc-citrus.com/
Moroccan Citrus Producers Association (ASPAM) http://maroc-
citrus.com/?page_id=315
Moroccan Ministry of Agriculture http://www.agriculture.gov.ma/
Global Trade Atlas http://www.gtis.com/gta/usda/
Etablissement Autonomous of Control and Export Coordination
(EACCE)
http://web2.eacce.org.ma/
Exchange rate
1 US$ Exchange = 10.0203 MAD (source: Oanda, 11/27/15)
Table 1: Summary of fresh citrus production, supply and distribution by (1000MT)
citrus MY 2014/15 MY 2015/16
Producti
on
Domestic
Consumption
Expor
ts
Producti
on
Domestic
Consumption
Expor
ts
Oranges 868 693 125 918 728 135
Tangerines/Mand
arins 1,003 657 346 1,055 675 380
Lemons/Lime 30 23 7 35 27.5 7.5
Page 3
Foreign Agricultural Service 3 | P a g e
Table of Contents
Oranges, Fresh .............................................................................................................................. 4
Production ................................................................................................................................... 4
Consumption ............................................................................................................................... 5
Trade ........................................................................................................................................... 5
Tangerines/Mandarins, Fresh ...................................................................................................... 6
Production ................................................................................................................................... 6
Consumption ............................................................................................................................... 8
Trade ........................................................................................................................................... 8
Lemons, Fresh ............................................................................................................................. 10
Production ................................................................................................................................ 10
Consumption ............................................................................................................................ 11
Trade ......................................................................................................................................... 11
Orange Juice ................................................................................................................................ 12
Production ................................................................................................................................ 12
Consumption ............................................................................................................................ 12
Trade ......................................................................................................................................... 12
Export Procedures ...................................................................................................................... 13
Policy ............................................................................................................................................ 14
Subsidies and supports ............................................................................................................... 14
ANNEX ........................................................................................................................................ 15
Page 4
Foreign Agricultural Service 4 | P a g e
Commodities
Oranges, Fresh
Production
The area planted with oranges in Morocco has grown steadily since the 2007/08 MY by 40.6 percent
from 39,673 hectares to 55,804 hectares in 2015/16 MY. The total orange harvested area has grown by
at least four percent from 48,098 hectares in the 2014/15 MY to 50,100 hectares in the 2015/16 MY.
Figure 1: Area Planted and Harvested to Oranges
Source: MoA, MC. * Post estimation
Post forecasts that the MY 2015/16 production of oranges will increase by five percent to 918,120 MT
compared to previous year. The rise in orange production is mainly due to the rejuvenation of the orange
orchard, improved irrigation, and increases in harvested areas. The Souss and Oriental region that
accounts for nearly thirty percent of Morocco’s orange production has faced unfavorable weather this
season that negatively affected the bloom during the fruit setting, and hence the production is officially
expected to decline in those regions by 10 to 15 percent. In contrast, the Gharb, Tadla, and Houz will
register a production growth this season.
Table 2: Morocco Orange Production by regions in MT
Regions 2014/15 2015/16* % Change
GHARB 250,059 279,400 11.7%
SOUSS 208,999 184,315 -11.8%
TADLA 193,216 227,995 18.0%
ORIENTAL 121,305 108,570 -10.5%
TAZA 31,823 27,435 -13.8%
AL HAOUZ 29,690 49,270 66.0%
TANGER TETOUAN 12,065 17,615 46.0%
Other region 21,492 23,520 9.4%
Total 868,649 918,120 5.7% Source: MoA, DSS, and Maroc citrus association * Post estimation
Page 5
Foreign Agricultural Service 5 | P a g e
Orange production in Morocco is dominated by Maroc-Late (48 percent) and Navel (35 percent)
varieties. The Sanguine was the most affected variety where fruit size and quality were significantly
below average.
Table 3: Oranges Production by volume (1000 Metric Tons)
Marketing Year 2013/14 2014/15 2015/16* % Change
Maroc-Late 494 405 441 9%
Navel 370 317 330 5%
Sanguine 28 25 23 -10%
Salustiana 78 70 76 11%
Other Orange 30 33 48 -5%
Total Oranges 1,000 868 918 6%
Source: MC, MoA, * Post estimation
Consumption
Post forecasts that the 2015/16 MY domestic consumption of oranges will increase by 5 percent
compared to the previous year, reaching about 728,000 MT based on consumer demand. Fresh oranges
are the most popular citrus consumed in Morocco, and per capita annual consumption is estimated at 19
kg for oranges.
Trade
According to the Office des Changes, total oranges exports in 2014/15 MY amounted to 125,041 MT.
E.U. and Russia attracted 60% of the Moroccan oranges in 2014/15 MY, about 13 percent higher than
exports the previous year. Most of the increase in orange exports occurred in Maroc Late and Navel
exports. This season exports of oranges are expected to increase as tensions mount between Russia and
Turkey. Morocco has been named by Moscow as potential replacement for Turkish supplies after Russia
announced on Nov. 26, 2015 broad retaliatory measures against Turkey’s economy.
Post projects total orange exports for MY 2015/16 to reach around 135,000 MT, about 8 percent higher
than exports in MY 2014/15. The increase in exports is explained by the demand of Russian market.
Table 4: Oranges exports by country (Metric Tons)
Source: Office des changes
Table 5: Oranges exports by varieties (Metric
Tons)
Marketing Year 2010/11 2011/12 2012/13 2013/14 2014/15* % Change
Marketing Year 2013/14 2014/15
Netherlands 44,014 47,000
Russia 23,816 24,463
Sweden 12,460 11,717
United States 2,076 9,165
France 3,207 4,675
Canada 2,281 3,025
Mauritania 10,428 2,411
Senegal 6,292 416
Other country 6,855 21,886
Total Export 110,429 125,041
Page 6
Foreign Agricultural Service 6 | P a g e
Maroc-Late 100,486 84,753 42,237 46,029 81,792 -2%
Navel 19,391 10,850 4,499 7,187 6,510 38%
Navel Lane Late 3,886 2,870 874 3,895 2,198 29%
Salustiana 25,172 19,210 9,189 16,571 16,460 16%
W.Sanguine 25,253 22,477 17,474 23,631 16,632 35%
Sanguinelli 337 397 1,019 707 958 -3%
Other Orange 620 73 22 551 461 -21%
Oranges 175,145 140,630 75,314 110,429 125,041 11%
Source: MoA, office de change and EACCE/ * Post estimation
Table 6: PS&D Orange, Fresh
Oranges, Fresh 2013/2014 2014/2015 2015/2016*
Market Begin Year Oct 2013 Oct 2014 Oct-15
Morocco USDA
Official
New
Post
USDA
Official
Old
Post
New
Post
USDA
Official
New
Post
Area Planted (H) 53,300 53,300 54,536 54,536 54,536 0 55,804
Area Harvested 45,000 45,000 46,000 46,000 48,067 0 50,100
Bearing Trees 16,644 16,644 16,800 16,800 16,800 0 16,850
Non-Bearing Trees 1,747 1,747 1,500 1,500 1,500 0 1,540
Total No. Of Trees 18,391 18,391 18,300 18,300 18,300 0 18,390
Production 1,001 1,001 750 750 868 0 918
Imports 0 0 0 0 0 0 0
Total Supply 1,001 1,001 750 750 868 0 918
Exports 110 110 80 80 125 0 135
Fresh Dom.
Consumption 821 821 620 620 693 0 728
For Processing 70 70 50 50 50 0 55
Total Distribution 1,001 1,001 750 750 868 0 918
Source: PS&D/USDA * Post forecast
Commodities:
Tangerines/Mandarins, Fresh
Production
The area planted with tangerine/mandarin in Morocco has grown steadily since the 2007/08 MY by 40.6
percent from 40,292 hectares to 62,181 hectares in 2015/16 MY. The total tangerines/mandarins
Page 7
Foreign Agricultural Service 7 | P a g e
harvested area has grown slightly by 73 percent from 29,417 hectares in the 2007/08 MY to 50,996
hectares in the 2015/16 MY.
Figure 2: Area Planted and Harvested to Tangerines/Mandarins
Source: MoA, MC, * Post estimation
Post forecasts that the MY 2015/16 production of tangerines/mandarins in Morocco will increase by five
percent to 1,055,541 MT compared to previous year, the rise in tangerines/mandarins production is
mainly due to the rejuvenation of the tangerines/mandarins orchard, practice of localized irrigation, and
an increase in harvested areas.
Table 7: Morocco Tangerines/Mandarins Production by Regions in MT
Regions 2014/15 2015/16* % change
SOUSS 382,500 418,432 9.4%
ORIENTAL 195,026 156,043 -20.0%
AL HAOUZ 145,173 166,534 14.7%
TADLA 127,187 150,081 18.0%
GHARB 109,706 112,760 2.8%
TANGER 20,152 29,421 46.0%
TAZA 11,341 10,341 -8.8%
Other region 12,206 11,629 -4.7%
Total 1,003,291 1,055,241 5.2%
Source: Maroc citrus, MoA, * Post estimate
Tangerines/mandarins production is dominated by Clementine-type varieties, such as Nules, Deverdis
and Late Clementine with Nova projected to increase by 41 percent and Nadorcott by 19 percent, due to
new orchards coming on line. It should be noted that there are more than 47 varieties in Morocco,
several of which are new hybrid varieties, such as Nadorcott (Afourer) and Nova that are gaining
popularity compared to local varieties. These varieties have the advantages of being a higher quality and
harvested later which extends the marketing season through February and thus increases their
availability to the export markets.
Table 8: Tangerines/Mandarins Production by Volume (1000 Metric Tons)
Page 8
Foreign Agricultural Service 8 | P a g e
Marketing Year 2013/14 2014/15 2015/16* % Change
Clementine 629 559 537 -4%
Nules 141 123 122 -1%
Nova 154 112 158 41%
Nadorcott 141 112 134 19%
Others 120 96 104 8%
Total 1,185 1,003 1,055 5.2%
Source: Maroc citrus, MoA, * Post estimate
Consumption
Post forecasts that the MY 2015/16 domestic consumption of tangerines/mandarins in Morocco will
increase by 2.7 percent to 675,000MT compared to previous season. The high quality, desirable taste,
and low prices compared to the other fruits have made tangerines/mandarins the favorite fruit consumed
by Moroccans. Per capita annual consumption is estimated at 11 kg.
Trade
According to the Office des Changes, total tangerines/mandarins exports in 2014/15 MY amounted to
346,600 MT about 30 percent lower than exports from the previous period, the Russian market, which
accounts for more than 50% of Moroccan tangerines/mandarins exports, was not able to absorb the
quantity exported last year which resulted in dropping prices of fruit leading to severe losses for
Moroccan farmers who sell on consignment.
Table 9: Tangerines/Mandarins exports by country (Metric Tons)
Marketing Year 2013/14 2014/15*
Russia 279,560 139,294
Netherlands 48,500 48,599
Canada 46,223 40,779
United States 40,817 45,226
Sweden 24,651 30,989
France 24,449 15,323
United Kingdom 9,428 7,380
Page 9
Foreign Agricultural Service 9 | P a g e
Senegal 1,801 4,168
Mauritania 997 3,054
Other country 17,405 11,788
Total Export 493,831 346,600
Source: Office des change, * Post estimate
Morocco’s tangerines/mandarins exports to the United States (mostly Clementine varieties) totaled
45,226 MT in MY 2014/15 about 10.8 percent higher than exports from the MY 2013/14, about 47
percent of these exports consisted of Clementine, 29 percent Nadorcott, and 21 percent for Nour. The
expansion of Morocco’s tangerines/mandarins exports to the U.S. market has been constrained mainly
by U.S. consumers’ preference for larger fruit sizes rather than logistic.
Table 10: Tangerines/Mandarins Exports by Varieties (Metric Tons)
Marketing Year 2010/11 2011/12 2012/13 2013/14 2014/15* % change
Clementine 214,352 206,228 171,665 280,954 162,669 -42%
Nour 79,151 77,249 58,985 117,458 71,370 -39%
Nadorcott 37,931 41,926 66,481 65,043 98,787 52%
Ortanique 9,277 7,581 4,377 8,829 6,262 -29%
Nova 6,514 7,792 2,360 4,545 3,181 -30%
Others 1,915 3,202 3,420 17,002 4,330 -75%
Total 349,140 343,978 307,288 493,831 346,600 -30%
Source: Office des change, * Post estimate
Post forecasts that the Morocco 2015/16 MY exports of tangerines/mandarins will increase by 10
percent for MY 2015/16 to reach around 380,820 MT. The increase in exports is explained by Russian
increased demand as tensions mount between Moscow and Ankara wile Morocco among the countries
poised to win shares of the Russia citrus market.
Table 11: PS&D Tangerines/Mandarins
Tangerines/Mandarins,
Fresh
2013/2014 2014/2015 2015/2016
Oct 2013 Oct 2014 Oct 2014
Morocco USDA
Official
New
Post
USDA
Official
Old
Post
New
Post
USDA
Official
New
Post
Area Planted 57,201 57,201 60,227 60,227 60,227 0 62,181
Area Harvested 42,000 42,000 43,600 43,600 47,140 0 50,100
Bearing Trees 18,320 18,320 18,300 18,300 19,300 0 19,700
Non-Bearing Trees 6,412 6,412 6,412 6,412 6,412 0 6,610
Page 10
Foreign Agricultural Service 10 | P a g e
Total No. Of Trees 24,732 24,732 24,712 24,712 25,712 0 26,310
Production 1,160 1,160 925 925 1,003 0 1,055
Imports 0 0 0 0 0 0 0
Total Supply 1,160 1,160 925 925 1,003 0 1,055
Exports 501 501 350 350 346 0 380
Fresh Dom. Consumption 659 659 575 575 657 0 675
For Processing 0 0 0 0 0 0 0
Total Distribution 1,160 1,160 925 925 1,003 0 1,055
Source: PS&D/USDA * Post forecast
Commodities:
Lemons, Fresh
Production
The area planted for the lemons/limes has declined steadily since MY 2008/09 by 43 percent from
7,789 hectares in MY 2008/2009 to 4,415 hectares in MY 2015/16 due to increase in the area of
oranges and tangerines/mandarins varieties.
Figure 3: Area Planted to Lemons/Limes
Source: MoA, Maroc citrus
Post forecasts that the MY 2015/16 production of lemons/limes in Morocco will increase by five
percent to 35,200 MT compared to previous year. The rise in lemons/limes production is mainly due to
the increase of the harvested area compared to the previous year and the practice of localized irrigation.
Table 12: Lemon/Lime Production by volume
Production
Marketing Year 2012/2013 2013/14 2014/15 2015/16* % Change
Lemon/Lime** 47.5 42.4 29.6 35.2 19 %
Page 11
Foreign Agricultural Service 11 | P a g e
(1,000 Metric Tons)
Total Fresh Citrus 1,494 2,204 1,906 2,008 5.35%
Source: MoA, DSS,* Post estimate
**: includes grapefruits
Consumption
In MY 2015/16, Post forecasts Morocco’s domestic consumption of lemon/lime will increase by 19
percent compared to previous season, reaching about 670,000MT. Per capita annual consumption is
estimated at 1.3 kg for lemon/lime.
Trade
Post forecasts the 2015/16 MY lemon exports to increase by 8 percent to 7,500 MT based on the
increased of domestic production.
Table 13: Morocco‘s Citrus Exports by varieties (1000 Metric Tons)
Marketing Year
Exports Metric Tons
2013/14 2014/15 2015/16* Lemon/Lime* 10,494 6,900 7,500
Source: EACCE and MC//* Post estimate
Table 13: PSD Lemons/Limes
Lemons/Limes,
Fresh
2013/2014 2014/2015 2015/2016
Market Begin
Year
Oct 2013 Oct 2014 Oct 2015
Morocco USDA
Official
Old
Post
New
Post
USDA
Official
Old
Post
New
Post
USDA
Official
New
Post
Area Planted 3,577 3,57
7
0 3,235 3,23
5
0 0 3,750
Page 12
Foreign Agricultural Service 12 | P a g e
Area Harvested 3,000 3,00
0
0 2,800 2,80
0
0 0 2,920
Bearing Trees 1,702 1,70
2
0 1,500 1,50
0
0 0 1,550
Non-Bearing
Trees
450 450 0 325 325 0 0 335
Total No. Of
Trees
2,152 2,15
2
0 1,825 1,82
5
0 0 1,885
Production 43 43 0 35 30 0 0 35
Imports 0 0 0 0 0 0 0 0
Total Supply 43 43 0 35 30 0 0 35
Exports 10 10 0 10 7 0 0 7
Fresh Dom.
Consumption
33 33 0 25 23 0 0 28
For Processing 0 0 0 0 0 0 0 0
Total
Distribution
43 43 0 35 30 0 0 35
TS=TD 0 0 0 0 0 0 0 0
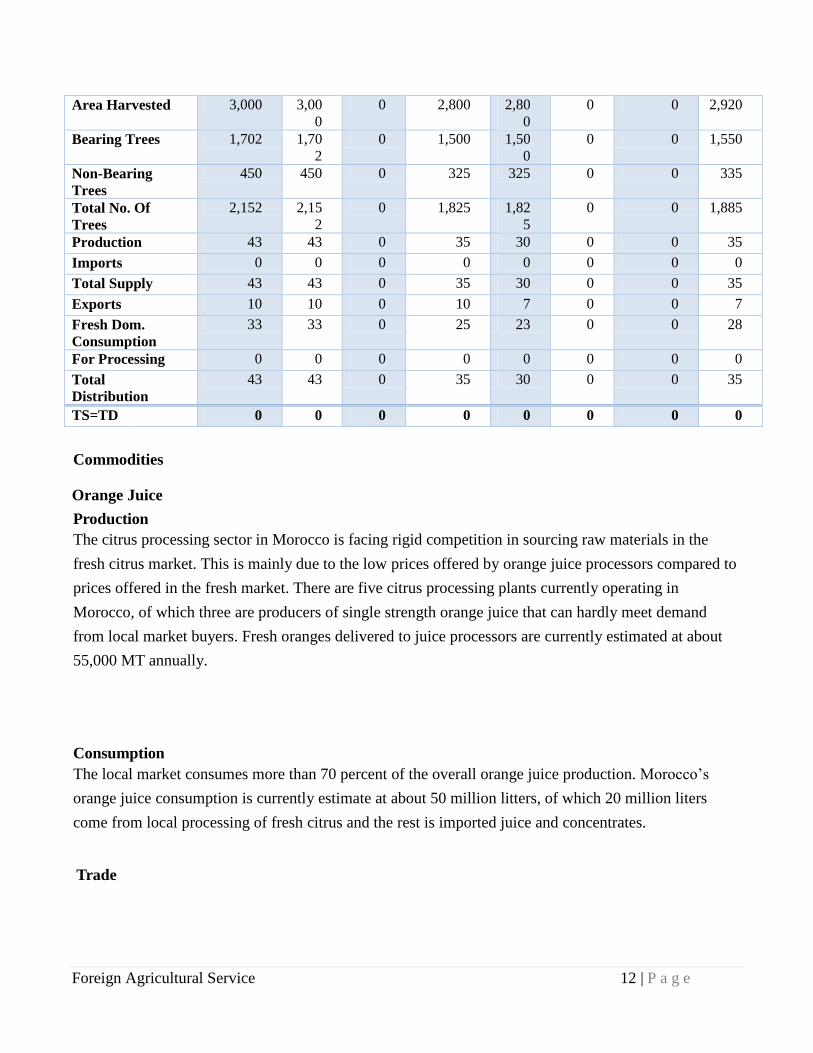
Commodities
Orange Juice
Production
The citrus processing sector in Morocco is facing rigid competition in sourcing raw materials in the
fresh citrus market. This is mainly due to the low prices offered by orange juice processors compared to
prices offered in the fresh market. There are five citrus processing plants currently operating in
Morocco, of which three are producers of single strength orange juice that can hardly meet demand
from local market buyers. Fresh oranges delivered to juice processors are currently estimated at about
55,000 MT annually.
Consumption
The local market consumes more than 70 percent of the overall orange juice production. Morocco’s
orange juice consumption is currently estimate at about 50 million litters, of which 20 million liters
come from local processing of fresh citrus and the rest is imported juice and concentrates.
Trade
Page 13
Foreign Agricultural Service 13 | P a g e
Post forecasts that the 2015/16 MY orange juice imports will remain flat at 2,900 MT and exports at
4,000MT. The customs office reports imports from October 2014 to June 2015 at 2,900 MT and exports
at 3,500 MT during the same period.
Table 14: PSD Orange Juice
Orange Juice 2013/2014 2014/2015 2015/2016
Market Begin Year Oct 2013 Oct 2014 Oct 2015
Morocco USDA
Official
New
Post
USDA
Official
New
Post
USDA
Official
New
Post
Deliv. To Processors 70,000 0 50,000 0 0 55,000
Beginning Stocks 0 0 0 0 0 0
Production 7,000 0 5,000 0 0 5,000
Imports 3,000 0 4,000 0 0 4,000
Total Supply 10,000 0 9,000 0 0 9,000
Exports 4,000 0 3,000 0 0 2,900
Domestic
Consumption
6,000 0 6,000 0 0 6,100
Ending Stocks 0 0 0 0 0 0
Total Distribution 10,000 0 9,000 0 0 9,000
(MT) Source: PSD Tables and Post forecast
Export Procedures
Moroccan citrus exports are all handled by the private sector and are carried out by fully integrated
cooperatives of small farmers and private companies (Moroccan as well as joint ventures with
Europeans). In many cases, the exporting companies are advanced technologically and have shown
great ability to adapt to constantly changing production and control requirements and meet importers’
standards such as ISO standards, EUROPGAP, BRC-British Retail Consortium, and HACCP.
The non-EU markets, commonly known as “Contract Markets”, include Russia, Lithuania, Saudi
Arabia, Canada, and the U.S. In the past few years, these markets have accounted for over 65 percent of
Morocco’s total exports, up from an average of 40 percent until 2004. This shift is mostly due to a
greater focus on the Russian market. Annual arrangements for these markets are
typically made between importers and Moroccan exporters to ship agreed-upon quantities and quality of
fruits. These markets are mostly handled by the exporters’ boards (such as the Moroccan Fruit Board)
that coordinate export logistics between its members.
Page 14
Foreign Agricultural Service 14 | P a g e
All exported food and agricultural products are subject to quality control by the Ministry of
Agriculture’s Export Quality Control Office (known as EACCE, i.e. Etablissement Autonome de
Controle et de Coordination des Exportations). The EACCE ensures that the standards and the
requirements of the importing country are effectively met.
Recently, the EACCE, effective January 2016 will be the only organization responsible for promoting
Moroccan agricultural exports, and is planning to establish a permanent office in the Russian city of St.
Petersburg to provide assistance with product arrivals, pricing and labeling.
Policy
The citrus sector is among the most organized and well managed sectors in Morocco. Due to its impact
on foreign exchange revenues (about $350 million annually) and job creation in rural areas and the
economy in general, this sector has received a great deal of support from the Moroccan Green Plan. The
Moroccan government plans to continue support with an ambitious strategy to increase Morocco’s
citrus production to 2.9 million MT by 2018 and to allocate 200,000 MT of fresh citrus production
annually for juice processing by 2018 as well.
Subsidies and supports
The Moroccan government plans to continue supporting an ambitious strategy to increase Morocco’s
citrus production to 2.9 million MT by 2018. The Ministry of Agriculture decree (# 2-09-601) issued in
October 2009 increased the support payments for new citrus plantations to $1,197 per hectare, up from
$778 per hectare the two preceding years. In addition, there are other incentives that are not crop
specific such as digging wells and purchasing of irrigation equipment that are available to citrus
growers to establish new citrus orchards.
Table 15: Subsidies and Incentives Provided to the Citrus Sector
Activity Subsidy/incentive Comment
Aggregation Project centered
around conditioning station
150 dollar/hectare for the aggregation
project
Specific to citrus to encourage
aggregation project
Conditioning Station 10% of the cost of construction and
equipment, with a maximum of 474
thousand dollars
Specific to citrus. Subsidy
depends on global cost of the
conditioning station,
Digging new wells and
installing irrigation
equipment
100 percent of cost with a maximum
cumulated of 3,292 dollars (an additional
maximum of 1,795 dollar/hectare could
be added if a water basin is built).
Not specific to citrus.
Investment Premium for new
citrus plantation
1197 dollars/hectare when certified plants
are used.
Specific to fresh citrus.
Export promotion to diversify 20 dollars for each MT exported to Russia Specific to fresh citrus. Could
Page 15
Foreign Agricultural Service 15 | P a g e
export destinations (subsidy if
exported to non EU countries)
or incremental exports to other non-EU
destinations (use exports in My
2000/2001 as basis)
probably be phased out for
Russia as this market accounts
for almost 50 percent total
exports.
Export promotion to diversify
export destinations (subsidy
provided to exports to non
EU or Russian markets)
50 dollars/MT for exports outside the
Russian and EU markets, and exceeding
export levels for periods between
September 1, 2000 and August 31, 2001.
Specific to fresh citrus.
Source: MoA, ADA publication 2015.
ANNEX Figure 4: Orange Production Regions
Page 16
Foreign Agricultural Service 16 | P a g e
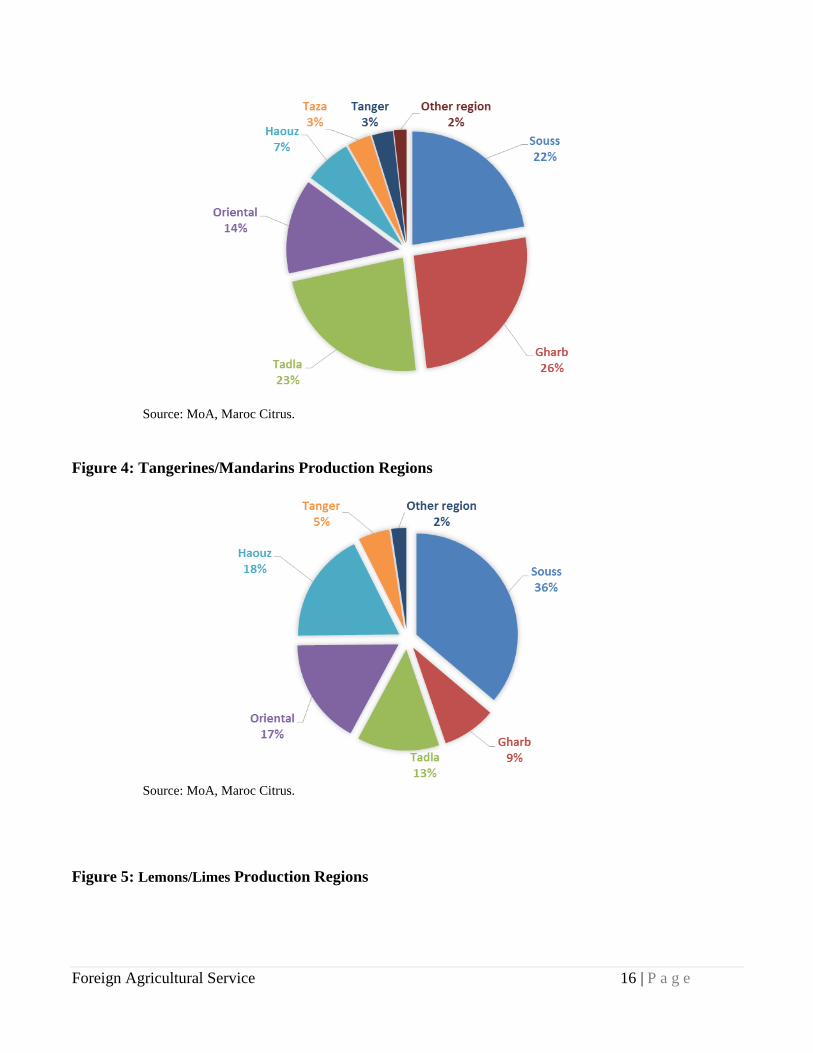
Source: MoA, Maroc Citrus.
Figure 4: Tangerines/Mandarins Production Regions
Source: MoA, Maroc Citrus.
Figure 5: Lemons/Limes Production Regions
Page 17
Foreign Agricultural Service 17 | P a g e
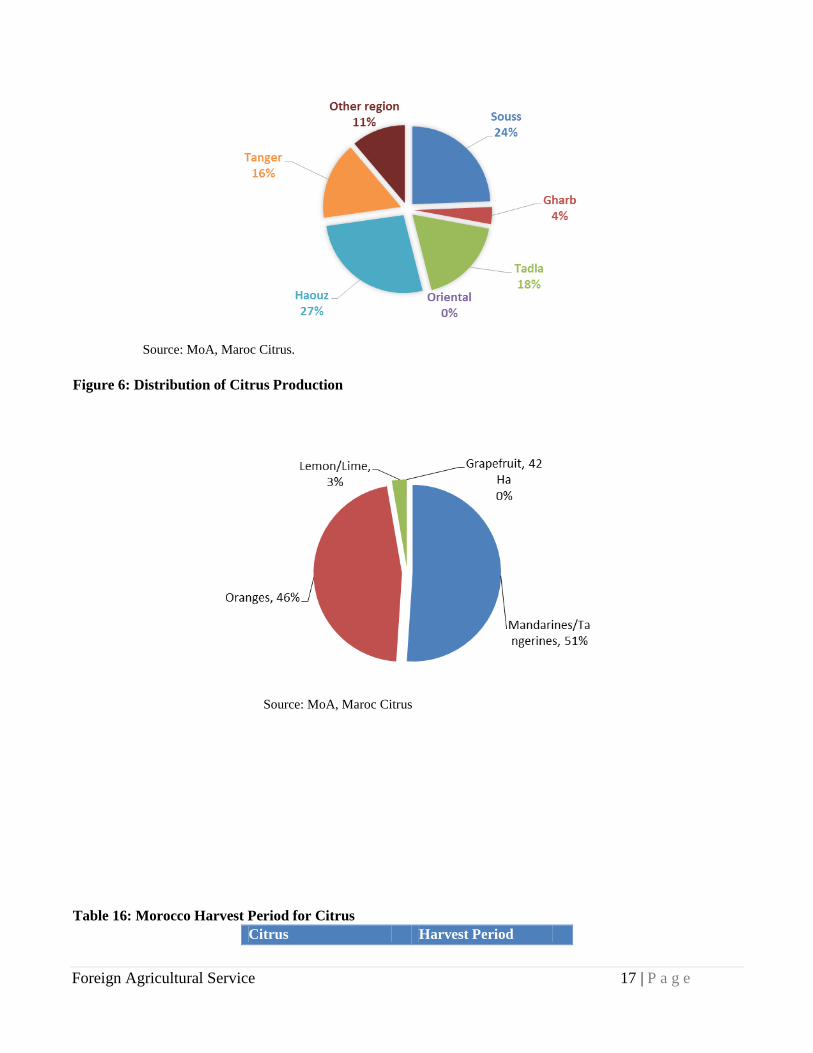
Source: MoA, Maroc Citrus.
Figure 6: Distribution of Citrus Production
Source: MoA, Maroc Citrus
Table 16: Morocco Harvest Period for Citrus
Citrus Harvest Period
Page 18
Foreign Agricultural Service 18 | P a g e
Mandarins/Tangerines
Clementine October - January
Nour December- January
Ortanique January- April
Nova November- December
Others(Nadorcott) November- December
Oranges
Navel December- January
Sanguine December- January
Maroc-Late March- June
Salustiana December- February
Source: MoA,
Table 17: Morocco's citrus exports schedule
Source: Maroc Citrus.