Morphometric and genetic structure of the edibledormouse (Glis glis): a consequence of forestfragmentation in Turkey
ZEYCAN HELVACI1,2*, SABRINA RENAUD3, RONAN LEDEVIN4,DOMINIQUE ADRIAENS5, JOHAN MICHAUX6,7, REYHAN ÇOLAK2,TEOMAN KANKILIÇ8, IRFAN KANDEMIR2, NURI YIGIT2 and ERCÜMENT ÇOLAK2
1Department of Biology, Faculty of Science and Letter, Aksaray University, Campus 68100, Aksaray,Turkey2Department of Biology, Faculty of Science, Ankara University, Tandogan Campus 06100, Ankara,Turkey3Laboratoire de Biométrie et Biologie Evolutive, UMR 5558, CNRS, University Lyon 1, Campus de laDoua 69622, Villeurbanne, France4Anthropologisches Institut & Museum, Universität Zürich-Irchel, Winterthurerstrasse 190, 8057Zürich, Switzerland5Evolutionary Morphology of Vertebrates, Ghent University, K.L. Ledeganckstraat 35, B-9000, Ghent,Belgium6Laboratoire de Génétique des micro-organismes, Université de Liège, Institut de Botanique (Bat. 22)4000 Liège, Belgium7INRA, UMR CBGP 1062, Campus international de Baillarguet, CS 30016, F-34988Montferrier-sur-Lez Cedex, France8Department of Biology, Faculty of Arts and Science, Nigde University, Campus 51240, Nigde,Turkey
Received 18 April 2012; revised 22 May 2012; accepted for publication 23 May 2012
Past climatic fluctuations influenced forest habitats and impacted heavily the distribution of forest species, suchas the edible dormouse, by changing the distribution and composition of forests themselves. Such effects may bevalid for ongoing climate change as well. To improve our understanding of the edible dormouse’s history and howit responded to changes in its environment, we investigated its variation across the understudied zone of NorthernTurkey using two complementary markers of differentiation: the mitochondrial cytochrome b gene for genetics, andsize and shape of the first upper molar for phenotypic differences. Genetic and morphometric results were stronglydiscrepant. Genetic analyses evidenced an amazing homogeneity throughout the Eurasian range of the edibledormouse, whereas morphometrics pointed to a complex, step-wise differentiation along the Black Sea coast, themain signal being an opposition between Easternmost and Westernmost Turkish dormice. The genetic homogeneitysuggests that this phenotypic differentiation is not the inheritance of glacial refuges, but the consequence of a morerecent post-glacial isolation. The transition between the European and Asian groups is located eastwards from theMarmara straits, undermining its claimed role as an efficient barrier but stressing the importance of climaticand vegetational factors. A secondary differentiation between populations from the Central Black Sea coast andEasternmost regions was evidenced, attributed to a complex interplay of climatic, topographic, anthropogenic, andecological factors. Turkey, at the crossroad of European and Asian species, heavily impacted by the current globalchange including climatic and anthropogenic factors, appears of importance for understanding the historical
Environmental conditions largely control the distri-bution of species, either through the direct impact ofabiotic parameters such as temperature or precipita-tion on metabolic properties, or by indirect effects onthe ecology of the animals, including changes in theirhabitat. Hence, past environmental changes contrib-uted to mould their current distribution and diversity.Focus is often put on the climatic oscillations associ-ated with the Quaternary glacial/interglacial cycles.Their impact was particularly important on forestspecies, as glacial periods were associated with anextension of open landscape, leading to the retractionof forest environments and the associated fauna ingeographically restricted areas, i.e. glacial refugia(e.g. Hewitt, 1996, 1999, 2000; Taberlet et al., 1998).More recent events associated with changes in forestdistribution such as historic and even prehistoricphases of deforestation (Kaplan et al., 2011; KleinGoldewijk et al., 2011) might have impacted forestspecies as well. Studying the distribution of forestspecies might thus shed precious light on howforest dwellers faced perturbations of their environ-ment at different time scales, providing relevant cluesabout the potential impact of the current globalchange on this kind of habitat, which is particularlyprone to disturbance and fragmentation.
The edible dormouse (Glis glis) is a relevant modelto tackle these questions, as this small mammalis strictly associated with the forest environment.Therefore, like the forests, it probably survived theQuaternary climatic cycles through important fluc-tuations in its distribution area, tracking changes inthe range of the forests themselves. Its relativelysedentary habits (Hönel, 1991; Morris, 1997) andits marked preference for deciduous woodlands(Kryštufek, 2010) could also make it prone to suffer asa result of recent forest fragmentation.
The aim of the present study is therefore to investi-gate if and how the edible dormouse differentiated instructured populations according to changes in itsforest habitat, with a focus on an understudied zone ofits distribution, namely throughout its Turkish range.This area is of interest for biogeographical studies forseveral reasons. First, at the time scale of Quaternaryclimatic fluctuations, the importance of eastern refuge
zones is increasingly being recognized (e.g. Michauxet al., 2004; Wielstra et al., 2010). The Balkanic refugezone has recently been studied (Deffontaine et al.,2005; Macholán et al., 2007), but the role of possiblerefuge areas in the Near and Middle East regionremains understudied due to a sampling bias in favourof European regions. Nevertheless, the Caucasus andits foothills close to the south-eastern coast of theBlack Sea deserves additional interest as a possiblerefuge zone for Eurasian species (Santucci, Emerson &Hewitt, 1998; Seddon et al., 2002; Wielstra et al.,2010). In this context, biogeographical studies throughTurkey are of key importance, because this area cor-responds to a potential crossroads of populationsexpanding eastwards from European refuges andwestward from Asian refuges. A second line of interestregarding this Turkish area is that today forest envi-ronments cover most of the Black Sea coast from theMarmara region to the foothills of the Caucasus, withsubtle variations throughout this apparent continuousdistribution. From west to east, climatic conditionsgrade from a Mediterranean to a more strongly sea-sonal Euro-Siberian climate (Güvenç, Öztürk & Oran,2009). Anthropogenic deforestation and local varia-tions in the precipitation regime (Sönmez et al., 2005)have caused local breaks in the forest, especially alongthe western Black Sea coast around Zonguldak(Fig. 1). This forest break is congruent with a breakin the current distribution of the edible dormouse(Kryštufek, 2010; Fig. 1) suggesting that forest frag-mentation might contribute to isolate populations ofthe species.
To investigate the population structure of the edibledormouse in this area of Turkey, two complementaryapproaches were combined. First, genetic analyseswere performed to insert the variation of Turkishdormice within the known framework of Europeanpopulations. Based on mitochondrial cytochrome bDNA, Europe as a whole appeared to be characterizedby very low genetic diversity, with only a few endemiclineages occurring in the Italian peninsula (Hürneret al., 2010; Lo Brutto, Sara & Arculeo, 2011). Theexistence of a refuge zone in the foothills of Caucasuswould be supported by evidence of a differentiatedlineage in the eastern part of the Turkish range, azone that was not thus far been documented. Thisgenetic approach was completed by a study of the
phenotypic variation based on an extensive samplingthroughout the Turkish range.
Morphological characters can be markers of intra-specific biogeographical structure, because they candiverge due to neutral genetic divergence amongisolated lineages, and/or as an adaptive response toenvironmental conditions (Thorpe, 1987; Fadda &Corti, 2001; Cardini, 2003; Monteiro, Duarte & dosReis, 2003; Renaud, Chevret & Michaux, 2007; Def-fontaine et al., 2009; Ledevin et al., 2010). Amongpossible morphological features, teeth have been sug-gested to provide good markers of the populationstructure even over short time scales (Renaud, 2005;Renaud & Michaux, 2007) because they are not proneto plastic variations such as in bone features likemandibles (Renaud & Auffray, 2010). The first uppermolar (UM1) was selected for morphometric studies
because this tooth appeared to deliver valuablephyletic information in diverse glirids (e.g. Pavlinov,2001) and many other rodents (e.g. Misonne, 1969;Michaux, 1971; Leamy & Sustarsic, 1978; Renaud,2005; Renaud et al., 2005; Macholán, 2006). Its sizeand shape variations were quantified through a mor-phometric analysis of the tooth outline, a characterand an approach that has been shown to be veryefficient at describing subtle geographical variationsin rodents (Renaud, 1999; Renaud & Michaux, 2007).
MATERIAL AND METHODSMATERIAL
The present study is based on the collection of edibledormice (Glis glis) from the Laboratory for Systematicof Vertebrate Animals (Ankara University, Turkey).
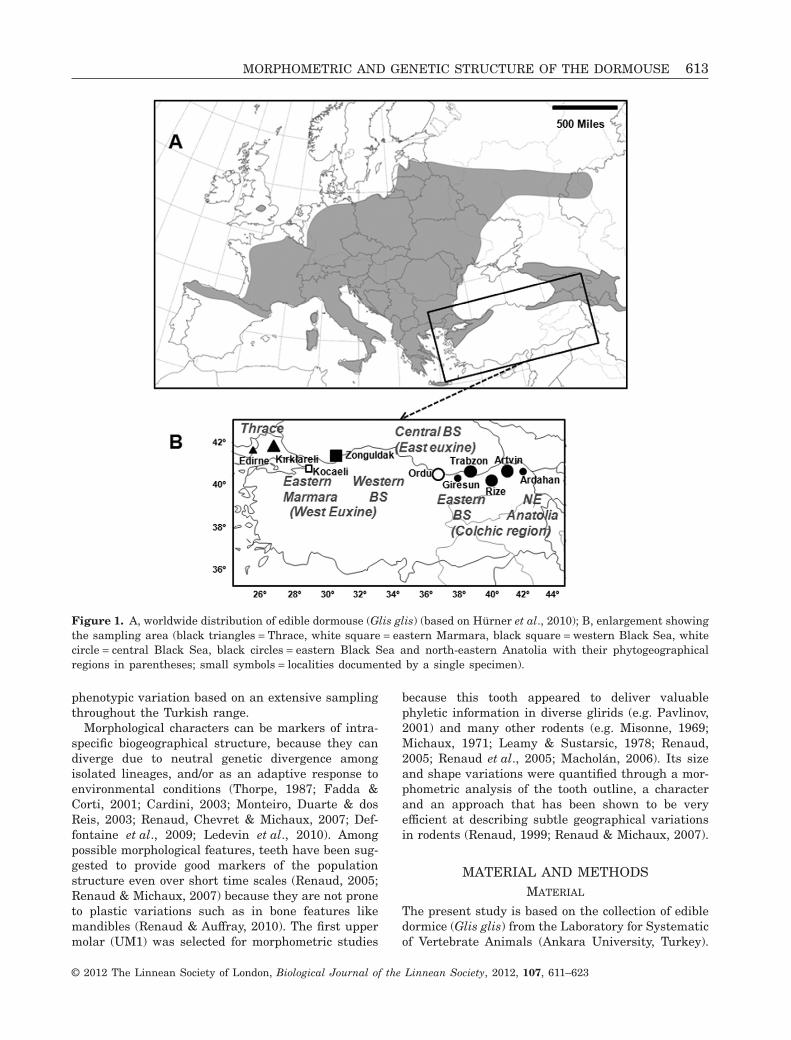
Figure 1. A, worldwide distribution of edible dormouse (Glis glis) (based on Hürner et al., 2010); B, enlargement showingthe sampling area (black triangles = Thrace, white square = eastern Marmara, black square = western Black Sea, whitecircle = central Black Sea, black circles = eastern Black Sea and north-eastern Anatolia with their phytogeographicalregions in parentheses; small symbols = localities documented by a single specimen).
MORPHOMETRIC AND GENETIC STRUCTURE OF THE DORMOUSE 613
The animals were trapped between 1991 and 2008 indifferent localities from the Thrace, Marmara regionand a broad longitudinal coverage along the BlackSea coast (Fig. 1B), using wooden live-traps or pickedup directly from hollow trees. The sampling locationsare scattered along a thin coastal strip roughly cor-responding to the extension of the eco-region knownas ‘Euxine-Colchic’ deciduous forest, ranging inTurkey from the south-eastern Bulgarian border tothe west to Georgia to the east. Localities can begrouped into six geographical areas: (1) Thrace on theEuropean continent, west of the Marmara Sea; (2)eastern Marmara region; (3) western Black Sea coast,ending to the east of Zonguldak; (4) central Black Searegion, up to the Melet River just eastward of Ordu;(5) the eastern Black Sea coast; and (6) north-eastAnatolia, corresponding to inland locations close tothe Caucasus foothills (Artvin, Ardahan).
These areas in turn correspond to three localeco-regions: (i) Thrace (1) and the neighbouring WestEuxine region, including eastern Marmara (2) andwestern Black Sea coast (3), all corresponding toareas of dry Euxinic(-like) forests, tending to supporta high diversity of tree species; (ii) East Euxine,roughly corresponding to the central Black Sea coast(4) and including slightly humid Euxine areas locatedwest of the Melet river; and (iii) Colchic zone, includ-ing all eastern localities (5 and 6) and correspondingto humid areas with old-growth forest with low treespecies diversity.
Genetic analyses were performed on 14 specimensfrom Kırklareli (Thrace: N = 4), Kocaeli (easternMarmara: East Euxine zone, N = 1), Zonguldak(western Black Sea: West Euxine zone, N = 2), Ordu(central Black Sea, N = 2), Trabzon (eastern BlackSea: Colchic zone, N = 1), Rize (eastern Black Sea:Colchic zone, N = 2), and Artvin (eastern Black Sea:Colchic zone, N = 1). These specimens were comparedwith animals already analysed in previous studies(see Hürner et al., 2010) to check the genetic relation-ship between European and Turkish edible dormicepopulations. Sixteen mitochondrial cytochrome b(cyt-b) haplotype sequences were downloaded fromthe GenBank database and were used for the geneticanalyses (accession numbers: FM160651–FM160665,FM160733, and FM160734). These haplotypes corre-sponded to 130 G. glis specimens from differentEuropean regions: Spain, France, Belgium, Italy,Sicily, Germany, Slovania, Russia, Great Britain,Switzerland, Macedonia, Montenegro, Czech Repub-lic, Bosnia–Herzegovina, Croatia, and Lettony.
For morphometric analyses, skulls of the specimenswere prepared as museum material. The UM1 of 51specimens was measured (Table 1). All animals couldbe considered as adult based on the fact that allmolars were erupted.
METHODS
Genetic analysesThe mitochontrial cyt-b gene was amplified usingspecific primers designed for Glis glis (Hürner et al.,2010). MODELTEST 3.0 (Posada & Crandall, 1998)was used to determine the most suitable model ofDNA substitution for the cyt-b data set studied. Phy-logenetic reconstructions were performed using themaximum-likelihood criterion (ML; Felsenstein, 1981)implemented in PHYML (Guindon & Gascuel, 2003).Phylogenetic trees were rooted with cyt-b sequencesfrom one specimen of the garden dormouse (Eliomysquercinus) and one specimen of the hazel dormouse(Muscardinus avellanarius) as suggested by Hürneret al. (2010). The robustness of the tree was assessedbased on bootstrap support (BS) (1000 randompseudoreplicates).
Morphometric analysis
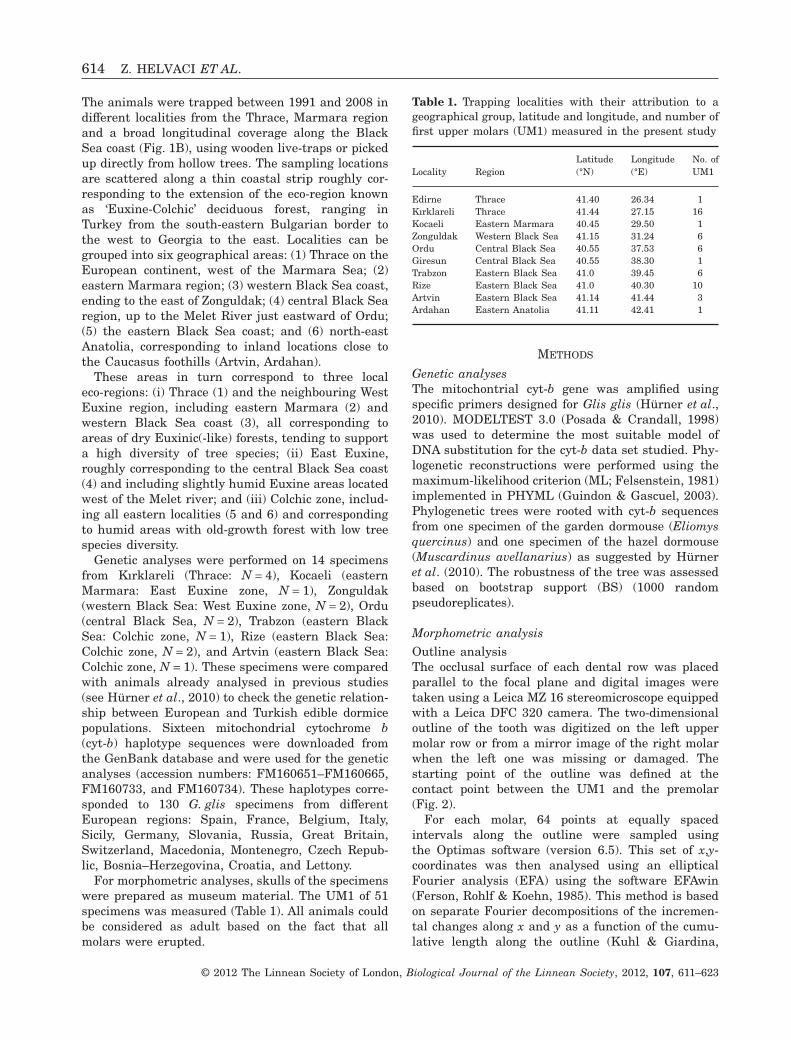
Outline analysisThe occlusal surface of each dental row was placedparallel to the focal plane and digital images weretaken using a Leica MZ 16 stereomicroscope equippedwith a Leica DFC 320 camera. The two-dimensionaloutline of the tooth was digitized on the left uppermolar row or from a mirror image of the right molarwhen the left one was missing or damaged. Thestarting point of the outline was defined at thecontact point between the UM1 and the premolar(Fig. 2).
For each molar, 64 points at equally spacedintervals along the outline were sampled usingthe Optimas software (version 6.5). This set of x,y-coordinates was then analysed using an ellipticalFourier analysis (EFA) using the software EFAwin(Ferson, Rohlf & Koehn, 1985). This method is basedon separate Fourier decompositions of the incremen-tal changes along x and y as a function of the cumu-lative length along the outline (Kuhl & Giardina,
Table 1. Trapping localities with their attribution to ageographical group, latitude and longitude, and number offirst upper molars (UM1) measured in the present study
Locality RegionLatitude(°N)
Longitude(°E)
No. ofUM1
Edirne Thrace 41.40 26.34 1Kırklareli Thrace 41.44 27.15 16Kocaeli Eastern Marmara 40.45 29.50 1Zonguldak Western Black Sea 41.15 31.24 6Ordu Central Black Sea 40.55 37.53 6Giresun Central Black Sea 40.55 38.30 1Trabzon Eastern Black Sea 41.0 39.45 6Rize Eastern Black Sea 41.0 40.30 10Artvin Eastern Black Sea 41.14 41.44 3Ardahan Eastern Anatolia 41.11 42.41 1
1982). The outline is approximated by a sum of trigo-nometric functions of decreasing wavelength: theharmonics. Each harmonic is then defined by fourcoefficients: An and Bn for x, and Cn and Dn for y,defining an ellipse in the x–y plane.
The first harmonic corresponds to the best-fittingellipse to the outline. Its major axis was taken as thenew x-axis to adjust the orientation of the outline(Rohlf, 1990). Its area was used to standardize theFourier coefficients (FCs) for size differences to elimi-nate isometric size effects and to concentrate on shapeinformation only.
As the coefficients A1, B1, and C1 correspond toresiduals after standardization (Crampton, 1995;Renaud et al., 1996) they were not included in thesubsequent statistical analysis. The coefficient D1
still retains information about the elongation of theoutline (Michaux, Chevret & Renaud, 2007). It wasthus included in the statistical analyses.
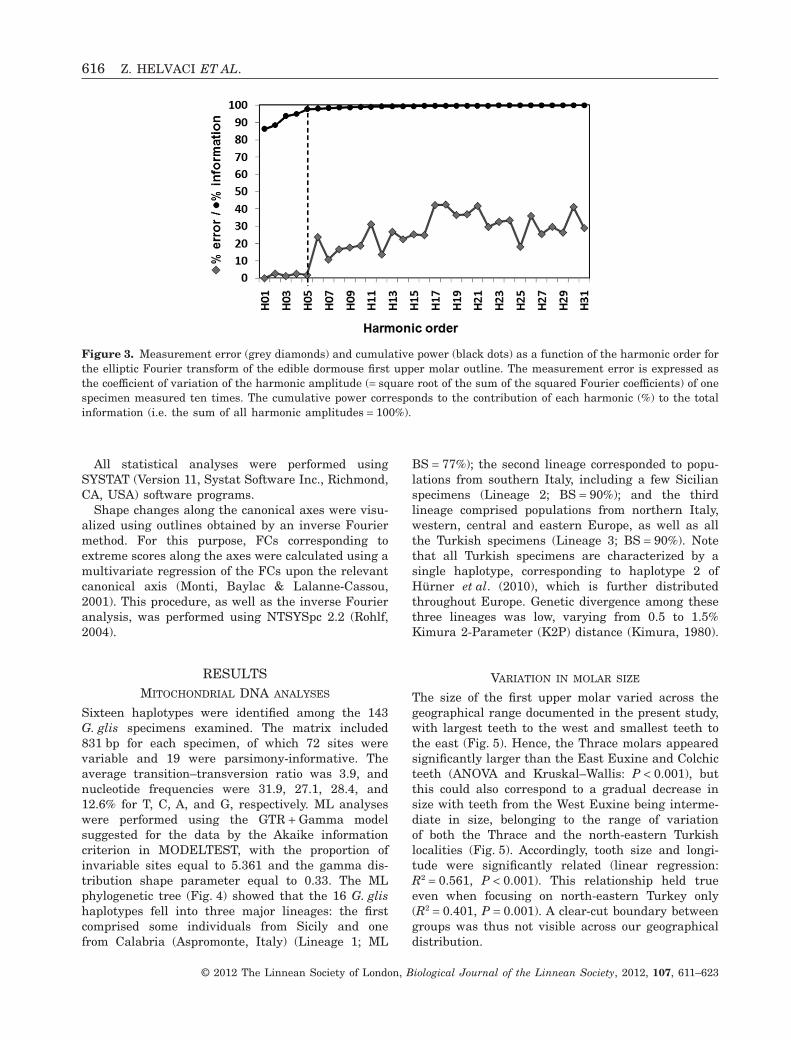
Using a Fourier analysis, the higher the rank of theharmonic, the more detailed is the description of theoutline. The number of harmonics selected for subse-quent statistical analyses should take into accountthe level of measurement error occurring during dataacquisition and the information content of each har-monic. To evaluate the adequate threshold harmonicfor analysis of dormouse teeth, the shape of one UM1was measured ten times, providing an estimate of themeasurement error for each harmonic (Fig. 3). Meas-urement error was estimated as the percentage oferror for the amplitude of each harmonic (square root
of the sum of the squared FCs An, Bn, Cn, and Dn). Inthe case of a dormouse tooth, measurement error waslow (< 5%) until the fifth harmonic and abruptlyincreased thereafter (Fig. 3).
The information content of each harmonic was esti-mated as follows. The amplitudes of the harmonicswere cumulated over the total range of harmonics,and the information brought by each harmonic wasthen estimated as the percentage of this sum repre-sented by this harmonic (Crampton, 1995). Each ofthe five first harmonics significantly increased theamount of shape information up to 97% of the totalinformation (Fig. 3). A plateau was then reached,showing that the subsequent harmonics providedalmost no further relevant shape information.
Hence, the set of the first five harmonics appearedto provide a good compromise between measurementerror, information content, and the number of vari-ables to be considered. A data set of 17 variables (20FCs minus A1, B1, and C1) was thus retained forsubsequent analyses.
A visualization of shape differences between UM1was provided by the reconstruction of outlines usingthe inverse Fourier method (Rohlf & Archie, 1984).
Statistical analysesThe size of UM1 was estimated from the squareroot of its two-dimensional outline area to avoid amagnification of any size difference due to quadraticeffects, an area being of squared linear dimension.Differences between regions or between localitieswere tested using analyses of variance (ANOVA)completed with a non-parametric test (Kruskal–Wallis). A possible relationship with longitude wasinvestigated using a linear regression.
Multivariate analyses were used to investigate pat-terns of shape differences. Multivariate analyses ofvariance (MANOVA, test considered: Wilks’ lambda)were performed on the set of 17 FCs to test fordifferences between the end-members of the Turkishdistribution (Thrace vs. East Euxine and Colchicregions). These geographical end-members were usedas the reference data set to investigate the affinities ofthe West Euxine specimens as well as single specimensfrom four localities (Edirne, Kocaeli, Giresun, andArdahan).
A canonical analysis was uses to further investigatethe relationships between localities to address thepatterns of geographical differentiation independentlyof any a priori definitions of geographical zones. Thisanalysis provided canonical shape axes on whichpatterns of among-group differentiation were repre-sented. Localities sampled by a single specimen(Edirne, Kocaeli, Giresun, and Ardahan) were notincluded in the computation but added as supplemen-tary specimens.
Figure 2. Upper molar row of edible dormouse in occlusalview. The studied outline is superimposed on the firstupper molar (UM1), with the starting point (black dot) atthe meeting point between the premolar and the UM1.Lingual side to the left, anterior part to the top.
MORPHOMETRIC AND GENETIC STRUCTURE OF THE DORMOUSE 615
All statistical analyses were performed usingSYSTAT (Version 11, Systat Software Inc., Richmond,CA, USA) software programs.
Shape changes along the canonical axes were visu-alized using outlines obtained by an inverse Fouriermethod. For this purpose, FCs corresponding toextreme scores along the axes were calculated using amultivariate regression of the FCs upon the relevantcanonical axis (Monti, Baylac & Lalanne-Cassou,2001). This procedure, as well as the inverse Fourieranalysis, was performed using NTSYSpc 2.2 (Rohlf,2004).
RESULTSMITOCHONDRIAL DNA ANALYSES
Sixteen haplotypes were identified among the 143G. glis specimens examined. The matrix included831 bp for each specimen, of which 72 sites werevariable and 19 were parsimony-informative. Theaverage transition–transversion ratio was 3.9, andnucleotide frequencies were 31.9, 27.1, 28.4, and12.6% for T, C, A, and G, respectively. ML analyseswere performed using the GTR + Gamma modelsuggested for the data by the Akaike informationcriterion in MODELTEST, with the proportion ofinvariable sites equal to 5.361 and the gamma dis-tribution shape parameter equal to 0.33. The MLphylogenetic tree (Fig. 4) showed that the 16 G. glishaplotypes fell into three major lineages: the firstcomprised some individuals from Sicily and onefrom Calabria (Aspromonte, Italy) (Lineage 1; ML
BS = 77%); the second lineage corresponded to popu-lations from southern Italy, including a few Sicilianspecimens (Lineage 2; BS = 90%); and the thirdlineage comprised populations from northern Italy,western, central and eastern Europe, as well as allthe Turkish specimens (Lineage 3; BS = 90%). Notethat all Turkish specimens are characterized by asingle haplotype, corresponding to haplotype 2 ofHürner et al. (2010), which is further distributedthroughout Europe. Genetic divergence among thesethree lineages was low, varying from 0.5 to 1.5%Kimura 2-Parameter (K2P) distance (Kimura, 1980).
VARIATION IN MOLAR SIZE
The size of the first upper molar varied across thegeographical range documented in the present study,with largest teeth to the west and smallest teeth tothe east (Fig. 5). Hence, the Thrace molars appearedsignificantly larger than the East Euxine and Colchicteeth (ANOVA and Kruskal–Wallis: P < 0.001), butthis could also correspond to a gradual decrease insize with teeth from the West Euxine being interme-diate in size, belonging to the range of variationof both the Thrace and the north-eastern Turkishlocalities (Fig. 5). Accordingly, tooth size and longi-tude were significantly related (linear regression:R2 = 0.561, P < 0.001). This relationship held trueeven when focusing on north-eastern Turkey only(R2 = 0.401, P = 0.001). A clear-cut boundary betweengroups was thus not visible across our geographicaldistribution.
Figure 3. Measurement error (grey diamonds) and cumulative power (black dots) as a function of the harmonic order forthe elliptic Fourier transform of the edible dormouse first upper molar outline. The measurement error is expressed asthe coefficient of variation of the harmonic amplitude (= square root of the sum of the squared Fourier coefficients) of onespecimen measured ten times. The cumulative power corresponds to the contribution of each harmonic (%) to the totalinformation (i.e. the sum of all harmonic amplitudes = 100%).
The two groups constituted by dormice from Thracevs. north-eastern Turkey (East Euxine and Colchicregions) differed significantly in molar shape(MANOVA: P = 0.0040). This differentiation between
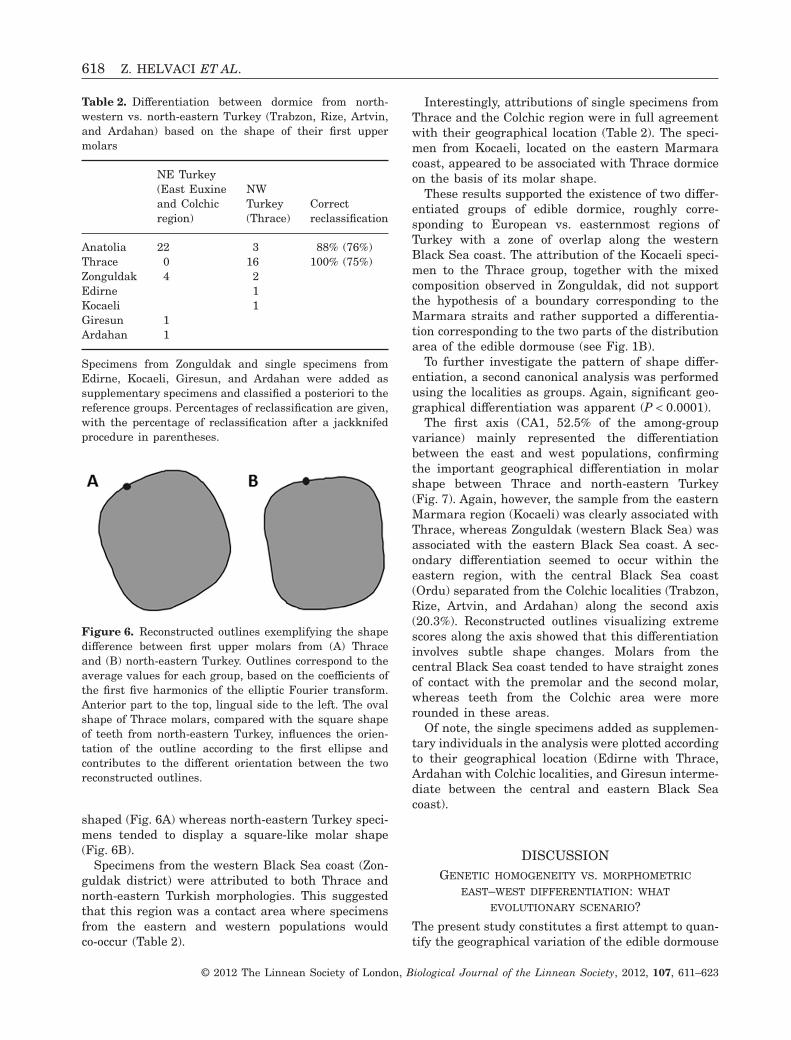
the two groups led to a good percentage (> 80%)of reclassification of the original groups (Table 2),although jack-knifed reclassification was not as goodand suggested an overlap between the two groups. Aninverse elliptic Fourier transform allowed us to visu-alize differences in UM1 shape between the twogroups. Thrace teeth were more diamond- to oval-
Figure 4. Maximum-likelihood tree for the 16 haplotypes identified in edible dormouse (Glis glis). Localities where thehaplotypes were found are given on the right of the tree. Numbers at nodes indicate maximum-likelihood bootstrap valuesgreater than 50%. Maximum likelihood distance for the scale bar.
Figure 5. Distribution of the first upper molar (UM1) size, estimated by the square root of the tooth outline area, of dormicein the different localities along the northern part of Turkey, plotted as a function of longitude. Each dot represents one tooth.
MORPHOMETRIC AND GENETIC STRUCTURE OF THE DORMOUSE 617
shaped (Fig. 6A) whereas north-eastern Turkey speci-mens tended to display a square-like molar shape(Fig. 6B).
Specimens from the western Black Sea coast (Zon-guldak district) were attributed to both Thrace andnorth-eastern Turkish morphologies. This suggestedthat this region was a contact area where specimensfrom the eastern and western populations wouldco-occur (Table 2).
Interestingly, attributions of single specimens fromThrace and the Colchic region were in full agreementwith their geographical location (Table 2). The speci-men from Kocaeli, located on the eastern Marmaracoast, appeared to be associated with Thrace dormiceon the basis of its molar shape.
These results supported the existence of two differ-entiated groups of edible dormice, roughly corre-sponding to European vs. easternmost regions ofTurkey with a zone of overlap along the westernBlack Sea coast. The attribution of the Kocaeli speci-men to the Thrace group, together with the mixedcomposition observed in Zonguldak, did not supportthe hypothesis of a boundary corresponding to theMarmara straits and rather supported a differentia-tion corresponding to the two parts of the distributionarea of the edible dormouse (see Fig. 1B).
To further investigate the pattern of shape differ-entiation, a second canonical analysis was performedusing the localities as groups. Again, significant geo-graphical differentiation was apparent (P < 0.0001).
The first axis (CA1, 52.5% of the among-groupvariance) mainly represented the differentiationbetween the east and west populations, confirmingthe important geographical differentiation in molarshape between Thrace and north-eastern Turkey(Fig. 7). Again, however, the sample from the easternMarmara region (Kocaeli) was clearly associated withThrace, whereas Zonguldak (western Black Sea) wasassociated with the eastern Black Sea coast. A sec-ondary differentiation seemed to occur within theeastern region, with the central Black Sea coast(Ordu) separated from the Colchic localities (Trabzon,Rize, Artvin, and Ardahan) along the second axis(20.3%). Reconstructed outlines visualizing extremescores along the axis showed that this differentiationinvolves subtle shape changes. Molars from thecentral Black Sea coast tended to have straight zonesof contact with the premolar and the second molar,whereas teeth from the Colchic area were morerounded in these areas.
Of note, the single specimens added as supplemen-tary individuals in the analysis were plotted accordingto their geographical location (Edirne with Thrace,Ardahan with Colchic localities, and Giresun interme-diate between the central and eastern Black Seacoast).
DISCUSSIONGENETIC HOMOGENEITY VS. MORPHOMETRIC
EAST–WEST DIFFERENTIATION: WHAT
EVOLUTIONARY SCENARIO?
The present study constitutes a first attempt to quan-tify the geographical variation of the edible dormouse
Table 2. Differentiation between dormice from north-western vs. north-eastern Turkey (Trabzon, Rize, Artvin,and Ardahan) based on the shape of their first uppermolars
Specimens from Zonguldak and single specimens fromEdirne, Kocaeli, Giresun, and Ardahan were added assupplementary specimens and classified a posteriori to thereference groups. Percentages of reclassification are given,with the percentage of reclassification after a jackknifedprocedure in parentheses.
Figure 6. Reconstructed outlines exemplifying the shapedifference between first upper molars from (A) Thraceand (B) north-eastern Turkey. Outlines correspond to theaverage values for each group, based on the coefficients ofthe first five harmonics of the elliptic Fourier transform.Anterior part to the top, lingual side to the left. The ovalshape of Thrace molars, compared with the square shapeof teeth from north-eastern Turkey, influences the orien-tation of the outline according to the first ellipse andcontributes to the different orientation between the tworeconstructed outlines.
in an underdocumented zone of its distribution area,namely the northern part of Turkey, which may be ofconsiderable biogeographical importance in docu-menting the contact between European and Asiaticpopulations of Eurasian species. In this regard, con-flicting evidence was provided by genetic and morpho-metric analyses. Molar size and shape suggesteda complex geographical structure of the Turkishdormice populations, with a primary differentiationopposing European (Thrace) and north-easternTurkey (Colchic region) populations, in agreementwith recent genetic analyses based on fast evolvingmarkers of intra-specific differentiation [randomamplification of polymorphic DNAs (RAPDs), Selçuket al., 2012]. In contrast, analysis of the mitochondrialcyt-b gene revealed a surprising homogeneity not onlywithin the Turkish range of the edible dormouse, butalso of the Turkish dormice when compared with thewhole of Europe.
The strong east–west morphological differentiationsuggested at first glance an ancient separationbetween the populations, allowing the accumulationof significant phenotypic differences as the pas-sive consequence of isolation. A long-term isolationbetween Asian and European populations during thesuccessive glacial–interglacial cycles appeared to be aplausible hypothesis. The eastern Black Sea coast
towards the foothills of the Caucasus increasinglyseems a possible refuge zone for European species(Santucci et al., 1998; Seddon et al., 2002; Wielstraet al., 2010). Indeed, it seems likely that forest habi-tats persisted there during glacial phases (Svenning,Normand & Kageyama, 2008; Tarkhnishvili,Gavashelishvili & Mumladze, 2012), including treespecies such as the sweet chestnut (Castanea sativa)(Krebs et al., 2004) on which the edible dormouseheavily relies for food and shelter, making the zone apossible glacial refuge for this species.
This interpretation is, however, undermined by thegenetic homogeneity observed throughout the Euro-pean and Turkish range of the edible dormouse basedon the mitochondrial cyt-b gene, and interpreted as aresult of a post-glacial expansion from a single refugeprobably located in the Italian peninsula (Hürneret al., 2010). This suggests that despite the appar-ently high chance of survival in other refuges (Ibericpeninsula, Balkan, as well as eastern Black Seacoast), the edible dormouse went extinct there duringthe glacial maxima, possibly due to its overall lowabundance making the risk of random extinctionquite high. The existence of adequate habitats wouldhave allowed a fast post-glacial recolonization, asevidenced by the reappearance of the dormouse in thefossil record soon after the end of the last glacial
Figure 7. Shape variation of the first upper molar (UM1) within the edible dormouse in Turkey, displayed on the firsttwo axes of a canonical analysis on the Fourier coefficients. The grouping variable corresponds to the localities of trapping.Each symbol corresponds to the mean of one locality. Single specimens are indicated by small symbols. Reconstructedoutlines show the shape changes along the canonical axes. They correspond to extreme scores (CA1 = ±2 and CA2 = ±2).
MORPHOMETRIC AND GENETIC STRUCTURE OF THE DORMOUSE 619
maximum (e.g. Cuenca-Bescós et al., 2009). Yet, thisinterpretation also means that the phenotypic andRAPDs genetic differentiation took place in an evolu-tionary quite short time span of less than around10 000 years.
A COMPLEX BOUNDARY BETWEEN EUROPEAN
AND ASIAN POPULATIONS
For many European species, including the edible dor-mouse, Turkey appears at the crossroads of popula-tions from western and eastern areas. Yet, dependingon the species, the location of the area where easternand western lineages meet varies, either correspond-ing to the Marmara straits or eastwards along theBlack Sea coast. A range of species document each ofthe cases: European and Asiatic lineages meet at theMarmara straits in hedgehogs (Seddon et al., 2002)and yellow-necked field mice (Michaux et al., 2004) butslightly eastwards for newts (Wielstra et al., 2010),turtles (Fritz et al., 2008), free-living mice (Macholánet al., 2007), and wood mice (Michaux et al., 2003).Regarding the edible dormouse, the first descriptionof a differentiation between European and Asiaticgroups, identified as subspecies (G. glis pindicus inThrace and G. g. orientalis in Anatolia) proposed aboundary corresponding to the Marmara straits (Dog-ramacı & Tez, 1991). Yet, that study included nosample between the Marmara strait and the region ofZonguldak, hindering a precise location of the bound-ary between the two groups. The present results, incontrast, suggest that the boundary between Europeanand Asiatic dormice is located eastwards of theMarmara straits, and probably corresponds to therecorded break in the distribution area of the edibledormouse (Kryštufek & Vohralík, 2005). Again, mor-phometric results are in agreement with genetic databased on fast evolving markers, clustering Zonguldakwith Thrace (Selçuk et al., 2012).
The various locations of the contact zone betweenEuropean and Asiatic lineages depending on thespecies considered point to the complexity of thefactors involved. The Marmara strait, as a watermass, constitutes an intuitive geographical barrier forterrestrial species. Yet, being shallow, it became dryduring most glacial periods and hence did not consti-tute a permanent barrier (Demirsoy, 2008). Further-more, its limited width might allow easy crossing bya species with good swimming ability such as theedible dormouse (Kryštufek, 2010).
Other factors thus need to be invoked to explaina contact zone located eastward of the Marmarastrait, along the north-western coast of the BlackSea. Climatic variations might be involved, asthis region corresponds to the transition between aMediterranean-like and a Euro-Siberian climate
(Güvenç et al., 2009), with a dry segment betweenZonguldak and Ordu where forest vegetation is scarce(Tarkhnishvili et al., 2012). Apart from a possibleimpact on the ecology and thermoregulation of theedible dormouse, this climatic transition impacts thevegetation (e.g. Fang & Lechowicz, 2006). This veg-etational factor may be crucial for an animal that ishighly dependent for food and shelter on maturedeciduous woodland with mast seeding trees, particu-larly beeches (Fagus sp.), oaks (Quercus sp.), and thesweet chestnut. Isolation between edible dormousepopulations may have been further promoted byanthropogenic deforestation, increasing in Anatoliaover historical times (e.g. Mayer & Aksoy, 1986;Atalay, 1992; Çolak & Rotherham, 2006).
These hypotheses are not mutually exclusive andpoint to the fact that focusing on putative precisegeographical barriers such as the Marmara straitsmay be a simplification of a more subtle reality inte-grating diverse aspects of the animal’s ecology.
COMPLEX ECOLOGICAL CONTROL FOR A STEP-WISE
DIFFERENTIATION ALONG THE BLACK SEA COAST?
Beyond the main differentiation between Europeanand Asian dormice, our results evidenced a furthergeographical differentiation along the Black Seacoast, separating dormice from the central Black Seacoast (Ordu) from those located eastwards (Trabzon,Rize, Artvin, Ardahan), in agreement with the differ-entiation observed based on fast evolving geneticmarkers (Selçuk et al., 2012). This differentiation cor-responds to a rather progressive change in tooth sizeand a step-wise differentiation for tooth shape; it isnot reflected in the differentiation of the mitochon-drial cyt-b gene, suggesting a three-fold processleading to the present pattern of differentiation:(1) post-glacial recolonization from a single refuge,explaining the homogeneity of the cyt-b gene; (2)isolation of west and east populations; (3) furtherisolation of East Euxine vs. Colchic populations.Factors driving this differentiation might again mixecological, vegetational, and climatic aspects. Fromthe west to the east of the Black Sea coast, theEuro-Siberian climate gradually increases in season-ality (Akman, 1995, 2011), a factor that may explainthe gradual change in tooth size of the edible dor-mouse and favour a differentiation in tooth shape.Furthermore, a fragmentation in the distributionof beeches and chestnuts is recorded between theOrdu and Trabzon regions (Esen, 2000; Maurer &Fernández-López, 2001; Aydınözü, 2008) that may bedue to a combination of anthropogenic fragmentation,climatic, and topographic factors. All these factorsmay contribute to hinder gene flow from east to westfor dormice just as for trees.
Of note, the two areas where a differentiationoccurred (western Black Sea coast around Zonguldakand transition between Euxine and Colchic regionsaround Giresun) both correspond to areas where risksof drought increase even close to the Black Sea coast(Sönmez et al., 2005). Drought years in forest envi-ronments are likely to negatively impact mast pro-duction (Pérez-Ramos et al., 2010). Periods of foodshortage may lead edible dormice to postpone repro-duction (Schlund, Scharfe & Ganzhorn, 2002; Bieber& Ruf, 2009). Areas of higher drought vulnerabilitymight thus be unfavourable to persistent dormicepopulations despite apparently favourable conditions.
In conclusion, a combination of ecological and cli-matic factors probably reduced gene flow betweenpopulations after recolonization from a single refuge.This recent fragmentation triggered the accumulationof neutral genetic divergence (Selçuk et al., 2012) andconcomitant phenotypic differentiation. However, westill lack data to further interpret this morphologicaldifferentiation in tooth size and shape: it could haveaccumulated by neutral genetic divergence; and anadaptive component to the different environmentsmight have further accelerated morphological evolu-tion (Renaud et al., 2007) especially as reduced geneflow may help populations to track their local adap-tive optimum (Lenormand, 2002).
Such an intricate interplay of ecological factorsmight also have contributed to the extinction of theedible dormouse in apparently suitable refuge areasduring glacial periods. It might also represent acurrent underestimated threat to this rare species asglobal climate change is increasing drought in Medi-terranean regions, thus impacting forest trees andthe associated fauna.
ACKNOWLEDGEMENTS
We thank Prof. Dr Engin Ünay, Associate Prof. SakirÖzkurt, Res. Asst. Güliz Yavuz and two anonymousreviewers who provided valuable comments at earlierpoints in the study. The Council of Higher Educationin Turkey (YÖK) supported Z.H. by a scholarship tovisit the University of Lyon. This study was partiallyfunded by TÜBITAK (105T068).
REFERENCES
Akman Y. 1995. Türkiye orman vejetasyonu. Ankara: AnkaraÜniversitesi Fen Fakültesi, Botanik Anabilim Dalı.
Akman Y. 2011. Iklim ve Biyoiklim. Ankara: PalmeYayıncılık.
Atalay I. 1992. Kayın Ormanlarının Ekolojisi ve TohumTransferi Açısından Bölgelere Ayrımı. The ecology of beech(Fagus orientalis Lipsky) forests and their regioning in
terms of seed transfer. The Improvement Institute of ForestTrees and Seeds, Forest Ministry 5: 54–59.
Aydınözü D. 2008. Avrupa Kayını (Fagus sylvatica)’nın Yıldız(Istranca) Daglarındaki Yayılıs Alanları. Istanbul Üniversi-tesi, Edebiyat Fakültesi Cografya Bölümü, Cografya Dergisi17: 46–56.
Bieber C, Ruf T. 2009. Habitat differences affect life historytactics of a pulsed resource consumer, the edible dormouse(Glis glis). Population Ecology 51: 481–492.
Cardini A. 2003. The geometry of the marmot (Rodentia:Sciuridae) mandible: phylogeny and patterns of morphologi-cal evolution. Systematic Biology 52: 186–205.
Çolak AH, Rotherham ID. 2006. A review of the forestvegetation of Turkey: its status past and present and itsfuture conservation. Biology and Environment: Proceedingsof the Royal Irish Academy 106B: 343–354.
Crampton JS. 1995. Elliptic Fourier shape analysis of fossilbivalves: some practical considerations. Lethaia 28: 179–186.
Cuenca-Bescós G, Straus LG, González Morales MR,García Pimienta JC. 2009. The reconstruction of pastenvironments through small mammals: from the Moust-erian to the Bronze Age in El Mirón Cave (Cantabria,Spain). Journal of Archaeological Science 36: 947–955.
Deffontaine V, Ledevin R, Fontaine MC, Quéré J-P,Renaud S, Libois R, Michaux JR. 2009. A relict bankvole lineage highlights the biogeographic history of thePyrenean region in Europe. Molecular Ecology 18: 2489–2502.
Deffontaine V, Libois R, Kotlik P, Sommer R, Nieberd-ing C, Paradis E, Searle JB, Michaux JR. 2005. Beyondthe Mediterranean peninsulas: evidence of central Euro-pean glacial refugia for a temperate forest mammal species,the bank vole (Clethrionomys glareolus). Molecular Ecology14: 1727–1739.
Demirsoy A. 2008. Genel Zoocografya ve Türkiye Zoocograf-yası: Hayvan Cografyası. Ankara: Meteksan Yayınları.
Dogramacı S, Tez C. 1991. Geographic variations and karyo-logical characteristics of the species Glis glis (Mammalia:Rodentia) in Turkey. Doga- Turkish Journal of Zoology 18:167–170.
Esen D. 2000. Ecology and control of Rhododendron (Rhodo-dendron ponticum L.) in Turkish eastern beech (Fagus ori-entalis Lipsky) forests. PhD Thesis, Virginia PolytechnicInstitute and State University.
Fadda C, Corti M. 2001. Three-dimensional geometric mor-phometrics of Arvicanthis: implications for systematics andtaxonomy. Journal of Zoological Systematics and Evolution-ary Research 39: 235–245.
Fang J, Lechowicz MJ. 2006. Climatic limits for the presentdistribution of beech (Fagus L.) species in the world.Journal of Biogeography 33: 1804–1819.
Felsenstein J. 1981. Evolutionary trees from DNAsequences: a maximum likelihood approach. Journal ofMolecular Evolution 17: 368–376.
Fritz U, Ayaz D, Buschbom J, Kami HG, Mazanaeva LF,Aloufi AA, Auer M, Rifai L, Šlic T, Hundsdörfer AK.2008. Go east: phylogeographies of Mauremys caspica andM. rivulata – discordance of morphology, mitochondrial andnuclear genomic markers and rare hybridization. Journal ofEvolutionary Biology 21: 527–540.
Guindon S, Gascuel O. 2003. A simple, fast, and accuratealgorithm to estimate large phylogenies by maximum like-lihood. Systematic Biology 52: 696–704.
Güvenç S, Öztürk S, Oran S. 2009. Additions to lichen floraof Zonguldak Province. Journal of Biological and Environ-mental Sciences 3: 1–6.
Hewitt GM. 1996. Some genetic consequences of ice ages, andtheir role in divergence and speciation. Biological Journal ofthe Linnean Society 58: 247–276.
Hewitt GM. 1999. Post-glacial re-colonization of Europeanbiota. Biological Journal of the Linnean Society 68: 87–112.
Hewitt GM. 2000. The genetic legacy of the Quaternary iceages. Nature 405: 907–913.
Hönel B. 1991. Raumnutzung und Sozialsystem freilebenderSiebenschläfer (Glis glis L.). PhD thesis, University ofKarlsruhe.
Hürner H, Kryštufek B, Sarà M, Ribas A, Ruch T,Sommer R, Ivashkina V, Michaux JR. 2010. Mitochon-drial phylogeography of the edible dormouse (Glis glis) inthe western Palearctic region. Journal of Mammalogy 91:233–242.
Kaplan JO, Krumhardt KM, Ellis EC, Ruddiman WF,Lemmen C, Goldewijk KK. 2011. Holocene carbon emis-sions as a result of anthropogenic land cover change. TheHolocene 21: 775–791.
Kimura J. 1980. A simple method for estimating evolutionaryrate of base substitutions through comparative studies ofnucleotide sequences. Journal of Molecular Evolution 16:111–120.
Klein Goldewijk K, Beusen A, van Drecht G, de Vos M.2011. The HYDE 3.1 spatially explicit database of human-induced global land-use change over the past 12,000 years.Global Ecology and Biogeography 20: 73–86.
Krebs P, Conedera M, Pradella M, Torriani D, Felber M,Tinner W. 2004. Quaternary refugia of the sweet chestnut(Castanea sativa Mill.): an extended palynological approach.Vegetation History and Archaeobotany 13: 145–160.
Kryštufek B. 2010. Glis glis (Rodentia: Gliridae). Mamma-lian Species 42: 195–206.
Kryštufek B, Vohralík V. 2005. Mammals of Turkey andCyprus. Rodentia I: sciuridae, dipodidae, gliridae, arvicoli-nae. Koper: University of Primorska, Science and ResearchCentre.
Kuhl FP, Giardina CR. 1982. Elliptic Fourier features of aclosed contour. Computer Graphics and Image Processing18: 236–258.
Leamy L, Sustarsic SS. 1978. A morphometric discriminantanalysis of agouti genotypes in C57BL/6 house mice. Sys-tematic Biology 27: 49–60.
Ledevin R, Michaux JR, Deffontaine V, Henttonen H,Renaud S. 2010. Evolutionary history of the bank vole
Myodes glareolus: a morphometric perspective. BiologicalJournal of the Linnean Society 100: 681–694.
Lenormand T. 2002. Gene flow and the limits to naturalselection. Trends in Ecology and Evolution 17: 183–189.
Lo Brutto S, Sara M, Arculeo M. 2011. Italian Peninsulapreserves an evolutionary lineage of the fat dormouseGlis glis L. (Rodentia: Gliridae). Biological Journal of theLinnean Society 102: 11–21.
Macholán M. 2006. A geometric morphometric analysis ofthe shape of the first upper molar in mice of the genus Mus(Muridae, Rodentia). Journal of Zoology 270: 672–681.
Macholán M, Vyskocilova M, Bonhomme F, Kryštufek B,Orth A, Vohralík V. 2007. Genetic variation and phyloge-ography of free-living mouse species (genus Mus) in theBalkans and the Middle East. Molecular Ecology 16: 4774–4788.
Mayer H, Aksoy H. 1986. Wälder der Türkei. Stuttgart:Gustav Fischer Verlag.
Michaux J. 1971. Muridae (Rodentia) neogenes d’Europe sudoccidentale. Evolution et rapports avec les formes actuelles.Paléobiologie Continentale 2: 1–67.
Michaux J, Chevret P, Renaud S. 2007. Morphologicaldiversity of Old World rats and mice (Rodentia, Muridae)mandible in relation with phylogeny and adaptation.Journal of Zoological Systematics and EvolutionaryResearch 45: 263–279.
Michaux JR, Libois R, Paradis E, Filippucci MG. 2004.Phylogeographic history of the yellow-necked fieldmouse(Apodemus flavicollis) in Europe and in the Near andMiddle East. Molecular Phylogenetics and Evolution 32:788–798.
Michaux JR, Magnanou E, Paradis E, Nieberding C,Libois R. 2003. Mitochondrial phylogeography of the Wood-mouse (Apodemus sylvaticus) in the Western Palearcticregion. Molecular Ecology 12: 685–697.
Misonne X. 1969. African and indo-Australian Muridae.Evolutionary trends Annalen. Tervuren: Musée Royal del’Afrique Centrale.
Monteiro LR, Duarte LC, dos Reis SF. 2003. Environmen-tal correlates of geographical variation in skull and mandi-ble shape of the Thrichomys apereoides (Rodentia:Echimyidae). Journal of Zoology 261: 47–57.
Monti L, Baylac M, Lalanne-Cassou B. 2001. EllipticFourier analysis of the form of genitalia in two Spodopteraspecies and their hybrids (Lepidoptera: Noctuidae). Biologi-cal Journal of the Linnean Society 72: 391–400.
Morris P. 1997. The edible dormouse (Glis glis). Southamp-ton: The Mammal Society.
Pavlinov IJ. 2001. Geometric morphometrics of glirid dentalcrown patterns. Trakya University Journal of ScientificResearch 2: 151–157.
Pérez-Ramos IM, Ourcival JM, Limousin JM, Rambal S.2010. Mast seeding under increasing drought: results from
a long-term data set and from a rainfall exclusion experi-ment. Ecology 91: 3057–3068.
Posada D, Crandall KA. 1998. MODELTEST: testing themodel of DNA substitution. Bioinformatics 14: 817–818.
Renaud S. 1999. Size and shape variability in relation tospecies differences and climatic gradients in the Africanrodent Oenomys. Journal of Biogeography 26: 857–865.
Renaud S. 2005. First upper molar and mandible shape ofwood mice (Apodemus sylvaticus) from northern Germany:ageing, habitat and insularity. Mammalian Biology –Zeitschrift fur Saugetierkunde 70: 157–170.
Renaud S, Auffray JC. 2010. Adaptation and plasticity ininsular evolution of the house mouse mandible. Journal ofZoological Systematics and Evolutionary Research 48: 138–150.
Renaud S, Chevret P, Michaux J. 2007. Morphological vs.molecular evolution: ecology and phylogeny both shape themandible of rodents. Zoologica Scripta 36: 525–535.
Renaud S, Michaux J, Schmidt DN, Aguilar JP, Mein P,Auffray JC. 2005. Morphological evolution, ecologicaldiversification and climate change in rodents. Proceedings ofthe Royal Society B: Biological Sciences 272: 609–617.
Renaud S, Michaux JR. 2007. Mandibles and molars of thewood mouse, Apodemus sylvaticus (L.): integrated latitudi-nal pattern and mosaic insular evolution. Journal of Bioge-ography 34: 339–355.
Rohlf FJ. 1990. Fitting curves to outlines. In: Rohlf FJ,Bookstein FL, eds. Proceedings of the Michigan Morphomet-rics Workshop. Ann Arbor, MI: The University of MichiganMuseum of Zoology, 169–176.
Rohlf FJ. 2004. NTSYSpc, numerical taxonomy and multi-variate analysis system version 2.2. Department of Ecologyand Evolution, State University of New York: Exeter Soft-ware, Stony Brook, New York.
Rohlf FJ, Archie JW. 1984. A comparison of Fouriermethods for the description of wing shape in mosquitoes(Diptera: Culicidae). Systematic Biology 33: 302–317.
Santucci F, Emerson BC, Hewitt GM. 1998. MitochondrialDNA phylogeography of European hedgehogs. MolecularEcology 7: 1163–1172.
Seddon JM, Santucci F, Reeve N, Hewitt GM.2002. Caucasus Mountains divide postulated postglacialcolonization routes in the white-breasted hedgehog, Eri-naceus concolor. Journal of Evolutionary Biology 15: 463–467.
Selçuk SE, Çolak R, Karacan GO, Çolak E. 2012. Popu-lation structure of edible dormouse, Glis glis (Linnaeus,1766) in Turkey, inferred from RAPD-PCR. Acta ZoologicaBulgarica 64: 77–83.
Sönmez FK, Kömüscü AÜ, Erkan A, Turgu E. 2005. Ananalysis of spatial and temporal dimension of drought vul-nerability in Turkey using the standardized precipitationindex. Natural Hazards 35: 243–264.
Svenning J-C, Normand S, Kageyama M. 2008. Glacialrefugia of temperate trees in Europe: insights from speciesdistribution modelling. Journal of Ecology 96: 1117–1127.
Taberlet P, Fumagalli L, Wust-Saucy A-G, Cosson J-F.1998. Comparative phylogeography and postglacial coloni-zation routes in Europe. Molecular Ecology 7: 453–464.
Tarkhnishvili D, Gavashelishvili A, Mumladze L. 2012.Palaeoclimatic models help to understand current distribu-tion of Caucasian forest species. Biological Journal of theLinnean Society 105: 231–248.
Thorpe RS. 1987. Geographic variation: a synthesis of cause,data, pattern and congruence in relation to subspecies,multivariate analysis and phylogenesis. Italian Journal ofZoology 54: 3–11.
Wielstra B, Themudo GE, Güçlü Ö, Olgun K, PoyarkovNA, Arntzen JW. 2010. Cryptic crested newt diversity atthe Eurasian transition: the mitochondrial DNA phylogeog-raphy of Near Eastern Triturus newts. Molecular Phyloge-netics and Evolution 56: 888–896.
MORPHOMETRIC AND GENETIC STRUCTURE OF THE DORMOUSE 623