McGuire/Frankel LASA 2003 Mortality Decline in Cuba, 1900-1959: Patterns, Comparisons, and Causes James W. McGuire and Laura B. Frankel James W. McGuire Department of Government Wesleyan University Through June 30, 2003 Research Fellow Harvard Center for Population and Development Studies 9 Bow Street Cambridge, MA 02138 (617) 495-3699 [email protected]Laura B. Frankel Gallup, New Mexico [email protected]March 25, 2003
Transcript
McGuire/Frankel LASA 2003
Mortality Decline in Cuba, 1900-1959:
Patterns, Comparisons, and Causes
James W. McGuire and
Laura B. Frankel
James W. McGuire Department of Government
Wesleyan University
Through June 30, 2003 Research Fellow
Harvard Center for Population and Development Studies 9 Bow Street
Prepared for delivery at the 2003 Meeting of the Latin American Studies Association, Dallas, TX, March 27-29, 2003
McGuire/Frankel LASA 2003
Abstract
Cuba from 1900 to 1959 raised life expectancy and reduced infant mortality faster than any other Latin American country for which data are available. It accomplished this feat despite being ruled by a series of governments best known for personalism, patronage, corruption, mismanagement, toadying to US business interests, and neglect, at best, of the exploited and downtrodden. To make matters worse, Cuba from 1900 to 1959 experienced slow economic growth, high income inequality, inadequate provision of safe water and sanitation, a scarcity of rural health facilities and health personnel, and rampant corruption and maladministration, not least in the health sector. How, then, did Cuba manage to reduce premature mortality so rapidly? Our answer highlights Cuba's bountiful supply of physicians along with features of the country's geography, social structure, and class organization that seem to have made made health care more accessible to the poor than in many other Latin American countries.
Acknowledgements
The Harvard Center for Population and Development Studies and a Christian A. Johnson Endeavor Foundation Research Apprenticeship at Wesleyan University provided generous support for this reasearch. We are particularly grateful for comments and suggestions made by Sergio Díaz-Briquets, Carmelo Mesa-Lago, and participants in a March 12, 2003 seminar at the Harvard Center for Population and Development Studies, where an earlier version of this paper was presented. We also thank the staff of the Interlibrary Loan Office of Olin Library at Wesleyan University for their help in obtaining research materials.
McGuire/Frankel LASA 2003
4
Cuba has done well at expanding the survival-related capabilities of its citizens. In 1998, the infant mortality rate in Cuba was 7.1 per 1000, compared to 7.2 per 1000 in the United States (United Nations 2000: 356-357). The government newspaper Granma reported in early January 2003 that Cuba's infant mortality rate in 2002 was "¡6.5!," up slightly from "¡6.2!" in 2001 (de la Osa 2002, 2003). In March 2003, the latest available estimate of US infant mortality was 6.9 per 1000 in 2000 (United States CDC 2002: Table 20), not much lower than Cuba's 7.2 per 1000 in 2000 (de la Osa 2003). For Cuba to have an infant mortality rate as low as that of the United States is a notable achievement, given that it is a much poorer country. In 1996, the most recent year for which data are available, Cuba's GDP per capita at purchasing power parity was $5,259, compared to $29,194 in the United States (Heston, Summers, and Aten 2002).
The revolutionary government of Fidel Castro, which has ruled Cuba since 1959, is proud of its universalistic and egalitarian social policies. Cuba's leaders consider the infant mortality rate to be one of the most telling indicators of how these policies are affecting the population (Benjamin, Collins, and Scott 1984: 96; Feinsilver 1993: 51-52, 94). Castro and his colleagues have reason to be pleased with these policies and their effects. In 1995, the most recent year for which comparable, high-quality data are available, Cuba had the lowest infant mortality rate in Latin America. The revolutionary government's expansion of health care, family planning, education, sanitation, and water provision among the poor, together with its redistribution of income in favor of the poor, contributed heavily to this achievement (Díaz-Briquets 1983: 125; Drèze and Sen 1989: 249-250; Feinsilver 1993, Mehrotra 1997).
Compared to other Latin American countries, however, Cuba since 1959 has done well, rather than extremely well, at reducing infant mortality. Although revolutionary Cuba is often assumed to be way out ahead of the rest of the region on the mortality front, several other Latin American countries have done at least as well as Cuba at reducing the risk of early death. The problem is not with Cuba's statistics, which are defined in the conventional way and are among the most complete and accurate in the world. Rather, it is that Cuba's reputation as an outstanding performer is based on the levels of life expectancy and infant mortality it had achieved in 1995, rather than on its progress at improving these indicators from 1960 to 1995. During this period, the longest for which comparable data of reasonable quality are available, Cuba ranked only fourth of 20 Latin American countries at progress at raising life expectancy, and only fifth among 20 at progress at reducing infant mortality.
The reason why Cuba's level of infant mortality in 1995 was more impressive than its progress at reducing infant mortality from 1960 to 1995 was that Cuba started out in 1960 with an already low infant mortality rate. This rate, 39 per 1000, was the lowest in Latin America, and was lower than the rates in 1960 in Italy or Spain (both of which wound up with rates lower than Cuba in 1995). Cuba's lead over other Latin American countries in lowness of infant mortality was even wider in 1960 than in 1995, and Cuba's progress relative to other Latin American countries at reducing infant mortality was even greater from 1900 to 1960 than from 1960 to 1995. During the earlier period, Cuba led all Latin American countries for which data are available at raising life expectancy and reducing infant mortality. From 1960 to 1995, by contrast, it came in fourth and fifth respectively (see Tables 5-8 below). In
McGuire/Frankel LASA 2003
5
short, relative to other Latin American countries, and assuming that the foregoing statistics can be trusted to the degree necessary to establish the point, Cuba did at least as well at reducing premature mortality before the revolution as after it.
The Cuban government since 1959 has made enormous efforts to reduce the infant mortality rate. Some would even argue that it has overinvested in this goal (Alonso, Donate-Armada, and Lago 1994). Its policies have been successful, most remarkably in the face of a severe economic crisis in the early 1990s (Barraclough 2000, Chomsky 2000). The government deserves credit for this achievement, and other countries, including the United States, have much to learn from it. It is not really surprising, however, that a government so firmly committed to reducing infant mortality should find the goal within reach. More remarkable is the progress that Cuba made before 1959, when it was ruled by a series of governments best known for personalism, patronage, corruption, mismanagement, toadying to US business interests, and neglect, at best, of the exploited and downtrodden. Moreover, Cuba from 1900 to 1959 experienced slow economic growth, high income inequality, inadequate provision of safe water and sanitation, a scarcity of rural health facilities and health personnel, and rampant corruption and maladministration, not least in the health sector. How did Cuba manage to do so well at reducing premature mortality under these apparently inhospitable conditions?
The explanation lies partly with broad-scale modernization, particularly with fertility and urbanization, but Cuba's modest advantages in these areas, compared to other Latin American countries, were offset by more severe disadvantages in the areas of income growth, which was sluggish, and income inequality, which was very high. Our explanation highlights pre-revolutionary Cuba's geography, class structure, trade union movement, and health care system. Each of these features of Cuban society was fairly distinctive in the Latin American context, and there is a plausible story, backed by some evidence, as to how each of them might have assisted the country in achieving rapid mortality decline. By highlighting these factors here, we hope to provoke research on their evolution in other cases, and to provide inspiration for further inquiry into the causes and characeristics of the expansion of survival-related capabilities in Cuba.
We begin by depicting the pace and pattern of mortality decline in Cuba from 1900 to 1960. The first section of the paper assesses the sources and quality of Cuban mortality data and chooses the best estimates levels of life expectancy and infant mortality in 1900, 1960, and 1995. The second section compares Cuba's progress at reducing premature mortality to that of other Latin American countries both before and after the 1959 revolution. The third section identifies speedups and slowdowns in the pace of mortality decline from 1900 to 1960.
We then proceed to sort through possible reasons for Cuba's rapid mortality decline from 1900 to 1960. The fourth section assesses the impact of modernization factors like GDP growth and fertility change on the pace of mortality decline. The fifth sction explores the effects of social policies like education and health care. The sixth section traces Cuba's success at reducing premature mortality to mosquito control in the first decade of the 20th century; to a bountiful supply of physicians (particularly after 1945); and to features of the country's geography, social structure, class organization that seem to have made made health care more accessible to the poor than elsewhere in Latin America.
McGuire/Frankel LASA 2003
6
1. Levels and Changes of Premature Mortality, 1900 to 1995
Mortality estimates are typically derived from vital registration records, census data, or sample surveys. Vital registration records usually permit more direct and timely estimates of mortality rates than do census or survey data, provided that they use a standard definition of infant death, and provided that they are nearly complete and accurate. The first condition did not hold in Cuba until 1957, and the second did not prevail until the late 1960s.
1.1. Vital Registration Statistics, 1884-1959
Cuba's vital registration system got off to an early start. In 1884, the Spanish colonial authorities passed one of Latin America's earliest laws requiring the registration of births, deaths, and stillbirths (United Nations 1955: 20-21; Rios Massabot 1983: 17). From that time until at least the late 1950s, however, Cuba's vital registries had serious deficiencies.
One problem was definition. Before 1957, a death in the first 24 hours of life entered Cuba's vital registries, if at all, as a late fetal death rather than an infant death (González Quiñones and Debasa 1970: 5; Cuba. JUCEPLAN 1974: 84; United Nations 2000). Similar definitions of fetal and infant deaths were used in Spain, France, Belgium, and the Netherlands (United Nations 1955: 48, 231). As late as the 1990s, the death of an infant before the registry of its birth, which could take up to 48 hours, was recorded in France as a late fetal death rather than an infant death (Liu et al. 1992: 107; United States Congress 1994: 35). In 1957, however, Cuba began to count deaths in the first 24 hours of life as infant deaths, and in 1965 it adopted the standard World Health Organization definitions of live birth, infant death, and fetal death (Cuba. JUCEPLAN 1975: 141; Catasus Cervera and Hernández Castellón 1977: 282 n. 3; Rios Massabot 1983: 17, Riverón Corteguera 1996).
A second problem was that parents until 1967 were legally allowed to wait as long as a year before registering a birth, as opposed to 60 days in Chile, 25 days in Costa Rica, and 3 days in Argentina (United Nations 1955: 84, 170). When an infant dies before his or her birth has been registered, parents are much less likely to register either the birth or the death (Hill 1991: 369). The death and birth go similarly unreported, but because infant deaths are rarer than births, omitting the death matters more to the size of the numerator than omitting the birth matters to the size of the denominator. Hence, the net effect of the dual omission is to reduce the calculated infant mortality rate. The long delay that was legally permissible in registering a birth thus exacerbated the underregistration of infant deaths. The problem persisted until 1967, when a new law reduced the reporting period to 20 days. The new law also required health personnel to register the births and, if necessary, the deaths of infants whose parents were unwilling or unable to do so (Rios Massabot 1983: 17-18).
A third problem with Cuban death registration in the pre-revolutionary era is that births and deaths were recorded by place of occurrence rather than by place of residence. This was also the custom in Argentina, Brazil, Chile, and Costa Rica (United Nations 1955: 78). Hence, mortality rates in the city and metropolitan area of Havana may have been "inflated by the deaths of non-residents who sought Havana's medical facilities" (Diaz-Briquets 1981: 400; Díaz-Briquets 1983: 142-143).
McGuire/Frankel LASA 2003
7
The biggest shortcoming of Cuban mortality statistics in the pre-revolutionary era was, however, their incompleteness. In the city of Havana from 1901 to 1951, and possibly as far back as 1835, death registration is thought to have been virtually complete (Foreign Policy Association 1935: 95-97; Díaz-Briquets 1981: 400). The same cannot be said for the rest of the country. González Quiñones and Debasa (1970: 14) used data from the 1943 and 1953 censuses to estimate the degree of incompleteness of death records across the country as a whole in 1947, 1948, and 1949. They found that only about 57 percent of all deaths, and only about 36 percent of under-5 deaths, had found their way into the vital registries. Those who died without medical certification, and infants who survived for less than 24 hours, were omitted from the registries. A scarcity of registration facilities contributed to the incompleteness of death records outside Havana. Of 13 Latin American countries in the early 1950s, Cuba had the lowest ratio of birth and death reporting facilities to population (United Nations 1955: 66).
1.2. Infant Mortality and Life Expectancy around 1900
The completeness of death registries is said to have been even lower in the first few decades of the twentieth century than in the late 1940s (Díaz-Briquets 1983: 141). Because the death registries cannot be trusted, most scholars have used census data to estimate infant mortality and life expectancy in Cuba around 1900. Tables 1 and 2 depict the available estimates for 1899 and 1900. Of the estimates of infant mortality around 1900, González Quiñones and Ramos Piñol's (1996) estimate of 195 per 1000 in 1900-04 seems closest to the mark. Hollerbach and Díaz-Briquets (1983: 5) found that the series reprinted by Catasus Cervera and Hernández Castellón (1977), which appears in Column 3 of Table 1, overstated the true mortality rate. If so, the estimate for 1899 in Column 2 is also overstated, and the estimate in Column 1 is greatly overstated. Losada (1999: 197 n. 50), who provided the Column 1 estimate of 265 per 1000 in 1899, took it from registered death records, arguing that vital registries probably improved under the US occupation from 1899 to 1902. Still, if Hollerbach and Diaz Briquets are correct that an estimate of 224 per 1000 overstates the infant mortality level in 1899, an estimate of 265 per 1000 would overstate it even more.
[Insert Tables 1 and 2 About Here]
On the other hand, Hollerbach and Díaz-Briquets (1983: 8) regard Collver's (1965) estimates of Cuban infant mortality as too low (Table 1, Column 5). Indeed, Collver's estimates are lower in many years the vital registration figures in Column 8, which are known to be incomplete. The Havana series from Díaz-Briquets (Table 1, Columns 6 and 7) are useful for tracing the evolution of infant mortality after 1900, and for measuring the evolution of infant mortality in Havana itself, but less so for estimating the level of infant mortality across the whole country in 1900. Not only were death records more complete in Havana than elswhere; the better health services and sanitary conditions in Havana also attracted ill people and expectant mothers anticipating difficult births. Any deaths that resulted were counted as occuring Havana, the municipality (province) where they took place, rather than being attributed to the province where the deceased, or the mother of the deceased newborn, usually resided. Hence, the Havana infant mortality rate would be overstated, and that of the other provinces understated, at least from the point of view of the success of each province at expanding the survival-related capabilities of its inhabitants. At the same time, the reality of the better health services and
McGuire/Frankel LASA 2003
8
sanitary conditions held the mortality rates of Havana residents below those of the residents of other provinces. It is possible that these effects balanced each other out, or that one was considerably stronger than the other, and it is also possible that the balance between them changed over time.
Among all of these alternative estimates of infant mortality in 1900, we accept González Quiñones and Ramos Piñol's (1996) 195 per 1000. It was produced in a transparent and systematic fashion and is thereby open to replication and critique, and it splits the difference between the estimates of Collver and Catasus/Hernández, which in the judgment of Hollerbach and Díaz-Briquets (1983: 5) are too low and too high respectively.
Less variation is apparent in the fewer available estimates of life expectancy around 1900. We shall accept Astorga and FitzGerald's (1998) estimate that life expectancy at birth in Cuba in 1900 was 32 years (Table 2, Column 4), not far from the alternative estimate of 33.2 years (Table 2, Columns 1 and 2, each of which take their figures from the same original source). We prefer Astorga and Fitzgerald (1998) to this alternative estimate because Astorga and Fitzgerald provide the estimates of life expectancy for the other countries to which Cuba is compared in Section 2.
1.3. Infant Mortality and Life Expectancy around 1960
Cuba's infant mortality level in 1960 is a matter of some controversy. The higher the infant mortality rate in Cuba in 1960, the easier it is to credit the revolutionary government with significant progress at reducing infant mortality. The lower the rate in 1960, the harder it is to credit the government with such progress. Accordingly, an article in the official newspaper of the US Communist Party assigns Cuba an infant mortality rate of 65 per 1000 in 1960 (Wheeler 1997), much higher than the 39 per 1000 around which most other estimates cluster. Some of the more breathless backers of the revolution even suggest the plausibility of rates as high as 125 per 1000 (Benjamin, Collins, and Scott 1984: 96). On the other hand, the US Department of State (Bureau of Inter-American Affairs 1998/2002), citing the 1979 UN Statistical Yearbook (which draws its estimates mostly from government tallies of official vital registration statistics), assigns Cuba an infant mortality rate of only 32 per 1000 in 1960, below the rate in Germany in 1960 (World Bank 2002).
Columns 1-3 of Table 3 present three different series of infant mortality rates, all based on vital registration statistics. Columns 2 and 3 explicitly count infants dying in the first twenty-four hours of life as infant deaths. It is not known for certain how such deaths are counted in Column 1, but our guess is that they are counted as infant deaths in this source as well. In any case, the 32 per 1000 estimate for 1960 published by the US Department of State is much lower than any of the estimates in Columns 1-3, which are also based on vital registration statistics and which hover around 36 per 1000. The slightly higher estimates of infant mortality in Columns 4 and 5 are based on vital registration records which have been revised upward to compensate for the presumed underregistation of infant deaths. Neither of the sources of the data in Columns 4 and 5 explains the basis of such revisions, but each produces an estimate for 1960 that is very close to the Hill et al. (1999) estimate of 39 per 1000, which is regarded here as the best available. The Hill et al. (1999) estimate itself is based on a knotted regression line that minimizes the squared distance between itself and three other estimates: an uncorrected vital registration estimate of 37 per 1000 (United Nations 1992: 104), and the 1974 and 1979 survey estimates
McGuire/Frankel LASA 2003
9
recorded in Columns 6 and 7. The survey data closely corroborate the corrected vital registration figures, and reassure us that the Hill et al. (1999) estimate of 39 per 1000 is in the neighborhood of the actual rate.
[Insert Table 3 About Here]
The estimates for 1960 in columns 9 and 10 of Table 3, which hover near 60 per 1000 (much higher than the Hill et al. estimate of 39 per 1000), are based on life tables calculated from data in the 1953 and 1970 censuses. The figures in these life tables are interpolated to generate estimates of age-specific death rates in intervening years, including 1960. Farnos Morejón (1977) describes the specific method used to generate the figures in Column 9. The figures in Column 10 are produced by a similar method, except that Gonzales Quinones and Ramos Piñol (1996: 31) incorporate new data on migration; correct for an apparent census undercount of under-5 children; and use the method of inverse projection (McCaa 2001). The figures in Column 11 are taken from a CELADE publication that provides no information about methodology, but seem to be derived from census data.
These higher estimates of infant mortality are problematic. The long interval between the 1953 and 1970 censuses makes projections for 1960 necessarily imprecise. Moreover, none of the sources in Columns 9-11 engages the alternative, readily available, and much lower estimates in the other columns -- either the corrected vital registration estimates in Columns 4 and 5, or the survey estimates in Columns 6 and 7. Also boosting confidence in the Hill et al. (1999) estimate of 39 per 1000 for 1960, Granma, the official newspaper of the Cuban revolutionary government, recorded the 1960 infant mortality rate as 37.3 per 1000 in two consecutive years (de la Osa 2002, 2003). The Cuban government would seem to have an interest in endorsing a higher estimate. That way, the amount of infant mortality decline since 1959 would look bigger.
More agreement exists on life expectancy than on infant mortality in 1960. The three sources for 1960 in Table 2 concur that a newborn in 1960 could expect to live about 64 years. The mean of the CEPAL/CELADE estimates (Column 7) for 1955-1960 and 1960-1965 is 63.9 years. Díaz-Briquets (1983: 19) accepts an estimate of 64.0 years for 1960, and the World Bank (2002) provides an estimate of 64.2 years for 1960. We therefore accept that the infant mortality rate in Cuba in 1960 was about 39 per 1000, as Hill et al. (1999) suggest, and that life expectancy at birth was about 64 years.
1.4. Infant Mortality and Life Expectancy around 1995
Cuba's infant mortality rate in 1995 was reported to be 9 per 1000, the lowest in Latin America (Hill et al. 1999). Life expectancy at birth was reported to be 75.8 years, second-highest in the region after Costa Rica (76.2) (World Bank 2002). More controversy exists over the level of infant mortality than over the level of life expectancy, perhaps because the infant mortality rate is updated every year and is calculated directly from vital statistics collected by the government. In the opinion of some critics, Cuba's official infant mortality statistics since 1959 have been "fudged," improperly defined, insufficiently complete, and/or low in part because of a high abortion rate. Let us consider each of these objections in turn. Life expectancy estimates for 1995 will be discussed briefly at the end of the subsection.
McGuire/Frankel LASA 2003
10
In an article entitled "Did Fidel Fudge the Figures?," Nicholas Eberstadt (1986: 38) raised the possibility that "Cuban authorites [may be] deliberately falsifying statistics on their nation's infant mortality rate," and pointed to other instances in which the government had apparently falsified official statistics. Lawrence Solomon (2003) wrote that "Castro's accomplishments are a hoax; his statistics have been fudged or fabricated," and argued that the government had covered up an outbreak of dengue fever in 1997. Both Eberstadt and Solomon cite a study by Kenneth Hill (1983) that found large differences from 1974 to 1978 between infant mortality rates calculated from vital statistics and infant mortality rates estimated indirectly from child survivorship questions asked in the 1979 Demographic Survey. In 1978, infant mortality was 22 per 1000 according to vital statistics (Table 4, Column 2), but 38 per 1000 according to indirect estimates based on the 1979 Demographic Survey (Table 4, Column 6). Indirect estimates based on the 1987 Fertility Survey produced similarly high figures, 36 per 1000 for 1976 and 32 per 1000 for 1978 (not shown). This survey, however, also produced estimates of 42 per 1000 for 1981 and 9 per 1000 for 1985 (United Nations 1992: 106). Such huge apparent changes over such a short span of time cast serious doubt on the survey's reliability.
[Insert Table 4 About Here]
Neither Eberstadt nor Solomon give any direct evidence that the Cuban government has falsified its infant mortality statistics. Moreover, observation of a discrepancy between vital statistics and survey results does not entail the conclusion that the vital statistics are flawed whereas the survey results are accurate. Hill et al. (1999: 70) regard the estimates from the 1987 Fertility Survey as severely flawed, and give them zero weight in their own estimates. Hill (1983: 89-92) also views the vital registration-based estimate for 1978 (22 per 1000) as more credible than the estimate based on the 1979 Demographic Survey (38 per 1000), in part because the survey responses that provided the basis for the 1978 estimates were from women aged 15 to 19 (United Nations 1992: 105). Such women tend to be poorer than average, and tend to be giving birth to their first child, both of which are risk factors for infant death. Moreover, the number of births to 15-19 year-old women in sample surveys is often so small as to make estimates based upon them unreliable (United Nations 1992: 7).
What about the possibility that Cuba uses a non-standard definition of infant mortality that yields a lower rate than the standard definition? Until 1957, as noted earlier, an infant had to survive for at least 24 hours in Cuba to be counted as a live birth; a death in the first twenty-four hours of life was considered to be a late fetal death. In 1957, however, as noted above, Cuba effectively abandoned this policy, and in 1965 it formally adopted the World Health Organization definitions of live birth, infant death, and fetal death. Hence, Cuba since 1957 has used the standard definition of an infant death.
The vital registries improved after 1959 as the revolutionary government streamlined data collection, established new centers for processing death certificates, rehabilitated existing centers, and trained personnel (Mesa-Lago 1969; Cuba. JUCEPLAN 1975: 141; Catasus Cervera and Hernández Castellón 1977: 282 n. 3; Rios Massabot 1983: 17). Also improving the completness of infant death registration, the share of births taking place in medical facilities rose from 63 percent in 1963 to 98 percent in 1972 (Riverón Corteguera, Valdez Lazo, and Rodríguez Castro 1978: 413, Rios Massabot 1983: 17; Santana 1988: 109). Between 1960 and 1966, accordingly, the unadjusted vital registration estimates begin to approach the adjusted estimates (Table 4, Columns 3 and 4; Landstreet 1976: 108).
McGuire/Frankel LASA 2003
11
In April 1975, the Cuban government told the United Nations that its birth and death (including infant death) statistics could be regarded as complete as of 1967 and 1969 respectively (Landstreet 1976: 102).
Most observers agree that vital-registration based infant mortality statistics in Cuba have been acceptably complete and accurate at least since the late 1960s (Mesa-Lago 1969: 76; Landstreet 1976: 102; Rojas Ochoa and Sánchez Texidó 1977; Díaz-Briquets 1986: 10; Santana 1988; Drèze and Sen 1989: 186 n. 13; Feinsilver 1993: 97-98). International agencies concur with this evaluaton. In March 1974, a researcher for the Pan American Health Organization concluded from several types of evidence that Cuban vital statistics were substantially complete, and recommended that the WHO label them as such in its official publications (Santana 1988: 108). Cuba from 1965 to 1970 averaged 54,000 recorded deaths, very close to 53,000 expected by researchers at the Centro Latinoamericano de Demografía (CELADE). In each year from 1970 to 1975, Cuba similarly recorded between 49,000 and 54,000 deaths (CELADE 1977: 16). The Pan American Health Organization (PAHO) estimated that Cuban vital registries in 1985-1990 recorded at least 90 percent of births, infant deaths, and child deaths, a proportion as high as the United States. Another PAHO study estimated that Cuban registries in 1996 recorded 99.9 percent of all deaths, more than the 97.2 percent in the United States (McGuire 2001: 1679).
Although most observers and international agencies agree that Cuba's vital registration statistics were complete and accurate during the 1990s, some claim that Cuba underreports the births and deaths of newborns weighing less than 1500 grams. In 2000, the mortality rate for US infants weighing less than 1500 grams was 247 per 1000, nearly 100 times as high as that for infants weighing 2500 grams or more (2.5 per 1000) (United States CDC 2002: Table 22). Hence, even though only a small percentage of newborns weighs 1500 grams or less, their extraordinarily high death rate means that the completeness of reporting of their births, and frequent deaths, can have a pronounced effect on the infant mortality rate.
The claim that Cuba underreports the births and deaths of very low-birthweight infants rests on a report that newborns weighing less than 1500 grams comprise 1.5 percent of births in the United States, but only 0.4 percent in Cuba (Carnell 2002; for the US rate see also United States CDC 2002: Table 15). In making this observation, Carnell (2002) suggests that US reporting of the births and deaths of very low-birthweight infants is virtually complete, whereas Cuban reporting suffers from widespread omissions. This possibility is worth taking seriously, for cross-national differences in birth and death reporting of very low-birthweight infants complicate infant mortality comparisons even among rich countries (Howell and Blondel 1994; United States Congress 1994: 34-35; Kramer et al. 2002).
Maternal health, rather than reporting differences, may explain some of the gap between the US and Cuban incidence of low-birthweight births. Inequalities of income, education, nutrition, and access to health care are much greater in the United States than in Cuba, and disadvantaged mothers in the United States may well be in poorer health than disadvantaged mothers in Cuba. In Sweden, where the social safety net is much stronger than in the United States, the share of births under 1500 grams is only 0.7 percent (Howell and Blondel 1994: 851), closer to the reported Cuban rate of 0.4 than to the US rate of 1.5. Moreover, it is possible that the already high percentage of very low birthweight births in the
McGuire/Frankel LASA 2003
12
United States should actually be even higher. Underreporting of births under 1500 grams has been identified on American Indian reservations (Heck, Schoendorf, and Parker 1999).
Even if the differential between the share of US and Cuban births under 1500 grams were due entirely to underreporting in Cuba, raising the infant mortality rate to compensate for the omissions would probably not change the main findings of the present study. A simulation by Howell and Blondel (1994: 851) found that an increase in the share of births under 1500 grams from 0.5 to 1.0 percent would raise a perinatal mortality rate of 15.0 per 1000 only to 17.3 per 1000 (perinatal mortality encompasses fetal deaths after 28 weeks plus infant deaths under 7 days). In 1996, Cuba's perinatal mortality rate was 12.4 per 1000 (PAHO 2001) and its infant mortality rate was 7.9 per 1000 (Table 4). Hence, even if the true proportion of very low-birthweight babies in Cuba were considerably higher than the official statistics report (a claim not conceded here), Cuba's infant mortality rate in 1996 might have been about 9 per 1000 rather than 8 per 1000 -- still the lowest in Latin America, and just above the 7 per 1000 rate in 1996 in the United States.
Díaz-Briquets (1986: 40-41) has called attention to Cuba's high rate of abortion, which implies the termination of some pregancies that might otherwise have resulted in births of vulnerable infants. In 1996, Cuba indeed had, after Vietnam, the highest abortion rate in the world, with nearly four times the US ratio of abortions to pregnancies (Henshaw, Singh, and Haas 1999: 534). Feinsilver (1993: 101-02) writes that the high incidence of abortion, in the context of frequent use of genetic diagnosis, "has given Cuba an advantage over others in the race to decrease the infant mortality rate," and added that "given the intense effort to decrease infant mortality, it is possible that, the free-choice abortion policy aside, many doctors may strongly advise and even pressure for abortion."
Whatever the content of such advice, Feinsilver reported an estimate that the advantage conferred by genetic diagnosis followed by abortion amounted to no more than 1 per 1000 at a time when the official infant mortality rate was 10 per 1000. A study of the decline in US neonatal mortality (deaths within the first 28 days of life) from 1964 to 1977 produced even lower estimates of the abortion effect. The study found that the rise in availability of abortion services reduced neonatal (birth to 28 days) mortality by about 1 per 1000 among blacks (whose neonatal mortality rate fell from 28 to 16 per 1000 over the period) and by about 0.2 per 1000 among whites (whose rate fell from 16 to 9 over the period) (Corman and Grossman 1985: 232-33). Hence, although Cuba's high abortion rate may contribute to its low infant mortality rate, the substantive impact of such a contribution is probably small.
We may therefore accept that Cuba's official infant mortality estimate for 1995, 9.4 per 1000 (Table 4, Column 2), is based on a standard definition of infant mortality and on reasonably complete and accurate vital registration statistics. Accordingly, we accept the Hill et al. estimate that infant mortality in 1995 was about 9 per 1000. A high rate of abortion is one reason why this rate was so low, but it is only a small part of the explanation.
In 1995 as in 1960 and 1900, alternative estimates of life expectancy at birth do not differ much. Most are on the order of 76 years (Astorga and FitzGerald 1998: 32). The World Bank's estimate is 75.8 years, and the mean of CEPAL/CELADE's estimates for 1990-1995 and 1995-2000 is 75.7 years (2002: 22).
McGuire/Frankel LASA 2003
13
2. Cuba and Latin America: Mortality Decline in Comparative Perspective
Levels of infant mortality and life expectancy reflect decades or even centuries of ecological challenges, social contexts, institutional arrangements, and government policies. Progress over time in reducing premature mortality, by contrast, reflects shorter-term changes in socioeconomic conditions, institutional arrangements, and government policies that reduce the risk of early death. We therefore take an interest not only in the levels of premature mortality that Cuba and other Latin American countries had achieved in 1900, 1960, and 1995, but also in the progress each made at raising life expectancy and reducing infant mortality during the periods on which we focus in this section, 1900 to 1960 and 1960 to 1995.
Cuba did well in 1960 as well as in 1995 at achieving a low level of premature death (Tables 5 and 6). On infant mortality, Cuba led the region in both years, but by a greater margin in 1960 than in 1995. On life expectancy, Cuba came in third in 1960 and a close second in 1995. Where Cuba really excelled before the revolution was, however, in the progress it made at reducing premature mortality. After the revolution, from 1960 to 1995, Cuba ranked only fourth among 20 Latin American countries at progress at raising life expectancy, and only fifth at progress at reducing infant mortality. From 1900 to 1960, by contrast, Cuba enjoyed the sharpest percent rise in life expectancy and sharpest percent decline in infant mortality of any Latin American country for which information is available (Tables 7 and 8). Indeed, Cuba may have surpassed the other countries at reducing infant mortality by an even greater margin than is suggested by the figures in Table 7, for Cuba's infant mortality rate in 1900, as argued in Section 1.2, was probably closer to 195 per 1000 than to Collver's (1965) estimate of 136 per 1000. If the true initial rate in 1900 were 195 per 1000 rather than 136 per 1000, Cuba's percent decline from 1900 to 1960 would be 80 percent rather than 71 percent, giving it a much wider lead over the other countries.
[Insert Tables 5, 6, 7, and 8 About Here]
Collver's estimates of the infant mortality rate in other Latin American countries around 1900 may also be understated, but his figures for Argentina and Costa Rica, and to a lesser extent Chile, coincide fairly closely with estimates based on vital registration records (which, although flawed, were more complete in these countries than in Cuba). According to these records, Argentina's infant mortality rate in 1911 was 148 per 1000 (Mitchell 1998: 87-88), near Collver's estimate of 146, and Costa Rica's was 197 in 1910 (Rosero-Bixby 1985: 365-66), close to Collver's estimate of 208. Chile's rate according to vital statistics -- 340 in 1901 and 270 in 1902 (Mamalakis 1980: 40-41) -- was higher than Collver's estimate of 261, but even if the 340 per 1000 figure were accepted (the annual average from 1902 to 1906 was 293 per 1000), Chile's reduction of shortfall from 1900 to 1960 would be 65 percent. That is more than the 55 percent in Table 7, but still below Cuba's 71-80 percent.
Compared to other Latin American countries, then, Cuba's progress at reducing premature mortality before the revolution, from 1900 to 1959, was at least as good as its performance after the revolution, from 1959 to 1995. To account for Cuba's strong performance at reducing premature mortality from 1900 to 1960, it is helpful to identify sub-periods when the pace of mortality decline either slowed or accelerated.
McGuire/Frankel LASA 2003
14
3. The Pattern and Pace of Mortality Decline, 1900-1960
The Spanish American War was a demographic catastrophe for Cuba, reducing the population from 1.8 million in 1895 to 1.5 million in 1898. Part of the decline resulted from a fall in the birth rate, but in 1897-98 "war, starvation, and pestilence killed one person in ten in a single year" (Foreign Policy Association 1935: 97). The proportion of the Cuban population lost to the Spanish-American war has been compared to the proportion of the Soviet population lost in World War II (Thomas 1971: 423 n. 36). Over the next six decades, however, premature mortality fell rapidly, particularly in the 1940s and 1950s.
Díaz-Briquets (1983: 21) reviewed available data for Cuba and Havana and concluded that "mortality declined gradually during the first two decades of [the twentieth] century. The decline gained momentum in the 1920s, may have slowed down during the 1930s, and accelerated rapidly after the Second World War. That rapid decline seems to have continued through the 1960s." Since Díaz-Briquets wrote his pioneering work, researchers have produced new infant mortality and life expectancy series that allow us to reexamine his depiction of the trajectory of mortality decline from 1900 through the 1960s. Rather than picking one series as the most accurate and discarding the others, we take the average of all the series using a method illustrated in Appendix 1. This method involves converting each column in Table 1 (infant mortality), as well as in Table 2 (life expectancy), to a series of annual percent decline figures, and then taking the average of the values in each row.
The results of these exercises for infant mortality and, to a lesser extent, life expectancy suggest that the trajectory of mortality decline in Cuba from 1900 to 1960 is close to the one traced by Díaz-Briquets. Infant mortality (Table 1, Column 8) fell slowly from 1900 to 1920 (at an annual rate of 1.3 to 1.6 percent), then faster from 1921 to 1930 (at an annual rate of 2.0-2.5 percent). The pace of decline then slowed in the early 1930s before speeding back up from 1936 to 1943 and especially from 1944 to 1960 (when the annual rate of decline reached 3.6-4.3 percent). Life expectancy (Table 2, Column 8) showed a broadly similar trend, except that no slowdown in the rate of increase was visible during the 1930s. The bottom line for both indicators is that the pace of mortality decline was rather slow from 1900 to 1920, but very fast from 1945 to 1960.
Díaz-Briquets (1983: 67-101) has analyzed, within the limits of the available data, the decline in mortality from specific causes in Cuba from 1899 to 1953. Unlike in Sri Lanka (Livi-Bacci 2001: 138), Taiwan (Yip 2000: 123), or Thailand (Muscat 1990: 87-89), no plunge in malaria seems to have propelled the post-World War II mortality decline in Cuba. Malaria continued to be a problem even after the anti-mosquito campaigns from 1900 to 1909, partly because of the influx in subsequent decades of malaria sufferers from neighboring countries who arrived in search of work. A 1935 report by the Foreign Policy Association regarded malaria as "the most important public health problem in Cuba" (1935: 99). By the late 1930s, however, Cuba had fewer than 400 malaria deaths per year, and the number dropped below 100 after 1950 (Díaz-Briquets 1983: 73-79). More important to the mortality decline after World War II seems to have been a decline in deaths from influenza, pneumonia, bronchitis, tuberculosis, diarrhea, gastritis, and enteritis (the last three maladies affected mainly infants and children). Díaz-Briquets regards the post-1945 decline of tuberculosis, influenza, and pneumonia deaths as resulting more from the introduction of new drugs than from economic conditions (1981: 407,
McGuire/Frankel LASA 2003
15
409; 1983: 5, 72). He also notes that a campaign against intestinal parasites was launched in 1946 (1983: 82).
This depiction of the pace and pattern of mortality decline in Cuba from 1900 to 1960 -- notably, a slow decline before World War II, and a rapid decline afterward -- can be usefully juxtaposed to the evolution of modernization indicators for which time series data exist. These factors, as Section 4 shows, provide part of the explanation for Cuba's remarkable decline in premature mortality from 1900 to 1960. As is argued in Section 5, however, the Cuban poor also seem to have had better access to health care than in most other Latin American countries, owing to peculiarities of geography, class structure, and class organization. That too contributed to rapid mortality decline, perhaps more than has previously been recognized.
4. Modernization and Mortality Decline in Cuba, 1900 to 1960
The factors to be addressed in this section are GDP per capita, income inequality, wages, poverty, nutrition, height, urbanization, and fertility. We do not discuss the quality or derivation of data on these variables as systematically as we discussed the infant mortality estimates, but the sources we have used are, we believe, the best available. Where cross-national data exist, we compare Cuba to other Latin American countries. Where time series data exist, we look for correlations between periods of faster change in modernization indicators and periods of accelerated mortality decline, allowing for possible lag effects.
Our findings can be summarized briefly. Compared to other Latin American countries, Cuba in 1960 had high urbanization and low fertility. These advantages were offset, however, by low GDP per capita and high income inequality. From 1900 to 1960, moreover, Cuba experienced slow GDP growth and sluggish urbanization. Fertility fell, but mostly before 1940, whereas mortality began to diminish rapidly only after 1945. Modernization factors alone do not explain, then, why Cuba had the region's lowest mortality in 1960, or the fastest rate of mortality decline from 1900 to 1960. Social policies, including health care, must also have been influential.
GDP per capita
Higher GDP per capita facilitates improvements in survival, both by generating public revenue for social programs and by raising private incomes so that individuals have more to spend on food, shelter, health care, and other basic needs. Some cross-national studies have found that growth in GDP per capita plays only a modest role in reducing premature mortality (Preston 1975). Others, however, have found much stronger effects (Pritchett and Summers 1996). We therefore begin by examining the relation between GDP per capita and the magnitude and evolution of mortality decline in Cuba from 1900 to 1959.
No reliable GDP statistics exist for pre-1950 Cuba (Brundenius 1984: 6), but indirect estimates suggest that Cuba did poorly by Latin American standards at both the pace of economic growth from 1900 to 1960 and the level of GDP per capita attained in 1960. Of the nine Latin American countries for which Astorga and Fitzgerald (1998) provide data for both 1900 and 1960, Cuba went from having
McGuire/Frankel LASA 2003
16
the third-highest GDP per capita in 1900 to having the third-lowest in 1960 (Astorga and Fitzgerald calculate their estimates of Cuban GDP per capita from a series developed by Brundenius 1984). As a result, Cuba ranked ninth among the nine countries at GDP per capita growth during the sixty-year period, and seventh at the level of GDP per capita attained in 1960 (Table 9). Cuba thus came in first in Latin America on mortality decline, but last in GDP per capita growth. Hence, the claim that modernization explains Cuba's rapid mortality decline gets off to a rough start.
[Insert Table 9 About Here]
Because the pace of mortality decline accelerated notably from 1945 to 1960, it is useful to inquire whether GDP per capita growth also sped up significantly at that time. The available data are not homogeneous. According to Domínguez (1978: 74), the index of real income per capita rose from 100 in 1946 to 123 in 1958, down from 134 in 1957. According to Brundenius (1984: 145), real income per capita in 1926 pesos rose from 159 in 1946 to 178 in 1958, down from 205 in 1957. According to the figures for Cuba in Astorga and Fitzgerald (1998: 31), GDP per capita in 1970 $US rose from 374 in 1940 to 380 in 1950 to 390 in 1960. Putting these estimates together, and recognizing that GDP per capita dipped sharply in 1958 in part for conjunctural reasons (the revolution), GDP per capita probably grew a total of 20-30 percent between 1945 and 1957, i.e., on the order of 2 percent per year. Although not spectacular, this progress was fairly solid, and was certainly much better than in the first half of the twentieth century, over the course of which GDP per capita rose little if at all (Brundenius 1984: 5-7, 140, 145). Hence, although GDP per capita doesn't take us very far in explaining why Cuba led Latin America in mortality decline from 1900 to 1960, it seems plausible that a rise in the rate of GDP per capita growth after World War II may have had something to do with faster mortality decline from 1945 to 1960.
Income Inequality
An uneven income distribution made it harder for the Cuban poor to benefit from the modest rise in national affluence that did take place. Studies of both poor and rich countries have generally found a fairly strong relation between higher income inequality and higher premature mortality, even controlling for GDP per capita and other factors (Flegg 1982; Daniels, Kennedy, and Kawachi 2000; Hertzman 2001, Wilkinson 2001). No time series data are available for income inequality in Cuba before 1960, but estimates for the 1950s and early 1960s in eight Latin American countries, including Cuba, can be obtained from Deininger and Squire (1998). These estimates (Table 10) are not homogeneous, but they suggest that income inequality in the late 1950s was higher in Cuba than in most other Latin American countries. It should be borne in mind that Latin America is the world region with the highest level of income inequality to begin with.
[Insert Table 10 About Here]
It is worth discussing briefly the derivation of the estimate for Cuba in 1953, which Deininger and Squire (1998) take from Brundenius (1984). As is noted in the Deininger and Squire database, the Gini index for Cuba in 1953 (as well as the one for Peru in 1961) is based on data for "income recipients" only. In fact, Brundenius estimated the Gini for Cuba by attributing to each occupational group
McGuire/Frankel LASA 2003
17
distinguished in the 1953 census an estimated annual income based on the distribution of wages among some 1200 employees of "10 leading companies." Most of the employees lived in Havana, and farmers and farm workers were excluded from the sample (Brundenius 1979: 37-43; Brundenius 1984: 105). Refinement of the estimate with additional information, including about agricultural workers, changed the Gini estimate only from 57 to 55 (Brundenius 1984: 105-06, 180). Mesa-Lago (1981: 143, 223) expresses reservations about this methodology, but regards it as ingenious and agrees that income inequality in prerevolutionary Cuba was "extreme." Hence, Cuba seems to have done well on the mortality front despite a high level of income inequality.
Wages
In Cuba before the revolution, a high proportion of wage recipients worked in the sugar industry. In 1953, about 42 percent of the labor force worked in agriculture, and more than half of agricultural workers earned a living from sugar (MacGaffey and Barnett 1962: 141). Additionally, sugar mills employed about one-third of the 17 percent of the labor force that worked in manufacturing. Domínguez (1978: 73) writes that agricultural workers were positioned "on the bottom of the social structure" and characterizes their living conditions as "shockingly low." Nonetheless, many of them received a wage, if often only for the cane cutting and milling season, which lasted from January to June. Unemployment usually rose from about 8 percent of the labor force during this zafra season to 20 percent during the tiempo muerte (dead season); and some 20 percent of the working population was unemployed for up to eight months of the year (MacGaffey and Barnett 1962: 139, 171).
The relatively high proportion of agricultural wage workers among the rural poor in Cuba contrasts with the situation in other Latin American countries, where the rural poor include a higher proportion of smallholders, tenant farmers, sharecroppers, subsistence farmers, and informal sector workers who do not earn wages at any time of year. Because the families of the poorest members of the labor force are usually those who run the highest risk of early death, wage rates, particularly in the agricultural sector, may be expected to have a stronger relation to mortality levels in Cuba than in many other Latin American countries.
Cuban workers in 1957 are reported to have enjoyed relatively high wages: $6.00 in then-current US dollars for an 8-hour day, compared to US$5.80 in Norway and US$4.29 in France. Agricultural and unskilled sugar workers received $3.00-$4.00 a day, while some skilled workers could make $10.00-$11.00 a day (O'Connor 1964: 144). Also, the share of the national income going to wages and salaries in 1958 was higher in Cuba than in most other Latin American countries for which data are available (Table 11). These relatively high wage rates, which resulted from a combination of strong labor organization and generous wage hikes by presidents interested in buying social peace or electoral support, may have had something to do with the relatively low mortality levels that Cuba had achieved by 1959.
[Insert Table 11 About Here]
Domínguez (1978: 73-74) reports that agricultural wages rose fairly steadily from 1934 to 1957, and Brundenius (1984: 18) reports that the wages paid to sugar workers by the United Fruit Company
McGuire/Frankel LASA 2003
18
rose by 20 percent in real terms between 1946 and 1958, perhaps a bit more slowly than overall GDP per capita (see above), but more or less in line with the growth in the overall economy. The fact that many sugar workers earned these wages for only about half of the year, however, greatly attenuated the effect of their relatively high levels on the well-being of the poor. Fairly high and steadily rising wages, including in the sugar sector, thus probably had less salutary effects on Cuban premature mortality levels and changes than would otherwise have been the case.
Poverty, Nutrition, and Height
Food intake and nutritional status can serve as rough proxies for income poverty, on which little information exists for pre-revolutionary Cuba. Governments often provide the poor with health care, education, and other social services at little or no charge, but they rarely supply food, which the poor must usually purchase with private income. Hence, food intake and nutritional status indicators can provide a certain amount of insight into levels and trends in income poverty. Statistics for the country as a whole can even provide such insights, for it may be assumed that the food consumption of better-off citizens will rise only very modestly regardless of their rise in income.
The availability of calories and protein in Cuba in the early 1960s was about average for Latin America, and was near the Food and Agriculture Organization (FAO) recommended minimums for both indicators for Latin America in the early 1990s (Table 12; MacGaffey and Barnett 1962: 164). Hence, there is no clue here as to why Cuba led the region in mortality decline from 1900 to 1960, or why its infant mortality rate was the lowest in Latin America in 1960. Average calorie and protein availability tells us nothing about the degree to which the poor are able to establish command over the food that is available, however, and adequate food intake is not the same thing as adequate nourishment (Drèze and Sen 1989: 37-42). Indeed, some of the nutritive value of the food consumed by the Cuban rural poor went to parasites, which were reported to afflict some 80-90 percent of rural children in the 1940s (IBRD 1951: 441). The Cuban diet was reportedly also lacking in calcium, vitamin A, and riboflavin, although not in calories or protein (Díaz-Briquets 1983: 47).
[Insert Table 12 About Here]
Information on the evolution of nourishment in pre-revolutionary Cuba can be inferred from data on changes in average height. According to Domínguez (1978: 75), average height increased "considerably" from 1900 to 1964, although more for whites than for blacks (Domínguez 1978: 75). However, "the entire increase in the height of Cuban mulattos and blacks occurred after the early 1930s, while all of the increase in the height of whites occurred before the early 1930s" (Domínguez 1978: 519). Because blacks and mulattos were generally poorer than whites, this observation would seem to imply that the poor after 1930 were becoming better nourished, while wealthier citizens already had adequate food.
If our conjecture about the relation between money income and food intake is correct, the rise in wages, including agricultural wages, after 1946 should have been reflected in higher food consumption. Rice in the 1950s made up nearly a quarter of Cuban caloric intake, and Díaz-Briquets (1983: 48) found that its consumption per capita rose rapidly, to historically high levels, from 1945 to 1950, when the series ends. The post-World War II increase in rice consumption is consistent not only with the rise
McGuire/Frankel LASA 2003
19
in wages, but also with the rapid mortality decline that took place during that period. The evidence collected so far thus suggests that GDP per capita growth, rising agricultural wages, increased consumption of food staples, and the average height of the poor all rose in tandem in the years after World War II, possibly contributing to the acceleration of mortality decline during the period.
Urbanization
In Europe until about 1850 urban residence was associated with higher mortality. After about 1900, however, the positive effects of easier health care delivery, better infrastructure, and increased biological resistance began to outweigh the negative effects of crowding and exposure to disease (Easterlin 1996: 73-79). Assuming that urban residence in Cuba from 1900 to 1960 conferred a similar balance of costs and benefits, and recognizing that almost all accounts of Cuban health and education services before the revolution highlight a huge imbalance in favor of the cities, particularly Havana, it is worth asking whether the precipitous decline in premature mortality from 1900 to 1960 can be traced to a substantial shift in population from rural to urban areas during the period, particularly after the Second World War when the pace of mortality decline picked up.
No such titanic shift seems to have taken place. Although Cuba in 1960 had the fifth-highest level of urbanization in Latin America (Table 13), the pace of urbanization was not rapid. Because the definition of "urban" changed from census to census, our main criterion for urbanization, following Luzón (1987: 101-103), will be the proportion of the population in the country's 25 largest cities. This proportion rose only from 31 to 39 percent from 1899 to 1953, and the share in the city of Havana actually declined from 16 to 14 percent, although the share in the Havana metropolitan area rose from 18 to 21 percent (Table 14). Time-series for other Latin American countries are unavailable, but the rise in urbanization in Cuba from 1900 to 1960 was probably not among the highest in the region. From 1943 to 1953, moreover, during roughly the first half of the period of fastest mortality decline, the share of the population in the 25 largest cities rose only from 36 to 39 percent, while the share in the city of Havana fell. A moderately high level of urbanization by comparison with other Latin American countries probably did facilitate rapid mortality decline from 1900 to 1960, but the slow pace of urbanization in Cuba may well have made its rate of mortality decline slower than it would otherwise have been.
[Insert Tables 13 and 14 about Here]
Fertility
A decline in fertility tends to promote a decline in infant and child mortality by increasing birth spacing, by lessening the number of higher-order parities, by reducing the share of births to very young and to very old mothers, by enabling parents to devote more attention to each child, and by ameliorating the burden on obstetric and pediatric services. Among 20 Latin American countries, Cuba had the third-lowest fertility rate in 1960 (Table 15). From 1900 to 1960, moreover, the age-standardized birth rate fell more in Cuba than in any other Latin American country for which data are available, except Argentina (Table 16). Hence, low fertility and rapid fertility decline may well have contributed to Cuba's strong performance at reducing premature mortality from 1900 to 1960. It should be noted, however, that most of the drop in fertility took place from 1919 to 1943 (Table 17), well before the period of
McGuire/Frankel LASA 2003
20
fastest mortality decline from 1943 to 1959 (Tables 1 and 2). Fertility decline in the 1920s and 1930s may have encouraged mortality decline in the 1940s and 1950s, but the mechanisms of such a lagged effect are unclear. To the extent that fertility decline promotes mortality decline by mechanisms involving infant mortality, the effect would seem to be contemporaneous, or lagged at most by a year or two.
[Insert Tables 15, 16, and 17 About Here]
Some modernization factors thus facilitated rapid mortality decline, while others seem to have deterred it. Given this mixed performance, it is well worth examining pre-1959 policies in education, disease control, and health care to see whether part of the explanation for Cuba's rapid mortality decline may lie with such policies, notwithstanding the reputation of most pre-revolutionary governments as failures in each of these areas.
5. Social Policies and Mortality Decline
This section will discuss education, provision of safe water and adequate sanitation, mosquito control, and health care delivery, with an emphasis on the structure of the health system, the level and distribution of health personnel, and the access of the poor to health services. In general, Cuban governments did well, but not exceptionally well, at expanding literacy from 1900 to 1960. Moreover, the biggest improvements in literacy took place well before the rate of mortality began to accelerate after World War II. Cuban governments did poorly at throughout the period at providing access to safe water and adequate sanitation. Their performance in health care sector was mixed. Services were heavily biased toward urban areas, particularly Havana, but impoverished rural Cubans may well have had better access to basic health care than the rural poor of most other Latin American countries.
Education and Literacy
Literacy and educational attainment are valuable in themselves, and can also help to reduce the risk of early death. Female education is particularly important to the reduction of infant and child mortality. More educated women know more about nutrition, sanitation, and health, and tend to be more assertive in demanding food and health care for children. They are, moreover, more likely to use modern health facilities and to employ child care practices that improve health (Caldwell and Caldwell 1993).
Cuban governments before the revolution were publicly committed to education. The constitutions of both 1901 and 1940 mandated free and compulsory education (MacGaffey and Barnett 1962: 157), and the 1920s have been called "a period of remarkable educational achievement" (Domínguez 1978: 71). Total literacy rose 10 percent, and female literacy 13 percent, between the censuses of 1919 and 1931 (Table 18). In 1936 the army, led by Fulgencio Batista, established the first of more than 1000 rural misiones educativas (civic-military schools) in which soldiers taught reading, writing, agricultural techniques, nutrition, and hygiene. Day sessions were for children; adults could attend three evenings per week (Pérez 1976: 111-112). These schools were not always adequately equipped (MacGaffey and Barnett 1962: 159), but by the end of the 1930s, an estimated 100,000 persons had enrolled in them
McGuire/Frankel LASA 2003
21
(Pérez 1988: 279). In 1944 and 1945 the education ministry built more than 2000 classrooms and expanded school lunch and health programs, but the minister who sponsored these measures became "too popular for his own good" and was replaced in 1945 by José Manuel Alemán, who was notorious for corrupt practices. Among his many disservices to Cuban education, Alemán discontinued the army's rural misiones educativas in 1946 (Ameringer 2000: 32-35).
[Insert Table 18 About Here]
On the downside, however, school administration was overcentralized, reducing local initiative and responsiveness to local needs, and the education ministry was plagued by turnover, policy discontinuity, patronage appointments, and corruption (Ameringer 2000: 32-36). President Ramón Grau San Martín (1944-1948) built new school facilities and expanded the school lunch and health programs, but located the new facilities where they could be showcased, rather than where they were needed (Ameringer 2000: 72). Education in Cuba also suffered from urban bias. In 1953, 88 percent of urban residents were literate, compared to only 58 percent of rural residents (Mesa-Lago 2000: 172). Oriente, Cuba's poorest province, enrolled only 20 percent of 5-13 year-olds in primary school, compared to 69 percent in Havana (Nelson 1950: 228). Those rural children who managed to enroll in a primary school often went to class "in a one-room schoolhouse where the teacher has all six grades, is probably inadequately trained, and works without adequate books and supplies" (IBRD 1950, quoted in MacGaffey and Barnett 1962: 161). As late as the 1930s, according to a report by the Foreign Policy Association (1935: 130, 137), no secondary schools existed outside of the six provincial capitals, resulting in a situation where "schools in Cuba are failing entirely to meet the needs of the rural population."
These advantages and handicaps in education seem to have balanced out to a modest plus. Cuba ranked 6th of 18 Latin American countries in percent rise in literacy from 1900 to 1960, and 5th of 18 on percent literate in 1960 (Table 19). This performance was fairly good, but not nearly as good as Cuba's performance on mortality decline. Moreover, the period of rapid literacy expansion (1899-1931) was a period of slow mortality decline, and vice versa (Table 18). Literacy might have exerted a lagged effect on mortality decline, particularly because it was measured in the population 10 years of age and older, but in 1931-1943, the decade leading up to the post-1945 plunge in premature mortality, female literacy actually fell (Table 18). In cross-national studies, female education is usually found to be highly beneficial for achieving longer life expectancies and lower infant mortality rates (e.g. Caldwell 1986, Filmer and Pritchett 1999). Cuba, however, achieved exceptionally fast mortality decline without exceptionally rapid growth in educational attainment from 1900 to 1960, either for males or for females.
[Insert Table 19 About Here]
Water and Sanitation
Access to safe water reduces premature mortality by lowering the costs of washing and by reducing the risk of contamination from well water and inadequate home storage. Access to adequate sanitation also reduces the risk of contamination. Cuba from 1899 to 1953 did poorly at extending access to safe water and adequate sanitation beyond the upper strata of the population in Havana and
McGuire/Frankel LASA 2003
22
some other large cities. The proportion of Cubans who obtained water from a spring, stream, or well (the latter "were everywhere suspect"; Thomas 1971: 433), as opposed to a pipe or cistern, actually fell from 62 percent in 1899 to 57 percent in 1953. In rural areas, the share with access to piped water remained at only 2 percent, while the share obtaining water from a cistern fell from 54 percent in 1899 to 13 percent in 1953. The share of homes with a toilet or outhouse rose from 47 to 77 percent from 1899 to 1953, but the proportion in rural areas rose only from 32 to 46 percent (Díaz-Briquets 1983: 41-45). Redefinition by the census authorities of pipe, well, privy, and so on may have contributed to the apparent lack of progress, but the evidence at hand suggests a very weak performance. According to a World Bank mission, as late as 1950 some 80 to 90 percent of rural children suffered from intestinal parasites, owing primarily to "widespread ignorance of even elementary sanitation and unsanitary water supplies" (IBRD 1951: 441).
Mosquito Control
Yellow fever, a painful and deadly mosquito-borne disease, is thought to have been transmitted from Africa to the West Indies on slave ships in the 1600s. From the West Indies it traveled to port cities all over the Western Hemisphere. A yellow fever epidemic literally decimated Philadelphia in 1793, causing the deaths of an estimated 5,500 of the city's 55,000 inhabitants, and subsequent outbreaks devastated Memphis, New Orleans, and other large cities (Spielman and D'Antonio 2001: 53-65). Many in the United States regarded Cuba as the source of these epidemics, and there was talk of invading the island solely to prevent the spread of the disease (Spielman and D'Antonio 2001: 122). A mild form of yellow fever afflicted many infants in Cuba, conferring subsequent immunity (Danielson 1979: 97). Foreigners, however, were vulnerable. During their occupation from 1898 to 1902 an estimated 80 percent of US army troops came down with the disease (Spielman and D'Antonio 2001: 122). More Spanish and US soldiers died of disease, especially yellow fever, than of battle injuries during the Spanish-American War from 1895 to 1898 (Danielson 1979: 78-79; Thomas 1971: 405, 414).
The danger of yellow fever and malaria gave the US government a strong interest in mosquito control, health education, quinine provision, trash collection, patient isolation, and other sanitary reforms in Cuba. The United States was able to act upon this interest when it occupied Cuba from 1899 to 1902 and from 1906 to 1909 (Lockmiller 1938: 112-117; Danielson 1979: 89-92; Díaz-Briquets 1983: 28-36; Centro de Estudios Demográficos 1976: 15). In 1899 William Gorgas, head of Havana's Department of Sanitation, turned Havana into "what may have been the cleanest major city on earth" (Spielman and D'Antonio 2001: 123) by eliminating open sewers and carting off garbage. Gorgas's policies failed, however, to eliminate yellow fever. Building on the work of Carlos Finlay, a Cuban physician who was "the first to state the hypothesis concerning transmission of yellow fever by the mosquito" (Danielson 1979: 98 n. 29), the US army physician Walter Reed set out to show that mosquitoes spread the disease. Gorgas ordered soldiers to drain standing water from ditches, spread oil on the surface of ponds, isolate yellow fever sufferers in screened rooms, fumigate houses, and "swat adult mosquitoes, one by one" (Spielman and D'Antonio 2001: 122). Yellow fever deaths in Havana thereupon dropped from 706 (the annual average for the thirty-year period preceding the occupation) to 310 in 1900 and 0 in 1902 (Danielson 1979: 90), providing strong evidence in favor of the mosquito
McGuire/Frankel LASA 2003
23
theory. Meanwhile, the death rate from malaria in Havana fell from 59 to 8 per 100,000 in 1901-07 (Díaz-Briquets 1981: 403) and continued to decline thereafter.
Even after withdrawing from Cuba in 1909, the United States continued to pressure Cuba to monitor disease outbreaks and sanitary conditions. The Platt Amendment to the Cuban constitution of 1901, which remained in effect until 1934, included a clause that authorized the United States to invade and re-occupy the island if the government neglected disease control (Díaz-Briquets 1983: 35-37). Such US political influence in Cuba from 1900 to 1930 had many negative consequences, but it did help to reduce the incidence of mosquito-borne disease. These advances in sanitation and mosquito control in the first decade of the 20th century did not, however, produce an immediate decline in premature mortality. Indeed, premature mortality fell more slowly in Cuba during the first decade of the 20th century than in any other decade except the 1960s (Tables 1, 2, and 4).
Organization of the Health System
Cuba's health care system before 1959 was divided into contributory, private, and public sectors. The contributory sector served the middle classes, some of the organized working class, and many of the rich. The purely private sector was rather small by Latin American standards; it served mainly the rich, although many people who were not rich purchased private medical services for some purposes. The purely public sector served mainly the poor, although many who were not poor used its services at one time or another.
The most distinctive feature of the contributory sector in pre-1959 Cuba was the role of mutualist associations, many of which emerged in the late 19th century to help impoverished immigrants from Galicia, Asturias, and other Spanish regions. The mutualist associations offered medical services either through their own clinics, doctors, and hospitals (known as quintas), or through contracts with outside health facilities and health personnel. They were governed by boards of directors elected by the membership, and many offered educational, recreational, and welfare services as well as medical care. After a time, many began to widen their memberships to include women (who had been initially excluded) and persons who hailed from regions other than that of the originating group. Helping to keep the monthly prepayments that funded the associations low, many doctors accepted low salaries "because of the prestige that accrued, as well as the advantages of the interesting work in the large, well-equipped hospitals, and the opportunity for professional advancement" (Foreign Policy Association 1935: 120). By 1927, mutualist associations served nearly half the population of metropolitan Havana, and the approximately 350,000 members who lived outside Havana in the 1950s were entitled to use association facilities in the capital, as well as any that existed in the cities and towns of their home provinces (Hernández 1969: 538-541; Danielson 1979: 76-78, 113-115, 120-121; Díaz-Briquets 1983: 51, 103).
Although the mutualist associations provided important health services to a remarkably large share of the population, they "were removed from sanitary and preventive functions, were inadequately linked to hospital and specialty services, made ineffective use of auxiliary personnel and extravagant use of physicians, and were largely disconnected from a geographically defined base" (Danielson 1979: 178). Also, many of the ethnically-based mutualist associations banned nonwhites altogether, while others
McGuire/Frankel LASA 2003
24
segregated them from white patients (Danielson 1979: 120). In general, the mutualist associations served Cubans of "moderate income" in Havana and a few other large cities; most other Cubans from the interior were too poor to pay the monthly fee (Foreign Policy Association 1935: 120). Hence, racism and the need to make regular, if modest, prepayments, meant that poor people generally received few benefits from mutualist health care services. Nonetheless, the mutualist associations "provided at least limited medical services to the segment of the population unable to pay the fees required to join" (Díaz-Briquets 1983: 51).
New, non-ethnically based mutualist associations known as medical cooperatives began to spring up in the 1920s. They catered to more elite sectors of the population and did more in the way of home visits, being generally poorly endowed with facilities but having a great many physicians under contract. Unlike the mutualist associations, members did not have a say in the governance of the medical cooperatives, and the services the cooperatives provided varied widely in scope and quality. Their expansion was hampered by their need to charge low fees to compete with the mutualist associations, which generally offered more diverse and higher quality services (Hernández 1969: 540-541; Danielson 1979: 113-115). In 1958, according to one estimate, 1,150,000 Cubans, one-fifth of the total population, belonged either to a mutualist health association or to a medical cooperative (Hernández 1969: 555).
In 1938, the communist-led transport workers' union inaugurated a contributory health care plan funded by payroll deductions, similar to funds that existed during the 1940s in Argentina (obras sociales) and Brazil (caixas). The transport workers soon opened their plan to workers outside the sector, and by 1959 it had about 25,000 members, including some from outside Havana. The health facilities run by the transport workers, unlike those of the mutualist associations, "served a substantial number of nonwhite Cubans and served them without discrimination or segregation." Many of the physicians who worked for the association were sympathetic to the political left. By 1959, the association had "become a center of considerable experimentation and innovation, with emphasis on preventive medical efforts" (Danielson 1979: 120, 150).
Very few hospitals delivered services exclusively for out-of-pocket payments; the private sector consisted mainly of doctors who worked part time for the university hospital in Havana, other public hospitals, mutualist health associations, or medical cooperatives (Hernández 1969: 541, 557). In pre-revolutionary Cuba, then, the purely private sector was smaller, and the contributory sector larger, than in most other Latin American countries at similar stages of economic development. Moreover, although the contributory sector in Cuba included some union-based health insurance funds similar to the Argentine obras sociales or Brazilian caixas, more important were the mutualist associations and medical cooperatives. The small role for the private sector and big role for mutualist and cooperative associations may have made it easier to socialize the entire medical system in the 1960s (Danielson 1979: 121).
The poor who received health care usually received it from the public system run by the Department of Public Health. In the 1950s, the government allocated about 7.5 percent of its budget to "health and welfare," but these funds were depleted by "graft and waste." The number of persons employed to control malaria, for example, continued to soar well after the disease had been brought
McGuire/Frankel LASA 2003
25
under control. Public health jobs were often allocated by patronage, and medical facilities were often built in accordance with "political rather than technical decisions" (MacGaffey and Barnett 1962: 167-68). As was also the case in the private and contributory sectors, public health facilities and health personnel were overconcentrated in Havana. Rural poor people nonetheless could often, although not always, get health care when they needed it. This access, we believe, helps to explain why pre-1959 Cuba became Latin America's unlikely champion of premature mortality decline.
The Health Care System: Personnel, Facilities, and Programs
By comparison to other Latin American countries, Cuba in the late 1950s was amply endowed with both doctors and nurses, although nurse's aides and hospital beds were in comparatively shorter supply (Table 20). Indeed, as early as the 1930s, foreign observers regarded Cuba as oversupplied with physicians, and a mission sent by the International Labour Organisation recommended limiting the number of new medical graduates each year (Foreign Policy Association 1935: 116, 121). One reason why Cuba had so many doctors may have been that many landholding families responded to losses in the late 1800s (due to war, economic crisis, technological change, and the influx of US capital) by sending their children to medical school, so that "the tottering sugar oligarchy and declining aristocracy gave birth to medical dynasties which came to predominate among the future names of Cuban medicine" (Danielson 1979: 75). Another reason for the ample supply of physicians may have been the free tuition and excellent facilities for medical training at the University of Havana, where more than 1500 students were registered in the 1929-1930 academic year (Foreign Policy Association 1935: 116). The mutualist associations, by continuing to employ doctors even at times of economic depression and crisis, may also have slowed what would otherwise have been an exodus from the profession (Roemer 1991: 448).
[Insert Table 20 About Here]
Changes over time in the number of doctors per capita may go some way toward explaining Cuba's remarkable success at reducing premature mortality from 1900 to 1959. The more doctors and nurses a country has, all else equal, the greater the supply of medical services, although the poor might well be better off if some of the resources that went into training and paying such highly-skilled professionals went into training and paying other types of health workers. As Table 21 shows, population per physician rose (worsened) from 1899 to 1931, and then declined only slightly from 1931 to 1943. From 1943 to 1953, however, the number of persons per doctor plunged from 1,846 to 940 (Table 21). Part of the reason for this plunge (which indicates a spike in the number of doctors) may have been that growing numbers of retired or semi-retired physicians were reporting that their occupation remained "physician," even as new medical graduates entered the ranks and the life expectancy of retired doctors rose. Such an explanation seems insufficient, however, to explain what would appear to be a doubling of the number of doctors per capita in a single decade. No other indicator we have considered takes such a big jump right when the pace of mortality decline accelerated.
[Insert Table 21 About Here]
McGuire/Frankel LASA 2003
26
Virtually every account of health personnel in pre-1959 Cuba lays enormous stress on the overconcentration of doctors and health facilities in the city of Havana. By 1955 the province of Havana contained 62 percent of Cuba's doctors, most of whom worked in the Havana metropolitan area (Hernández 1969: 550). The overconcentration of doctors and health facilities in Havana was bad for the rural poor, but probably benefited the poor in Havana. With an estimated indigent population of 200,000, Havana in the early 1930s had one poor relief physician for every 2,964 inhabitants, or one for every 1,070 poor persons. The city also had 3,000 free hospital beds, one for every 180 inhabitants and one for every 67 indigent people (Foreign Policy Association 1935: 119).
It would be wrong to suppose that Cubans outside Havana were entirely deprived of medical care, moreover. According to the Foreign Policy Association (1935: 119), "great numbers of indigents come to Havana from the interior for hospitalization." The problem of the spatial maldistribution of doctors was partly attenuated, it would seem, by Cuba's comparatively small geographical size and relatively well-developed transport system (Hernández 1969: 551). As early as 1935, some of the larger cities outside Havana provided free medicine to the poor, and each of Cuba's 124 districts or municipios employed doctors to care for the sick poor. About 200 physicians outside Havana were employed in this fashion, usually on a part-time basis (Foreign Policy Association 1935: 107, 116-18). In the interviews conducted by Oscar Lewis and his collaborators in 1969-70, even very poor women reported having gone to hospitals and doctors in pre-1959 Cuba, including for prenatal care (Lewis, Lewis, and Rigdon 1977: 131, 135, 147, 245).
The 1946 agricultural census found that Cuba had some 423,000 farm laborers (Nelson 1950: 164). A majority of these agricultural wage workers were employed in harvesting and milling sugar cane. It is therefore worth noting that big sugar mills were legally required to have a doctor on hand to treat job-related injuries and to supervise sanitary conditions. Moreover, "many plantations [went] much further than the legal requirements, supplying free medical care, nursing service, medicines and sometimes hospitalization for their employees" (Foreign Policy Association 1935: 118-19). Others, however, seem to have complied more with the letter than the spirit of the law. Around 1920, the hospital of the Santa Lucia sugar mill in Oriente province had very poor hygienic conditions, according to a patient (Núñez Machín 1981: 30). By 1941 the United Fruit Company, Cuban-American Sugar, and Cuba Cane were each deducting 1-2% of their workers' salaries for health care. The United Fruit company built two hospitals and several nursing stations on its holdings; it also introduced mosquito control measures and provided quinine to people with malaria in the parts of Oriente in which it operated (United Fruit Company 1976: 310-313). The United Fruit Company sugar plantation at Preston, in Oriente province, is reported to have used malaria control methods that helped to "reduce the devastation of this disease to the vanishing point" (Foreign Policy Association 1935: 99).
Governments in pre-1959 Cuba initiated rudimentary primary health and mother and child health care initiatives that may also have contributed to mortality decline. "Child hygiene services" functioned in Havana and some other large cities in the early 1930s (Foreign Policy Association 1935: 110). The army in 1933 launched a successful campaign against yaws and began to encourage the use of cement floors, sealed wells, and latrines in home construction (Batista 1964: 93). Such encouragement came without funding, however, and in 1946, a house with such amenities cost about $2000 (in then-current
McGuire/Frankel LASA 2003
27
US dollars) at a time when the average income of an agricultural household was about US $800. More usual, and less healthy, was a thatched hut with a dirt floor, which could be built for a more affordable US $200 in materials (Nelson 1950: 202-04). In 1934, congress passed a law mandating contributory maternity insurance for working women and the wives of male workers. The contributions came from employers, workers, and the government, and were used to build, equip, and staff maternity hospitals and to pay for physician or midwife services for those who could not, or preferred not to, use hospital facilities. Services provided included prenatal and postpartum care as well as attendance at the moment of birth (Hernández 1969: 537). In 1946, the government launched a campaign against intestinal parasites (Díaz-Briquets 1983: 82).
The foregoing description is not meant to imply that the poor had excellent health care in pre-1959 Cuba. The doctors who served the poor in the cities and towns of the interior had low salaries, eschewed home visits, and were "largely untrained in the technique of public health procedure." The government budgeted no monies to permit these doctors to travel, although "many people from the country came to [their] office[s] for quinine and vaccination" (Foreign Policy Association 1935: 107, 116-18). Also, despite the country's small geographical size and fairly good transportation network, many Cubans continued to live in inaccessible areas. In a 1943 survey, 392 of 742 rural families lived on roads that were impassable to vehicles except in the dry season (Nelson 1950: 248). People in such areas could experience great hardship in seeking medical care (Nelson 1950: 17-18). Patronage considerations governed access to medical care in many areas. It was often necessary to appeal to a "political organization" to gain access to a clinic or hospital bed, and medical "services were channeled to the rural population through leaders of the party in power. Those using the health services and facilities were strongly reminded of the source of the benefits, and many were required to vote accordingly" (MacGaffey and Barnett 1962: 168). Health care for the poor in Cuba before the revolution was not good in any absolute sense, but a higher proportion of the poor may well have had access to minimally adequate medical care in Cuba than in most other Latin American countries.
6. Labor Movement Strength
A study of 16 middle-income developing countries in East Asia and Latin America from 1960 to 1995 found that those with stronger labor movements made, counterintuitively, slower progress than those with weaker labor movements at reducing the risk of early death (McGuire 1999). Cuba from 1900 to 1960, with its powerful labor movement and rapid mortality decline, represents a stark exception to this pattern. During this period Cuba made the region's greatest progress at raising life expectancy and reducing infant mortality, even though it had, particularly after the mid-1930s, one of the strongest labor movements in Latin America and possibly in the world (O'Connor 1964: 148; Table 22). Indeed, mortality decline was fastest during the 1940s and 1950s, when the labor movement was strongest.
[Insert Table 22 About Here]
In addition to organizing a large share of the labor force (Table 22), the Cuban labor movement had a long history of militancy. Port workers went on strike as early as 1902, and sugar, port, and transport workers launched important strikes in 1917-1920 and 1923-1925. Strikes by workers in
McGuire/Frankel LASA 2003
28
Havana were instrumental in bringing down the dictator Gerardo Machado, who ruled from 1925 to 1933 (Alba 1968: 289-291; Domínguez 1978: 50-51).
Leaders had two options for dealing with labor: repression or concession. Pre-revolutionary governments made liberal use of each approach. Machado used harsh repression but was unable to subdue the workers. Grau San Martín courted labor during his first presidency in 1933-34, but the massive strike activity that followed his overthrow ushered in another year of harsh repression. By 1936, however, Batista, now the power behind the scenes, was seeking a more legitimate basis for his rule, and was concerned that the power and militancy of the communist-led labor movement could threaten political stability (Domínguez 1978: 79, 87, 96). At the same time, communist parties throughout Latin America, Cuba included, were turning to electoral politics in accordance with Stalin's united front strategy. In the 1940 elections, moreover, Batista's main competitor was the left-leaning Ramón Grau San Martín, so by moving to the left Batista could improve his electoral chances. Consequently, the stage was set for an alliance between Batista and the communist-led unions. The alliance was sealed, and in the late 1930s and early 1940s, many pro-labor laws were passed, strongly pro-labor clauses were added to the 1940 constitution, and the Communist Party was legalized. The Auténtico governments of 1944-1952 continued to support worker-friendly legislation, and after Batista returned to power in a 1952 coup he attempted to buy off workers with employment and public works programs, even as he harassed unions and cracked down on strikes.
The Cuban labor movement had both considerable electoral clout and the capacity to damage and destabilize the economy through strikes and other militant actions. Because the Cuban labor movement continuously demonstrated its ability to withstand repression, and because repression is a costly way to rule, post-1933 governments yielded, at least in part, to worker demands. As noted previously, unions were able to secure relatively high wages, helping workers to improve their living standards and allowing some to join the mutualist associations or health care funds run by the unions themselves. These conquests led to improved survival outcomes for workers, including many very poor workers in the sugar industry. It is possible that a rising demand for health care among unionized workers contributed to the rapid growth in the number of physicians from 1943 to 1953, but more research is needed to explore this hypothesis.
The Cuban governments of 1934-1959 were heavily dependent on clientelism and patronage and tended especially to exchange favors with labor bosses. Cuba would seem therefore to be a strong candidate to fall into a pattern typical of Argentina, Brazil, and Chile, wherein labor unions, in alliance with better-off groups, induce governments to enact urban-biased and formal sector-biased policies that contribute to the neglect or further impoverishment of the rural and urban poor (McGuire 1999). One difference between Cuba and other Latin American countries is, however, that sugar workers in Cuba comprised a significant share of both union members and the rural poor. In 1934, 100,000 of the 300,000 organized workers in Cuba came from the sugar industry; many others worked in the tobacco industry (Alba 1968: 292). In 1942, the Cuban Labor Confederation (CTC), which had been organized in 1939 and was led by the Communists (who had made a pact with the Batista government), claimed 345,000 workers, among which were 102,000 sugar workers and 60,000 tobacco workers (Raggi Ageo 1944: 194). In other Latin American countries during the 1930s and 1940s, union membership
McGuire/Frankel LASA 2003
29
was more exclusively urban. Consequently, Cuban unions represented less of a "labor aristocracy" than, say, the labor movements of contemporary Argentine, Brazilian, Chilean, or Venezuelan. Hence, benefits won by the labor movement from employers and the government benefited a poorer section of the labor force in Cuba than in these other Latin American countries. The Cuban labor union movement was also quite strong (Table 22), so it was able to extract a fairly high overall level of benefits (Table 11), as well as to channel an unusually large share of them toward rural workers. Hence, labor movement strength may well have contributed to rapid mortality decline in Cuba from 1900 to 1960.
7. Conclusion
Cuba from 1900 to 1959 raised life expectancy and reduced infant mortality faster than any other Latin American country for which data are available, despite suffering from slow economic growth, high income inequality, inadequate provision of safe water and sanitation, a scarcity of rural health facilities and health personnel, and rampant corruption and maladministration, not least in the health sector. Part of the explanation for this perplexing outcome may well involve fertility decline, literacy expansion, urbanization, and mosquito control, but most of the gains on in these areas occurred before 1945, whereas Cuba's greatest progress in raising life expectancy and reducing infant mortality occurred after 1945. We believe that access to health care for an unusually large share of the population (by then-current Latin American standards) may have played a greater role than previously recognized in Cuba's success at reducing the risk of early death, although more research needs to be done to explore this hypothesis.
Access to health care in Cuba was improved by the country's bountiful supply of health personnel. The great majority of these personnel worked in big cities, especially Havana, but Cuba was geographically small and had a good transportation network. Cuba had a lot of physicians because medicine became a preferred vocation of scions of the old agricultural elite displaced at the end of the 19th century by economic crisis, US capital, technological change, or war; because the University of Havana medical school was cheap and fairly good; and possibly because the widespread prevalence of pre-paid health plans increased the demand for health personnel.
An additional reason for the rapid mortality decline in Cuba from 1900 to 1960 was that small towns and rural areas were not completely devoid of health services. The government paid physicians to provide free health care in many areas, and from time to time the army or a government ministry would undertake a sanitation or health education campaign. Also, the government provided fairly extensive health services to the urban poor in Havana, and many poor people from the countryside came to Havana to use these services as well.
A very large proportion of the rural poor in Cuba earned wages in the sugar industry, although many of these workers could find employment in the industry for only 3-4 months per year. This peculiarity of Cuba's rural social structure had two consequences conducive to a rapid decline in mortality. First, the big sugar mills usually had doctors and hospitals. Second, sugar workers were highly unionized, making the Cuban trade union movement less of a "labor aristocracy" than, say, the contemporary Argentine, Brazilian, Chilean, or Venezuelan labor movements. Hence, the benefits that the Cuban labor movement extracted from employers and the government benefited a poorer section of
McGuire/Frankel LASA 2003
30
the labor force than in many other Latin American countries. The Cuban trade union movement was also quite powerful, so it was able to extract a fairly high overall level of benefits, as well as to channel an unusually large share of them toward poor people in rural areas.
In short, modernization, education, and disease control help explain Cuba's remarkable success from 1900 to 1960 at reducing the risk of early death, but their effects were partly offset by slow economic growth and high income inequality. Access to health care for an unusually wide range of the poor seems also to have made an important difference. This access, in turn, depended upon (1) a bountiful supply of doctors and nurses; (2) the island's small geographical size; (3) fairly good health services for the urban poor, and at least some health services for the rural poor; (4) an unusual rural class structure in which a large fraction of the rural poor were wage workers; and (5) an unusually powerful trade union movement with an unusually rural constituency.
McGuire/Frankel LASA 2003
31
Appendix 1
Calculation of the Mean Annual Percent Change in Infant Mortality and Life Expectancy: Examples
Infant Mortality (Table 1) (1) In column 1, the total percent decline in infant mortality from 1899 to 1907 is (265-213)/(265), or 19.6 percent. (2) Our (crude) measure of the annual percent decline is therefore 19.6 percent ÷ 8 years, or 2.45 percent (using a compound interest function doesn't make much difference because our intervals are fairly short). (3) Each cell in Column 1 for the years 1899-1906 inclusive thus acquires a value of 2.45 percent. (4) This procedure is repeated for the remaining pairs of successive observations in Column 1 (e.g., 1907-1919, 1919-1931, etc.), and then for each pair of successive observations in Columns 2-7 consecutively. We thus make use of Díaz-Briquets's two series for Havana (Columns 6 and 7) but exclude the vital registration series for Cuba as a whole (Column 8). (5) The result of this exercise is a grid resembling Table 1, with the years 1899 to 1960 down the side and seven infant mortality series across the top. Each cell in the grid contains an annual percent decline value (in other words, each cell in the grid is filled, unlike the grid in the existing Table 1). (6) We then take the mean of the percent decline values in each row (year) and record it in the cell at the end of the row (Column 9). Life Expectancy (Table 2) (1) In Column 1, the total percent rise in life expectancy at birth from 1900 to 1905 is (34.20-33.16)/(85.0-33.16), or 2.04 percent (the percent rise in life expectancy calculation stipulates a "target" of 85 years). (2) The annual percent rise for the period is thus 2.04 percent ÷ five years, or 0.41 percent. (3) Each cell in Column 1 from 1900 to 1904 inclusive thus acquires a value of 0.41 percent. (4) This procedure is repeated for the remaining pairs of successive observations in Column 1, and then for all pairs of successive observations in Columns 2-7. (5) The value in each cell in Column 8 is the mean of the resulting annual percent decline figures in each row (year).
McGuire/Frankel LASA 2003
32
References Alba, Victor (1968). Politics and the Labor Movement in Latin America. Stanford, CA: Stanford University Press. Alonso, José F., Ricardo A. Donate-Armada, and Armando M. Lago (1994). "A First Approximation Design of the Social Safety Net for a Democratic Cuba." In Cuba in Transition, V. 4. Proceedings of the Fourth Annual Meeting of the Association for the Study of the Cuban Economy (ASCE), Florida International University, Miami, FL, August 11-13, 1994. Accessed March 4, 2003, at http://lanic.utexas.edu/la/cb/cuba/asce/cuba4/ Ameringer, Charles D. (2000). The Cuban Democratic Experience: The Auténtico Years, 1944-1952. Gainesville: University Press of Florida, 2000. Anuario Estadístico de la República de Cuba (1915). Año 1--1914. Director: Orestes Ferrara. La Habana: "El Siglo XX" de Aurelio Miranda. Astorga, Pablo, and Valpy FitzGerald (1998). "The Standard of Living in Latin America During the Twentieth Century." Centro Studi Luca D'Agliano - Queen Elizabeth House Development Studies Working Paper No. 117, St. Antony's College, University of Oxford. Barraclough, Solon (2000). "Protecting Social Achievements during Economic Crisis in Cuba." In Dharam Ghai, ed., Social Development and Public Policy: Some Lessons from Successful Experiences. London and New York: St. Martin's Press and United Nations Research Institute for Social Development, 229-276. Batista, Fulgencio (1964). The Growth and Decline of the Cuban Republic. New York, NY: Devin-Adair. Benjamin, Medea, Joseph Collins, and Michael Scott (1984). No Free Lunch: Food and Revolution in Cuba. San Francisco, CA: Institute for Food and Development Policy. Brundenius, Claes (1979). "Measuring Income Distribution in Pre- and Post-Revolutionary Cuba." Cuban Studies/Estudios Cubanos 9 No. 2 (July), 29-44. Brundenius, Claes (1984). Revolutionary Cuba: The Challenge of Economic Growth with Equity. Boulder, CO: Westview Press. Bureau of Inter-American Affairs (1998/2002). "Zenith and Eclipse: A Comparative Look at Socio-Economic Conditions in Pre-Castro and Present Day Cuba." February 9, 1998. Revised June 2002. Accessed February 7, 2003, at http://www.state.gov/p/wha/ci/14776.htm Caldwell, John C. (1986). "Routes to Low Mortality in Poor Countries." Population and Development Review 12 No. 2 (June), 171-220.
McGuire/Frankel LASA 2003
33
Caldwell, John, and Pat Caldwell. (1993). "Women's Position and Child Mortality and Morbidity in Less Developed Countries." In Nora Federici, Karen Oppenheim Mason, and Sølvi Sogne, eds., Women's Position and Demographic Change. New York, NY: Oxford University Press. Carnell, Brian. "Cuba vs. the United States on Infant Mortality." February 21, 2002. Accessed February 6, 2003 at http://www.skepticism.net/print/articles/2002/000022.html Catasus Cervera, Sonia, and Raúl Hernández Castellón (1977). "Algunas consideraciones en torno a la mortalidad infantil en Cuba." Revista Cubana de Administración de Salud 3 No. 3 (July-September), 281-288. CELADE [Centro Latinoamericano de Demografía] (1977). "Latin America: Evaluation of the Demographic Situation in the Period 1970-1975. Comparison of Previous Estimates with Those Derived from Recent Data." Series A, No. 158. July. Santiago de Chile: CELADE. Centro de Estudios Demográficos (1976). La población de Cuba. La Habana: Editoral de Ciencias Sociales. CEPAL/CELADE [Comisión Económica para América Latina y el Caribe/Centro Latinoamericano y Caribeño de Demografía] (2002). "América Latina y Caribe: Estimaciones y Proyecciones de Población 1950-2050." Demographic Bulletin Año 35 No. 69 (January)
Chomsky, Aviva (2000). "'The Threat of a Good Example': Health and Revolution in Cuba." In Jim Yong Kim et al., eds., Dying for Growth: Global Inequality and the Health of the Poor. Monroe, ME: Common Courage Press, 331-357. Collver, O. Andrew (1965). Birth Rates in Latin America: New Estimates of Historical Trends and Fluctuations. Berkeley, CA: Institute of International Studies, University of California. Corman, Hope, and Michael Grossman (1985). "Determinants of Neonatal Mortality Rates in the U.S.: A Reduced Form Model." Journal of Health Economics 4 No. 3 (September), 213-236. Cuba (1943). Informe general del censo de 1943. La Habana: P. Fernández. Cuba. JUCEPLAN [Junta Central de Planificación] (1975). Las estadísticas demográficas cubanas. La Habana: Editorial de Ciencias Sociales. Cuba. JUCEPLAN/DCE [Junta Central de Planificación, Dirección Central de Estadística] (1974). Anuario estadístico de Cuba 1974. La Habana: JUCEPLAN/DCE. Cuba. MH/DGE [Ministerio de Hacienda, Dirección General de Estadística] (1958). Anuario Estadístico de Cuba 1957. La Habana: P. Fernández y Cia.
McGuire/Frankel LASA 2003
34
Cuba. ONE/UNFPA (2001) [Oficina Nacional de Estadísticas, Centro de Estudios de Población y Desarrollo; and United Nations Population Fund] (2001). Anuario Demográfico de Cuba 2000. La Habana: Oficina Nacional de Estadísticas.
Daniels, Norman, Bruce Kennedy, and Ichiro Kawachi (2000). Is Inequality Bad for Our Health? Boston, MA: Beacon Press. Danielson, Ross (1979). Cuban Medicine. New Brunswick, NJ: Transaction Books. de la Osa, José A. (2002). "¡6,2! Mortalidad infantil en Cuba en el 2001." Granma 2 January 2002. Accessed February 14, 2002, at http://www.granma.cubaweb.cu/2002/01/02/nacional/articulo13.html de la Osa, José A. (2003). "Mortalidad infantil en el 2002: ¡6,5!" Granma 8 January 2003. Accessed February 14, 2003, at http://www.granma.cubaweb.cu/2003/01/08/index.html Debasa, Jorge, and Fernando González Quiñones (1971). Cuba: Los componentes de la mortalidad entre 1919-1954. Utilidad de la proyección de la mortalidad. Serie C, No. 132 (September). Santiago, Chile: Centro Latinoamericano de Demografía (CELADE).
Deininger, Klaus, and Lyn Squire (1998). "Measuring Income Inequality: A New Database." Washington, DC: World Bank, Policy Research Department. Accessed May 8, 2001, at http://www.worldbank.org/research/growth/deisqu2.zip Díaz-Briquets, Sergio (1981). "Determinants of Mortality Transition in Developing Countries Before and After the Second World War: Some Evidence from Cuba." Population Studies 35 No. 3 (November), 399-411. Díaz-Briquets, Sergio (1983). The Health Revolution in Cuba. Austin, TX: University of Texas Press. Díaz-Briquets, Sergio (1986). "How to Figure Out Cuba: Development, Ideology and Mortality." Caribbean Review 15 No. 2 (Spring), 8-11 and 39-42. Domínguez, Jorge (1978). Cuba: Order and Revolution. Cambridge, MA: Harvard University Press.
Drèze, Jean, and Amartya K. Sen (1989). Hunger and Public Action. Oxford: Clarendon Press.
Easterlin, Richard A. (1996). Growth Triumphant: The Twenty-first Century in Historical Perspective. Ann Arbor: University of Michigan Press. Eberstadt, Nicholas (1986). "Did Fidel Fudge the Figures? Literacy and Health: The Cuban Model." Caribbean Review 15 No. 2 (Spring), 5-7 and 37-38. FAO [Food and Agriculture Organization] (2000). The State of Food Insecurity in the World 2000. Rome: FAO. Accessed June 28, 2001, at http://www.fao.org/docrep/x8200e/x8200e00.htm.
McGuire/Frankel LASA 2003
35
Farnos Morejón, Alfonso (1977). "Los niveles de mortalidad en Cuba durante el siglo XX." Revista Cubana de Administración de Salud 3 No. 4 (October-December), 351-363. Feinsilver, Julie (1993). Healing the Masses: Cuban Health Politics at Home and Abroad. Berkeley, CA: University of California Press. Filmer, Deon, and Lant Pritchett (1999). "The Impact of Public Spending on Health: Does Money Matter?" Social Science and Medicine 49 No. 10 (November), 1309-1323. Flegg, A.T. (1982). "Inequality of Income, Illiteracy and Medical Care as Determinants of Infant Mortality in Underdeveloped Countries." Population Studies 36 No. 3 (November), 441-458. Foreign Policy Association (1935). Problems of the New Cuba. New York, NY: Foreign Policy Association. Golomb, Berl, and Ronald H. Dolkart, eds. (1962). Statistical Abstract of Latin America 1962. Los Angeles, CA: Center of Latin American Studies, University of California, Los Angeles. González Quiñones, Fernando, and Jorge Debasa (1970). Cuba: Evaluación y ajuste del censo de 1953 y las estadísticas de nacimientos y defunciones entre 1943 y 1958. Tabla de mortalidad, por sexos, 1952-54. Serie C, No. 124 (June). Santiago, Chile: Centro Latinoamericano de Demografía (CELADE). González Quiñones, Fernando R., and Oscar R. Ramos Piñol (1996). Cuba: Balance e indicadores demográficos estimados del período 1900-1959. La Habana: Centro de Estudios Demográficos, Universidad de la Habana. Heck, K. E., K. C. Schoendorf, and J. Parker (1999). "Are Very Low Birthweight Births among American Indians and Alaska Natives Underregistered?" International Journal of Epidemiology 28 No. 6 (December), 1096-1011. Henshaw, Stanley K., Susheela Singh, and Taylor Haas (1999). "The Incidence of Abortion Worldwide." International Family Planning Perspectives 25, Supplement (January), S30-S38. Hernández, Roberto E. (1969). "La atención médica en Cuba hasta 1958." Journal of Inter-American Studies 11 No. 4 (October), 533-557.
Hertzman, Clyde (2001). "Health and Human Society." American Scientist 89 No. 6 (Nov-Dec), 538-545.
Heston, Alan, Robert Summers, and Bettina Aten (2002). Penn World Table Version 6.1. Center for International Comparisons at the University of Pennsylvania (CICUP), October 2002. Accessed October 20, 2002, at http://pwt.econ.upenn.edu.
McGuire/Frankel LASA 2003
36
Hill, Kenneth E. (1983). "Appendix 1: An Evaluation of Cuban Demographic Statistics, 1938-1980." In Paula E. Hollerbach and Sergio Díaz-Briquets, with an Appendix by Kenneth Hill, "Fertility Determinants in Cuba." Working Paper No. 102, Center for Policy Studies. New York, NY: The Population Council. Hill, Kenneth (1991). "Approaches to the Measurement of Child Mortality: A Comparative Review." Population Index 57 No. 3 (Fall), 368-382.
Hill, Kenneth et al. (1999). Trends in Child Mortality in the Developing World: 1960-1996. New York: UNICEF. Hollerbach, Paula E., and Sergio Díaz-Briquets, with an Appendix by Kenneth Hill (1983). "Fertility Determinants in Cuba." Working Paper No. 102, Center for Policy Studies. New York, NY: The Population Council. Howell, Embry M., and Béatrice Blondel (1994). "International Infant Mortality Rates: Biases from Reporting Differences." American Journal of Public Health 84 No. 5 (May), 850-852. IBRD [International Bank for Reconstruction and Development, or World Bank] (1951). Report on Cuba: Findings and Recommendations of an Economic and Technical Mission. Washington, DC: IBRD. ILO [International Labour Office] (1961). Yearbook of Labour Statistics. Geneva: ILO. ILO [International Labour Organisation] (2003). LABORSTA Labour Statistics Database. Accessed March 17, 2003, at http://laborsta.ilo.org/cgi-bin/brokerv8.exe Kramer, M.S., R.W. Platt, H. Yang, B. Haglund, S. Cnattingius, and P. Bergsjo (2002). "Registration Artifacts in International Comparisons of Infant Mortality." Paediatric and Perinatal Epidemiology16 No. 1 (January), 16-22. Landstreet, Barent F., Jr. (1976). "Cuban Population Issues in Historical and Comparative Perspective." PhD. Diss., Cornell University. Latin American Studies Program Dissertation Series No. 75. May. Lewis, Oscar, Ruth M. Lewis, and Susan M. Rigdon (1977). Four Women: Living the Revolution, An Oral History of Contemporary Cuba. Urbana, IL: University of Chicago Press.
Liu, Korbin et al. (1992). "International Infant Mortality Rankings: A Look Behind the Numbers." Health Care Financing Review 13 No. 4 (Summer), 105-118.
Livi-Bacci, Massimo (2001). A Concise History of World Population. 3rd ed. Malden, MA and Oxford, UK: Blackwell.
Lockmiller, David A. (1938). Magoon in Cuba: A History of the Second Intervention, 1906-1909. Chapel Hill, NC: University of North Carolina Press.
McGuire/Frankel LASA 2003
37
López Fernández, Carmen (1972). "Tendencia de Cuba de la mortalidad de menores de 1 año entre 1910 y 1970." Revista Cubana de Pediatría 2, 129-136. Losada, Abel F. (1999). Cuba: Población y economía entre la independencia y la revolución. Barcelona: Universidade de Vigo, Servicio de Publicaciones. Luzón, José Luis (1987). Economía, población, y territorio en Cuba (1899-1983). Madrid: Ediciones Cultura Hispánica del Instituto de Cooperación Iberoamericana. MacGaffey, Wyatt, and Clifford R. Barnett (1962). Cuba: Its People, Its Society, Its Culture. New Haven, CT: Human Relations Area Files.
Mamalakis, Markos J., ed. (1980). Historical Statistics of Chile: Demography and Labor Force. Vol. 2. Westport, CT: Greenwood Press.
McCaa, Robert (2001). "An Essay on Inverse Projection." Posted February 2001. Accessed March 18, 2003, at http://www.hist.umn.edu/~rmccaa/populate/index.htm McGuire, James W. (1997). Peronism without Perón: Unions, Parties, and Democracy in Argentina. Stanford, CA: Stanford University Press.
McGuire, James W. (1999). "Labor Union Strength and Human Development in East Asia and Latin America." Studies in Comparative International Development 33 No. 4 (Winter), 3-34.
McGuire, James W. (2001). "Social Policy and Mortality Decline in East Asia and Latin America." World Development 29 No. 10 (October), 1673-1697. Mehrotra, Santosh (1997). "Human Development in Cuba: Growing Risk of Reversal." In Santosh Mehrotra and Richard Jolly, eds., Development with a Human Face: Experiences in Social Achievement and Economic Growth. Oxford: Clarendon Press, 384-417. Mesa-Lago, Carmelo (1969). "Availability and Reliability of Statistics in Socialist Cuba." Latin American Research Review 4 No. 1, 53-91. Mesa-Lago, Carmelo (1981). The Economy of Socialist Cuba: A Two-Decade Appraisal. Albuquerque, NM: University of New Mexico Press. Mesa-Lago, Carmelo (2000). Market, Socialist, and Mixed Economies: Comparative Policy and Performance: Chile, Cuba, and Costa Rica. Baltimore, MD: Johns Hopkins University Press. Mezquita, Rodolfo (1970). Cuba: Estimación de la mortalidad por sexo. Tabla de vida para los períodos 1919-31 y 1931-43. Serie C, No. 121. Santiago, Chile: Centro Latinoamericano de Demografía (CELADE).
Mitchell, B. R. (1998). International Historical Statistics: The Americas 1750-1993. 4th ed. London: Macmillan Reference.
McGuire/Frankel LASA 2003
38
Muscat, Robert J. (1990). Thailand and the United States: Development, Security, and Foreign Aid. New York, NY: Columbia University Press. Nelson, Lowry (1950). Rural Cuba. Minneapolis, MN: University of Minnesota Press.
Núñez Machín, Ana (1981). Memoria amarga del azúcar. La Habana: Editorial de Ciencias Sociales.
O'Connor, James R. (1964). "The Political Economy of Pre-Revolutionary Cuba." PhD Diss., Columbia University. Ann Arbor, MI: University Microfilms International.
PAHO [Pan American Health Organization] (1964). Las condiciones de salud en las Américas 1961-1962. Scientific Publication No. 104. Washington, DC: Pan American Health Organization.
PAHO [Pan American Health Organization] (1988). Los servicios de salud en las Américas: Análisis de indicadores básicos. Cuaderno Técnico No. 14. Washington, DC: PAHO. PAHO [Pan American Health Organization] (2001). Country Health Profile: Cuba. Data updated for 2001. Accessed March 3, 2003, at http://www.paho.org/English/SHA/prflcub.htm Pérez, Louis A., Jr. (1976). Army Politics in Cuba. Pittsburgh: Pittsburgh University Press. Pérez, Louis A., Jr. (1988). Cuba: Between Reform and Revolution. 2nd ed. New York: Oxford University Press.
Preston, Samuel (1975). "The Changing Relation Between Mortality and Level of Economic Development." Population Studies 29 No. 2 (July), 231-248.
Pritchett, Lant, and Lawrence H. Summers (1996). "Wealthier is Healthier." Journal of Human Resources 31 No. 4 (Fall), 841-868. Raggi Ageo, Carlos M. (1944). Condiciones económicas y sociales de la República de Cuba. Informe preparado por la Oficina de Estudios del Plan de Seguridad Social de la Ministerio de Trabajo. La Habana: Editoral Lex. Rios Massabot, N. E. (1983). "Sistemas de información de estadísticas vitales en Cuba." Revista Cubana de Administración de Salud 9 No. 1 (January-March), 16-31. Riverón Corteguera, Raúl (1996). "Neonatal Mortality in Cuba, 1970-1993." International Child Health 7 No. 4 (October). Published by the International Pediatric Association. Accessed February 11, 2003, at www.ipa-france.net/pubs/inches/inch7_4/cort.htm. Riverón Corteguera, Raúl L.; F. Valdés Lazo, and R. Rodríguez Castro (1978). "Salud materno-infantil en Cuba: Situación actual y perspectiva." Revista Cubana de Pediatría No. 50 (September-October), 407-423.
McGuire/Frankel LASA 2003
39
Roberts, C. Paul, and Mukhtar Hamour, eds. (1970). Cuba 1968: Supplement to the Statistical Abstract of Latin America. Statistical Abstract of Latin America Supplement Series, No. 1. Los Angeles, CA: Latin American Center, University of California, Los Angeles. Roemer, Milton I. (1991). National Health Systems of the World. Vol. 1, The Countries. New York, NY: Oxford University Press.
Rojas Ochoa, Francisco, and Carlos Sánchez Texidó (1977). "Cobertura y calidad de la información estadística sobre la mortalidad perinatal en Cuba." Boletín de la Oficina Sanitaria Panamericana 82 No. 4 (April), 334-343.
Rosero-Bixby, Luis (1985). "The Case of Costa Rica." In Jacques Vallin and Alan D. Lopez, eds., Health Policy, Social Policy, and Mortality Prospects. Liège: International Union for the Scientific Study of Population, 341-370. Santana, Sarah (1988). "Some Thoughts on Vital Statistics and Health Status in Cuba." In Andrew Zimbalist, ed., Cuban Political Economy: Controversies in Cubanology. Boulder, CO, and London: Westview Press, 107-118. Solomon, Lawrence (2003). "Castro's Dupes." CubaNet News, Inc. (Coral Gables, FL), February 4, 2003. Accessed February 11, 2003, at http://www.cubanet.org/CNews/y03/feb03/04e4.htm Spielman, Andrew, and Michael D'Antonio (2001). Mosquito: A Natural History of Our Most Persistent and Deadly Foe. New York, NY: Hyperion. Thomas, Hugh (1971). Cuba: The Pursuit of Freedom. New York, NY: Harper and Row. UNICEF (1997). State of the World's Children. New York, NY: Oxford University Press. Accessed June 21, 2001, at http://www.unicef.org/sowc97/download.htm United Fruit Company, un caso del dominio imperialista en Cuba. [by "Varios Autores"] La Habana: Editorial de Ciencias Sociales, 1976. United Nations (1955). Handbook of Vital Statistics Methods. UN Document ST/STAT/Ser.F/7. New York, NY: United Nations Department of Economic and Social Affairs. United Nations (1992). Child Mortality since the 1960s: A Database for Developing Countries. New York: United Nations, Department of Economic and Social Development, Population Division. United Nations (2000). Statistics Division. Demographic Yearbook, Historical Supplement. CD-ROM. United States. Bureau of the Census (2001). US Census Bureau International Database. Accessed February 11, 2002, at http://www.census.gov/ipc/www/idbconf.html United States CDC (2002). [United States. Department of Health and Human Services. Centers for Disease Control and Prevention. National Center for Health Statistics]. Health, United States, 2002.
McGuire/Frankel LASA 2003
40
With Chartbook on Trends in the Health of Americans. Hyattsville, MD: National Center for Health Statistics. Accessed February 23, 2003, at http://www.cdc.gov/nchs/hus.htm United States Congress. Office of Technology Assessment (1994). International Health Statistics: What the Numbers Mean for the United States. Background Paper OTA-BP-H-1 16. September. Washington, DC: US Government Printing Office. Wheeler, Tim (1997). "The Children of Jose Martí." People's Weekly World [Communist Party USA], January 25, 1997. Accessed February 7, 2003, at http://www.hartford hwp.com/archives/43b/089.html Wilkie, James W., Eduardo Alemán, and José Guadalupe Ortega, eds. (1999). Statistical Abstract of Latin America. Vol. 35. Los Angeles, CA: UCLA Latin American Center Publications, University of California, Los Angeles.
Wilkinson, Richard G. (2001). Mind the Gap: Hierarchies, Health, and Human Evolution. New Haven: Yale University Press.
World Bank (2002). World Development Indicators on CD-ROM. Washington, DC: World Bank.
World Bank (2003). Online compiler of development statistics accessed March 3, 2003, at http://devdata.worldbank.org/query/
Notes to Table 1 Infant Mortality Estimates for Cuba and Havana, 1899-1963
1. Losada 1999: 178. Original data for 1899 from Cuba. Secretaría de Estado. Boletín Oficial de la Secretaría de Estado (an issue from between 1907 and 1935); 1907-1931 from Centro de Estudios Demográficos (1976); 1943 and 1953 from López Fernández (1972).
2. Centro de Estudios Demográficos (1976): 60. Original data for 1899-1943 from Elio Velásquez and Lázaro Toirac, Cuba: Tablas de mortalidad estimadas por sexo, para los años calendarios terminados en cero y cinco durante el período 1900-1950, Estudios Demográficos, Serie 1, No. 3. July. (La Habana: Centro de Estudios Demográficos, Instiuto de Economía, Universidad de La Habana, 1975). The table in Centro de Estudios Demográficos (1976): 60 includes figures for 1953 and for 1958-1970, but they are derived from uncorrected vital registration statistics and are omitted from the present table.
3. Catasus Cervera and Hernández Castellón 1977: 283. Hollerbach and Díaz-Briquets (1983: 5) regard these figures as overestimates. Original data from Elio Velásquez and Lázaro Toirac, Cuba: Tablas de mortalidad estimadas por sexo, para los años calendarios terminados en cero y cinco durante el período 1900-1950, Estudios Demográficos, Serie 1, No. 3. July. (La Habana: Centro de Estudios Demográficos, Instiuto de Economía, Universidad de La Habana, 1975); and Alfonso Farnos, "Cuba: Tablas de Mortalidad Estimadas por Sexo, 1955-1970." Unpublished paper. La Habana: Centro de Estudios Demográficos, Instituto de Economía, Universidad de la Habana.
4. González Quiñones and Ramos Piñol (1996): 34. Based on census data before 1955 and, apparently, on CELADE and JUCEPLAN data for 1955-59. Incorporates new data on migration, corrects for census underregistration of under-5 children, and uses the method of inverse projection.
5. Collver 1965: 108. Hollerbach and Diaz-Briquets (1983: 5) regard these figures as underestimates.
6. Díaz-Briquets 1983: 54. "Annual death rates per 1,000 population, by sex and age, City of Havana." Original source: "Cuban censuses and vital statistics." Number in column is mean of separate figures for males and females.
7. Díaz-Briquets 1983: 174-179. Average of male and female qx's at age 0, multiplied by 1000, from life tables for municipality of Havana. Source given as "Cuban censuses and vital statistics."
8. Vital registration statistics for 1902-13 from Anuario Estadístico de la República de Cuba 1915: 36-37; for 1928-32 from Foreign Policy Association 1935: 103; for 1948-49 from Cuba. MH/DGE 1958: 93; for 1953-1963 from Cuba. JUCEPLAN/DCE 1974: 28.
9. The method for calculating the average annual percent decline in infant mortality is described in the text and is illustrated in Appendix 1.
McGuire/Frankel LASA 2003
44
Table 2: Life Expectancy Estimates for Cuba, 1899-1963
Notes to Table 2 Life Expectancy Estimates for Cuba, 1899-1963
1. Farnos Morejón 1977: 359. Original data from 1900 to 1950 apparently from Elio Velásquez and Lázaro Toirac, Cuba: Tablas de mortalidad estimadas por sexo, para los años calendarios terminados en cero y cinco durante el período 1900-1950, Estudios Demográficos, Serie 1, No. 3. July. (La Habana: Centro de Estudios Demográficos, Instiuto de Economía, Universidad de La Habana, 1975). Original data for 1955 and 1960 from Alfonso Farnos, "Cuba: Tablas de Mortalidad Estimadas por Sexo, 1955-1970." Unpublished paper. La Habana: Centro de Estudios Demográficos, Instituto de Economía, Universidad de la Habana.
2. Centro de Estudios Demográficos 1976: 55. Original data: 1900-45 from Elio Velásquez and Lázaro Toirac, Cuba: Tablas de mortalidad estimadas por sexo, para los años calendarios terminados en cero y cinco durante el período 1900-1950, Estudios Demográficos, Serie 1, No. 3. July. (La Habana: Centro de Estudios Demográficos, Instiuto de Economía, Universidad de La Habana, 1975); 1953 from González Quiñones and Debasa 1970.
3. Díaz-Briquets 1983:19. Original data: 1905 and 1915 calculated by Diaz-Briquets; 1925 and 1937 from Mezquita 1970; 1953 from González Quiñones and Debasa 1970.
4. Astorga and Fitzgerald 1998: 32. Original data for 1900-1940 from H. Pérez Brignoli, "América Latina en la Transición Demográfica," in Instituto Nacional de Estadística, Geografía e Informática [Mexico, D. F.] (1993), La transición demográfica en América Latina y el Caribe, V. 1. Pérez Brignoli uses the method of inverse projection (Astorga and Fitzgerald 1998: 28). Original data for 1950-1960 from CELADE, Boletín Demográfico, various years; "1950 projected from 1955 and 1960" (Astorga and Fitzgerald 1998: 28).
5. Mezquita 1970: 33-35. Original data: Life tables based on census results. The estimates are for five-year periods; the last year of each period overlaps with the first year of the next period.1931 and 1943 are years in which the estimates overlap; the value recorded for each year is that of the later five-year estimate. The values are the means of separate figures for males and females; the sex ratio of population is not taken into account.
6. Debasa and González Quiñones 1971: 27-36. Original data: Life tables based on census data analyzed with principal components. The estimates are for periods encompassing up to 12 years; the last year of each period overlaps with the first year of the next period.1931, 1943, and 1952 are years in which the estimates overlap; the value recorded for each year is that of the later estimate. The values are the means of separate figures for males and females; the sex ratio of population is not taken into account.
7. CEPAL/CELADE 2002: 22. The estimates are for five-year periods; the last year of each period overlaps with the first year of the next period. The value recorded for 1955, an overlap year, is that for 1955-1960.
McGuire/Frankel LASA 2003
47
8. The method for calculating the average annual percent rise in life expectancy is described in the text and is illustrated in Appendix 1.
Notes to Table 3 Infant Mortality Estimates, Cuba, 1957-1963
1. Cuba. JUCEPLAN/DCE 1974: 28.
2. United Nations 2000. Identical figures for 1960, 1961, 1962, and 1963 appeared in de la Osa (2002 and 2003), writing in Granma, and were therefore apparently accepted by the Cuban government. From vital registration statistics, except for the estimate for 1958 (marked with *), which was prepared by the United Nations Populations Division. A note in the source reads "Prior to 1957, excluding live-born infants dying within 24 hours of birth. Beginning 1957, data are estimates based on analysis of 1943 and 1953 population census results and application of an assumed rate of growth."
3. Roberts and Hamour 1970: 68. Unadjusted vital statistics. Infants dying within 24 hours of birth are counted as infant deaths.
4. Roberts and Hamour 1970: 68. Vital statistics adjusted upward to take account of presumed omissions. Infants dying within 24 hours of birth are counted as infant deaths.
5. Landstreet 1976: 90. Data have been adjusted upward to take account of underregistration. Original data from Cuba. Junta Central de Planificación (JUCEPLAN), "Resumen de Estadísticas de Población," No. 3. La Habana: Dirección Nacional de Estadística, 1968.
6. United Nations 1992: 105. Indirect estimates, West Model. Original estimates from Encuesta Nacional de Ingresos y Egresos de la Población, 1974, as reported in "Cuba: La mortalidad infantil y sus diferencias sociales y económicas," La Habana: Comité Estatal de Estadísticas; and Santiago, Chile, Centro Latinoamericano de Demografía, 1988, p. 101, Table II.4, unpublished.
7. United Nations 1992: 105. Indirect estimates, West Model. Original estimates from Encuesta Demográfica Nacional de1979, V. 1, Metodología y tablas seleccionadas (Havana: Comité Estatal de Estadísticas, 1981), p. 25, Table 1, and "Cuba: La mortalidad infantil y sus diferencias sociales y económicas," La Habana: Comité Estatal de Estadísticas; and Santiago, Chile, Centro Latinoamericano de Demografía, 1988, p. 101, Table II.4, unpublished.
8. Hill et al. 1999: 70. The estimate is based on a knotted regression line fitted to (a) unadjusted vital registration statistics; (b) indirect estimates based on the 1974 Encuesta Nacional de Ingresos y Egresos de la Población; and (c) indirect estimates based on the 1979 Encuesta Demográfica Nacional.
9. Catasus Cervera and Hernández Castellón 1977: 283. Hollerbach and Díaz-Briquets (1983: 5) regard these figures as overestimates. Original data from Elio Velásquez and Lázaro Toirao, Cuba: Tablas de mortalidad estimadas por sexo, para los años calendarios terminados en cero y cinco durante el período 1900-1950, Estudios Demográficos, Serie 1, No. 3. July. (La Habana: Centro de Estudios Demográficos, Instiuto de Economía, Universidad de La Habana, 1975); and Alfonso Farnos, "Cuba: Tablas de Mortalidad Estimadas por Sexo, 1955-1970." Unpublished paper. La Habana: Centro de Estudios Demográficos, Instituto de Economía, Universidad de la Habana.
McGuire/Frankel LASA 2003
50
10. González Quiñones and Ramos Piñol (1996): 34. Based on census data before 1955 and, apparently, on CELADE and JUCEPLAN data for 1955-59. Incorporates new data on migration, corrects for census underregistration of under-5 children, and uses the method of inverse projection.
11. CEPAL/CELADE 2002: 24. The source provides no information about the original data or the methodology of the estimates.
McGuire/Frankel LASA 2003
51
Table 4 Infant Mortality Estimates for Cuba, 1959-2002
Notes to Table 4: Infant Mortality Estimates for Cuba, 1959-2002
1. Hill et al. 1999: 70. The estimate is based on a knotted regression line fitted to (a) unadjusted vital registration statistics; (b) indirect estimates based on the 1974 Encuesta Nacional de Ingresos y Egresos de la Población; and (c) indirect estimates based on the 1979 Encuesta Demográfica Nacional.
2. de la Osa 2003. Series identical to those in United Nations 1992, United Nations 2000, and Cuba. ONE/UNFPA (2001).
3. Cuba. JUCEPLAN/DCE 1974: 28.
4. Landstreet 1976: 90. Data have been adjusted upward to take account of underregistration. Original data from Cuba. Junta Central de Planificación (JUCEPLAN), "Resumen de Estadísticas de Población," No. 3. La Habana: Dirección Nacional de Estadísticas, 1968.
5. United Nations 1992: 105. Indirect estimates, West Model. Original estimates from Encuesta Nacional de Ingresos y Egresos de la Población, 1974, as reported in "Cuba: La mortalidad infantil y sus diferencias sociales y económicas," La Habana: Comité Estatal de Estadísticas; and Santiago, Chile, Centro Latinoamericano de Demografía, 1988, p. 101, Table II.4, unpublished.
6. United Nations 1992: 105. Indirect estimates, West Model. Original estimates from Encuesta Demográfica Nacional de1979, V. 1, Metodología y tablas seleccionadas, La Habana: Comité Estatal de Estadísticas, 1981, p. 25, Table 1, and "Cuba: La mortalidad infantil y sus diferencias sociales y económicas," La Habana: Comité Estatal de Estadísticas and Santiago, Chile, Centro Latinoamericano de Demografía, 1988, p. 101, Table II.4, unpublished.
7. United Nations 1992: 105. Indirect estimates, West Model. Original estimates from Censo de Población y Viviendas, 1981, República de Cuba. V. 16 (Havana: Comité Estatal de Estadísticas, Oficina Nacional del Censo, 1984), pp. 99 and 105, Tables 25 and 26.
8. United Nations 1992: 105. According to "data provided to the UN Statistical Office." Not clear what sort(s) of data went in to the construction of these life tables.
9. Catasus Cervera and Hernández Castellón 1977: 283. Original data from Alfonso Farnos, "Cuba: Tablas de Mortalidad Estimadas por Sexo, 1955-1970." Unpublished paper. La Habana: Centro de Estudios Demográficos, Instituto de Economía, Universidad de la Habana.
10. CEPAL/CELADE 2002: 24. The source provides no information about the original data or the methodology of the estimates.
McGuire/Frankel LASA 2003
53
Table 5
Infant Mortality, 1960 and 1995, in 20 Latin American Countries
Ranked by percent decline in infant mortality, 1960-1995
Infant mortality
Infant mortality
Infant mortality, percent decline
1960 1995 1960-1995
Chile 118 11 91% Costa Rica 87 12 86% El Salvador 129 25 81% Honduras 137 29 79% Cuba 39 9 77% Ecuador 107 27 75% Panama 58 16 72% Peru 142 40 72% Nicaragua 130 38 71% Colombia 79 24 70% Mexico 94 32 66% Guatemala 136 48 65% Brazil 115 41 64% Venezuela 56 21 63% Argentina 60 23 62% Paraguay 67 26 61% Uruguay 48 20 58% Domin. Rep. 102 47 54% Bolivia 152 77 49% Haiti 169 95 44% Source: Hill et al. 1999.
McGuire/Frankel LASA 2003
54
Table 6
Life Expectancy, 1960 and 1995, in 20 Latin American Countries
Ranked by percent increase in life expectancy, 1900-1995
Life Expectancy
Life Expectancy
Life Expectancy
percent increase
1960 1995 1960-1995 Chile 57.3 74.9 63% Costa Rica 61.9 76.2 62% Honduras 46.6 68.7 57% Cuba 64.2 75.8 56% Domin. Rep. 52.2 70.4 56% Peru 48.0 67.8 54% Nicaragua 47.3 67.3 53% Panama 60.9 73.6 53% El Salvador 50.8 68.5 52% Mexico 57.3 71.5 51% Venezuela 59.8 72.4 50% Ecuador 53.4 68.1 46% Colombia 56.8 69.8 46% Guatemala 45.9 63.6 45% Bolivia 42.8 60.6 42% Brazil 54.9 66.5 39% Argentina 65.2 72.7 38% Uruguay 68.0 73.4 32% Haiti 42.4 53.6 26% Paraguay 63.9 69.2 25% Source: World Bank 2002.
McGuire/Frankel LASA 2003
55
Table 7
Infant Mortality, 1900 and 1960, in 8 Latin American Countries
Ranked by percent decline in infant mortality
Infant deaths per 1000 live
births
Infant deaths per 1000 live
births
Infant mortality percent decline
1900-04 1960 1900-1960 Cuba 136 39 71% Venezuela 169 56 67% Argentina 146 60 59% Costa Rica 208 87 58% Colombia 186 79 58% Mexico 220 94 57% Panama 130 58 55% Chile 261 118 55% Source: 1900: Collver 1965. 1960: Hill et al. 1999. Note. Hollerbach and Díaz-Briquets (1983: 5) regard Collver's 1900 infant mortality estimate for Cuba (136 per 1000) as an underestimate. As noted in the text, more plausible estimates suggest a rate closer to 195 per 1000, which would imply a decline from 1900 to 1960 of 80 percent rather than 71 percent. Collver's statistics for Argentina and Costa Rica conform more closely to those derived from alternative sources, whereas alternative estimates for Chile are, like those for Cuba, considerably higher (270, 340), although not so high as to raise Chile's percent decline estimate above 65 percent. See text for details.
McGuire/Frankel LASA 2003
56
Table 8
Life Expectancy, 1900 and 1960, in 12 Latin American Countries
GDP per capita, 1900 and 1960, in 9 Latin American Countries
Ranked by increase in GDP per capita
GDP per capita in
1900
GDP per capita in
1960
Multiple by which 1960 exceeded 1900 GDP per capita
Venezuela 106 1,128 10.64 Peru 104 485 4.66 Brazil 71 324 4.56 Colombia 118 420 3.56 Ecuador 89 285 3.20 Chile 283 679 2.40 Mexico 261 611 2.34 Argentina 439 852 1.94 Cuba 272 390 1.43 Source: Astorga and FitzGerald 1998: 31. All figures GDP per capita in 1970 $US at PPP according to a chain index, 3 year average.
McGuire/Frankel LASA 2003
58
Table 10
Income Inequality, 1953-1962, in 8 Latin American Countries
Ranked from lowest to highest inequality
Country Year Gini Index Uruguay 1962 39.5 Venezuela 1962 44.8 Argentina 1959 46.2 Costa Rica 1961 50.0 Brazil 1960 53.0 Mexico 1957 55.1 Cuba 1953 57.1 Peru 1961 75.8 Source: Deininger and Squire 1998. Note: The Gini index of income inequality ranges from 0 (low inequality) to 100 (high inequality). Figures are all based on income rather than consumption expenditure, but those for Cuba and Peru are based on individual income (rather than household income as in all of the other cases), and correspond only to income recipients (members of the economically active population). The Argentine figure is the mean of two separate estimates for personal and household income. The Venezuelan figure is the mean of four estimates for 1962, two for urban areas and two for rural areas, that range from 43.9 to 46.1. The Uruguayan figure is the mean of separate estimates for Montevideo in 1961 (36.6) and for rural Uruguay in 1963 (42.4).
McGuire/Frankel LASA 2003
59
Table 11
Employee Compensation as a Share of National Income, 1958, in 9 Latin American Countries
Ranked from highest to lowest share
Country Share Panama 68.4 Cuba 66.6 Costa Rica 60.9 Argentina 57.2 Ecuador 52.3 Honduras 48.6 Brazil 47.9 Peru 48.8 Colombia 38.4 Source: ILO 1961: Table 19, pp. 399-400. The figure for Cuba given in Domínguez (1978: 75) is 62.3 in 1958, down from a peak of 67.7 in 1952.
McGuire/Frankel LASA 2003
60
Table 12
Calorie and Protein Availability, 1961-63, in 20 Latin American Countries
Ranked by calorie availability
Calories Protein
Argentina 3,073 100.2 Uruguay 2,794 106.3 Chile 2,531 55.0 Nicaragua 2,523 51.6 Mexico 2,490 57.8 Paraguay 2,404 64.1 Brazil 2,320 42.9 Cuba 2,297 47.7 Peru 2,223 42.0 Costa Rica 2,197 53.7 Venezuela 2,187 57.5 Panama 2,169 45.9 Colombia 2,165 41.7 Ecuador 2,034 39.5 Haiti 2,028 27.4 Honduras 1,927 34.5 Guatemala 1,927 35.1 Domin. Rep. 1,850 36.9 El Salvador 1,840 40.0 Bolivia 1,798 34.4 Note: Calorie availability is expressed in kcal per capita per day; protein availability is expressed in grams per capita per day. The data for El Salvador and Nicaragua are from 1966-68. In the 1990s, the FAO (2000) recommended minimums for Latin America were 2,200 kcal and 53 grams of protein per capita per day. Source: Wilkie, Alemán, and Ortega 1999: 200.
McGuire/Frankel LASA 2003
61
Table 13
Urbanization, 1960 and 1995, in 20 Latin American Countries
Ranked by level of urbanization in 1960
Urbani-zation
Urbani-zation
Rise in Urbani-zation
1960 1995 1960-1995 Uruguay 80 90 50% Argentina 74 88 56% Chile 68 84 52% Venezuela 61 86 63% Cuba 55 75 44% Mexico 51 73 46% Colombia 48 72 46% Peru 46 71 46% Brazil 45 78 61% Panama 41 55 23% Nicaragua 40 55 25% Bolivia 39 60 33% El Salvador 38 45 11% Costa Rica 37 47 16% Paraguay 36 52 26% Ecuador 34 60 39% Guatemala 32 39 9% Domin. Rep. 30 62 45% Honduras 23 48 32% Haiti 16 33 20% Source: World Bank 2002. The stipulated maximum for urbanization is 100 percent. Countries may use different definitions of "urban."
McGuire/Frankel LASA 2003
62
Table 14
Urbanization in Cuba, 1899-1953
Year Population of Cuba
Pop. in the 25 largest
cities
Population in Havana metro. area
% pop. in 25 largest
cities
% pop. in Havana
metro. area
% pop. in the city of Havana
1899 1,572,797 16.1 1907 2,048,980 628,600 367,900 31 18.3 14.8 1919 2,889,004 919,300 472,900 32 16.5 12.6 1931 3,962,344 1,346,100 728,500 34 18.5 13.7 1943 4,778,583 1,744,100 947,000 36 20.0 14.2 1953 5,829,029 2,281,000 1,223,900 39 21.3 13.5 Source: Luzón 1987: 54, 116, except for % of population in the metropolitan area and city of Havana, which come fron Díaz-Briquets 1983: 46. Both Luzón and Díaz-Briquets derive their figures from census data. Luzón's percentages for the Havana metropolitan area are close to Díaz-Briquets's.
McGuire/Frankel LASA 2003
63
Table 15
Total Fertility Rate, 1960 and 1995, in 20 Latin American Countries
Ranked by lowness of fertility rate in 1960
Total fertilty rate
Total fertilty rate
Fertility, percent decline
toward 2.1
1960 1995 1960-1995 Uruguay 2.9 2.3 75% Argentina 3.1 2.7 40% Cuba 4.2 1.8 114% Chile 5.3 2.5 88% Panama 5.9 2.8 82% Brazil 6.2 2.8 83% Haiti 6.3 4.7 38% Venezuela 6.6 3.1 78% Bolivia 6.7 4.6 46% Ecuador 6.7 3.3 74% Colombia 6.8 2.6 89% El Salvador 6.8 3.8 64% Mexico 6.8 3.0 81% Paraguay 6.8 4.1 57% Guatemala 6.9 5.1 38% Peru 6.9 3.3 75% Costa Rica 7.0 3.0 82% Domin. Rep. 7.4 2.9 85% Nicaragua 7.4 4.8 49% Honduras 7.5 4.6 54% Note: The total fertility rate is the number of children a woman would be expected to bear in her lifetime were she to bear children in accordance with the age-specific fertility rates prevailing in the year indicated. Source: UNICEF 1997: 96-97. The "target level" for fertility decline is the replacement rate (2.1).
McGuire/Frankel LASA 2003
64
Table 16
Age-Standardized Birth Rate, 1900-1959, in 8 Latin American Countries
Year TFR 1899 4.01 1907 5.82 1919 5.79 1931 4.50 1943 4.00 1950-54 4.01 1955-59 3.76 1960-64 4.67 Note: The total fertility rate is the number of children a woman would be expected to bear in her lifetime were she to bear children in accordance with the age-specific fertility rates prevailing in the year indicated. Source: Hollerbach and Díaz-Briquets 1983: 5, 15. Hill (1983) estimates that the total fertility rate in 1950-54 was 3.6.
McGuire/Frankel LASA 2003
66
Table 18
Literacy as a Percentage of the Population Aged 10 and Over, Cuba, 1899-1953
Year Literacy, total
Literacy, female
1899 43.2 38.1 1907 56.6 54.6 1919 61.6 61.0 1931 71.7 73.7 1943 77.9 72.8 1953 76.4 78.8 Source: Díaz-Briquets 1983: 45 for total literacy; Losada 1999: 201 for female literacy. Based on census data.
McGuire/Frankel LASA 2003
67
Table 19
Literacy as a Percentage of the Population Aged 15 and Over in 1900, 1960, and 1995, in 18 Latin American Countries
Ranked by percent rise in literacy from 1900 to 1960
Literacy Literacy Literacy Literacy rise
Literacy rise
1900 1960 1995 1900-1960
1960-1995
Argentina 51 91 96 82% 56% Uruguay 59 90 97 76% 70% Costa Rica 36 83 95 73% 71% Chile 44 84 95 71% 69% Panama 17 73 91 67% 67% Cuba 46 79 97 61% 86% Paraguay 31 73 92 61% 70% Colombia 34 70 91 55% 70% Mexico 24 65 90 54% 71% Ecuador 33 66 90 49% 71% Peru 24 60 89 47% 73% Venezuela 28 62 91 47% 76% Brazil 35 60 83 38% 58% Bolivia 19 44 83 31% 70% El Salvador 26 48 76 30% 54% Guatemala 12 36 64 27% 44% Honduras 28 45 70 24% 45% Haiti 8 16 45 9% 35% Source: Astorga and Fitzgerald 1998. The data, drawn from national censuses, are taken from an unpublished paper by consultants to the Inter-American Development Bank. All of the figures reportedly use as the denominator of the literacy rate the number of persons aged 15 and older, except the 1900 figure for Argentina, where 14 years of age is the cut-off point. Astorga and Fitzgerald (1998: 27) list several census estimates with a different age cut-off, and indicate that the consultants adjusted the estimates from these censuses to 15 and over using ratios from censuses in countries with similar demographic and educational characteristics. Cuba, however, is not listed among the countries for which census results were adjusted in this way, even though the age-cut off in Cuba has traditionally been 10 rather than 15 years of age. Because Cuban 10 to 14 year-olds probably had a higher literacy rate in 1960 than Cubans aged 15 and older, the above figure may slighly exaggerate the literacy rate in 1960 of Cubans aged 15 and older.
McGuire/Frankel LASA 2003
68
Table 20
Health Personnel and Health Facilities circa 1957 in 20 Latin American Countries
Doctors per 10,000 inhabitants
Nurses per 10,000 inhabitants
Nurse's aides per 10,000 inhabitants
Hospital beds per 1,000
inhabitants Argentina 12.8 Costa Rica 6.1 Chile 10.0 Argentina 5.3 Uruguay 11.6 Panama 5.8 Venezuela 8.5 Costa Rica 5.1 Cuba 10.0 Argentina 5.2 Argentina 8.3 Uruguay 5.1 Chile 6.2 Cuba 4.5 Costa Rica 8.3 Chile 5.0 Venezuela 6.2 Venezuela 3.4 Uruguay 8.0 Panama 3.9 Mexico 5.7 Chile 2.0 Panama 7.0 Venezuela 3.6 Paraguay 5.2 Peru 2.0 Brazil 5.9 Brazil 3.4 Brazil 4.0 El Salvador 1.7 El Salvador 5.0 Colombia 3.0 Costa Rica 3.7 Nicaragua 1.7 Colombia 4.4 Dom. Rep. 2.7 Peru 3.7 Guatemala 1.6 Paraguay 3.4 Cuba 2.6 Nicaragua 3.5 Mexico 1.6 Mexico 3.3 Guatemala 2.3 Colombia 3.4 Uruguay 1.6 Guatemala 2.6 Paraguay 2.2 Ecuador 3.4 Bolivia 0.6 Honduras 2.4 Peru 2.2 Panama 3.1 Brazil 0.6 Cuba 2.0 Ecuador 2.0 Bolivia 2.6 Haiti 0.6 Ecuador 2.0 Honduras 2.0 Honduras 2.1 Honduras 0.6 Peru 2.0 Nicaragua 2.0 Guatemala 1.6 Dom. Rep. 0.5 Dom. Rep. 1.7 Bolivia 1.8 Dom. Rep. 1.5 Ecuador 0.5 Nicaragua 1.4 El Salvador 1.4 El Salvador 1.4 Paraguay 0.5 Haiti 1.0 Mexico 1.0 Haiti 0.4 Colombia 0.3 Bolivia 0.8 Haiti 0.6
Source: PAHO 1988, except for health personnel in Mexico, where the figures (for 1961 in the case of doctors and 1962 in the case of nurses and nurse's aides) are from PAHO 1964: 63, 66. The nurse's aides figure for Uruguay was recorded as 80.0 (PAHO 1988: 80). This figure is presumed to be a misprint, and is recorded in the table as 8.0 (Uruguay in 1962 had 10.0 nurse's aides per 10,000 inhabitants; PAHO 1964: 66).
McGuire/Frankel LASA 2003
69
Table 21
Physicians Per Capita in Cuba, 1899-1953
Year Population per doctor,
Cuba
Population per doctor,
Havana province
Population per doctor,
Oriente province
1899 1,286 649 2,625 1907 1,648 805 3,610 1919 1,631 691 4,630 1931 1,958 696 3,155 1943 1,846 556 3,140 1953 940 400 2,490 Sources: Figures for Cuba from Díaz-Briquets (1983: 50); figures for the provinces of Havana and Oriente from Losada (1999: 197). Losada's figures for Cuba as a whole are identical to Díaz-Briquets's for all years except 1931 (1,559 persons per doctor) and 1943 (1,324 persons per doctor). The 1943 census put the population of Cuba at 4,778,583 (Table 7) and the number of doctors at 2,589 (Cuba 1943: 1112). These figures work out to 1,845 persons per doctor, almost exactly the figure reported by Díaz-Briquets. Hence, we have used Díaz-Briquets's national series in preference to Losada's.
McGuire/Frankel LASA 2003
70
Table 22
Labor Union Membership in 20 Latin American Countries, 1946 and 1960
Ranked in order of union members as a share of economically active population, 1960
Economically Active
Population (EAP), 1946
Union Members,
1946
Union members
as a percent of EAP,
1946
Economically Active
Population (EAP), 1960
Union Members,
1960
Union members
as a percent of
EAP, 1960
ILO con- ventions signed as of 1961 (of 116 possible)
Venezuela 1,705,000 200,000 12% 2,363,890 1,500,400 64% 19 Cuba 2,132,000 300,000 14% 2,513,203 1,503,795 60% 64 Argentina 7,106,000 500,000 7% 8,110,334 2,576,186 32% 56 Chile 2,307,000 350,000 15% 2,559,331 492,900 19% 36 Mexico 9,050,000 1,000,000 11% 11,079,810 2,101,045 19% 47 Uruguay 930,000 75,000 8% 1,029,413 197,118 19% 57 Dom. Rep. 776,000 25,000 3% 998,379 188,000 19% 22 Peru 2,584,000 350,000 14% 3,177,920 550,000 17% 26 Bolivia 1,152,000 70,000 6% 1,331,687 200,060 15% 6 Brazil 18,863,000 500,000 3% 24,965,050 2,500,000 10% 29 Costa Rica 295,000 30,000 10% 359,497 23,000 6% 17 Ecuador 1,222,000 75,000 6% 1,501,270 84,800 6% 6 Colombia 4,431,000 150,000 3% 5,370,640 330,071 6% 25 Panama 306,000 25,000 8% 376,309 15,000 4% 11 El Salvador 677,000 829,343 36,012 4% 4 Nicaragua 403,000 25,000 6% 500,071 16,000 3% 30 Paraguay 572,000 25,000 4% 646,174 20,000 3% 0 Honduras 496,000 653,430 18,150 3% 11 Guatemala 1,062,000 50,000 5% 1,350,590 16,000 1% 34 Haiti 1,999,000 15,000 1% 2,138,228 9,517 0% 0 Sources: Economically active population in 1946: ILO 2003; in 1960: World Bank 2003. Union members in 1946: Alba 1968: 211, drawing on Robert J. Alexander, Labour Movements in Latin America. Union members in 1960: Golomb and Dolkart 1962: 40, drawing on US Bureau of International Labor Affairs, Directory of Labor Organizations, Western Hemisphere. Data from c. Jan 1960; later where available and
McGuire/Frankel LASA 2003
71
earlier if necessary. For a critique of data compiled by the US Bureau of International Labor Affairs, see McGuire 1997: 335-36, n. 15 International Labour Organisation conventions signed: Alba 1968: 214.


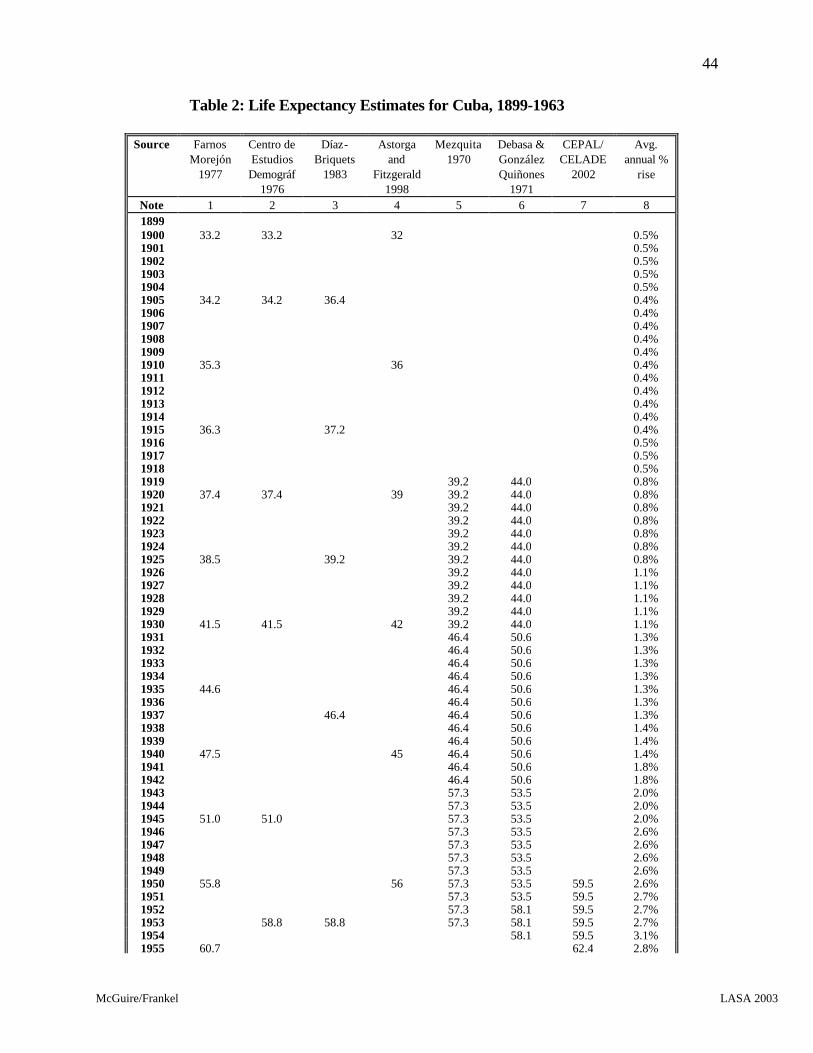


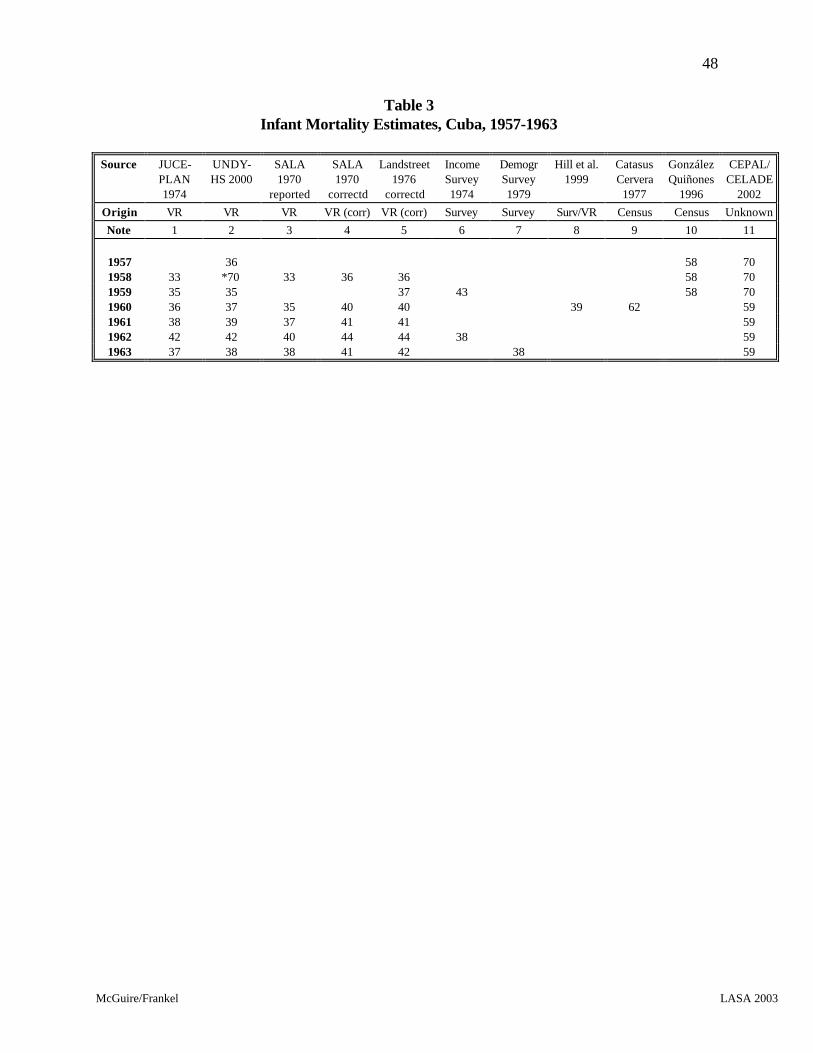


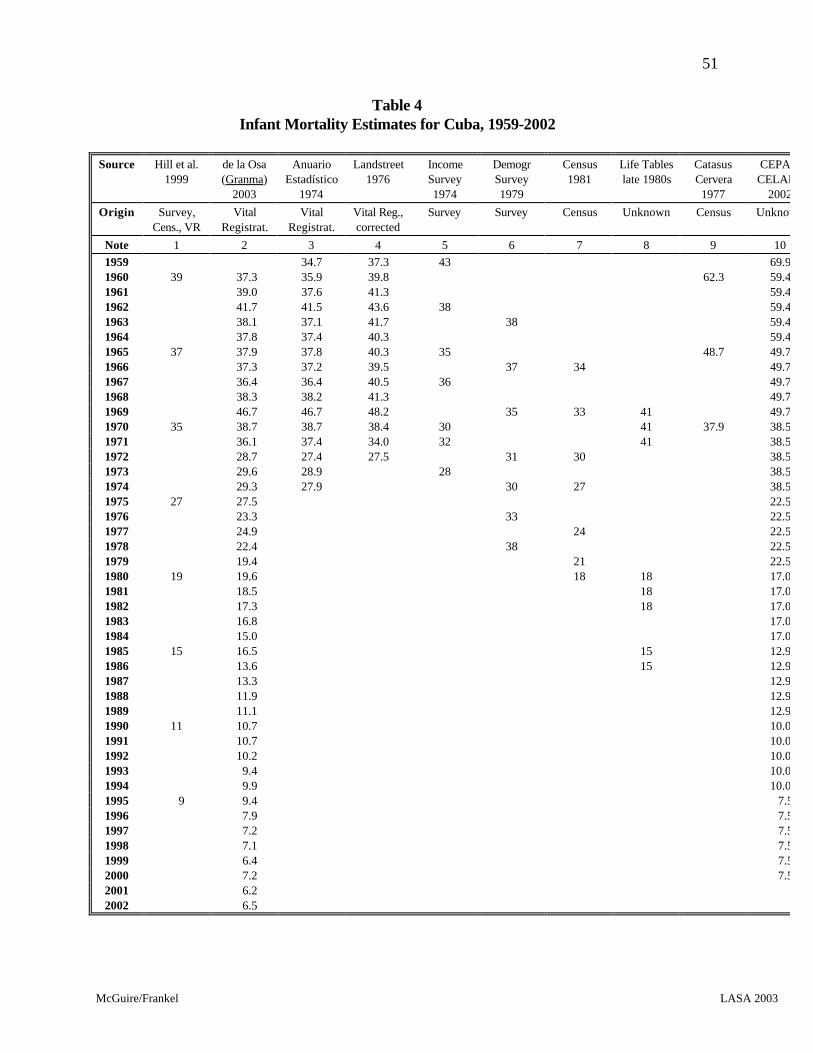
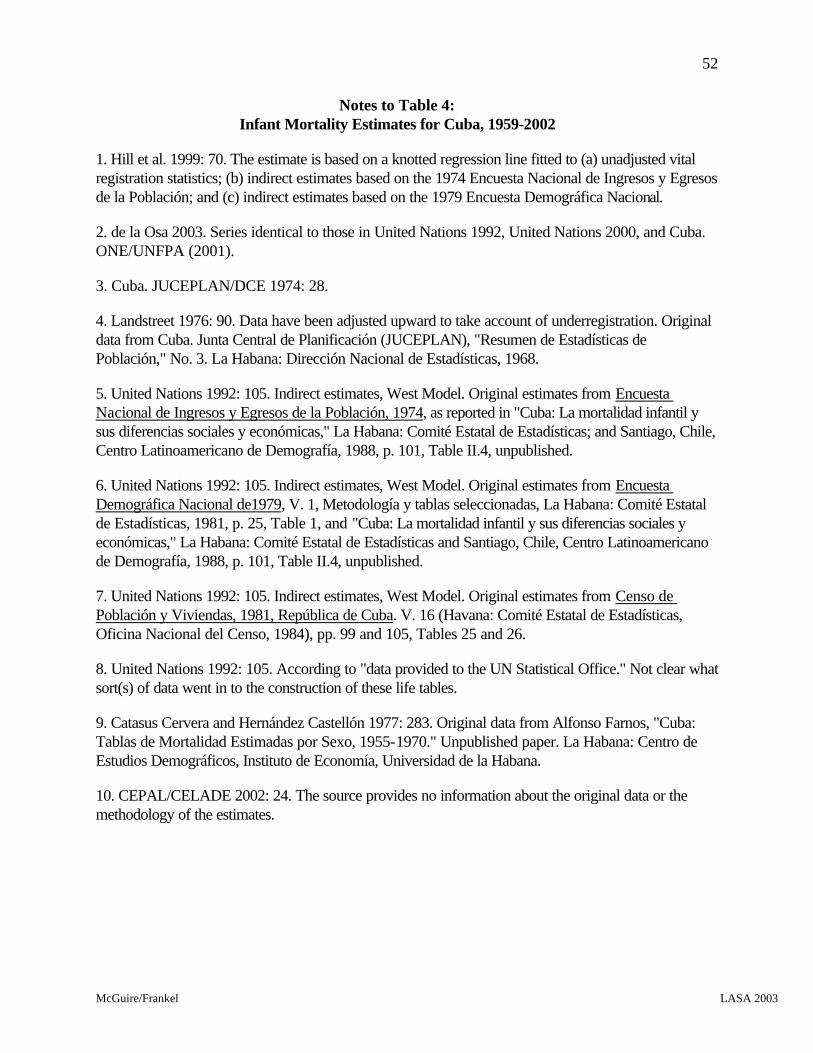

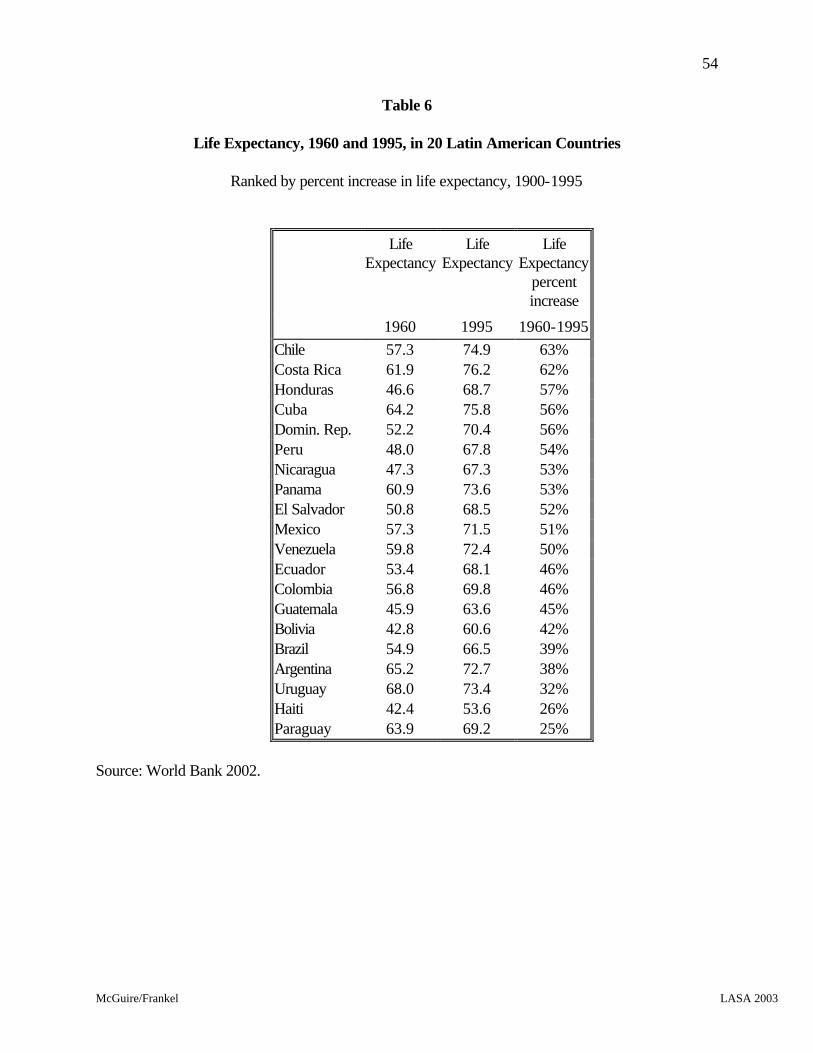

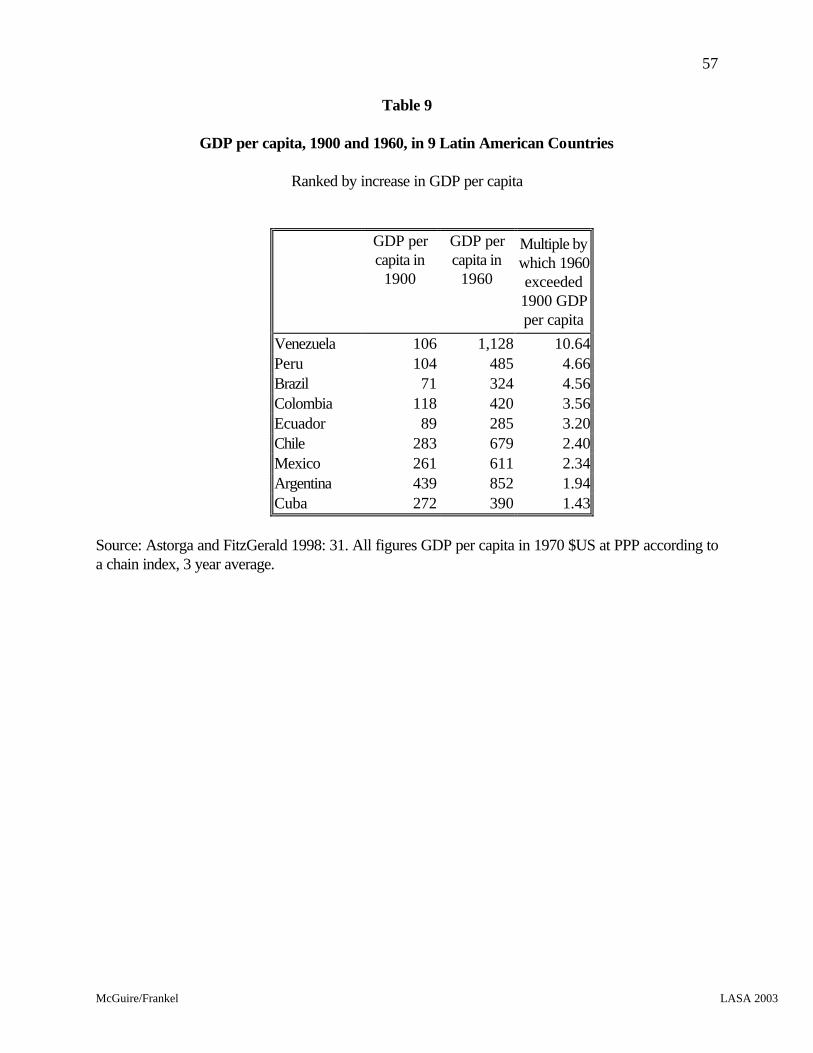
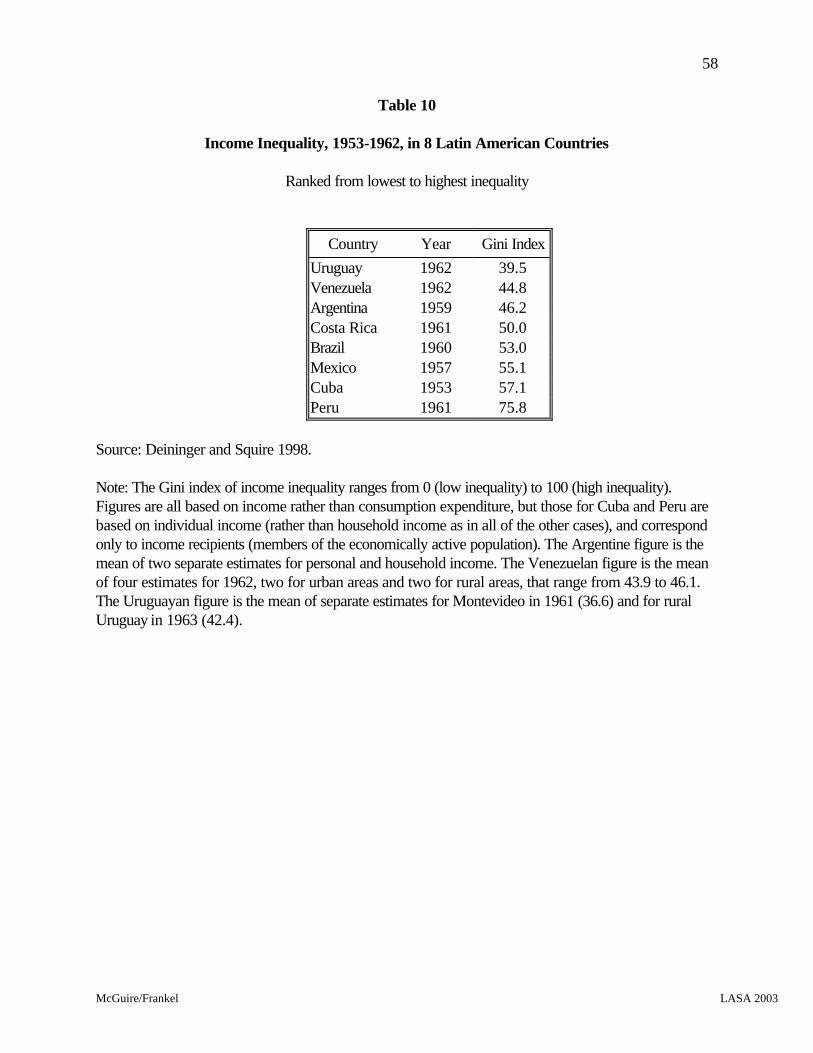

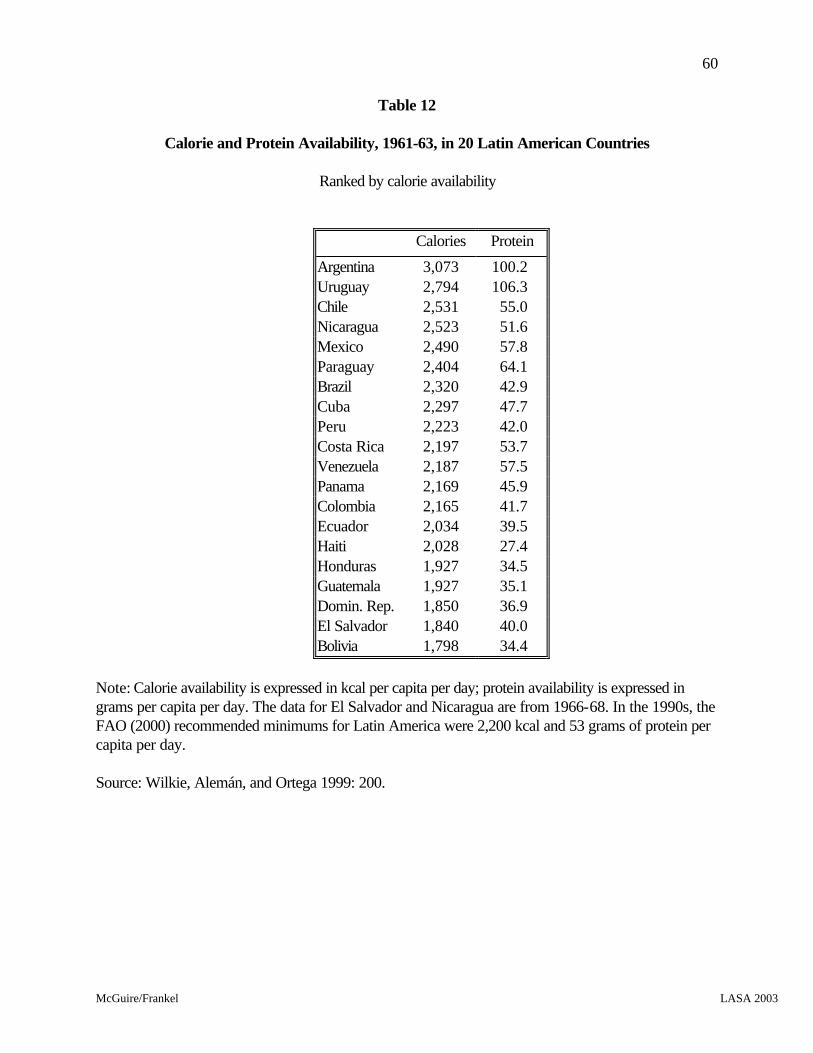


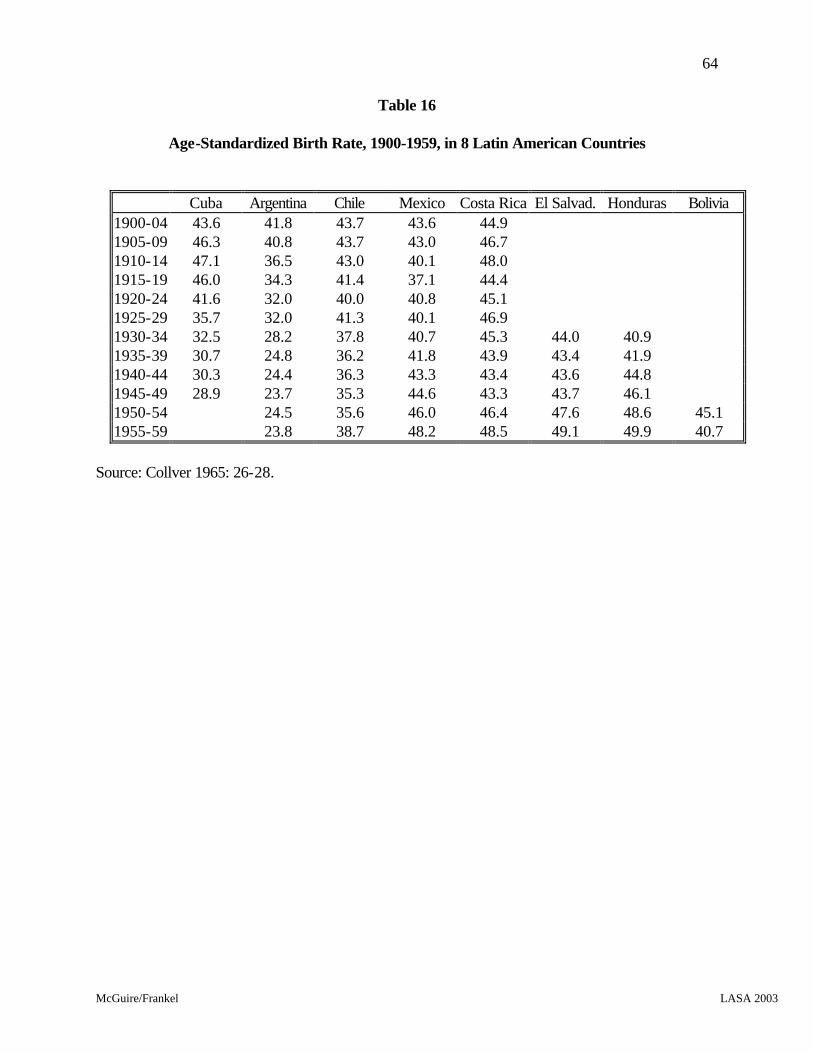


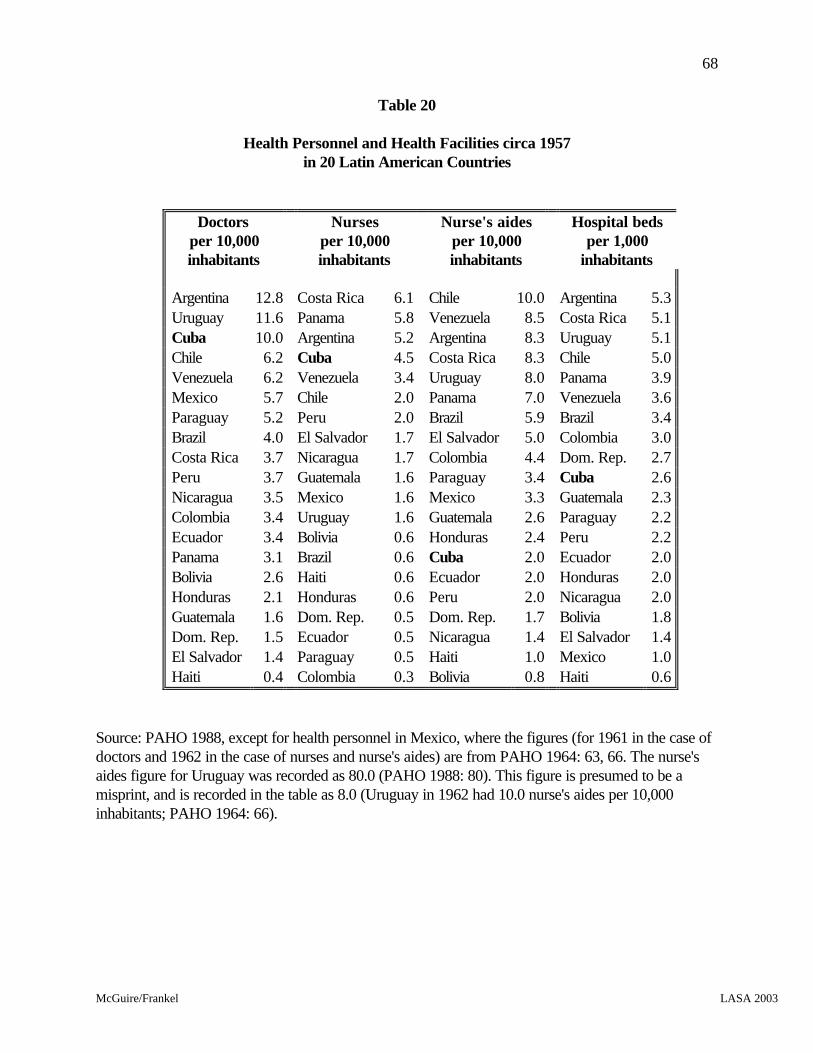


![History of the Development of Physics in Cuba...Revista Cubana de Física, 18 (2), 146-154 (2001).] La enseñanza de la física en Cuba, desde la Colonia hasta 1959 José Altshuler,](https://static.documents.pub/doc/80x56/6138a5a90ad5d20676496294/history-of-the-development-of-physics-in-cuba-revista-cubana-de-fsica-18.jpg)


