18
APRIL 2015 REPORT MONITOR MORTGAGE

APRIL 2015 REPORT
MONITORMORTGAGE

April 2015MONITORMORTGAGE
Confidential, Proprietary and/or Trade SecretTM SM ® Trademark(s) of Black Knight IP Holding Company, LLC, and/or an affiliate.
© 2015 Black Knight Financial Technology Solutions, LLC. All Rights Reserved.
CONTENTS
1 | APRIL 2015 OVERVIEW
2 | APRIL FIRST LOOK FINDINGS
3 | 90-DAY DELINQUENT & FORECLOSURE INVENTORIES
4 | HOME RETENTION ACTIONS
5 | REFINANCE ORIGINATIONS
6 | APPENDIX
7 | DISCLOSURES

April 2015MONITORMORTGAGE
Confidential, Proprietary and/or Trade SecretTM SM ® Trademark(s) of Black Knight IP Holding Company, LLC, and/or an affiliate.
© 2015 Black Knight Financial Technology Solutions, LLC. All Rights Reserved.
APRIL 2015 OVERVIEW
Each month, the Black Knight Mortgage Monitor looks at a variety of issues related to the mortgage and financial services industry.
This month, Black Knight takes a closer look at the shifting landscape of seriously delinquent and foreclosure inventories, with a particular focus on the three states with the largest share of such loans – Florida, New York and New Jersey. In addition, the report examines pipeline ratios in both judicial and non-judicial states.
From there, the report delves into the current state of home retention actions (loan modifications and repayment plans) and how they relate to the remaining inventory of loans either seriously delinquent or in active foreclosure.
Finally, this month’s Mortgage Monitor looks into refinance originations as a share of the total market, as well as the tightening of current credit score requirements in regard to both refinance and purchase originations.
In producing the Mortgage Monitor, the Data & Analytics division of Black Knight Financial Services aggregates, analyzes and reports upon the most recently available mortgage performance data from the company’s McDash loan-level database. For more information on McDash or Black Knight Data & Analytics in general, please call 844-474-2537 or email [email protected].

April 2015MONITORMORTGAGE
Confidential, Proprietary and/or Trade SecretTM SM ® Trademark(s) of Black Knight IP Holding Company, LLC, and/or an affiliate.
© 2015 Black Knight Financial Technology Solutions, LLC. All Rights Reserved.
APRIL FIRST LOOKFINDINGS
Here we have a brief overview of findings from Black Knight’s ‘First Look’ at April mortgage performance data. This information has been compiled from Black Knight’s McDash loan-level mortgage performance database. You may click on each chart to see its contents in high resolution.
Apr-15Month-over-
month changeYear-over-
year change
4.77% 1.46% -15.04%
1.51% -2.43% -25.45%
73,500 -21.89% -6.73%
1.39% -14.49% 60.12%
1.89% 2.47% -3.66%
2,415,000 35,000 -406,000
952,000 -19,000 -235,000
764,000 -18,000 -252,000
3,179,000 17,000 -658,000
12 Month Trend
Total U.S. loan delinquency rate (loans 30 or more days past due, but not in foreclosure):
Total U.S. foreclosure pre-sale inventory rate:
Number of properties in foreclosure pre-sale inventory:
Total U.S. foreclosure starts:
Monthly Prepayment Rate (SMM):
Foreclosure Sales as % of 90+:
Number of properties that are 30 or more days past due, but not in foreclosure:
Number of properties that are 90 or more days past due, but not in foreclosure:
Number of properties that are 30 or more days past due or in foreclosure:
» From Black Knight’s ‘First Look’ report, a high-level view at the month’s mortgage performance data, we saw a slight seasonal uptick in delinquencies push the national rate back up to nearly 4.8 percent
» Foreclosure starts dropped by 22 percent in April, falling 7 percent on a year-over-year basis
» While prepayment rates (Single Month Mortality) did decline from March, they were still up 60 percent from this time last year
» As of April month-end, the nation’s foreclosure inventory fell by 18,000 to 764,000 total, a drop of over 250,000 from this time last year
17.0%
6.3% 4.4% 2.6%
-‐1.0%
2.4% 1.1%
-‐5.8%
1.8% 1.5%
-‐30%
-‐20%
-‐10%
0%
10%
20%
30%
40%
50%
2006-‐04 2007-‐04 2008-‐04 2009-‐04 2010-‐04 2011-‐04 2012-‐04 2013-‐04 2014-‐04 2015-‐04
Percen
tage Cha
nge in Delinqu
ency Rate
Historical April Delinquency Changes
Monthly Change Yearly Change
» April saw a slight uptick in delinquency rates – rising 1.5 percent month-over-month
» Seasonal increases in April are typical (they’ve been seen in eight of the past 10 years)
April 2015MONITORMORTGAGE
Confidential, Proprietary and/or Trade SecretTM SM ® Trademark(s) of Black Knight IP Holding Company, LLC, and/or an affiliate.
© 2015 Black Knight Financial Technology Solutions, LLC. All Rights Reserved.
APRIL FIRST LOOKFINDINGS
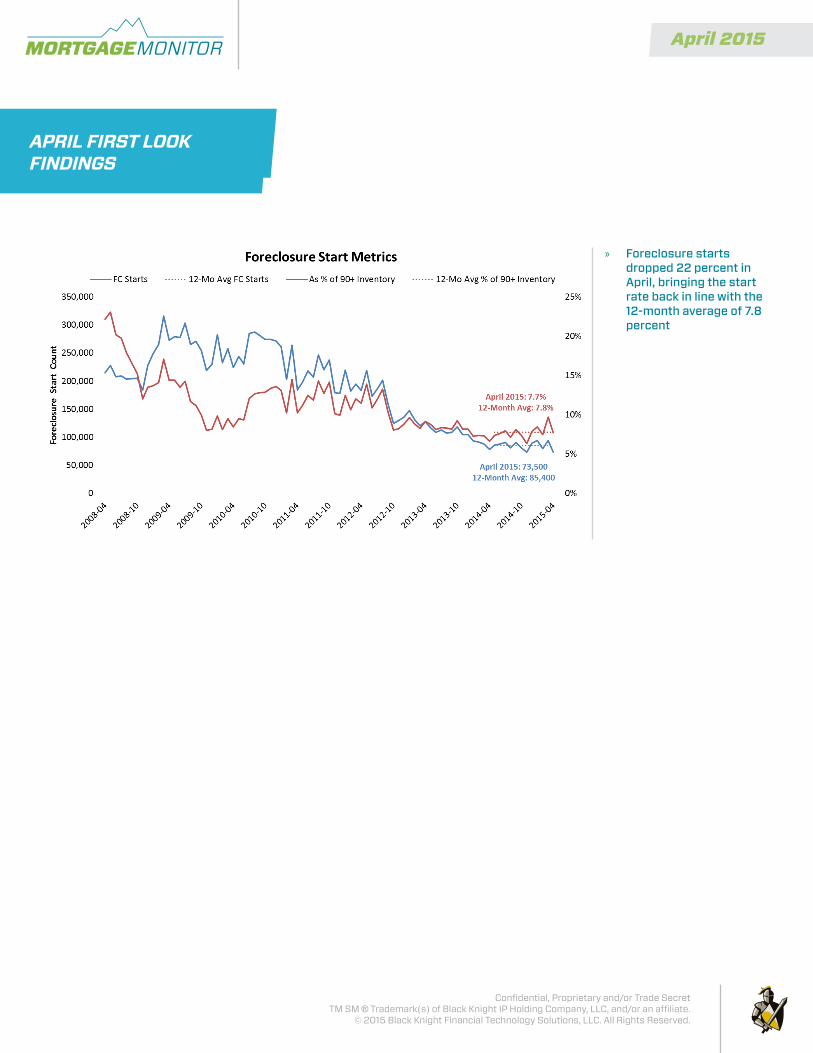
» Foreclosure starts dropped 22 percent in April, bringing the start rate back in line with the 12-month average of 7.8 percent

April 2015MONITORMORTGAGE
Confidential, Proprietary and/or Trade SecretTM SM ® Trademark(s) of Black Knight IP Holding Company, LLC, and/or an affiliate.
© 2015 Black Knight Financial Technology Solutions, LLC. All Rights Reserved.
» 30-day delinquencies, down 11 percent year-over-year, have now fallen below pre-crisis norms, while 60-day delinquencies remain just slightly above their pre-crisis norm
» While down 20 percent year-over-year, at nearly 1.9 percent, 90-day delinquencies are still over twice their pre-crisis norm of .88 percent, though down significantly from the peak of 5.4 percent in January 2010
» Likewise, the inventory of loans in foreclosure – though down 25 percent year-over-year and just over a third of the October 2011 peak of 4.3 percent – remain 3X the pre-crisis norm of .48 percent
2.12%
0.77%
1.88% 1.51%
0%
1%
2%
3%
4%
5%
6%
2005-‐04
2005-‐10
2006-‐04
2006-‐10
2007-‐04
2007-‐10
2008-‐04
2008-‐10
2009-‐04
2009-‐10
2010-‐04
2010-‐10
2011-‐04
2011-‐10
2012-‐04
2012-‐10
2013-‐04
2013-‐10
2014-‐04
2014-‐10
2015-‐04
Delinquency and Foreclosure Rates by Bucket
30 Days DQ 60 Days DQ 90+ Days DQ Foreclosure Rate
90-DAY DELINQUENT & FORECLOSURE INVENTORIES
Here, we examine current inventories of loans either seriously delinquent or in foreclosure, with a particular focus on the three states with the largest share of such loans – Florida, New York and New Jersey. You may click on each chart to see its contents in high resolution.

April 2015MONITORMORTGAGE
Confidential, Proprietary and/or Trade SecretTM SM ® Trademark(s) of Black Knight IP Holding Company, LLC, and/or an affiliate.
© 2015 Black Knight Financial Technology Solutions, LLC. All Rights Reserved.
90-DAY DELINQUENT & FORECLOSURE INVENTORIES
» The rate of new severely delinquent loans (those that were current 6 months ago but are now 60 or more days past due) remains at pre-crisis levels
» The low rate of new severely delinquent loans underscores the age of existing 90+ days delinquent and foreclosure inventories
» The average number of days delinquent for a loan 90 or more days past due is now 544 days (1.5 years), whereas the pre-crisis norm for such a loan was approximately 230 days
» For a loan in foreclosure, the average number of days delinquent is 1011 days (well over 2.5 years), whereas the norm was about 320 days

April 2015MONITORMORTGAGE
Confidential, Proprietary and/or Trade SecretTM SM ® Trademark(s) of Black Knight IP Holding Company, LLC, and/or an affiliate.
© 2015 Black Knight Financial Technology Solutions, LLC. All Rights Reserved.
» Roughly 480,000 of the remaining 1.7 million loans that are either seriously delinquent or in foreclosure are located in Florida, New York and New Jersey
» These states make up three of the top five by rate of loans 90+ days past due or in foreclosure (Mississippi and Maine are numbers three and four in this category at 6.2 and 5.6 percent), and the top three by volume
» Florida has seen the highest level of improvement over the last 12 months (37 percent decline in inventory) and last 24 months (63 percent decline)
» New York and New Jersey now represent 17 percent of such inventory, up from 11 percent over the past 3 years
5.6%
7.9%6.3%
3 4%4.7%
5%
10%
15%
20%
25%
Percent of Borrowers 90+ Days Delinquent or in ForeclosureFlorida New Jersey New York Average ‐ National Average ‐ Judicial States
28% of the country’s remaining 90+ Delinquent and Foreclosure inventory is located in New York,
New Jersey, and Florida
3.4%
0%
» Low foreclosure sale (completion) rates in New York and New Jersey have contributed to elevated inventory in those states
» Court system delays and mandatory mediation in New York continue to slow the foreclosure process there
» In New York, the average days without payment for a loan in foreclosure is now over four years, as compared to the national average of just under three years
90-DAY DELINQUENT & FORECLOSURE INVENTORIES

April 2015MONITORMORTGAGE
Confidential, Proprietary and/or Trade SecretTM SM ® Trademark(s) of Black Knight IP Holding Company, LLC, and/or an affiliate.
© 2015 Black Knight Financial Technology Solutions, LLC. All Rights Reserved.
» Pipeline ratios equal the time in years needed to work through seriously delinquent and foreclosure inventories at the current rate of foreclosure sales; overall the national pipeline ratio is roughly 4.5 years
» Note: ratios are not a prediction, but rather a visualization of backlogs as they stand today; there are multiple other avenues to reduce these volumes, including modifications, short sales, deeds in lieu and cures to current status
» Washington D.C. has the highest pipeline ratio (43.3 years) primarily due to extremely low foreclosure sales volume
» While ranking among the top states in both inventory number and rate, Florida has the lowest pipeline ratio of any judicial state
» Florida’s low pipeline ratio is due in part to increased funds provided for additional court staff to facilitate the judicial foreclosure process; these funds expire in June of this year
90-DAY DELINQUENT & FORECLOSURE INVENTORIES

April 2015MONITORMORTGAGE
Confidential, Proprietary and/or Trade SecretTM SM ® Trademark(s) of Black Knight IP Holding Company, LLC, and/or an affiliate.
© 2015 Black Knight Financial Technology Solutions, LLC. All Rights Reserved.
» While pipeline ratios are still elevated by historical standards, improvement has been seen in the most troubled states
» Even though Florida peaked with 20 percent of the entire state being 90+ days past due, its pipeline ratio was never longer than 10 years (9.8 years in February 2006, the earliest peak of any of these states)
» Meanwhile, New York peaked at 13 percent of that state’s inventory being 90+ days past due, and its pipeline ballooned to nearly 70 years in February of 2012
» Dates and sizes of other peaks: Washington D.C., 81 years in February 2012; Massachusetts, 29.5 years in May 2014 – the latest among these states; Hawaii 29.5 years in February 2012; and New Jersey at 59.1 years in March 2012
0
10
20
30
40
50
60
70
80
Judicial
NY
NM
ND HI
NJ
WI IL
KS
IA
FL
Foreclosure an
d 90
+ Da
y DQ
Pipeline in Years
Pipeline Ra8os -‐ Judicial 10-‐Year High Current 10-‐Year Low
0
10
20
30
40
50
60
70
80
Non Judicial
DC
MA NV CA
RI
MO
ID
AK
MN
MI
Foreclosure an
d 90
+ Da
y DQ
Pipeline in Years
Pipeline Ra8os -‐ Non-‐Judicial 10-‐Year High Current 10-‐Year Low
90-DAY DELINQUENT & FORECLOSURE INVENTORIES

April 2015MONITORMORTGAGE
Confidential, Proprietary and/or Trade SecretTM SM ® Trademark(s) of Black Knight IP Holding Company, LLC, and/or an affiliate.
© 2015 Black Knight Financial Technology Solutions, LLC. All Rights Reserved.
HOME RETENTION ACTIONS
» Home retention actions have declined 42 percent over the past two years, but at the same time, have increased 9 percent as share of 90+ days delinquent inventory
» In Q1 2015, 15 percent of loans 90 or more days delinquent saw some form of home retention action each month (using a 3-month weighted average)
» Home retention actions include trial modifications, repayment plans and permanent HAMP and proprietary modifications
15%
0%
2%
4%
6%
8%
10%
12%
14%
16%
18%
20%
2008
-‐Q1
2008
-‐Q2
2008
-‐Q3
2008
-‐Q4
2009
-‐Q1
2009
-‐Q2
2009
-‐Q3
2009
-‐Q4
2010
-‐Q1
2010
-‐Q2
2010
-‐Q3
2010
-‐Q4
2011
-‐Q1
2011
-‐Q2
2011
-‐Q3
2011
-‐Q4
2012
-‐Q1
2012
-‐Q2
2012
-‐Q3
2012
-‐Q4
2013
-‐Q1
2013
-‐Q2
2013
-‐Q3
2013
-‐Q4
2014
-‐Q1
2014
-‐Q2
2014
-‐Q3
2014
-‐Q4
2015
-‐Q1
Reten%
on Ac%on
s as %
of 9
0+ In
ventory
Quarter
Home Reten%on Ac%ons Reten2on Ac2on Volume (Indexed) Reten2on Ac2ons as % of 90+ DQ Inventory
• Home Reten)on Ac)ons above include trial modifica)ons, repayment plans, and permanent HAMP and proprietary modifica)ons • Reten)on Ac)ons as % of 90+ DQ Inventory is the 3-‐Month weighted average for the quarter.
ChangeRetention Action
(% of 90+ Inventory)Retention Action
(Volume)1 -‐Year 1% -‐19%2-‐Year 9% -‐42%
Here we look at the current state of home retention actions (loan modifications and repayment plans) and how they relate to the remaining inventory of loans either seriously delinquent or in active foreclosure. You may click on each chart to see its contents in high-resolution.
April 2015MONITORMORTGAGE
Confidential, Proprietary and/or Trade SecretTM SM ® Trademark(s) of Black Knight IP Holding Company, LLC, and/or an affiliate.
© 2015 Black Knight Financial Technology Solutions, LLC. All Rights Reserved.
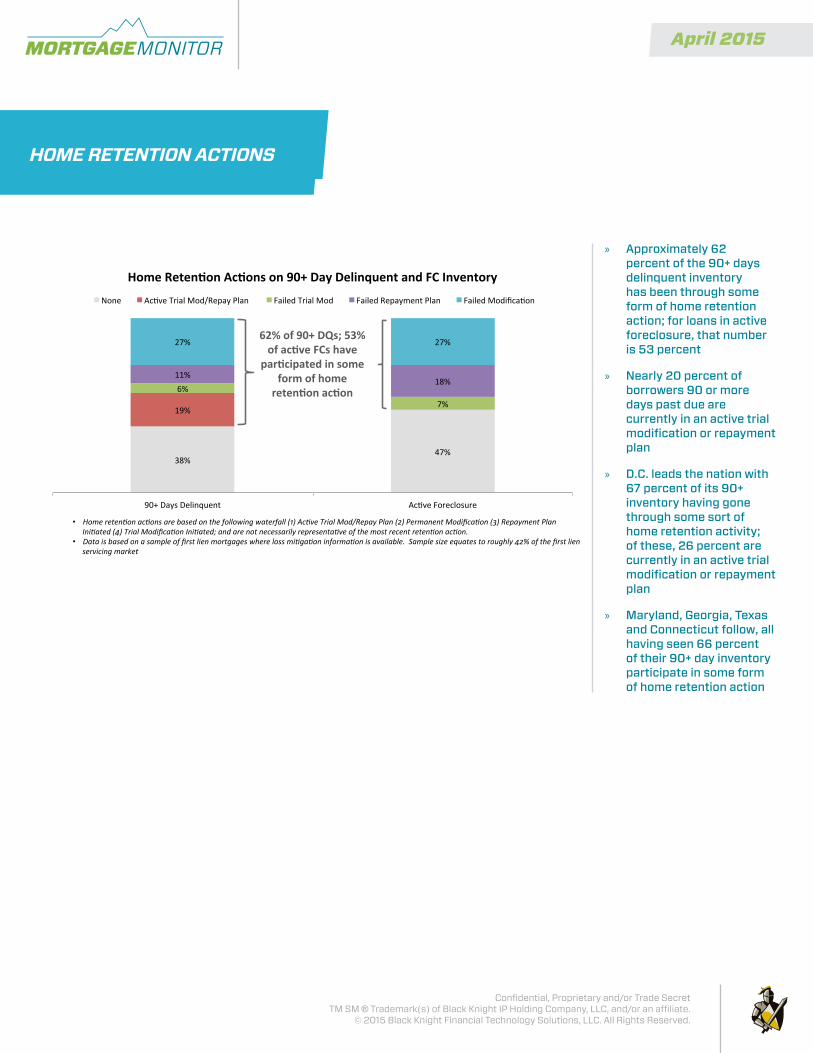
» Approximately 62 percent of the 90+ days delinquent inventory has been through some form of home retention action; for loans in active foreclosure, that number is 53 percent
» Nearly 20 percent of borrowers 90 or more days past due are currently in an active trial modification or repayment plan
» D.C. leads the nation with 67 percent of its 90+ inventory having gone through some sort of home retention activity; of these, 26 percent are currently in an active trial modification or repayment plan
» Maryland, Georgia, Texas and Connecticut follow, all having seen 66 percent of their 90+ day inventory participate in some form of home retention action
• Home reten)on ac)ons are based on the following waterfall (1) Ac)ve Trial Mod/Repay Plan (2) Permanent Modifica)on (3) Repayment Plan Ini)ated (4) Trial Modifica)on Ini)ated; and are not necessarily representa)ve of the most recent reten)on ac)on.
• Data is based on a sample of first lien mortgages where loss mi)ga)on informa)on is available. Sample size equates to roughly 42% of the first lien servicing market
38% 47%
19%
6%
7%
11% 18%
27% 27%
90+ Days Delinquent Ac:ve Foreclosure
Home Reten)on Ac)ons on 90+ Day Delinquent and FC Inventory
None Ac:ve Trial Mod/Repay Plan Failed Trial Mod Failed Repayment Plan Failed Modifica:on
62% of 90+ DQs; 53% of ac)ve FCs have
par)cipated in some form of home
reten)on ac)on
HOME RETENTION ACTIONS

April 2015MONITORMORTGAGE
Confidential, Proprietary and/or Trade SecretTM SM ® Trademark(s) of Black Knight IP Holding Company, LLC, and/or an affiliate.
© 2015 Black Knight Financial Technology Solutions, LLC. All Rights Reserved.
» In contrast to the inventory of loans 90 or more days past due, home retention activity saturation continues to increase in active foreclosure inventory
» Saturation continues to grow at approximately 3 percent per year
» To date, some 53 percent of active foreclosures have participated in home retention activities
74% 63%
56% 53% 50% 47%
8%
13% 14%
13% 10%
7%
9% 9%
11% 14% 16%
18%
9% 13% 16% 17% 19% 20%
1% 2% 3% 3% 5% 6%
0%
10%
20%
30%
40%
50%
60%
70%
80%
90%
100%
2010-‐03 2011-‐03 2012-‐03 2013-‐03 2014-‐03 2015-‐03
Home Renten)on Ac)ons on Ac)ve Foreclosure Inventory
None Failed Trial(s) Failed Repay Plan Failed Mod MulBple Failed Mods
HOME RETENTION ACTIONS
» Home retention activity saturation is beginning to flatten on 90+ day delinquent inventory
» At 62 percent, we are currently seeing the highest level of saturation, but this is only marginally higher than one year ago
» We are starting to see redundancy in retention actions; 70 percent of all new trials and repayment plans have already been through one or more home retention actions in the past
» Looking back to 2011, the rate of repeat trials/repays was only about 45 percent
Only 30% of ac-ve trials and repayment plans are the borrowers’ first home reten-on ac-on

April 2015MONITORMORTGAGE
Confidential, Proprietary and/or Trade SecretTM SM ® Trademark(s) of Black Knight IP Holding Company, LLC, and/or an affiliate.
© 2015 Black Knight Financial Technology Solutions, LLC. All Rights Reserved.
» As the number of borrowers seeking to refinance has grown, weighted average credit scores have been rising, and loan-to-value ratios (LTVs) dropping
» Over the past 18 months, credit scores on refinance originations have increased 19 points to a weighted average of 761, while LTVs have dropped to 65 percent
68
65
742
761
640
660
680
700
720
740
760
780
2005
-‐03
2005
-‐09
2006
-‐03
2006
-‐09
2007
-‐03
2007
-‐09
2008
-‐03
2008
-‐09
2009
-‐03
2009
-‐09
2010
-‐03
2010
-‐09
2011
-‐03
2011
-‐09
2012
-‐03
2012
-‐09
2013
-‐03
2013
-‐09
2014
-‐03
2014
-‐09
2015
-‐03
50
55
60
65
70
75
80
85
90
95
100
Weighted Av
erage Cred
it Score
Weighted Av
erage LTV
Refinance Origina?ons
Refinance Origina7on Volume (Indexed) Weighed Average LTV Weighted Average Credit Score
REFINANCE ORIGINATIONS
» The refinance share of the mortgage origination market was over 50 percent in Q1 2015 for the first time since Q3 2013
» The 30-year conforming mortgage interest rate is down approximately 70 basis points from where it was one year ago, providing qualifying borrowers with additional incentive to refinance
» There are now some 7 million potential refinance candidates – borrowers likely to both qualify for and benefit from refinancing – up from 4.5 million a year ago
» This is a very interest rate sensitive population; a 50 basis point increase in interest rates would result in a 43 percent reduction in refinance candidates, approximately 3 million borrowers
55%
76%
56%
4%
6%
8%
10%
40%
50%
60%
70%
80%
90%
MC 30
‐Yea
r Fixed
Rate
hare of O
rigination Market
Refinance Share of Origination MarketRefinance Share FHLMC 30‐Year Fixed Rate
31%
0%
2%
0%
10%
20%
30%
FHLM
Refin
ance S
Here we take a look at refinance originations as a share of the total market, as well as the tightening of current credit score requirements in regard to both refinance and purchase originations. You may click on each chart to see its contents in high-resolution.

April 2015MONITORMORTGAGE
Confidential, Proprietary and/or Trade SecretTM SM ® Trademark(s) of Black Knight IP Holding Company, LLC, and/or an affiliate.
© 2015 Black Knight Financial Technology Solutions, LLC. All Rights Reserved.
REFINANCE ORIGINATIONS
» Lending requirements remain tight on purchase transactions, with a weighted average credit score of 751 and LTV of 81 percent, both only marginally higher than in Q1 201480
81
750
751
690
700
710
720
730
740
750
760
2005
-‐03
2005
-‐09
2006
-‐03
2006
-‐09
2007
-‐03
2007
-‐09
2008
-‐03
2008
-‐09
2009
-‐03
2009
-‐09
2010
-‐03
2010
-‐09
2011
-‐03
2011
-‐09
2012
-‐03
2012
-‐09
2013
-‐03
2013
-‐09
2014
-‐03
2014
-‐09
2015
-‐03
50
55
60
65
70
75
80
85
90
95
100
Weighted Av
erage Cred
it Score
Weighted Av
erage LTV
Purchase Origina>ons
Purchase Origina9on Volume (Indexed) Weighed Average LTV Weighted Average Credit Score
» Borrowers with credit scores of 740 or above made up 68 percent of refinance originations in Q1 2015, compared to 55 percent in Q1 2014
» Borrowers with credit scores below 640, who had edged up to account for 6 percent of originations in Q1 2014 have since dropped back down to make up just 3 percent in Q1 2015
» Borrowers with credit scores between 680-739 have lost market share as well, dropping to 23 percent of Q1 2015 refinance originations, as compared to 28 percent in Q1 2014
19%
20%
20%
18%
17%
18%
18%
16%
12%
13%
17%
15%
8%
8%
9%
10%
9%
8%
6%
6%
7%
8%
6%
5%
6%
7%
6%
7%
7%
8%
9%
11%
11%
11%
9%
8%
6%
31%
30%
30%
31%
32%
31%
30%
30%
30%
29% 28%
26%
22%
23%
26%
26%
26%
26%
22%
21%
25%
25%
21%
20%
22%
23%
22%
22%
23%
24%
27%
28%
28%
27%
28%
26%
23%
26%
26%
25%
28%
31%
30%
29%
33%
45%
44%
37%
43%
64%
66%
60%
59%
62%
63%
70%
72%
67%
64%
70%
74%
70%
66%
69%
68%
66%
64%
58%
54%
55%
57%
59%
63%
68%
0% 10% 20% 30% 40% 50% 60% 70% 80% 90%
100%
2006
-‐Q1
2006
-‐Q2
2006
-‐Q3
2006
-‐Q4
2007
-‐Q1
2007
-‐Q2
2007
-‐Q3
2007
-‐Q4
2008
-‐Q1
2008
-‐Q2
2008
-‐Q3
2008
-‐Q4
2009
-‐Q1
2009
-‐Q2
2009
-‐Q3
2009
-‐Q4
2010
-‐Q1
2010
-‐Q2
2010
-‐Q3
2010
-‐Q4
2011
-‐Q1
2011
-‐Q2
2011
-‐Q3
2011
-‐Q4
2012
-‐Q1
2012
-‐Q2
2012
-‐Q3
2012
-‐Q4
2013
-‐Q1
2013
-‐Q2
2013
-‐Q3
2013
-‐Q4
2014
-‐Q1
2014
-‐Q2
2014
-‐Q3
2014
-‐Q4
2015
-‐Q1
Origina'on Quarter
Credit Score Distribu'on of Refinance Origina'ons
<640 640 -‐ 679 680-‐739 740+
April 2015MONITORMORTGAGE
Confidential, Proprietary and/or Trade SecretTM SM ® Trademark(s) of Black Knight IP Holding Company, LLC, and/or an affiliate.
© 2015 Black Knight Financial Technology Solutions, LLC. All Rights Reserved.
APPENDIX
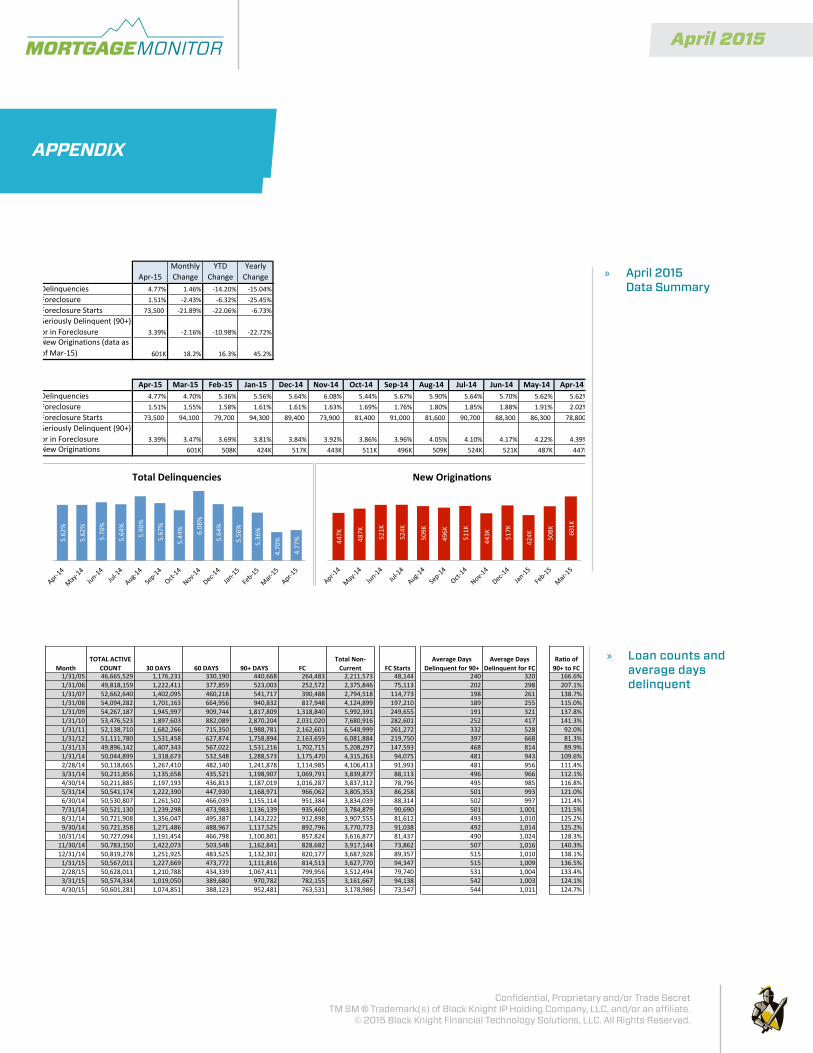
» April 2015 Data Summary
» Loan counts and average days delinquent
Apr-‐15Monthly Change
YTD Change
Yearly Change
Delinquencies 4.77% 1.46% -‐14.20% -‐15.04%Foreclosure 1.51% -‐2.43% -‐6.32% -‐25.45%Foreclosure Starts 73,500 -‐21.89% -‐22.06% -‐6.73%Seriously Delinquent (90+) or in Foreclosure 3.39% -‐2.16% -‐10.98% -‐22.72%New Originations (data as of Mar-‐15) 601K 18.2% 16.3% 45.2%
Apr-‐15 Mar-‐15 Feb-‐15 Jan-‐15 Dec-‐14 Nov-‐14 Oct-‐14 Sep-‐14 Aug-‐14 Jul-‐14 Jun-‐14 May-‐14 Apr-‐14Delinquencies 4.77% 4.70% 5.36% 5.56% 5.64% 6.08% 5.44% 5.67% 5.90% 5.64% 5.70% 5.62% 5.62%Foreclosure 1.51% 1.55% 1.58% 1.61% 1.61% 1.63% 1.69% 1.76% 1.80% 1.85% 1.88% 1.91% 2.02%Foreclosure Starts 73,500 94,100 79,700 94,300 89,400 73,900 81,400 91,000 81,600 90,700 88,300 86,300 78,800 Seriously Delinquent (90+) or in Foreclosure 3.39% 3.47% 3.69% 3.81% 3.84% 3.92% 3.86% 3.96% 4.05% 4.10% 4.17% 4.22% 4.39%New Originations 601K 508K 424K 517K 443K 511K 496K 509K 524K 521K 487K 447K
5.62
%
5.62
%
5.70
%
5.64
%
5.90
%
5.67
%
5.44
%
6.08
%
5.64
%
5.56
%
5.36
%
4.70
%
4.77
%
Total Delinquencies
447K
487K
521K
524K
509K
496K
511K
443K
517K
424K
508K
601K
New OriginaAons
MonthTOTAL ACTIVE
COUNT 30 DAYS 60 DAYS 90+ DAYS FCTotal Non-‐Current FC Starts
Average Days Delinquent for 90+
Average Days Delinquent for FC
Ratio of 90+ to FC
1/31/05 46,665,529 1,176,231 330,190 440,668 264,483 2,211,573 48,144 240 320 166.6%1/31/06 49,818,159 1,222,411 377,859 523,003 252,572 2,375,846 75,113 202 298 207.1%1/31/07 52,662,640 1,402,095 460,218 541,717 390,488 2,794,518 114,773 198 261 138.7%1/31/08 54,094,282 1,701,163 664,956 940,832 817,948 4,124,899 197,210 189 255 115.0%1/31/09 54,267,187 1,945,997 909,744 1,817,809 1,318,840 5,992,391 249,655 191 321 137.8%1/31/10 53,476,523 1,897,603 882,089 2,870,204 2,031,020 7,680,916 282,601 252 417 141.3%1/31/11 52,138,710 1,682,266 715,350 1,988,781 2,162,601 6,548,999 261,272 332 528 92.0%1/31/12 51,111,780 1,531,458 627,874 1,758,894 2,163,659 6,081,884 219,750 397 668 81.3%1/31/13 49,896,142 1,407,343 567,022 1,531,216 1,702,715 5,208,297 147,593 468 814 89.9%1/31/14 50,044,899 1,318,673 532,548 1,288,573 1,175,470 4,315,263 94,075 481 943 109.6%2/28/14 50,118,665 1,267,410 482,140 1,241,878 1,114,985 4,106,413 91,993 481 956 111.4%3/31/14 50,211,856 1,135,658 435,521 1,198,907 1,069,791 3,839,877 88,113 496 966 112.1%4/30/14 50,211,885 1,197,193 436,813 1,187,019 1,016,287 3,837,312 78,796 495 985 116.8%5/31/14 50,541,174 1,222,390 447,930 1,168,971 966,062 3,805,353 86,258 501 993 121.0%6/30/14 50,530,807 1,261,502 466,039 1,155,114 951,384 3,834,039 88,314 502 997 121.4%7/31/14 50,521,130 1,239,298 473,983 1,136,139 935,460 3,784,879 90,690 501 1,001 121.5%8/31/14 50,721,908 1,356,047 495,387 1,143,222 912,898 3,907,555 81,612 493 1,010 125.2%9/30/14 50,721,358 1,271,486 488,967 1,117,525 892,796 3,770,773 91,038 492 1,014 125.2%10/31/14 50,727,094 1,191,454 466,798 1,100,801 857,824 3,616,877 81,437 490 1,024 128.3%11/30/14 50,783,150 1,422,073 503,548 1,162,841 828,682 3,917,144 73,862 507 1,016 140.3%12/31/14 50,819,278 1,251,925 483,525 1,132,301 820,177 3,687,928 89,357 515 1,010 138.1%1/31/15 50,567,011 1,227,669 473,772 1,111,816 814,513 3,627,770 94,347 515 1,009 136.5%2/28/15 50,628,011 1,210,788 434,339 1,067,411 799,956 3,512,494 79,740 531 1,004 133.4%3/31/15 50,574,334 1,019,050 389,680 970,782 782,155 3,161,667 94,138 542 1,003 124.1%4/30/15 50,601,281 1,074,851 388,123 952,481 763,531 3,178,986 73,547 544 1,011 124.7%
April 2015MONITORMORTGAGE
Confidential, Proprietary and/or Trade SecretTM SM ® Trademark(s) of Black Knight IP Holding Company, LLC, and/or an affiliate.
© 2015 Black Knight Financial Technology Solutions, LLC. All Rights Reserved.
APPENDIX
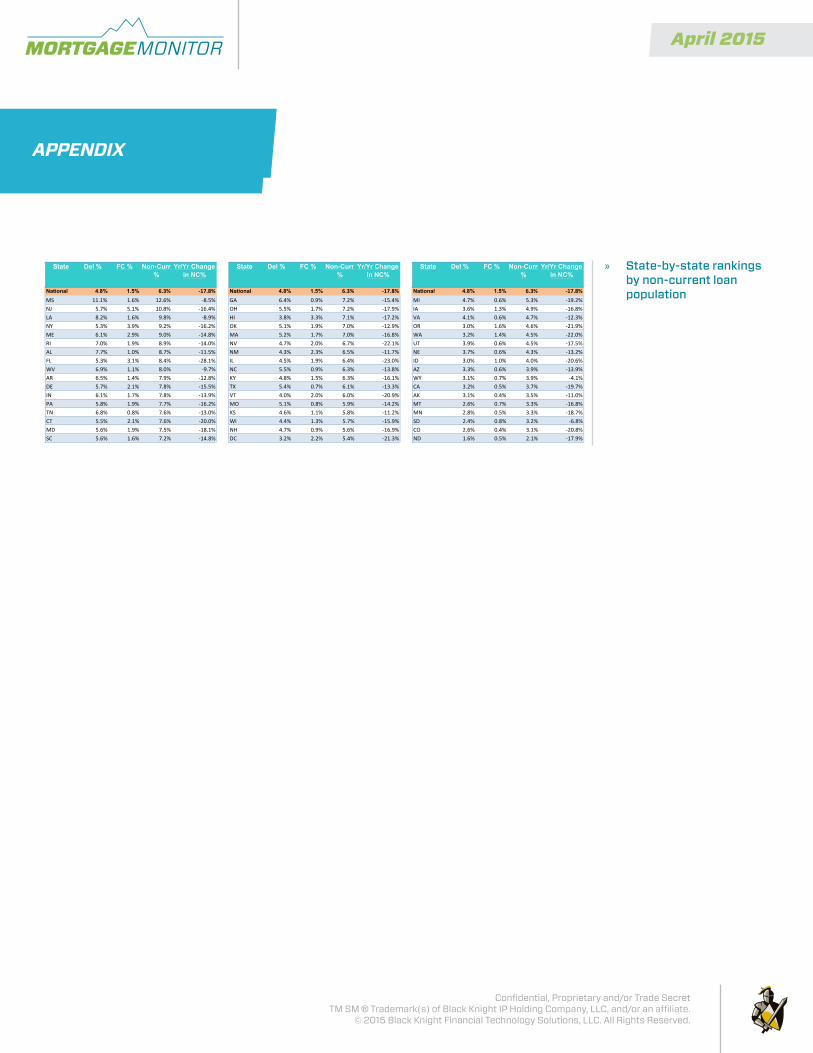
» State-by-state rankings by non-current loan population
State Del % FC % Non-Curr %
Yr/Yr Change in NC%
State Del % FC % Non-Curr %
Yr/Yr Change in NC%
State Del % FC % Non-Curr %
Yr/Yr Change in NC%
National 4.8% 1.5% 6.3% -‐17.8% National 4.8% 1.5% 6.3% -‐17.8% National 4.8% 1.5% 6.3% -‐17.8%MS 11.1% 1.6% 12.6% -‐8.5% GA 6.4% 0.9% 7.2% -‐15.4% MI 4.7% 0.6% 5.3% -‐19.2%NJ 5.7% 5.1% 10.8% -‐16.4% OH 5.5% 1.7% 7.2% -‐17.9% IA 3.6% 1.3% 4.9% -‐16.8%LA 8.2% 1.6% 9.8% -‐8.9% HI 3.8% 3.3% 7.1% -‐17.2% VA 4.1% 0.6% 4.7% -‐12.3%NY 5.3% 3.9% 9.2% -‐16.2% OK 5.1% 1.9% 7.0% -‐12.9% OR 3.0% 1.6% 4.6% -‐21.9%ME 6.1% 2.9% 9.0% -‐14.8% MA 5.2% 1.7% 7.0% -‐16.8% WA 3.2% 1.4% 4.5% -‐22.0%RI 7.0% 1.9% 8.9% -‐14.0% NV 4.7% 2.0% 6.7% -‐22.1% UT 3.9% 0.6% 4.5% -‐17.5%AL 7.7% 1.0% 8.7% -‐11.5% NM 4.3% 2.3% 6.5% -‐11.7% NE 3.7% 0.6% 4.3% -‐13.2%FL 5.3% 3.1% 8.4% -‐28.1% IL 4.5% 1.9% 6.4% -‐23.0% ID 3.0% 1.0% 4.0% -‐20.6%WV 6.9% 1.1% 8.0% -‐9.7% NC 5.5% 0.9% 6.3% -‐13.8% AZ 3.3% 0.6% 3.9% -‐13.9%AR 6.5% 1.4% 7.9% -‐12.8% KY 4.8% 1.5% 6.3% -‐16.1% WY 3.1% 0.7% 3.9% -‐4.1%DE 5.7% 2.1% 7.8% -‐15.5% TX 5.4% 0.7% 6.1% -‐13.3% CA 3.2% 0.5% 3.7% -‐19.7%IN 6.1% 1.7% 7.8% -‐13.9% VT 4.0% 2.0% 6.0% -‐20.9% AK 3.1% 0.4% 3.5% -‐11.0%PA 5.8% 1.9% 7.7% -‐16.2% MO 5.1% 0.8% 5.9% -‐14.2% MT 2.6% 0.7% 3.3% -‐16.8%TN 6.8% 0.8% 7.6% -‐13.0% KS 4.6% 1.1% 5.8% -‐11.2% MN 2.8% 0.5% 3.3% -‐18.7%CT 5.5% 2.1% 7.6% -‐20.0% WI 4.4% 1.3% 5.7% -‐15.9% SD 2.4% 0.8% 3.2% -‐6.8%MD 5.6% 1.9% 7.5% -‐18.1% NH 4.7% 0.9% 5.6% -‐16.9% CO 2.6% 0.4% 3.1% -‐20.8%SC 5.6% 1.6% 7.2% -‐14.8% DC 3.2% 2.2% 5.4% -‐21.3% ND 1.6% 0.5% 2.1% -‐17.9%

April 2015MONITORMORTGAGE
Confidential, Proprietary and/or Trade SecretTM SM ® Trademark(s) of Black Knight IP Holding Company, LLC, and/or an affiliate.
© 2015 Black Knight Financial Technology Solutions, LLC. All Rights Reserved.
DISCLOSURESPlease refer to the links below for specific disclosures relating to Product Definitions, Metrics Definitions and Extrapolation Methodology.
>> PRODUCT DEFINITIONS>> METRICS DEFINITIONS>> EXTRAPOLATION METHODOLOGY


