MOSSBAUER EFFECT IN HEMOGLOBIN AND SOME IRON-CONTAINING BIOLOGICAL COMPOUNDS U. GONSER and R. W. GRANT From the North American Aviation Science Center, Thousand Oaks, California ABSTRACT The Mossbauer effect in Fe' has been used to study the molecules, hemoglobin, O.-hemoglobin, CO2-hemoglobin, and CO-hemoglobin (within red cells) and the molecules, hemin and hematin (in the crystalline state). Quadrupole splittings and isomeric shifts observed in the Mossbauer spectra of these molecules are tabulated. The temperature dependence of the quadrupole splitting and relative recoil-free fraction for hemoglobin with different ligands has been investigated. An estimate of the Debye-Waller factor in 02-hemoglobin at 5°K is 0.83. An asymmetry in the quadrupole splitting observed in hemoglobin is attributed to a directional dependence of the recoil-free fraction which estab- lishes the sign of the electric field gradient in the molecule and indicates that the lowest lying d orbital of the Fe atoms is Ixy). This asymmetry indicates that the iron atoms in hemoglobin are vibrating farther perpendicular to the heme planes than parallel to them, and, in fact, the ratio of the mean square displacements perpendicular and parallel to the heme planes in hemoglobin is sw5.5 at 5°K. The temperature dependence of the quadrupole splitting in hemo- globin has been used to estimate a splitting between the lowest lying iron atom d orbitals of P420 cm . INTRODUCTION The Mossbauer effect (recoil-free nuclear y-ray resonance) has been used to study many interesting problems in physics and chemistry (1 - 4) since its discovery by Mossbauer in 1958 (5, 6). The main difficulty of applying this technique to bio- physical studies concerns the extreme dilution of presently available M'ossbauer isotopes in most biological compounds. However, this difficulty is an experimental problem which can usually be solved (if necessary with the use of enriched isotopes) and should not prevent the Mossbauer effect from becoming a new and interesting tool for biological research (7). At present, it appears that only the elements iron and iodine offer reasonable possibilities for Mossbauer experiments of a biological nature. We will restrict our attention to iron in this paper. Fe57 has become the most widely used Mo3ssbauer 823
Transcript
MOSSBAUER EFFECT IN HEMOGLOBIN
AND SOME IRON-CONTAINING
BIOLOGICAL COMPOUNDS
U. GONSER and R. W. GRANT
From the North American Aviation Science Center, Thousand Oaks, California
ABSTRACT The Mossbauer effect in Fe' has been used to study the molecules,hemoglobin, O.-hemoglobin, CO2-hemoglobin, and CO-hemoglobin (within redcells) and the molecules, hemin and hematin (in the crystalline state).Quadrupole splittings and isomeric shifts observed in the Mossbauer spectra ofthese molecules are tabulated. The temperature dependence of the quadrupolesplitting and relative recoil-free fraction for hemoglobin with different ligands hasbeen investigated. An estimate of the Debye-Waller factor in 02-hemoglobinat 5°K is 0.83. An asymmetry in the quadrupole splitting observed in hemoglobinis attributed to a directional dependence of the recoil-free fraction which estab-lishes the sign of the electric field gradient in the molecule and indicates thatthe lowest lying d orbital of the Fe atoms is Ixy). This asymmetry indicatesthat the iron atoms in hemoglobin are vibrating farther perpendicular to theheme planes than parallel to them, and, in fact, the ratio of the mean squaredisplacements perpendicular and parallel to the heme planes in hemoglobin issw5.5 at 5°K. The temperature dependence of the quadrupole splitting in hemo-globin has been used to estimate a splitting between the lowest lying iron atomd orbitals of P420 cm .
INTRODUCTION
The Mossbauer effect (recoil-free nuclear y-ray resonance) has been used to studymany interesting problems in physics and chemistry (1 - 4) since its discovery byMossbauer in 1958 (5, 6). The main difficulty of applying this technique to bio-physical studies concerns the extreme dilution of presently available M'ossbauerisotopes in most biological compounds. However, this difficulty is an experimentalproblem which can usually be solved (if necessary with the use of enriched isotopes)and should not prevent the Mossbauer effect from becoming a new and interestingtool for biological research (7).At present, it appears that only the elements iron and iodine offer reasonable
possibilities for Mossbauer experiments of a biological nature. We will restrict ourattention to iron in this paper. Fe57 has become the most widely used Mo3ssbauer
823
isotope in physics and chemistry, and it is fortunate that iron is contained in hemo-globin (Hb), myoglobin, cytochrome, peroxidases of plants, catalases of erythro-cytes, and other molecules which have interesting biological functions. A number oftechniques has been applied to studying the physical and chemical parameters ofthese iron-containing compounds. Mossbauer effect studies with Fe57 should addnew information about the nature of these compounds, since the technique allowsone to make a non-destructive measurement on an atomic scale and to single outand study only the iron atoms in the sample.
In the present study we wil demonstrate the feasibility and applicability ofMossbauer spectroscopy for biophysical studies of compounds containing Fe57 anddiscuss the Mossbauer spectra of hemoglobin and some related porphyrin ring com-pounds in considerable detail.
MOSSBAUER PARAMETERS
The underlying principle of the Mossbauer effect is that a y-ray resulting from thetransition between excited and ground nuclear states can be emitted in a recoil-freefashion (i.e., the y-ray can possess essentially the full nuclear transition energy) ifthe emitting nucleus is strongly bound in a lattice or molecule. This y-ray can excitethe reverse nuclear process in an identical nucleus. A Mossbauer spectrum can thenbe observed by applying a small relative velocity between the emitting and absorbingnuclei to Doppler shift the energy of the recoil-free -rray in and off resonance. Thereare several extensive review articles which discuss the origin and interpretation ofparameters measured by Mossbauer spectroscopy (8 - 11). Since comparativelyfew Mossbauer studies of a biological nature have been published, in this sectionwe present a highly condensed formulation of these parameters which is useful indiscussing our experimental results.
Recoil-Free Fraction. The intensity of a Mossbauer absorption line isdetermined by the recoil-free fraction, f, which can be expressed in a general form as
f = exp - (x2)K2 (1)
where (x2) is the mean square displacement component of the resonating atom inthe y-ray emission direction, K is the wave number (27r/X), and X is the y-raywavelength.
If the Debye model is used to represent the vibrational frequency spectrum of thesolid, the Debye-Waller factor (which was developed in the theory of the tempera-ture dependent x-ray scattering) gives the fraction of recoil-free processes.
The appropriate form of this factor is, (see reference 12)
f = exp{-2 [I + 4(L)) ; x dxI} (2)
where Es is the free atom recoil energy, k is the Boltzmann constant, OD iS the effec-
BIOPHYSICAL JOURNAL VOLUME 5 1965824
tive Debye temperature of the Mossbauer atom in its environment, and T is theabsolute temperature of the solid. The free atom recoil energy is just
E,, = 2,,lC2 (3)
where EP is the y-ray energy, m, the mass of the recoiling nucleus, and c, the velocityof light.
In the low temperature limit equation (2) reduces to
exp{ 2kD[ 3(OD)Ii} T <<OD (4)
which is accurate to a few per cent for T ; 0.3 OD. For higher temperatures, onemust evaluate equation (2) which has been done by Muir (13).
In more complicated solids or molecules (such as the ones studied in the presentinvestigation), the simple Debye model which contains only acoustical vibrationalmodes may not be sufficient and one also must consider the effect of optical modes.An optical vibrational branch in a solid can be characterized by a single vibrationalfrequency and the relevant expression for the recoil-free fraction becomes, (seereference 11)
f = exp ER coth 2-T (5)
where the effective Einstein temperature, 0s, is related to the characteristic oscillatorfrequency, (DB, by
OE =k (6)k
and h is Planck's constant, h, divided by 21r. Thus, in general, to interpret a recoil-free fraction measured in a complicated solid, one must consider both the acousticaland optical branches of the phonon spectrum.
Hyperfine Interactions. The nominal energy and splitting of a nuclearstate can be described in terms of a spin Hamiltonian
XC = E + GI, + P[I, 33(+1)+ ( )](7)
where the first term represents an electric monopole interaction (responsible for theisomeric shift), the second term represents the magnetic dipole interaction, and thethird term represents an electric quadrupole interaction (we have assumed that themagnetic field is parallel to the z axis of the electric field gradient tensor, which hasbeen transformed to principle axes, and interactions of higher order than quadrupolehave been neglected). I,, I., and 1# are the projections of the nuclear spin, I, alongthe x, y, and z directions, andv is an asymmetry parameter which contains the com-
U. GONSER AND R. W. GRANT Mossbauer Effect in Hemoglobin 825
ponents of the electric field gradient tensor v = (V., - V,,)/V,2. The hyperfinestructure constant, G, and the quadrupole coupling constant, P, are defined as
G = -y H(8)
= 3e2qQ41(2I- 1)
where ji is the nuclear magnetic moment, H, is the effective magnetic field at thenucleus, e, is the charge of the electron, q = V./e, and Q is the nuclear quadrupolemoment. To determine the position of absorption lines, one must calculate theenergy levels of the ground state and excited state in both source and absorber usingthe appropriate terms in equation (7). The transitions between these energy levelswill then be given by the selection rules appropriate for the multipolarity of the y-ray.The isomeric shift, 8, (in the non-relativistic approximation) can be expressed
as, see reference (14)
= C R- (O)- S(°)] (9)
where C contains parameters which are constant for a given isotope, R is the nuclearradius, SR = Rexcited- Rgroud and the term in brackets represents the difference inthe total electron density evaluated at the nucleus, 02(O), between source andabsorber atoms. This term contains information that can be interpreted in terms ofchemical bonding and is the reason that 8 is also called the chemical shift.
FE57 IN PORPHYRIN RING COMPOUNDS
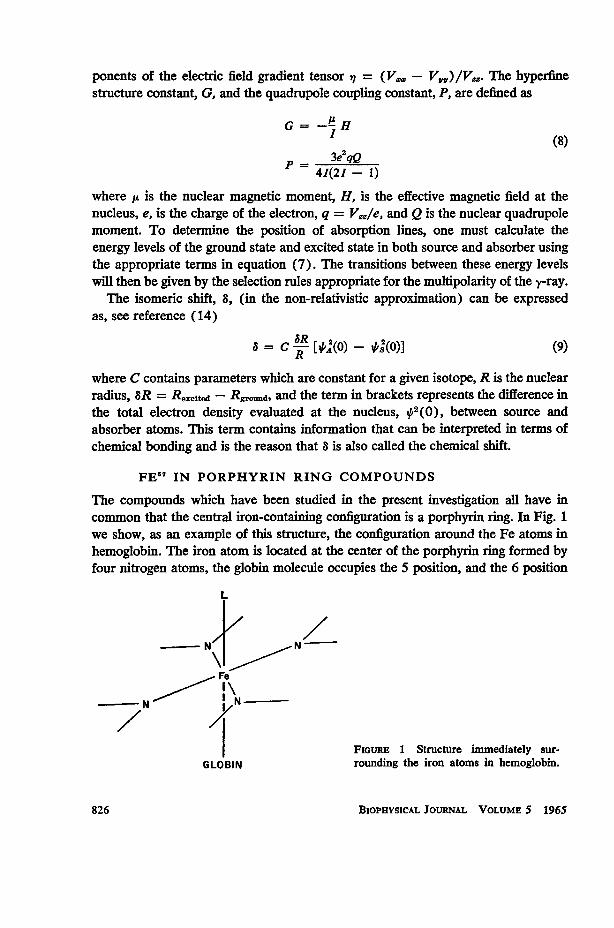
The compounds which have been studied in the present investigation all have incommon that the central iron-containing configuration is a porphyrin ring. In Fig. 1we show, as an example of this structure, the configuration around the Fe atoms inhemoglobin. The iron atom is located at the center of the porphyrin ring formed byfour nitrogen atoms, the globin molecule occupies the 5 position, and the 6 position
L
N N
Fe
N / N
/ /FIGURE 1 Structure immediately sur-
GLOBIN rounding the iron atoms in hemoglobin.
BIOPHYSICAL JOURNAL VOLUME 5 1965826
is usually occupied by a ligand, L. The ease with which the ligand can be exchangedand the electronic transitions (Fe++ < Fe+++; high spin ; low spin) are some of theinteresting functions of the porphyrin ring compounds (15) which can be investi-gated via the M6ssbauer effect.
The Mossbauer transition in Fe57 involves a 14.4 kev y-ray which converts theI = 3/2 excited state to theI = 1/2 ground state (I is the nuclear spin). Althoughthe exact details of the bonding to the globin molecule and to various ligands arestill somewhat in dispute, to a first approximation the iron atom in the porphyrin ringis located in an axially symmetric configuration (probably a fourfold rotational axis)at least with respect to its nearest neighbors. It is well established in some iron-containing porphyrin ring compounds that the iron atom is slightly displaced outof the porphyrin ring plane (16). However, as long as the bond lengths between theiron atom and the four nitrogen atoms of the ring remain equal, the iron atom willstill possess axial symmetry with respect to its nearest neighbors. The asymmetryparameter in equation (7) will, therefore, be small for Fe in porphyrin ring com-pounds, and we will assume it is zero.
In our experiments we have used biological compounds as absorbers in conjunc-tion with a single line source. All hyperfine splittings which we observe in thesecompounds can be attributed to a quadrupole interaction in the I = 3/2 excited stateof the absorber (except possibly in hemin and hematin, see Discussion section). Theground state of Fe57 has I = 1/2 which precludes a quadrupole interaction. With theabove assumption (v = 0), we can now use equation (7) to obtain the approximateexpression for the quadrupole splitting (peak separation), AEQ, of Fe57 in porphyrinring compounds
AEQ = 1/2e2qQ (10)where q can be treated as a scaler (because v = 0), and Q = +0.29 barn (17) isthe nuclear quadrupole moment of the I = 3/2 excited state in Fe57. The multi-polarity of the 14.4 kev y-ray is mainly Ml which has the selection rules Al = 0, ± 1.
EXPERIMENTAL TECHNIQUES AND RESULTS
Source. Our source consisted of approximately 10 mc of co' diffused into Pt'and kept at room temperature during the measurements. Values of the isomeric shiftare quoted with respect to this source.
Absorbers. The hemoglobin absorbers, with one exception, were prepared fromhuman blood (taken from a vein) which was washed several times with saline solution.The ligand in the hemoglobin molecule was varied by bubbling an appropriate gas (CO,02, N,, CO-) through the blood and preventing exposure to air thereafter. Before placingthe blood into the absorber holder, the red cells were concentrated by centrifuging.2 TheI This source was obtained commercially from the Nuclear Science and Engineering Corpora-tion, Pittsburgh, Pennsylvania.2In a preliminary study (18) the red cells were allowed to sediment. However, it was ex-perimentally determined that centrifuging produced no change in the Mossbauer spectra and
U. GONSER AND R. W. GRArNT Mossbauer Effect in Hemoglobin 827
absorber was then mounted in a cryostat and cooled to 800K before evacuating thecryostat and adjusting the absorber temperature to the desired value.One hemoglobin absorber was prepared from rat blood which was isotopically en-
riched with Fe'7 so that about 3.5 per cent of the Fe atoms were Fe' (natural abundanceis 2.2 atomic per cent). The enrichment was accomplished by injecting a rat with a 1 percent solution of phenylhydrazine hydrochloride to produce hemolysis. Concommitantly,the rat was injected with an Fe'7 chloride solution. The new red blood cells were ableto incorporate some of the Few and the enriched blood was drawn from the rat aboutfour weeks after the injections.8 The hemin and hematin absorbers were obtained com-mercially4 as fine powders and were studied in the crystalline state.
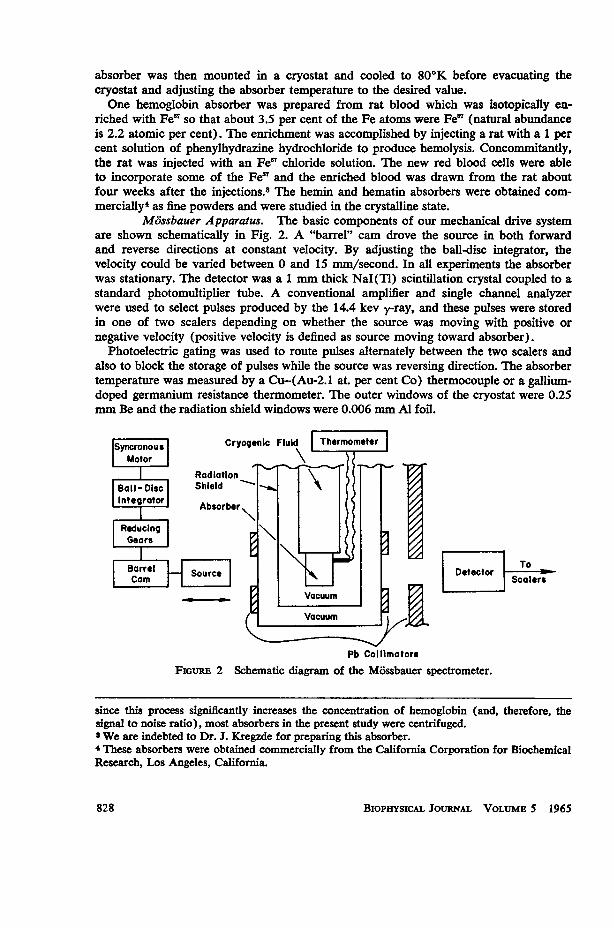
Mossbauer Apparatus. The basic components of our mechanical drive systemare shown schematically in Fig. 2. A "barrel" cam drove the source in both forwardand reverse directions at constant velocity. By adjusting the ball-disc integrator, thevelocity could be varied between 0 and 15 mm/second. In all experiments the absorberwas stationary. The detector was a 1 mm thick NaI(Tl) scintillation crystal coupled to astandard photomultiplier tube. A conventional amplifier and single channel analyzerwere used to select pulses produced by the 14.4 kev y-ray, and these pulses were storedin one of two scalers depending on whether the source was moving with positive ornegative velocity (positive velocity is defined as source moving toward absorber).
Photoelectric gating was used to route pulses alternately between the two scalers andalso to block the storage of pulses while the source was reversing direction. The absorbertemperature was measured by a Cu-(Au-2.1 at. per cent Co) thermocouple or a gallium-doped germanium resistance thermometer. The outer windows of the cryostat were 0.25mm Be and the radiation shield windows were 0.006 mm Al foil.
FiGuRE 2 Schematic diagram of the Mbssbauer spectrometer.
since this process significantly increases the concentration of hemoglobin (and, therefore, thesignal to noise ratio), most absorbers in the present study were centrifuged.8 Weare indebted to Dr. J. Kregzde for preparing this absorber.4'These absorbers were obtained commercially from the California Corporation for BiochemicalResearch, Los Angeles, California.
BIOPHYSICAL JOURNAL VOLUME 5 1965828
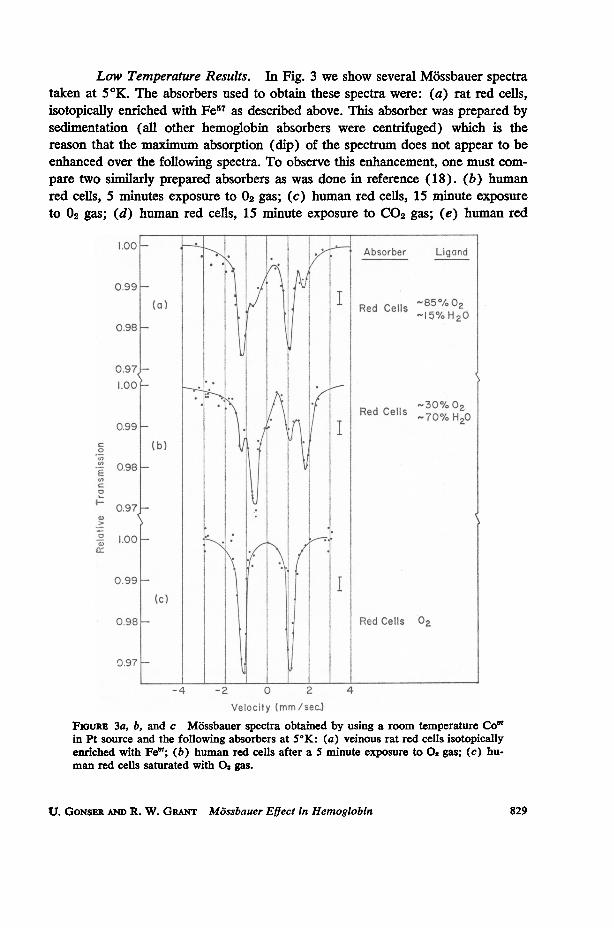
Low Temperature Results. In Fig. 3 we show several Mossbauer spectrataken at 5°K. The absorbers used to obtain these spectra were: (a) rat red cells,isotopically enriched with Fe57 as described above. This absorber was prepared bysedimentation (all other hemoglobin absorbers were centrifuged) which is thereason that the maximum absorption (dip) of the spectrum does not appear to beenhanced over the following spectra. To observe this enhancement, one must com-pare two similarly prepared absorbers as was done in reference (18). (b) humanred cells, 5 minutes exposure to 02 gas; (c) human red cells, 15 minute exposureto 02 gas; (d) human red cells, 15 minute exposure to CO2 gas; (e) human red
-Absober Uon
0.99T
(a) lRd Cells 00.96
0.97-1.00'
*099
0
0.97 Je
.100,
0.991(c)
0.98 Red Cells a~
0.97
-4 -2 0 2 4
velocity (MM/Soc.FIGuRE 3a, b, and c Mossbauer spectra obtained by using a room temperature Co'in Pt source and the following absorbers at 5°K: (a) veinous rat red cells isotopicallyenriched with Fe; (b) human red cells after a 5 minute exposure to 0,gas; (c) hu-man red cells saturated with 0 gas.
U. GONSER AND R. W. GRANT M6ssbauer Effect in Hemoglobin 829
i *1V I Red Cells Hz0
.2I--40.97 F
1.00
0.99
O.e9 Red Cells co(f)
0.97
0.96-
0.95- --4 -2: 0 2 4
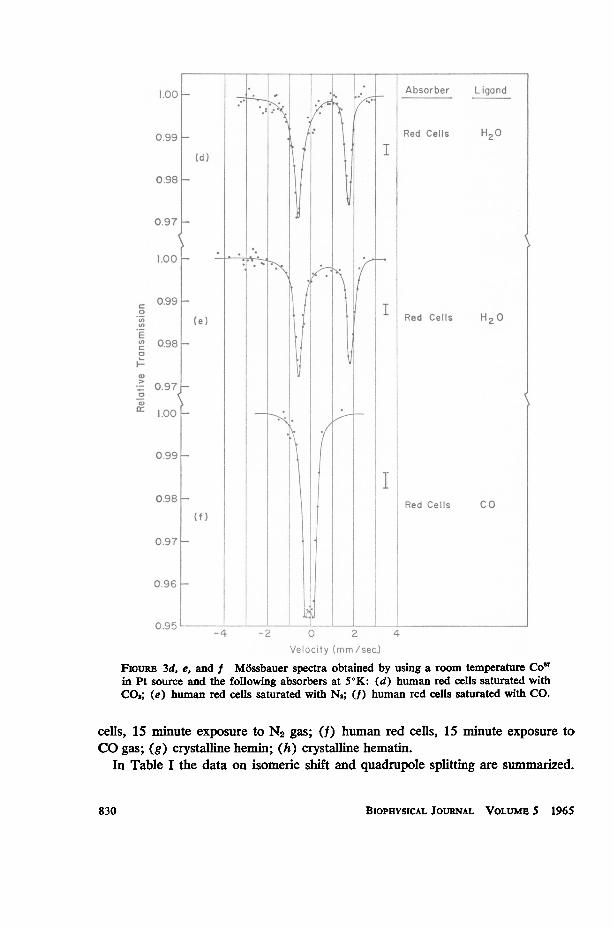
Velocity (mhm/sec.FioYuRE 3d, e, and f Md5ssbauer spectra obtained by using a room temperature Co'7in Pt source and the following absorbers at 50K: (d) human red cells saturated withC02; (e) hulman red cells saturated with N2; (f) human red cells saturated with CO.
cells, 15 minute exposure to N2 gas; (f) human red cells, 15 minute exposure toCO gas; (g) crystalline hemin; (h) crystalline hematin.
In Table I the data on isomeric shift and quadrupole splitting are summarized.
BIOPHYSICAL JOURNAL VOLUME 5 1965830
0
0.70
1.00-
0.90-
(h) . Hematin OH
0.80-
0.70--4 -2 0 2 4
Velocity (mm/sec.)
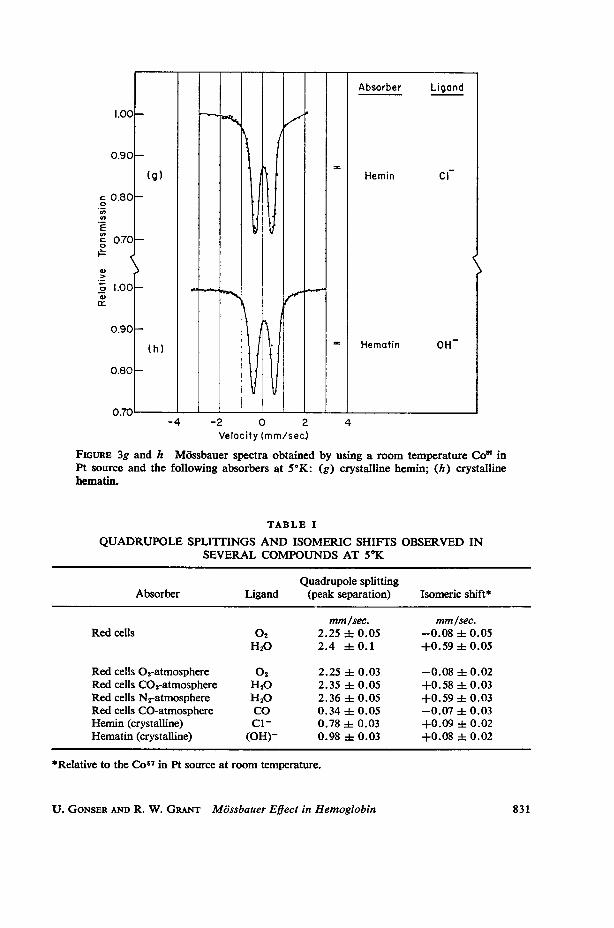
FIGURE 3g and h Mossbauer spectra obtained by using a room temperature Co" inPt source and the following absorbers at 5°K: (g) crystalline hemin; (h) crystallinehematin.
TABLE I
QUADRUPOLE SPLIITINGS AND ISOMERIC SHIFTS OBSERVED INSEVERAL COMPOUNDS AT 50K
Red cells 02-atmosphere 02 2. 25 1= O. 03 -0.08 -i 0.02Red cells C02-atmosphere H20 2.35 4 0.05 +0.58 1= 0.03Red cells N2-atmosphere H20 2.36 4= 0.05 +0.59 4 0.03Red cells CO-atmosphere CO 0. 34 i O.05 -0.07 i 0.03Hemin (crystalline) C1l 0. 78 i O0. 03 +0.09 i 0.02Hematin (crystalline) (OH)- 0. 98 h O. 03 +0. 08 1: 0. 02
*Relative to the Co567 in Pt source at room temperature.
U. GONSER AND R. W. GRANT Mossbauer Effect in Hemoglobin 831
The fact that spectra 3d and 3e are identical to within experimental error is con-firmation that the CO2 molecule in C02-Hb is not bound as a ligand in the 6 positionbut is attached to some other part of the molecule.
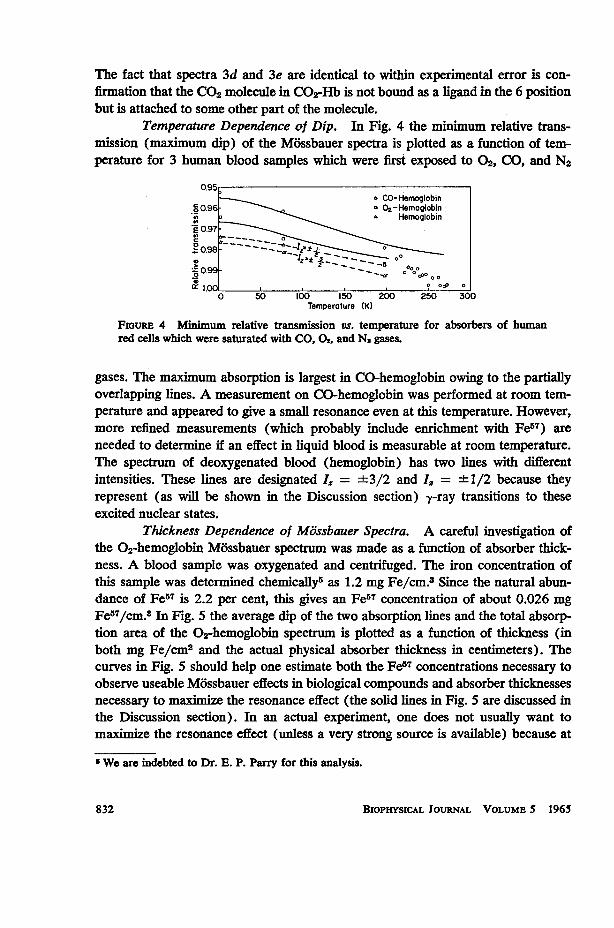
Temperature Dependence of Dip. In Fig. 4 the minimum relative trans-mission (maximum dip) of the Mossbauer spectra is plotted as a function of tem-perature for 3 human blood samples which were first exposed to 02, CO, and N2
0.9 b~~~~~~~~~o CO-Hemoglobin
o0.96 o°02-Hm90igas i is l Hemoglobin
e0998 '- 0--CP-0 50 100 150 200 250 300
Temperature (K)
FIGURE 4 Minimuim relative transmission vs. temperature for absorbers of humanred cells which were saturated with CO, 02, and N. gases.
gases. The maximium absorption is largest in CO-hemoglobin owing to the partiallyoverlapping lines. A measurement on CO-hemoglobin was performed at room tem-perature and appeared to give a small resonance even at this temperature. However,more refined measurements (which probably include enrichment with Fe57) areneeded to determine if an effect in liquid blood is measurable at room temperature.The spectrum of deoxygenated blood (hemoglobin) has two lines with differentintensities. These lines are designated I. = ±3/2 and I, = ±+1/2 because theyrepresent (as will be shown in the Discussion section) y-ray transitions to theseexcited nuclear states.
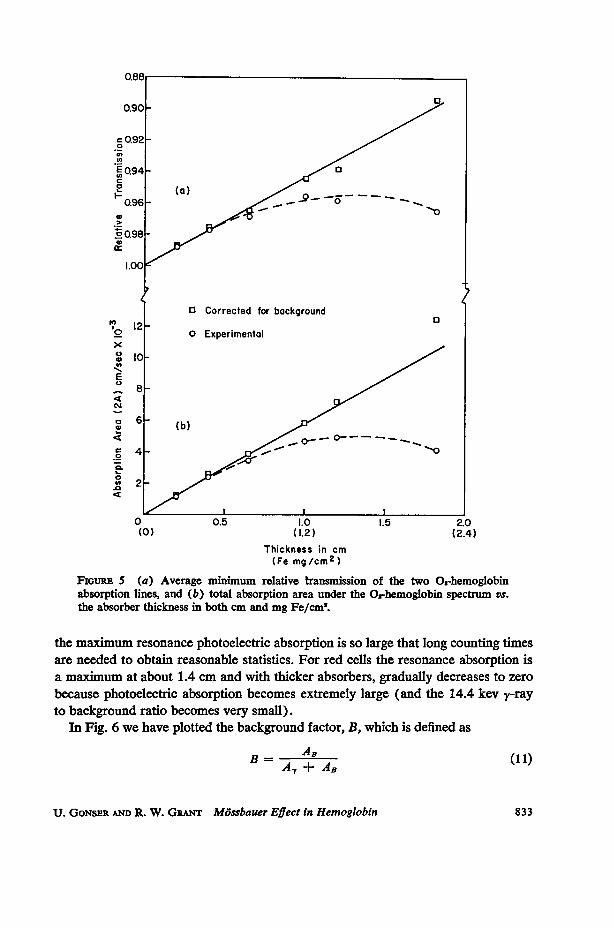
Thickness Dependence of Mossbauer Spectra. A careful investigation ofthe 02-hemoglobin M6ssbauer spectrum was made as a function of absorber thick-ness. A blood sample was oxygenated and centrifuged. The iron concentration ofthis sample was determined chemically5 as 1.2 mg Fe/cm.8 Since the natural abun-dance of Fe57 is 2.2 per cent, this gives an Fe57 concentration of about 0.026 mgFe57/cm.8 In Fig. 5 the average dip of the two absorption lines and the total absorp-tion area of the 02-hemoglobin spectrum is plotted as a function of thickness (inboth mg Fe/cm2 and the actual physical absorber thickness in centimeters). Thecurves in Fig. 5 should help one estimate both the Fe57 concentrations necessary toobserve useable M6ssbauer effects in biological compounds and absorber thicknessesnecessary to maximize the resonance effect (the solid lines in Fig. 5 are discussed inthe Discussion section). In an actual experiment, one does not usually want tomaximize the resonance effect (unless a very strong source is available) because at
5 We are indebted to Dr. E. P. Parry for this analysis.
BIOPHYSICAL JOURNAL VOLUME 5 1965832
EQ94S- 0
QO98 z
1.00
3 Corrected for background
o 0 Experimentalx%> lo-/E
8-
c6- (b)
e 4 -
0.
.0 °> 2 -
° 0.5 1.0 1.5 2.0(0) (1.2) (2.4)
Thickness in cm(Fe mg /cm2)
FiouRE S (a) Average minimum relative transmission of the two 02-hemoglobinabsorption lines, and (b) total absorption area under the 02-hemoglobin spectrum vs.the absorber thickness in both cm and mg Fe/cm'.
the maximum resonance photoelectric absorption is so large that long counting timesare needed to obtain reasonable statistics. For red cells the resonance absorption isa maximum at about 1.4 cm and with thicker absorbers, gradually decreases to zero
because photoelectric absorption becomes extremely large (and the 14.4 kev y-rayto background ratio becomes very small).
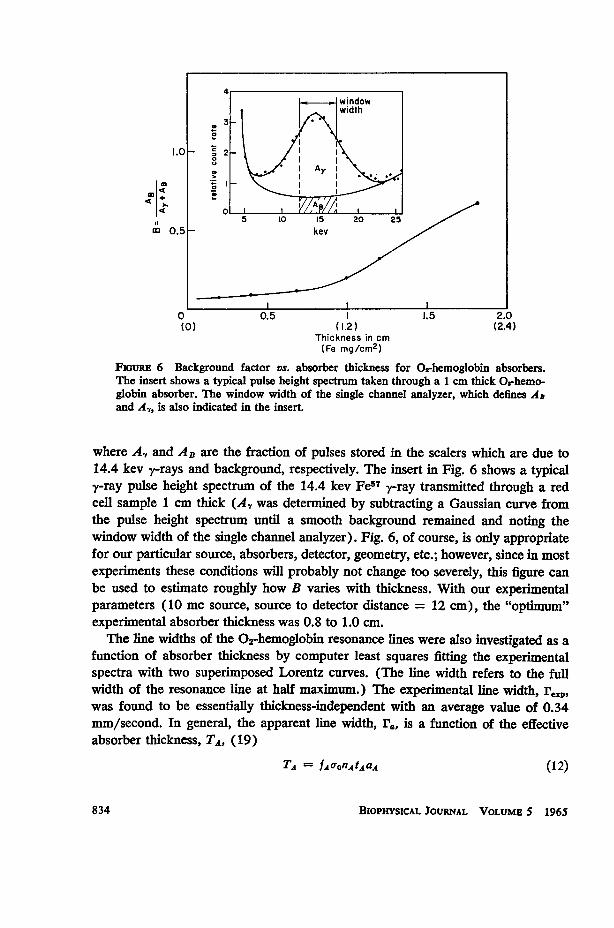
In Fig. 6 we have plotted the background factor, B, which is defined as
B AB
A7r + A (11
U. GONSER AND R. W. GRANT M5ssbauer Effect in Hemoglobin 833
. 31-
1.0 5 0 1 0 2
~~0.5~ OCO0.5 - kev
0 0.5 1 1.5 2.0(0) (1.2) (2.4)
Thickness in cm(Fe mg/cm2)
FiGuRE 6 Background factor vs. absorber thickness for O-hemoglobin absorbers.The insert shows a typical pulse height spectrum taken through a 1 cm thick Orhemo-globin absorber. The window width of the single channel analyzer, which defines ADand A,, is also indicated in the insert.
where A, and AB are the fraction of pulses stored in the scalers which are due to14.4 kev y-rays and background, respectively. The insert in Fig. 6 shows a typicaly-ray pulse height spectrum of the 14.4 kev Fe57 y-ray transmitted through a redcell sample 1 cm thick (A, was determined by subtracting a Gaussian curve fromthe pulse height spectrum until a smooth background remained and noting thewindow width of the single channel analyzer). Fig. 6, of course, is only appropriatefor our particular source, absorbers, detector, geometry, etc.; however, since in mostexperiments these conditions will probably not change too severely, this figure canbe used to estimate roughly how B varies with thickness. With our experimentalparameters (10 mc source, source to detector distance = 12 cm), the "optimum"experimental absorber thickness was 0.8 to 1.0 cm.The line widths of the 02-hemoglobin resonance lines were also investigated as a
function of absorber thickness by computer least squares fitting the experimentalspectra with two superimposed Lorentz curves. (The line width refers to the fullwidth of the resonance line at half maimum.) The experimental line width, reip,was found to be essentially thickness-independent with an average value of 0.34mm/second. In general, the apparent line width, r1, is a function of the effectiveabsorber thickness, TA,, (19)
TA = fAonAtAaA (12)
BIOPHYSICAL JOURNAL VOLUME 5 1965
4r
834
--.- windowwidth
k
where fA is the recoil-free fraction in the absorber, nA, the number of Fe atoms percm3 in the absorber, tA, the physical thickness of the absorber in centimeters and aAis the isotopic abundance of Fe57. ao is the Mossbauer absorption cross-section whichis given by, (see reference 9)
0,r = x2( I + 2 (13)=2wr(1 + 2Ig)(1 + a) (3
where Ie. and 1, are the nuclear spins of the excited and ground states, respectively,and a is the internal conversion coefficient.' Assuming the natural line width,r, (r = h/r where r is the mean lifetime of the excited nuclear state) in both theemission and absorption lines and for values of TA < 5, (see reference 9)
ra = 2 + 0.27TA. (14)
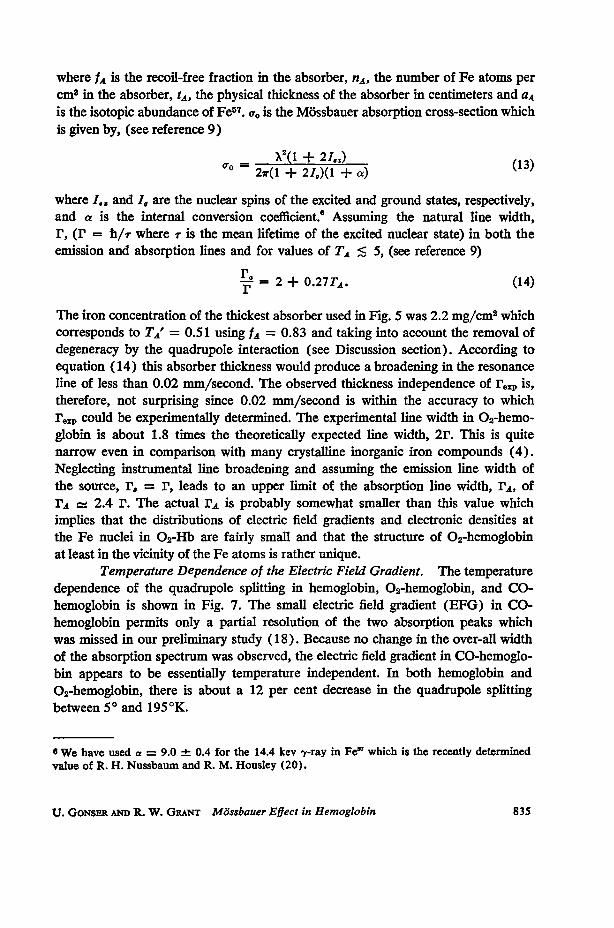
The iron concentration of the thickest absorber used in Fig. 5 was 2.2 mg/cm2 whichcorresponds to TA' = 0.51 using fA = 0.83 and taking into account the removal ofdegeneracy by the quadrupole interaction (see Discussion section). According toequation (14) this absorber thickness would produce a broadening in the resonanceline of less than 0.02 mm/second. The observed thickness independence of r,,p is,therefore, not surprising since 0.02 mm/second is within the accuracy to whichr9,, could be experimentally determined. The experimental line width in 02-hemo-globin is about 1.8 times the theoretically expected line width, 2r. This is quitenarrow even in comparison with many crystalline inorganic iron compounds (4).Neglecting instrumental line broadening and assuming the emission line width ofthe source, r8 = r, leads to an upper limit of the absorption line width, rA, ofrA , 2.4 r. The actual rA is probably somewhat smaller than this value whichimplies that the distributions of electric field gradients and electronic densities atthe Fe nuclei in 02-Hb are fairly small and that the structure of 02-hemoglobinat least in the vicinity of the Fe atoms is rather unique.
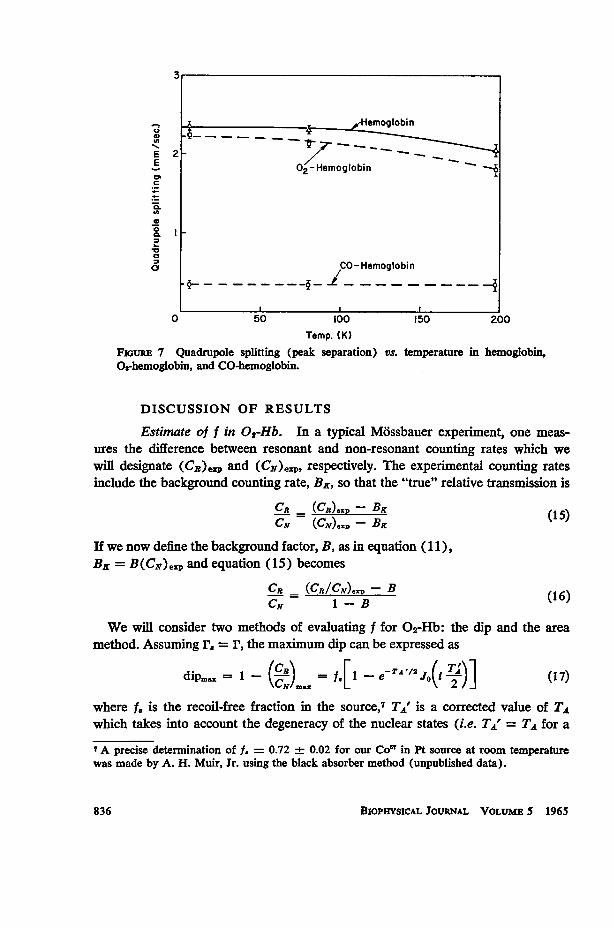
Temperature Dependence of the Electric Field Gradient. The temperaturedependence of the quadrupole splitting in hemoglobin, 02-hemoglobin, and CO-hemoglobin is shown in Fig. 7. The small electric field gradient (EFG) in CO-hemoglobin permits only a partial resolution of the two absorption peaks whichwas missed in our preliminary study (18). Because no change in the over-all widthof the absorption spectrum was observed, the electric field gradient in CO-hemoglo-bin appears to be essentially temperature independent. In both hemoglobin and02-hemoglobin, there is about a 12 per cent decrease in the quadrupole splittingbetween 50 and 195°K.
S We have used a = 9.0 ± 0.4 for the 14.4 kev yi-ray in Fe' which is the recently determinedvalue of R. H. Nussbaum and R. M. Housley (20).
U. GONSER AND R. W. GRANT Mossbauer Effect in Hemoglobin 835
E 2E2E 1 02-Hemoglobin
0
CO-Hemoglobin
0 50 100 150 200Temp. (K)
FIGURE 7 Quadrupole splitting (peak separation) vs. temperature in hemoglobin,O=hemoglobin, and CO-hemoglobin.
DISCUSSION OF RESULTS
Estimate of f in 0-Hb. In a typical Mossbauer experiment, one meas-ures the difference between resonant and non-resonant counting rates which wewill designate (Cv).sp and (CN)exp, respectively. The experimental counting ratesinclude the background counting rate, BK, so that the "true" relative transmission is
CR = (CR),xD - BK (15)CN (CN),1V - BK (5
If we now define the background factor, B, as in equation (11),BK = B(CN)exp and equation (15) becomes
CR = (CR/CN)eXP - B (16)CN 1 -B
We will consider two methods of evaluating f for 02-Hb: the dip and the areamethod. Assuming r8 = r, the maximum dip can be expressed as
dipma = 1 (C) = f.[l - eTA 2 J )] (17)where f8 is the recoil-free fraction in the source,7 TA' is a corrected value of TAwhich takes into account the degeneracy of the nuclear states (i.e. TA' = TA for a
7A precise determination of f. = 0.72 ± 0.02 for our Co" in Pt source at room temperaturewas made by A. H. Muir, Jr. using the black absorber method (unpublished data).
BIoPHysIcAL JouRNAL VOLUME 5 1965
31
-Uftrnt%^lt%k;f%
836
single line absorption spectrum, but for 02-Hb where a well resolved quadrupolesplitting is present, TA' = 0.5 TA), and JO is the Bessel function of zero order. Onecan then determine fA for 02-Hb by correcting the data of Fig. 5a with equation(16) and solving equation (17) for fA. The value of fI determined in this way is0.49. This value should be considered only as a lower limit since one makes theimplicit assumption in equation (17) that the absorption line width is 2r whichis not experimentally justified as pointed out in Experimental Techniques and Re-sults section. Perhaps a better estimate for fA could be obtained in this case bymultiplying the value of fIA, as determined from equation (17), by rp/2r to cor-rect roughly for the observed line broadening. This correction leads to a value fA =0.88 in good agreement with the value determined below.The area analysis method is discussed in detail by Shirley, Kaplan, and Axel
(21). For t - 2 the absorption area (in cm/second), A, of a single line spectrumcan be approximately expressed as
A = 2 E TAIr1(i - 0.24t + 0.04t2) = 2-r - (18)27l 2 E7 LXI \CNIZMJwhere E7, r and rexF are measured in the same units and t = TAr/rA. As in equation(17), TA in equation (18) must be replaced by TA'(= 0.5 TA) to analyze thequadrupole split absorption spectrum of 02-H1b. In this case A represents the ab-sorption area under each line and the total absorption area is 2A. The experimentalabsorption area, 2Aexp, shown in Fig. 5b must be corrected for background in thesame manner as the dip is corrected and in this case the appropriate correctionbecomes
2 A =(2A)e.K (19)
The corrected data are shown as squares in this figure and the solid line throughthe corrected data is calculated from equation (18) for
I.-Hb = 0.83 (20)
and represents the best fit of this data. In this calculation we have somewhatarbitrarily used rA = 0.24 mm/second which assumes rg = r and no instrumentalbroadening. These assumptions are reasonable since experimental line widthsapproaching 2r have been obtained by using the same source and other absorbers;also, it is fortunate that fIA, as determined by the area method analysis, is notstrongly dependent on the choice of rA. One can calculate the dip [1 - (CR/CN)m.]from equation (18)
dip = TArf.(l - 0.24t + 0.04t) (21)rOlD
and this curve is shown as the solid line in Fig. Sa (again, TA in equation (21) must bereplaced by TA'). The area method, which is relatively insensitive to the absorption
U. GONSER AND R. W. GRANT Mossbauer Effect in Hemoglobin 837
line width, should give a considerably better estimate of fo-.Hb than the dip method.Experimental errors and uncertainties in a, n,A, tA, and f. make it difficult to estimatemeaningful error limits for fO..,Hb; however, we feel the error in equation (20) is onthe order of 1 10 per cent. The accuracy of the data in Fig. 5 for the 1.8 cm thicksample is very poor due to the large background, and therefore, this point has beenignored in the above f analysis.
Recoil-Free Fraction and Mean Square Displacement. For samples withsmall TA, such as those in the present study, the relative absorption (corrected forbackground) is nearly proportional to the recoil-free fraction, fA. Therefore, the tem-perature dependence of the relative absorption as shown in Fig. 4 is essentially thetemperature dependence of fA. As calculated above, the recoil-free fraction in O2-Hbat 5°K is fA t 0.83. The proportionality of relative absorption and f applies toeach absorber individually; however, Fig. 4 also reflects, to a first approximation,the relative fA of the three absorbers because the thickness and iron concentra-tion of the absorbers in all cases were similar. Of course, in such a comparisononly one component of the unresolved CO-hemoglobin spectrum should be con-sidered; whereas, in Fig. 4, the maximum dip of the partially overlapping lines isplotted. The recoil-free fraction for 02-hemoglobin and CO-hemoglobin is the sameto within our experimental accuracy. A thickness study similar to that in 02-Hb wasnot performed for CO-Hb and Hb. The experimental points for 02-Hb and CO-Hbin Fig. 4 can be fitted with an fA derived from a Debye frequency spectrum (equation2) with OD ; 180°K and these theoretical curves are shown as solid lines. If the vibra-tional spectrum were characterized by the Einstein model, fO.-Hb = 0.83 would corre-spond to a 0E - 120°K. With the aid of equation (5), it can be shown that the Einsteinmodel does not fit the data as well as the Debye model. The determination of foI0bmay be used to evaluate the mean square displacement of the Fe atoms in 02-Hband CO-Hb from equation (1) as (x2)5*K, 0.35 X 10⁻¹⁸ cm2.
In the O2-Hb spectrum the quadrupole split lines are observed to have the sameintensity, and therefore, f should be isotropic, while the quadrupole split lines of theHb spectrum are considerably asymmetric (Fig. 3d and e). An asymmetry in quad-rupole split lines can be observed when f is isotropic if there is a preferential orienta-tion of molecules in the absorber (8). However, in our case where the Hb is still mainlywithin the red cells, this possibility seems extremely unlikely. Since we have observedno asymmetry with either CO-Hb or 0a-Hb samples prepared in the same manner andhave observed the same asymmetry in different Hb samples, the obvious conclusionis that f is a function of direction in Hb, and therefore, the Debye model (which isisotropic in nature) cannot be a good representation of the vibrational spectrum ofthis molecule. The Hb molecule has essentially the same central structure around theFe atoms as in 02-Hb with the exception that the strongly bound 02 molecule hasbeen removed. One can assume that the elimination of this bond allows the Fe atomsto vibrate farther out of plane than in plane which makes f smaller perpendicular tothe heme plane.
BIoPHYsIcAL JOURNAL VOLUME 5 1965838
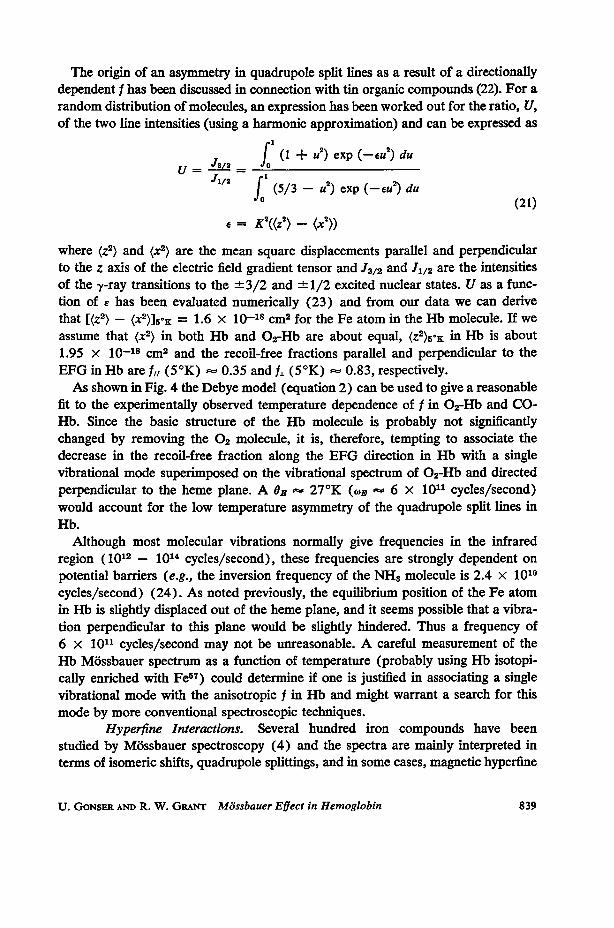
The origin of an asymmetry in quadrupole split lines as a result of a directionallydependent f has been discussed in connection with tin organic compounds (22). For arandom distribution of molecules, an expression has been worked out for the ratio, U,of the two line intensities (using a harmonic approximation) and can be expressed as
- f (1 + u2) exp (- eu2) duu =J-1/2 2
(5/3 _ u2) exp (-eu2) du(21)
e = K2((z2) _ (x2))
where (z2) and (x2) are the mean square displacements parallel and perpendicularto the z axis of the electric field gradient tensor and J3/2 and J1/2 are the intensitiesof the y-ray transitions to the ±3/2 and ± 1/2 excited nuclear states. U as a func-tion of e has been evaluated numerically (23) and from our data we can derivethat [(Z2) -(X2)]5 = 1.6 x 10⁻¹⁸ cm2 for the Fe atom in the Hb molecule. If weassume that (x2) in both Hb and 02-Hb are about equal, (Z2)5°E in Hb is about1.95 x 10-18 cm2 and the recoil-free fractions parallel and perpendicular to theEFG in Hb are f,, (5°K) 0.35 and fi (5°K) 0.83, respectively.As shown in Fig. 4 the Debye model (equation 2) can be used to give a reasonable
fit to the experimentally observed temperature dependence of f in 02-Hb and CO-Hb. Since the basic structure of the Hb molecule is probably not significantlychanged by removing the 02 molecule, it is, therefore, tempting to associate thedecrease in the recoil-free fraction along the EFG direction in Hb with a singlevibrational mode superimposed on the vibrational spectrum of 02-Hb and directedperpendicular to the heme plane. A Om 27°K (,,, 6 x 10¹¹ cycles/second)would account for the low temperature asymmetry of the quadrupole split lines inHb.
Although most molecular vibrations normally give frequencies in the infraredregion (1012 - 1014 cycles/second), these frequencies are strongly dependent onpotential barffers (e.g., the inversion frequency of the NH3 molecule is 2.4 x 10¹⁰cycles/second) (24). As noted previously, the equilibrium position of the Fe atomin Hb is slightly displaced out of the heme plane, and it seems possible that a vibra-tion perpendicular to this plane would be slightly hindered. Thus a frequency of6 x 1011 cycles/second may not be unreasonable. A careful measurement of theHb Mossbauer spectrum as a function of temperature (probably using Hb isotopi-cally enriched with Fe57) could determine if one is justified in associating a singlevibrational mode with the anisotropic f in Hb and might warrant a search for thismode by more conventional spectroscopic techniques.
Hyperfine Interactions. Several hundred iron compounds have beenstudied by Mossbauer spectroscopy (4) and the spectra are mainly interpreted interms of isomeric shifts, quadrupole splittings, and in some cases, magnetic hyperfine
U. GONSER AND R. W. GRANT Mossbauer Egect in Hemoglobin 839
interactions. Attempts to evaluate these data in terms of chemical bonding, crystalfield theory, or ligand field theory are still rather primitive, probably owing to therather complicated electronic configuration of iron (8 in iron compounds will cer-tainly depend on the ionic state, hybridization, polarization, etc.).
Attempts have been made by various investigators to interpret the isomericshifts of iron compounds qualitatively considering the shielding of I2(0) by p andd electrons (25) and in terms of partial isomeric shifts due to various ligands (26);however, at present no theory is available which allows a completely satisfactoryderivation of chemical parameters. This situation may be somewhat simpler inother Mossbauer isotopes where, for example, in Au'97 a correlation of the isomericshift and electronegativity has been established (27).A few very useful qualitative observations regarding the isomeric shifts in iron
compounds have been made, namely, that 8 for iron in different ionic (Fe2+ andFe8+) and covalent (FeII, Fe"', and Fevl) states fall within certain ranges (28).Another interesting empirical correlation between the isomeric shift and thequadrupole splitting has been reported for a series of covalent compounds byCollins and Pettit (29), and for both high and low spin iron compounds by Remyand Pollak (30). Since Hb (Fe2+), hemin (Fe3+), and hematin (Fe3+) are all highspin compounds, the empirical correlation of reference 30 can be used to predictthat the sign of q in all three cases is positive. This result can be independentlyconfirmed as discussed below.
The isomeric shift of Hb falls close to the normally observed range for high spinferrous compounds. As discussed in the Fe5 in Porphyrin Ring Compounds Section,the local symmetry immediately surrounding the Fe atoms in hemoglobin indicatesthat the EFG must be axially symmetric and directed perpendicular to the hemeplane. Therefore, since the Zeeman selection rules indicate that transitions betweenthe nuclear substates + 1/2 - +3/2 and - 1/2 -> -3/2 will occur mainly alongthe EFG direction and the transitions + 1/2 -+ 1/2 mainly perpendicular to theEFG, the weaker intensity line in Fig. 3d and e is associated with transitions to theI# = +3/2 excited nuclear state in the Hb molecule. Using the known positive signof the Fe57 14.4 kev excited state quadrupole moment, equation (7) indicates thatq in Hb must be positive (V^, is negative).The iron atoms in hemin and hematin are in the Fe3+ high spin state. The d
electrons in these atoms have parallel spins with a spin quantum number S = 5/2.Mossbauer spectra of hemin at various temperatures have been obtained by severalgroups (7, 31-38), but the data are in poor agreement and the interpretation ofthese spectra seems not well understood. At 5°K a quadrupole split spectrum (peakseparation 0.78 mm/second) with lines of equal intensity was found (Fig. 3g).Similar spectra have been reported by Shulman and Wertheim (36) and recently byBearden et al. (38). The low temperature spectrum of hematin (Fig. 3h) is similarwith a somewhat larger quadrupole splitting (peak separation 0.98 mm/second).
BIoPHYSIcAL JouRNAL VOLUME 5 1965840
The isomeric shift of hemin and hematin falls within the region of other high spinFe3+ compounds. Between liquid helium and liquid nitrogen temperature, thespectra of hemin and hematin change considerably. The high velocity line is dras-tically broadened, although the absorption area under the two lines remainsroughly equal to within experimental error. The effect, therefore, cannot be at-tributed to a directional dependence of f as is observed in Hb. We feel that thiseffect is probably caused by a long spin lattice relaxation time (on the order of thenuclear Larmor precessional frequency) of atoms in the S. = ±3/2 and ±5/2states which become populated at higher temperatures. The line broadening isthen due to a magnetic hyperfine interaction (since the time average of the internalmagnetic field is no longer zero) which initially splits the 1 = 4-3/2 excited nuclearstate three times faster than the I. = ± 1/2 excited state. A similar effect has beenobserved in corundum (39) and has been theoretically postulated by Blume (40).If this interpretation is correct, equation (7) again indicates that q is positive inagreement with our above conclusion.The sign of the EFG cannot be determined from the spectra of 02-Hb and CO-
Hb, and the quadrupole split lines appear to have the same intensity at all tem-peratures to within experimental error. The isomeric shifts of these spectra fallabout 0.1 mm/second higher in velocity than the range [-0.5 -* -0.2 mm/second]normally observed in both low spin Fe" and Fe"' compounds. A general correla-tion between 8 and AEQ is not well established in low spin ferrous and ferriccompounds (possibly because a large abundance of data is not as yet available).Within our experimental accuracy 8 for both 02-Hb and CO-Hb is the same, al-though there is a large difference in AEQ. The sign of the EFG at the Fe nucleiin these molecules could be determined with the use of a large external magneticfield to observe a magnetic hyperfine splitting in these molecules. The possibilitythat Fe in 02-Hb could be in the Fe"' state (rather than the normally acceptedFe"' state) has been proposed recently (41). It is unfortunate that the isomericshift of the Mossbauer spectrum does not allow one to make a clear cut distinctionin this case; however, because the quadrupole splitting observed in 02-Hb is con-siderably larger than is normally observed in Fe"' compounds, we feel it is some-what more likely that the iron in 02-Hb is in the ferrous state. In ionic compoundsthe difference between Fe2+ and Fe3+ is obvious; however, in low spin iron com-pounds the distinction depends on assigning covalently bonded electrons to specificatoms and in this case the difference between Fe"l and Fe"I may not be particularlymeaningful.
The EFG in Hemoglobin. The bonding to the Fe atoms in hemoglobinmust be essentially ionic since this is a "high spin" compound with a measuredeffective magnetic moment of 5.46 Bohr magnetons per heme (42). Hund's rulefor the Fe2+ ion predicts a 5D, 3dM ground state for this ion (a half-filled d shellwith parallel spins plus one d electron of opposite spin) and assuming the orbital
U. GONSER AND R. W. GRANT Mossbauer Effect in Hemoglobin 841
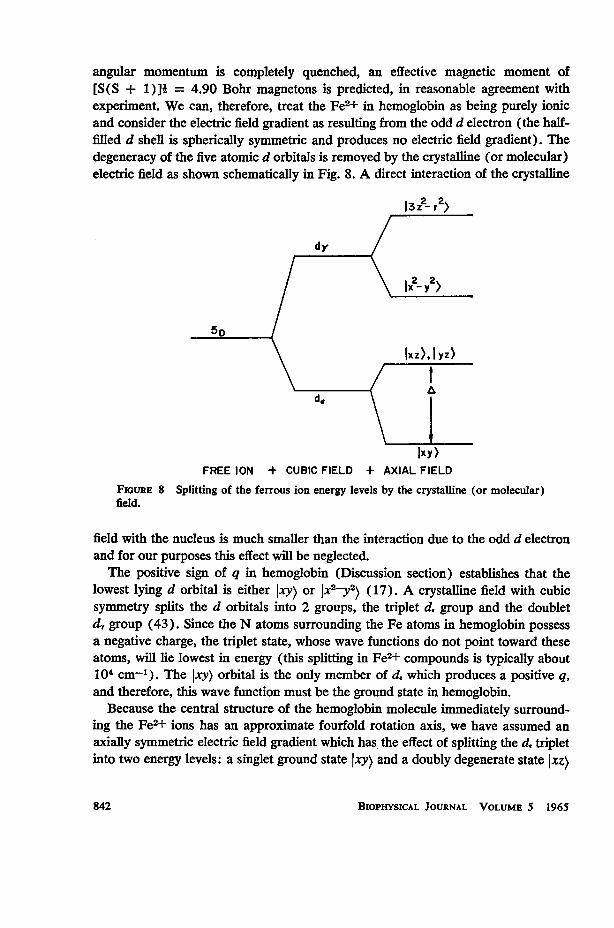
angular momentum is completely quenched, an effective magnetic moment of[S(S + 1)]i = 4.90 Bohr magnetons is predicted, in reasonable agreement withexperiment. We can, therefore, treat the Fe2+ in hemoglobin as being purely ionicand consider the electric field gradient as resulting from the odd d electron (the half-filled d shell is spherically symmetric and produces no electric field gradient). Thedegeneracy of the five atomic d orbitals is removed by the crystalline (or molecular)electric field as shown schematically in Fig. 8. A direct interaction of the crystalline
13z2 r2>
dy
5D
\ I~~~~~~xz).I YZ)
Ixy)FREE ION + CUBIC FIELD + AXIAL FIELD
FIGURE 8 Splitting of the ferrous ion energy levels by the crystalline (or molecular)field.
field with the nucleus is much smaller than the interaction due to the odd d electronand for our purposes this effect will be neglected.The positive sign of q in hemoglobin (Discussion section) establishes that the
lowest lying d orbital is either Jxy) or Ix2-y2) (17). A crystalline field with cubicsymmetry splits the d orbitals into 2 groups, the triplet d. group and the doubletd, group (43). Since the N atoms surrounding the Fe atoms in hemoglobin possessa negative charge, the triplet state, whose wave functions do not point toward theseatoms, will lie lowest in energy (this splitting in Fe2+ compounds is typically about104 cm-'). The Ixy) orbital is the only member of dc which produces a positive q,and therefore, this wave function must be the ground state in hemoglobin.
Because the central structure of the hemoglobin molecule immediately surround-ing the Fe2+ ions has an approximate fourfold rotation axis, we have assumed anaxially symmetric electric field gradient which has the effect of splitting the d. tripletinto two energy levels: a singlet ground state ixy) and a doubly degenerate state jxz)
BIOPHYSICAL JOURNAL VOLUME 5 1965842
and Iyz) at an energy A above the ground state. If the nuclear relaxation time is longcompared with the transition times between the d orbitals (44) and we ignore theeffects of spin-orbit coupling, we can then estimate A from the temperature depend-ence of AEQ by averaging the contributions to the electric field gradient from the d.levels weighted by an appropriate Boltzmann factor
E qnAnlkT
q n , (23)n
and noting that the electric field gradient produced by an electron in the Ixz) andIyz) orbitals is i that produced by an electron in the Ixy) orbital and of the oppositesign. We have assumed that the d, orbitals lie high enough in energy so that theircontribution to the electric field gradient is negligible, but low enough in energy sothat the d shell remains half filled. The symbol q,, in equation (23) represents thevalue of q produced by an electron in the nth orbital and A. is the energy separationof the nth orbital from the ground state. The low temperature quadrupole splitting(peak separation = 2.36 mm/second at 5°K) is then proportional to the shieldedelectric field gradient produced by an electron in the Ixy) orbital and A = 420 cm-1(A/k = 600°K). The theoretical curve based on this value A is shown as a solidline in Fig. 7. The values of A observed in various Fe2+ compounds are typically onthe order of 102 to 103 cm-' (17) which makes the value observed in hemoglobinseem reasonable; however, in vew of the assumptions made, this number shouldbe regarded as a rough estimate.
The authors gratefully acknowledge many helpful discussions with Dr. A. H. Muir, Jr., Dr. H.Wiedersich, Dr. L. E. Topol, and Dr. W. J. Frajola, and the technical assistance of M. R.Bloombaum, A. C. Micheletti, and K. G. Rasmussen.Received for publication, May 24, 1965.
REFERENCES
1. Proceedings of the First Conference of the Mossbauer Effect, Urbana, University of Illinois,(H. Frauenfelder and H. Lustig, editors), 1960.
2. Proceedings of the Second International Conference of the Mossbauer Effect, 1961, Saclay,France, (D. M. J. Compton and A. H. Schoen, editors), New York, John Wiley & Sons,Inc., 1962.
3. Proceedings of the Third International Conference of the Mossbauer Effect, 1963, Ithaca,New York, Cornell University, (A. J. Bearden, editor), Rev. Mod. Phys., 1964, 36,333.
4. Mum, A. H., and ANDo, K. J., The Mossbauer Effect Data Index, Thousand Oaks, Cali-fornia, North American Aviation Science Center, 1964.
5. MOSSBAUER, R. L., Z. Physik., 1958, 151, 124.6. MOSSBAUER, R. L., Naturwissenschaften, 1958, 45, 538.7. GONSER, U., and GRANT, R. W., Symp. Mossbauer Effect Methodology, New York, Plenum
Press, 1965.8. BOYLE, A. J. F., and HALL, H. E., Rep. Progr. Phys., 1962, 25, 441.9. FRAUENFELDER, H., The Mossbauer Effect, New York, W. A. Benjamin, Inc., 1962.
U. GONSER AND R. W. GRANT Mossbauer Effect in Hemoglobin 843
10. GOL'DANSKI, V. I., The Mossbauer Effect and Its Applications in Chemistry, Moscow,Academy of Sciences Press, 1963.
11. WERTHEIM, G. K., Mossbauer Effect. Principles and Applications, New York, AcademicPress, Inc., 1964.
12. M6SSBAUER, R. L., and WIEDEMANN, W. H., Z. Physik. 1960, 159, 33.13. Munt, A. H., Atomics International Report #6699, 1962.14. SHRLEY, D. A., Rev. Mod. Phys., 1964, 36, 339.15. GEORGE, P., BEETLESTONE, J., and GRIFrrH, J. S., Rev. Mod. Phys., 1964, 36, 441.16. KENDREW, J. C., Science, 1963, 139, 1259.17. INGALLS, R., Physic. Rev., 1964, 133, 787.18. GONSER, U., GRANT, R. W., and KREGzDE, J., Science, 1964, 143, 680.19. MARGuLIs, S., and EEWMAN, J. R., Nuclear Instr. and Methods, 1961, 12, 131.20. NUSSBAUM, R. H., and HOUSLEY, R. M., to be published.21. SHIRLEY, D. A., KAPLAN, M., and AXEL, P., Physic. Rev., 1961, 123, 816.22. GOL'DANSKU, V. I., MuARov, E. F., and KmLRpov, V. V., Physical Rev. Letters, 1963, 3,
344.23. FLINN, P. A., RUBY, S. L., and KEHL, W. L., Science, 1964, 143, 1434.24. TowNEs, C. H., and ScHAwLow, A. L., Microwave Spectroscopy, New York, McGraw-Hill
Book Company, 1955.25. WALKER, L. R., WERTHEIM, G. K., and JACCARINO, V., Physic. Rev., Letters, 1961, 6, 98.26. HEmmE., R. H., KINO, R. B., and WERrnuIM, G. K., Inorg. Chem. 1964, 3, 101.27. BARRETr, P. H., GRANT, R. W., KAPLAN, M., KELLER, D. A., and SIRLEY, D. A., J. Chem.
Phys., 1963, 39, 1035.28. KERLER, W., NEuWRTH, W., and FLUCK, E., Z. Physik., 1963, 175, 200.29. COLLINS, R. L., and PErrrr, R., J. Chem. Physics, 1963, 39, 3433.30. REMy, P. H., and POLLAK, H., J.. Appl. Physics, 1965, 36, 860.31. RENSTEIN, P. G., and SwAN, J. B., International Biophysics Congress, 1961, 147.32. GONSER, U., Physic. Chem., 1962, 66, 564.33. EPSTEIN, L. M., 1. Chem. Physics, 1962, 36, 2731.34. CRAIG, P. P., and SUTIN, N., Phys. Rev. Letters, 1963, 11, 460.35. MALUNG, J. E., and WEISSBLUTH, M., in Electronic Aspects of Biochemistry, (B. Pullman,
editor), New York, Academic Press, Inc., 1964, 93.36. SHULMAN, R. G., and WERTHEIM, G. K., Rev. Mod. Physics, 1964, 36, 457.37. KARGER, W., Berichte der Bunsengesellschaft, 1964, 68, 793.38. BEAREN, A. J., Moss, T. H., CAUGHEY, W. S., and BEAUDREAU, C. A., to be published.39. WERTHEIM, G. K., and REMEIKA, J. P., Physic. Rev. Letters, 1964, 10, 14.40. BLUME, M., Physic. Rev. Letters, 1965, 14, 96.41. WEISS, J. J., Nature, 1964, 202, 83.42. PAULING, L., and CORYELL, C. D., Proc. Nat. Acad. Sc., 1936, 22, 210.43. BLEANEY, B., and STEVENS, K. W. H., Rep. Progr. Physics, 1963,16, 108.44. LANG, L. G., DEBENEDETrI, S., and INGALLS, R. L., J. Physic. Soc., Japan, 1962, 17, suppl.