110
Appendix A – Service Array Most Frequently Used Services
Appendix A – Service Array
Most Frequently
Used Services
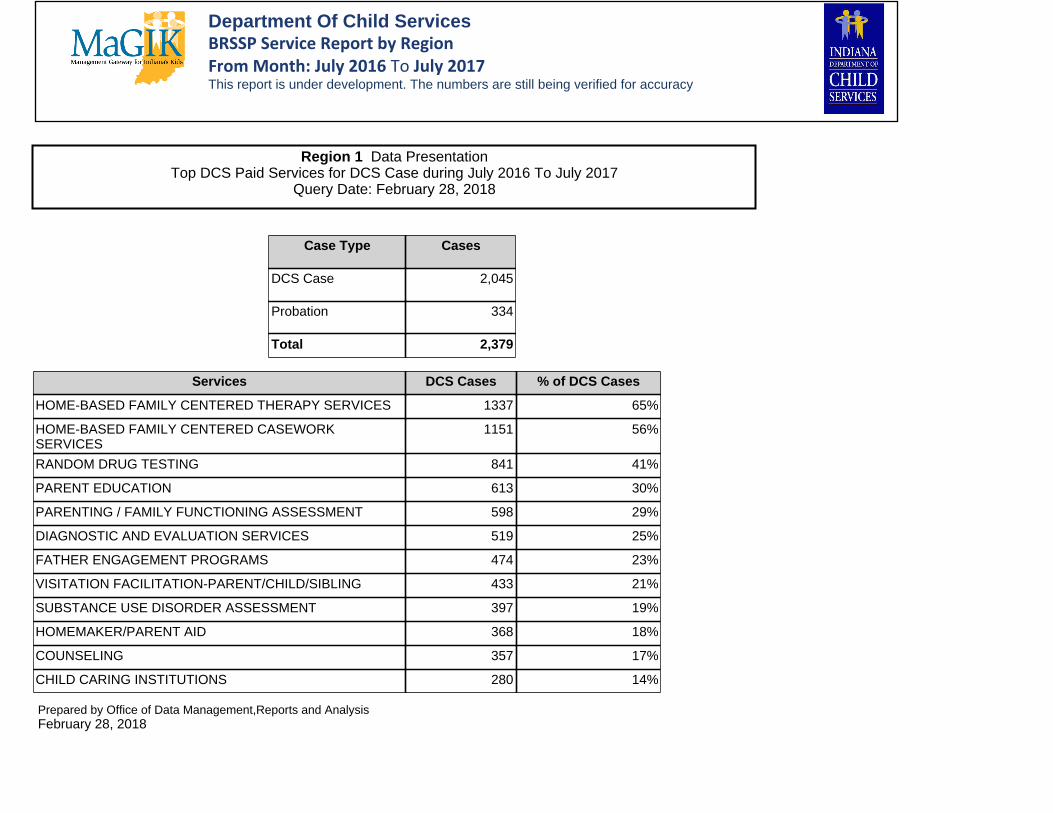
Case Type Cases
DCS Case 2,045
Probation 334
Total 2,379
Services DCS Cases % of DCS Cases
HOME-BASED FAMILY CENTERED THERAPY SERVICES 1337 65%
HOME-BASED FAMILY CENTERED CASEWORK SERVICES
1151 56%
RANDOM DRUG TESTING 841 41%
PARENT EDUCATION 613 30%
PARENTING / FAMILY FUNCTIONING ASSESSMENT 598 29%
DIAGNOSTIC AND EVALUATION SERVICES 519 25%
FATHER ENGAGEMENT PROGRAMS 474 23%
VISITATION FACILITATION-PARENT/CHILD/SIBLING 433 21%
SUBSTANCE USE DISORDER ASSESSMENT 397 19%
HOMEMAKER/PARENT AID 368 18%
COUNSELING 357 17%
CHILD CARING INSTITUTIONS 280 14%
Region 1 Data PresentationTop DCS Paid Services for DCS Case during July 2016 To July 2017
Query Date: February 28, 2018
Prepared by Office of Data Management,Reports and AnalysisFebruary 28, 2018
Department Of Child Services BRSSP Service Report by RegionFrom Month: July 2016 To July 2017This report is under development. The numbers are still being verified for accuracy
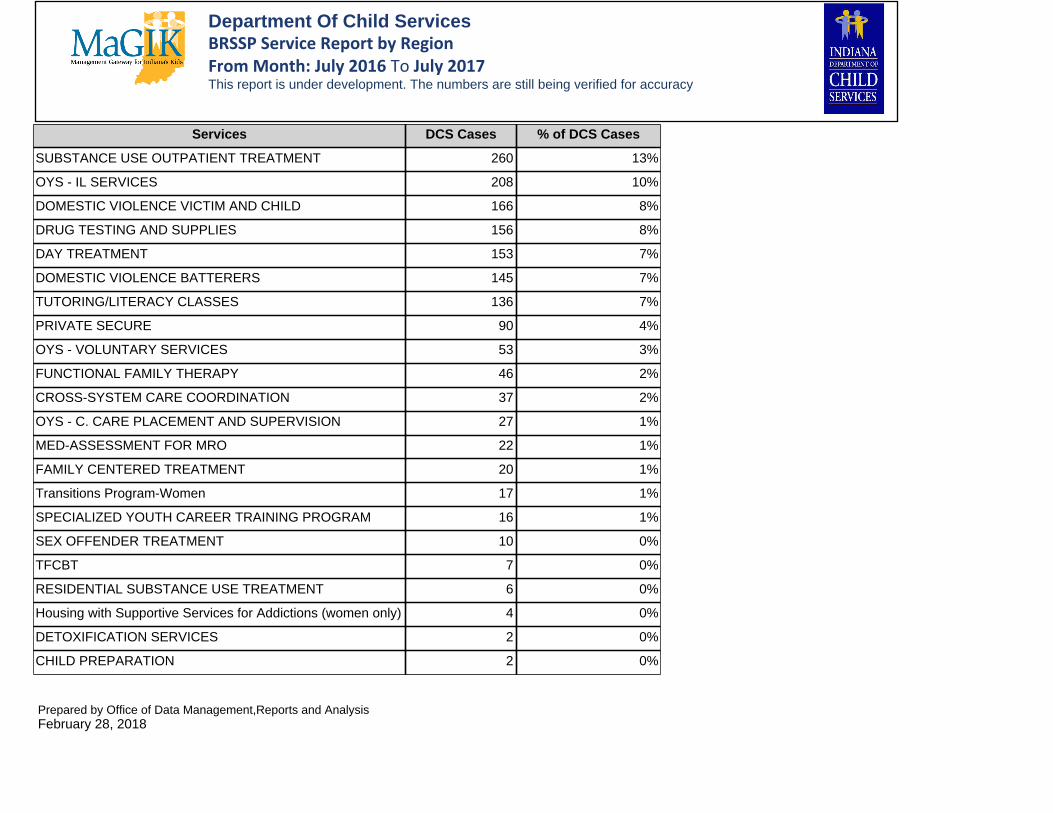
Services DCS Cases % of DCS Cases
SUBSTANCE USE OUTPATIENT TREATMENT 260 13%
OYS - IL SERVICES 208 10%
DOMESTIC VIOLENCE VICTIM AND CHILD 166 8%
DRUG TESTING AND SUPPLIES 156 8%
DAY TREATMENT 153 7%
DOMESTIC VIOLENCE BATTERERS 145 7%
TUTORING/LITERACY CLASSES 136 7%
PRIVATE SECURE 90 4%
OYS - VOLUNTARY SERVICES 53 3%
FUNCTIONAL FAMILY THERAPY 46 2%
CROSS-SYSTEM CARE COORDINATION 37 2%
OYS - C. CARE PLACEMENT AND SUPERVISION 27 1%
MED-ASSESSMENT FOR MRO 22 1%
FAMILY CENTERED TREATMENT 20 1%
Transitions Program-Women 17 1%
SPECIALIZED YOUTH CAREER TRAINING PROGRAM 16 1%
SEX OFFENDER TREATMENT 10 0%
TFCBT 7 0%
RESIDENTIAL SUBSTANCE USE TREATMENT 6 0%
Housing with Supportive Services for Addictions (women only) 4 0%
DETOXIFICATION SERVICES 2 0%
CHILD PREPARATION 2 0%
Prepared by Office of Data Management,Reports and AnalysisFebruary 28, 2018
Department Of Child Services BRSSP Service Report by RegionFrom Month: July 2016 To July 2017This report is under development. The numbers are still being verified for accuracy

Services DCS Cases % of DCS Cases
TFCBT/CBT/MI 2 0%
TRANSITION FROM RESTRICTIVE PLACEMENTS (TRP) 2 0%
Transitions Program-Child 1 0%
TFCBT/MI 1 0%
TRUANCY TERMINATION 1 0%
CBT 1 0%
CBT/MI 1 0%
COMPREHENSIVE HOME BASED SERVICES 1 0%
MI 1 0%
SPECIALIZED SERVICES 1 0%
SIR V 0 0%
HOMEBUILDER SERVICES 0 0%
COMPETITIVE 0 0%
STATE HEALTHY FAMILIES 0 0%
Prepared by Office of Data Management,Reports and AnalysisFebruary 28, 2018
Department Of Child Services BRSSP Service Report by RegionFrom Month: July 2016 To July 2017This report is under development. The numbers are still being verified for accuracy
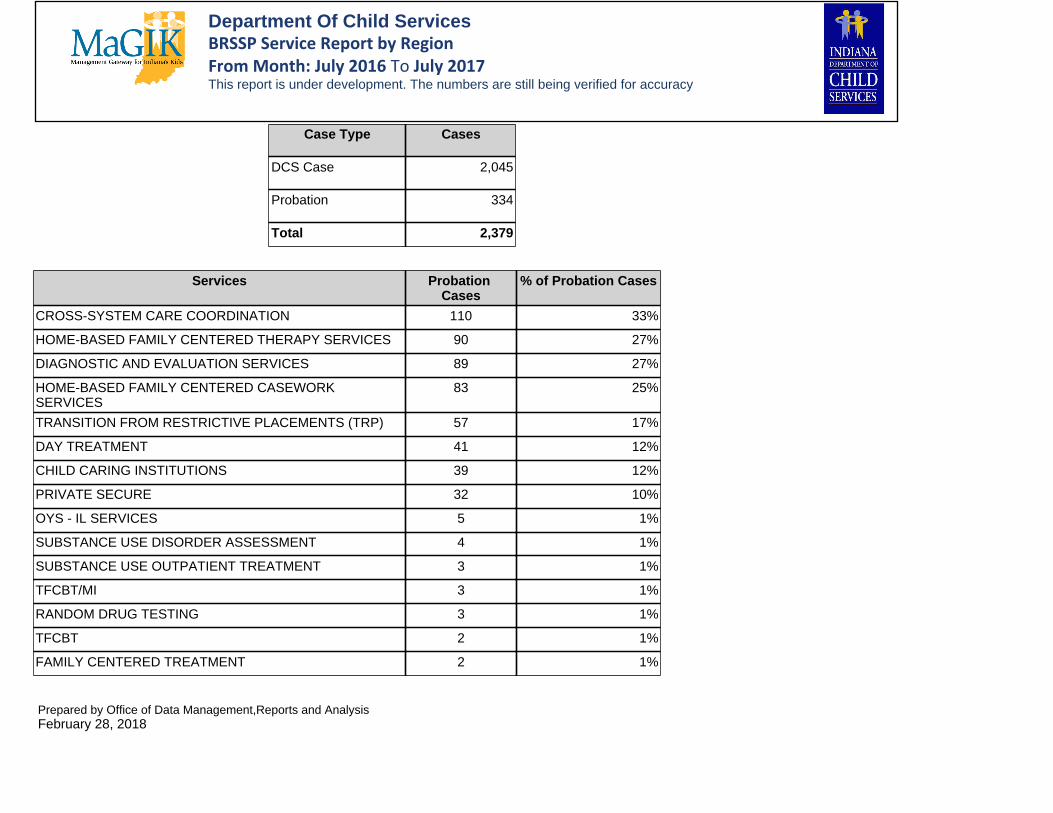
Case Type Cases
DCS Case 2,045
Probation 334
Total 2,379
Services Probation Cases
% of Probation Cases
CROSS-SYSTEM CARE COORDINATION 110 33%
HOME-BASED FAMILY CENTERED THERAPY SERVICES 90 27%
DIAGNOSTIC AND EVALUATION SERVICES 89 27%
HOME-BASED FAMILY CENTERED CASEWORK SERVICES
83 25%
TRANSITION FROM RESTRICTIVE PLACEMENTS (TRP) 57 17%
DAY TREATMENT 41 12%
CHILD CARING INSTITUTIONS 39 12%
PRIVATE SECURE 32 10%
OYS - IL SERVICES 5 1%
SUBSTANCE USE DISORDER ASSESSMENT 4 1%
SUBSTANCE USE OUTPATIENT TREATMENT 3 1%
TFCBT/MI 3 1%
RANDOM DRUG TESTING 3 1%
TFCBT 2 1%
FAMILY CENTERED TREATMENT 2 1%
Prepared by Office of Data Management,Reports and AnalysisFebruary 28, 2018
Department Of Child Services BRSSP Service Report by RegionFrom Month: July 2016 To July 2017This report is under development. The numbers are still being verified for accuracy
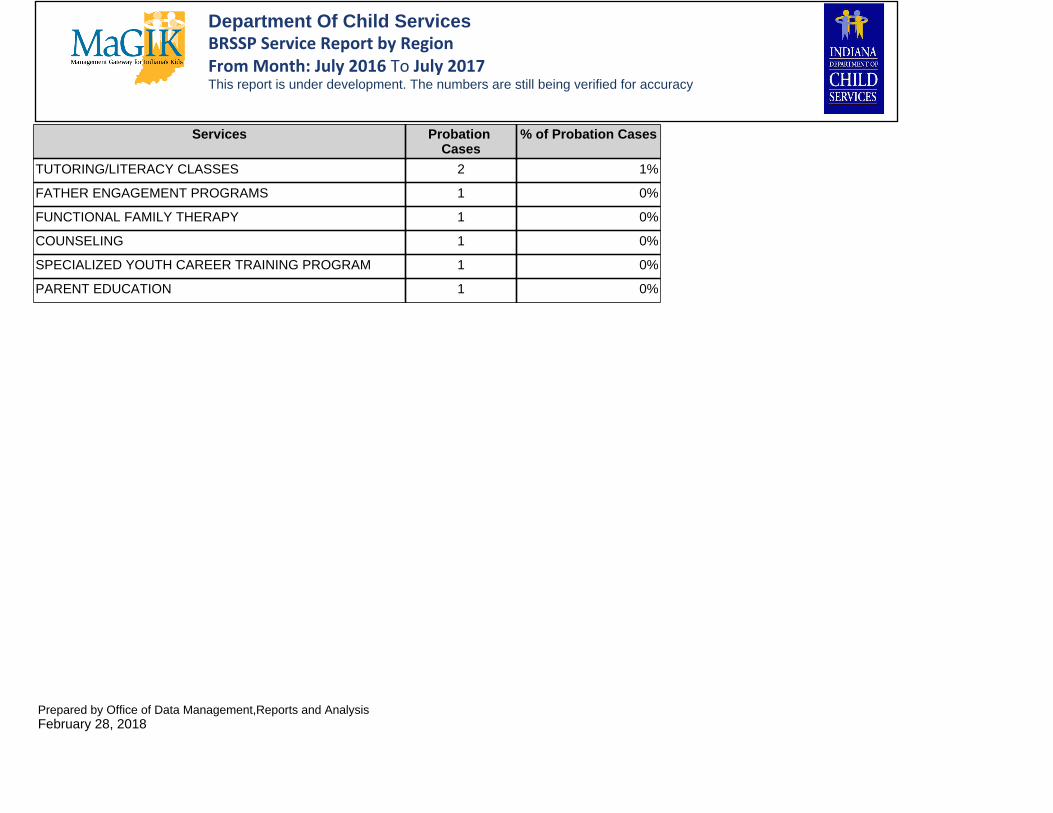
Services Probation Cases
% of Probation Cases
TUTORING/LITERACY CLASSES 2 1%
FATHER ENGAGEMENT PROGRAMS 1 0%
FUNCTIONAL FAMILY THERAPY 1 0%
COUNSELING 1 0%
SPECIALIZED YOUTH CAREER TRAINING PROGRAM 1 0%
PARENT EDUCATION 1 0%
Prepared by Office of Data Management,Reports and AnalysisFebruary 28, 2018
Department Of Child Services BRSSP Service Report by RegionFrom Month: July 2016 To July 2017This report is under development. The numbers are still being verified for accuracy
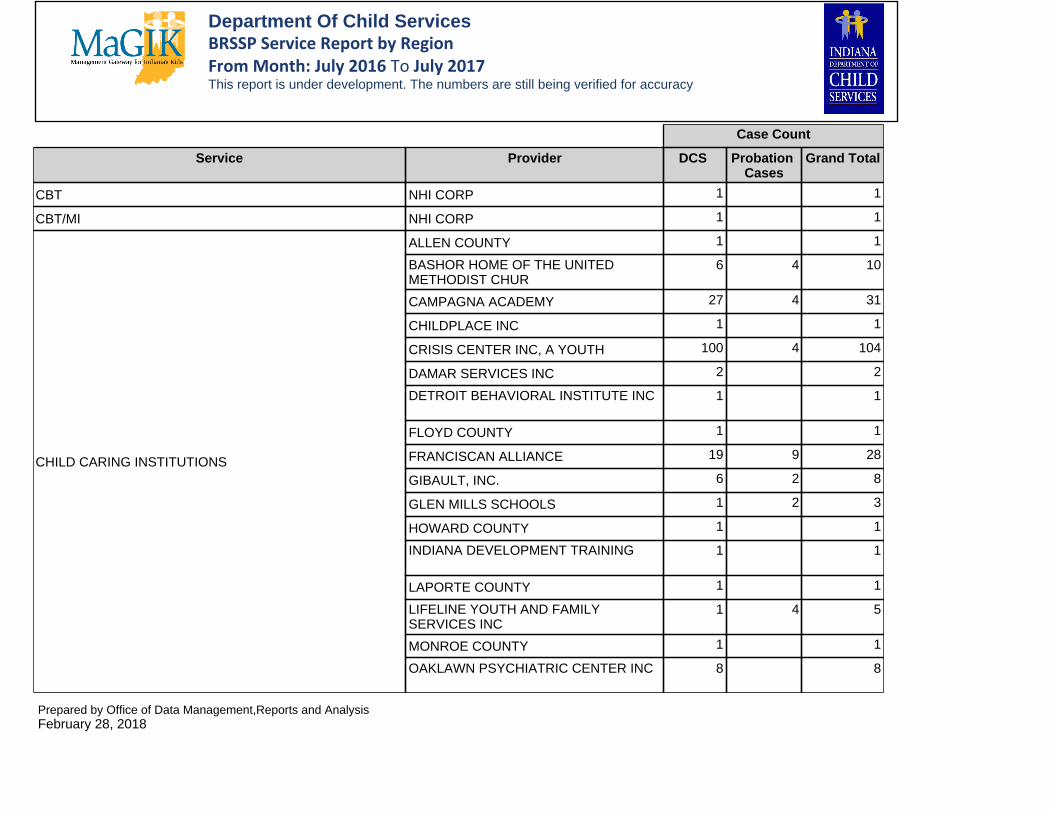
Case Count
Service Provider DCS Probation Cases
Grand Total
CBT NHI CORP 1 1
CBT/MI NHI CORP 1 1
CHILD CARING INSTITUTIONS
ALLEN COUNTY 1 1
BASHOR HOME OF THE UNITED METHODIST CHUR
6 4 10
CAMPAGNA ACADEMY 27 4 31
CHILDPLACE INC 1 1
CRISIS CENTER INC, A YOUTH 100 4 104
DAMAR SERVICES INC 2 2
DETROIT BEHAVIORAL INSTITUTE INC
1 1
FLOYD COUNTY 1 1
FRANCISCAN ALLIANCE 19 9 28
GIBAULT, INC. 6 2 8
GLEN MILLS SCHOOLS 1 2 3
HOWARD COUNTY 1 1
INDIANA DEVELOPMENT TRAINING
1 1
LAPORTE COUNTY 1 1
LIFELINE YOUTH AND FAMILY SERVICES INC
1 4 5
MONROE COUNTY 1 1
OAKLAWN PSYCHIATRIC CENTER INC
8 8
Prepared by Office of Data Management,Reports and AnalysisFebruary 28, 2018
Department Of Child Services BRSSP Service Report by RegionFrom Month: July 2016 To July 2017This report is under development. The numbers are still being verified for accuracy

Case Count
Service Provider DCS Probation Cases
Grand Total
CHILD CARING INSTITUTIONS
PADDOCK VIEW RESIDENTIAL 3 3 6
PARK CENTER INC 3 3
RESOLUTE ACQUISITION CORP
4 4 8
RTC RESOURCE ACQUISITION CORP
7 7
SHULTS-LEWIS CHILD & FAMILY 2 2
ST JOSEPH CARMELITE HOME FOR
124 124
VALLE VISTA LLC 3 3
WERNLE YOUTH & FAMILY TREATMENT CTR INC
4 2 6
YOUTH OPPORTUNITY CENTER INC
5 5
CHILD PREPARATION
MIDWEST PSYCHOLOGICAL CENTER INC
1 1
THE CARING CORNER LLC 1 1
COMPETITIVE MENTAL HEALTH AMERICA OF LAKE COUNTY INC
0 0
COMPREHENSIVE HOME BASED SERVICES NHI CORP 1 1
COUNSELING
APOSTOLIC YOUTH & FAMILY SERV.
13 13
ARISINGS INC 3 3
CAPITOL CITY FAMILY AND EDUCATION SVCS
11 11
CROWN COUNSELING 128 128
Prepared by Office of Data Management,Reports and AnalysisFebruary 28, 2018
Department Of Child Services BRSSP Service Report by RegionFrom Month: July 2016 To July 2017This report is under development. The numbers are still being verified for accuracy

Case Count
Service Provider DCS Probation Cases
Grand Total
COUNSELING
DOCKSIDE SERVICES, INC. 5 5
ELAINE SPICER 6 6
FAMILY FIRST SERVICES LLC 38 38
FAMILY FOCUS, INC. 20 20
FAMILY LIFE CONSULTANTS INC
13 13
HDI COUNSELING LLC 7 7
HOME BASED BEHAVIORAL SOLUTIONS LLC
4 4
KELLY HALCARZ 1 1
KEY COUNSELING INC 2 2
METROPOLITAN OASIS COMMUNITY
25 25
MID-AMERICA PSYCH COUNSELING
4 4
NATIONAL YOUTH ADVOCATE
1 1
NHI CORP 11 11
NORTH STAR SERVICES, LLC 16 16
NORTHWEST PSYCHOLOGICAL
1 1
NUSOURCE EDUCATIONAL SERVICE
1 1
PARK CENTER INC 1 1
Prepared by Office of Data Management,Reports and AnalysisFebruary 28, 2018
Department Of Child Services BRSSP Service Report by RegionFrom Month: July 2016 To July 2017This report is under development. The numbers are still being verified for accuracy
Case Count
Service Provider DCS Probation Cases
Grand Total
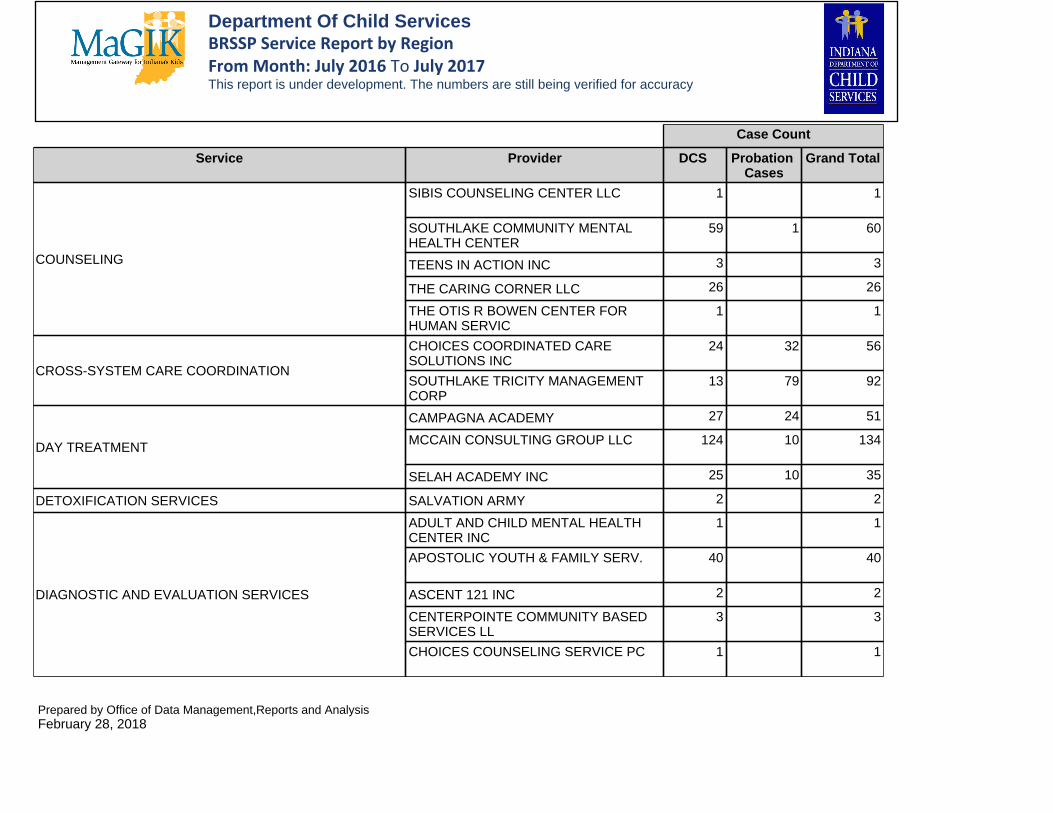
COUNSELING
SIBIS COUNSELING CENTER LLC
1 1
SOUTHLAKE COMMUNITY MENTAL HEALTH CENTER
59 1 60
TEENS IN ACTION INC 3 3
THE CARING CORNER LLC 26 26
THE OTIS R BOWEN CENTER FOR HUMAN SERVIC
1 1
CROSS-SYSTEM CARE COORDINATION
CHOICES COORDINATED CARE SOLUTIONS INC
24 32 56
SOUTHLAKE TRICITY MANAGEMENT CORP
13 79 92
DAY TREATMENT
CAMPAGNA ACADEMY 27 24 51
MCCAIN CONSULTING GROUP LLC
124 10 134
SELAH ACADEMY INC 25 10 35
DETOXIFICATION SERVICES SALVATION ARMY 2 2
DIAGNOSTIC AND EVALUATION SERVICES
ADULT AND CHILD MENTAL HEALTH CENTER INC
1 1
APOSTOLIC YOUTH & FAMILY SERV.
40 40
ASCENT 121 INC 2 2
CENTERPOINTE COMMUNITY BASED SERVICES LL
3 3
CHOICES COUNSELING SERVICE PC
1 1
Prepared by Office of Data Management,Reports and AnalysisFebruary 28, 2018
Department Of Child Services BRSSP Service Report by RegionFrom Month: July 2016 To July 2017This report is under development. The numbers are still being verified for accuracy

Case Count
Service Provider DCS Probation Cases
Grand Total
DIAGNOSTIC AND EVALUATION SERVICES
COUNSELING PARTNERS LLC 4 4
CROWN COUNSELING 140 140
DAVID L PHD WINSCH 1 1
DR JB SCHWARTZ INC 89 5 94
ELAINE SPICER 1 1
FLOYD COUNTY 1 1
FOUR CO COMP MENTAL HEALTH CENTER INC
1 1
JEFF BURNETT 1 1
LAPORTE CO COMPREHENSIVE
1 1
METROPOLITAN OASIS COMMUNITY
27 27
MID-AMERICA PSYCH COUNSELING
13 13
NEW BEGINNINGS LIFE CENTER
1 1
NORTHWEST PSYCHOLOGICAL
6 13 19
PARK CENTER INC 1 1
PORTER-STARKE SERVICES INC
3 3
RONALD RUFF PC 77 72 149
SIBIS COUNSELING CENTER LLC
4 4
Prepared by Office of Data Management,Reports and AnalysisFebruary 28, 2018
Department Of Child Services BRSSP Service Report by RegionFrom Month: July 2016 To July 2017This report is under development. The numbers are still being verified for accuracy

Case Count
Service Provider DCS Probation Cases
Grand Total
DIAGNOSTIC AND EVALUATION SERVICES
SOUTHLAKE COMMUNITY MENTAL HEALTH CENTER
104 104
THE CARING CORNER LLC 65 65
DOMESTIC VIOLENCE BATTERERS
ABUSE COUNSELING AND EDUCATION INC
1 1
CRISIS CONNECTION INC 1 1
CROWN COUNSELING 70 70
SOUTHLAKE TRICITY MANAGEMENT CORP
80 80
DOMESTIC VIOLENCE VICTIM AND CHILD
APOSTOLIC YOUTH & FAMILY SERV.
17 17
COUNSELING PARTNERS LLC 2 2
CRISIS CONNECTION INC 1 1
CROWN COUNSELING 69 69
FAMILIES FIRST INDIANA INC 1 1
HDI COUNSELING LLC 6 6
HOME BASED BEHAVIORAL SOLUTIONS LLC
4 4
HOPE UNITED FAMILY SERVICES INC
1 1
JUST DO IT COUNSELING LLC 1 1
KEY COUNSELING INC 1 1
NATIONAL YOUTH ADVOCATE
1 1
NHI CORP 5 5
Prepared by Office of Data Management,Reports and AnalysisFebruary 28, 2018
Department Of Child Services BRSSP Service Report by RegionFrom Month: July 2016 To July 2017This report is under development. The numbers are still being verified for accuracy
Case Count
Service Provider DCS Probation Cases
Grand Total
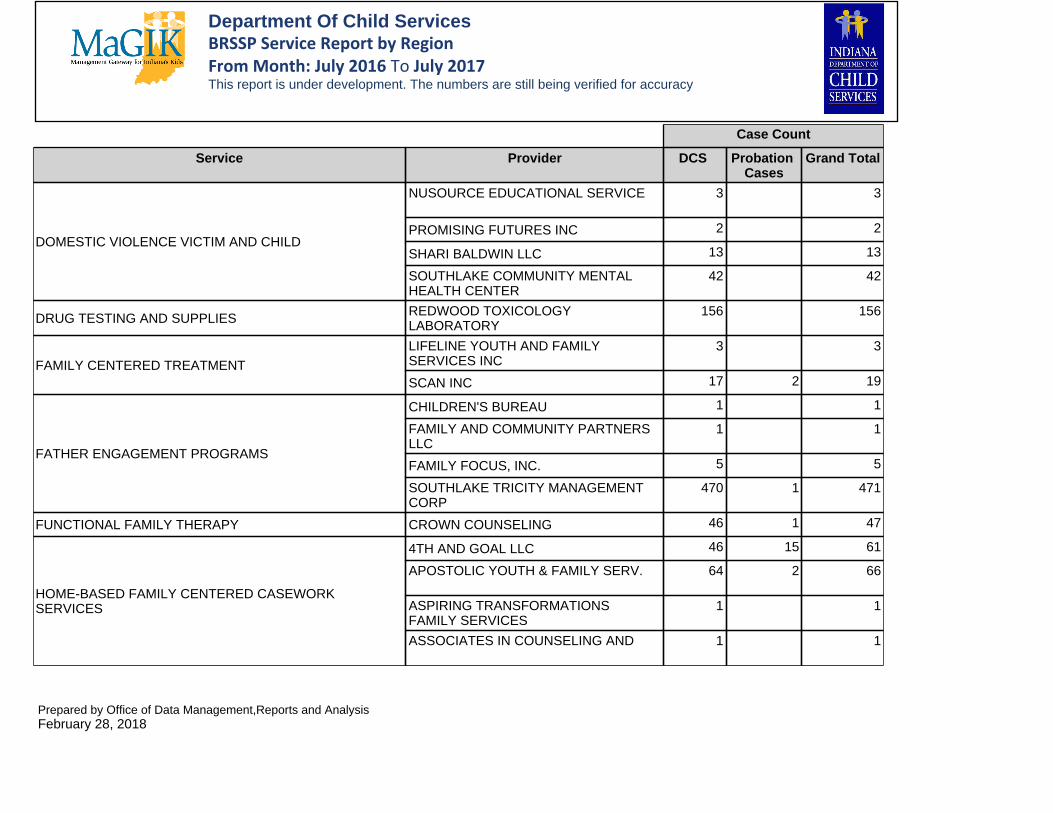
DOMESTIC VIOLENCE VICTIM AND CHILD
NUSOURCE EDUCATIONAL SERVICE
3 3
PROMISING FUTURES INC 2 2
SHARI BALDWIN LLC 13 13
SOUTHLAKE COMMUNITY MENTAL HEALTH CENTER
42 42
DRUG TESTING AND SUPPLIES REDWOOD TOXICOLOGY LABORATORY
156 156
FAMILY CENTERED TREATMENT
LIFELINE YOUTH AND FAMILY SERVICES INC
3 3
SCAN INC 17 2 19
FATHER ENGAGEMENT PROGRAMS
CHILDREN'S BUREAU 1 1
FAMILY AND COMMUNITY PARTNERS LLC
1 1
FAMILY FOCUS, INC. 5 5
SOUTHLAKE TRICITY MANAGEMENT CORP
470 1 471
FUNCTIONAL FAMILY THERAPY CROWN COUNSELING 46 1 47
HOME-BASED FAMILY CENTERED CASEWORK SERVICES
4TH AND GOAL LLC 46 15 61
APOSTOLIC YOUTH & FAMILY SERV.
64 2 66
ASPIRING TRANSFORMATIONS FAMILY SERVICES
1 1
ASSOCIATES IN COUNSELING AND
1 1
Prepared by Office of Data Management,Reports and AnalysisFebruary 28, 2018
Department Of Child Services BRSSP Service Report by RegionFrom Month: July 2016 To July 2017This report is under development. The numbers are still being verified for accuracy

Case Count
Service Provider DCS Probation Cases
Grand Total
HOME-BASED FAMILY CENTERED CASEWORK SERVICES
CAPITOL CITY FAMILY AND EDUCATION SVCS
46 46
CASE MANAGEMENT AFFIRMED SERVICES INC
1 1
CENTERPOINTE COMMUNITY BASED SERVICES LL
1 1
CENTERSTONE OF INDIANA INC
1 1
COUNSELING PARTNERS LLC 1 1
COUPLES MENTORING YOUTH AND
16 16
CROWN COUNSELING 215 1 216
DOCKSIDE SERVICES, INC. 51 21 72
FAMILIES FIRST INDIANA INC 1 1
FAMILY ARK INC 1 1
FAMILY FIRST SERVICES LLC 189 189
FAMILY FOCUS, INC. 73 73
FAMILY SOLUTIONS INC 1 1
GENESIS OUTREACH INC 4 4
HDI COUNSELING LLC 27 1 28
HNS CONSULTING SERVICES LLC
1 1
HOME BASED BEHAVIORAL SOLUTIONS LLC
26 4 30
Prepared by Office of Data Management,Reports and AnalysisFebruary 28, 2018
Department Of Child Services BRSSP Service Report by RegionFrom Month: July 2016 To July 2017This report is under development. The numbers are still being verified for accuracy
Case Count
Service Provider DCS Probation Cases
Grand Total
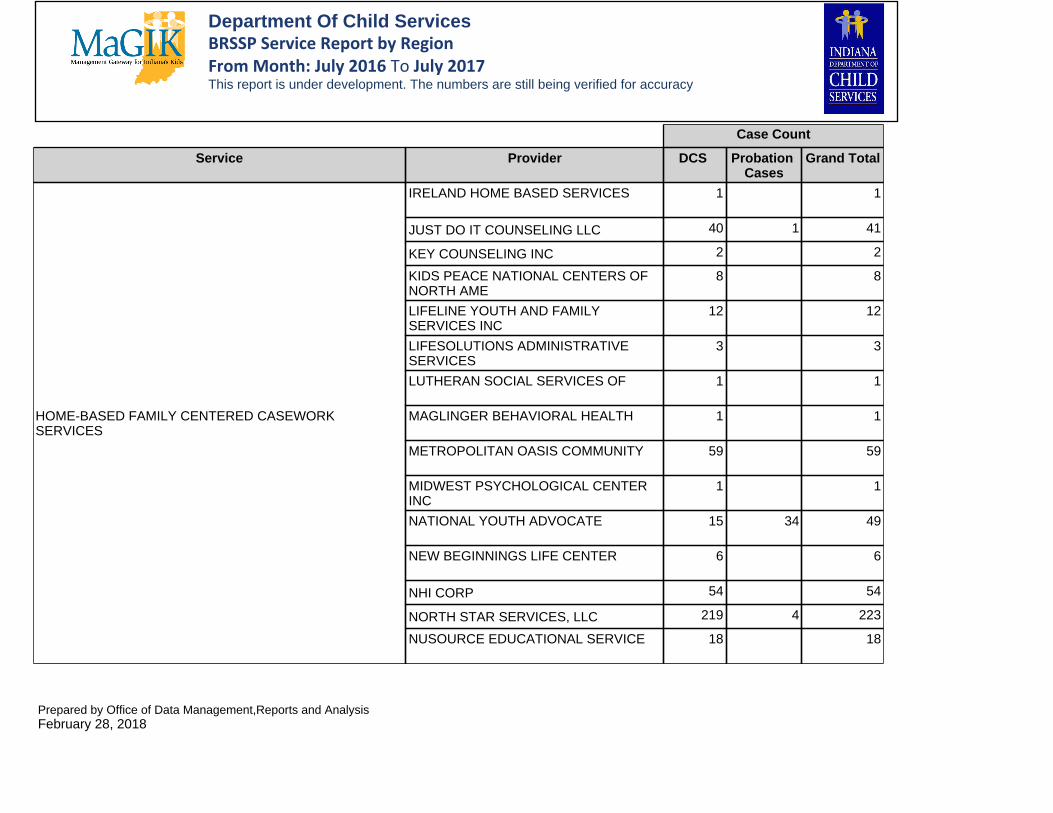
HOME-BASED FAMILY CENTERED CASEWORK SERVICES
IRELAND HOME BASED SERVICES
1 1
JUST DO IT COUNSELING LLC 40 1 41
KEY COUNSELING INC 2 2
KIDS PEACE NATIONAL CENTERS OF NORTH AME
8 8
LIFELINE YOUTH AND FAMILY SERVICES INC
12 12
LIFESOLUTIONS ADMINISTRATIVE SERVICES
3 3
LUTHERAN SOCIAL SERVICES OF
1 1
MAGLINGER BEHAVIORAL HEALTH
1 1
METROPOLITAN OASIS COMMUNITY
59 59
MIDWEST PSYCHOLOGICAL CENTER INC
1 1
NATIONAL YOUTH ADVOCATE
15 34 49
NEW BEGINNINGS LIFE CENTER
6 6
NHI CORP 54 54
NORTH STAR SERVICES, LLC 219 4 223
NUSOURCE EDUCATIONAL SERVICE
18 18
Prepared by Office of Data Management,Reports and AnalysisFebruary 28, 2018
Department Of Child Services BRSSP Service Report by RegionFrom Month: July 2016 To July 2017This report is under development. The numbers are still being verified for accuracy

Case Count
Service Provider DCS Probation Cases
Grand Total
HOME-BASED FAMILY CENTERED CASEWORK SERVICES
OAKLAWN PSYCHIATRIC CENTER INC
1 1
PORTER-STARKE SERVICES INC
2 2
PROMISING FUTURES INC 14 14
RISING STARS ACADEMY LLC 53 53
SCAN INC 14 14
SOUTHLAKE COMMUNITY MENTAL HEALTH CENTER
61 61
STEPPING STONE THERAPY CENTER LLC
1 1
THE CARING CORNER LLC 93 93
THE OTIS R BOWEN CENTER FOR HUMAN SERVIC
1 1
URBAN SUNS COMMUNITY DEVELOPMENT
39 2 41
VILLAGES OF INDIANA INC 3 3
WABASH VALLEY ALLIANCE INC
2 2
HOME-BASED FAMILY CENTERED THERAPY SERVICES
ADULT AND CHILD MENTAL HEALTH CENTER INC
1 1
APOSTOLIC YOUTH & FAMILY SERV.
92 1 93
ARISINGS INC 24 5 29
CAPITOL CITY FAMILY AND EDUCATION SVCS
37 37
Prepared by Office of Data Management,Reports and AnalysisFebruary 28, 2018
Department Of Child Services BRSSP Service Report by RegionFrom Month: July 2016 To July 2017This report is under development. The numbers are still being verified for accuracy
Case Count
Service Provider DCS Probation Cases
Grand Total
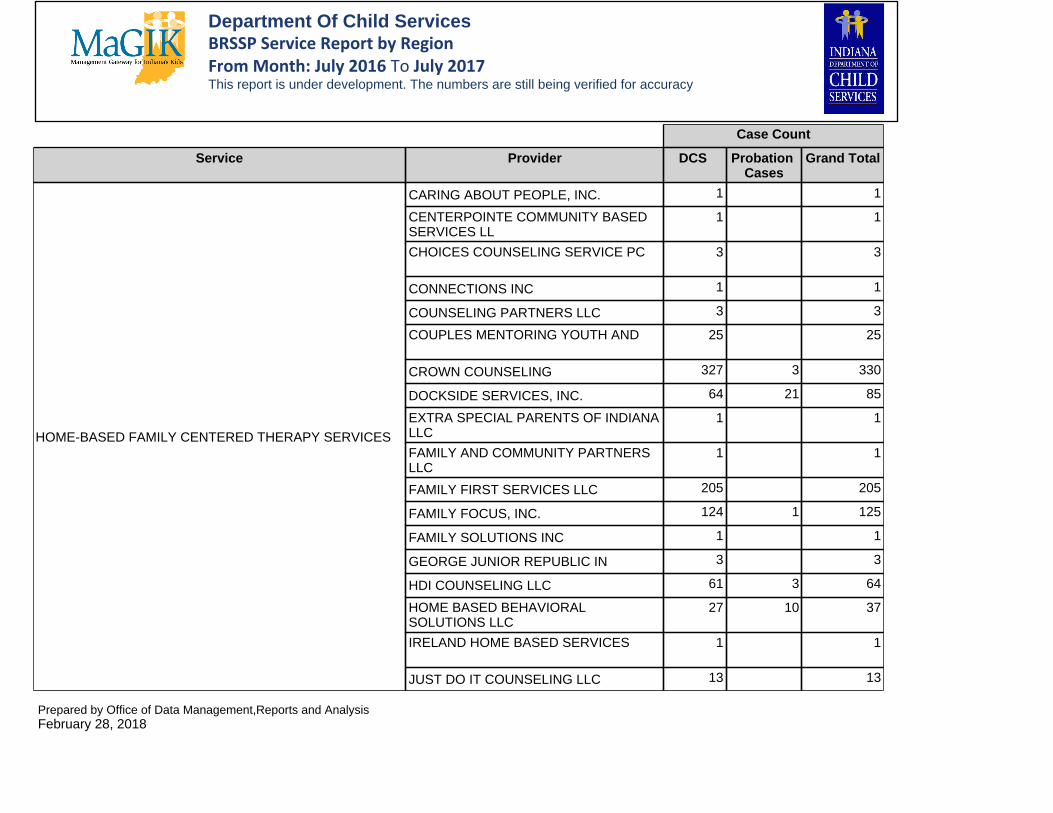
HOME-BASED FAMILY CENTERED THERAPY SERVICES
CARING ABOUT PEOPLE, INC. 1 1
CENTERPOINTE COMMUNITY BASED SERVICES LL
1 1
CHOICES COUNSELING SERVICE PC
3 3
CONNECTIONS INC 1 1
COUNSELING PARTNERS LLC 3 3
COUPLES MENTORING YOUTH AND
25 25
CROWN COUNSELING 327 3 330
DOCKSIDE SERVICES, INC. 64 21 85
EXTRA SPECIAL PARENTS OF INDIANA LLC
1 1
FAMILY AND COMMUNITY PARTNERS LLC
1 1
FAMILY FIRST SERVICES LLC 205 205
FAMILY FOCUS, INC. 124 1 125
FAMILY SOLUTIONS INC 1 1
GEORGE JUNIOR REPUBLIC IN 3 3
HDI COUNSELING LLC 61 3 64
HOME BASED BEHAVIORAL SOLUTIONS LLC
27 10 37
IRELAND HOME BASED SERVICES
1 1
JUST DO IT COUNSELING LLC 13 13
Prepared by Office of Data Management,Reports and AnalysisFebruary 28, 2018
Department Of Child Services BRSSP Service Report by RegionFrom Month: July 2016 To July 2017This report is under development. The numbers are still being verified for accuracy
Case Count
Service Provider DCS Probation Cases
Grand Total
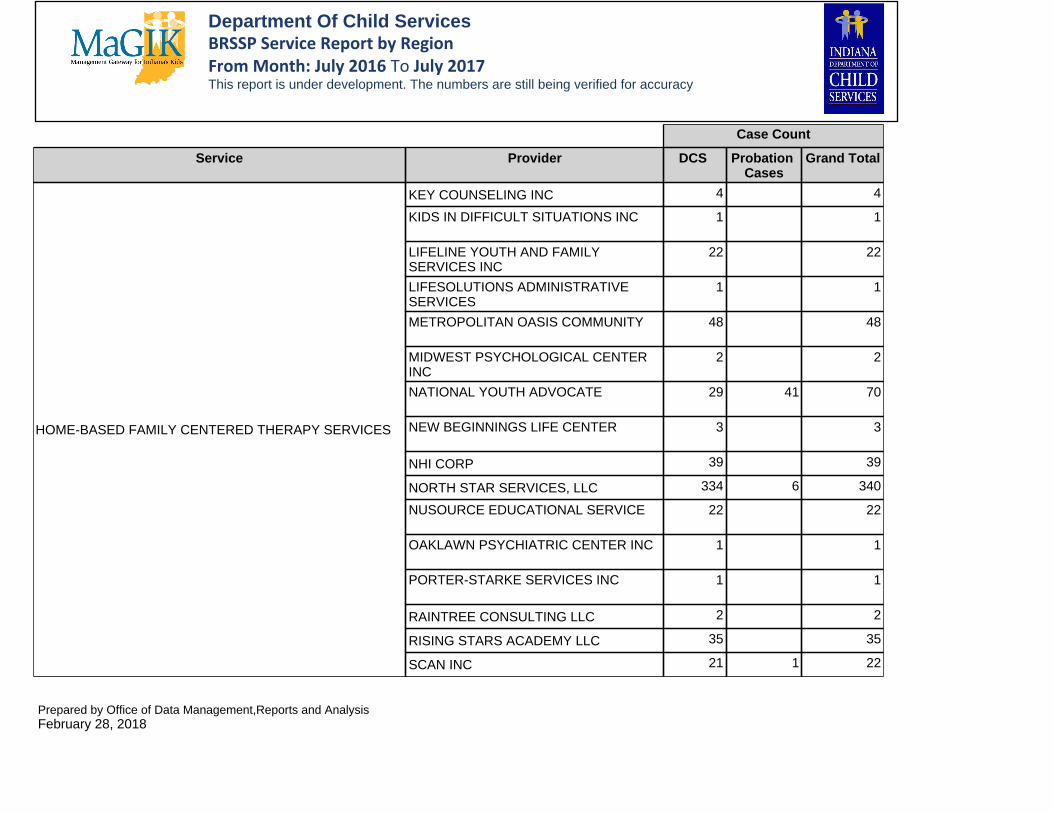
HOME-BASED FAMILY CENTERED THERAPY SERVICES
KEY COUNSELING INC 4 4
KIDS IN DIFFICULT SITUATIONS INC
1 1
LIFELINE YOUTH AND FAMILY SERVICES INC
22 22
LIFESOLUTIONS ADMINISTRATIVE SERVICES
1 1
METROPOLITAN OASIS COMMUNITY
48 48
MIDWEST PSYCHOLOGICAL CENTER INC
2 2
NATIONAL YOUTH ADVOCATE
29 41 70
NEW BEGINNINGS LIFE CENTER
3 3
NHI CORP 39 39
NORTH STAR SERVICES, LLC 334 6 340
NUSOURCE EDUCATIONAL SERVICE
22 22
OAKLAWN PSYCHIATRIC CENTER INC
1 1
PORTER-STARKE SERVICES INC
1 1
RAINTREE CONSULTING LLC 2 2
RISING STARS ACADEMY LLC 35 35
SCAN INC 21 1 22
Prepared by Office of Data Management,Reports and AnalysisFebruary 28, 2018
Department Of Child Services BRSSP Service Report by RegionFrom Month: July 2016 To July 2017This report is under development. The numbers are still being verified for accuracy

Case Count
Service Provider DCS Probation Cases
Grand Total
HOME-BASED FAMILY CENTERED THERAPY SERVICES
SIBIS COUNSELING CENTER LLC
6 6
SOUTHLAKE COMMUNITY MENTAL HEALTH CENTER
65 65
TEENS IN ACTION INC 14 14
THE CARING CORNER LLC 184 184
VILLAGES OF INDIANA INC 6 6
HOMEBUILDER SERVICES SOUTHLAKE COMMUNITY MENTAL HEALTH CENTER
0 0
HOMEMAKER/PARENT AID
APOSTOLIC YOUTH & FAMILY SERV.
70 70
CAPITOL CITY FAMILY AND EDUCATION SVCS
18 18
CROWN COUNSELING 96 96
DOCKSIDE SERVICES, INC. 15 15
FAMILY FIRST SERVICES LLC 97 97
FAMILY FOCUS, INC. 11 11
HOME BASED BEHAVIORAL SOLUTIONS LLC
2 2
IRELAND HOME BASED SERVICES
1 1
KIDS PEACE NATIONAL CENTERS OF NORTH AME
4 4
LIFELINE YOUTH AND FAMILY SERVICES INC
1 1
Prepared by Office of Data Management,Reports and AnalysisFebruary 28, 2018
Department Of Child Services BRSSP Service Report by RegionFrom Month: July 2016 To July 2017This report is under development. The numbers are still being verified for accuracy

Case Count
Service Provider DCS Probation Cases
Grand Total
HOMEMAKER/PARENT AID
METROPOLITAN OASIS COMMUNITY
13 13
NATIONAL YOUTH ADVOCATE
3 3
NEW BEGINNINGS LIFE CENTER
1 1
NHI CORP 6 6
NORTH STAR SERVICES, LLC 36 36
NUSOURCE EDUCATIONAL SERVICE
2 2
PROMISING FUTURES INC 6 6
RISING STARS ACADEMY LLC 21 21
SOUTHLAKE COMMUNITY MENTAL HEALTH CENTER
2 2
THE OTIS R BOWEN CENTER FOR HUMAN SERVIC
3 3
Housing with Supportive Services for Addictions (women only) YWCA NORTHEAST INDIANA INC
4 4
MED-ASSESSMENT FOR MRO SOUTHLAKE COMMUNITY MENTAL HEALTH CENTER
22 22
MI FAMILY FOCUS, INC. 1 1
OYS - C. CARE PLACEMENT AND SUPERVISION
DAMAR SERVICES INC 3 3
SPECIALIZED ALTERNATIVES FOR
22 22
VILLAGES OF INDIANA INC 2 2
OYS - IL SERVICES CHILDREN'S BUREAU 7 7
Prepared by Office of Data Management,Reports and AnalysisFebruary 28, 2018
Department Of Child Services BRSSP Service Report by RegionFrom Month: July 2016 To July 2017This report is under development. The numbers are still being verified for accuracy

Case Count
Service Provider DCS Probation Cases
Grand Total
OYS - IL SERVICES
DAMAR SERVICES INC 2 2
GEORGE JUNIOR REPUBLIC IN 3 1 4
SPECIALIZED ALTERNATIVES FOR
189 3 192
VILLAGES OF INDIANA INC 13 1 14
OYS - VOLUNTARY SERVICES
CHILDREN'S BUREAU 1 1
DAMAR SERVICES INC 1 1
SPECIALIZED ALTERNATIVES FOR
50 50
VILLAGES OF INDIANA INC 1 1
PARENT EDUCATION
APOSTOLIC YOUTH & FAMILY SERV.
43 43
CAPITOL CITY FAMILY AND EDUCATION SVCS
21 21
CHOICES COUNSELING SERVICE PC
1 1
CROWN COUNSELING 157 1 158
DUNEBROOK INC 1 1
FAMILIES FIRST INDIANA INC 1 1
FAMILY FIRST SERVICES LLC 61 61
FAMILY FOCUS, INC. 36 36
HDI COUNSELING LLC 18 18
HOME BASED BEHAVIORAL SOLUTIONS LLC
10 10
Prepared by Office of Data Management,Reports and AnalysisFebruary 28, 2018
Department Of Child Services BRSSP Service Report by RegionFrom Month: July 2016 To July 2017This report is under development. The numbers are still being verified for accuracy
Case Count
Service Provider DCS Probation Cases
Grand Total
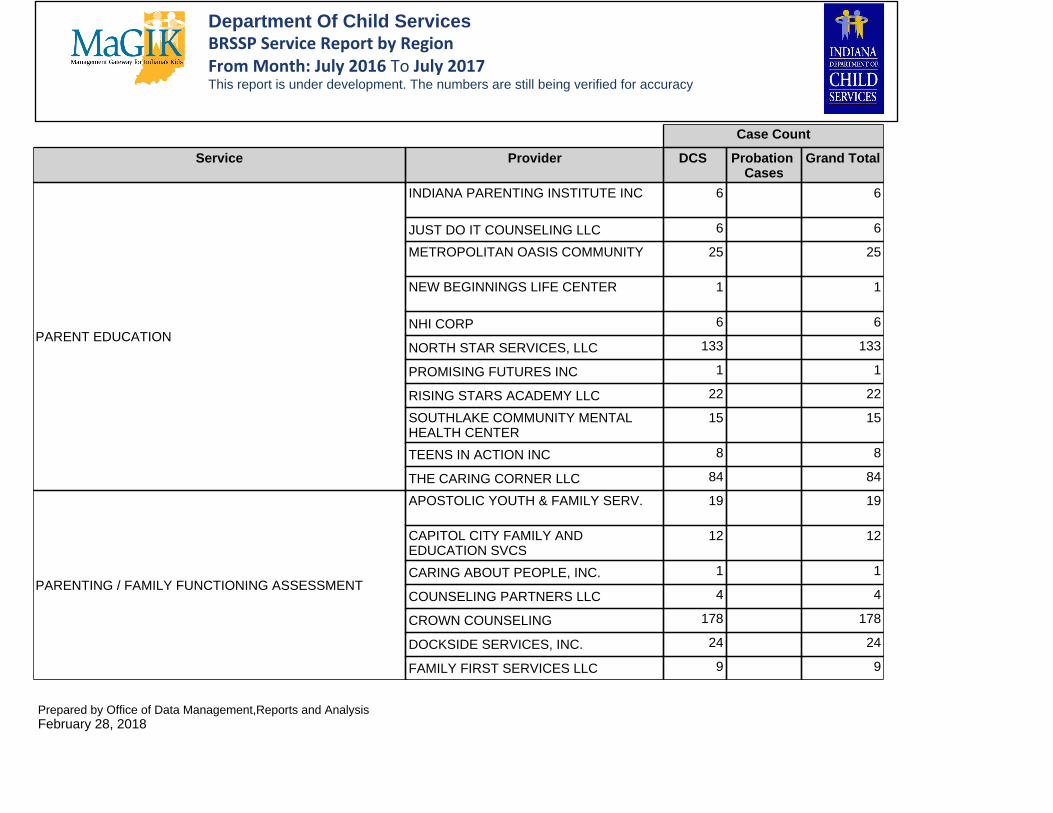
PARENT EDUCATION
INDIANA PARENTING INSTITUTE INC
6 6
JUST DO IT COUNSELING LLC 6 6
METROPOLITAN OASIS COMMUNITY
25 25
NEW BEGINNINGS LIFE CENTER
1 1
NHI CORP 6 6
NORTH STAR SERVICES, LLC 133 133
PROMISING FUTURES INC 1 1
RISING STARS ACADEMY LLC 22 22
SOUTHLAKE COMMUNITY MENTAL HEALTH CENTER
15 15
TEENS IN ACTION INC 8 8
THE CARING CORNER LLC 84 84
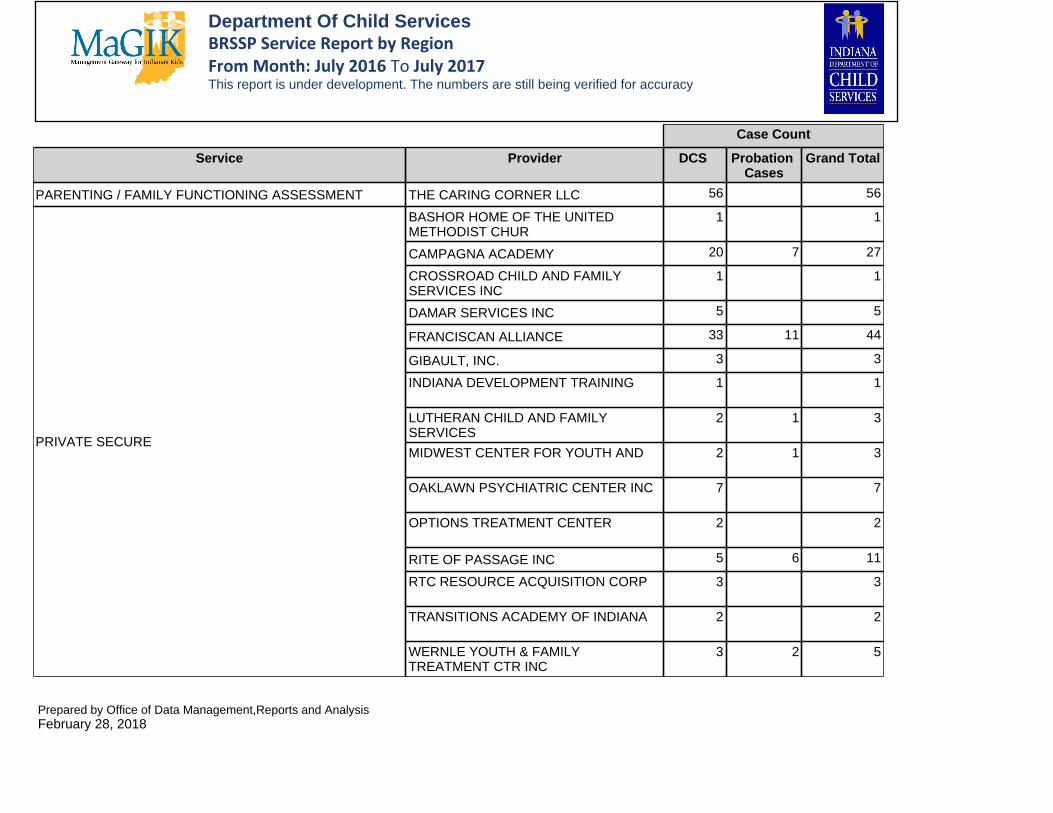
PARENTING / FAMILY FUNCTIONING ASSESSMENT
APOSTOLIC YOUTH & FAMILY SERV.
19 19
CAPITOL CITY FAMILY AND EDUCATION SVCS
12 12
CARING ABOUT PEOPLE, INC. 1 1
COUNSELING PARTNERS LLC 4 4
CROWN COUNSELING 178 178
DOCKSIDE SERVICES, INC. 24 24
FAMILY FIRST SERVICES LLC 9 9
Prepared by Office of Data Management,Reports and AnalysisFebruary 28, 2018
Department Of Child Services BRSSP Service Report by RegionFrom Month: July 2016 To July 2017This report is under development. The numbers are still being verified for accuracy

Case Count
Service Provider DCS Probation Cases
Grand Total
PARENTING / FAMILY FUNCTIONING ASSESSMENT
FAMILY FOCUS, INC. 33 33
HDI COUNSELING LLC 16 16
HOME BASED BEHAVIORAL SOLUTIONS LLC
11 11
IRELAND HOME BASED SERVICES
3 3
JUST DO IT COUNSELING LLC 3 3
METROPOLITAN OASIS COMMUNITY
45 45
MIDWEST PSYCHOLOGICAL CENTER INC
1 1
NEW BEGINNINGS LIFE CENTER
1 1
NHI CORP 15 15
NORTH STAR SERVICES, LLC 126 126
OAKLAWN PSYCHIATRIC CENTER INC
1 1
PORTER-STARKE SERVICES INC
1 1
RAINTREE CONSULTING LLC 1 1
RISING STARS ACADEMY LLC 15 15
SIBIS COUNSELING CENTER LLC
2 2
SOUTHLAKE COMMUNITY MENTAL HEALTH CENTER
29 29
TEENS IN ACTION INC 7 7
Prepared by Office of Data Management,Reports and AnalysisFebruary 28, 2018
Department Of Child Services BRSSP Service Report by RegionFrom Month: July 2016 To July 2017This report is under development. The numbers are still being verified for accuracy
Case Count
Service Provider DCS Probation Cases
Grand Total
PARENTING / FAMILY FUNCTIONING ASSESSMENT THE CARING CORNER LLC 56 56
PRIVATE SECURE
BASHOR HOME OF THE UNITED METHODIST CHUR
1 1
CAMPAGNA ACADEMY 20 7 27
CROSSROAD CHILD AND FAMILY SERVICES INC
1 1
DAMAR SERVICES INC 5 5
FRANCISCAN ALLIANCE 33 11 44
GIBAULT, INC. 3 3
INDIANA DEVELOPMENT TRAINING
1 1
LUTHERAN CHILD AND FAMILY SERVICES
2 1 3
MIDWEST CENTER FOR YOUTH AND
2 1 3
OAKLAWN PSYCHIATRIC CENTER INC
7 7
OPTIONS TREATMENT CENTER
2 2
RITE OF PASSAGE INC 5 6 11
RTC RESOURCE ACQUISITION CORP
3 3
TRANSITIONS ACADEMY OF INDIANA
2 2
WERNLE YOUTH & FAMILY TREATMENT CTR INC
3 2 5
Prepared by Office of Data Management,Reports and AnalysisFebruary 28, 2018
Department Of Child Services BRSSP Service Report by RegionFrom Month: July 2016 To July 2017This report is under development. The numbers are still being verified for accuracy

Case Count
Service Provider DCS Probation Cases
Grand Total
PRIVATE SECUREWRFS SERVICES LLC 6 5 11
YOUTH OPPORTUNITY CENTER INC
3 1 4
RANDOM DRUG TESTING REDWOOD TOXICOLOGY LABORATORY
841 3 844
RESIDENTIAL SUBSTANCE USE TREATMENT
SALVATION ARMY 3 3
TARA TREATMENT CENTER INC
2 2
YWCA NORTH CENTRAL INDIANA, INC
1 1
SEX OFFENDER TREATMENT
CENTERPOINTE COMMUNITY BASED SERVICES LL
3 3
CROWN COUNSELING 7 7
SIR V MENTAL HEALTH AMERICA OF LAKE COUNTY INC
0 0
SPECIALIZED SERVICES SALVATION ARMY 1 1
SPECIALIZED YOUTH CAREER TRAINING PROGRAM HOWE LLC 16 1 17
STATE HEALTHY FAMILIES MENTAL HEALTH AMERICA OF LAKE COUNTY INC
0 0
SUBSTANCE USE DISORDER ASSESSMENT
APOSTOLIC YOUTH & FAMILY SERV.
16 16
CAPITOL CITY FAMILY AND EDUCATION SVCS
10 10
CHOICES COUNSELING SERVICE PC
5 5
CROWN COUNSELING 70 70
Prepared by Office of Data Management,Reports and AnalysisFebruary 28, 2018
Department Of Child Services BRSSP Service Report by RegionFrom Month: July 2016 To July 2017This report is under development. The numbers are still being verified for accuracy
Case Count
Service Provider DCS Probation Cases
Grand Total
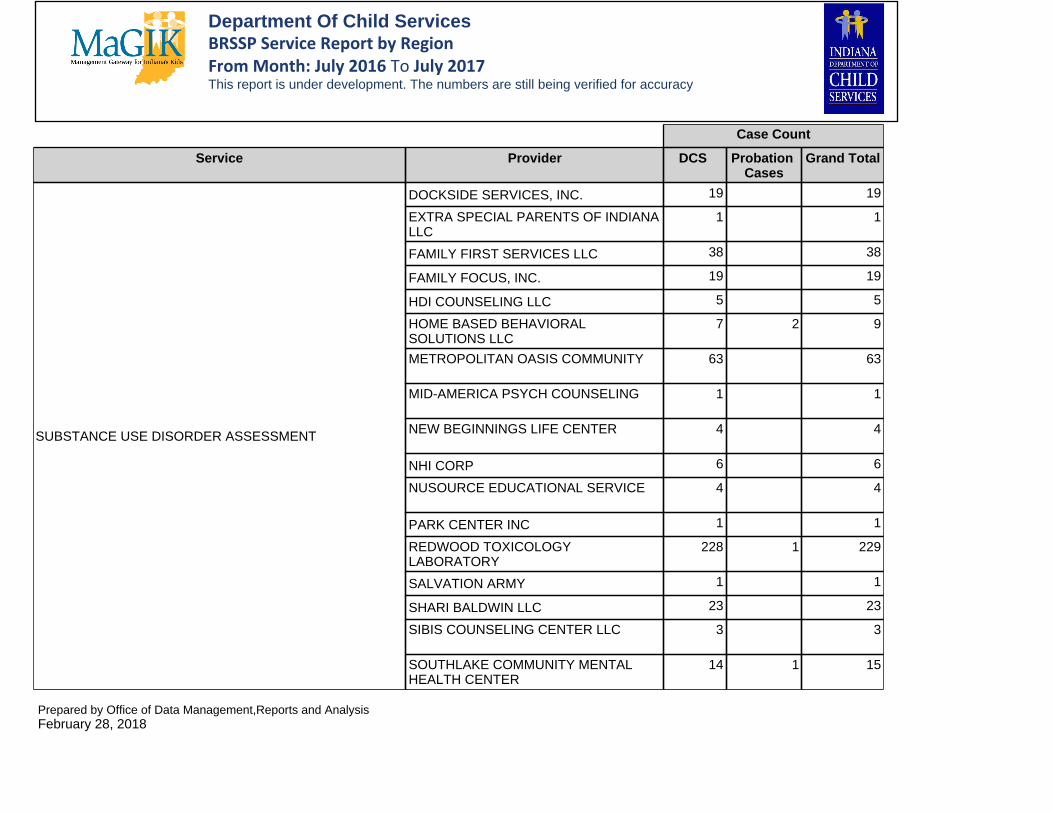
SUBSTANCE USE DISORDER ASSESSMENT
DOCKSIDE SERVICES, INC. 19 19
EXTRA SPECIAL PARENTS OF INDIANA LLC
1 1
FAMILY FIRST SERVICES LLC 38 38
FAMILY FOCUS, INC. 19 19
HDI COUNSELING LLC 5 5
HOME BASED BEHAVIORAL SOLUTIONS LLC
7 2 9
METROPOLITAN OASIS COMMUNITY
63 63
MID-AMERICA PSYCH COUNSELING
1 1
NEW BEGINNINGS LIFE CENTER
4 4
NHI CORP 6 6
NUSOURCE EDUCATIONAL SERVICE
4 4
PARK CENTER INC 1 1
REDWOOD TOXICOLOGY LABORATORY
228 1 229
SALVATION ARMY 1 1
SHARI BALDWIN LLC 23 23
SIBIS COUNSELING CENTER LLC
3 3
SOUTHLAKE COMMUNITY MENTAL HEALTH CENTER
14 1 15
Prepared by Office of Data Management,Reports and AnalysisFebruary 28, 2018
Department Of Child Services BRSSP Service Report by RegionFrom Month: July 2016 To July 2017This report is under development. The numbers are still being verified for accuracy

Case Count
Service Provider DCS Probation Cases
Grand Total
SUBSTANCE USE DISORDER ASSESSMENT
TARA TREATMENT CENTER INC
2 2
TEENS IN ACTION INC 7 7
THE CARING CORNER LLC 16 16
THE OTIS R BOWEN CENTER FOR HUMAN SERVIC
1 1
SUBSTANCE USE OUTPATIENT TREATMENT
APOSTOLIC YOUTH & FAMILY SERV.
30 30
CAPITOL CITY FAMILY AND EDUCATION SVCS
21 21
CHOICES COUNSELING SERVICE PC
1 1
CROWN COUNSELING 2 2
DOCKSIDE SERVICES, INC. 18 1 19
FAMILY FIRST SERVICES LLC 4 4
HDI COUNSELING LLC 6 6
KEY COUNSELING INC 1 1
METROPOLITAN OASIS COMMUNITY
67 67
MID-AMERICA PSYCH COUNSELING
1 1
NHI CORP 8 8
NUSOURCE EDUCATIONAL SERVICE
3 3
PARK CENTER INC 3 3
Prepared by Office of Data Management,Reports and AnalysisFebruary 28, 2018
Department Of Child Services BRSSP Service Report by RegionFrom Month: July 2016 To July 2017This report is under development. The numbers are still being verified for accuracy
Case Count
Service Provider DCS Probation Cases
Grand Total
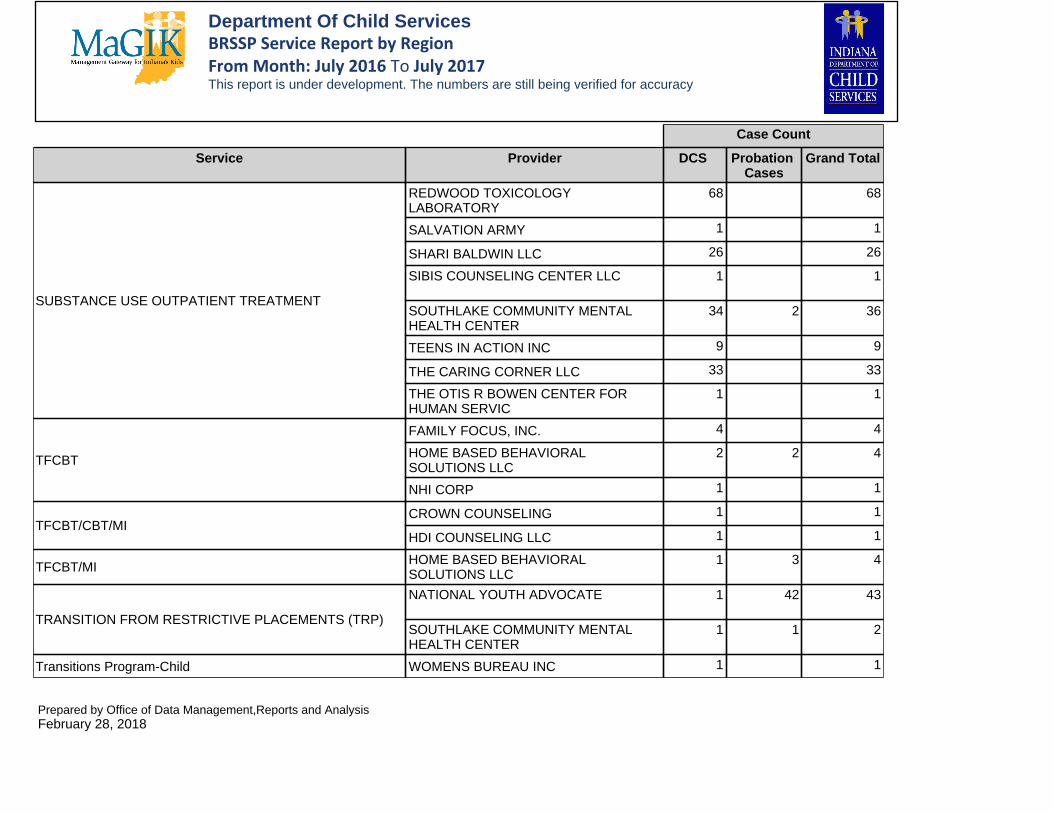
SUBSTANCE USE OUTPATIENT TREATMENT
REDWOOD TOXICOLOGY LABORATORY
68 68
SALVATION ARMY 1 1
SHARI BALDWIN LLC 26 26
SIBIS COUNSELING CENTER LLC
1 1
SOUTHLAKE COMMUNITY MENTAL HEALTH CENTER
34 2 36
TEENS IN ACTION INC 9 9
THE CARING CORNER LLC 33 33
THE OTIS R BOWEN CENTER FOR HUMAN SERVIC
1 1
TFCBT
FAMILY FOCUS, INC. 4 4
HOME BASED BEHAVIORAL SOLUTIONS LLC
2 2 4
NHI CORP 1 1
TFCBT/CBT/MICROWN COUNSELING 1 1
HDI COUNSELING LLC 1 1
TFCBT/MI HOME BASED BEHAVIORAL SOLUTIONS LLC
1 3 4
TRANSITION FROM RESTRICTIVE PLACEMENTS (TRP)
NATIONAL YOUTH ADVOCATE
1 42 43
SOUTHLAKE COMMUNITY MENTAL HEALTH CENTER
1 1 2
Transitions Program-Child WOMENS BUREAU INC 1 1
Prepared by Office of Data Management,Reports and AnalysisFebruary 28, 2018
Department Of Child Services BRSSP Service Report by RegionFrom Month: July 2016 To July 2017This report is under development. The numbers are still being verified for accuracy

Case Count
Service Provider DCS Probation Cases
Grand Total
Transitions Program-Women WOMENS BUREAU INC 17 17
TRUANCY TERMINATION PROJECT REBUILD FOUNDATION
1 1
TUTORING/LITERACY CLASSES
1 TO 1 TUTORING 34 34
ACADEMICALLY YOURS LLC 37 37
CHOICES COUNSELING SERVICE PC
11 11
ECLECTIC SOUL VOICES CORP
1 1
GROWING MINDS EDUCATIONAL SERVICES LLC
2 2
HOME BASED BEHAVIORAL SOLUTIONS LLC
23 2 25
KEY COUNSELING INC 4 4
PROMISING FUTURES INC 2 2
RISING STARS ACADEMY LLC 34 34
VISITATION FACILITATION-PARENT/CHILD/SIBLING
APOSTOLIC YOUTH & FAMILY SERV.
57 57
CAPITOL CITY FAMILY AND EDUCATION SVCS
6 6
CHILDRENS TREE HOUSE INC 1 1
CROWN COUNSELING 86 86
DOCKSIDE SERVICES, INC. 28 28
FAMILY ADVOCATES INC 1 1
FAMILY FIRST SERVICES LLC 3 3
Prepared by Office of Data Management,Reports and AnalysisFebruary 28, 2018
Department Of Child Services BRSSP Service Report by RegionFrom Month: July 2016 To July 2017This report is under development. The numbers are still being verified for accuracy
Case Count
Service Provider DCS Probation Cases
Grand Total
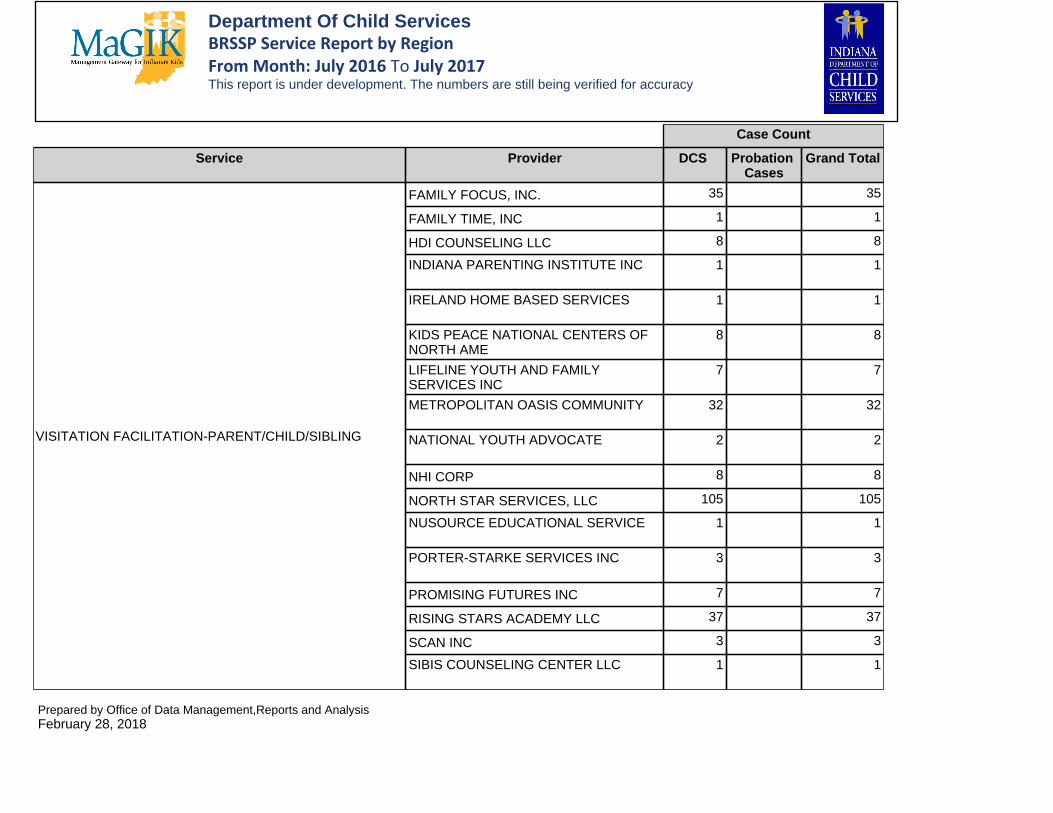
VISITATION FACILITATION-PARENT/CHILD/SIBLING
FAMILY FOCUS, INC. 35 35
FAMILY TIME, INC 1 1
HDI COUNSELING LLC 8 8
INDIANA PARENTING INSTITUTE INC
1 1
IRELAND HOME BASED SERVICES
1 1
KIDS PEACE NATIONAL CENTERS OF NORTH AME
8 8
LIFELINE YOUTH AND FAMILY SERVICES INC
7 7
METROPOLITAN OASIS COMMUNITY
32 32
NATIONAL YOUTH ADVOCATE
2 2
NHI CORP 8 8
NORTH STAR SERVICES, LLC 105 105
NUSOURCE EDUCATIONAL SERVICE
1 1
PORTER-STARKE SERVICES INC
3 3
PROMISING FUTURES INC 7 7
RISING STARS ACADEMY LLC 37 37
SCAN INC 3 3
SIBIS COUNSELING CENTER LLC
1 1
Prepared by Office of Data Management,Reports and AnalysisFebruary 28, 2018
Department Of Child Services BRSSP Service Report by RegionFrom Month: July 2016 To July 2017This report is under development. The numbers are still being verified for accuracy

UAT Report
Report Description
Case Count
Service Provider DCS Probation Cases
Grand Total
VISITATION FACILITATION-PARENT/CHILD/SIBLING
SOUTHLAKE COMMUNITY MENTAL HEALTH CENTER
11 11
TEENS IN ACTION INC 4 4
THE CARING CORNER LLC 31 31
Prepared by Office of Data Management,Reports and AnalysisFebruary 28, 2018
Department Of Child Services BRSSP Service Report by RegionFrom Month: July 2016 To July 2017This report is under development. The numbers are still being verified for accuracy
Appendix A – Service Array
Fiscal Data
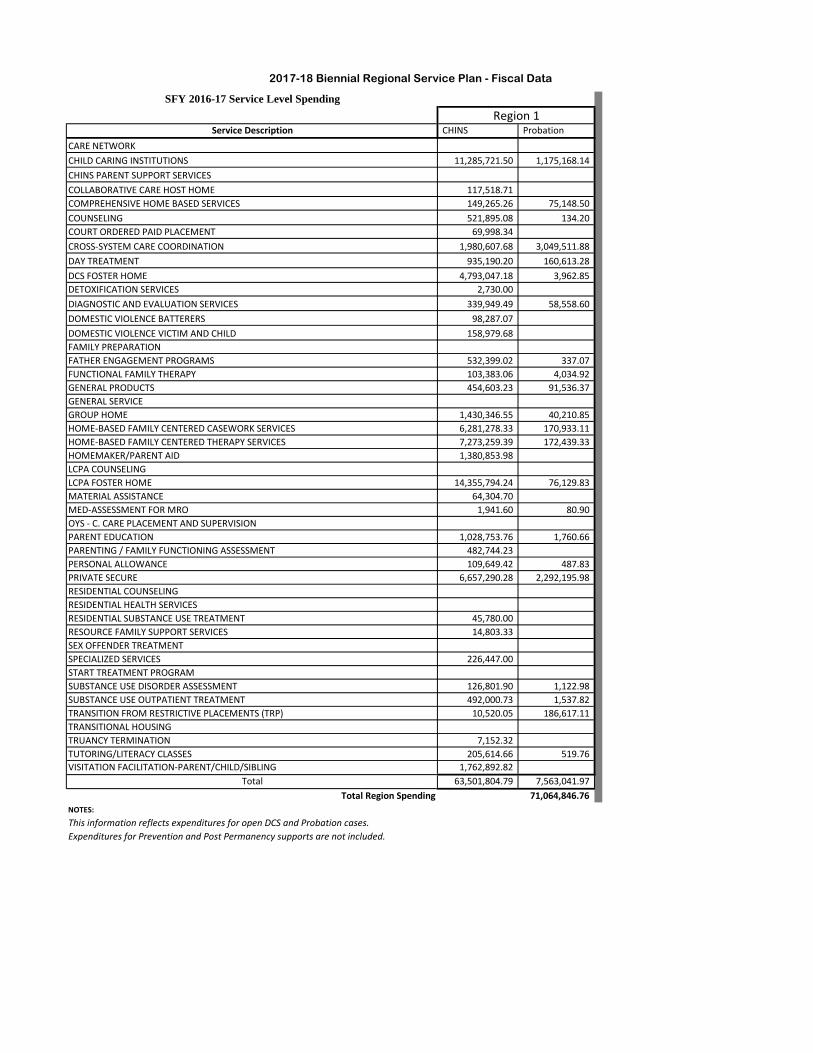
SFY 2016-17 Service Level Spending
Service Description CHINS ProbationCARE NETWORKCHILD CARING INSTITUTIONS 11,285,721.50 1,175,168.14 CHINS PARENT SUPPORT SERVICESCOLLABORATIVE CARE HOST HOME 117,518.71 COMPREHENSIVE HOME BASED SERVICES 149,265.26 75,148.50 COUNSELING 521,895.08 134.20 COURT ORDERED PAID PLACEMENT 69,998.34 CROSS-SYSTEM CARE COORDINATION 1,980,607.68 3,049,511.88 DAY TREATMENT 935,190.20 160,613.28 DCS FOSTER HOME 4,793,047.18 3,962.85 DETOXIFICATION SERVICES 2,730.00 DIAGNOSTIC AND EVALUATION SERVICES 339,949.49 58,558.60 DOMESTIC VIOLENCE BATTERERS 98,287.07 DOMESTIC VIOLENCE VICTIM AND CHILD 158,979.68 FAMILY PREPARATIONFATHER ENGAGEMENT PROGRAMS 532,399.02 337.07 FUNCTIONAL FAMILY THERAPY 103,383.06 4,034.92 GENERAL PRODUCTS 454,603.23 91,536.37 GENERAL SERVICEGROUP HOME 1,430,346.55 40,210.85 HOME-BASED FAMILY CENTERED CASEWORK SERVICES 6,281,278.33 170,933.11 HOME-BASED FAMILY CENTERED THERAPY SERVICES 7,273,259.39 172,439.33 HOMEMAKER/PARENT AID 1,380,853.98 LCPA COUNSELING LCPA FOSTER HOME 14,355,794.24 76,129.83 MATERIAL ASSISTANCE 64,304.70 MED-ASSESSMENT FOR MRO 1,941.60 80.90 OYS - C. CARE PLACEMENT AND SUPERVISIONPARENT EDUCATION 1,028,753.76 1,760.66 PARENTING / FAMILY FUNCTIONING ASSESSMENT 482,744.23 PERSONAL ALLOWANCE 109,649.42 487.83 PRIVATE SECURE 6,657,290.28 2,292,195.98 RESIDENTIAL COUNSELINGRESIDENTIAL HEALTH SERVICESRESIDENTIAL SUBSTANCE USE TREATMENT 45,780.00 RESOURCE FAMILY SUPPORT SERVICES 14,803.33 SEX OFFENDER TREATMENTSPECIALIZED SERVICES 226,447.00 START TREATMENT PROGRAMSUBSTANCE USE DISORDER ASSESSMENT 126,801.90 1,122.98 SUBSTANCE USE OUTPATIENT TREATMENT 492,000.73 1,537.82 TRANSITION FROM RESTRICTIVE PLACEMENTS (TRP) 10,520.05 186,617.11 TRANSITIONAL HOUSINGTRUANCY TERMINATION 7,152.32 TUTORING/LITERACY CLASSES 205,614.66 519.76 VISITATION FACILITATION-PARENT/CHILD/SIBLING 1,762,892.82
Total 63,501,804.79 7,563,041.97 Total Region Spending 71,064,846.76
NOTES:
This information reflects expenditures for open DCS and Probation cases. Expenditures for Prevention and Post Permanency supports are not included.
2017-18 Biennial Regional Service Plan - Fiscal Data
Region 1
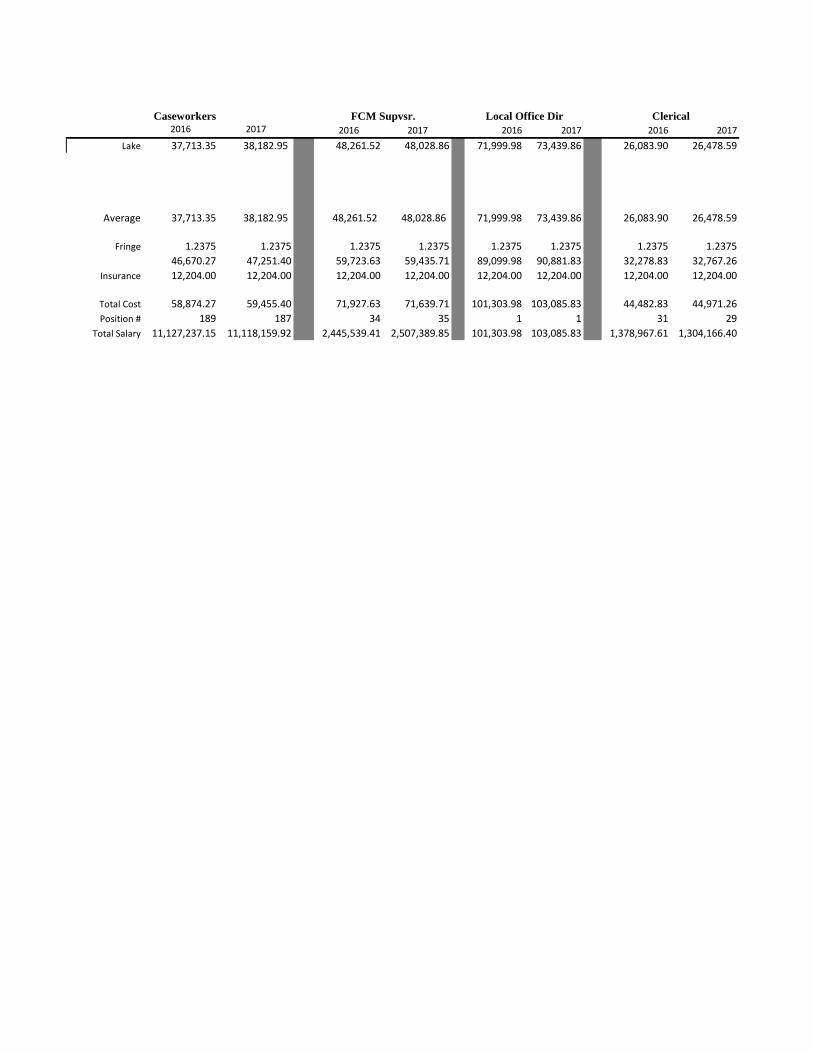
Caseworkers2016 2017 2016 2017 2016 2017 2016 2017
Lake 37,713.35 38,182.95 48,261.52 48,028.86 71,999.98 73,439.86 26,083.90 26,478.59
Average 37,713.35 38,182.95 48,261.52 48,028.86 71,999.98 73,439.86 26,083.90 26,478.59
Fringe 1.2375 1.2375 1.2375 1.2375 1.2375 1.2375 1.2375 1.237546,670.27 47,251.40 59,723.63 59,435.71 89,099.98 90,881.83 32,278.83 32,767.26
Insurance 12,204.00 12,204.00 12,204.00 12,204.00 12,204.00 12,204.00 12,204.00 12,204.00
Total Cost 58,874.27 59,455.40 71,927.63 71,639.71 101,303.98 103,085.83 44,482.83 44,971.26Position # 189 187 34 35 1 1 31 29
Total Salary 11,127,237.15 11,118,159.92 2,445,539.41 2,507,389.85 101,303.98 103,085.83 1,378,967.61 1,304,166.40
Clerical
FCM Supvsr. Local Office Dir
Appendix B – Needs Assessment Survey Results
FCM Survey Results
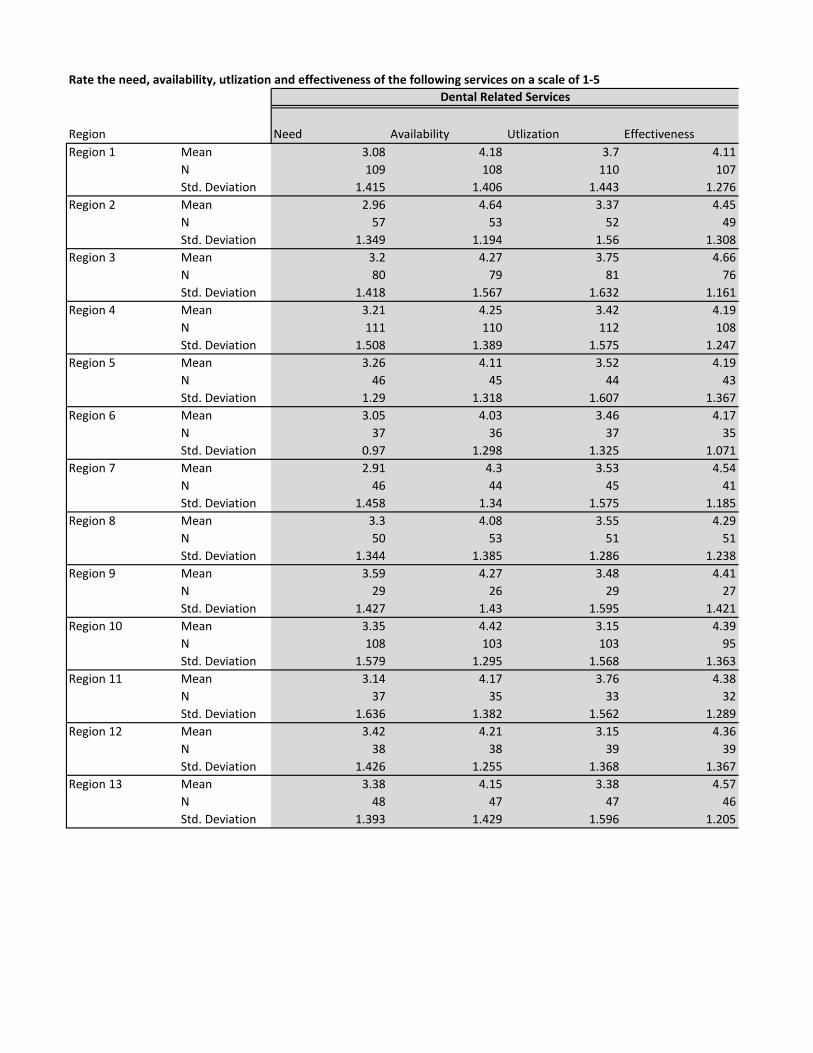
Region Need Availability Utlization EffectivenessRegion 1 Mean 3.08 4.18 3.7 4.11
N 109 108 110 107Std. Deviation 1.415 1.406 1.443 1.276
Region 2 Mean 2.96 4.64 3.37 4.45N 57 53 52 49Std. Deviation 1.349 1.194 1.56 1.308
Region 3 Mean 3.2 4.27 3.75 4.66N 80 79 81 76Std. Deviation 1.418 1.567 1.632 1.161
Region 4 Mean 3.21 4.25 3.42 4.19N 111 110 112 108Std. Deviation 1.508 1.389 1.575 1.247
Region 5 Mean 3.26 4.11 3.52 4.19N 46 45 44 43Std. Deviation 1.29 1.318 1.607 1.367
Region 6 Mean 3.05 4.03 3.46 4.17N 37 36 37 35Std. Deviation 0.97 1.298 1.325 1.071
Region 7 Mean 2.91 4.3 3.53 4.54N 46 44 45 41Std. Deviation 1.458 1.34 1.575 1.185
Region 8 Mean 3.3 4.08 3.55 4.29N 50 53 51 51Std. Deviation 1.344 1.385 1.286 1.238
Region 9 Mean 3.59 4.27 3.48 4.41N 29 26 29 27Std. Deviation 1.427 1.43 1.595 1.421
Region 10 Mean 3.35 4.42 3.15 4.39N 108 103 103 95Std. Deviation 1.579 1.295 1.568 1.363
Region 11 Mean 3.14 4.17 3.76 4.38N 37 35 33 32Std. Deviation 1.636 1.382 1.562 1.289
Region 12 Mean 3.42 4.21 3.15 4.36N 38 38 39 39Std. Deviation 1.426 1.255 1.368 1.367
Region 13 Mean 3.38 4.15 3.38 4.57N 48 47 47 46Std. Deviation 1.393 1.429 1.596 1.205
Rate the need, availability, utlization and effectiveness of the following services on a scale of 1-5Dental Related Services
Region Need Availability Utlization Effectiveness
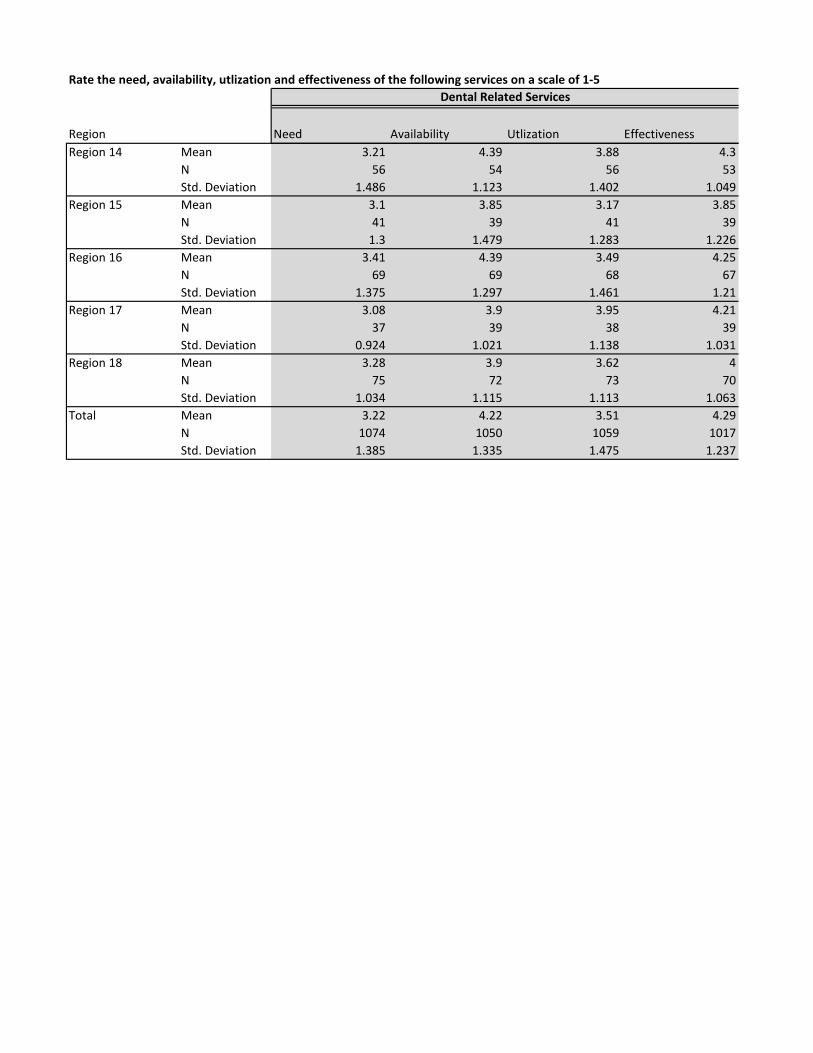
Rate the need, availability, utlization and effectiveness of the following services on a scale of 1-5Dental Related Services
Region 14 Mean 3.21 4.39 3.88 4.3N 56 54 56 53Std. Deviation 1.486 1.123 1.402 1.049
Region 15 Mean 3.1 3.85 3.17 3.85N 41 39 41 39Std. Deviation 1.3 1.479 1.283 1.226
Region 16 Mean 3.41 4.39 3.49 4.25N 69 69 68 67Std. Deviation 1.375 1.297 1.461 1.21
Region 17 Mean 3.08 3.9 3.95 4.21N 37 39 38 39Std. Deviation 0.924 1.021 1.138 1.031
Region 18 Mean 3.28 3.9 3.62 4N 75 72 73 70Std. Deviation 1.034 1.115 1.113 1.063
Total Mean 3.22 4.22 3.51 4.29N 1074 1050 1059 1017Std. Deviation 1.385 1.335 1.475 1.237

RegionRegion 1 Mean
NStd. Deviation
Region 2 MeanNStd. Deviation
Region 3 MeanNStd. Deviation
Region 4 MeanNStd. Deviation
Region 5 MeanNStd. Deviation
Region 6 MeanNStd. Deviation
Region 7 MeanNStd. Deviation
Region 8 MeanNStd. Deviation
Region 9 MeanNStd. Deviation
Region 10 MeanNStd. Deviation
Region 11 MeanNStd. Deviation
Region 12 MeanNStd. Deviation
Region 13 MeanNStd. Deviation
Rate the need, availability, utlization
Need Availability Utlization Effectiveness3.89 4.42 4.15 3.96108 109 109 108
1.202 0.906 1.061 1.0043.73 4.34 3.85 4.02
56 56 52 501.036 0.815 0.998 1.059
3.99 4.38 4.06 3.8881 80 80 77
1.09 0.96 1.023 1.0513.8 4.36 3.88 3.96
112 109 112 1091.222 0.928 1.041 0.86
4.02 4.33 4 3.947 46 44 42
1.073 0.871 1.012 0.9833.81 4.08 3.86 4.03
37 36 37 360.967 0.874 1.032 0.81
3.7 4.25 3.75 4.146 44 44 41
1.348 1.102 1.314 1.2214.12 4.23 4.08 3.86
50 53 51 510.982 0.869 0.956 1
4.36 4.59 4.1 4.1928 27 29 27
0.951 0.797 1.113 1.0013.93 4.39 3.78 4.22108 104 104 96
1.28 0.98 1.351 1.1633.76 4 3.91 3.91
38 35 32 321.364 1.138 1.146 1.146
4.16 4.5 3.62 4.0338 38 39 39
1.103 0.726 0.963 1.0633.96 4.4 3.77 4.11
48 47 47 461.202 0.925 1.306 1.1
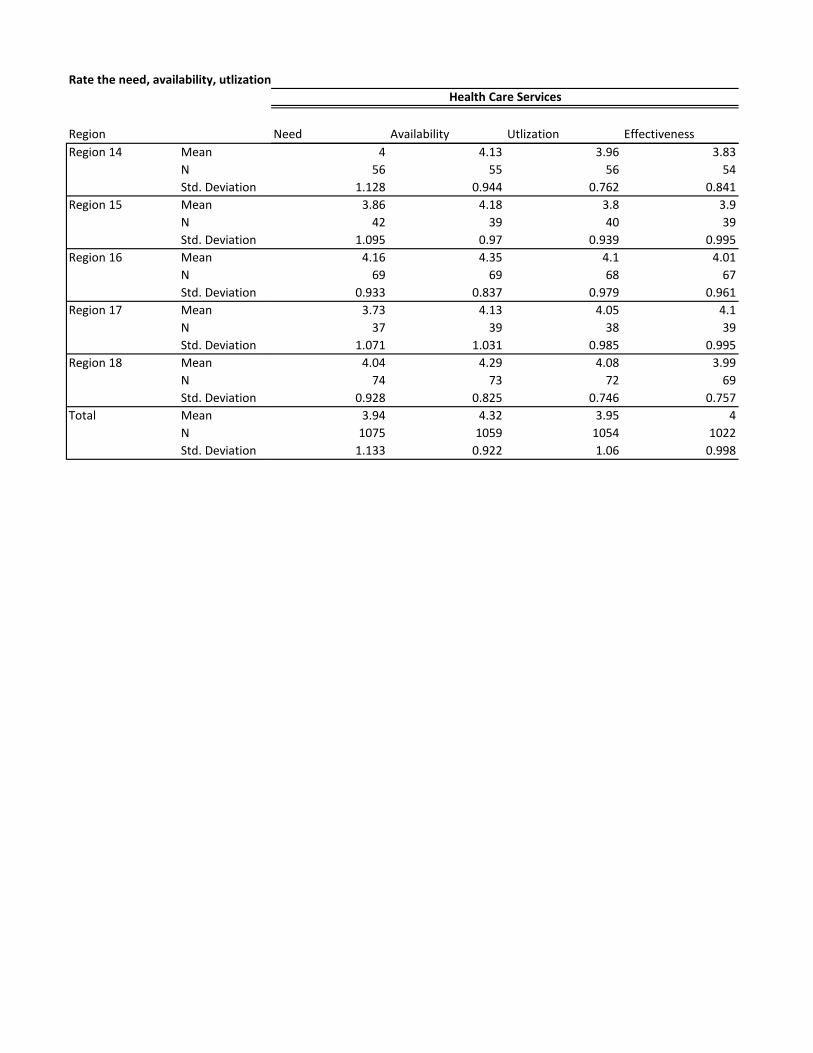
Health Care Services
Region
Rate the need, availability, utlization
Region 14 MeanNStd. Deviation
Region 15 MeanNStd. Deviation
Region 16 MeanNStd. Deviation
Region 17 MeanNStd. Deviation
Region 18 MeanNStd. Deviation
Total MeanNStd. Deviation
Need Availability Utlization Effectiveness
Health Care Services
4 4.13 3.96 3.8356 55 56 54
1.128 0.944 0.762 0.8413.86 4.18 3.8 3.9
42 39 40 391.095 0.97 0.939 0.995
4.16 4.35 4.1 4.0169 69 68 67
0.933 0.837 0.979 0.9613.73 4.13 4.05 4.1
37 39 38 391.071 1.031 0.985 0.995
4.04 4.29 4.08 3.9974 73 72 69
0.928 0.825 0.746 0.7573.94 4.32 3.95 4
1075 1059 1054 10221.133 0.922 1.06 0.998

RegionRegion 1 Mean
NStd. Deviation
Region 2 MeanNStd. Deviation
Region 3 MeanNStd. Deviation
Region 4 MeanNStd. Deviation
Region 5 MeanNStd. Deviation
Region 6 MeanNStd. Deviation
Region 7 MeanNStd. Deviation
Region 8 MeanNStd. Deviation
Region 9 MeanNStd. Deviation
Region 10 MeanNStd. Deviation
Region 11 MeanNStd. Deviation
Region 12 MeanNStd. Deviation
Region 13 MeanNStd. Deviation
Rate the need, availability, utlization
Need Availability Utlization Effectiveness4.11 4.25 4.09 3.53108 110 109 108
0.96 0.979 0.938 13.96 3.79 3.9 3.28
56 56 52 500.785 0.967 0.869 0.834
4.19 4.13 4.19 3.5581 79 80 78
0.726 0.868 0.731 1.0524 4.23 3.93 3.33
113 109 112 1090.866 0.878 0.846 0.933
4.36 3.39 4.23 3.2447 46 43 42
0.64 0.802 0.841 0.9584.03 3.7 3.95 3.19
38 37 37 360.636 0.909 0.705 0.92
3.91 3.64 3.8 3.4946 45 44 41
1.05 1.069 1.047 1.0754.3 3.72 3.96 3.1850 53 51 51
0.735 0.928 0.799 1.0144.21 4.3 4.21 3.19
28 27 29 270.686 0.775 0.861 1.178
4.1 3.75 4.01 3.59108 106 103 97
1.004 1.122 1.062 1.1974.08 3.58 3.94 3.28
38 36 32 320.912 1.079 0.914 0.991
4.24 4.11 3.74 3.4638 38 39 39
0.82 0.894 0.85 1.0974.25 3.81 3.98 3.36
48 48 47 470.729 0.938 0.989 0.987
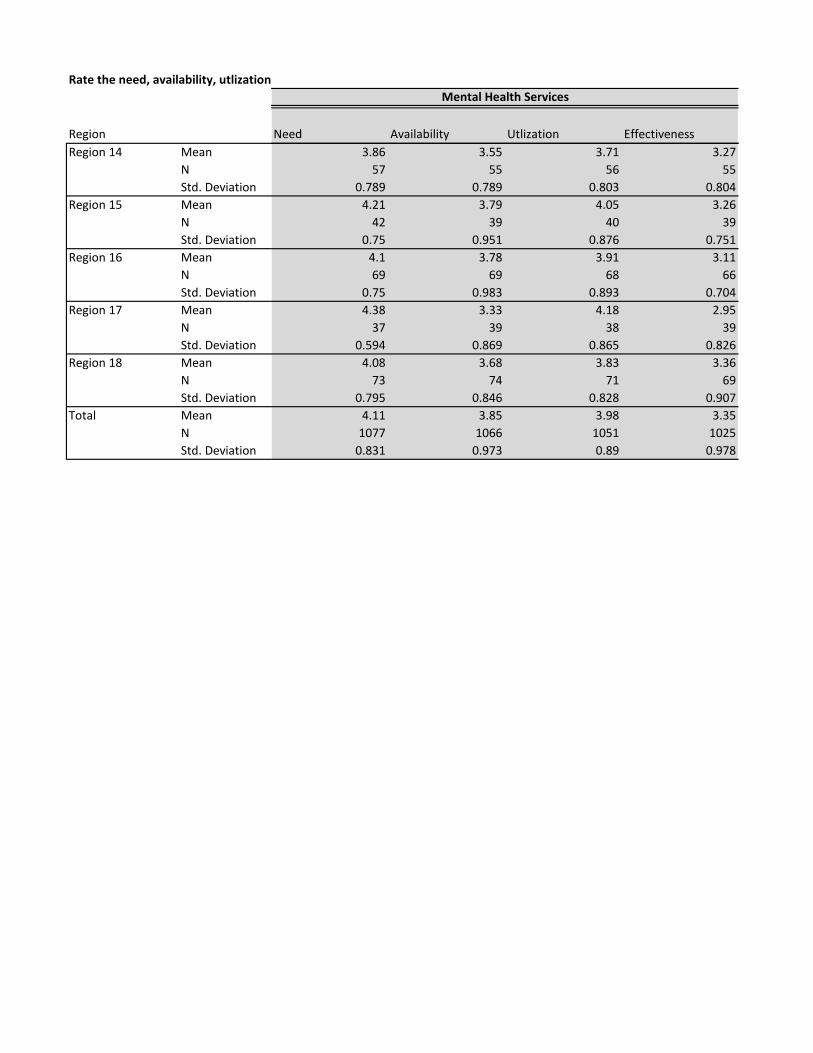
Mental Health Services
Region
Rate the need, availability, utlization
Region 14 MeanNStd. Deviation
Region 15 MeanNStd. Deviation
Region 16 MeanNStd. Deviation
Region 17 MeanNStd. Deviation
Region 18 MeanNStd. Deviation
Total MeanNStd. Deviation
Need Availability Utlization Effectiveness
Mental Health Services
3.86 3.55 3.71 3.2757 55 56 55
0.789 0.789 0.803 0.8044.21 3.79 4.05 3.26
42 39 40 390.75 0.951 0.876 0.751
4.1 3.78 3.91 3.1169 69 68 66
0.75 0.983 0.893 0.7044.38 3.33 4.18 2.95
37 39 38 390.594 0.869 0.865 0.826
4.08 3.68 3.83 3.3673 74 71 69
0.795 0.846 0.828 0.9074.11 3.85 3.98 3.35
1077 1066 1051 10250.831 0.973 0.89 0.978
RegionRegion 1 Mean
NStd. Deviation
Region 2 MeanNStd. Deviation
Region 3 MeanNStd. Deviation
Region 4 MeanNStd. Deviation
Region 5 MeanNStd. Deviation
Region 6 MeanNStd. Deviation
Region 7 MeanNStd. Deviation
Region 8 MeanNStd. Deviation
Region 9 MeanNStd. Deviation
Region 10 MeanNStd. Deviation
Region 11 MeanNStd. Deviation
Region 12 MeanNStd. Deviation
Region 13 MeanNStd. Deviation
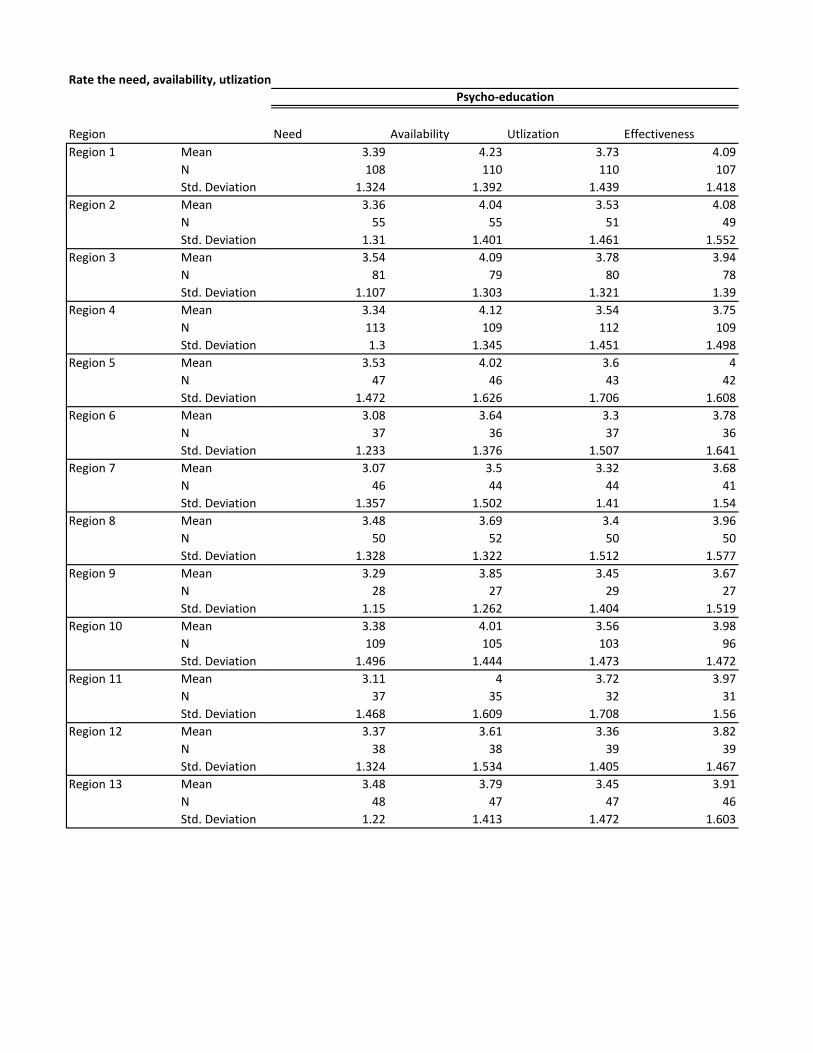
Rate the need, availability, utlization
Need Availability Utlization Effectiveness3.39 4.23 3.73 4.09108 110 110 107
1.324 1.392 1.439 1.4183.36 4.04 3.53 4.08
55 55 51 491.31 1.401 1.461 1.5523.54 4.09 3.78 3.94
81 79 80 781.107 1.303 1.321 1.39
3.34 4.12 3.54 3.75113 109 112 1091.3 1.345 1.451 1.498
3.53 4.02 3.6 447 46 43 42
1.472 1.626 1.706 1.6083.08 3.64 3.3 3.78
37 36 37 361.233 1.376 1.507 1.641
3.07 3.5 3.32 3.6846 44 44 41
1.357 1.502 1.41 1.543.48 3.69 3.4 3.96
50 52 50 501.328 1.322 1.512 1.577
3.29 3.85 3.45 3.6728 27 29 27
1.15 1.262 1.404 1.5193.38 4.01 3.56 3.98109 105 103 96
1.496 1.444 1.473 1.4723.11 4 3.72 3.97
37 35 32 311.468 1.609 1.708 1.56
3.37 3.61 3.36 3.8238 38 39 39
1.324 1.534 1.405 1.4673.48 3.79 3.45 3.91
48 47 47 461.22 1.413 1.472 1.603
Psycho-education
Region
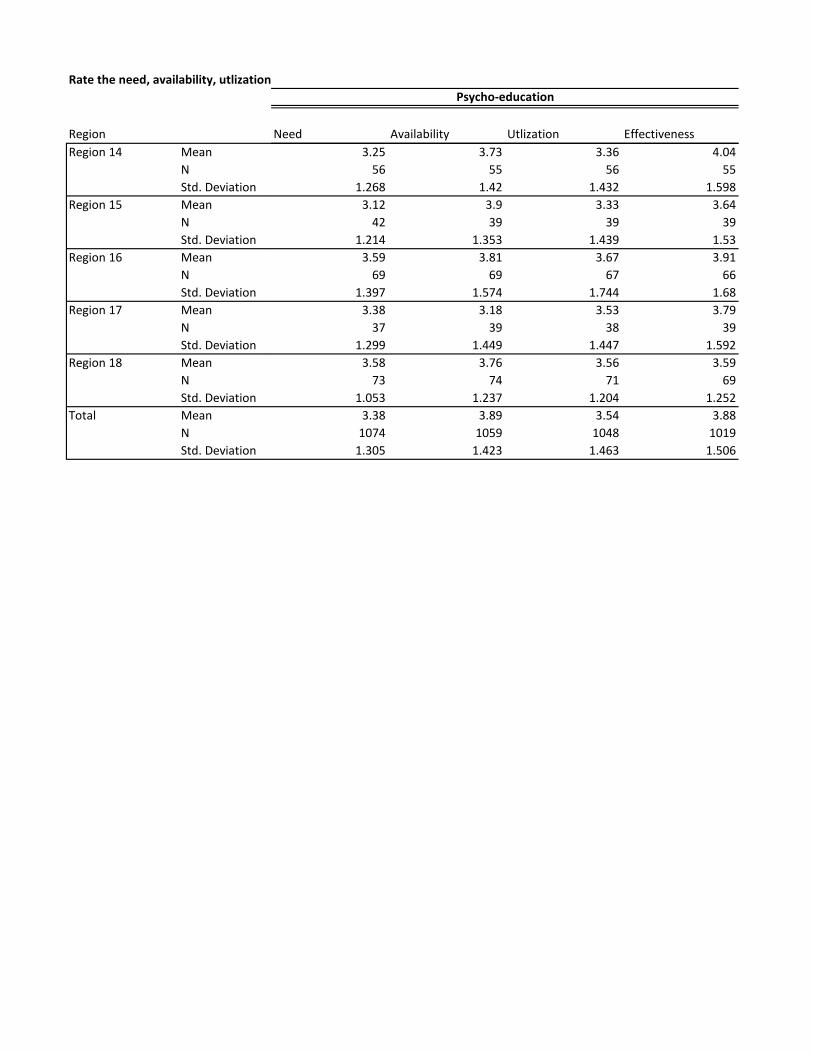
Rate the need, availability, utlization
Region 14 MeanNStd. Deviation
Region 15 MeanNStd. Deviation
Region 16 MeanNStd. Deviation
Region 17 MeanNStd. Deviation
Region 18 MeanNStd. Deviation
Total MeanNStd. Deviation
Need Availability Utlization Effectiveness
Psycho-education
3.25 3.73 3.36 4.0456 55 56 55
1.268 1.42 1.432 1.5983.12 3.9 3.33 3.64
42 39 39 391.214 1.353 1.439 1.53
3.59 3.81 3.67 3.9169 69 67 66
1.397 1.574 1.744 1.683.38 3.18 3.53 3.79
37 39 38 391.299 1.449 1.447 1.592
3.58 3.76 3.56 3.5973 74 71 69
1.053 1.237 1.204 1.2523.38 3.89 3.54 3.88
1074 1059 1048 10191.305 1.423 1.463 1.506
RegionRegion 1 Mean
NStd. Deviation
Region 2 MeanNStd. Deviation
Region 3 MeanNStd. Deviation
Region 4 MeanNStd. Deviation
Region 5 MeanNStd. Deviation
Region 6 MeanNStd. Deviation
Region 7 MeanNStd. Deviation
Region 8 MeanNStd. Deviation
Region 9 MeanNStd. Deviation
Region 10 MeanNStd. Deviation
Region 11 MeanNStd. Deviation
Region 12 MeanNStd. Deviation
Region 13 MeanNStd. Deviation
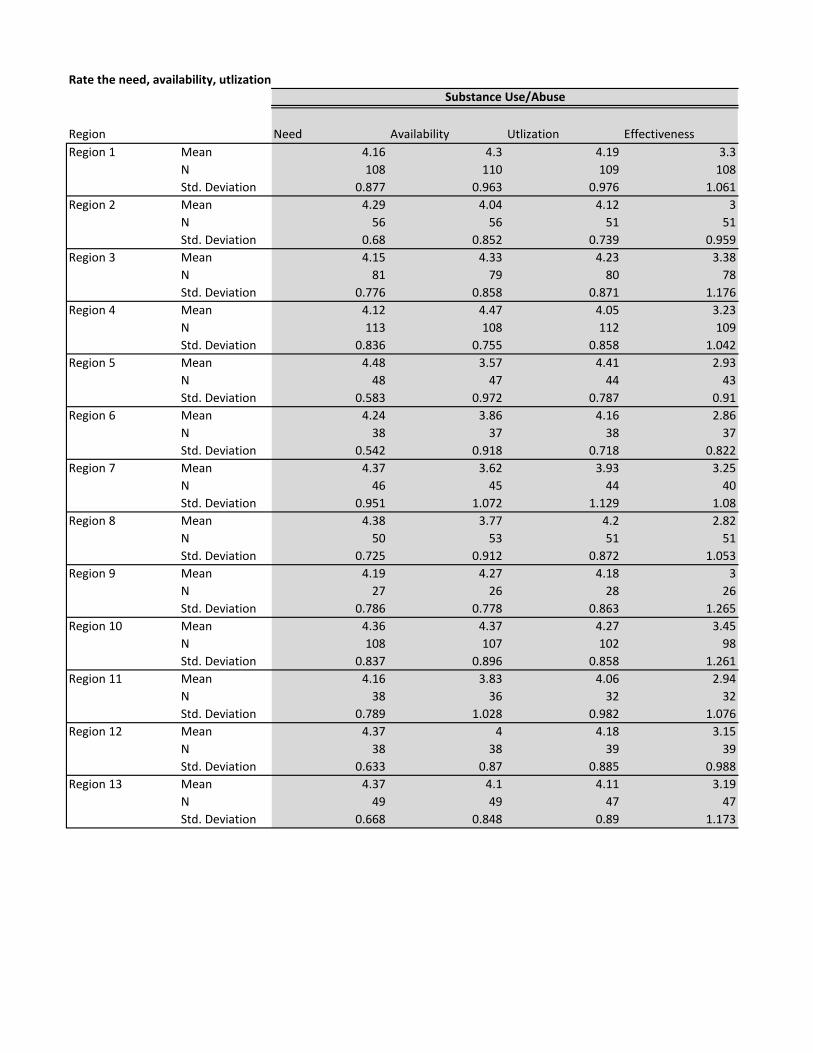
Rate the need, availability, utlization
Need Availability Utlization Effectiveness4.16 4.3 4.19 3.3108 110 109 108
0.877 0.963 0.976 1.0614.29 4.04 4.12 3
56 56 51 510.68 0.852 0.739 0.9594.15 4.33 4.23 3.38
81 79 80 780.776 0.858 0.871 1.176
4.12 4.47 4.05 3.23113 108 112 109
0.836 0.755 0.858 1.0424.48 3.57 4.41 2.93
48 47 44 430.583 0.972 0.787 0.91
4.24 3.86 4.16 2.8638 37 38 37
0.542 0.918 0.718 0.8224.37 3.62 3.93 3.25
46 45 44 400.951 1.072 1.129 1.08
4.38 3.77 4.2 2.8250 53 51 51
0.725 0.912 0.872 1.0534.19 4.27 4.18 3
27 26 28 260.786 0.778 0.863 1.265
4.36 4.37 4.27 3.45108 107 102 98
0.837 0.896 0.858 1.2614.16 3.83 4.06 2.94
38 36 32 320.789 1.028 0.982 1.076
4.37 4 4.18 3.1538 38 39 39
0.633 0.87 0.885 0.9884.37 4.1 4.11 3.19
49 49 47 470.668 0.848 0.89 1.173
Substance Use/Abuse

Region
Rate the need, availability, utlization
Region 14 MeanNStd. Deviation
Region 15 MeanNStd. Deviation
Region 16 MeanNStd. Deviation
Region 17 MeanNStd. Deviation
Region 18 MeanNStd. Deviation
Total MeanNStd. Deviation
Need Availability Utlization Effectiveness
Substance Use/Abuse
4.33 3.96 3.93 2.8957 55 56 55
0.607 0.793 0.735 0.7374.24 4.13 4.23 3.23
42 39 39 390.932 0.951 0.902 0.81
4.45 4.22 4.24 3.0269 69 67 66
0.654 0.872 0.799 0.7124.24 3.51 4.18 2.79
37 39 38 390.641 0.914 0.896 1.005
4.27 3.67 3.91 3.0974 72 70 69
0.708 0.769 0.944 1.0814.28 4.07 4.14 3.14
1079 1065 1047 10270.763 0.927 0.881 1.048

RegionRegion 1 Mean
NStd. Deviation
Region 2 MeanNStd. Deviation
Region 3 MeanNStd. Deviation
Region 4 MeanNStd. Deviation
Region 5 MeanNStd. Deviation
Region 6 MeanNStd. Deviation
Region 7 MeanNStd. Deviation
Region 8 MeanNStd. Deviation
Region 9 MeanNStd. Deviation
Region 10 MeanNStd. Deviation
Region 11 MeanNStd. Deviation
Region 12 MeanNStd. Deviation
Region 13 MeanNStd. Deviation
Rate the need, availability, utlization
Need Availability Utlization Effectiveness4.02 3.62 3.53 3.7109 108 109 103
1.045 1.351 1.337 1.3353.58 3.53 3.26 3.66
55 55 50 500.937 1.136 1.322 1.437
3.68 3.65 3.3 3.6480 78 77 75
1.167 1.385 1.278 1.533.81 3.63 3.39 3.57111 108 110 107
1.091 1.265 1.335 1.4083.83 3.38 3.56 3.52
46 45 43 421.102 1.23 1.351 1.366
3.95 3.22 3.19 3.2837 36 37 36
0.941 1.098 1.101 1.213.51 3.58 3.38 3.57
45 43 45 421.254 1.139 1.23 1.272
3.86 3.44 3.33 3.4651 52 49 50
0.96 1.037 1.049 1.1993.71 3.85 3.57 3.92
28 26 28 261.049 1.156 1.168 1.262
3.9 3.76 3.5 4.04103 101 101 96
1.089 1.394 1.467 1.4653.39 3.7 3.39 3.29
36 33 33 311.128 1.287 1.321 1.296
3.77 3.58 3.13 3.5939 38 38 37
0.872 1.348 1.189 1.3013.98 3.53 3.31 3.64
49 49 48 471.108 1.356 1.49 1.524
Employment/Training Services

Region
Rate the need, availability, utlization
Region 14 MeanNStd. Deviation
Region 15 MeanNStd. Deviation
Region 16 MeanNStd. Deviation
Region 17 MeanNStd. Deviation
Region 18 MeanNStd. Deviation
Total MeanNStd. Deviation
Need Availability Utlization Effectiveness
Employment/Training Services
3.7 3.22 3.38 3.456 55 56 55
0.711 0.917 1.019 1.2713.95 3.5 3.45 3.63
41 40 40 380.973 1.062 1.061 1.076
3.8 3.57 3.4 3.2469 69 67 66
0.884 0.947 1.016 1.0534.03 3.13 3.47 3.51
38 38 36 370.972 1.143 1.341 1.484
3.85 3.22 3.23 3.3474 72 71 67
0.855 0.967 0.959 1.0673.81 3.53 3.38 3.58
1067 1046 1038 10051.026 1.213 1.247 1.337

RegionRegion 1 Mean
NStd. Deviation
Region 2 MeanNStd. Deviation
Region 3 MeanNStd. Deviation
Region 4 MeanNStd. Deviation
Region 5 MeanNStd. Deviation
Region 6 MeanNStd. Deviation
Region 7 MeanNStd. Deviation
Region 8 MeanNStd. Deviation
Region 9 MeanNStd. Deviation
Region 10 MeanNStd. Deviation
Region 11 MeanNStd. Deviation
Region 12 MeanNStd. Deviation
Region 13 MeanNStd. Deviation
Rate the need, availability, utlization
Need Availability Utlization Effectiveness3.88 3.07 3.86 3.64109 107 109 103
0.997 1.223 1.142 1.1453.4 3.04 3.48 3.5655 55 50 50
0.655 0.881 0.974 1.1633.69 3.24 3.75 3.79
80 79 75 760.908 1.361 1.054 1.369
3.55 3.2 3.6 3.45111 108 110 107
0.882 1.066 1.068 1.1593.85 2.96 3.65 3.64
46 45 43 420.918 1.107 1.089 1.246
3.7 3 3.59 3.3137 36 37 36
0.845 1.042 0.956 1.0373.71 3.3 3.64 3.62
45 43 45 421.218 1.245 1.111 1.168
3.98 3.04 3.57 3.4651 52 49 50
0.86 1.188 0.791 1.0143.64 3.62 3.93 3.92
28 26 28 261.062 1.499 1.274 1.383
3.88 3.47 3.8 3.89104 101 101 96
1.011 1.229 1.175 1.2213.5 3.15 3.73 3.3936 34 33 31
1 1.306 1.281 1.3083.74 3.26 3.61 3.43
39 38 38 371.093 1.107 1.22 1.259
3.67 2.96 3.92 3.5749 49 48 47
1.029 1.306 1.2 1.395
Housing

Region
Rate the need, availability, utlization
Region 14 MeanNStd. Deviation
Region 15 MeanNStd. Deviation
Region 16 MeanNStd. Deviation
Region 17 MeanNStd. Deviation
Region 18 MeanNStd. Deviation
Total MeanNStd. Deviation
Need Availability Utlization Effectiveness
Housing
3.5 2.67 3.54 3.2456 55 56 55
0.688 0.795 0.852 1.1223.44 3.18 3.65 3.37
41 40 40 380.743 0.931 0.834 0.819
3.83 3.09 3.73 3.2369 69 67 66
0.874 1.095 0.863 0.784.16 2.63 4.03 3.59
38 38 36 371.001 1.195 0.971 1.189
3.84 2.93 3.89 3.5673 73 71 68
0.782 0.839 0.747 1.0133.73 3.11 3.72 3.55
1067 1048 1036 10070.934 1.152 1.044 1.167

RegionRegion 1 Mean
NStd. Deviation
Region 2 MeanNStd. Deviation
Region 3 MeanNStd. Deviation
Region 4 MeanNStd. Deviation
Region 5 MeanNStd. Deviation
Region 6 MeanNStd. Deviation
Region 7 MeanNStd. Deviation
Region 8 MeanNStd. Deviation
Region 9 MeanNStd. Deviation
Region 10 MeanNStd. Deviation
Region 11 MeanNStd. Deviation
Region 12 MeanNStd. Deviation
Region 13 MeanNStd. Deviation
Rate the need, availability, utlization
Need Availability Utlization Effectiveness3.6 3.69 3.59 3.92
109 106 109 1031.226 1.376 1.442 1.467
3.55 3.43 3.44 3.5855 54 50 50
0.939 1.354 1.402 1.4863.45 3.28 3.53 3.85
80 78 75 751.054 1.553 1.298 1.411
3.6 3.55 3.61 3.52111 108 110 107
1.089 1.248 1.182 1.2463.61 3.56 3.58 3.69
46 45 43 421.043 1.056 1.22 1.22
3.53 3.3 3.46 3.3638 37 37 36
0.725 1.288 1.238 1.4173.6 3.33 3.49 3.5745 43 45 42
1.053 1.248 1.392 1.3643.59 3.51 3.63 3.61
51 51 49 491.134 1.332 1.27 1.397
3.46 3.62 3.68 3.7328 26 28 26
0.962 1.551 1.389 1.5643.66 3.98 3.67 4.01104 101 100 95
1.319 1.456 1.518 1.5193.54 3.64 3.58 3.74
35 33 33 311.221 1.245 1.415 1.46
3.49 3.87 3.49 3.8639 38 37 37
1.254 1.51 1.574 1.5663.78 3.69 3.27 3.98
49 49 48 471.177 1.475 1.425 1.525
Legal Assistance

Region
Rate the need, availability, utlization
Region 14 MeanNStd. Deviation
Region 15 MeanNStd. Deviation
Region 16 MeanNStd. Deviation
Region 17 MeanNStd. Deviation
Region 18 MeanNStd. Deviation
Total MeanNStd. Deviation
Need Availability Utlization Effectiveness
Legal Assistance
3.48 3.16 3.27 3.3356 55 56 55
0.713 1.214 0.963 1.3063.63 3.58 3.63 3.53
41 40 40 381.043 1.107 0.952 0.951
3.61 3.41 3.43 3.369 69 67 66
0.988 1.192 1.062 1.0813.79 3.03 3.64 3.57
38 39 36 370.935 1.405 1.15 1.324
3.73 3.15 3.56 3.4674 72 70 68
0.955 1.134 1.15 1.2153.6 3.51 3.54 3.66
1068 1044 1033 10041.076 1.342 1.291 1.374

RegionRegion 1 Mean
NStd. Deviation
Region 2 MeanNStd. Deviation
Region 3 MeanNStd. Deviation
Region 4 MeanNStd. Deviation
Region 5 MeanNStd. Deviation
Region 6 MeanNStd. Deviation
Region 7 MeanNStd. Deviation
Region 8 MeanNStd. Deviation
Region 9 MeanNStd. Deviation
Region 10 MeanNStd. Deviation
Region 11 MeanNStd. Deviation
Region 12 MeanNStd. Deviation
Region 13 MeanNStd. Deviation
Rate the need, availability, utlization
Need Availability Utlization Effectiveness4.12 4.03 4.21 3.84109 107 109 104
0.95 0.966 0.973 1.0623.8 3.71 3.84 3.655 55 50 50
0.621 0.854 0.912 1.053.9 3.72 3.89 3.8480 79 75 76
0.739 1.085 0.967 1.1083.86 3.84 3.83 3.57111 108 110 107
0.78 0.888 0.844 0.9924.04 3.58 4.21 3.67
46 45 43 420.759 0.965 0.833 1.119
3.92 3.67 3.92 3.4437 36 37 36
0.64 0.894 0.795 0.7733.98 3.64 3.76 3.57
45 44 45 421.011 1.014 1.111 1.291
4.04 3.56 3.84 3.551 52 49 50
0.564 0.669 0.717 0.8634 4 4.21 4.08
28 26 28 260.77 1.233 0.917 1.0934.18 3.86 4.06 3.98104 101 100 96
0.901 1.14 1.043 1.1143.8 3.53 3.91 3.6535 34 33 31
0.901 1.051 1.1 1.1124 3.95 3.92 3.59
39 38 37 370.725 0.928 1.115 1.212
4.02 3.61 3.75 3.3349 49 48 48
0.901 1.151 1.082 1.078
Public Assistance

Region
Rate the need, availability, utlization
Region 14 MeanNStd. Deviation
Region 15 MeanNStd. Deviation
Region 16 MeanNStd. Deviation
Region 17 MeanNStd. Deviation
Region 18 MeanNStd. Deviation
Total MeanNStd. Deviation
Need Availability Utlization Effectiveness
Public Assistance
3.79 3.38 3.82 3.4756 55 56 55
0.594 0.805 0.936 0.8794 3.48 3.72 3.53
41 40 39 380.837 0.96 0.857 0.862
4.01 3.77 3.94 3.4169 69 67 66
0.813 0.894 0.814 0.8224.16 3.46 4.06 3.54
38 39 36 370.855 0.996 0.984 1.07
4.08 3.6 3.96 3.6573 73 70 68
0.722 0.862 0.788 0.8943.99 3.72 3.94 3.65
1066 1050 1032 10090.804 0.977 0.939 1.035
RegionRegion 1 Mean
NStd. Deviation
Region 2 MeanNStd. Deviation
Region 3 MeanNStd. Deviation
Region 4 MeanNStd. Deviation
Region 5 MeanNStd. Deviation
Region 6 MeanNStd. Deviation
Region 7 MeanNStd. Deviation
Region 8 MeanNStd. Deviation
Region 9 MeanNStd. Deviation
Region 10 MeanNStd. Deviation
Region 11 MeanNStd. Deviation
Region 12 MeanNStd. Deviation
Region 13 MeanNStd. Deviation
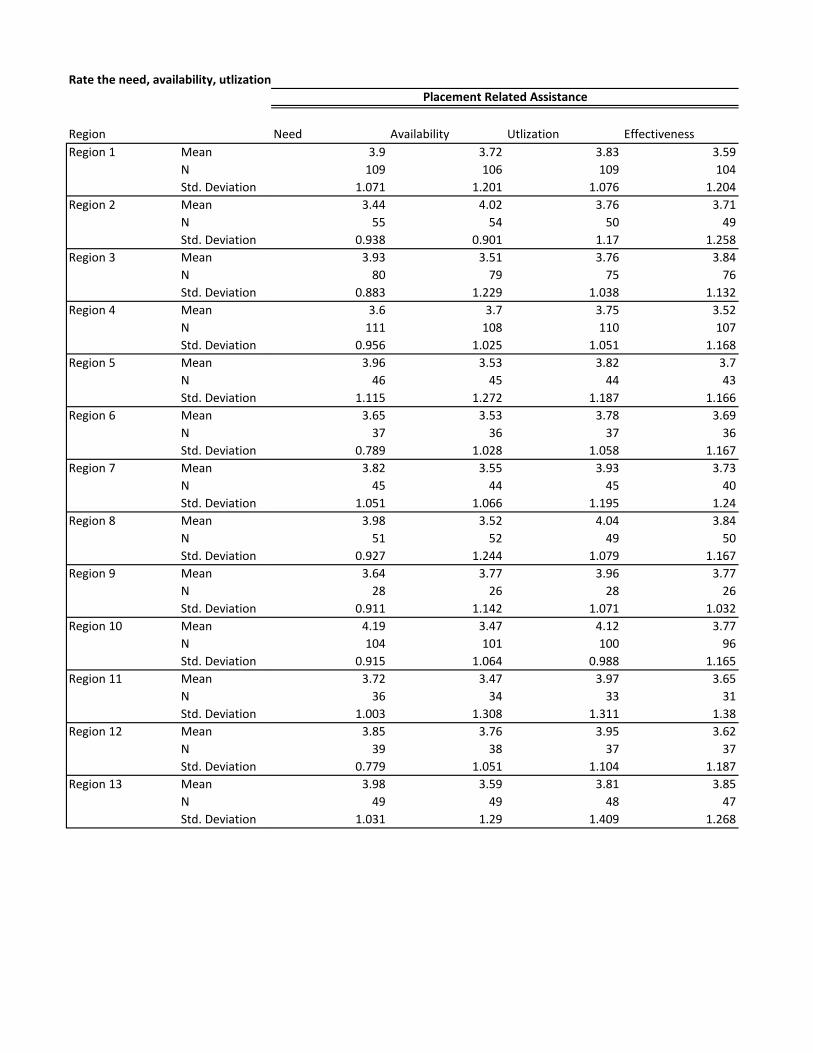
Rate the need, availability, utlization
Need Availability Utlization Effectiveness3.9 3.72 3.83 3.59
109 106 109 1041.071 1.201 1.076 1.204
3.44 4.02 3.76 3.7155 54 50 49
0.938 0.901 1.17 1.2583.93 3.51 3.76 3.84
80 79 75 760.883 1.229 1.038 1.132
3.6 3.7 3.75 3.52111 108 110 107
0.956 1.025 1.051 1.1683.96 3.53 3.82 3.7
46 45 44 431.115 1.272 1.187 1.166
3.65 3.53 3.78 3.6937 36 37 36
0.789 1.028 1.058 1.1673.82 3.55 3.93 3.73
45 44 45 401.051 1.066 1.195 1.24
3.98 3.52 4.04 3.8451 52 49 50
0.927 1.244 1.079 1.1673.64 3.77 3.96 3.77
28 26 28 260.911 1.142 1.071 1.032
4.19 3.47 4.12 3.77104 101 100 96
0.915 1.064 0.988 1.1653.72 3.47 3.97 3.65
36 34 33 311.003 1.308 1.311 1.38
3.85 3.76 3.95 3.6239 38 37 37
0.779 1.051 1.104 1.1873.98 3.59 3.81 3.85
49 49 48 471.031 1.29 1.409 1.268
Placement Related Assistance

Region
Rate the need, availability, utlization
Region 14 MeanNStd. Deviation
Region 15 MeanNStd. Deviation
Region 16 MeanNStd. Deviation
Region 17 MeanNStd. Deviation
Region 18 MeanNStd. Deviation
Total MeanNStd. Deviation
Need Availability Utlization Effectiveness
Placement Related Assistance
3.77 3.47 3.79 3.6456 55 56 55
0.874 0.858 1.057 1.0783.75 3.67 3.74 3.55
40 39 38 380.899 0.898 0.891 1.058
3.88 3.54 3.82 3.5369 69 67 66
0.883 1.092 0.92 0.9483.66 3.44 3.92 3.65
38 39 36 370.966 1.021 0.937 1.16
3.88 3.51 3.87 3.6273 73 70 68
0.832 0.945 0.9 1.0373.83 3.6 3.87 3.67
1066 1047 1032 10060.954 1.097 1.069 1.15

RegionRegion 1 Mean
NStd. Deviation
Region 2 MeanNStd. Deviation
Region 3 MeanNStd. Deviation
Region 4 MeanNStd. Deviation
Region 5 MeanNStd. Deviation
Region 6 MeanNStd. Deviation
Region 7 MeanNStd. Deviation
Region 8 MeanNStd. Deviation
Region 9 MeanNStd. Deviation
Region 10 MeanNStd. Deviation
Region 11 MeanNStd. Deviation
Region 12 MeanNStd. Deviation
Region 13 MeanNStd. Deviation
Rate the need, availability, utlization
Need Availability Utlization Effectiveness3.47 3.89 3.75 3.92104 100 100 97
1.214 1.294 1.242 1.2563.1 3.71 3.59 4.2252 52 49 49
1.192 1.446 1.526 1.493.37 3.83 3.32 3.95
76 77 76 771.164 1.409 1.309 1.327
3.14 3.83 3.44 3.68108 105 108 105
0.99 1.156 1.146 1.1733.3 3.6 3.49 3.5544 43 43 42
0.954 1.275 1.352 1.3293.31 3.76 3.37 3.56
35 34 35 341.278 1.327 1.308 1.307
3.21 3.75 3.54 4.1543 40 41 39
1.245 1.296 1.468 1.2683.2 3.5 3.29 3.9250 50 48 48
1.178 1.389 1.368 1.4273.19 3.92 4.04 3.92
27 25 27 251.302 1.656 1.581 1.605
3.59 3.96 3.74 3.9100 96 100 94
1.28 1.305 1.353 1.3923.06 3.44 3.39 3.83
35 32 31 301.533 1.39 1.606 1.555
2.92 3.67 3.17 3.7437 36 36 35
0.954 1.309 1.231 1.4423.15 3.58 3.23 3.55
48 48 48 471.052 1.334 1.259 1.265
Developmental/Disability Services

Region
Rate the need, availability, utlization
Region 14 MeanNStd. Deviation
Region 15 MeanNStd. Deviation
Region 16 MeanNStd. Deviation
Region 17 MeanNStd. Deviation
Region 18 MeanNStd. Deviation
Total MeanNStd. Deviation
Need Availability Utlization Effectiveness
Developmental/Disability Services
3.15 3.53 3.43 3.9454 53 53 52
0.856 1.103 1.323 1.2742.95 3.87 3.62 3.83
39 38 37 350.944 1.07 1.46 1.248
3.13 3.67 3.52 3.7467 67 66 66
1.043 1.33 1.256 1.3853.16 3.21 3.35 3.66
37 38 37 380.688 1.255 1.006 1.258
3.14 3.27 3.5 3.6872 71 70 68
0.737 1.082 1.113 1.0433.23 3.69 3.5 3.82
1028 1005 1005 9811.109 1.296 1.309 1.317
RegionRegion 1 Mean
NStd. Deviation
Region 2 MeanNStd. Deviation
Region 3 MeanNStd. Deviation
Region 4 MeanNStd. Deviation
Region 5 MeanNStd. Deviation
Region 6 MeanNStd. Deviation
Region 7 MeanNStd. Deviation
Region 8 MeanNStd. Deviation
Region 9 MeanNStd. Deviation
Region 10 MeanNStd. Deviation
Region 11 MeanNStd. Deviation
Region 12 MeanNStd. Deviation
Region 13 MeanNStd. Deviation
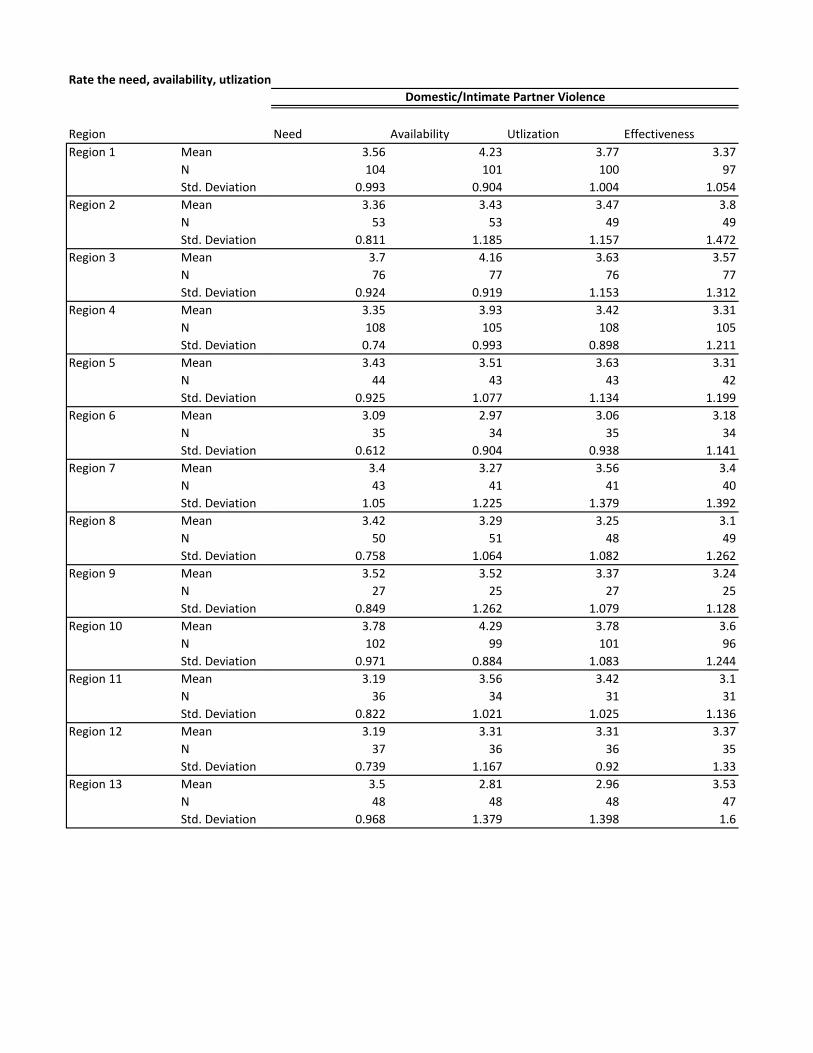
Rate the need, availability, utlization
Need Availability Utlization Effectiveness3.56 4.23 3.77 3.37104 101 100 97
0.993 0.904 1.004 1.0543.36 3.43 3.47 3.8
53 53 49 490.811 1.185 1.157 1.472
3.7 4.16 3.63 3.5776 77 76 77
0.924 0.919 1.153 1.3123.35 3.93 3.42 3.31108 105 108 105
0.74 0.993 0.898 1.2113.43 3.51 3.63 3.31
44 43 43 420.925 1.077 1.134 1.199
3.09 2.97 3.06 3.1835 34 35 34
0.612 0.904 0.938 1.1413.4 3.27 3.56 3.443 41 41 40
1.05 1.225 1.379 1.3923.42 3.29 3.25 3.1
50 51 48 490.758 1.064 1.082 1.262
3.52 3.52 3.37 3.2427 25 27 25
0.849 1.262 1.079 1.1283.78 4.29 3.78 3.6102 99 101 96
0.971 0.884 1.083 1.2443.19 3.56 3.42 3.1
36 34 31 310.822 1.021 1.025 1.136
3.19 3.31 3.31 3.3737 36 36 35
0.739 1.167 0.92 1.333.5 2.81 2.96 3.5348 48 48 47
0.968 1.379 1.398 1.6
Domestic/Intimate Partner Violence

Region
Rate the need, availability, utlization
Region 14 MeanNStd. Deviation
Region 15 MeanNStd. Deviation
Region 16 MeanNStd. Deviation
Region 17 MeanNStd. Deviation
Region 18 MeanNStd. Deviation
Total MeanNStd. Deviation
Need Availability Utlization Effectiveness
Domestic/Intimate Partner Violence
3.26 3 2.98 3.2754 53 53 52
0.589 1.193 1.065 1.4973.18 3.37 3.35 3.75
39 38 37 360.683 1.239 1.184 1.228
3.51 3.7 3.46 3.1567 67 65 65
0.877 1.101 1.032 1.1353.38 3.66 3.32 3.03
37 38 37 380.681 1.072 0.784 1.078
3.33 3.28 3.33 2.9772 71 69 68
0.671 1.031 1.066 1.1593.44 3.64 3.44 3.35
1032 1014 1004 9860.855 1.148 1.095 1.264

RegionRegion 1 Mean
NStd. Deviation
Region 2 MeanNStd. Deviation
Region 3 MeanNStd. Deviation
Region 4 MeanNStd. Deviation
Region 5 MeanNStd. Deviation
Region 6 MeanNStd. Deviation
Region 7 MeanNStd. Deviation
Region 8 MeanNStd. Deviation
Region 9 MeanNStd. Deviation
Region 10 MeanNStd. Deviation
Region 11 MeanNStd. Deviation
Region 12 MeanNStd. Deviation
Region 13 MeanNStd. Deviation
Rate the need, availability, utlization
Need Availability Utlization Effectiveness3.84 4.57 4.06 3.85104 102 100 97
0.893 0.697 0.93 0.9723.34 3.98 3.43 3.65
53 53 49 480.919 1.101 1.384 1.523
3.42 4.05 3.57 3.7576 76 76 76
0.997 1.082 1.3 1.4343.31 4.07 3.38 3.53108 105 108 105
0.848 1.022 1.133 1.2793.66 3.12 3.47 3.4
44 43 43 421.055 1.434 1.351 1.345
3.4 3.62 3.33 3.4735 34 36 34
0.847 1.256 1.195 1.3983.51 3.73 3.45 3.8
43 40 42 401.142 1.132 1.329 1.244
3.76 4.04 3.83 3.3550 51 48 49
0.797 0.848 0.953 1.0323.41 3.96 3.59 3.44
27 25 27 250.931 1.207 1.083 1.417
3.76 4.23 3.74 3.73101 98 100 95
0.95 0.939 1.021 1.1433.36 3.59 3.45 3.29
36 34 31 310.798 0.957 1.091 1.071
3.73 3.72 3.83 3.8637 36 36 35
0.769 1.031 0.971 1.0043.08 3.79 3.02 3.47
48 48 48 471.007 1.166 1.229 1.412
Father Engagement Services

Region
Rate the need, availability, utlization
Region 14 MeanNStd. Deviation
Region 15 MeanNStd. Deviation
Region 16 MeanNStd. Deviation
Region 17 MeanNStd. Deviation
Region 18 MeanNStd. Deviation
Total MeanNStd. Deviation
Need Availability Utlization Effectiveness
Father Engagement Services
3.5 3.6 3.36 3.4454 53 53 52
0.795 1.062 1.076 1.1273.44 4.08 3.57 3.61
39 38 37 360.754 1.05 0.987 0.934
3.28 4.24 3.52 3.5667 67 65 64
1.084 1.102 1.3 1.4683.32 3.87 3.3 2.97
37 38 37 380.669 0.704 0.661 0.788
3.46 4.04 3.71 3.5672 71 69 68
0.934 0.885 1.03 1.073.5 3.99 3.57 3.58
1031 1012 1005 9820.933 1.063 1.143 1.226
RegionRegion 1 Mean
NStd. Deviation
Region 2 MeanNStd. Deviation
Region 3 MeanNStd. Deviation
Region 4 MeanNStd. Deviation
Region 5 MeanNStd. Deviation
Region 6 MeanNStd. Deviation
Region 7 MeanNStd. Deviation
Region 8 MeanNStd. Deviation
Region 9 MeanNStd. Deviation
Region 10 MeanNStd. Deviation
Region 11 MeanNStd. Deviation
Region 12 MeanNStd. Deviation
Region 13 MeanNStd. Deviation
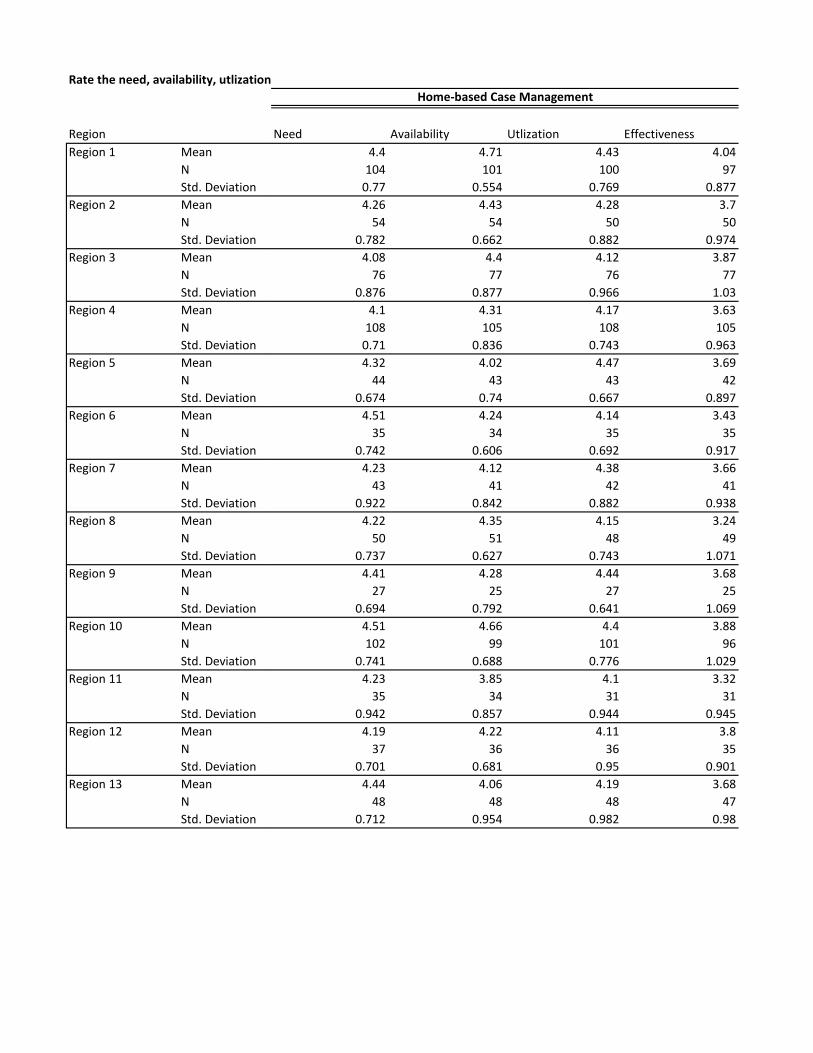
Rate the need, availability, utlization
Need Availability Utlization Effectiveness4.4 4.71 4.43 4.04
104 101 100 970.77 0.554 0.769 0.8774.26 4.43 4.28 3.7
54 54 50 500.782 0.662 0.882 0.974
4.08 4.4 4.12 3.8776 77 76 77
0.876 0.877 0.966 1.034.1 4.31 4.17 3.63
108 105 108 1050.71 0.836 0.743 0.9634.32 4.02 4.47 3.69
44 43 43 420.674 0.74 0.667 0.897
4.51 4.24 4.14 3.4335 34 35 35
0.742 0.606 0.692 0.9174.23 4.12 4.38 3.66
43 41 42 410.922 0.842 0.882 0.938
4.22 4.35 4.15 3.2450 51 48 49
0.737 0.627 0.743 1.0714.41 4.28 4.44 3.68
27 25 27 250.694 0.792 0.641 1.069
4.51 4.66 4.4 3.88102 99 101 96
0.741 0.688 0.776 1.0294.23 3.85 4.1 3.32
35 34 31 310.942 0.857 0.944 0.945
4.19 4.22 4.11 3.837 36 36 35
0.701 0.681 0.95 0.9014.44 4.06 4.19 3.68
48 48 48 470.712 0.954 0.982 0.98
Home-based Case Management
Region
Rate the need, availability, utlization
Region 14 MeanNStd. Deviation
Region 15 MeanNStd. Deviation
Region 16 MeanNStd. Deviation
Region 17 MeanNStd. Deviation
Region 18 MeanNStd. Deviation
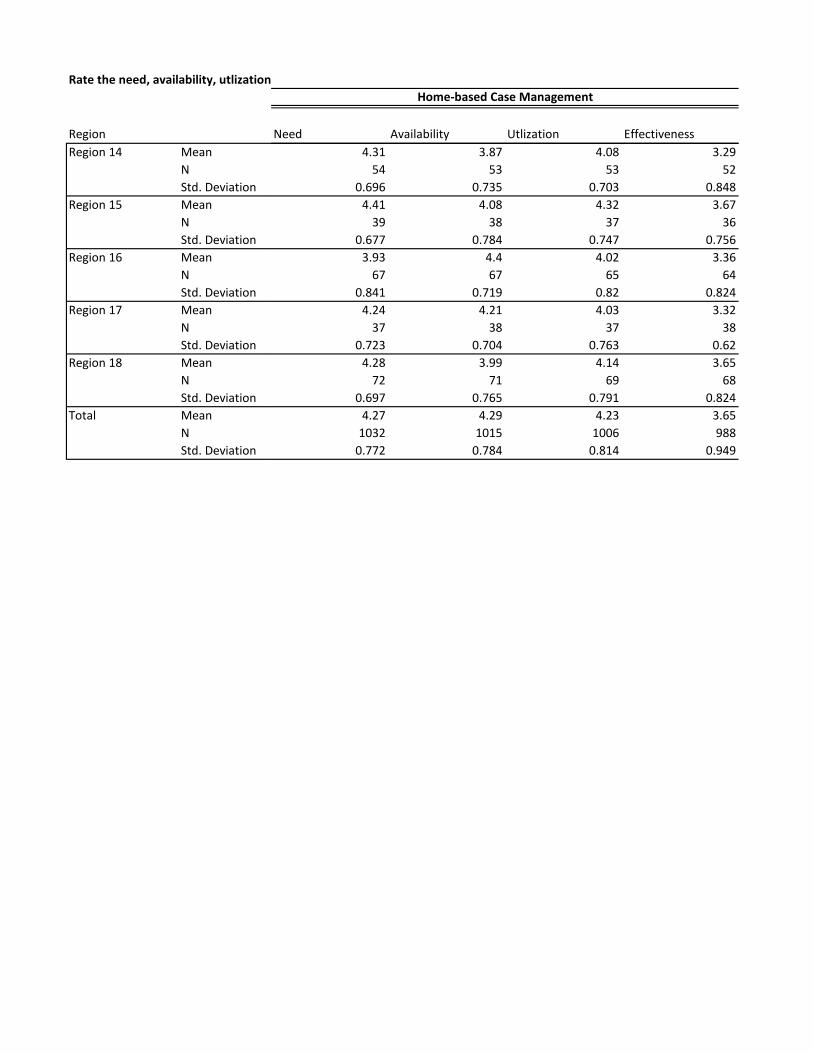
Total MeanNStd. Deviation
Need Availability Utlization Effectiveness
Home-based Case Management
4.31 3.87 4.08 3.2954 53 53 52
0.696 0.735 0.703 0.8484.41 4.08 4.32 3.67
39 38 37 360.677 0.784 0.747 0.756
3.93 4.4 4.02 3.3667 67 65 64
0.841 0.719 0.82 0.8244.24 4.21 4.03 3.32
37 38 37 380.723 0.704 0.763 0.62
4.28 3.99 4.14 3.6572 71 69 68
0.697 0.765 0.791 0.8244.27 4.29 4.23 3.65
1032 1015 1006 9880.772 0.784 0.814 0.949

RegionRegion 1 Mean
NStd. Deviation
Region 2 MeanNStd. Deviation
Region 3 MeanNStd. Deviation
Region 4 MeanNStd. Deviation
Region 5 MeanNStd. Deviation
Region 6 MeanNStd. Deviation
Region 7 MeanNStd. Deviation
Region 8 MeanNStd. Deviation
Region 9 MeanNStd. Deviation
Region 10 MeanNStd. Deviation
Region 11 MeanNStd. Deviation
Region 12 MeanNStd. Deviation
Region 13 MeanNStd. Deviation
Rate the need, availability, utlization
Need Availability Utlization Effectiveness4.04 4.01 4.1 3.86103 102 102 101
0.959 1 0.939 13.78 3.94 4 3.78
54 54 50 500.839 0.878 0.926 0.91
3.89 4.03 4.01 3.9174 75 74 75
0.959 0.885 0.944 0.9613.93 4.1 3.97 3.76107 105 104 101
0.832 0.808 0.897 0.8733.93 3.6 3.83 3.51
44 43 41 390.873 0.877 0.803 0.854
3.66 3.79 4 3.8835 34 35 34
0.906 0.729 0.97 0.9133.84 3.85 4.05 3.78
43 41 43 410.974 0.882 0.999 0.988
3.96 3.69 3.85 3.6548 49 48 49
0.874 0.796 0.899 0.9483.85 3.64 3.89 3.6
27 25 27 250.77 0.757 0.934 0.9134.07 3.96 4.02 3.88101 96 99 94
0.941 0.962 1.05 1.0963.8 3.71 3.66 3.4435 34 32 32
0.868 1.031 1.004 1.1344.15 3.82 3.86 3.53
39 38 37 360.779 0.692 0.887 0.91
3.9 3.89 4.11 3.9348 47 45 44
1.016 0.938 0.91 0.974
Basic Needs

Region
Rate the need, availability, utlization
Region 14 MeanNStd. Deviation
Region 15 MeanNStd. Deviation
Region 16 MeanNStd. Deviation
Region 17 MeanNStd. Deviation
Region 18 MeanNStd. Deviation
Total MeanNStd. Deviation
Need Availability Utlization Effectiveness
Basic Needs
3.91 3.6 3.96 3.7153 52 52 51
0.838 0.774 0.862 0.9443.71 4.05 4.06 3.89
38 37 36 360.898 0.88 0.924 0.708
3.9 3.81 3.85 3.5467 68 67 67
0.819 0.833 0.783 0.7453.89 3.62 3.75 3.38
36 37 36 370.667 0.861 0.77 0.758
4 3.92 4.19 3.8473 72 70 69
0.816 0.765 0.822 0.8853.92 3.88 3.98 3.75
1025 1009 998 9810.882 0.875 0.914 0.937
RegionRegion 1 Mean
NStd. Deviation
Region 2 MeanNStd. Deviation
Region 3 MeanNStd. Deviation
Region 4 MeanNStd. Deviation
Region 5 MeanNStd. Deviation
Region 6 MeanNStd. Deviation
Region 7 MeanNStd. Deviation
Region 8 MeanNStd. Deviation
Region 9 MeanNStd. Deviation
Region 10 MeanNStd. Deviation
Region 11 MeanNStd. Deviation
Region 12 MeanNStd. Deviation
Region 13 MeanNStd. Deviation
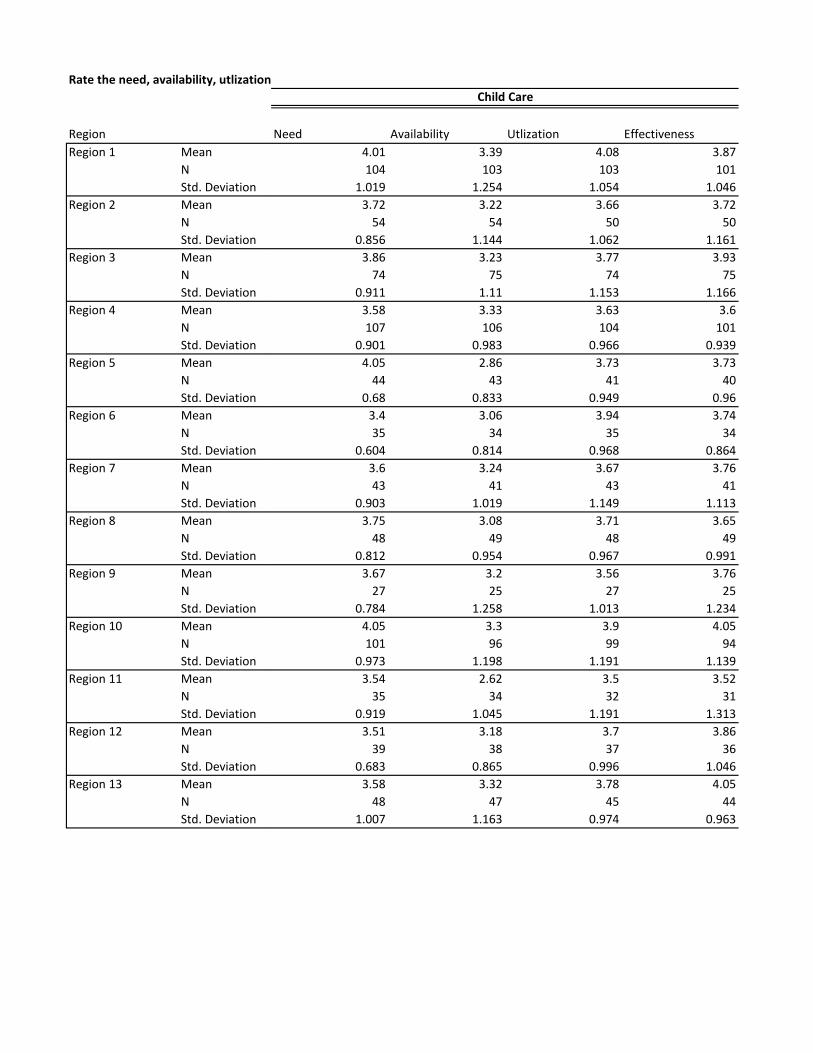
Rate the need, availability, utlization
Need Availability Utlization Effectiveness4.01 3.39 4.08 3.87104 103 103 101
1.019 1.254 1.054 1.0463.72 3.22 3.66 3.72
54 54 50 500.856 1.144 1.062 1.161
3.86 3.23 3.77 3.9374 75 74 75
0.911 1.11 1.153 1.1663.58 3.33 3.63 3.6107 106 104 101
0.901 0.983 0.966 0.9394.05 2.86 3.73 3.73
44 43 41 400.68 0.833 0.949 0.96
3.4 3.06 3.94 3.7435 34 35 34
0.604 0.814 0.968 0.8643.6 3.24 3.67 3.7643 41 43 41
0.903 1.019 1.149 1.1133.75 3.08 3.71 3.65
48 49 48 490.812 0.954 0.967 0.991
3.67 3.2 3.56 3.7627 25 27 25
0.784 1.258 1.013 1.2344.05 3.3 3.9 4.05101 96 99 94
0.973 1.198 1.191 1.1393.54 2.62 3.5 3.52
35 34 32 310.919 1.045 1.191 1.313
3.51 3.18 3.7 3.8639 38 37 36
0.683 0.865 0.996 1.0463.58 3.32 3.78 4.05
48 47 45 441.007 1.163 0.974 0.963
Child Care

Region
Rate the need, availability, utlization
Region 14 MeanNStd. Deviation
Region 15 MeanNStd. Deviation
Region 16 MeanNStd. Deviation
Region 17 MeanNStd. Deviation
Region 18 MeanNStd. Deviation
Total MeanNStd. Deviation
Need Availability Utlization Effectiveness
Child Care
3.74 2.94 3.67 3.7353 52 52 51
0.684 0.698 0.857 0.9183.47 3.46 3.72 3.83
38 37 36 360.83 0.989 0.944 0.8113.75 2.87 3.91 3.54
68 68 67 670.904 0.96 0.9 0.927
3.78 2.65 3.83 3.5936 37 36 37
0.681 0.857 0.845 0.9853.73 3 3.91 3.75
73 72 70 690.786 0.934 0.974 0.961
3.75 3.15 3.79 3.771027 1011 999 981
0.882 1.053 1.026 1.037
RegionRegion 1 Mean
NStd. Deviation
Region 2 MeanNStd. Deviation
Region 3 MeanNStd. Deviation
Region 4 MeanNStd. Deviation
Region 5 MeanNStd. Deviation
Region 6 MeanNStd. Deviation
Region 7 MeanNStd. Deviation
Region 8 MeanNStd. Deviation
Region 9 MeanNStd. Deviation
Region 10 MeanNStd. Deviation
Region 11 MeanNStd. Deviation
Region 12 MeanNStd. Deviation
Region 13 MeanNStd. Deviation
Rate the need, availability, utlization
Need Availability Utlization Effectiveness3.97 4.1 3.95 3.84103 102 102 100
1.089 0.98 1.075 1.1083.57 3.83 3.32 3.58
54 54 50 500.944 0.986 1.186 1.295
3.74 3.97 3.57 3.7774 75 74 75
1.073 1.078 1.171 1.1693.75 4.08 3.75 3.71107 105 104 101
1.117 1.124 1.164 1.1783.77 3.79 3.73 3.55
44 43 41 401.054 0.989 1.096 1.085
3.29 4.06 3.83 3.7135 34 35 34
1.045 1.013 1.071 1.063.6 3.78 3.49 3.5443 40 43 39
1.178 1.165 1.316 1.2113.6 3.63 3.58 3.5148 49 48 49
0.893 0.929 1.127 1.0633.93 4.08 3.85 3.92
27 25 27 251.107 1.038 1.262 1.115
4.06 4.18 4.06 4.1101 96 99 94
1.13 1.205 1.219 1.2543.34 3.48 3.34 3.39
35 33 32 311.11 1.064 1.234 1.2563.72 3.97 3.67 3.72
39 38 36 360.972 1.026 1.195 1.137
3.73 3.85 3.78 4.0548 47 45 44
1.106 1.122 1.241 1.077
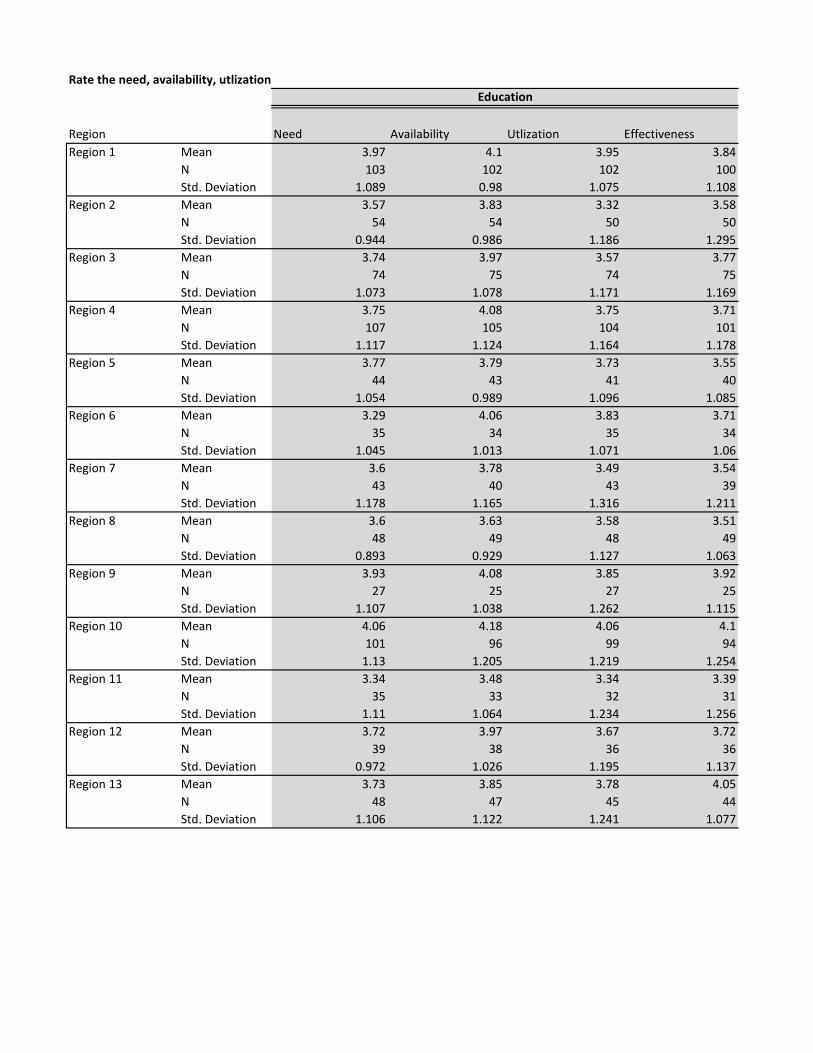
Education

Region
Rate the need, availability, utlization
Region 14 MeanNStd. Deviation
Region 15 MeanNStd. Deviation
Region 16 MeanNStd. Deviation
Region 17 MeanNStd. Deviation
Region 18 MeanNStd. Deviation
Total MeanNStd. Deviation
Need Availability Utlization Effectiveness
Education
3.45 3.52 3.48 3.4353 52 52 51
0.867 1 0.96 0.93.39 4.03 3.42 3.75
38 37 36 361.079 1.093 1.079 1.079
3.59 3.94 3.58 3.5468 68 67 67
0.966 0.929 1.047 1.1053.69 3.32 3.61 3.32
36 37 36 370.92 1.002 0.964 0.8843.79 3.81 3.77 3.49
73 72 70 690.833 0.944 0.966 0.918
3.72 3.9 3.7 3.691026 1007 997 978
1.049 1.061 1.141 1.13

RegionRegion 1 Mean
NStd. Deviation
Region 2 MeanNStd. Deviation
Region 3 MeanNStd. Deviation
Region 4 MeanNStd. Deviation
Region 5 MeanNStd. Deviation
Region 6 MeanNStd. Deviation
Region 7 MeanNStd. Deviation
Region 8 MeanNStd. Deviation
Region 9 MeanNStd. Deviation
Region 10 MeanNStd. Deviation
Region 11 MeanNStd. Deviation
Region 12 MeanNStd. Deviation
Region 13 MeanNStd. Deviation
Rate the need, availability, utlization
Need Availability Utlization Effectiveness3.94 3.96 3.88 3.78103 102 102 100
0.927 1.052 1.027 1.0013.59 3.93 3.7 3.72
54 54 50 500.858 0.968 1.055 1.051
3.77 3.73 3.86 3.9574 75 74 75
0.987 1.044 1.038 1.0513.83 3.86 3.88 3.79107 105 104 101
0.956 1.096 1.058 1.1073.66 3.37 3.83 3.7
44 43 41 400.776 0.846 0.946 1.067
3.71 3.56 3.71 3.7435 34 35 34
0.957 0.96 0.957 0.9943.6 3.71 3.71 3.8343 41 42 40
0.955 0.955 1.274 1.1743.79 3.5 3.87 3.56
47 48 47 480.832 0.772 1.013 1.009
3.74 3.72 3.7 3.8827 25 27 25
1.228 1.339 1.353 1.2693.97 3.98 3.9 4.1101 96 99 94
1.09 1.105 1.225 1.213.46 3.55 3.63 3.66
35 33 32 321.039 1.148 1.362 1.428
3.69 3.76 3.72 3.6739 38 36 36
0.95 1.076 1.059 1.1213.73 3.72 3.91 3.98
48 47 45 441.067 0.971 1.104 0.952
Concrete Services

Region
Rate the need, availability, utlization
Region 14 MeanNStd. Deviation
Region 15 MeanNStd. Deviation
Region 16 MeanNStd. Deviation
Region 17 MeanNStd. Deviation
Region 18 MeanNStd. Deviation
Total MeanNStd. Deviation
Need Availability Utlization Effectiveness
Concrete Services
3.55 3.29 3.63 3.5553 52 52 51
0.845 0.871 1.01 0.9013.58 3.84 3.97 3.67
38 37 36 360.858 0.834 0.971 0.756
3.87 3.82 3.94 3.5868 68 67 67
0.862 0.961 0.903 0.9873.44 3.38 3.58 3.38
36 37 36 370.735 0.794 0.874 0.721
3.79 3.69 3.99 3.6473 72 70 69
0.927 0.898 0.893 0.9543.75 3.73 3.83 3.76
1025 1007 995 9790.949 1.01 1.059 1.057

RegionRegion 1 Mean
NStd. Deviation
Region 2 MeanNStd. Deviation
Region 3 MeanNStd. Deviation
Region 4 MeanNStd. Deviation
Region 5 MeanNStd. Deviation
Region 6 MeanNStd. Deviation
Region 7 MeanNStd. Deviation
Region 8 MeanNStd. Deviation
Region 9 MeanNStd. Deviation
Region 10 MeanNStd. Deviation
Region 11 MeanNStd. Deviation
Region 12 MeanNStd. Deviation
Region 13 MeanNStd. Deviation
Rate the need, availability, utlization
Need Availability Utlization Effectiveness3.83 4.26 3.9 3.67103 102 102 101
1.011 0.922 1.01 1.0593.57 4 3.54 3.48
54 54 50 500.742 0.869 0.994 1.129
3.65 3.92 3.51 3.5974 75 74 75
0.985 0.969 1.037 1.1283.7 3.95 3.75 3.53
107 105 104 1010.871 0.859 1.002 1.006
3.75 3.58 3.9 3.5844 43 41 40
0.839 0.852 0.889 1.013.43 3.65 3.77 3.71
35 34 35 340.778 0.95 0.942 1.001
3.72 3.85 3.79 3.7943 40 42 39
1.202 1.001 1.279 1.263.62 3.73 3.7 3.29
47 48 47 480.768 0.736 0.931 0.967
4.11 4.04 4.04 3.827 25 27 25
0.892 0.935 1.055 1.0413.81 3.96 3.73 3.96100 96 99 94
1.032 0.928 1.176 1.2783.37 3.56 3.44 3.23
35 32 32 311.14 1.014 1.19 1.0873.46 3.71 3.64 3.39
39 38 36 360.854 0.927 0.899 1.022
3.75 3.96 3.98 3.5748 47 45 44
1.021 0.955 0.892 1.043
Living Skills

Region
Rate the need, availability, utlization
Region 14 MeanNStd. Deviation
Region 15 MeanNStd. Deviation
Region 16 MeanNStd. Deviation
Region 17 MeanNStd. Deviation
Region 18 MeanNStd. Deviation
Total MeanNStd. Deviation
Need Availability Utlization Effectiveness
Living Skills
3.55 3.62 3.54 3.4753 52 52 51
0.822 0.771 0.753 0.9023.74 3.81 3.81 3.75
38 37 36 360.685 0.616 0.822 0.732
3.5 4.03 3.73 3.468 68 67 67
0.801 0.863 0.88 0.973.72 3.62 3.61 3.05
36 37 36 370.659 0.794 0.871 0.621
3.59 3.74 3.83 3.4873 72 70 69
0.723 0.75 0.868 0.9013.67 3.88 3.74 3.56
1024 1005 995 9780.906 0.893 0.992 1.05
RegionRegion 1 Mean
NStd. Deviation
Region 2 MeanNStd. Deviation
Region 3 MeanNStd. Deviation
Region 4 MeanNStd. Deviation
Region 5 MeanNStd. Deviation
Region 6 MeanNStd. Deviation
Region 7 MeanNStd. Deviation
Region 8 MeanNStd. Deviation
Region 9 MeanNStd. Deviation
Region 10 MeanNStd. Deviation
Region 11 MeanNStd. Deviation
Region 12 MeanNStd. Deviation
Region 13 MeanNStd. Deviation
Rate the need, availability, utlization
Need Availability Utlization Effectiveness4.08 4.32 4.31 4.34
86 84 83 821.668 1.622 1.569 1.533
4.4 4.45 4.37 4.6142 42 38 38
1.547 1.58 1.667 1.6034.25 4.4 4.28 4.66
67 68 64 651.726 1.729 1.685 1.584
4.21 4.44 4.36 4.4291 88 87 84
1.657 1.582 1.585 1.5074.56 4.52 4.94 4.91
34 33 35 341.618 1.752 1.474 1.545
3.82 4.33 4.11 4.3728 27 28 27
1.611 1.544 1.548 1.3634.46 4.91 4.35 4.82
37 34 37 341.85 1.505 1.798 1.4244.44 4.39 4.25 4.24
41 41 40 421.659 1.716 1.794 1.792
4.38 4.35 4.71 4.621 20 21 20
1.746 1.725 1.678 1.5694.15 4.2 4.27 4.49
89 85 83 791.541 1.557 1.578 1.492
4.24 4.04 4.26 4.1529 27 27 26
1.883 2.047 1.789 1.874.18 4.36 4.28 4.13
33 33 32 311.467 1.365 1.464 1.522
4.58 4.79 4.66 4.7438 38 35 35
1.718 1.562 1.608 1.521
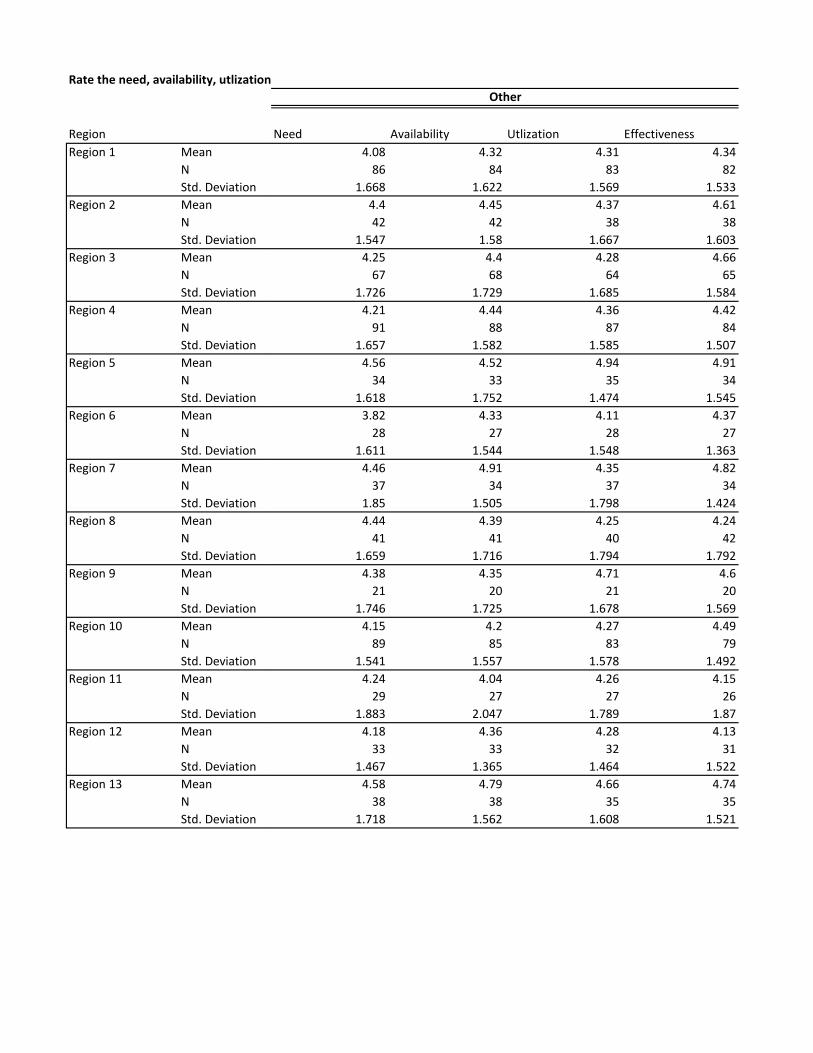
Other
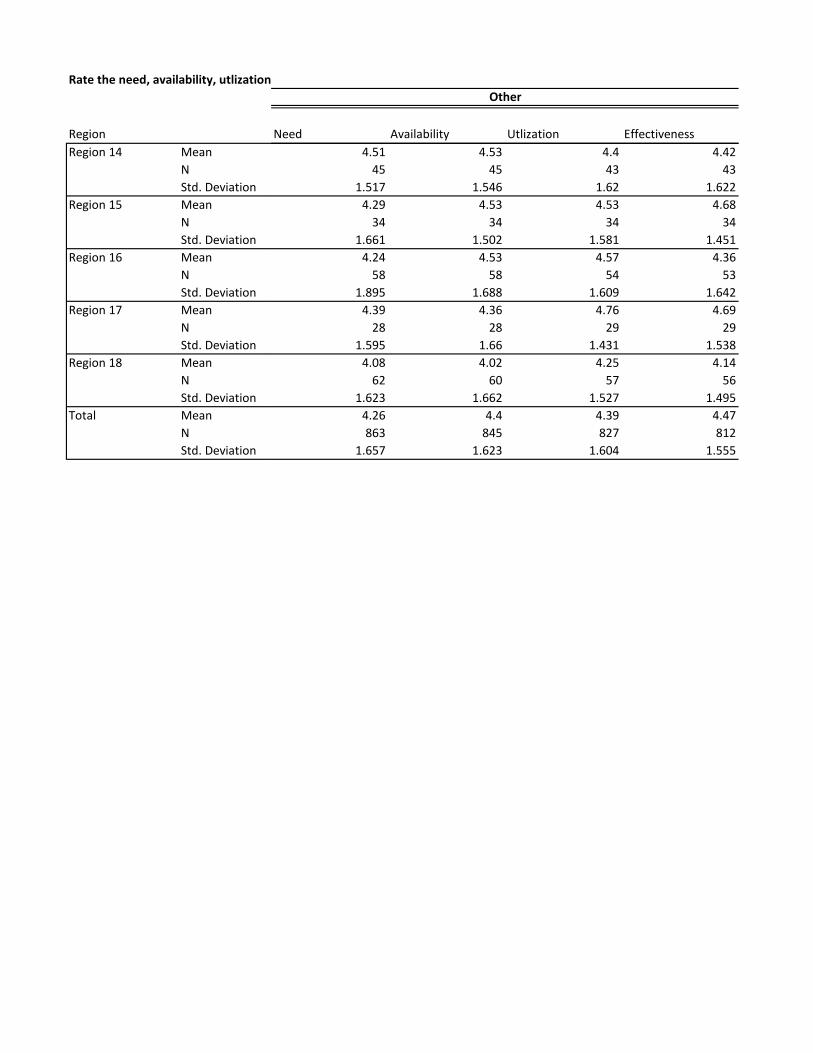
Region
Rate the need, availability, utlization
Region 14 MeanNStd. Deviation
Region 15 MeanNStd. Deviation
Region 16 MeanNStd. Deviation
Region 17 MeanNStd. Deviation
Region 18 MeanNStd. Deviation
Total MeanNStd. Deviation
Need Availability Utlization Effectiveness
Other
4.51 4.53 4.4 4.4245 45 43 43
1.517 1.546 1.62 1.6224.29 4.53 4.53 4.68
34 34 34 341.661 1.502 1.581 1.451
4.24 4.53 4.57 4.3658 58 54 53
1.895 1.688 1.609 1.6424.39 4.36 4.76 4.69
28 28 29 291.595 1.66 1.431 1.538
4.08 4.02 4.25 4.1462 60 57 56
1.623 1.662 1.527 1.4954.26 4.4 4.39 4.47863 845 827 812
1.657 1.623 1.604 1.555

RegionRegion 1 Mean
NStd. Deviation
Region 2 MeanNStd. Deviation
Region 3 MeanNStd. Deviation
Region 4 MeanNStd. Deviation
Region 5 MeanNStd. Deviation
Region 6 MeanNStd. Deviation
Region 7 MeanNStd. Deviation
Region 8 MeanNStd. Deviation
Region 9 MeanNStd. Deviation
Region 10 MeanNStd. Deviation
Region 11 MeanNStd. Deviation
Region 12 MeanNStd. Deviation
Region 13 MeanNStd. Deviation
Rate the need, availability, utlization
Need Availability Utlization Effectiveness3.63 4.2 3.85 3.96
98 96 95 941.41 1.211 1.376 1.311
3.2 3.84 3.73 4.2751 51 48 48
1.249 1.362 1.567 1.443.32 4 3.56 4.14
72 73 72 731.265 1.344 1.443 1.388
3.41 4.12 3.51 3.87102 100 101 97
1.254 1.225 1.331 1.3893.45 3.67 3.53 4.22
38 36 38 361.606 1.621 1.672 1.495
3.26 3.74 3.5 3.6735 34 34 33
1.268 1.442 1.354 1.4723.75 3.84 3.78 4.28
40 37 40 361.548 1.424 1.641 1.406
3.34 3.68 3.6 3.7847 47 45 46
1.387 1.548 1.421 1.5483.73 3.75 3.65 4.21
26 24 26 241.402 1.595 1.548 1.414
3.6 4.13 4.01 4.2790 87 90 84
1.52 1.437 1.525 1.43.12 3.63 3.41 3.88
34 32 32 321.225 1.641 1.456 1.54
3.71 4.03 3.38 4.2734 33 34 33
1.404 1.425 1.477 1.4423.39 3.45 3.73 4.05
46 44 44 431.145 1.32 1.484 1.463
Child-Parent Psychotherapy

Region
Rate the need, availability, utlization
Region 14 MeanNStd. Deviation
Region 15 MeanNStd. Deviation
Region 16 MeanNStd. Deviation
Region 17 MeanNStd. Deviation
Region 18 MeanNStd. Deviation
Total MeanNStd. Deviation
Need Availability Utlization Effectiveness
Child-Parent Psychotherapy
3.63 3.47 3.92 4.0852 49 51 49
1.284 1.386 1.508 1.3823 4.16 3.65 4.25
31 31 31 321.317 1.508 1.45 1.295
3.6 3.84 3.77 4.1362 62 62 61
1.465 1.601 1.53 1.5763.46 3.29 3.7 3.79
37 38 37 381.216 1.354 1.351 1.277
3.52 3.59 3.52 3.6467 66 67 66
1.146 1.136 1.119 1.1723.47 3.86 3.68 4.03962 940 947 925
1.347 1.403 1.444 1.406
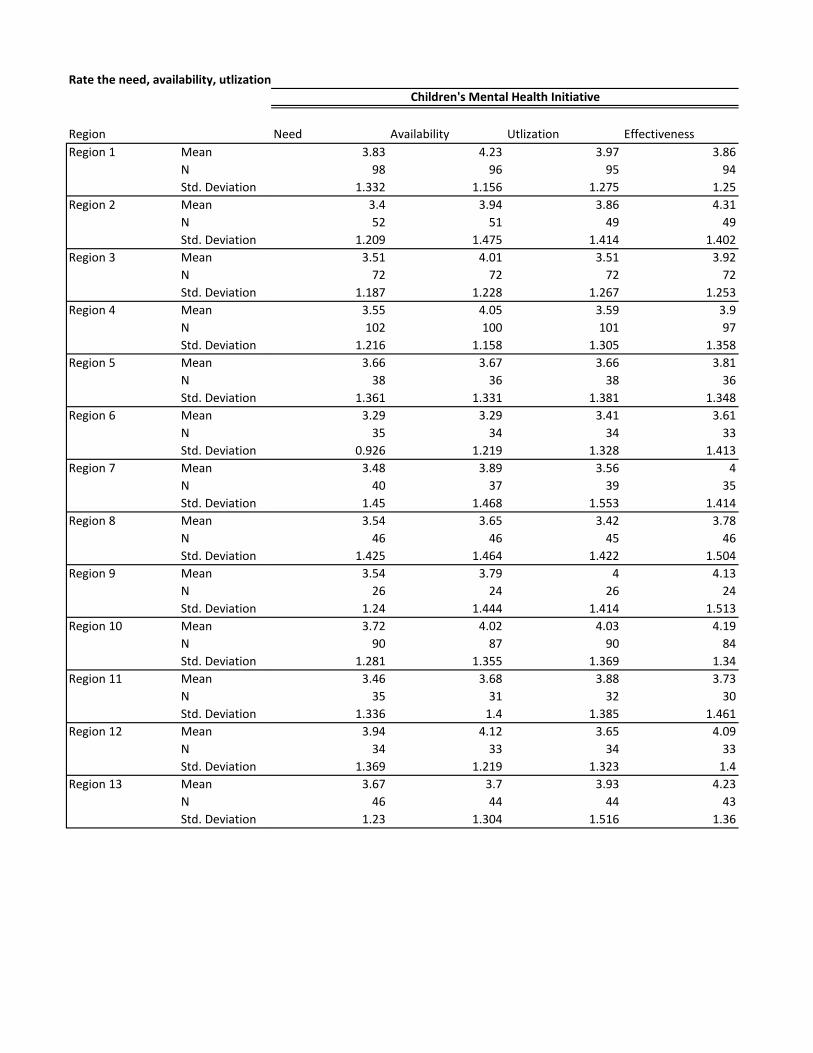
RegionRegion 1 Mean
NStd. Deviation
Region 2 MeanNStd. Deviation
Region 3 MeanNStd. Deviation
Region 4 MeanNStd. Deviation
Region 5 MeanNStd. Deviation
Region 6 MeanNStd. Deviation
Region 7 MeanNStd. Deviation
Region 8 MeanNStd. Deviation
Region 9 MeanNStd. Deviation
Region 10 MeanNStd. Deviation
Region 11 MeanNStd. Deviation
Region 12 MeanNStd. Deviation
Region 13 MeanNStd. Deviation
Rate the need, availability, utlization
Need Availability Utlization Effectiveness3.83 4.23 3.97 3.86
98 96 95 941.332 1.156 1.275 1.25
3.4 3.94 3.86 4.3152 51 49 49
1.209 1.475 1.414 1.4023.51 4.01 3.51 3.92
72 72 72 721.187 1.228 1.267 1.253
3.55 4.05 3.59 3.9102 100 101 97
1.216 1.158 1.305 1.3583.66 3.67 3.66 3.81
38 36 38 361.361 1.331 1.381 1.348
3.29 3.29 3.41 3.6135 34 34 33
0.926 1.219 1.328 1.4133.48 3.89 3.56 4
40 37 39 351.45 1.468 1.553 1.4143.54 3.65 3.42 3.78
46 46 45 461.425 1.464 1.422 1.504
3.54 3.79 4 4.1326 24 26 24
1.24 1.444 1.414 1.5133.72 4.02 4.03 4.19
90 87 90 841.281 1.355 1.369 1.34
3.46 3.68 3.88 3.7335 31 32 30
1.336 1.4 1.385 1.4613.94 4.12 3.65 4.09
34 33 34 331.369 1.219 1.323 1.4
3.67 3.7 3.93 4.2346 44 44 43
1.23 1.304 1.516 1.36
Children's Mental Health Initiative

Region
Rate the need, availability, utlization
Region 14 MeanNStd. Deviation
Region 15 MeanNStd. Deviation
Region 16 MeanNStd. Deviation
Region 17 MeanNStd. Deviation
Region 18 MeanNStd. Deviation
Total MeanNStd. Deviation
Need Availability Utlization Effectiveness
Children's Mental Health Initiative
3.54 3.74 3.84 3.952 50 51 50
1.146 1.192 1.347 1.3743.39 3.9 3.94 3.91
31 31 31 321.174 1.248 1.263 1.254
3.68 4.1 4.02 4.0262 62 62 61
1.376 1.468 1.443 1.4553.45 3.33 3.78 3.68
38 39 37 381.108 1.221 1.336 1.358
3.64 3.56 3.58 3.6267 66 67 66
1.138 1.178 1.089 1.1873.6 3.87 3.76 3.93
964 939 947 9231.256 1.307 1.35 1.354

RegionRegion 1 Mean
NStd. Deviation
Region 2 MeanNStd. Deviation
Region 3 MeanNStd. Deviation
Region 4 MeanNStd. Deviation
Region 5 MeanNStd. Deviation
Region 6 MeanNStd. Deviation
Region 7 MeanNStd. Deviation
Region 8 MeanNStd. Deviation
Region 9 MeanNStd. Deviation
Region 10 MeanNStd. Deviation
Region 11 MeanNStd. Deviation
Region 12 MeanNStd. Deviation
Region 13 MeanNStd. Deviation
Rate the need, availability, utlization
Need Availability Utlization Effectiveness3.92 4.19 3.95 3.76
98 96 96 951.118 1.019 1.089 1.108
3.67 3.75 3.9 4.0252 52 49 49
0.944 1.027 1.046 1.1453.79 4.11 3.99 3.85
72 73 72 731.034 0.936 1.014 1.05
3.72 4.08 3.82 3.65102 100 100 98
0.788 0.884 0.892 0.9963.71 3.56 3.84 3.56
38 36 38 361.183 1.081 1.128 1.107
3.69 3.79 3.65 3.3335 34 34 33
0.993 1.008 0.849 1.1093.95 3.76 3.92 3.69
40 38 39 361.131 1.173 1.156 1.091
3.77 3.83 3.93 3.647 47 46 47
1.165 1.09 1.063 1.2453.54 3.42 3.88 3.79
26 24 26 240.948 1.1 1.143 1.215
4.11 4.14 4.21 4.1990 87 90 84
1.106 1.143 1.166 1.2173.68 3.76 3.97 3.77
34 33 32 311.147 1.226 1.257 1.454
3.53 3.94 3.59 3.8234 33 34 33
1.107 0.966 1.104 1.1313.85 3.68 3.93 3.7
46 44 44 430.894 0.983 1.065 1.059
Comprehensive Home-based Services

Region
Rate the need, availability, utlization
Region 14 MeanNStd. Deviation
Region 15 MeanNStd. Deviation
Region 16 MeanNStd. Deviation
Region 17 MeanNStd. Deviation
Region 18 MeanNStd. Deviation
Total MeanNStd. Deviation
Need Availability Utlization Effectiveness
Comprehensive Home-based Services
3.44 3.4 3.8 3.5652 50 51 50
0.938 1.01 1.132 1.113.65 4.06 3.9 3.84
31 31 31 320.985 0.998 0.87 0.884
3.74 4.1 3.82 3.6362 62 62 62
1.039 1.197 1.109 1.1053.66 3.72 3.76 3.42
38 39 37 380.815 0.887 0.925 0.758
3.73 3.7 3.85 3.5667 66 67 66
0.863 0.784 0.909 0.8973.76 3.9 3.9 3.73964 945 948 930
1.016 1.041 1.051 1.103
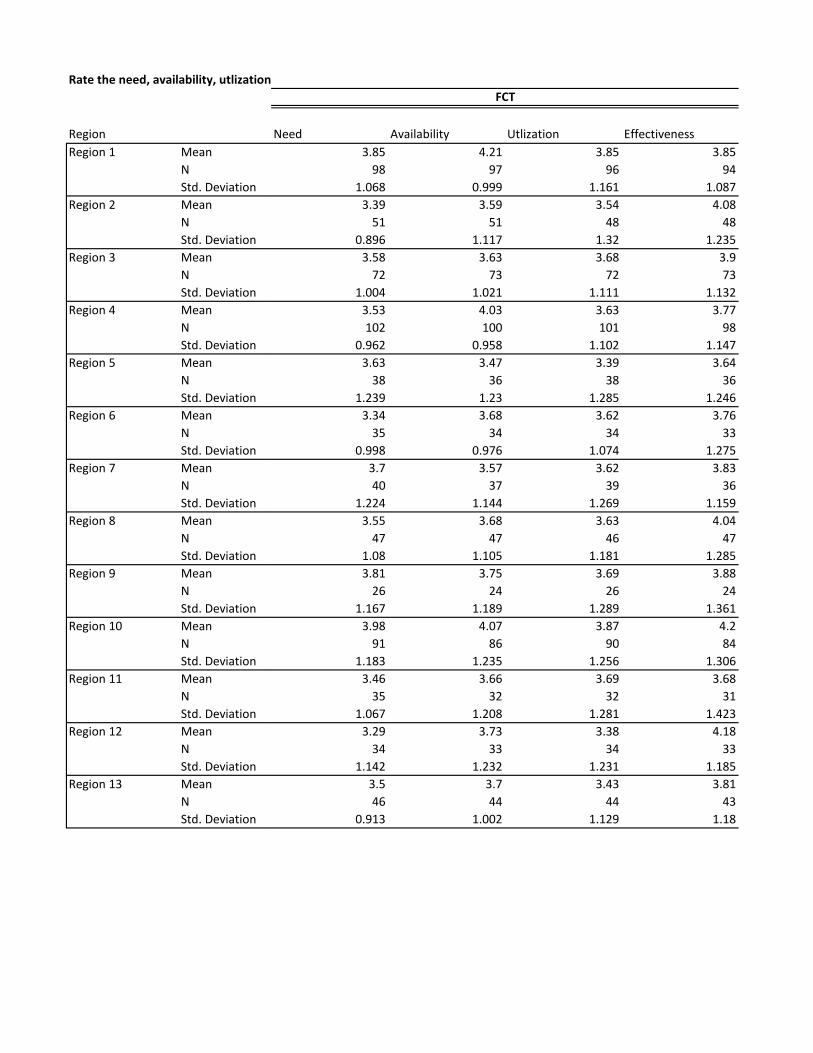
RegionRegion 1 Mean
NStd. Deviation
Region 2 MeanNStd. Deviation
Region 3 MeanNStd. Deviation
Region 4 MeanNStd. Deviation
Region 5 MeanNStd. Deviation
Region 6 MeanNStd. Deviation
Region 7 MeanNStd. Deviation
Region 8 MeanNStd. Deviation
Region 9 MeanNStd. Deviation
Region 10 MeanNStd. Deviation
Region 11 MeanNStd. Deviation
Region 12 MeanNStd. Deviation
Region 13 MeanNStd. Deviation
Rate the need, availability, utlization
Need Availability Utlization Effectiveness3.85 4.21 3.85 3.85
98 97 96 941.068 0.999 1.161 1.087
3.39 3.59 3.54 4.0851 51 48 48
0.896 1.117 1.32 1.2353.58 3.63 3.68 3.9
72 73 72 731.004 1.021 1.111 1.132
3.53 4.03 3.63 3.77102 100 101 98
0.962 0.958 1.102 1.1473.63 3.47 3.39 3.64
38 36 38 361.239 1.23 1.285 1.246
3.34 3.68 3.62 3.7635 34 34 33
0.998 0.976 1.074 1.2753.7 3.57 3.62 3.8340 37 39 36
1.224 1.144 1.269 1.1593.55 3.68 3.63 4.04
47 47 46 471.08 1.105 1.181 1.2853.81 3.75 3.69 3.88
26 24 26 241.167 1.189 1.289 1.361
3.98 4.07 3.87 4.291 86 90 84
1.183 1.235 1.256 1.3063.46 3.66 3.69 3.68
35 32 32 311.067 1.208 1.281 1.423
3.29 3.73 3.38 4.1834 33 34 33
1.142 1.232 1.231 1.1853.5 3.7 3.43 3.8146 44 44 43
0.913 1.002 1.129 1.18
FCT

Region
Rate the need, availability, utlization
Region 14 MeanNStd. Deviation
Region 15 MeanNStd. Deviation
Region 16 MeanNStd. Deviation
Region 17 MeanNStd. Deviation
Region 18 MeanNStd. Deviation
Total MeanNStd. Deviation
Need Availability Utlization Effectiveness
FCT
3.67 3.4 3.73 3.952 50 51 50
1.061 1.195 1.358 1.3593.32 3.71 3.61 4.34
31 31 31 321.077 1.243 1.358 1.285
3.61 4 3.45 3.7162 62 62 62
1.121 1.159 1.263 1.3843.41 3.45 3.46 3.47
37 38 37 380.832 0.76 1.12 1.033
3.55 3.55 3.69 3.5867 66 67 66
0.784 0.826 1.003 1.0093.6 3.78 3.64 3.87
964 941 948 9281.052 1.099 1.197 1.222
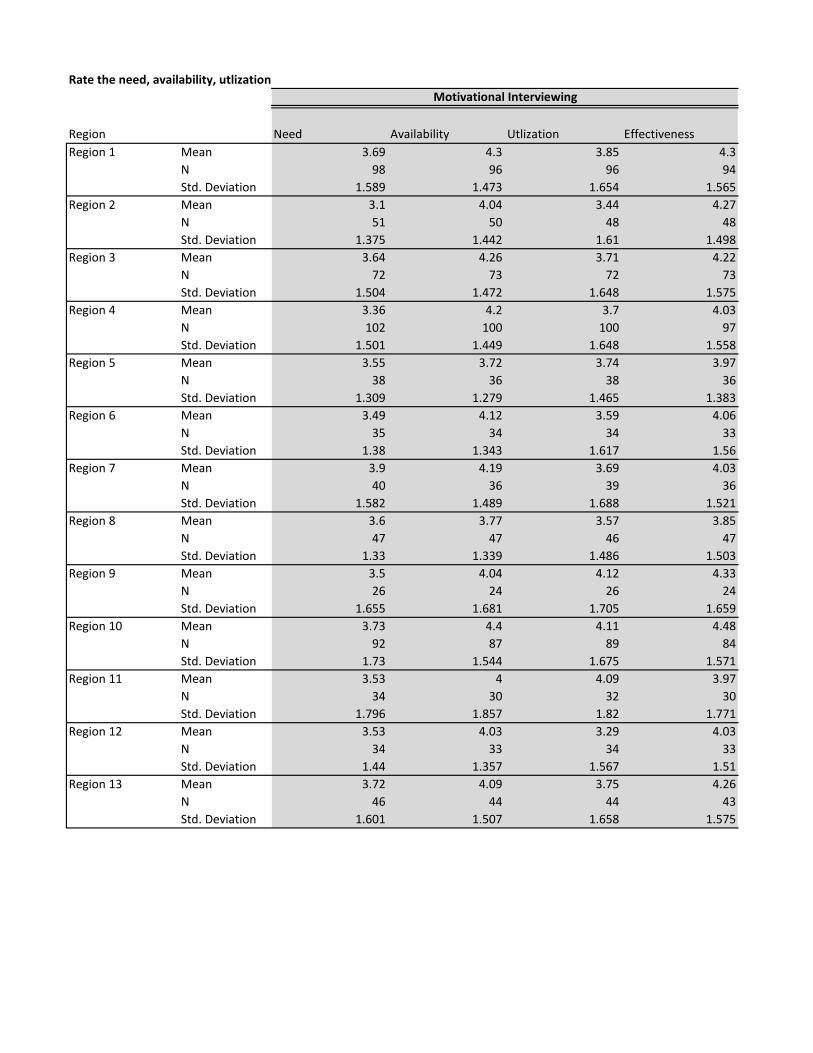
RegionRegion 1 Mean
NStd. Deviation
Region 2 MeanNStd. Deviation
Region 3 MeanNStd. Deviation
Region 4 MeanNStd. Deviation
Region 5 MeanNStd. Deviation
Region 6 MeanNStd. Deviation
Region 7 MeanNStd. Deviation
Region 8 MeanNStd. Deviation
Region 9 MeanNStd. Deviation
Region 10 MeanNStd. Deviation
Region 11 MeanNStd. Deviation
Region 12 MeanNStd. Deviation
Region 13 MeanNStd. Deviation
Rate the need, availability, utlization
Need Availability Utlization Effectiveness3.69 4.3 3.85 4.3
98 96 96 941.589 1.473 1.654 1.565
3.1 4.04 3.44 4.2751 50 48 48
1.375 1.442 1.61 1.4983.64 4.26 3.71 4.22
72 73 72 731.504 1.472 1.648 1.575
3.36 4.2 3.7 4.03102 100 100 97
1.501 1.449 1.648 1.5583.55 3.72 3.74 3.97
38 36 38 361.309 1.279 1.465 1.383
3.49 4.12 3.59 4.0635 34 34 33
1.38 1.343 1.617 1.563.9 4.19 3.69 4.0340 36 39 36
1.582 1.489 1.688 1.5213.6 3.77 3.57 3.8547 47 46 47
1.33 1.339 1.486 1.5033.5 4.04 4.12 4.3326 24 26 24
1.655 1.681 1.705 1.6593.73 4.4 4.11 4.48
92 87 89 841.73 1.544 1.675 1.5713.53 4 4.09 3.97
34 30 32 301.796 1.857 1.82 1.771
3.53 4.03 3.29 4.0334 33 34 33
1.44 1.357 1.567 1.513.72 4.09 3.75 4.26
46 44 44 431.601 1.507 1.658 1.575
Motivational Interviewing

Region
Rate the need, availability, utlization
Region 14 MeanNStd. Deviation
Region 15 MeanNStd. Deviation
Region 16 MeanNStd. Deviation
Region 17 MeanNStd. Deviation
Region 18 MeanNStd. Deviation
Total MeanNStd. Deviation
Need Availability Utlization Effectiveness
Motivational Interviewing
3.63 3.82 3.98 4.3152 50 51 49
1.469 1.637 1.783 1.5443.23 4.03 3.74 4.69
31 31 31 321.477 1.402 1.807 1.469
3.9 4.31 3.76 4.6562 61 62 62
1.705 1.608 1.879 1.63.32 3.56 3.51 3.76
38 39 37 381.21 1.353 1.446 1.4223.45 3.85 3.78 3.82
67 66 67 661.184 1.126 1.358 1.288
3.56 4.09 3.76 4.18965 937 946 925
1.512 1.47 1.642 1.54
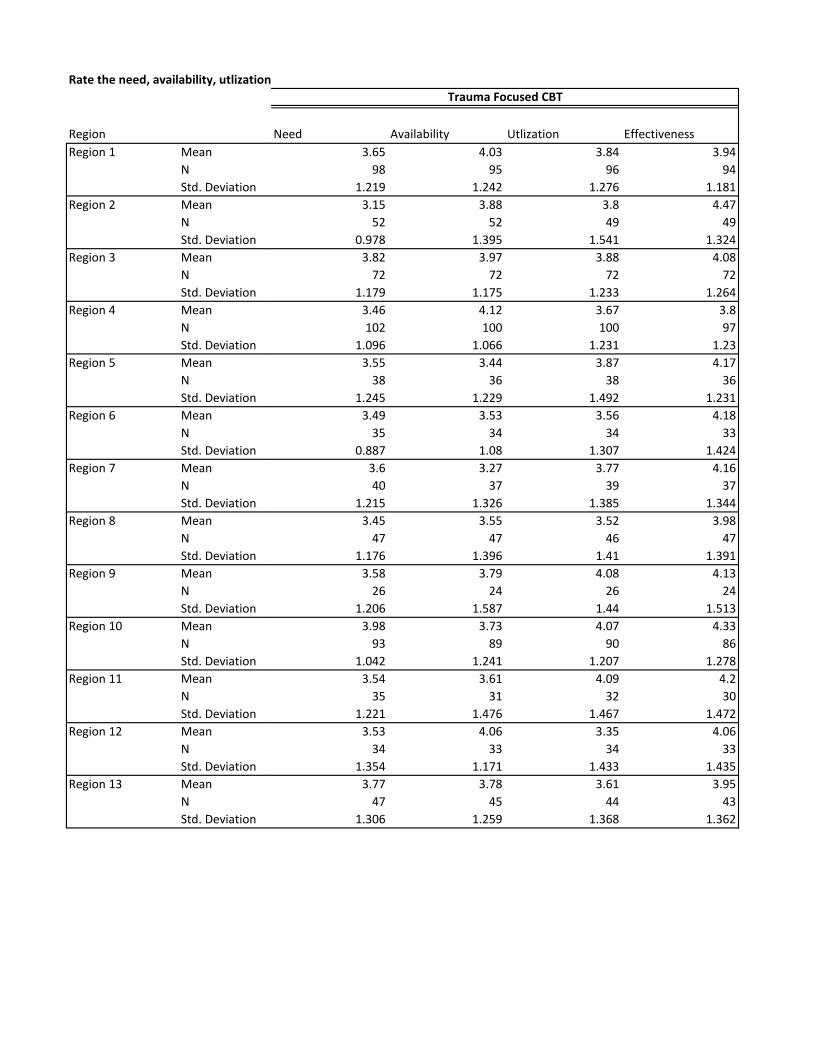
RegionRegion 1 Mean
NStd. Deviation
Region 2 MeanNStd. Deviation
Region 3 MeanNStd. Deviation
Region 4 MeanNStd. Deviation
Region 5 MeanNStd. Deviation
Region 6 MeanNStd. Deviation
Region 7 MeanNStd. Deviation
Region 8 MeanNStd. Deviation
Region 9 MeanNStd. Deviation
Region 10 MeanNStd. Deviation
Region 11 MeanNStd. Deviation
Region 12 MeanNStd. Deviation
Region 13 MeanNStd. Deviation
Rate the need, availability, utlization
Need Availability Utlization Effectiveness3.65 4.03 3.84 3.94
98 95 96 941.219 1.242 1.276 1.181
3.15 3.88 3.8 4.4752 52 49 49
0.978 1.395 1.541 1.3243.82 3.97 3.88 4.08
72 72 72 721.179 1.175 1.233 1.264
3.46 4.12 3.67 3.8102 100 100 97
1.096 1.066 1.231 1.233.55 3.44 3.87 4.17
38 36 38 361.245 1.229 1.492 1.231
3.49 3.53 3.56 4.1835 34 34 33
0.887 1.08 1.307 1.4243.6 3.27 3.77 4.1640 37 39 37
1.215 1.326 1.385 1.3443.45 3.55 3.52 3.98
47 47 46 471.176 1.396 1.41 1.391
3.58 3.79 4.08 4.1326 24 26 24
1.206 1.587 1.44 1.5133.98 3.73 4.07 4.33
93 89 90 861.042 1.241 1.207 1.278
3.54 3.61 4.09 4.235 31 32 30
1.221 1.476 1.467 1.4723.53 4.06 3.35 4.06
34 33 34 331.354 1.171 1.433 1.435
3.77 3.78 3.61 3.9547 45 44 43
1.306 1.259 1.368 1.362
Trauma Focused CBT

Region
Rate the need, availability, utlization
Region 14 MeanNStd. Deviation
Region 15 MeanNStd. Deviation
Region 16 MeanNStd. Deviation
Region 17 MeanNStd. Deviation
Region 18 MeanNStd. Deviation
Total MeanNStd. Deviation
Need Availability Utlization Effectiveness
Trauma Focused CBT
3.58 3.48 3.8 3.9652 50 51 49
1.226 1.374 1.4 1.4433.13 3.94 3.65 4.66
31 31 31 321.088 1.263 1.603 1.26
3.74 4.13 3.74 4.1862 61 62 62
1.425 1.5 1.588 1.5533.32 3.44 3.62 3.82
38 39 37 381.016 1.231 1.341 1.205
3.68 3.68 3.81 3.8366 66 67 66
0.947 1.112 1.246 1.1713.6 3.8 3.78 4.08
968 942 948 9281.169 1.281 1.359 1.324
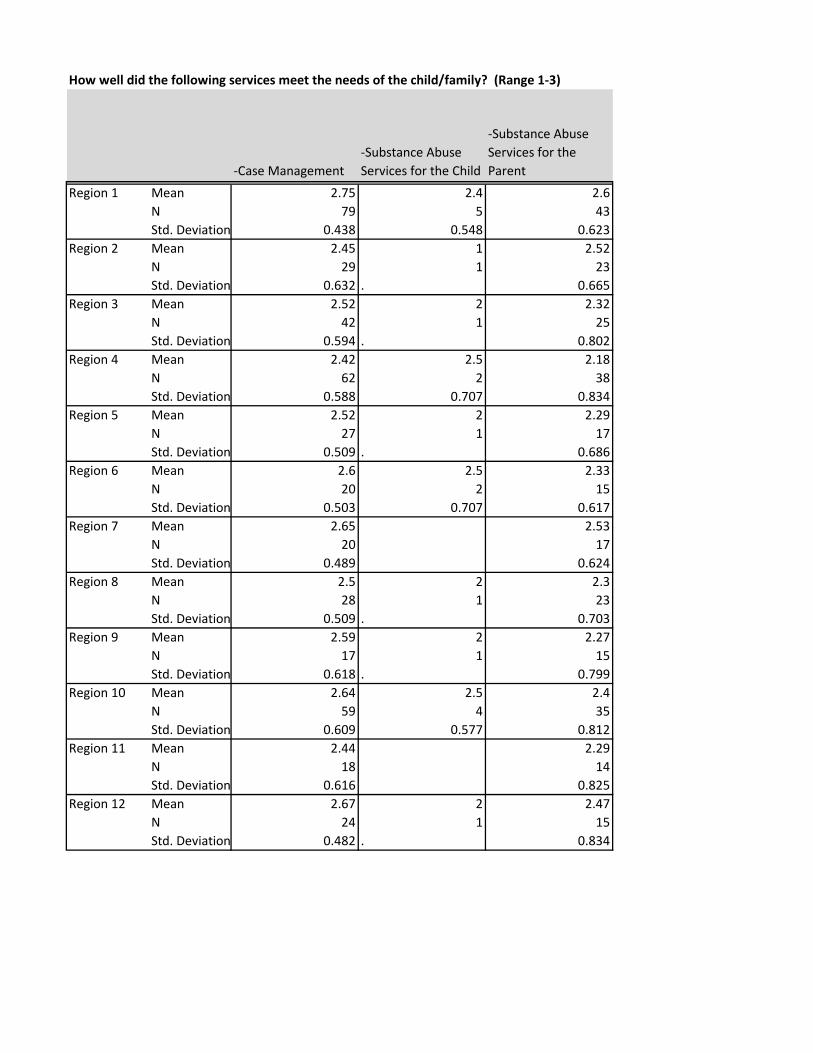
How well did the following services meet the needs of the child/family? (Range 1-3)
-Case Management-Substance Abuse Services for the Child
-Substance Abuse Services for the Parent
Region 1 Mean 2.75 2.4 2.6N 79 5 43Std. Deviation 0.438 0.548 0.623
Region 2 Mean 2.45 1 2.52N 29 1 23Std. Deviation 0.632 . 0.665
Region 3 Mean 2.52 2 2.32N 42 1 25Std. Deviation 0.594 . 0.802
Region 4 Mean 2.42 2.5 2.18N 62 2 38Std. Deviation 0.588 0.707 0.834
Region 5 Mean 2.52 2 2.29N 27 1 17Std. Deviation 0.509 . 0.686
Region 6 Mean 2.6 2.5 2.33N 20 2 15Std. Deviation 0.503 0.707 0.617
Region 7 Mean 2.65 2.53N 20 17Std. Deviation 0.489 0.624
Region 8 Mean 2.5 2 2.3N 28 1 23Std. Deviation 0.509 . 0.703
Region 9 Mean 2.59 2 2.27N 17 1 15Std. Deviation 0.618 . 0.799
Region 10 Mean 2.64 2.5 2.4N 59 4 35Std. Deviation 0.609 0.577 0.812
Region 11 Mean 2.44 2.29N 18 14Std. Deviation 0.616 0.825
Region 12 Mean 2.67 2 2.47N 24 1 15Std. Deviation 0.482 . 0.834
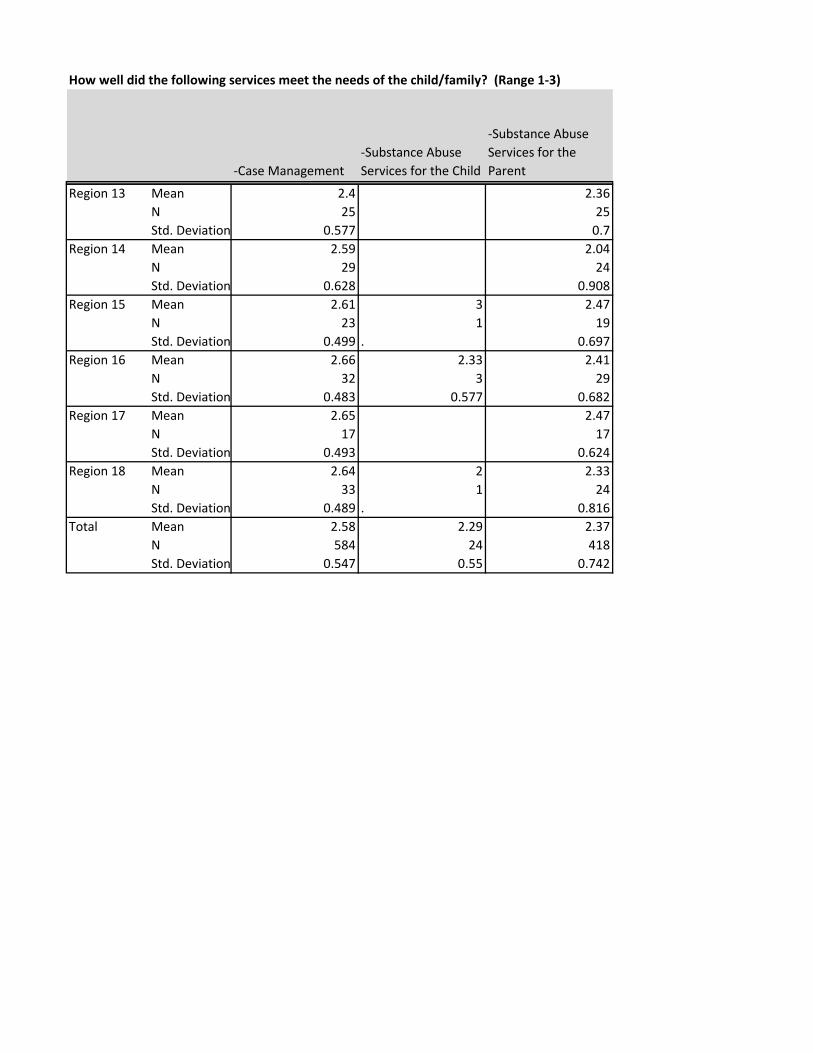
How well did the following services meet the needs of the child/family? (Range 1-3)
-Case Management-Substance Abuse Services for the Child
-Substance Abuse Services for the Parent
Region 13 Mean 2.4 2.36N 25 25Std. Deviation 0.577 0.7
Region 14 Mean 2.59 2.04N 29 24Std. Deviation 0.628 0.908
Region 15 Mean 2.61 3 2.47N 23 1 19Std. Deviation 0.499 . 0.697
Region 16 Mean 2.66 2.33 2.41N 32 3 29Std. Deviation 0.483 0.577 0.682
Region 17 Mean 2.65 2.47N 17 17Std. Deviation 0.493 0.624
Region 18 Mean 2.64 2 2.33N 33 1 24Std. Deviation 0.489 . 0.816
Total Mean 2.58 2.29 2.37N 584 24 418Std. Deviation 0.547 0.55 0.742

How well did the following s
Region 1 MeanNStd. Deviation
Region 2 MeanNStd. Deviation
Region 3 MeanNStd. Deviation
Region 4 MeanNStd. Deviation
Region 5 MeanNStd. Deviation
Region 6 MeanNStd. Deviation
Region 7 MeanNStd. Deviation
Region 8 MeanNStd. Deviation
Region 9 MeanNStd. Deviation
Region 10 MeanNStd. Deviation
Region 11 MeanNStd. Deviation
Region 12 MeanNStd. Deviation
-Housing Services (e.g., rent, utilities)
-Concrete Items/Services (e.g., bedding, clothing, pest control) -Dental Services -Health Care Services
2.42 2.86 2.88 2.8312 22 8 18
0.793 0.351 0.354 0.3832.6 2.85 3 310 20 4 7
0.699 0.366 0 02.67 3 2.67 2.86
9 20 3 70.5 0 0.577 0.378
2.73 2.86 2.85 2.7911 22 13 24
0.467 0.351 0.376 0.4153 3 3 2.713 7 3 70 0 0 0.488
2.67 3 3 33 7 2 6
0.577 0 0 03 2.91 3 37 11 1 30 0.302 . 0
2.64 2.9 3 2.8811 10 5 8
0.505 0.316 0 0.3543 3 3 2.751 2 1 8
. 0 . 0.4632.83 2.85 3 2.85
24 34 2 130.482 0.436 0 0.376
3 3 2.51 3 2
. 0 0.7072.8 2.87 3 2.8610 15 2 7
0.422 0.352 0 0.378

How well did the following s
Region 13 MeanNStd. Deviation
Region 14 MeanNStd. Deviation
Region 15 MeanNStd. Deviation
Region 16 MeanNStd. Deviation
Region 17 MeanNStd. Deviation
Region 18 MeanNStd. Deviation
Total MeanNStd. Deviation
-Housing Services (e.g., rent, utilities)
-Concrete Items/Services (e.g., bedding, clothing, pest control) -Dental Services -Health Care Services
2.83 2.77 3 36 13 5 7
0.408 0.439 0 02.57 2.9 3 2.92
7 10 8 130.787 0.316 0 0.277
2.67 2.89 3 2.63 9 1 5
0.577 0.333 . 0.5482.83 2.85 3 2.89
6 13 9 180.408 0.376 0 0.323
2.33 2.83 2.67 33 6 3 6
1.155 0.408 0.577 02.83 2.75 2.83 2.54
6 16 6 130.408 0.577 0.408 0.66
2.72 2.88 2.92 2.83133 240 76 172
0.542 0.356 0.271 0.391

How well did the following s
Region 1 MeanNStd. Deviation
Region 2 MeanNStd. Deviation
Region 3 MeanNStd. Deviation
Region 4 MeanNStd. Deviation
Region 5 MeanNStd. Deviation
Region 6 MeanNStd. Deviation
Region 7 MeanNStd. Deviation
Region 8 MeanNStd. Deviation
Region 9 MeanNStd. Deviation
Region 10 MeanNStd. Deviation
Region 11 MeanNStd. Deviation
Region 12 MeanNStd. Deviation
-Mental Health Services for the Child
-Mental Health Services for the Parent
-Developmental/Disability Services
-Older Youth Services (e.g., employment, independent living, education)
2.67 2.47 1.67 2.5630 45 3 9
0.479 0.625 0.577 0.7262.43 2.35 2.5 1.5
14 20 2 20.646 0.587 0.707 0.707
2.5 2.41 2.226 29 5
0.51 0.682 0.4472.51 2.14 2.6 2.6
35 44 5 50.507 0.668 0.548 0.894
2.53 2.5 3 215 20 1 1
0.516 0.607 . .2.36 2.29 3
11 14 10.505 0.469 .
2.27 2.16 2.5 311 19 2 1
0.467 0.688 0.707 .2.54 2.25 2 2
13 20 1 20.519 0.639 . 0
2.38 2.07 3 28 14 2 1
0.744 0.73 0 .2.68 2.34 3 2.83
22 29 1 60.477 0.67 . 0.408
2.67 2.5 39 10 1
0.5 0.527 .2.31 2.31 3
13 16 30.48 0.602 0
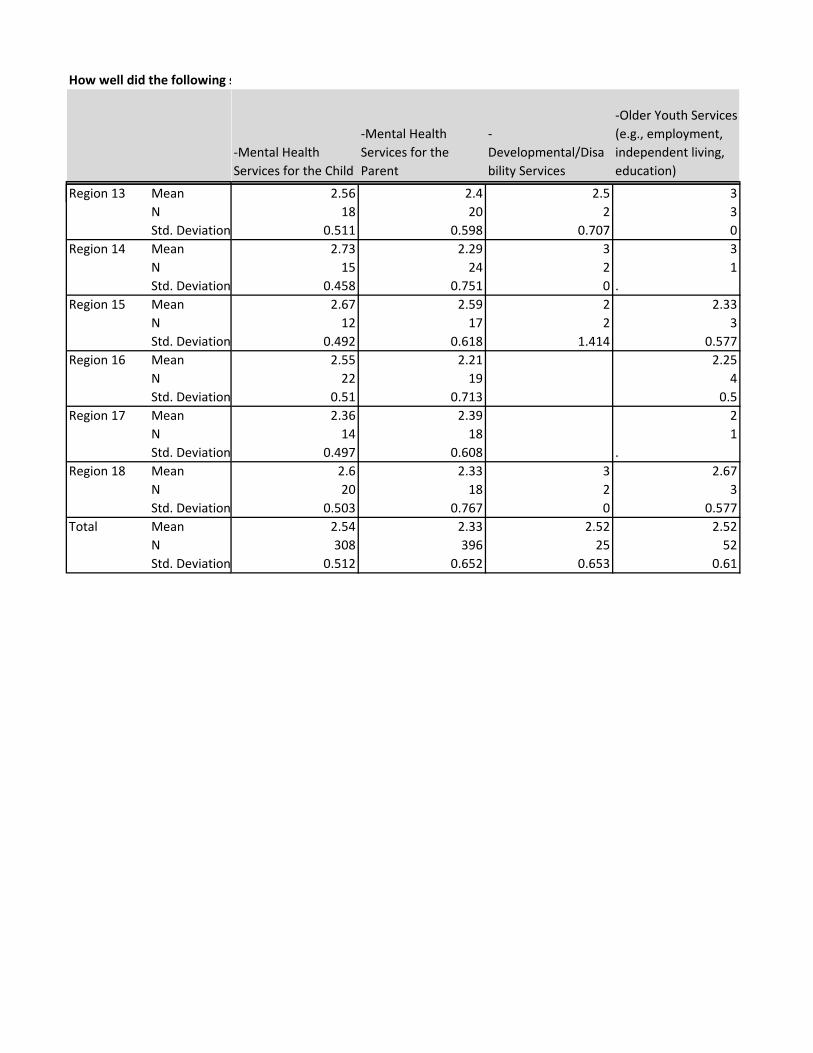
How well did the following s
Region 13 MeanNStd. Deviation
Region 14 MeanNStd. Deviation
Region 15 MeanNStd. Deviation
Region 16 MeanNStd. Deviation
Region 17 MeanNStd. Deviation
Region 18 MeanNStd. Deviation
Total MeanNStd. Deviation
-Mental Health Services for the Child
-Mental Health Services for the Parent
-Developmental/Disability Services
-Older Youth Services (e.g., employment, independent living, education)
2.56 2.4 2.5 318 20 2 3
0.511 0.598 0.707 02.73 2.29 3 3
15 24 2 10.458 0.751 0 .
2.67 2.59 2 2.3312 17 2 3
0.492 0.618 1.414 0.5772.55 2.21 2.25
22 19 40.51 0.713 0.52.36 2.39 2
14 18 10.497 0.608 .
2.6 2.33 3 2.6720 18 2 3
0.503 0.767 0 0.5772.54 2.33 2.52 2.52308 396 25 52
0.512 0.652 0.653 0.61
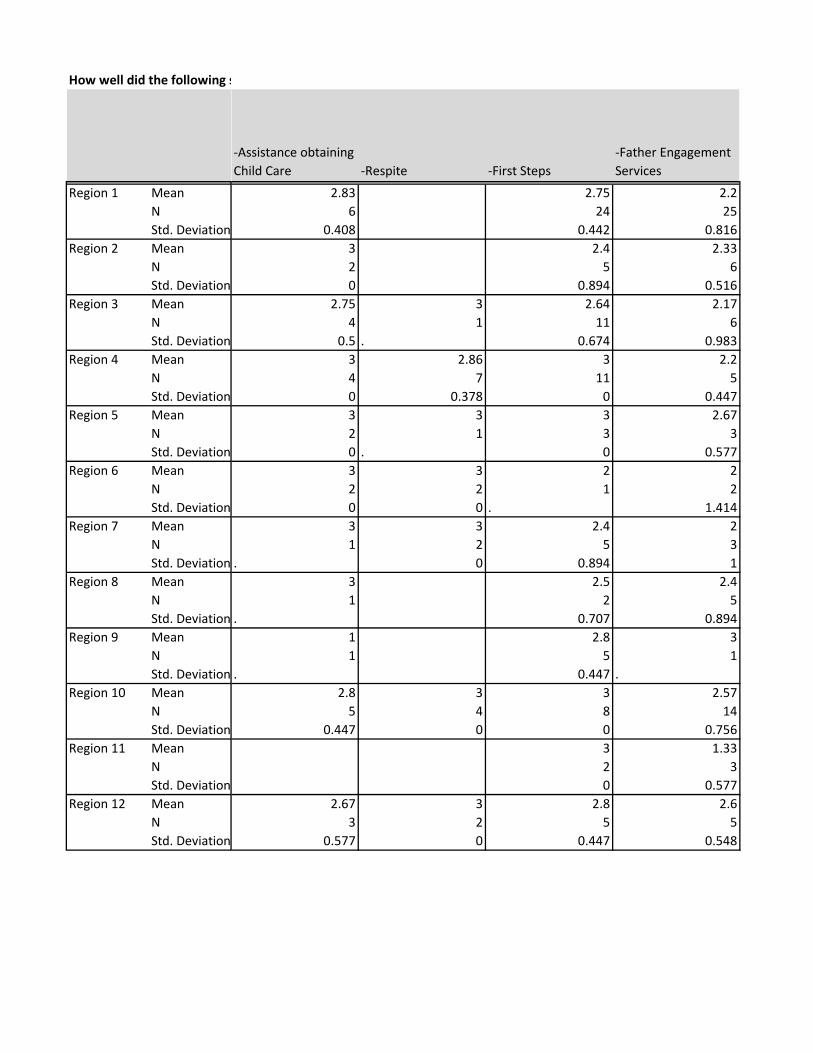
How well did the following s
Region 1 MeanNStd. Deviation
Region 2 MeanNStd. Deviation
Region 3 MeanNStd. Deviation
Region 4 MeanNStd. Deviation
Region 5 MeanNStd. Deviation
Region 6 MeanNStd. Deviation
Region 7 MeanNStd. Deviation
Region 8 MeanNStd. Deviation
Region 9 MeanNStd. Deviation
Region 10 MeanNStd. Deviation
Region 11 MeanNStd. Deviation
Region 12 MeanNStd. Deviation
-Assistance obtaining Child Care -Respite -First Steps
-Father Engagement Services
2.83 2.75 2.26 24 25
0.408 0.442 0.8163 2.4 2.332 5 60 0.894 0.516
2.75 3 2.64 2.174 1 11 6
0.5 . 0.674 0.9833 2.86 3 2.24 7 11 50 0.378 0 0.4473 3 3 2.672 1 3 30 . 0 0.5773 3 2 22 2 1 20 0 . 1.4143 3 2.4 21 2 5 3
. 0 0.894 13 2.5 2.41 2 5
. 0.707 0.8941 2.8 31 5 1
. 0.447 .2.8 3 3 2.57
5 4 8 140.447 0 0 0.756
3 1.332 30 0.577
2.67 3 2.8 2.63 2 5 5
0.577 0 0.447 0.548
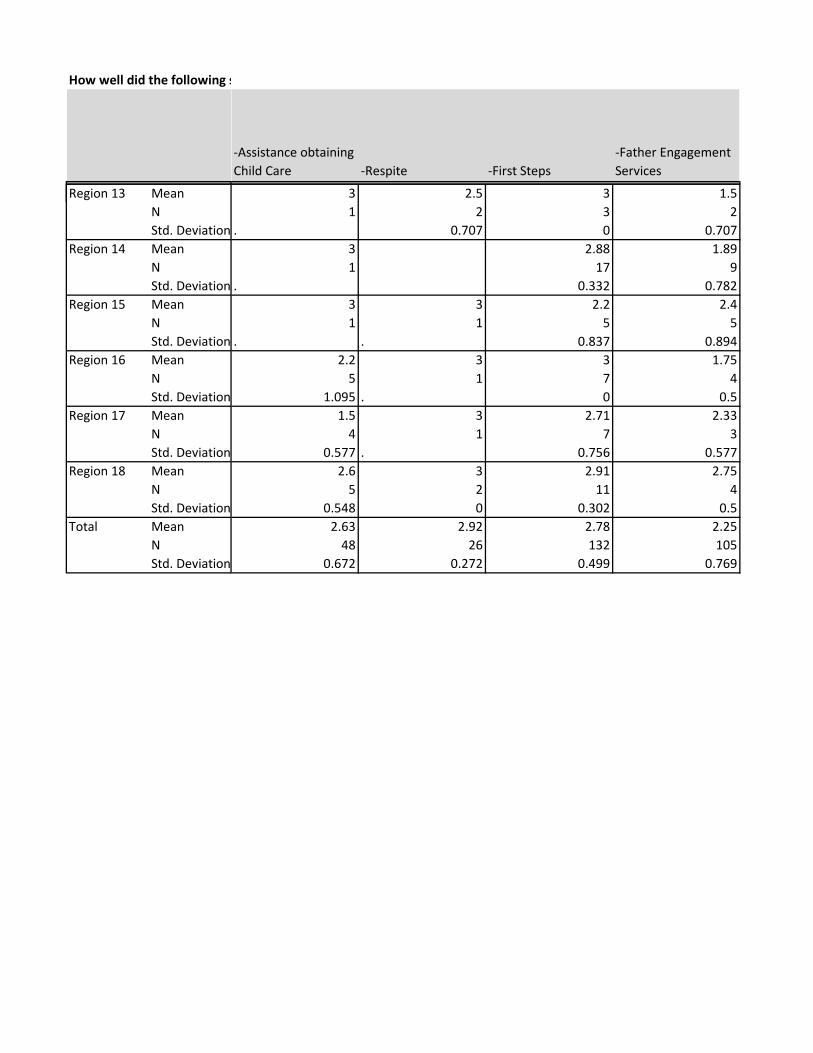
How well did the following s
Region 13 MeanNStd. Deviation
Region 14 MeanNStd. Deviation
Region 15 MeanNStd. Deviation
Region 16 MeanNStd. Deviation
Region 17 MeanNStd. Deviation
Region 18 MeanNStd. Deviation
Total MeanNStd. Deviation
-Assistance obtaining Child Care -Respite -First Steps
-Father Engagement Services
3 2.5 3 1.51 2 3 2
. 0.707 0 0.7073 2.88 1.891 17 9
. 0.332 0.7823 3 2.2 2.41 1 5 5
. . 0.837 0.8942.2 3 3 1.75
5 1 7 41.095 . 0 0.5
1.5 3 2.71 2.334 1 7 3
0.577 . 0.756 0.5772.6 3 2.91 2.75
5 2 11 40.548 0 0.302 0.5
2.63 2.92 2.78 2.2548 26 132 105
0.672 0.272 0.499 0.769
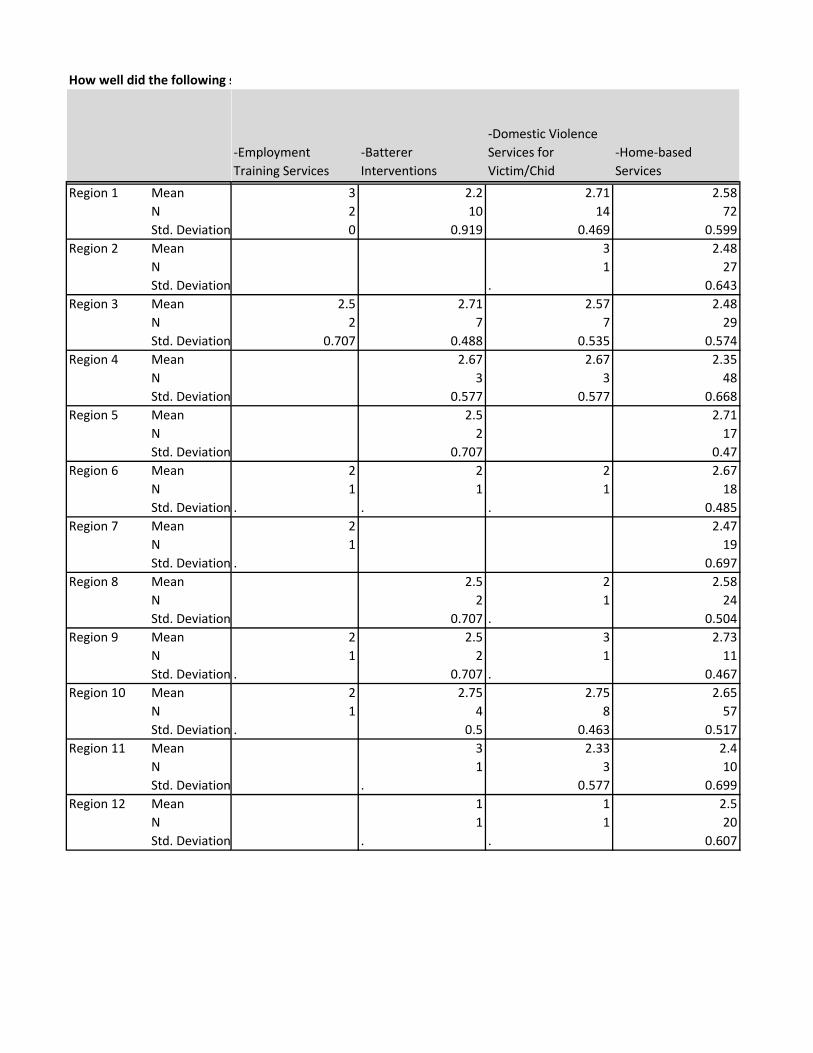
How well did the following s
Region 1 MeanNStd. Deviation
Region 2 MeanNStd. Deviation
Region 3 MeanNStd. Deviation
Region 4 MeanNStd. Deviation
Region 5 MeanNStd. Deviation
Region 6 MeanNStd. Deviation
Region 7 MeanNStd. Deviation
Region 8 MeanNStd. Deviation
Region 9 MeanNStd. Deviation
Region 10 MeanNStd. Deviation
Region 11 MeanNStd. Deviation
Region 12 MeanNStd. Deviation
-Employment Training Services
-Batterer Interventions
-Domestic Violence Services for Victim/Chid
-Home-based Services
3 2.2 2.71 2.582 10 14 720 0.919 0.469 0.599
3 2.481 27
. 0.6432.5 2.71 2.57 2.48
2 7 7 290.707 0.488 0.535 0.574
2.67 2.67 2.353 3 48
0.577 0.577 0.6682.5 2.71
2 170.707 0.47
2 2 2 2.671 1 1 18
. . . 0.4852 2.471 19
. 0.6972.5 2 2.58
2 1 240.707 . 0.504
2 2.5 3 2.731 2 1 11
. 0.707 . 0.4672 2.75 2.75 2.651 4 8 57
. 0.5 0.463 0.5173 2.33 2.41 3 10
. 0.577 0.6991 1 2.51 1 20
. . 0.607
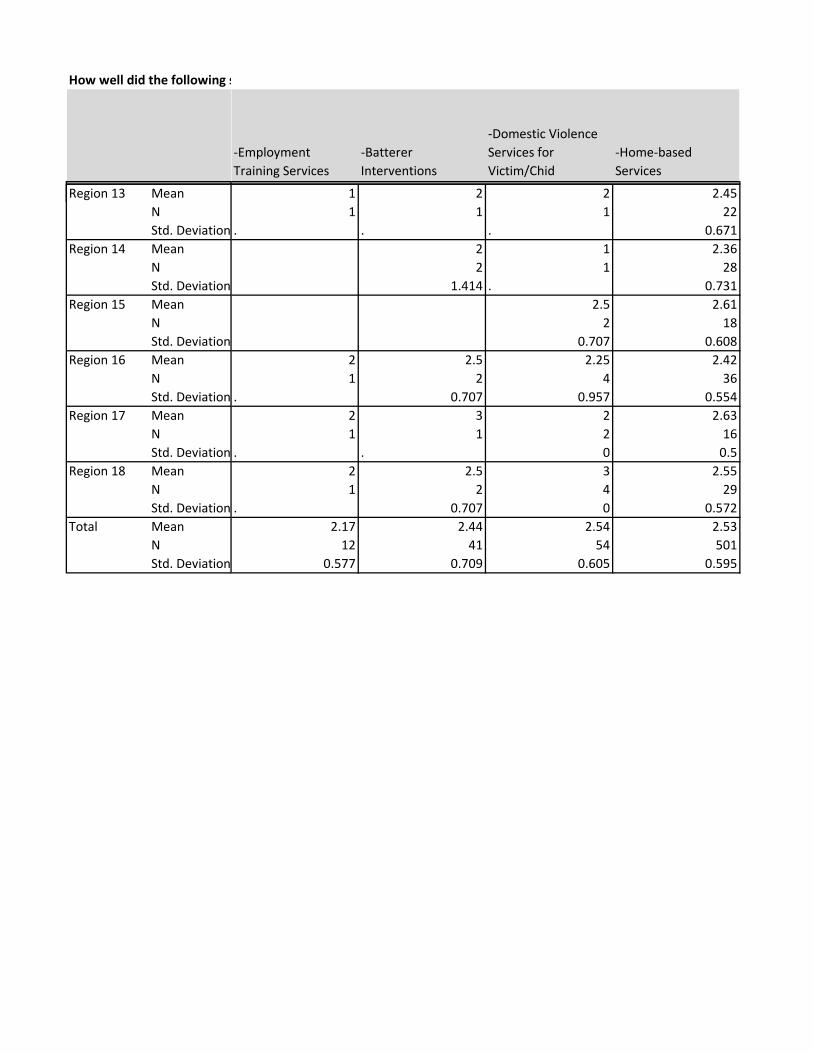
How well did the following s
Region 13 MeanNStd. Deviation
Region 14 MeanNStd. Deviation
Region 15 MeanNStd. Deviation
Region 16 MeanNStd. Deviation
Region 17 MeanNStd. Deviation
Region 18 MeanNStd. Deviation
Total MeanNStd. Deviation
-Employment Training Services
-Batterer Interventions
-Domestic Violence Services for Victim/Chid
-Home-based Services
1 2 2 2.451 1 1 22
. . . 0.6712 1 2.362 1 28
1.414 . 0.7312.5 2.61
2 180.707 0.608
2 2.5 2.25 2.421 2 4 36
. 0.707 0.957 0.5542 3 2 2.631 1 2 16
. . 0 0.52 2.5 3 2.551 2 4 29
. 0.707 0 0.5722.17 2.44 2.54 2.53
12 41 54 5010.577 0.709 0.605 0.595
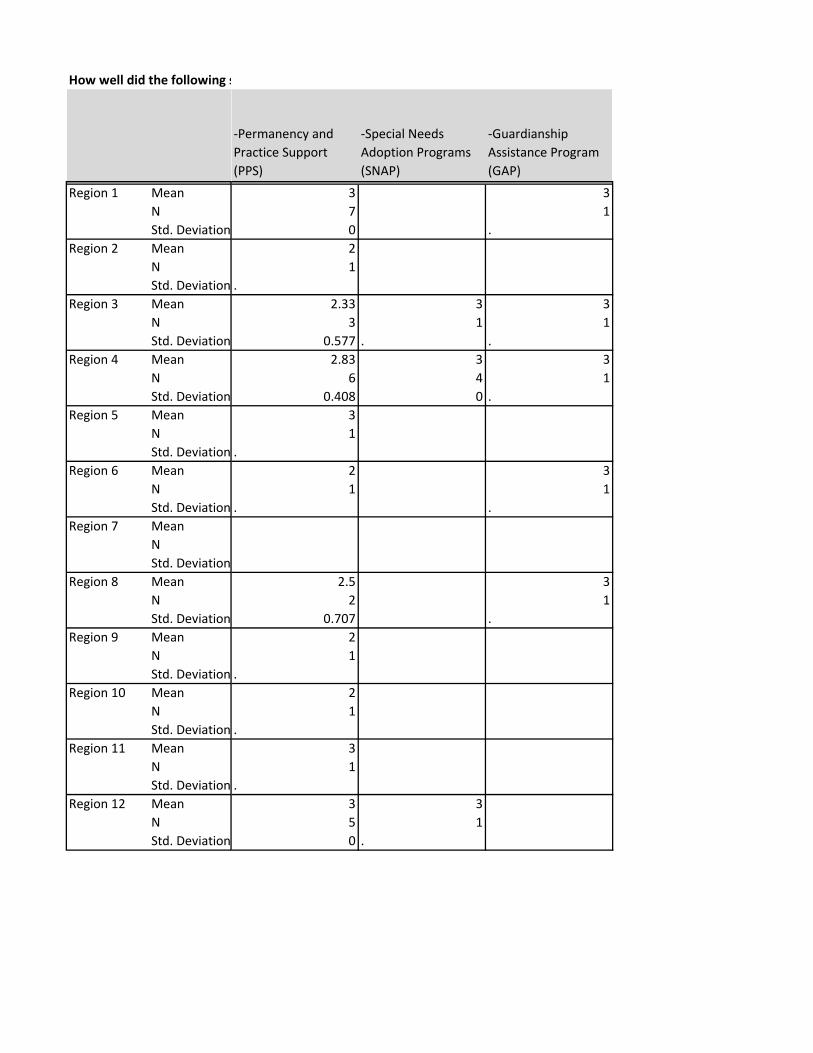
How well did the following s
Region 1 MeanNStd. Deviation
Region 2 MeanNStd. Deviation
Region 3 MeanNStd. Deviation
Region 4 MeanNStd. Deviation
Region 5 MeanNStd. Deviation
Region 6 MeanNStd. Deviation
Region 7 MeanNStd. Deviation
Region 8 MeanNStd. Deviation
Region 9 MeanNStd. Deviation
Region 10 MeanNStd. Deviation
Region 11 MeanNStd. Deviation
Region 12 MeanNStd. Deviation
-Permanency and Practice Support (PPS)
-Special Needs Adoption Programs (SNAP)
-Guardianship Assistance Program (GAP)
3 37 10 .21
.2.33 3 3
3 1 10.577 . .
2.83 3 36 4 1
0.408 0 .31
.2 31 1
. .
2.5 32 1
0.707 .21
.21
.31
.3 35 10 .
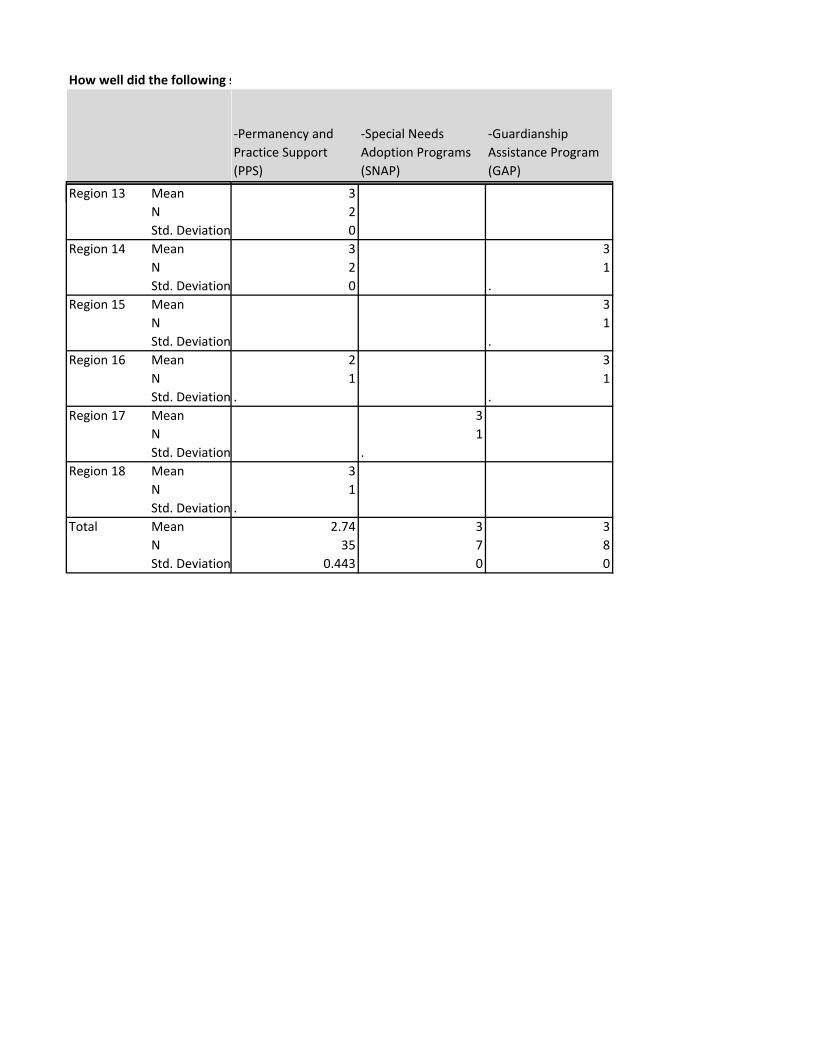
How well did the following s
Region 13 MeanNStd. Deviation
Region 14 MeanNStd. Deviation
Region 15 MeanNStd. Deviation
Region 16 MeanNStd. Deviation
Region 17 MeanNStd. Deviation
Region 18 MeanNStd. Deviation
Total MeanNStd. Deviation
-Permanency and Practice Support (PPS)
-Special Needs Adoption Programs (SNAP)
-Guardianship Assistance Program (GAP)
3203 32 10 .
31
.2 31 1
. .31
.31
.2.74 3 3
35 7 80.443 0 0
Appendix C – Public Testimony
Public Announcement

Michael R. Pence, Governor
Mary Beth Bonaventura, Director
Indiana Department of Child Services Lake County Office
661 Broadway Gary, Indiana 46402
219-881-2000 Fax: 219-881-2013
www.in.gov/dcs
Child Support Hotline: 800-840-8757 Child Abuse and Neglect Hotline: 800-800-5556
Protecting our children, families and future
Public Meeting Biannual Plan Meeting
Regional Services Council
Monday, December 11, 2017 @ 3:30 p.m. Lake County Juvenile Justice Complex
3000 West 93rd Avenue Crown Point, IN
Please be advised there will be a meeting of the Lake County Regional Services Council at the above stated date and time.
Appendix D – Additional Region Data
Prevention Data

Community Partners for Child Safety FFY 2016 Report – Region 1
Region 1 Data Tables
Category (Total Number of Families N=2,174)
Number of Families Percent
Rent/Utilities 600 28% Job Training/Employment 446 21% Subsidized Housing 437 20% Child Behavior 370 17% Child Care Assistance 253 12% Counseling 28 1% Transportation 142 7% Emergency Food 150 7% Information on Budgeting 11 1% School Issues 292 13% Medical Services 89 4% Shelter 215 10% Information on Medicaid 107 5% Information on Food 99 5% Disabilities 116 5% Feeling Hopeless 105 5% Adult Education 8 0% WIC 101 5% Household Organization 9 0% Infant Car Seat 13 1% Safety Issues 60 3% Information on TANF 67 3% Alcohol/Drug Abuse 37 2% Immunizations 6 0% Family Planning 3 0% Information on Lead Test 4 0% Head Lice 1 0% Information on TB Test 2 0% Pregnancy Test 0 0%

Referral Source Number of Referrals Percent
Unknown 20 0.91% Adult Probation 2 0.09% Community Agency 892 40.79% Department of Child Services 430 19.66%
Faith Based Organization 32 1.46% Family / Neighbor 234 10.70% Healthy Families 5 0.23% Juvenile probation 5 0.23% Legal System 156 7.13% Medical System 25 1.14% Mental health center 13 0.59% Other CPCS Region 0 0.00% School 114 5.21% Self 259 11.84%
Total 2,187 100.00%
Direct Service Activities Number Percent Community Outing 1 0.01% Crisis Intervention 0.00% Drop-by Visit 5074 28.01%
Electronic Message Received 24 0.13%
Electronic Message Sent 48 0.26% Group 1 0.01% Home Visit 4201 23.19% Homebased Therapy 0.00% Interpretation support 0.00% Other direct contact with participants 6 0.03%
Other site visit 829 4.58% Other site visit w/transportation 47 0.26%
Parenting Class 4 0.02% Phone contact 7830 43.22% Provided Transportation 1 0.01% School Visit 49 0.27%
Total 18,115 100.00%
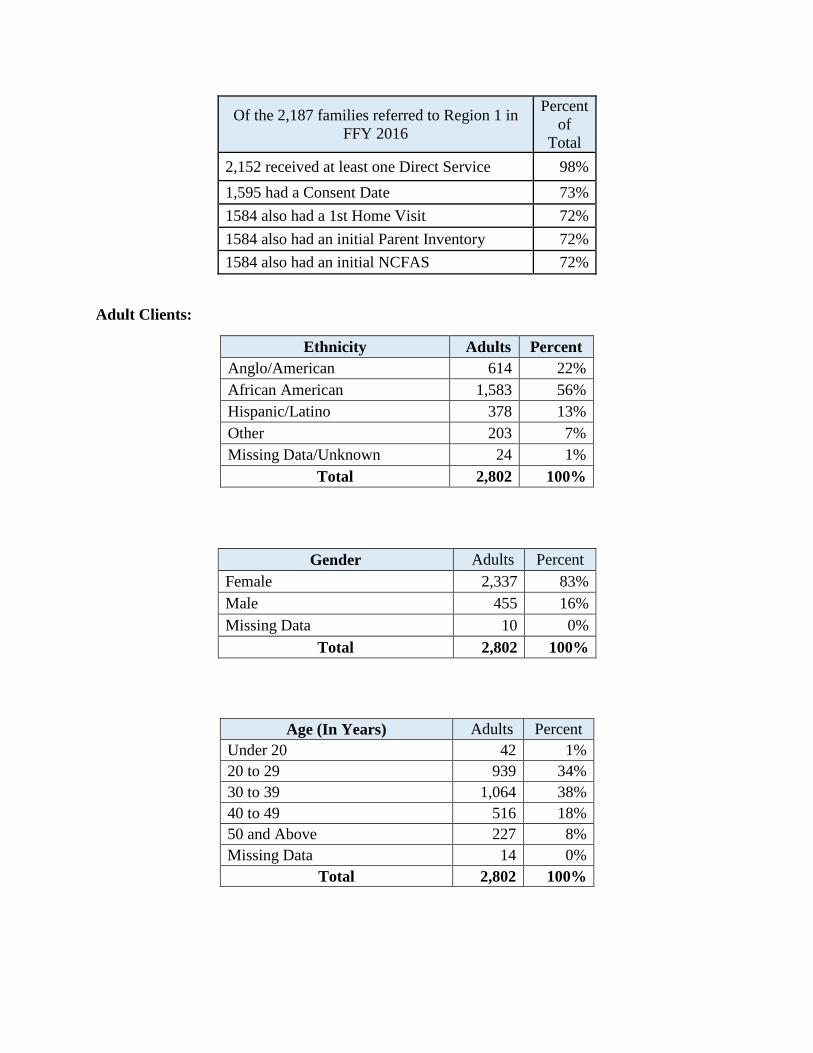
Of the 2,187 families referred to Region 1 in FFY 2016
Percent of
Total 2,152 received at least one Direct Service 98% 1,595 had a Consent Date 73% 1584 also had a 1st Home Visit 72% 1584 also had an initial Parent Inventory 72% 1584 also had an initial NCFAS 72%
Adult Clients:
Ethnicity Adults Percent Anglo/American 614 22% African American 1,583 56% Hispanic/Latino 378 13% Other 203 7% Missing Data/Unknown 24 1%
Total 2,802 100%
Gender Adults Percent Female 2,337 83% Male 455 16% Missing Data 10 0%
Total 2,802 100%
Age (In Years) Adults Percent Under 20 42 1% 20 to 29 939 34% 30 to 39 1,064 38% 40 to 49 516 18% 50 and Above 227 8% Missing Data 14 0%
Total 2,802 100%

Employment Status Adults Percent Employed Full Time 774 28% Employed Part Time 451 16% Homemaker 20 1% Retired 14 0% Seasonal 14 0% Student 18 1% Unemployed Not Seeking Work 559 20% Unemployed Seeking Work 915 33% Missing Data/Unknown 37 1%
Total 2,802 100%
Marital Status Adults Percent Divorced 202 7% Living with Partner 74 3% Married 527 19% Separated 147 5% Single 1,738 62% Widowed 42 1% Missing Data/Unknown 72 3%
Total 2,802 100%
Education Level Adults Percent 8th Grade or less 45 2% Some High School 490 17% High School Graduate/GED 1,138 41% Some College 700 25% Two Year Degree 176 6% Four Year College Degree 119 4% Graduate School 34 1% Missing Data/Unknown 100 4%
Total 2,802 100%
Number of Adults Adults with Disabilities Percent
2,802 318 11%

Juvenile Clients:
Ethnicity
Children Percent Anglo/American 901 16% African American 3,624 64% Hispanic/Latino 692 12% Other 409 7% Missing Data/Unknown 49 1%
Total 5,675 100%
Gender
Children Percent Female 2,823 50% Male 2,849 50% Missing Data 3 0%
Total 5,675 100%
Number of Children Children
with Disabilities
Percent
5,675 761 13%
Of the 2170 families that terminated services in FFY 2016
Percent of Total
1,839 received at least one Face to Face Contact 85%
1,602 had a Consent Date 74%
487 also had 8 or more Face to Face Contacts 22%
3,969 had a Follow-Up Parent Inventory 20% 5,959 had a Follow-Up NCFAS 30%

Length Of Service (Consent Date to Termination Date) Count Percent
0 to 30 Days 212 13% 31 to 60 Days 515 32% 61 to 90 Days 442 28% 91 to 120 Days 278 17% 121 to 150 Days 91 6% 151 to 180 Days 37 2% 181 to 210 Days 15 1% 211 to 240 Days 7 0% 241 to 270 Days 2 0% More than 270 Days 0%
Total 1,599 100%
Appendix D – Additional Region Data
Links to Additional
Reports and Maps
Please see the corresponding links for the following reports and maps.
Maltreatment After Involvement –
http://in.gov/dcs/files/repeatmaltreatment201709.pdf Permanency for Children Out of Home More than 24 Months
http://in.gov/dcs/files/lengthofstay2017109.pdf Regional Managers Map –
http://in.gov/dcs/files/Regional_Managers_Directory_Map.pdf Regional Child Welfare Services Coordinator Map -
http://in.gov/dcs/files/Child%20Welfare%20Services%20Coord%20Map_Mar2017.pdf


