10
Mount McKinley, Denali National Park, Alaska mortality 259

Mount McKinley, Denali National Park, Alaska
mortality
259

2012USRDSannualDataRepoRt
volumeESRD
260
mortality
2
introductionintroduction
ssessing mortality in the ESRD population is a unique challenge, in that two sources of death records are
available to the USRDS Coordinating Center (CC).Universal reporting to CMS of ESRD patient deaths is required as a condition
of coverage for dialysis units and transplant centers. Since all ESRD patients have Social Security numbers, the CC can also link patients to the National Death Index files, which are added to the Medicare and Social Security enrollment databases. The USRDS was formerly able to report deaths only from day 90 of treatment, as Medicare did not cover services for those younger than 65; now, however, the comprehensive tracking of all ESRD patient deaths allows the USRDS to identify all deaths occurring after the first outpatient dialysis session.
Between 1993 and 2003 there was little improvement in first-year death rates in the ESRD population. Between 2003 and 2009, however, these rates fell more than 14 percent, while second-year death rates declined 16.5 percent. Month-by-month mortality rates in the first year of hemodialysis have shown similar improvements, overall and for deaths due to cardiovascular disease and infection. Progress has been made as well in mortality due to infection, and to a greater extent than seen with cardiovascular deaths. Mortality due to other causes, in contrast, has increased since 1999, a finding which requires further investigation. Still striking are the high rates of all-cause mortality in the early months of therapy, and the fact that mortality in the dialysis population remains ten times greater than among Medicare patients of similar age without kidney disease.
In the prevalent population, mortality rates have declined nearly 25 percent over the last two decades, and 19 percent since 2000.
Despite these improvements, however, only 51 percent of dialysis patients, and 82 percent of those who receive a preemptive transplant, are still alive three years after the start of ESRD therapy — numbers that help illustrate the extreme vul-nerability of these patients when compared to the general population. Among dialysis patients age 65 and older, for example, mortality is twice as high as for patients in the general population who have diabetes, cancer, congestive heart failure, CVA/TIA, or AMI.
Patients with kidney disease are clearly at a high risk of death and, as shown in the hospitalization data, have very high event rates as well. In Chapter Three
Our dead never forget the
beautiful world that gave them
being. They still love its winding
rivers, its great mountains
and its sequestered vales, and
they ever yearn in tenderest
affection over the lonely-
hearted living, and often return
to visit and comfort them.
ChiEf SEattlE
262 mortality & survival
264 mortality in the general & ESRD populations
266 mortality rates by interdialytic interval
268 summary

81 85 89 93 97 01 05 09
150
200
250
300
350
1st year 2nd year 3rd year 4th year 5th year
81 85 89 93 97 01 05 090
100
200
300
400
500Peritoneal dialysis
All patients Hemodialysis
Dea
ths
per 1
,000
pat
ient
yea
rs a
t ris
k
Transplant
261
we examine hospitalization rates by interdialytic interval; here we look at the interval in terms of mortality. Deaths due to infection, for example, peak on the day after the first run of the week. Thrice-weekly treatment may be inadequate for addressing the critical problems of persistent fluid overload, hypertension, and left ventricular hypertrophy. Recent publication of the Frequent Hemodialysis Trial (NEJM Nov 2010), comparing treatment of three days per week to that of six days, demonstrated significant reductions in left ventricular hypertrophy and hyperphosphatemia among patients receiving more frequent therapy. Mortality comparisons still need to be considered, as do questions of how more frequent sessions might be implemented across the country. In the meantime, there should be a focus on improving care and outcomes through medication interventions and reductions in the use of dialysis catheters, with their high rates of associated complications. » Figure 5.1; see page 438 for analytical methods. Incident ESRD patients. Adj: age/gender/race/primary diagnosis; ref: incident ESRD patients, 2005.
5.1 Adjusted all-cause mortality rates (from
day 90), by modality & year of treatmentvol 2

<20 20-44 45-64 65+Dea
ths
per 1
,000
pat
ient
yea
rs a
t ris
k
0
100
200
300ESRD Dialysis Transplant General Medicare
86 90 94 98 02 06 10
Dea
ths p
er 1
,000
pat
ient
yea
rs a
t ris
k
150
175
200
225
250
275
300
<2 years
2-<5 years 5+ years
All
Dea
ths p
er 1
,000
pat
ient
yea
rs a
t ris
k
0
100
200
300
400
500
199920042009
All-cause Cardiovascular disease
2 4 6 8 10 120
100
200
300
Months after initiation
2 4 6 8 10 12
Infection Other
mortality
2
2012USRDSannualDataRepoRt
volumeESRD
262
mortality & survival
Adjusted rates of all-cause mortality are 6.3–8.2 times greater for dialysis patients than for individuals in the general popula-tion. For renal transplant patients, rates approach those of the general population, yet remain 1.1–1.5 times higher. Rates rise by age, reaching 264 per 1,000 patient years at risk for ESRD patients age 65 and older, and 304 for dialysis patients of the same age. » Figure 5.2; see page 438 for analytical methods. Prevalent ESRD & general Medicare (non-ESRD) patients. Adj: gender/race; ref: Medicare patients, 2010.
Through the 1980s, patients newer to dialysis had higher mor-tality rates than those on treatment for five years or more. This trend began to change in the early 1990s, and in 2010 the rate of 222 per 1,000 patient years in patients receiving hemodialysis therapy for five or more years was 17 percent higher than the rate of 190 in patients treated for less than two years. » Figure 5.4; see page 438 for analytical methods. Period prevalent hemodialysis patients. Adj: age/gender/race/primary diagnosis; ref: hemodi-alysis patients, 2005.
In the first year of hemodialysis, all-cause mortality and mor-tality due to cardiovascular disease or to other causes peak in month two following initiation, then fall. For incident hemodi-alysis patients in 2009, for example, all-cause mortality reached 435 deaths per 1,000 patient years at risk in month two, then fell to 206 in month 12. Cardiovascular mortality peaked at 169, and decreased to 78. Mortality due to infection peaks in months 2 and 3, at 40–43 per 1,000 patient deaths. » Figure 5.3; see page 438 for analytical methods. Incident hemodialysis patients defined on the day of dialysis onset, without the 60-day rule. Adj: age/gender/race/Hispanic ethnicity/primary diagnosis; ref: inci-dent hemodialysis patients, 2005.
5.2 Adjusted all-cause mortality in the ESRD
& general populations, by age, 2010
5.4 Adjusted all-cause mortality in prevalent
hemodialysis patients, by vintage5.3 Adjusted all-cause & cause-specific mortality
(from day one) in the first year of hemodialysis
vol 2
vol 2vol 2

1
6 months 12 months 24 months 36 months 48 months 60 monthsDialysis
1997 0.84 0.75 0.59 0.47 0.38 0.301999 0.84 0.74 0.60 0.48 0.38 0.312001 0.84 0.75 0.60 0.49 0.40 0.322003 0.84 0.74 0.61 0.50 0.40 0.332005 0.84 0.75 0.62 0.51 0.42 0.35
Hemodialysis1997 0.84 0.74 0.59 0.47 0.38 0.301999 0.84 0.74 0.59 0.48 0.38 0.312001 0.83 0.74 0.60 0.49 0.39 0.322003 0.83 0.74 0.60 0.49 0.40 0.332005 0.84 0.74 0.61 0.51 0.42 0.35
Peritoneal dialysis1997 0.89 0.80 0.62 0.49 0.37 0.291999 0.90 0.80 0.63 0.50 0.39 0.312001 0.91 0.82 0.67 0.54 0.43 0.342003 0.92 0.84 0.69 0.56 0.45 0.372005 0.93 0.86 0.72 0.60 0.49 0.41
Transplant1997 0.91 0.88 0.83 0.77 0.72 0.651999 0.92 0.89 0.85 0.79 0.73 0.672001 0.93 0.90 0.85 0.80 0.74 0.682003 0.94 0.91 0.86 0.81 0.76 0.712005 0.94 0.91 0.87 0.82 0.78 0.73
2005 cohortDialysis 0.84 0.75 0.62 0.51 0.42 0.35Hemodialysis 0.84 0.74 0.61 0.51 0.42 0.35Peritoneal dialysis 0.93 0.86 0.72 0.60 0.49 0.41Transplant 0.94 0.91 0.87 0.82 0.78 0.730-19 0.92 0.88 0.82 0.75 0.70 0.6620-44 0.94 0.90 0.81 0.74 0.68 0.6245-64 0.90 0.83 0.71 0.61 0.52 0.4465-74 0.83 0.73 0.58 0.46 0.35 0.2775+ 0.73 0.59 0.42 0.29 0.20 0.14Male 0.85 0.75 0.62 0.51 0.42 0.35Female 0.84 0.75 0.62 0.51 0.43 0.36White 0.83 0.74 0.59 0.48 0.39 0.32
Black/African American 0.86 0.77 0.64 0.55 0.46 0.39 Other 0.89 0.82 0.71 0.62 0.54 0.46
Diabetes 0.86 0.76 0.61 0.49 0.39 0.32 Hypertension 0.85 0.77 0.64 0.54 0.45 0.38 Glomerulonephritis 0.89 0.83 0.73 0.63 0.55 0.48 Other 0.78 0.68 0.56 0.47 0.40 0.34
263
5
5.a Adjusted survival probabilities, from
day one, in the ESRD populationvol 2 While six- and twelve-month survival
probabilities have remained stable since 1997 in the hemodialysis popula-tion, they have improved somewhat for both peritoneal dialysis and trans-plant patients. Five-year survival has improved across all modalities — from 0.30 to 0.35 for hemodialysis, from 0.29 to 0.41 for peritoneal dialysis, and from 0.65 to 0.73 for transplant.
In the 2005 incident cohort, sur-vival over the first five years of therapy is consistently highest in the transplant population and among younger patients, blacks/African Americans (compared to whites), and patients with a primary diagnosis of glomerulonephritis (com-pared to patients with diabetes or hyper-tension). » Table 5.a; see page 438 for analytical methods. Incident dialysis patients defined on the day of dialysis onset, without the 60-day rule, from day one of dialysis to December 31, 2010; transplant patients receiving a first transplant in the calendar year, followed from day of transplant to December 31, 2010. Adj: age/gender/race/Hispanic ethnicity/primary diagno-sis; ref: incident ESRD patients, 2005.

mortality
2
2012USRDSannualDataRepoRt
volumeESRD
264
Since 1995, unadjusted mortality among prevalent ESRD patients has fallen 23.7 percent, to 245 deaths per 1,000 patient years. Mortality adjusted for age, gender, race, and comorbidity (defined in the previous year), however, has fallen 28.4 percent, to 270. In the dialysis population, the unadjusted rate has fallen 15.6 percent, to 283, while the adjusted rate is now 23.7 percent lower than in 1995, falling to 294 in 2010. » Table 5.b; see page 438 for analytical methods. January 1 point prevalent ESRD & general Medi-care patients age 65 & older. Adj: age/gender/race/comorbidity; ref: ESRD patients, 2005.
1995 1996 1997 1998 1999 2000 2001 2002 2003 2004 2005 2006 2007 2008 2009 2010UnadjustedESRD 321 322 318 322 325 317 315 309 302 297 292 282 271 261 254 245Dialysis 336 339 337 342 347 340 339 336 330 327 325 316 306 298 292 283Transplant 99 94 87 99 93 98 94 90 92 88 86 82 82 75 78 77General Medicare Cancer 151 150 146 142 139 138 132 128 125 121 122 119 117 115 113 111 Diabetes 92 93 93 94 94 90 87 85 82 77 79 76 74 74 71 71 CHF 205 205 208 208 206 208 202 197 196 189 192 191 190 196 183 189 CVA/TIA 155 156 156 158 154 153 151 145 143 134 137 135 133 133 125 129 AMI 148 149 149 155 155 157 156 152 153 149 150 148 145 155 146 153AdjustedESRD 377 371 361 361 363 356 354 344 329 323 291 300 290 281 280 270Dialysis 386 381 372 373 377 370 368 359 345 337 311 320 311 304 303 294Transplant 186 188 198 204 174 207 184 174 175 177 139 151 138 127 150 116General Medicare Cancer 246 240 228 228 225 215 204 204 190 184 183 180 174 166 169 160 Diabetes 164 158 155 158 151 143 140 134 131 119 120 118 111 112 107 104 CHF 198 193 193 189 184 180 174 168 165 154 155 153 153 152 144 144 CVA/TIA 160 162 157 158 155 151 153 144 141 132 133 129 132 127 120 121 AMI 157 154 149 156 160 148 149 141 140 131 130 135 133 134 127 134
5.b Unadjusted & adjusted mortality rates in the ESRD & general
populations, age 65 & older, (per 1,000 patient years at risk)vol 2
mortality in the general & ESRD populations
1
0
100
200
300
400 Age: 65-69
Dea
ths p
er 1
,000
pat
ient
yea
rs a
t ris
k
0
100
200
300
400
ESRD Dialysis Transplant Cancer Diabetes CHF CVA/TIA AMI0
100
200
300
400
70-79
80+
MaleFemale
General Medicare
0
100
200
300
400 White
Dea
ths
per 1
,000
pat
ient
yea
rs a
t ris
k
0
100
200
300
400
ESRD Dialysis Transplant Cancer Diabetes CHF CVA/TIA AMI0
100
200
300
400
Black/African American
Other
General Medicare
MaleFemale
265
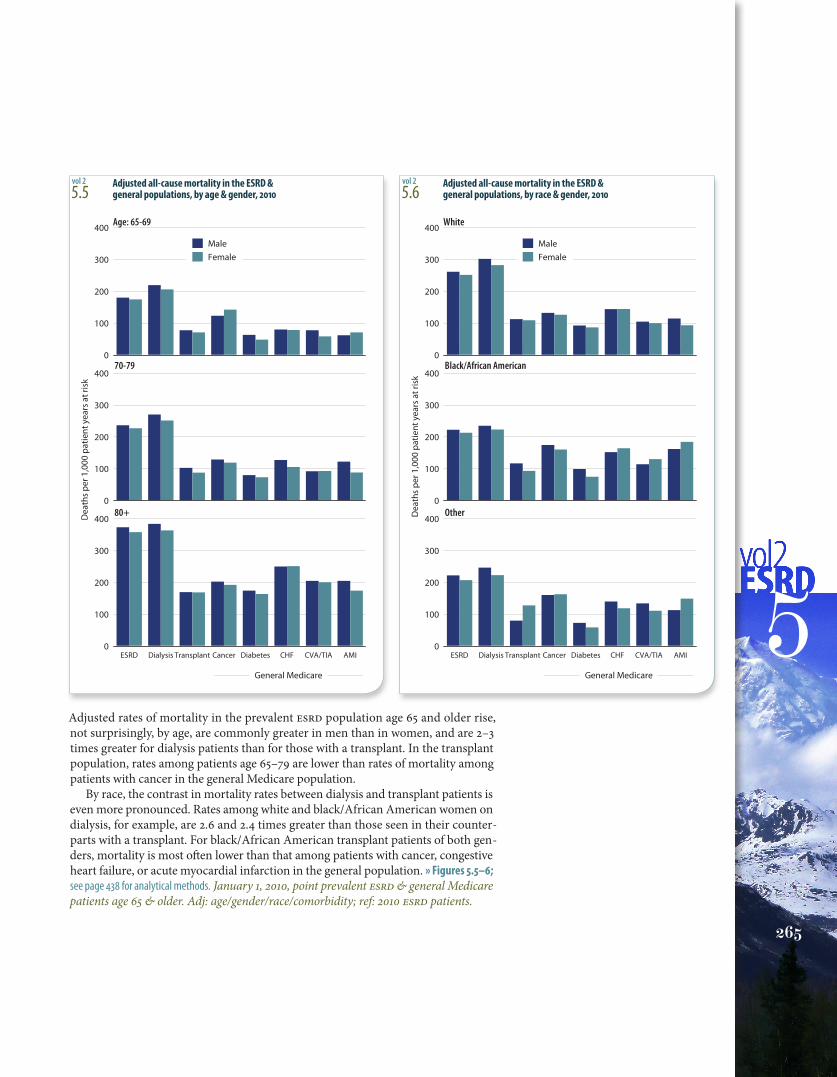
5Adjusted rates of mortality in the prevalent ESRD population age 65 and older rise, not surprisingly, by age, are commonly greater in men than in women, and are 2–3 times greater for dialysis patients than for those with a transplant. In the transplant population, rates among patients age 65–79 are lower than rates of mortality among patients with cancer in the general Medicare population.
By race, the contrast in mortality rates between dialysis and transplant patients is even more pronounced. Rates among white and black/African American women on dialysis, for example, are 2.6 and 2.4 times greater than those seen in their counter-parts with a transplant. For black/African American transplant patients of both gen-ders, mortality is most often lower than that among patients with cancer, congestive heart failure, or acute myocardial infarction in the general population. » Figures 5.5–6; see page 438 for analytical methods. January 1, 2010, point prevalent ESRD & general Medicare patients age 65 & older. Adj: age/gender/race/comorbidity; ref: 2010 ESRD patients.
5.5 Adjusted all-cause mortality in the ESRD &
general populations, by age & gender, 2010 5.6 Adjusted all-cause mortality in the ESRD &
general populations, by race & gender, 2010vol 2 vol 2

0
50
100
150
200
250
300
All
20-39
40-64
65+
Dea
ths p
er 1
,000
pat
ient
yea
rs
HD1 HD1+1 HD2 HD2+1 HD3 HD3+1 HD3+2
Dea
ths p
er 1
,000
pat
ient
yea
rs
0
50
100
150
All
20-64
65+
HD1 HD1+1 HD2 HD2+1 HD3 HD3+1 HD3+2
0
5
10
15
20
25
30
All
20-64
65+
Dea
ths p
er 1
,000
pat
ient
yea
rs
HD1 HD1+1 HD2 HD2+1 HD3 HD3+1 HD3+2
mortality
2
2012USRDSannualDataRepoRt
volumeESRD
266
mortality rates by interdialytic interval
Maintenance hemodialysis is typically delivered three times a week, and concern has emerged that the two-day, or “long,” interval may be associated with higher than expected rates of adverse outcomes. To explore this issue, we look here at mor-tality rates by different days of the hemodialysis week among prevalent adult hemodialysis patients in 2010.
In the framework of the “hemodialysis week,” HD1, for example, is defined as Monday for patients dialyzed on Mon-day, Wednesday, and Friday (MWF) and as Tuesday for those treated on Tuesday, Thursday, and Saturday (TTS). HD3 + 2, the second day of the long interval, is Sunday for MWS and Monday for TTS.
Mortality rates in the overall population are highest, at 174 per 1,000 patient years, on the day following the long interval (HD1), and a sawtooth pattern is apparent, with rates declining and increasing every two days thereafter. This pattern is repli-cated in patients age 65 and older, with rates varying between 185 and 226, but some differences are seen in younger age groups.
In patients age 20–39, mortality rates are highest on HD2+ 1 (57), lowest on HD3 (35), and the sawtooth pattern is absent. For ages 40–64, rates are substantially higher on HD1 (119), stable between HD1 + 1 (86) and HD3 + 1 (84), and intermediate on HD3 + 2 (96).
Figures 5.8 and 5.9 show corresponding analyses for mor-tality rates attributed to cardiovascular disease and infection. Rates are highest on HD1 (87) for cardiovascular disease, and on HD1 + 1 (17.7) for infection. » Figures 5.7–9; see page 438 for analytical methods. January 1, 2010 point prevalent Medicare hemodialysis patients alive on January 31. Includes patients age 20 & older receiving hemodialysis three times weekly on a Monday–Wednes-day–Friday or Tuesday–Thursday–Saturday schedule; HD1, HD2, & HD3, are the first, second, & third hemodialysis sessions. Rates for all patients are adjusted for age, gender, race, Hispanic ethnic-ity, & primary diagnosis; rates by age are adjusted for the other four factors. Ref: all included hemodialysis patients in 2010.
vol 2
vol 2
vol 2
5.7 Annualized all-cause mortality rates on different
days of the dialysis week, by age, 2010
5.8 Annualized cardiovascular mortality rates on
different days of the dialysis week, by age, 2010
5.9 Annualized rates of mortality due to infection on
different days of the dialysis week, by age, 2010
1
Events on day after long Events on day after short Events on days interdialytic interval interdialytic interval without dialysisAll patients 174 151 142Age: 20-39 53 43 4440-64 119 86 88≥65 226 209 191Male 175 154 141Female 172 148 143White 191 169 162Black/Af Am 147 123 107Other 130 119 112Hispanic 127 108 114Diabetes 193 161 152Hypertension 168 154 137Glomerulonephritis 126 125 122Other 156 132 131ESRD duration < 4 years 155 140 129 ≥ 4 years 199 167 159
267
5
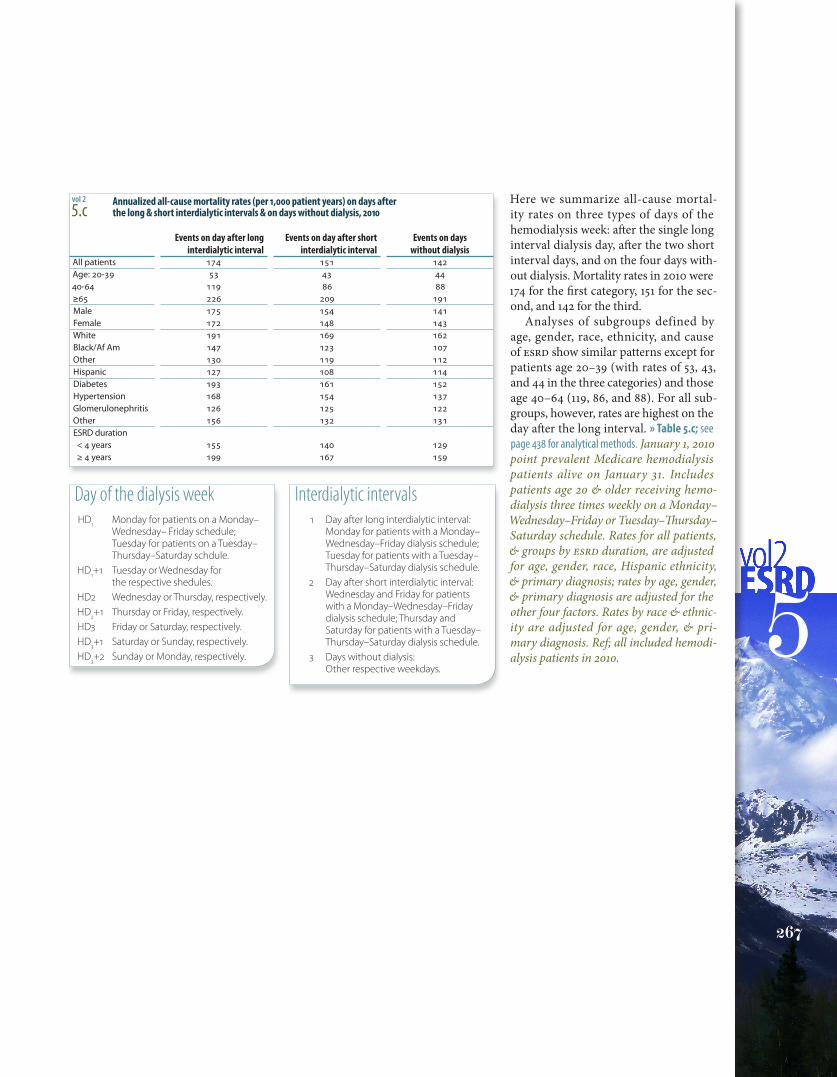
Here we summarize all-cause mortal-ity rates on three types of days of the hemodialysis week: after the single long interval dialysis day, after the two short interval days, and on the four days with-out dialysis. Mortality rates in 2010 were 174 for the first category, 151 for the sec-ond, and 142 for the third.
Analyses of subgroups defined by age, gender, race, ethnicity, and cause of ESRD show similar patterns except for patients age 20–39 (with rates of 53, 43, and 44 in the three categories) and those age 40–64 (119, 86, and 88). For all sub-groups, however, rates are highest on the day after the long interval. » Table 5.c; see page 438 for analytical methods. January 1, 2010 point prevalent Medicare hemodialysis patients alive on January 31. Includes patients age 20 & older receiving hemo-dialysis three times weekly on a Monday–Wednesday–Friday or Tuesday–Thursday–Saturday schedule. Rates for all patients, & groups by ESRD duration, are adjusted for age, gender, race, Hispanic ethnicity, & primary diagnosis; rates by age, gender, & primary diagnosis are adjusted for the other four factors. Rates by race & ethnic-ity are adjusted for age, gender, & pri-mary diagnosis. Ref; all included hemodi-alysis patients in 2010.
vol 2
5.c Annualized all-cause mortality rates (per 1,000 patient years) on days after
the long & short interdialytic intervals & on days without dialysis, 2010
Interdialytic intervals 1 Day after long interdialytic interval:
Monday for patients with a Monday–Wednesday–Friday dialysis schedule; Tuesday for patients with a Tuesday–Thursday–Saturday dialysis schedule.
2 Day after short interdialytic interval:Wednesday and Friday for patients with a Monday–Wednesday–Friday dialysis schedule; Thursday and Saturday for patients with a Tuesday–Thursday–Saturday dialysis schedule.
3 Days without dialysis:Other respective weekdays.
Day of the dialysis week HD1 Monday for patients on a Monday–
Wednesday– Friday schedule; Tuesday for patients on a Tuesday–Thursday–Saturday schdule.
HD1+1 Tuesday or Wednesday for the respective shedules.
HD2 Wednesday or Thursday, respectively. HD2+1 Thursday or Friday, respectively. HD3 Friday or Saturday, respectively. HD3+1 Saturday or Sunday, respectively. HD3+2 Sunday or Monday, respectively.

2012USRDSannualDataRepoRt
volumeESRD
268
mortality
2
summary
mortality & survivaladjusted all-cause first-year mortality (from day 90, per 1,000 patient years at risk; Figure 5.1)
» hemodialysis · 225 » peritoneal dialysis · 125 » transplant · 59
adjusted all-cause fifth-year mortality (from day 90, per 1,000 patient years at risk; Figure 5.1)» hemodialysis · 236 » peritoneal dialysis · 254 » transplant · 60
adjusted all-cause mortality in the ESRD & general populations, 2010 (per 1,000 patient years at risk; Figure 5.2)age <20 » ESRD · 27 » dialysis · 51 » transplant · 7.0 » general Medicare · 6.2 age 20–44 » ESRD · 43.9 » dialysis · 78.7 » transplant · 12.0 » general Medicare · 11.3 age 45–64 » ESRD · 99 » dialysis · 148.5 » transplant · 28.4 » general Medicare · 22.0 age 65+ » ESRD · 264 » dialysis · 304 » transplant · 73.4 » general Medicare · 48.1
adjusted all-cause & cause specific mortality from day one in the first year of hemodialysis, 2010 (per 1,000 patient years at risk; Figure 5.3)
month two after initiation » all-cause · 435 » cardiovascular disease · 169 » infection · 40month 12 after initiation » all-cause · 206 » cardiovascular disease · 78 » infection · 21
adjusted all-cause mortality in prevalent hemodialysis patients, by vintage, 2010 (per 1,000 patient years at risk; Figure 5.4)» <2 years · 190 » 2–<5 years · 189 » 5+ years · 222
adjusted five-year survival probabilities among incident ESRD patients, 2010 (from day one; Table 5.a)» dialysis · 0.35 » hemodialysis · 0.35 » peritoneal dialysis · 0.41 » transplant · 0.73 » age 0–19 · 0.66 » 20–44 · 0.62 » 45–64 · 0.44 » 65–74 · 0.27 » 75+ · 0.14» male · 0.35 » female · 0.36 » white · 0.32 » black/African American · 0.39 » other race · 0.46 primary diagnosis » diabetes · 0.32 » hypertension · 0.38 » glomerulonephritis · 0.48 » other · 0.34
mortality in the general & esrD populationsmortality rates in prevalent patients age 65 & older, 2010 (per 1,000 patient years at risk; Table 5.b)
unadjusted » ESRD · 245 » dialysis · 283 » transplant · 77 adjusted for age, gender, race, & comorbidity » ESRD · 270 » dialysis · 294 » transplant · 116
mortality rates by interDialytic intervalannualized all-cause mortality rates on different days of the dialysis week, by age (per 1,000 patient years; Figure 5.7)
day of week HD1 (Monday or Tuesday) » all · 174 » 20–39 · 53 » 40–64 · 119 » 65+ · 226day of week HD2 (Wednesday or Thursday) » all · 147 » 20–39 · 50 » 40–64 · 85 » 65+ · 204day of week HD3 (Friday or Saturday) » all · 155 » 20–39 · 35 » 40–64 · 87 » 65+ · 215


