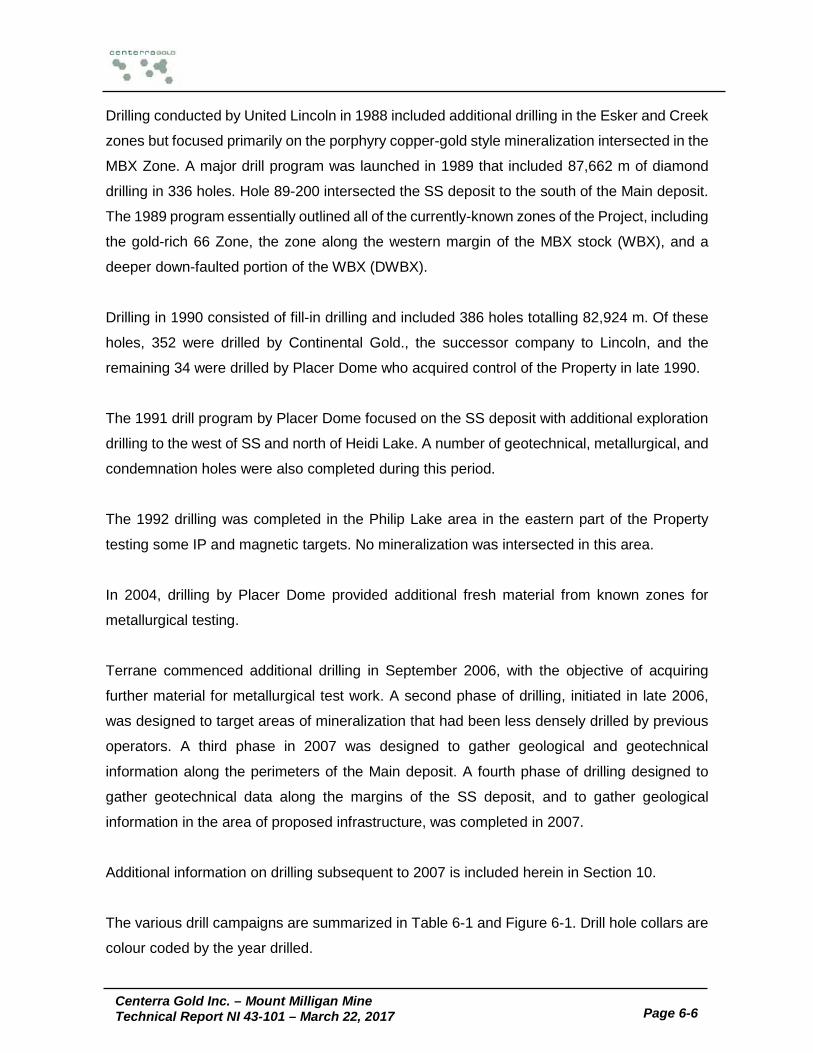
TECHNICAL REPORT ON THE MOUNT MILLIGAN MINE NORTH-CENTRAL BRITISH COLUMBIA CENTERRA GOLD INC. NI 43-101 Report Qualified Persons Peter Andrews, P. Eng. Doug Berthelsen, P.Geo. Ignacy Lipiec, P.Eng. March 22, 2017 Effective Date: December 31, 2016
Transcript
TECHNICAL REPORT ON THE MOUNT MILLIGAN MINE
NORTH-CENTRAL BRITISH COLUMBIA
CENTERRA GOLD INC.
NI 43-101 Report
Qualified Persons
Peter Andrews, P. Eng.
Doug Berthelsen, P.Geo.
Ignacy Lipiec, P.Eng.
March 22, 2017
Effective Date: December 31, 2016
Cautionary Note Regarding Forward-Looking Information Information contained in this Technical Report and the documents referred to herein which are not statements of historical facts, may be “forward-looking information” for the purposes of Canadian securities laws. Such forward looking information involves risks, uncertainties and other factors that could cause actual results, performance, prospects and opportunities to differ materially from those expressed or implied by such forward looking information. The words “expect”, “target”, “estimate”, “may”, “will”, and similar expressions identify forward-looking information. These forward-looking statements relate to, among other things, mineral reserve and mineral resource estimates, grades and recoveries, development plans, mining methods and metrics including strip ratio, recovery process and production expectations including expected cash flows, capital cost estimates and expected life of mine operating costs, the expected performance of the secondary crushing circuit, including increasing mill throughput to 62,500 t/d, and the level of capital expenditures set out in Chapter 13 and the expected outcomes of such work. Forward-looking information is necessarily based upon a number of estimates and assumptions that, while considered reasonable by Centerra Gold Inc. (“Centerra”) are inherently subject to significant political, business, economic and competitive uncertainties and contingencies. There may be factors that cause results, assumptions, performance, achievements, prospects or opportunities in future periods not to be as anticipated, estimated or intended. These factors may include following risks relating to the Mount Milligan project and/or Centerra: (A) strategic, legal, planning and other risks, including political risk, risks relating to aboriginal claims and consultation issues; resource nationalism including the management of external stakeholder expectations; the impact of changes in, or to the more aggressive enforcement of laws, regulations and government practices; the impact of changes to and the increased enforcement of, environmental laws and regulations; potential defects of title to the property that are not known as of the date hereof; the inability of Centerra to enforce its respective legal rights in certain circumstances; risks related to anti-corruption legislation; potential risks related to kidnapping or acts of terrorism; (B) risks relating to financial matters, sensitivity of the business to the volatility of metal prices; the imprecision of mineral reserves and mineral resources estimates, and the assumptions they rely on; the accuracy of the production and cost estimates; continued compliance with financial covenants in Centerra’s credit agreements, including the credit facility that is secured by certain assets used at the Mount Milligan Mine, and Centerra’s access to cash flow from its subsidiaries; and (C) risks related to operational matters and geotechnical issues, including the adequacy of insurance to mitigate operational risks; mechanical breakdowns; the occurrence of any labour unrest or disturbance; the ability to accurately predict decommissioning and reclamation costs, including closure costs; and the ability to attract and retain qualified personnel. There can be no assurances that forward-looking information and statements will prove to be accurate, as many factors and future events, both known and unknown could cause actual results, performance or achievements to vary or differ materially, from the results, performance or achievements that are or may be expressed or implied by such forward-looking statements contained herein or incorporated by reference. Accordingly, all such factors should be considered carefully when making decisions with respect to Centerra and prospective investors should not place undue reliance on forward-looking information. Forward-looking information in this technical report is as of the issue date, March 22, 2017. Centerra and the Qualified Persons who authored this Technical Report assume no obligation to update or revise forward-looking information to reflect changes in assumptions, changes in circumstances or any other events affecting such forward looking information, except as required by applicable law.
Non-GAAP Measures This Technical Report contains the following non-GAAP financial measures: all-in sustaining costs, on a by-product basis and all-in costs, on a by-product basis, including exploration. These financial measures do not have any standardized meaning prescribed by GAAP and are therefore unlikely to be comparable to similar measures presented by other issuers, even as compared to other issuers who may be applying the World Gold Council (“WGC”) guidelines, which can be found at http://www.gold.org.
Centerra believes that the use of these non-GAAP measures will assist analysts, investors and other stakeholders of the Company in understanding the costs associated with producing gold, understanding the economics of gold mining, assessing our operating performance, our ability to generate free cash flow from current operations and to generate free cash flow on an overall Company basis, and for planning and forecasting of future periods. However, the measures do have limitations as analytical tools as they may be influenced by the point in the life cycle of a specific mine and the level of additional exploration or expenditures a company has to make to fully develop its properties. Accordingly, these non-GAAP measures should not be considered in isolation, or as a substitute for, analysis of our results as reported under GAAP. Definitions
The following is a description of the non-GAAP measures used in this Technical Report. The definitions are similar to the WGC’s Guidance Note on these non-GAAP measures: • All-in sustaining costs on a by-product basis per ounce sold include adjusted operating costs,
the cash component of capitalized stripping costs, corporate general and administrative expenses, accretion expenses, and sustaining capital, net of copper and silver credits. The measure incorporates costs related to sustaining production. Copper and silver credits represent the expected revenue from the sale of these metals.
• All-in costs per ounce sold include all-in sustaining costs and additional costs for growth capital, global exploration expenses, business development costs, project development costs and social development costs not related to current operations.
• All-in cost per ounce sold exclude the following: o Working capital (except for adjustments to inventory on a sales basis). o All financing charges (including capitalized interest). o Costs related to business combinations, asset acquisitions and asset disposals. o Other non-operating income and expenses, including interest income, bank charges, and
foreign exchange gains and losses. • Adjusted operating costs include cost of sales (cash component), regional office administration,
mine standby costs, community costs related to current operations, refining fees and by-product credits.
• Sustaining capital is a capital expenditure necessary to maintain existing levels of production. The sustaining capital expenditures maintain the existing mine fleet, mill and other facilities so that they function at levels consistent from year to year.
• Growth capital is capital expended to expand the business or operations by increasing productive capacity beyond current levels of performance.
A reconciliation of the non-GAAP measures used in this Technical Report is contained in Centerra’s Management’s Discussion & Analysis for the year ended December 31, 2016, which is available on SEDAR at www.sedar.com.
Note from Amec Foster Wheeler Americas Limited
Sections 13 and 17 of this National Instrument 43-101 Technical Report were prepared for Centerra by Amec Foster Wheeler Americas Limited (Amec Foster Wheeler). The quality of information, conclusions and estimates contained herein is consistent with the terms of reference, constraints and circumstances under which those sections of the Technical Report were prepared by Amec Foster Wheeler and is based on I) information available at the time of preparation, II) data supplied by outside sources and III) the assumptions, conditions and qualifications set forth in this Technical Report. This Technical Report is intended to be used by Centerra subject to the terms and conditions of its contract with Amec Wheeler Foster. That contract permits Centerra to file this report as a Technical Report with Canadian securities regulatory authorities pursuant to provincial and territorial securities law. Except for the purposes legislated under Canadian provincial and territorial securities law, any other use of this report by any third party is at that party’s sole risk.
Centerra Gold Inc. – Mount Milligan Mine
Technical Report NI 43-101 – March 22, 2017 Page i
TABLE OF CONTENTS PAGE
1 SUMMARY ...................................................................................................................... 1-1 Project Location ............................................................................................................. 1-1 Project History and Ownership ....................................................................................... 1-1 Geology and Mineralization............................................................................................ 1-2 Mineral Resource and Mineral Reserve Estimates ......................................................... 1-3 Metallurgy ...................................................................................................................... 1-5 Mining Operations .......................................................................................................... 1-5 Mineral Processing ........................................................................................................ 1-6 Tailing Storage Facility ................................................................................................... 1-7 Environment and Permitting ........................................................................................... 1-7 Community Sustainability ............................................................................................... 1-8 Capital and Operating Costs .......................................................................................... 1-8 Financial Evaluation ....................................................................................................... 1-9 Interpretation and Conclusions .................................................................................... 1-11 Recommendations ....................................................................................................... 1-13
2 INTRODUCTION ............................................................................................................. 2-1 Sources of Information ................................................................................................... 2-1 Contributing Persons and Site Inspections ..................................................................... 2-2 Units .............................................................................................................................. 2-4
3 RELIANCE ON OTHER EXPERTS ................................................................................. 3-1
4 PROPERTY DESCRIPTION AND LOCATION ................................................................ 4-1 Claim Status .................................................................................................................. 4-3 Royalties and Streaming Agreements ............................................................................ 4-7 Environmental Liabilities ................................................................................................ 4-8 Permits .......................................................................................................................... 4-9 Known Risks ................................................................................................................ 4-10
5 ACCESSIBILITY, CLIMATE, LOCAL RESOURCES, INFRASTRUCTURE AND PHYSIOGRAPHY ............................................................................................................... 5-1
Technical Report NI 43-101 – March 22, 2017 Page iii
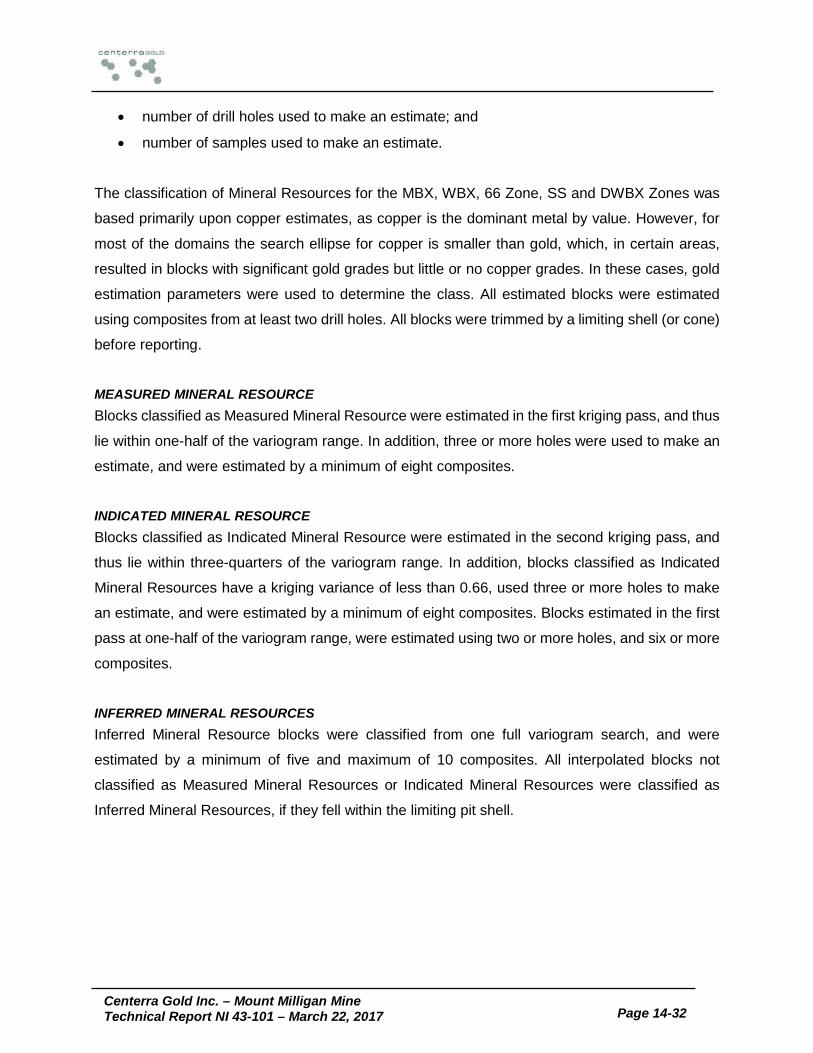
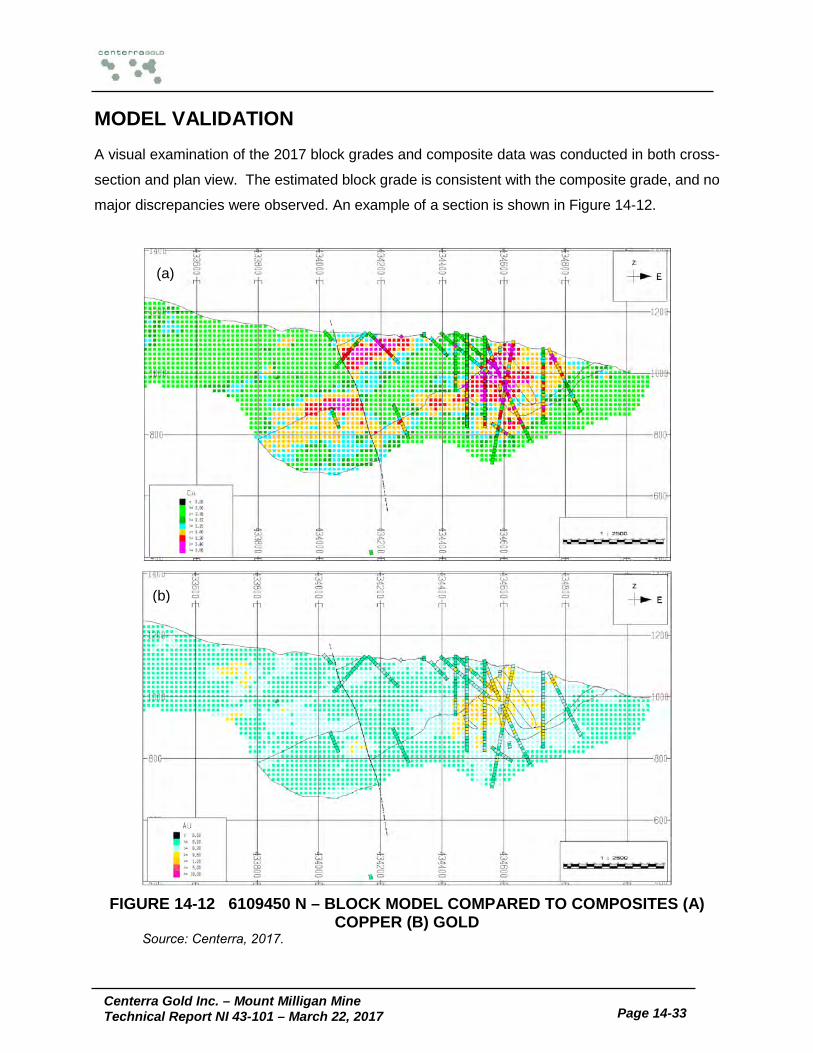
Model Validation ........................................................................................................ 14-33 Ore Reconciliation ..................................................................................................... 14-34
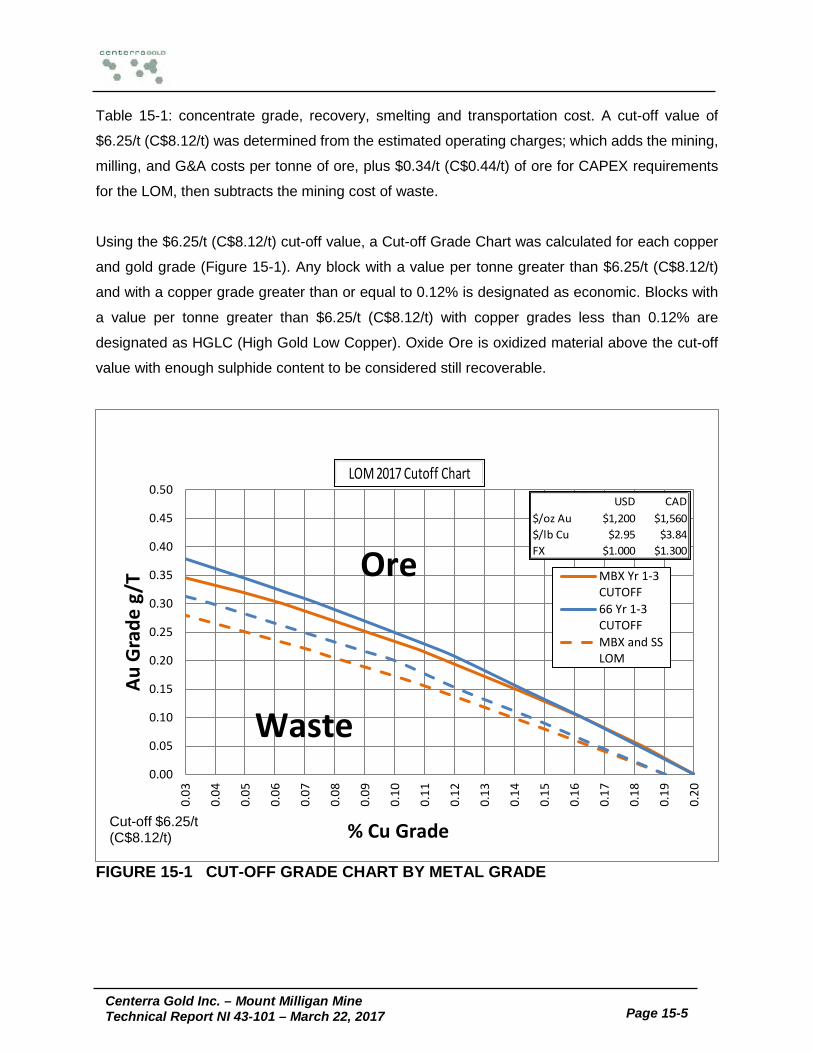
15 MINERAL RESERVE ESTIMATE ................................................................................ 15-1 Economic Model Assumptions ..................................................................................... 15-1 Resource Limiting Pit Shell .......................................................................................... 15-6 Resource to Reserve Conversion ................................................................................ 15-6 Tabulation of Mineral Reserve ..................................................................................... 15-7 Risk Factors ................................................................................................................. 15-8
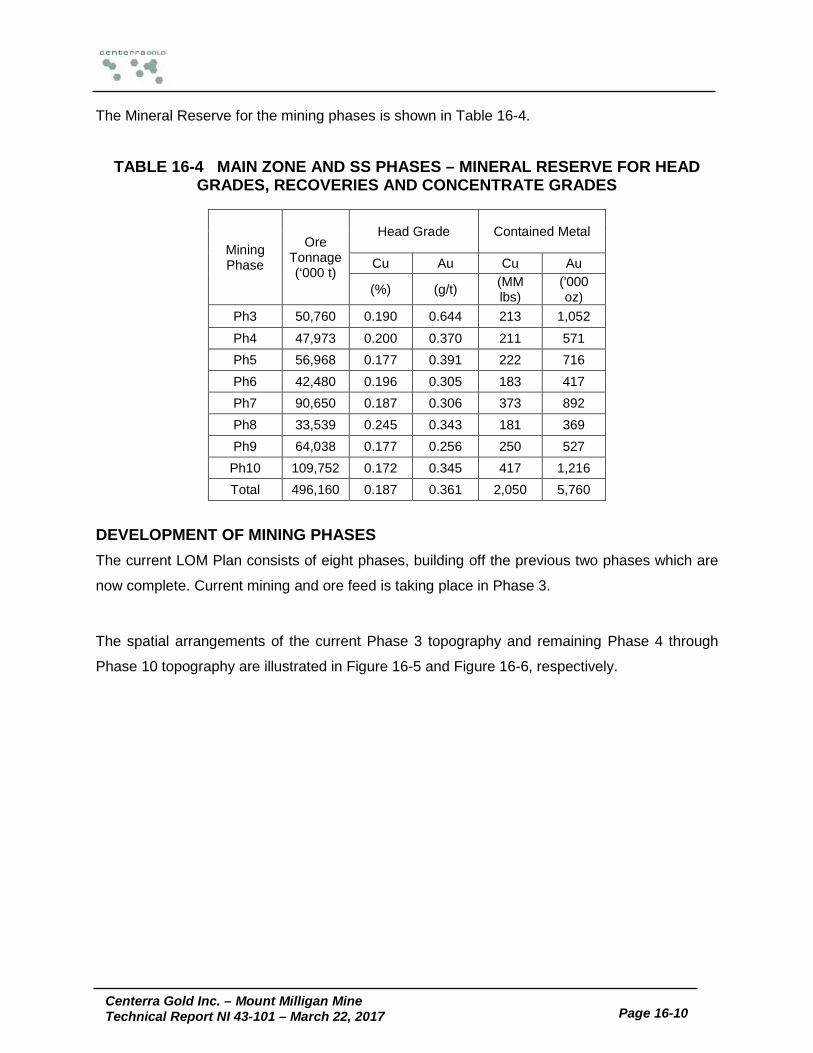
16 MINING METHODS ..................................................................................................... 16-1 Introduction .................................................................................................................. 16-1 Mine Design ................................................................................................................. 16-3 Mine Planning – Phase Development and Reserves ................................................... 16-9 Mine Production Schedule ......................................................................................... 16-13
17 RECOVERY METHODS .............................................................................................. 17-1 Summary ..................................................................................................................... 17-1 Process Plant Description ............................................................................................ 17-3 Process Control and Instrumentation ........................................................................... 17-8
20 ENVIRONMENTAL STUDIES, PERMITTING, AND SOCIAL OR COMMUNITY IMPACT ......................................................................................................................................... 20-1
Environmental Issues ................................................................................................... 20-1 Waste Disposal, Monitoring and Water Management ................................................... 20-2 Project Permitting ........................................................................................................ 20-3 Social or Community Requirements ............................................................................. 20-3
21 CAPITAL AND OPERATING COSTS .......................................................................... 21-1
Technical Report NI 43-101 – March 22, 2017 Page iv
28 DATE AND SIGNATURE PAGE .................................................................................. 28-1
29 CERTIFICATE OF QUALIFIED PERSON .................................................................... 29-1
30 APPENDIX A ............................................................................................................... 30-1 Glossary ...................................................................................................................... 30-1 Abbreviations and Acronyms ....................................................................................... 30-3
Centerra Gold Inc. – Mount Milligan Mine
Technical Report NI 43-101 – March 22, 2017 Page v
LIST OF TABLES PAGE
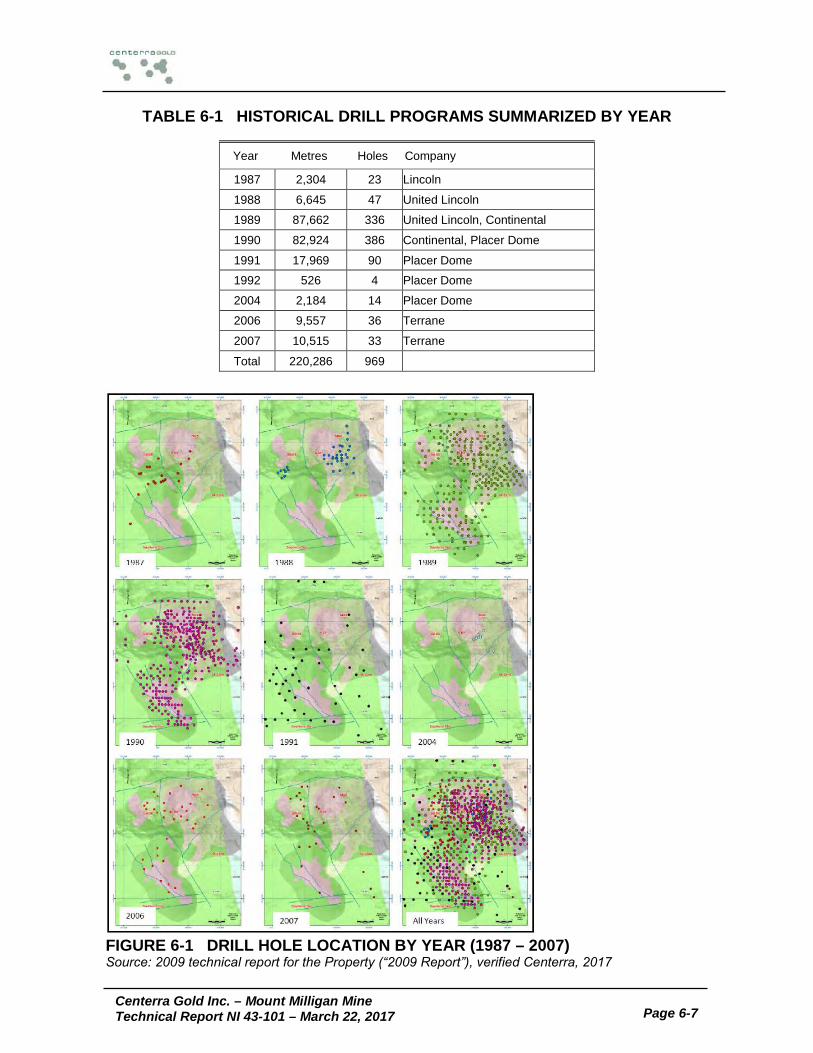
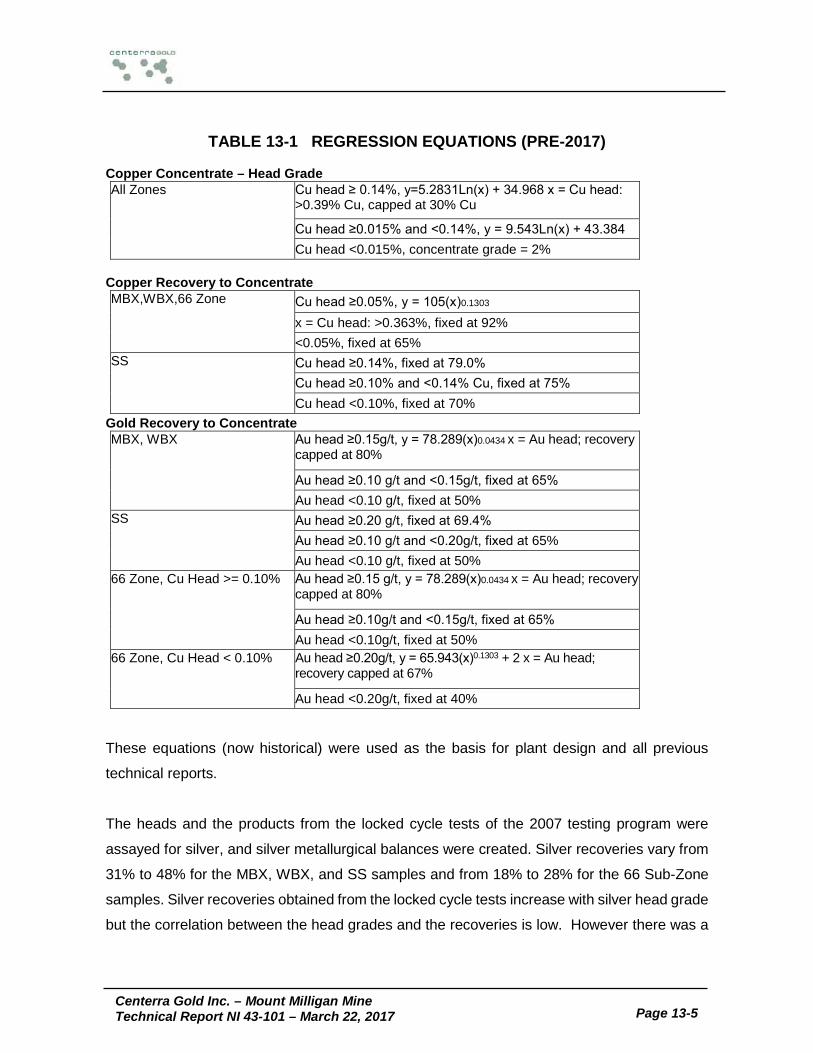
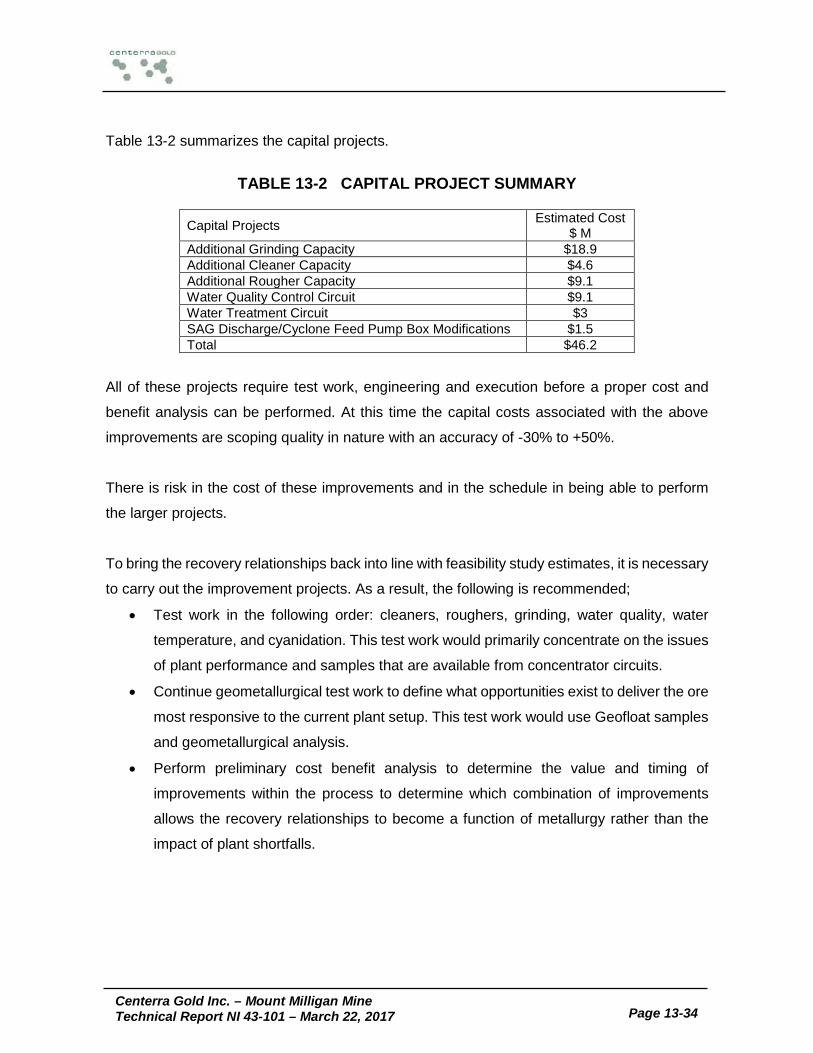
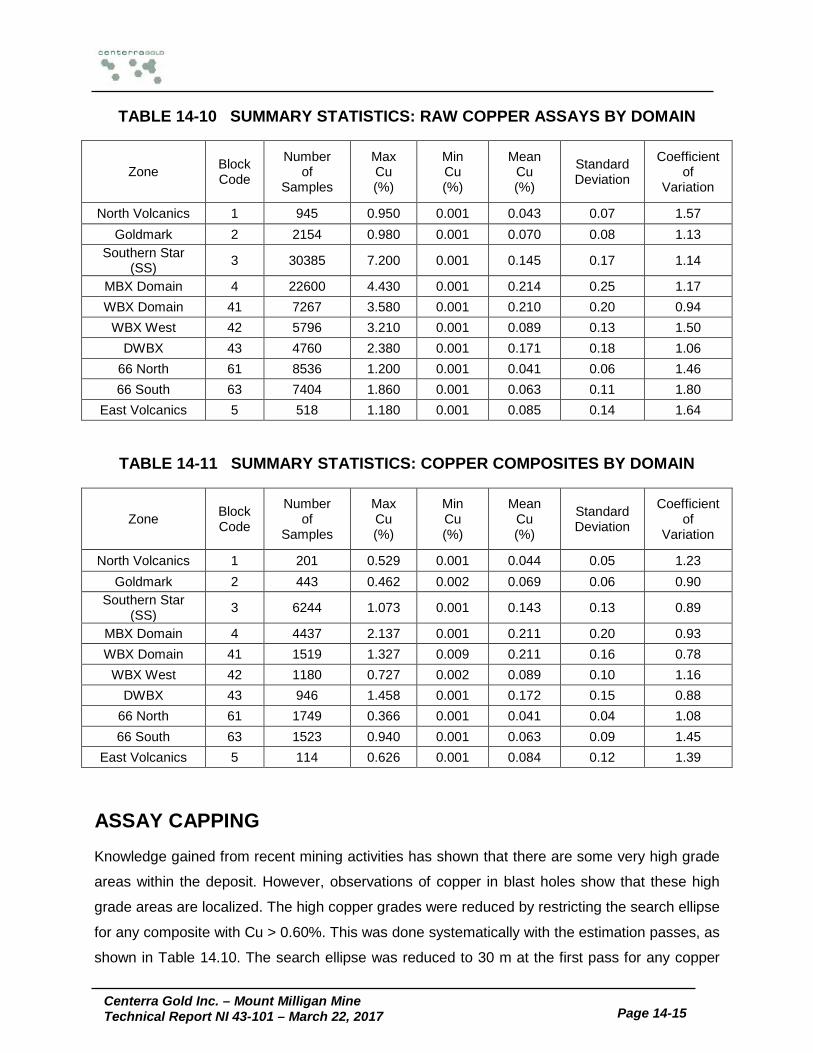
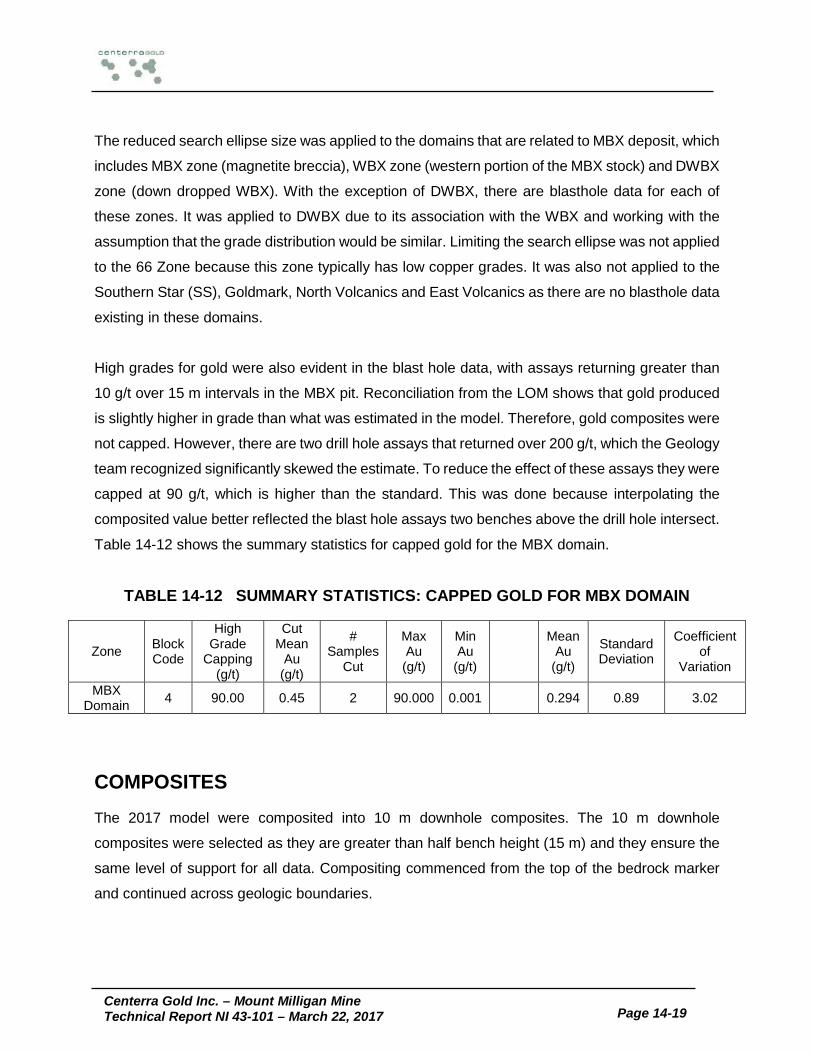
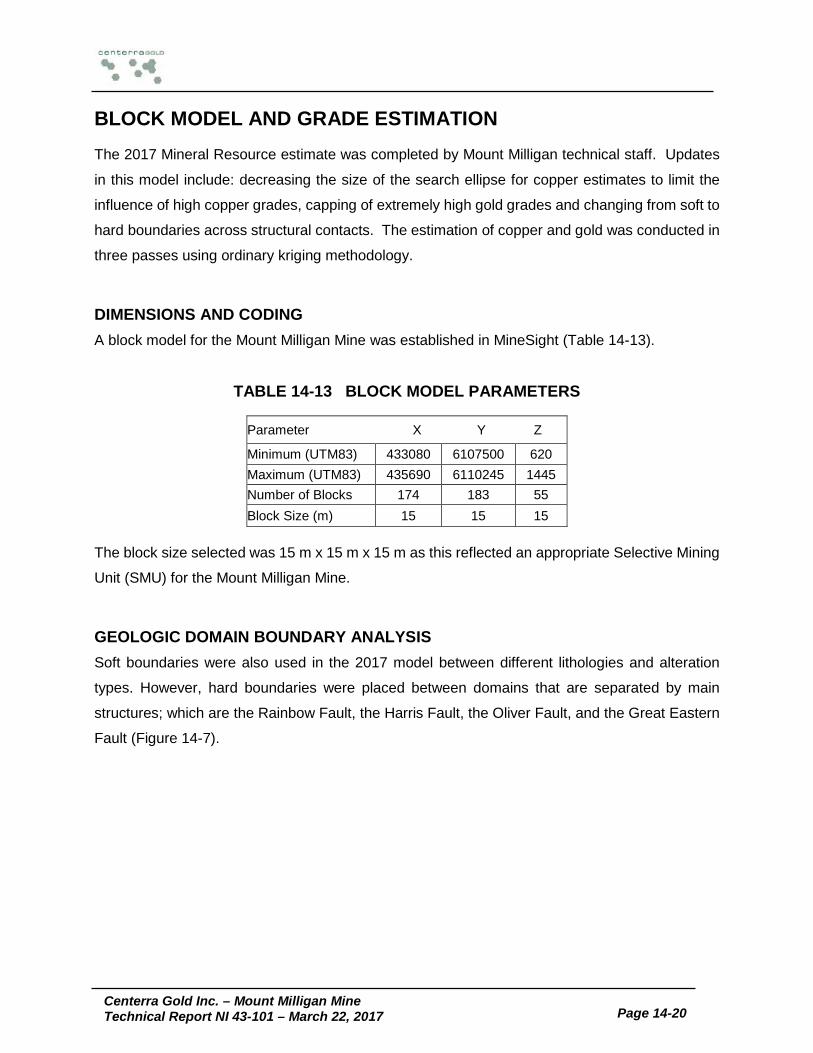
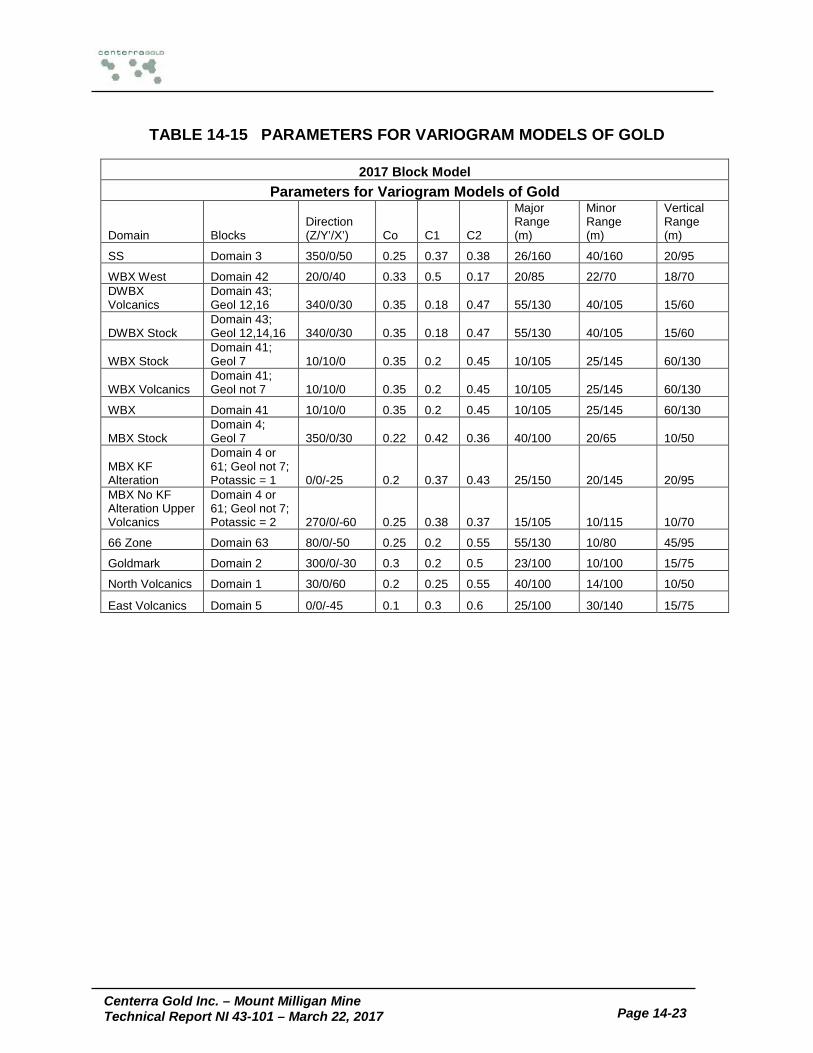
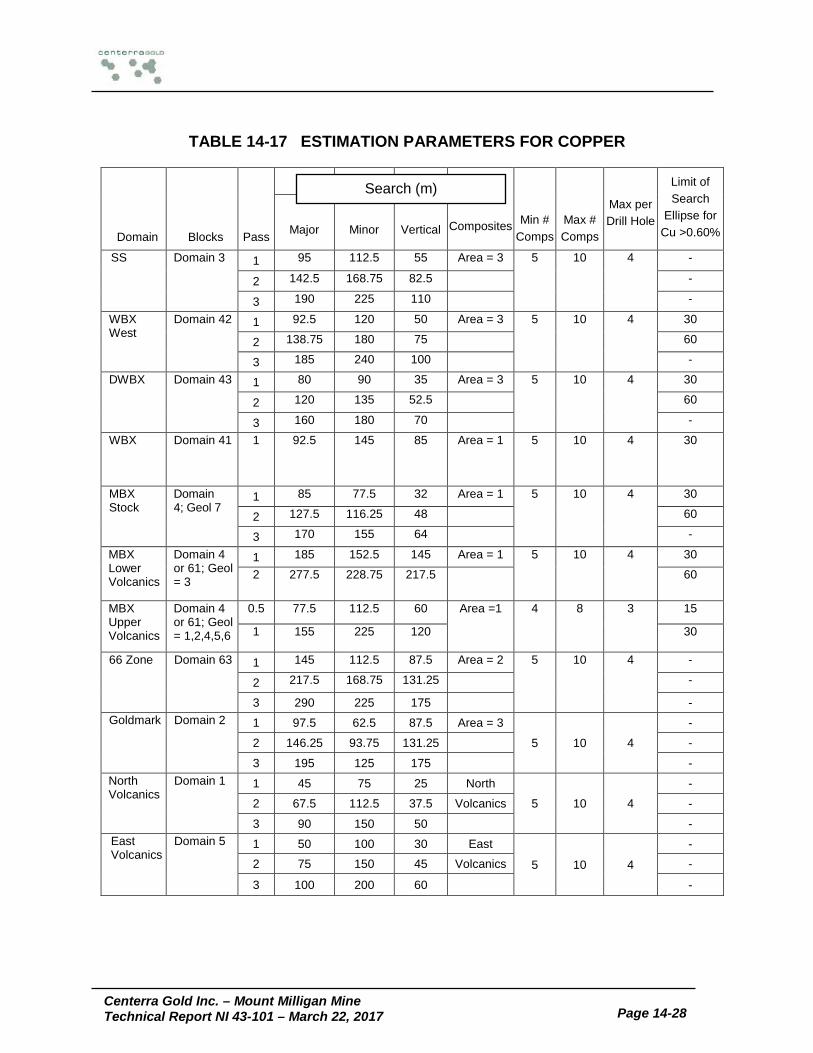
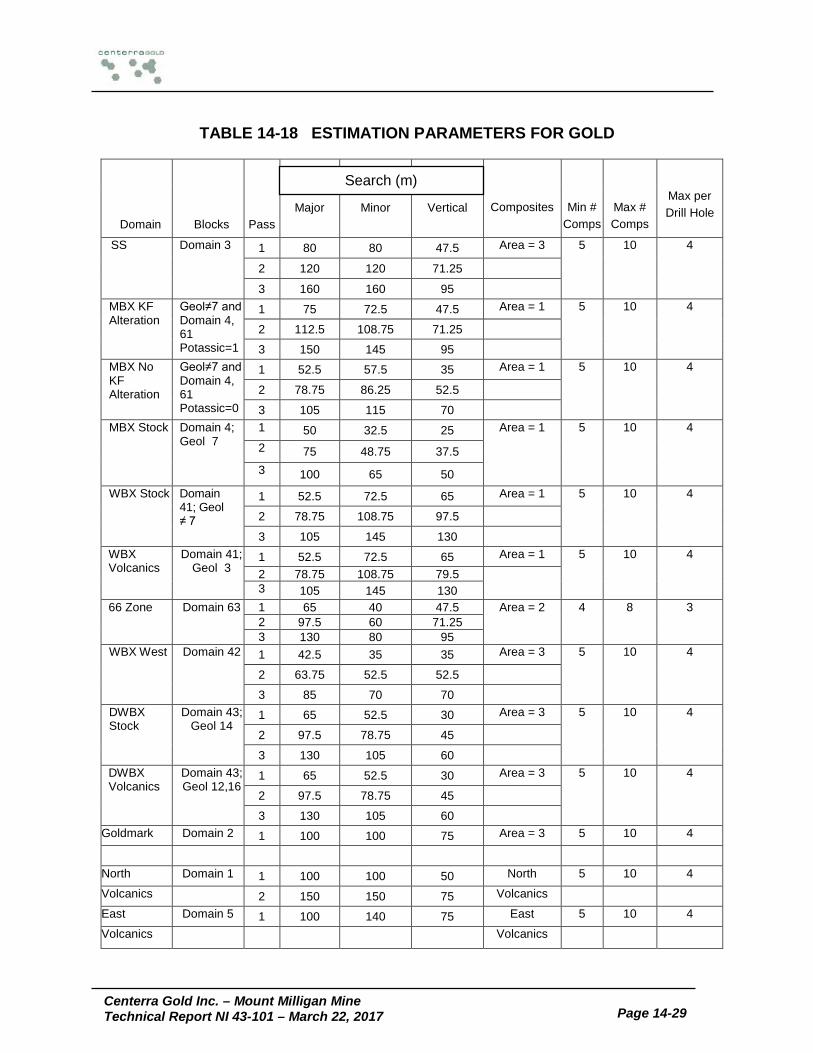
Table 1-1 Mineral Resource Estimate (Exclusive of Mineral Reserve) Effective as of December 31, 2016 ............................................................................................................ 1-3 Table 1-2 Mineral Reserve Estimate Effective as of December 31, 2016 .......................... 1-4 Table 1-3 Average Annual Tonnage, Grade, Recoveries, and Payable Metal Production . 1-6 Table 1-4 Life of Mine Operating Costs as of January 1, 2017 .......................................... 1-8 Table 1-5 LOM - Projected Net Cash Flow ..................................................................... 1-10 Table 2-1 Qualified Persons and Responsibilities ............................................................. 2-4 Table 4-1 List of Claims .................................................................................................... 4-5 Table 5-1 Mount Milligan Climate Statistics ...................................................................... 5-1 Table 6-1 Historical Drill Programs Summarized by Year ................................................. 6-7 Table 6-2 Historical Production as of December 31, 2016 .............................................. 6-13 Table 7-1 Rock Units of the Main and SS Deposits Used in Drill Program Descriptions. ... 7-4 Table 10-1 Summary of Drill Programs ........................................................................... 10-1 Table 10-2 Terrane Drill Program Summary ................................................................... 10-3 Table 13-1 Regression Equations (Pre-2017) ................................................................. 13-5 Table 13-2 Capital Project Summary ............................................................................ 13-34 Table 14-1 Mineral Resource Estimate (Exclusive of Mineral Reserve) Effective as of December 31, 2016 .......................................................................................................... 14-1 Table 14-2 Mineral Resource Estimate (Exclusive of Mineral Reserves) by Domain as of December 31, 2016 .......................................................................................................... 14-2 Table 14-3 Geotechnical Drilling – Depth to Bedrock ...................................................... 14-3 Table 14-4 Lithology Coding of Geology Model .............................................................. 14-8 Table 14-5 Specific Gravity Summary – ALS Chemex Data ............................................ 14-9 Table 14-6 Melis SG Measurements ............................................................................... 14-9 Table 14-7 Average Spacing Between Composites from Different Holes ...................... 14-13 Table 14-8 Summary Statistics: Raw Gold Assays by Domain ..................................... 14-14 Table 14-9 Summary Statistics: Gold Composites by Domain ...................................... 14-14 Table 14-10 Summary Statistics: Raw Copper Assays by Domain ............................... 14-15 Table 14-11 Summary Statistics: Copper Composites by Domain ................................ 14-15 Table 14-12 Summary Statistics: Capped Gold for MBX Domain .................................. 14-19 Table 14-13 Block Model Parameters ........................................................................... 14-20 Table 14-14 Parameters for Variogram Models of Copper ............................................ 14-22 Table 14-15 Parameters for Variogram Models of Gold ................................................ 14-23 Table 14-16 Geologic Domain Coding .......................................................................... 14-24 Table 14-17 Estimation Parameters for Copper ............................................................ 14-28 Table 14-18 Estimation Parameters for Gold ................................................................ 14-29 Table 14-19 LOM Mill/Mine/Model Reconciliation ......................................................... 14-34 Table 15-1 Input Data for Economic Model ..................................................................... 15-2 Table 15-2 Ore Type Classification by Cut-off Grade ...................................................... 15-4 Table 15-3 Mineral Reserve Estimate Effective December 31, 2016 .............................. 15-8 Table 16-1 Major Mining Equipment ............................................................................... 16-1 Table 16-2 Recommended Slope Geometries ................................................................ 16-7 Table 16-3 Ultimate Pit Dimensions ................................................................................ 16-8 Table 16-4 Main Zone and SS Phases – Mineral Reserve for Head Grades, Recoveries and Concentrate Grades ....................................................................................................... 16-10
Centerra Gold Inc. – Mount Milligan Mine
Technical Report NI 43-101 – March 22, 2017 Page vi
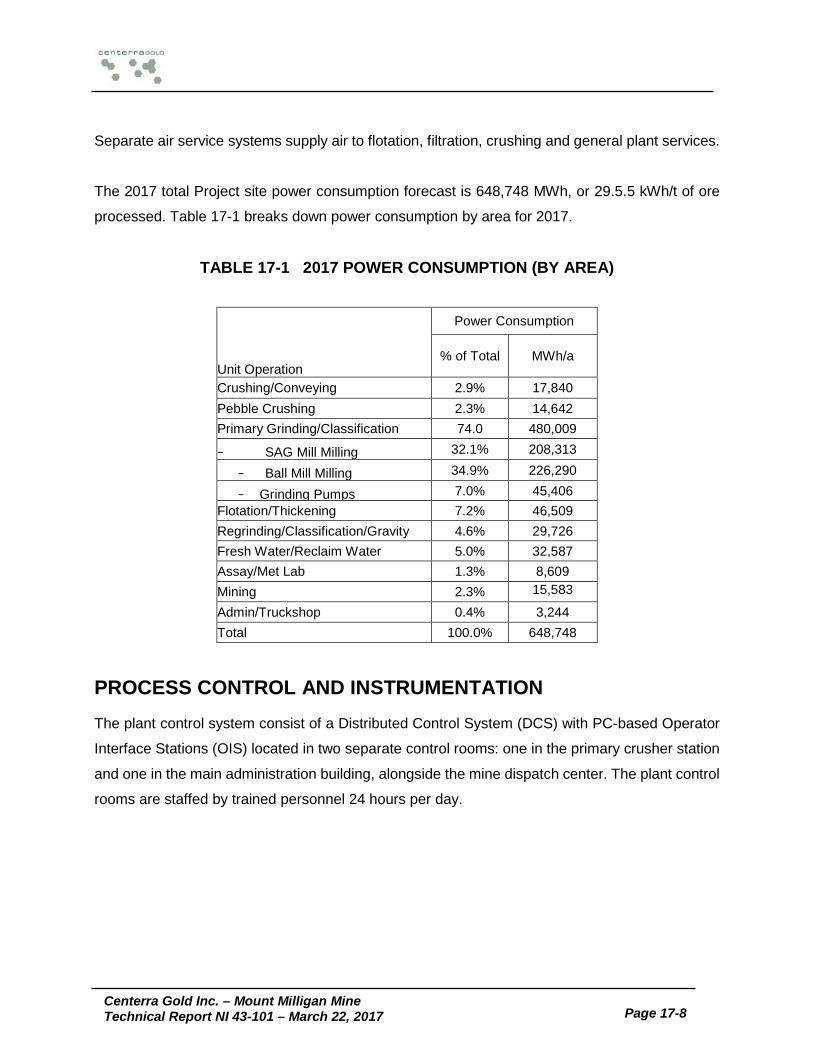
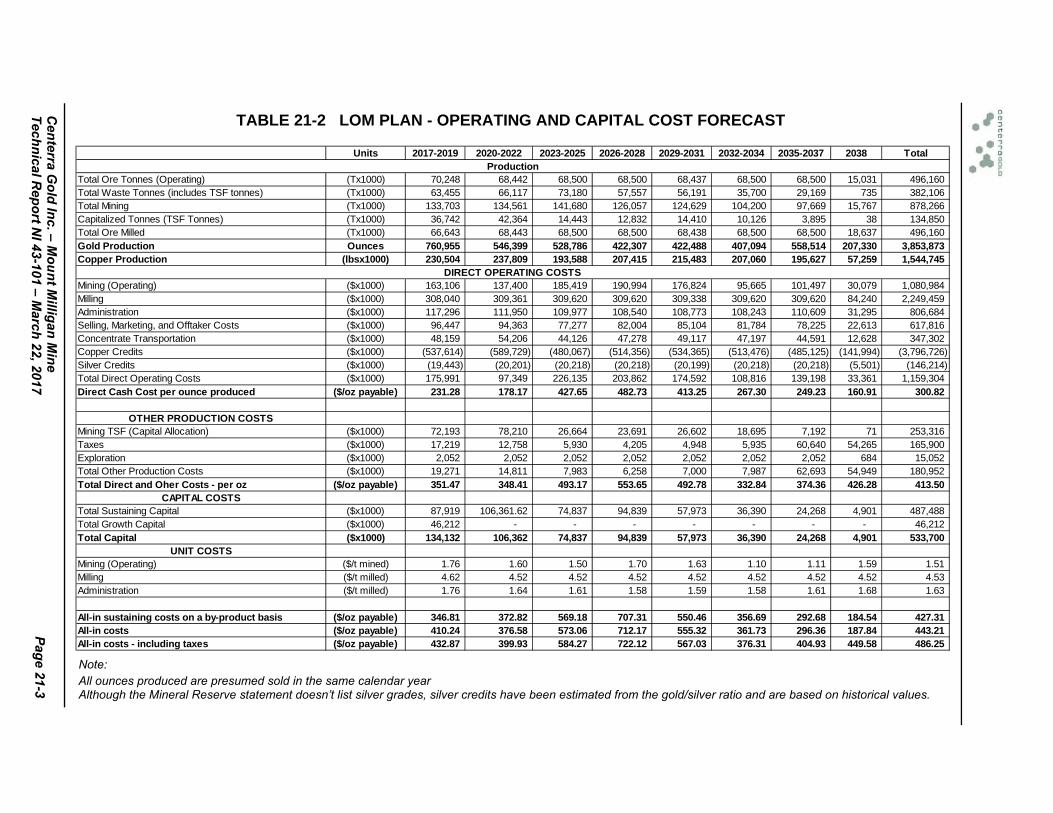
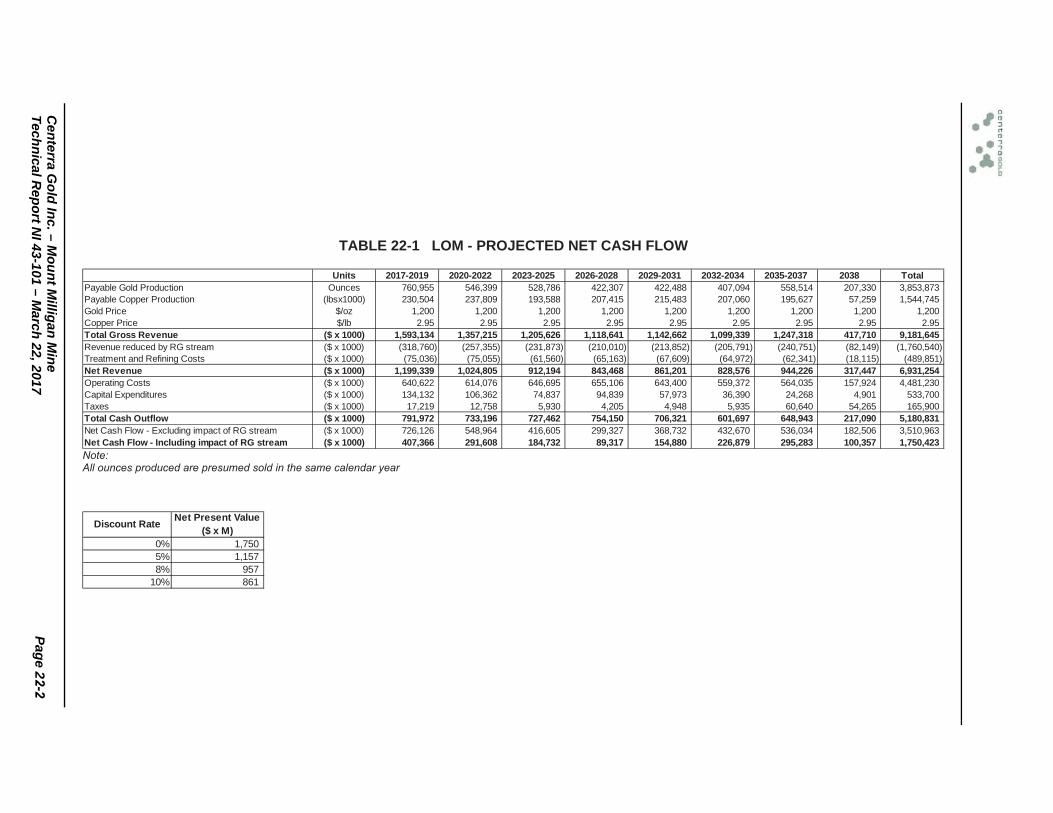
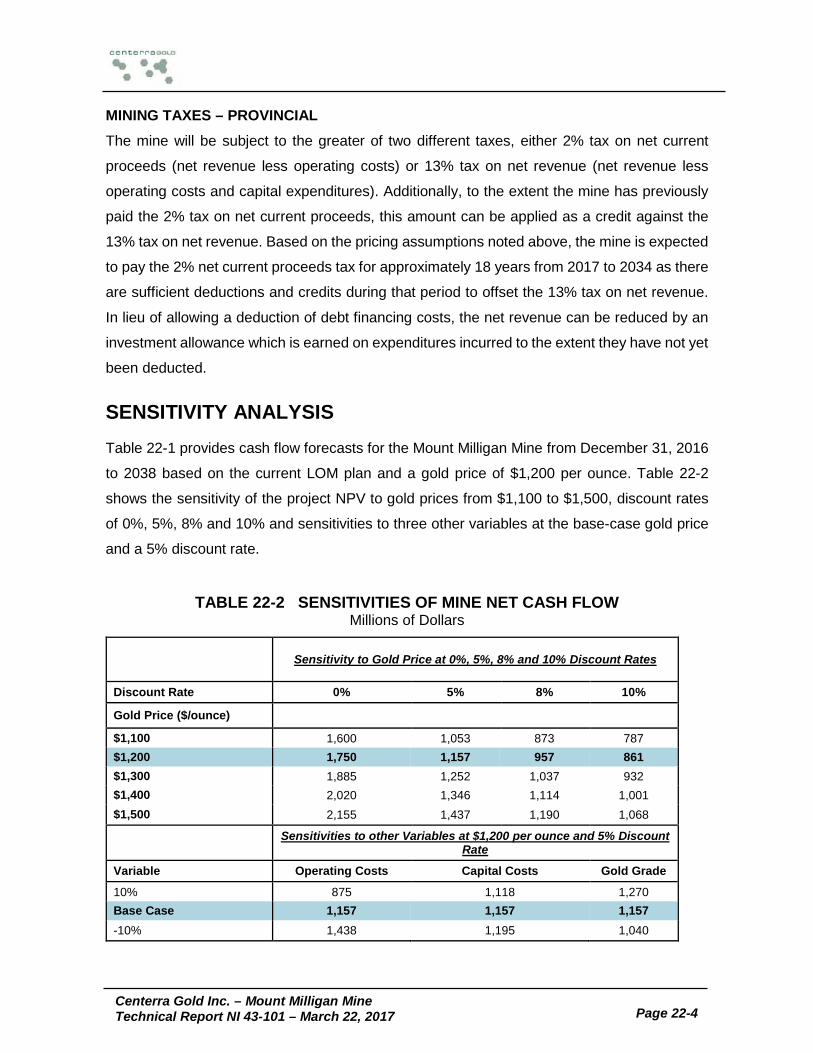
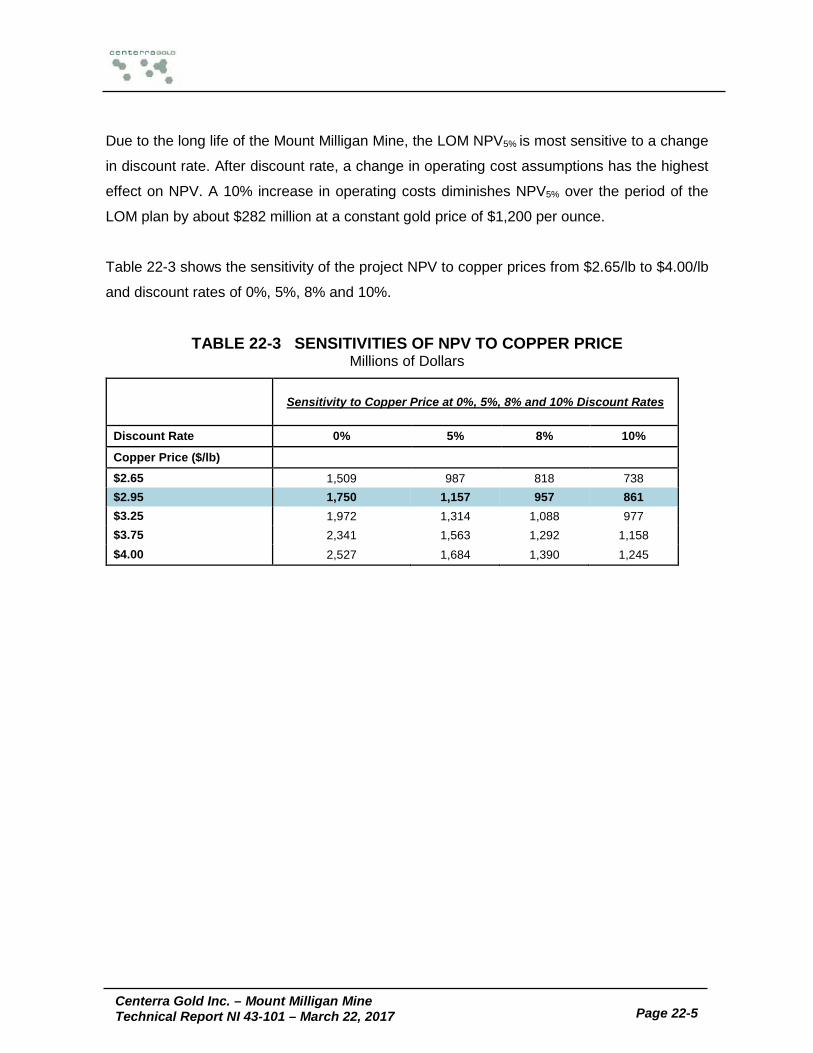
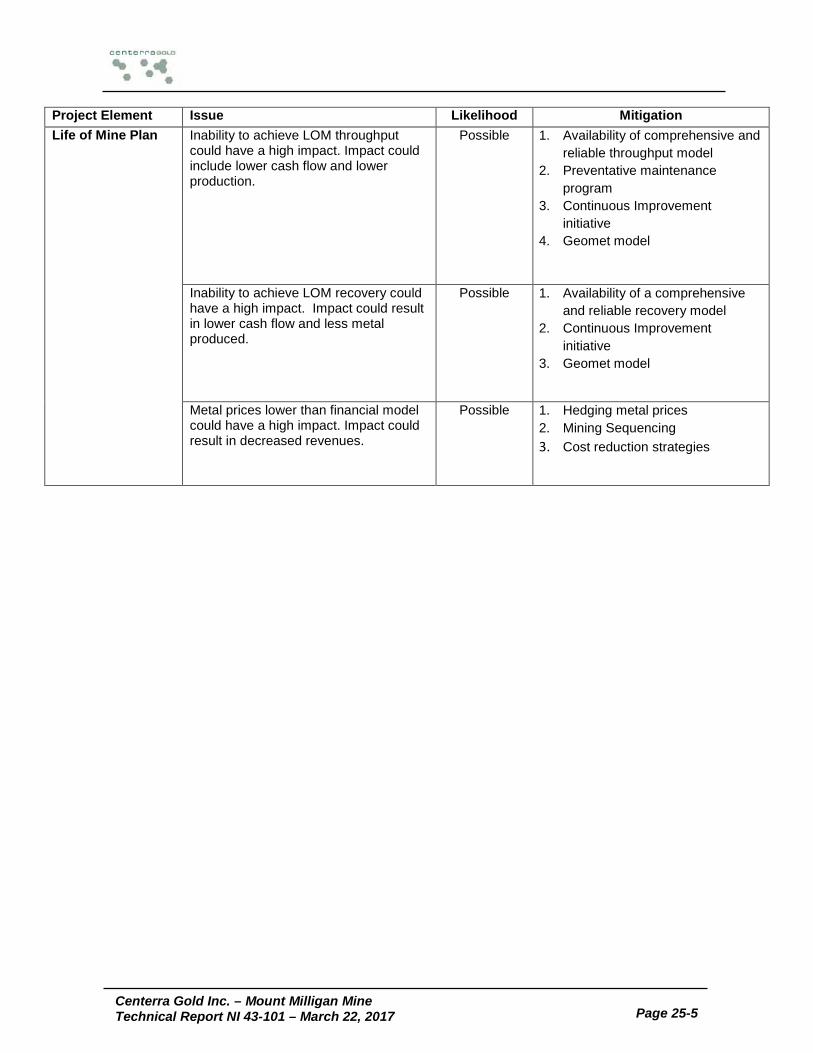
Table 16-5 Average Annual Tonnage, Grade, Recoveries, and Payable Metal Production16-14 Table 17-1 2017 Power Consumption (by area) .............................................................. 17-8 Table 21-1 LOM Operating Costs as of January 1, 2017 ................................................ 21-1 Table 21-2 LOM Plan - Operating and Capital Cost Forecast ......................................... 21-3 Table 21-3 Detailed Projected Capital Costs................................................................... 21-4 Table 22-1 LOM - Projected Net Cash Flow ................................................................... 22-2 Table 22-2 Sensitivities of Mine Net Cash Flow .............................................................. 22-4 Table 22-3 Sensitivities of NPV to Copper Price ............................................................. 22-5 Table 25-1 Risk Analysis Summary ................................................................................ 25-4
LIST OF FIGURES PAGE
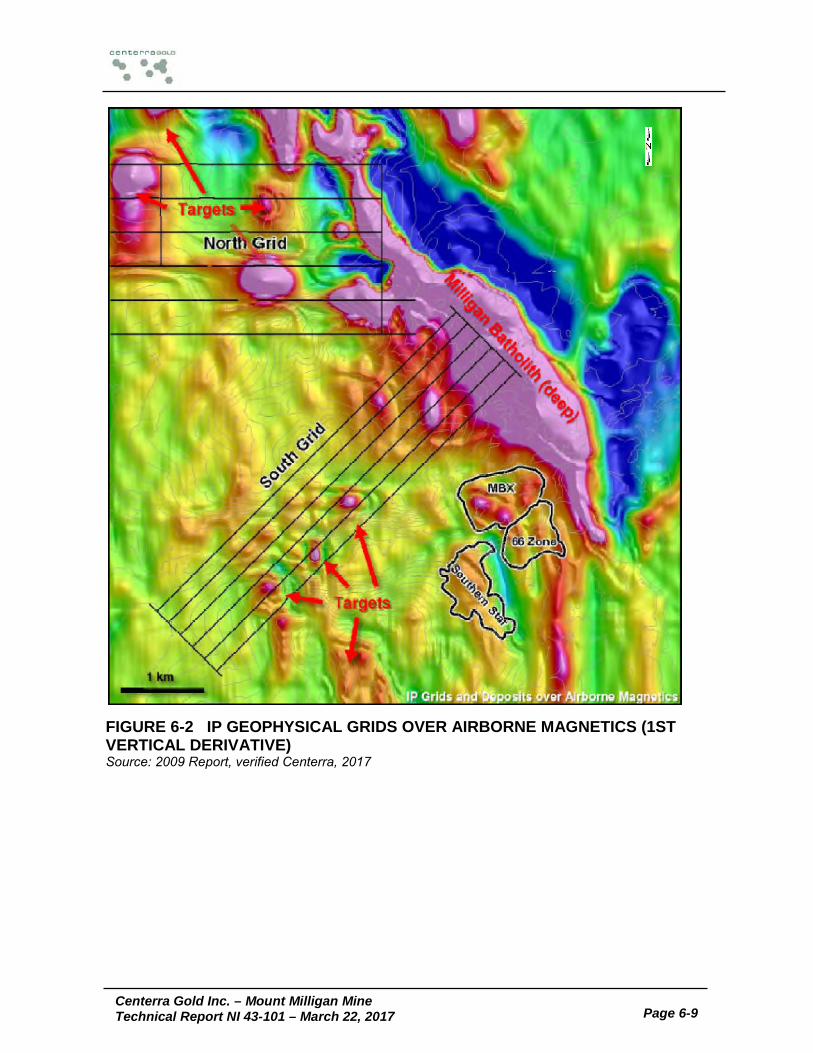
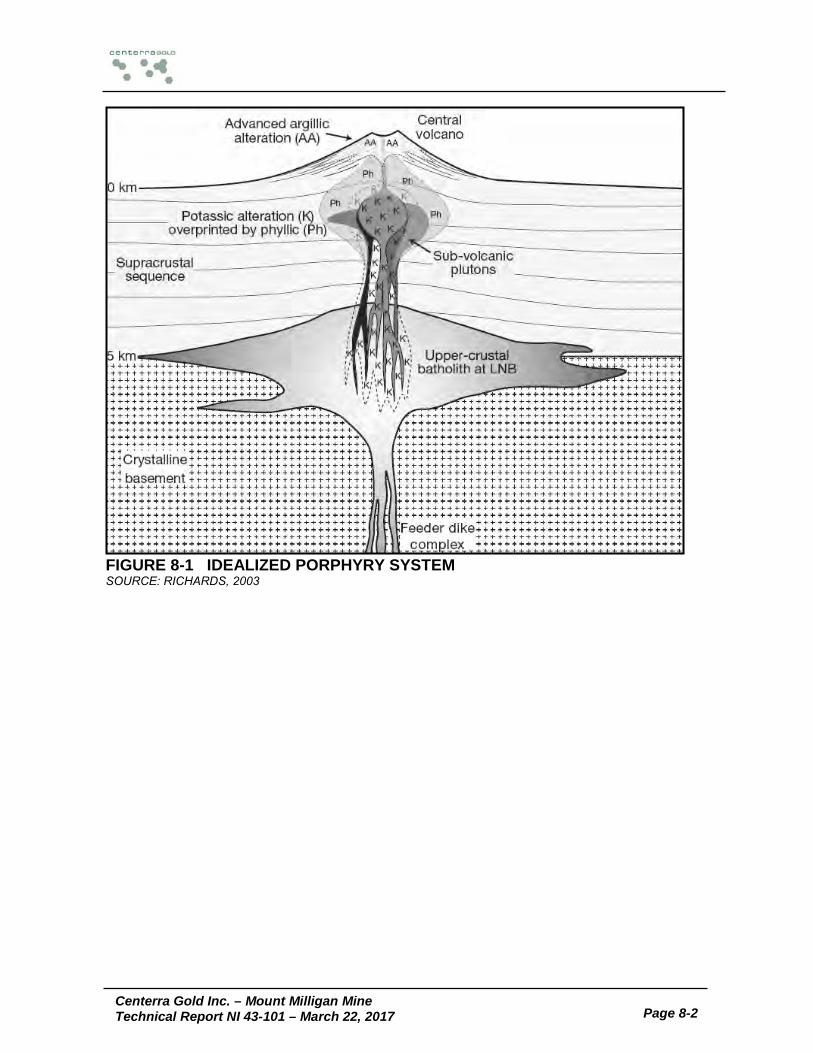
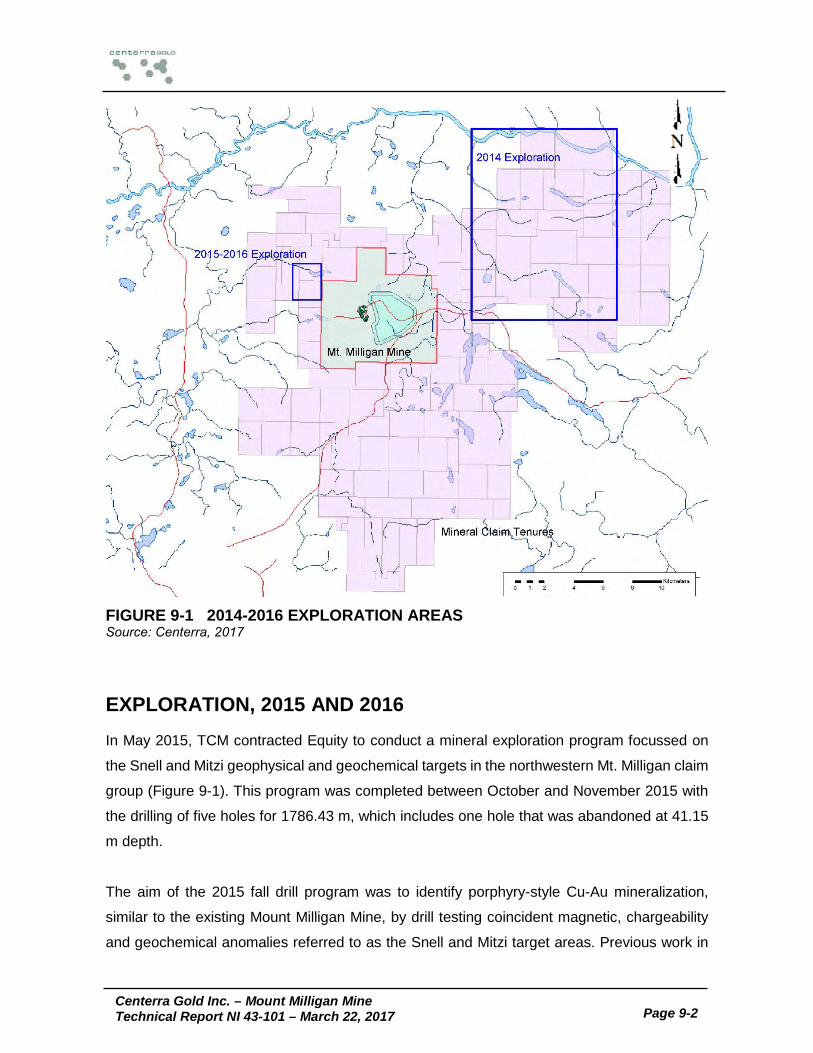
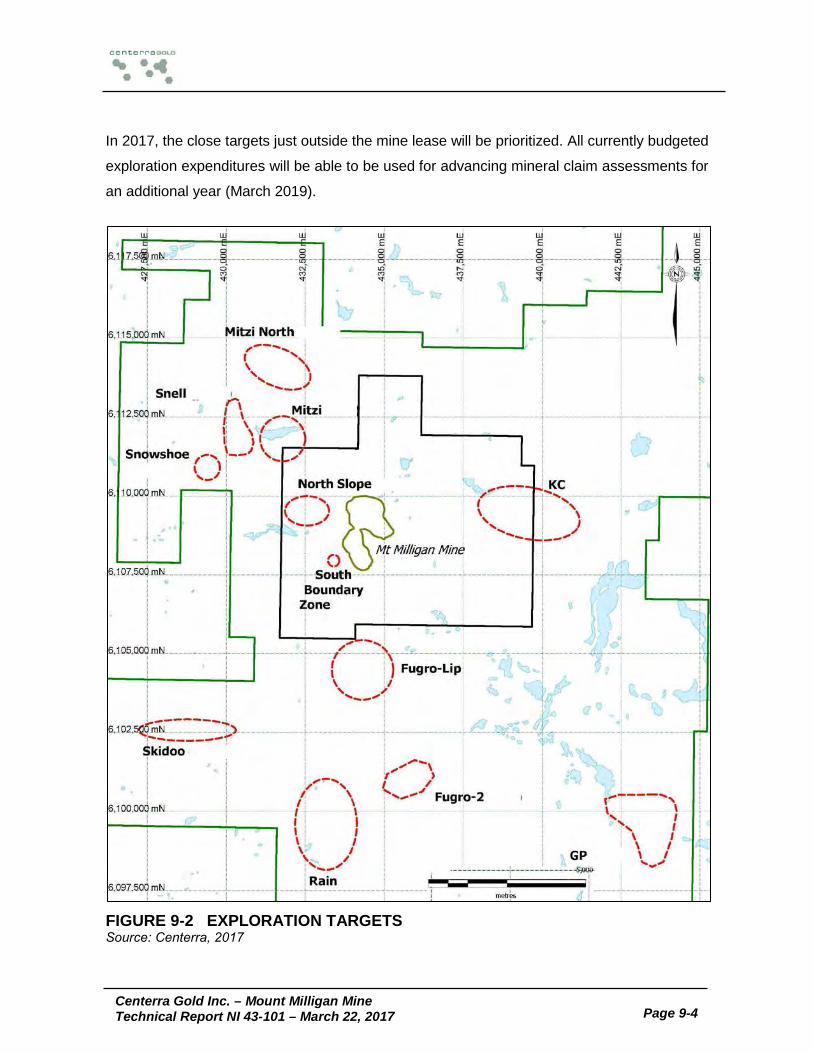
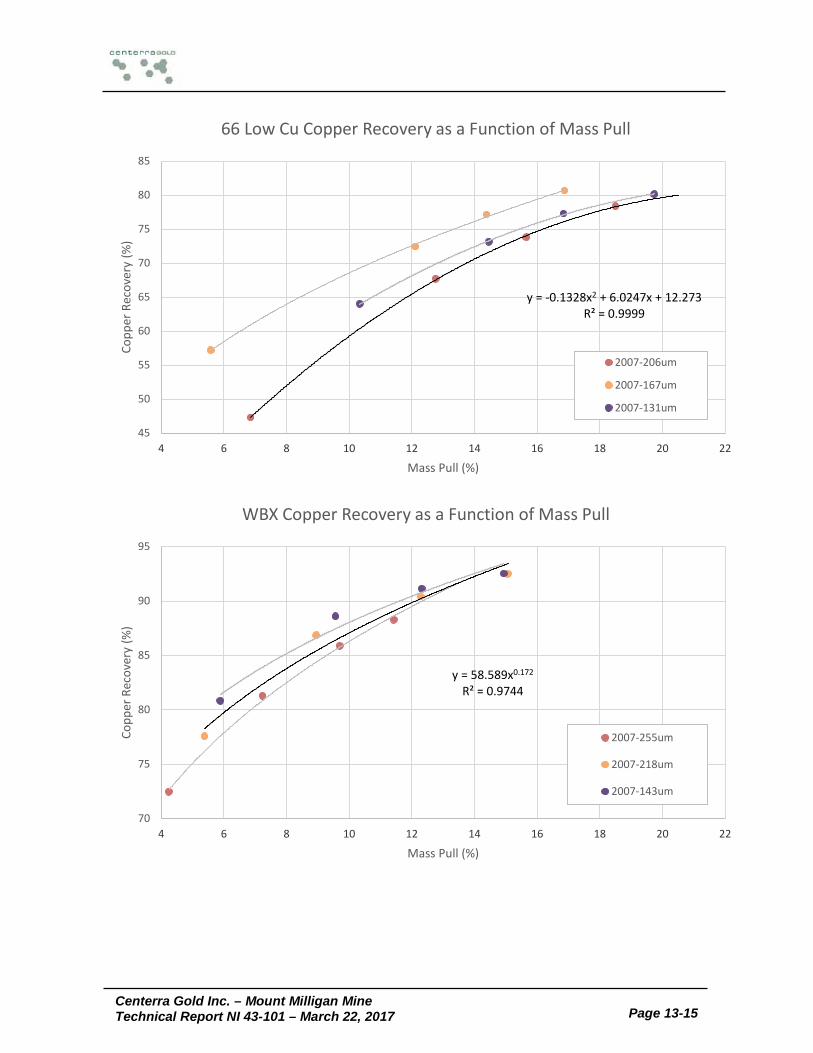
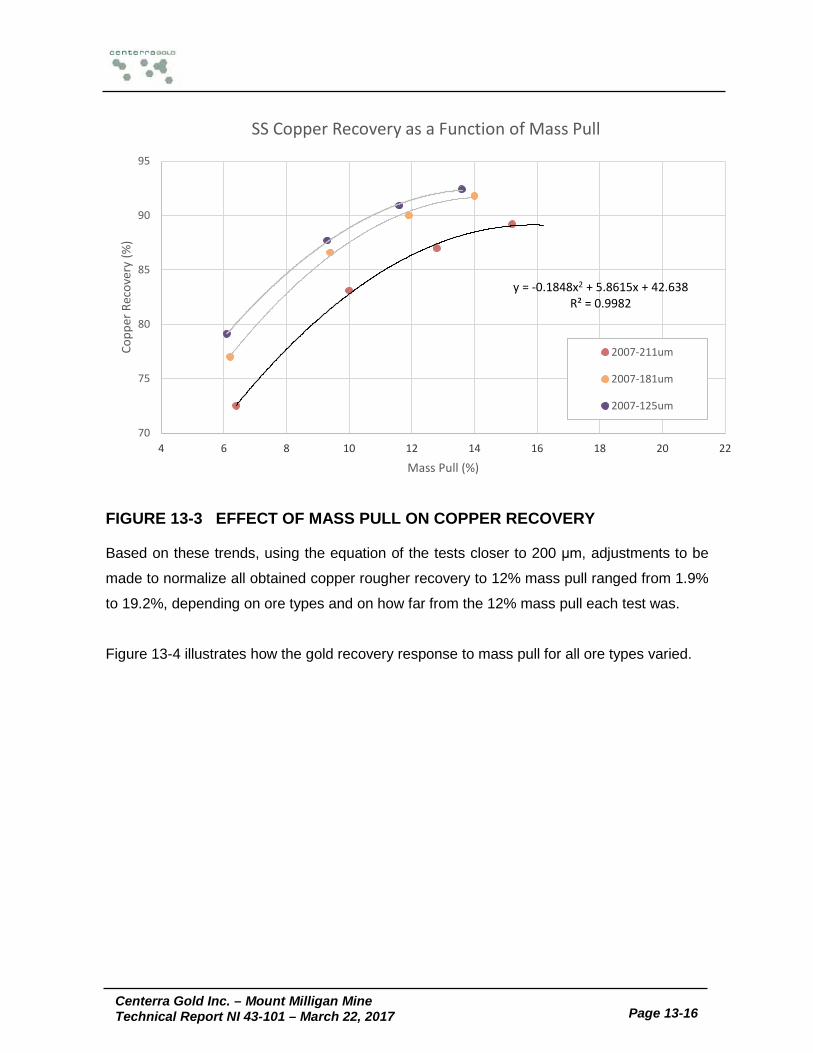
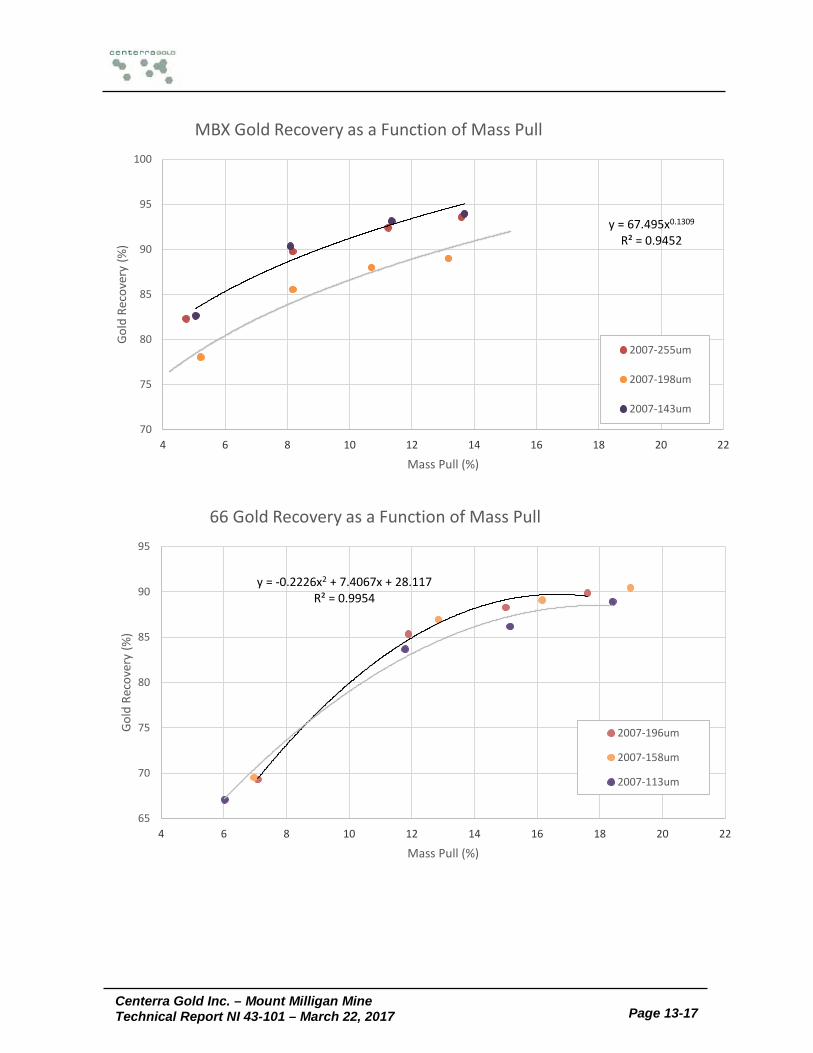
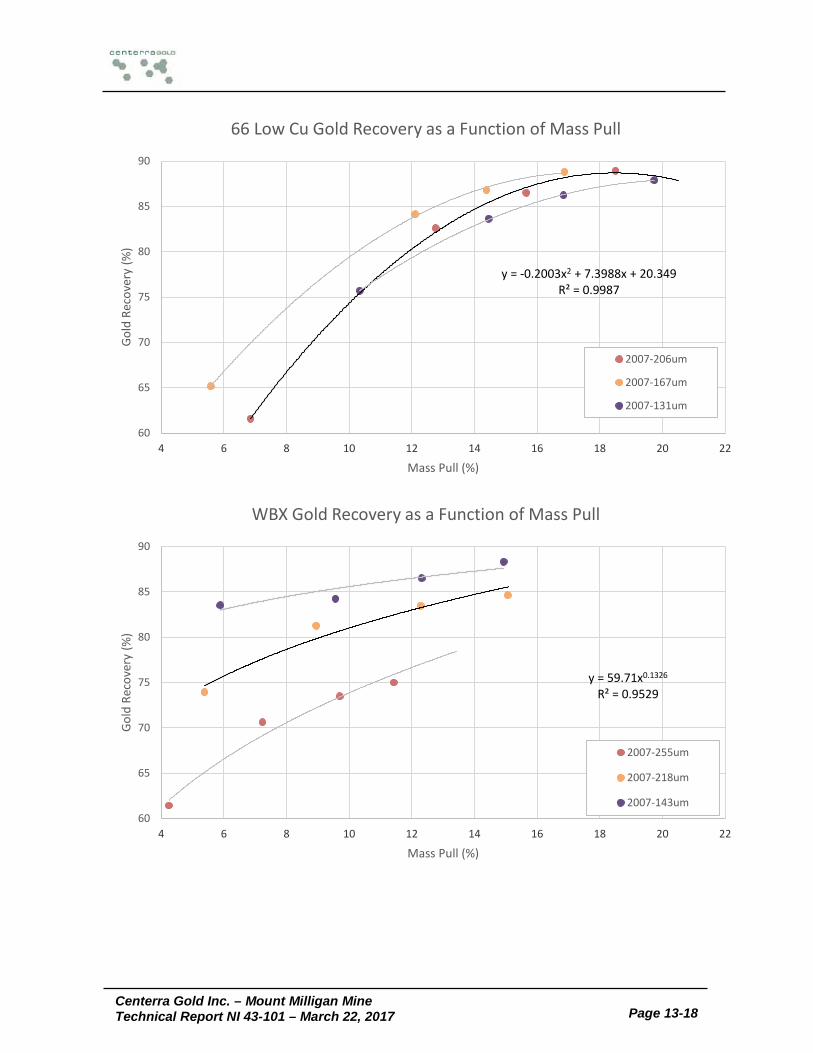
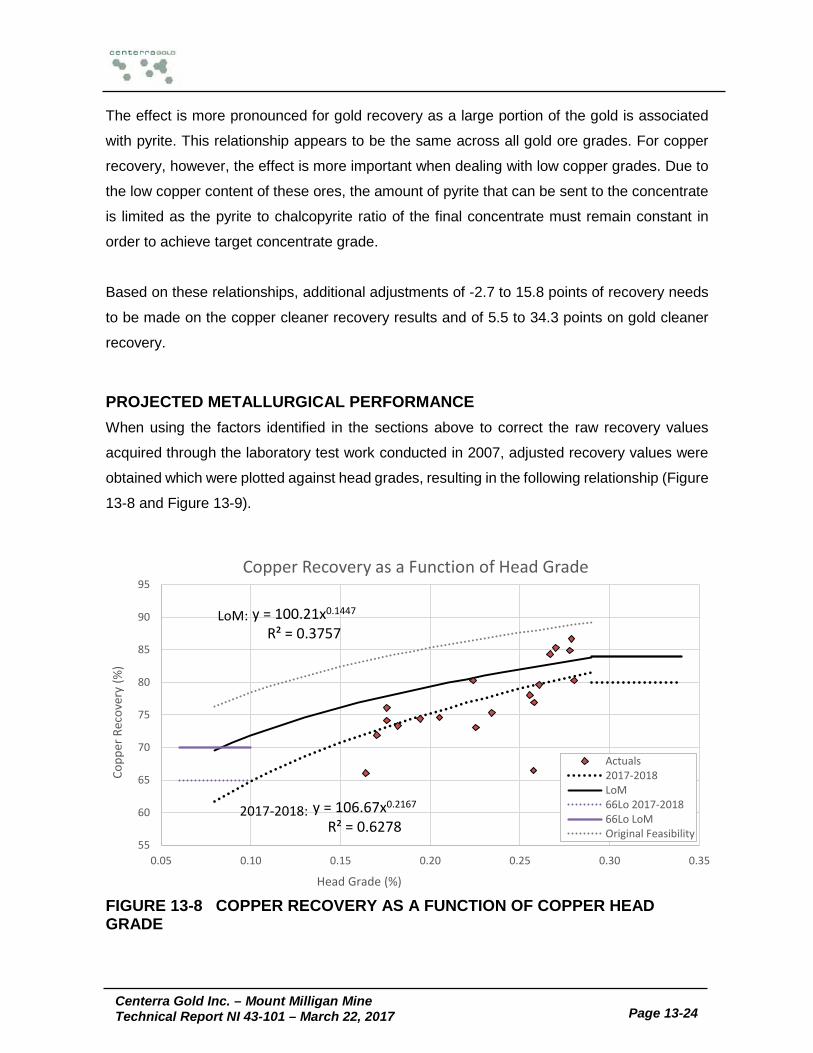
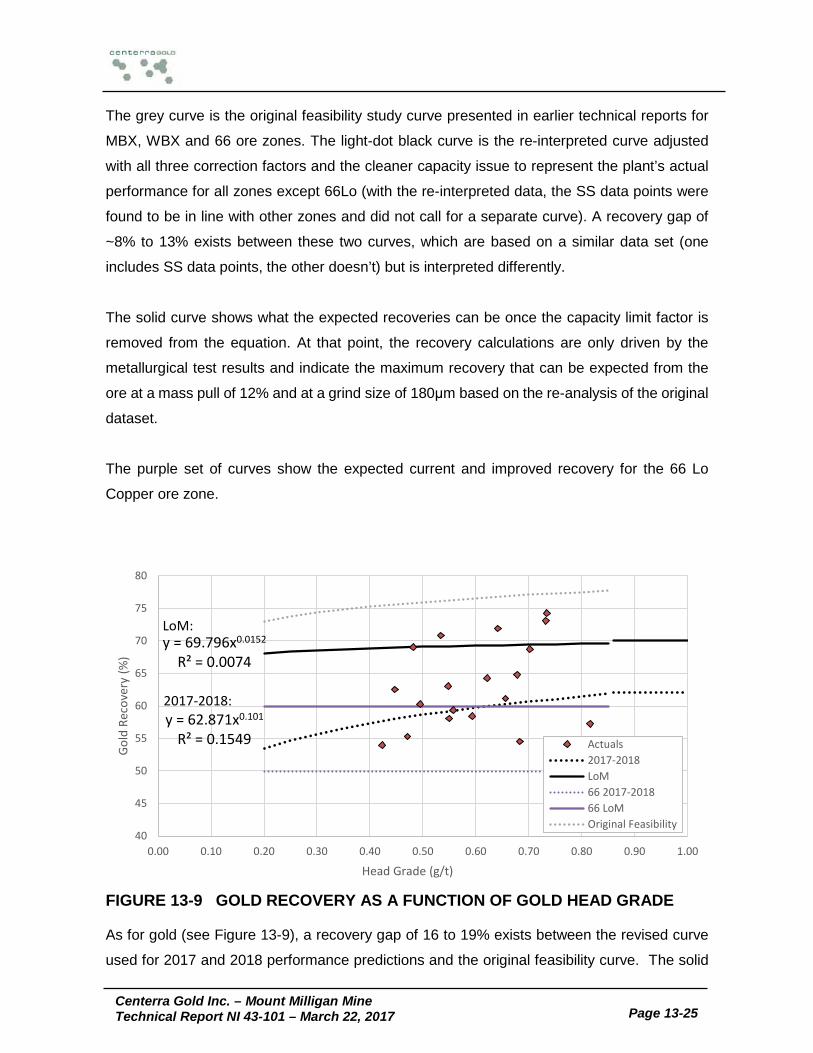
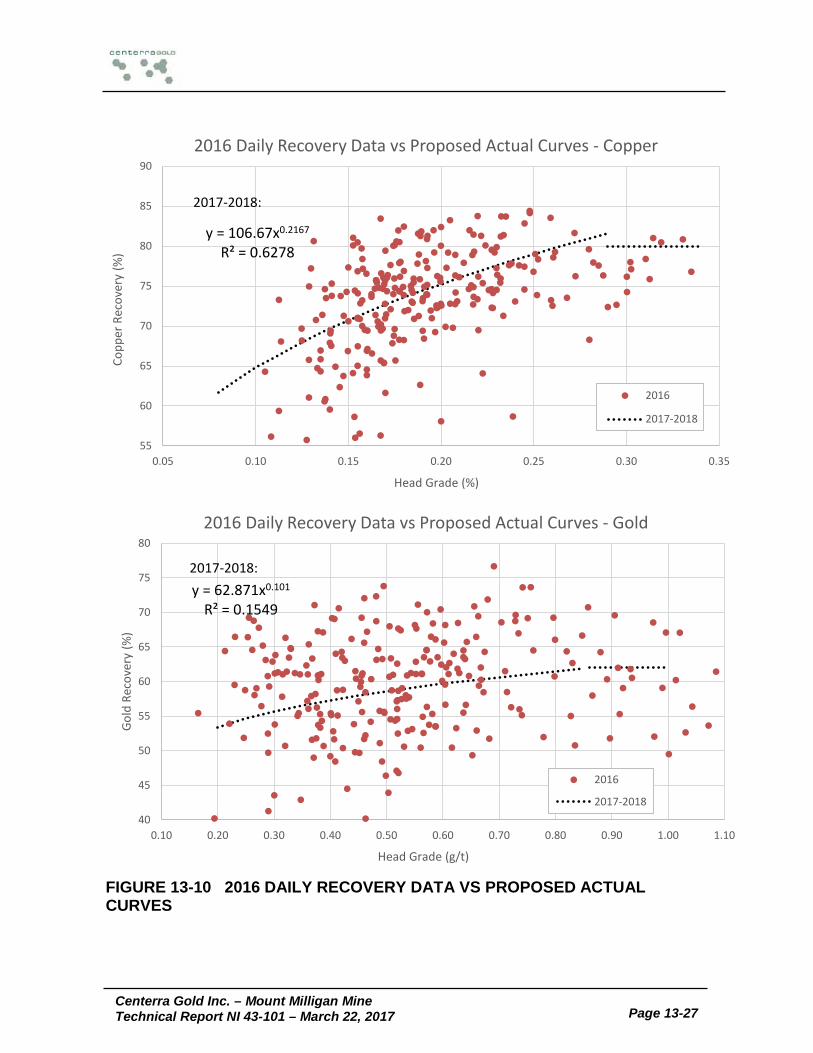
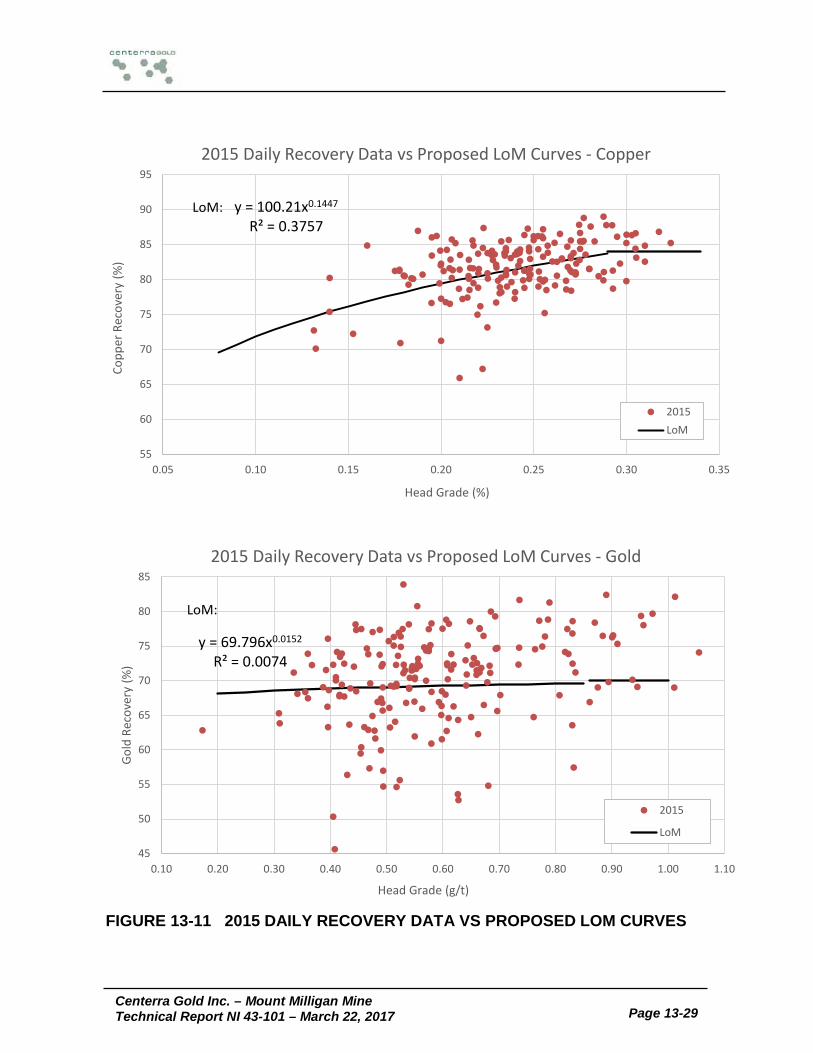
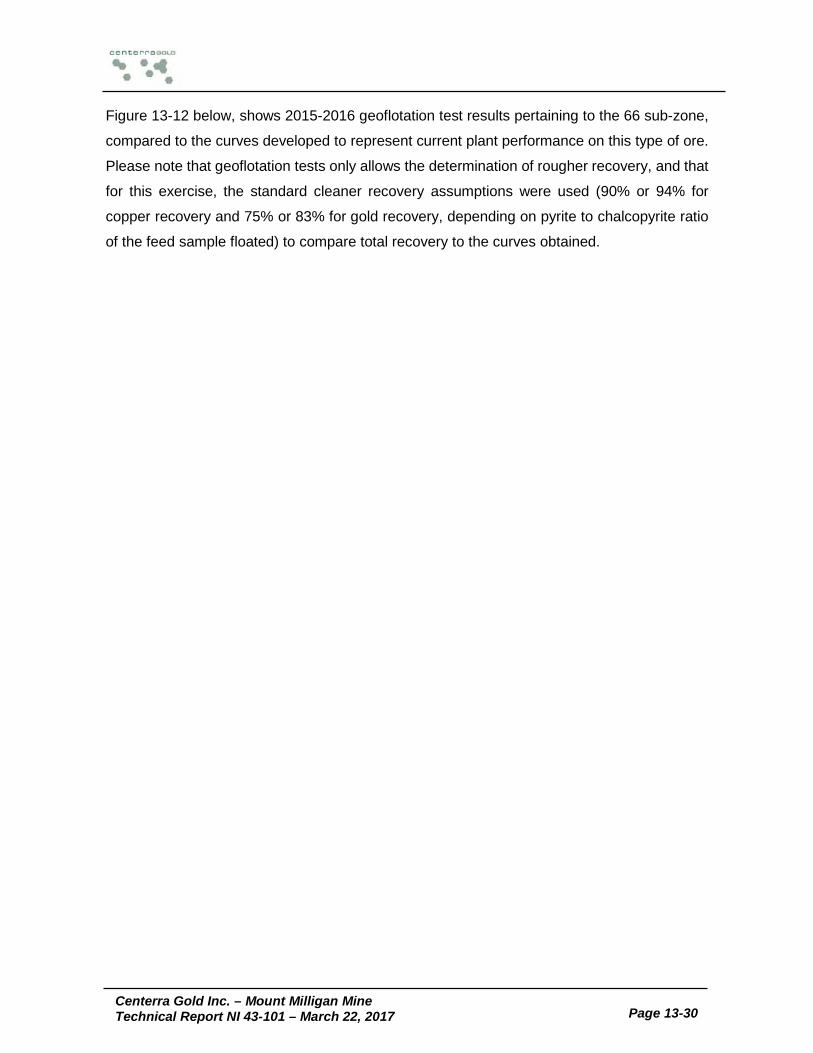
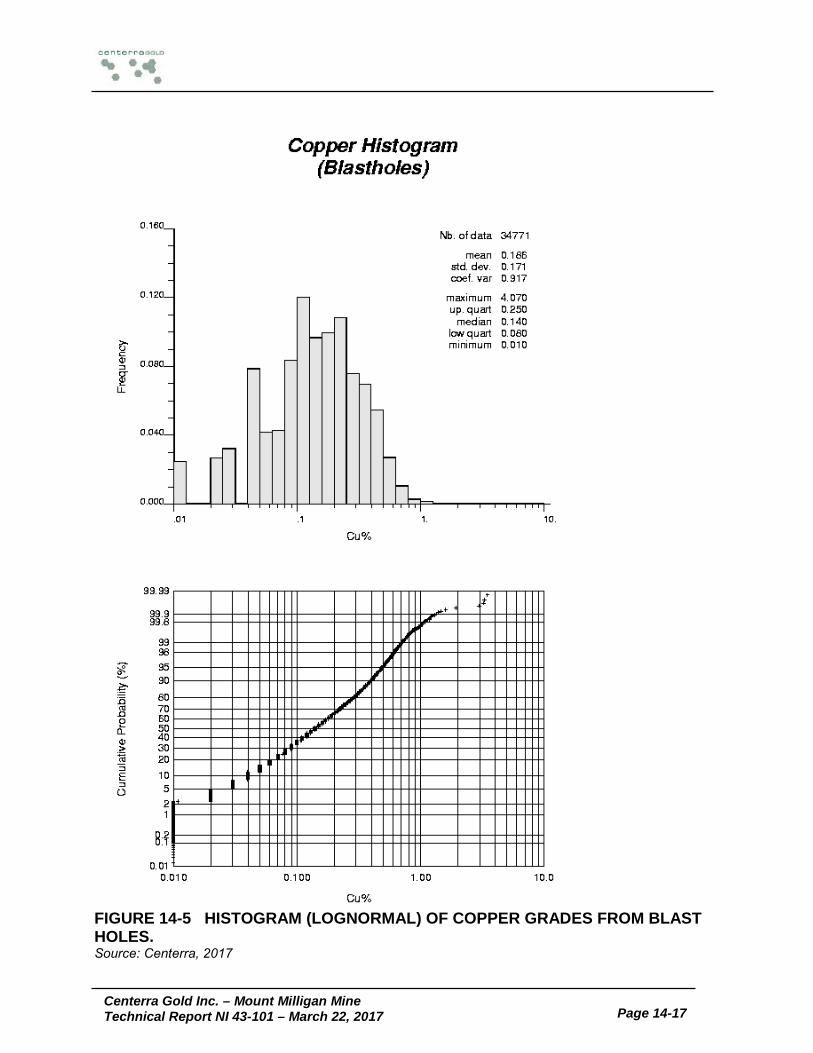
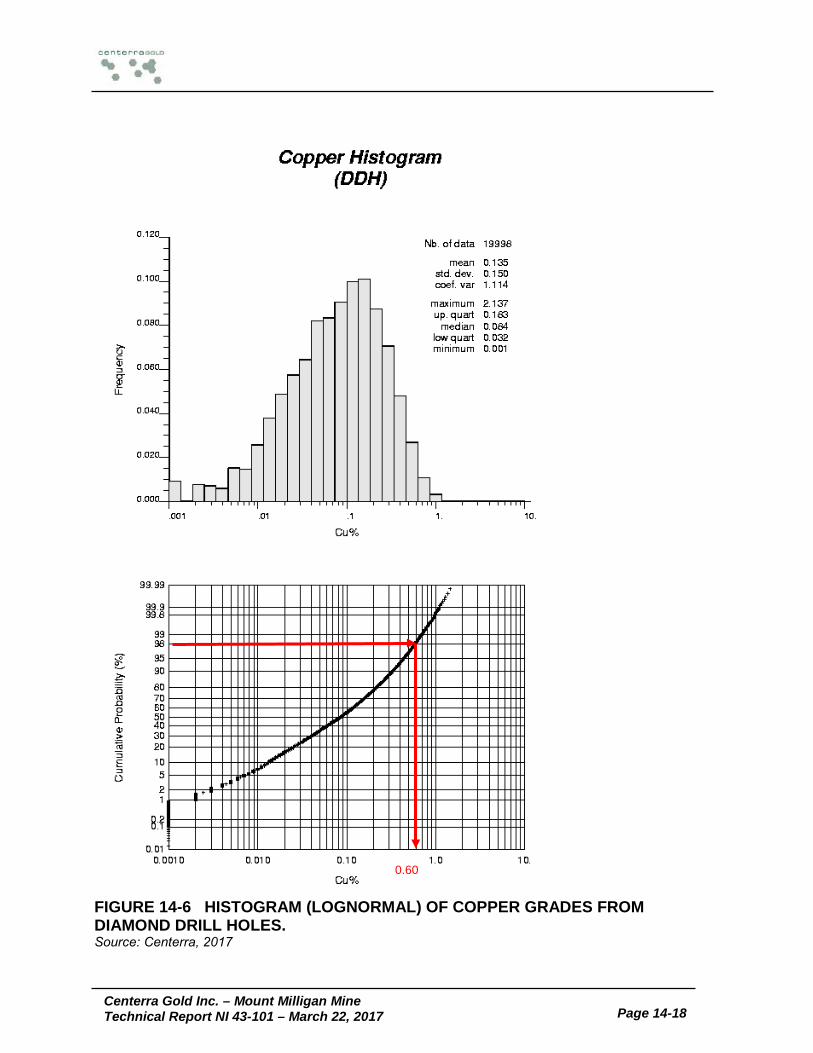
Figure 4-1 Location Map ................................................................................................... 4-1 Figure 4-2 Overall Site Layout .......................................................................................... 4-2 Figure 4-3 Claim Status .................................................................................................... 4-4 Figure 6-1 Drill Hole Location by Year (1987 – 2007) ....................................................... 6-7 Figure 6-2 IP Geophysical Grids over Airborne Magnetics (1st Vertical Derivative) .......... 6-9 Figure 6-3 South Grid – IP Chargeability in Plan View with Soil Anomaly and Historic Drilling ......................................................................................................................................... 6-10 Figure 6-4 South Grid Section 61+00N – D1, D2, and D3 IP Chargeability Anomalies with Historic Drilling .................................................................................................................. 6-11 Figure 6-5 North Grid – Airborne Magnetics Highs with Associated IP Chargeability Anomalies ......................................................................................................................... 6-11 Figure 6-6 North Grid Section 22+00N – Mitzi Anomaly (Magnetic High) with IP Chargeability Anomalies forming WBX- and MBX-like Exploration Targets ....................... 6-12 Figure 7-1 Regional Geological Setting............................................................................. 7-2 Figure 8-1 Idealized Porphyry System Source: Richards, 2003 ....................................... 8-2 Figure 9-1 2014-2016 Exploration Areas .......................................................................... 9-2 Figure 9-2 Exploration Targets ......................................................................................... 9-4 Figure 10-1 Drill Hole Location Map – Phases I to IV Drilling .......................................... 10-4 Figure 10-2 Drill Hole Location Map – Phase IV Drilling .................................................. 10-7 Figure 13-1 Feasibility Recovery Curves ...................................................................... 13-10 Figure 13-2 Effect of Grind Size on Copper and Gold Recovery ................................... 13-12 Figure 13-3 Effect of Mass Pull on Copper Recovery .................................................... 13-16 Figure 13-4 Effect of Mass Pull on Gold Recovery ........................................................ 13-19 Figure 13-5 Feasibility Sample Flotation Results Compared to 2015-2016 Geoflotation Results ........................................................................................................................... 13-20 Figure 13-6 Comparison of Effect of Mass Pull On High and Low Recovery Samples .. 13-21 Figure 13-7 Effect of Iron Rougher Recovery on Copper and Gold Cleaner Recovery .. 13-23 Figure 13-8 Copper Recovery as a Function of Copper Head Grade ............................ 13-24 Figure 13-9 Gold Recovery as a Function of Gold Head Grade .................................... 13-25 Figure 13-10 2016 Daily Recovery Data vs Proposed Actual Curves ............................ 13-27 Figure 13-11 2015 Daily Recovery Data vs Proposed LoM Curves ............................... 13-29 Figure 13-12 2015-2016 66 Zone Geofloat Data vs Proposed Actual Curves ............... 13-31 Figure 14-1 SS Cross Section – 6108220N .................................................................... 14-5
Centerra Gold Inc. – Mount Milligan Mine
Technical Report NI 43-101 – March 22, 2017 Page vii
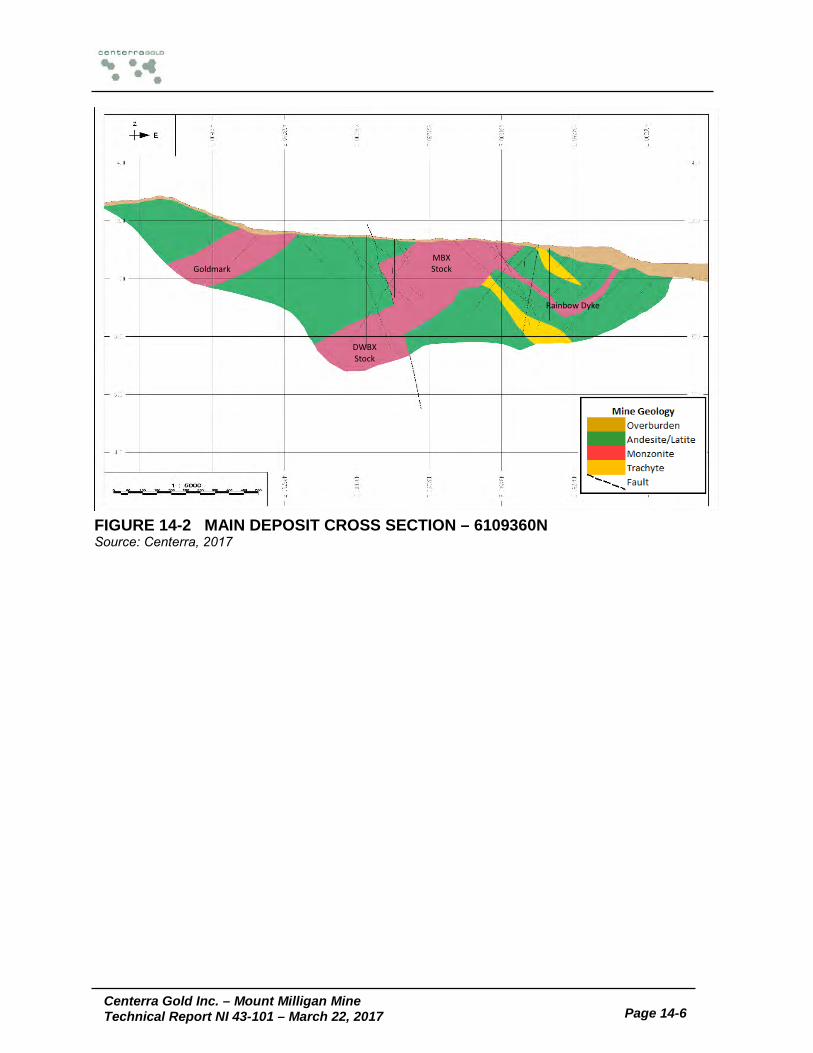
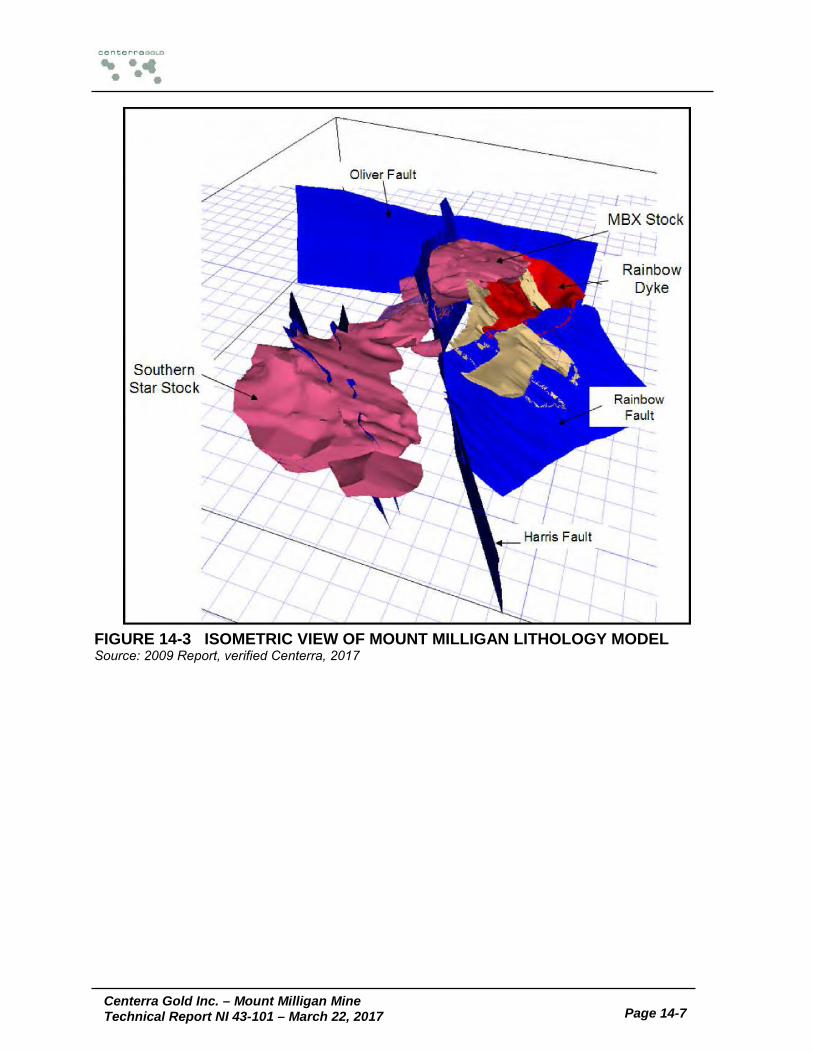
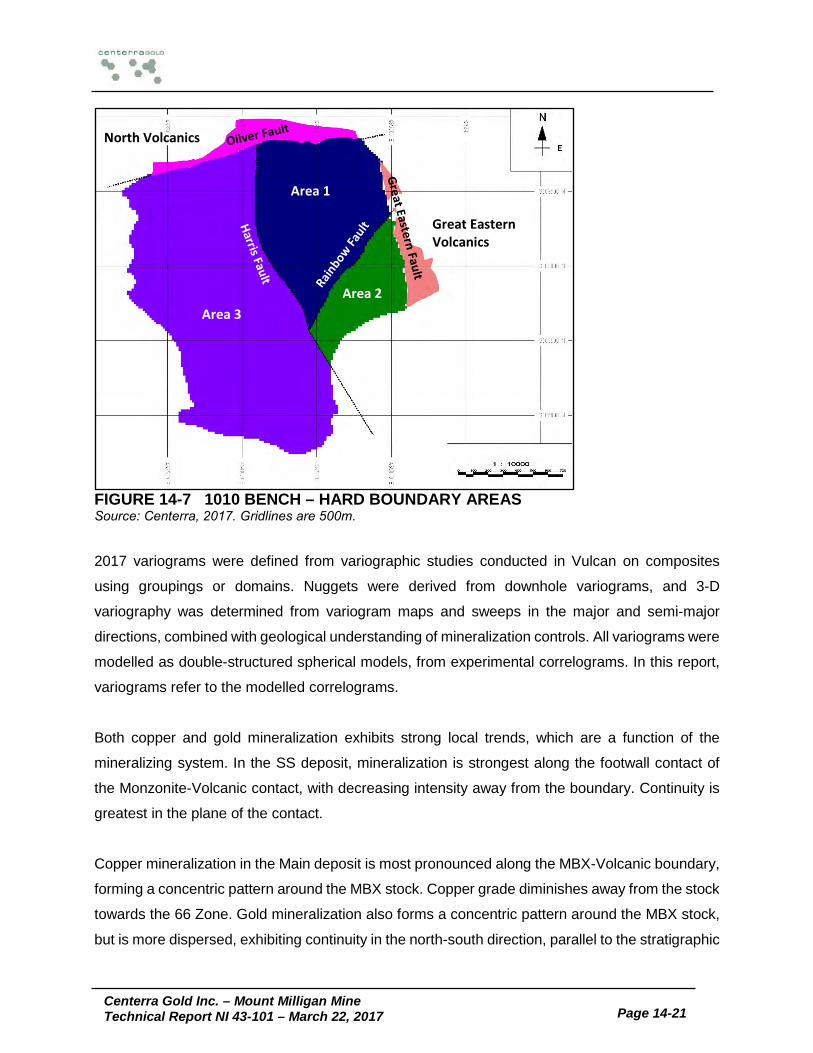
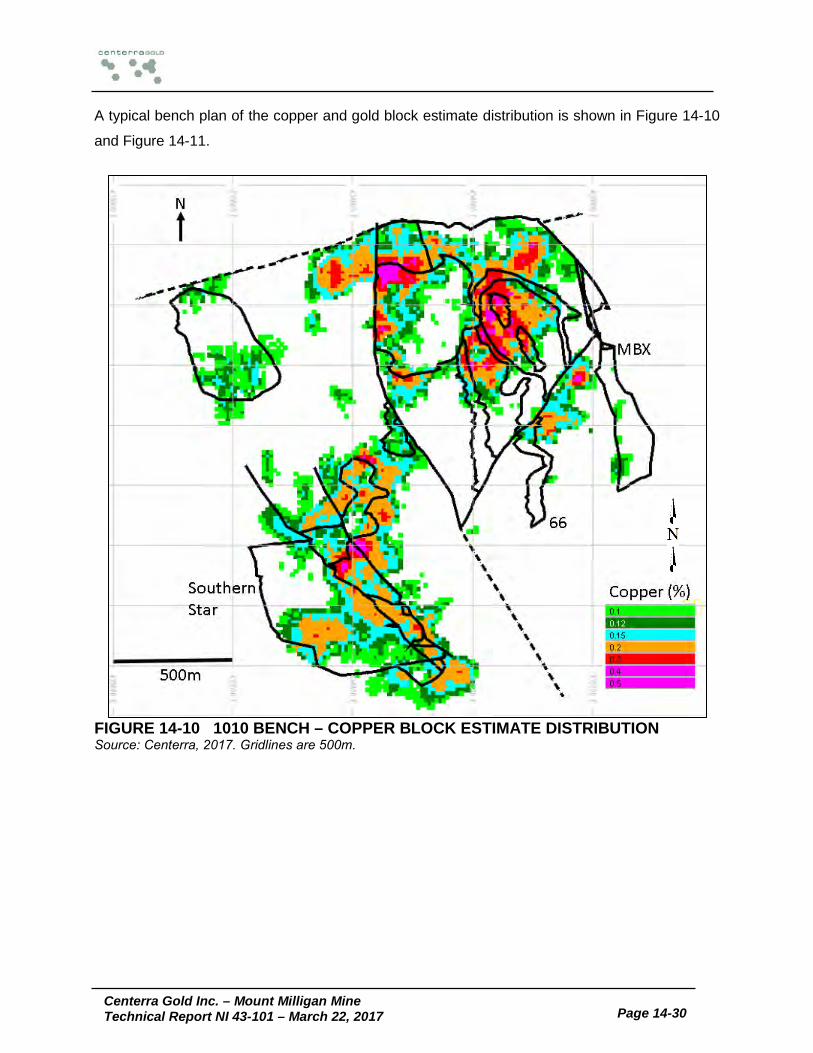
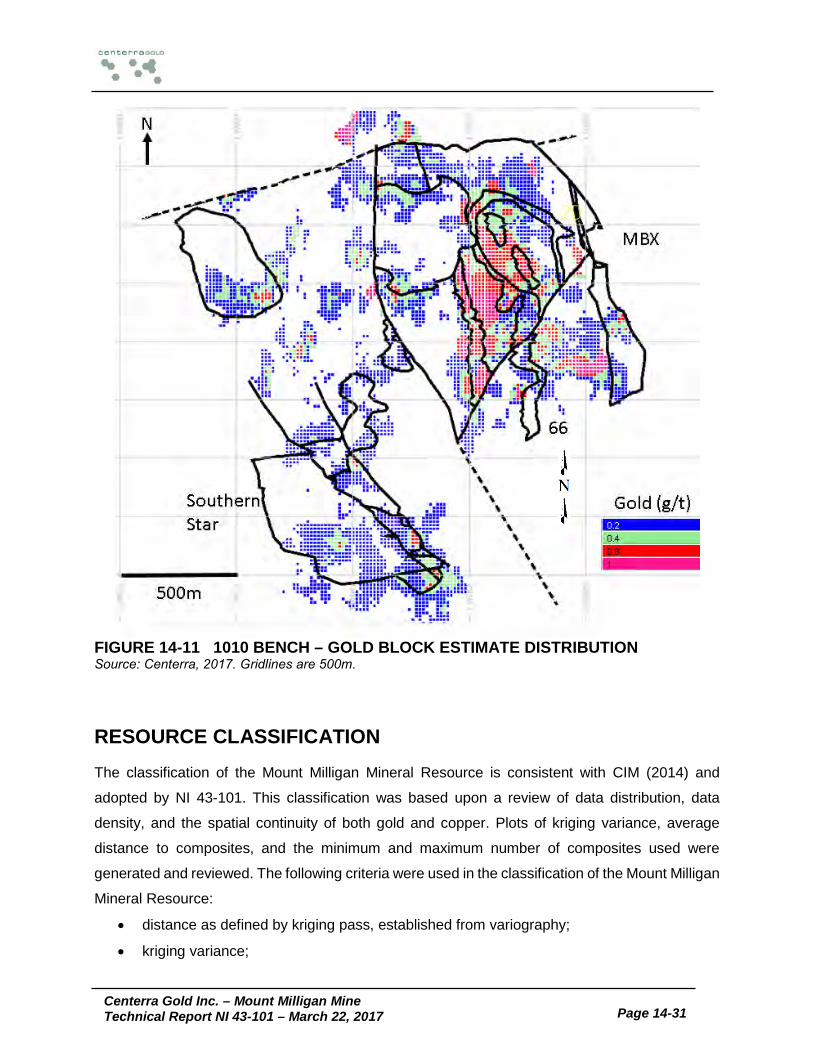
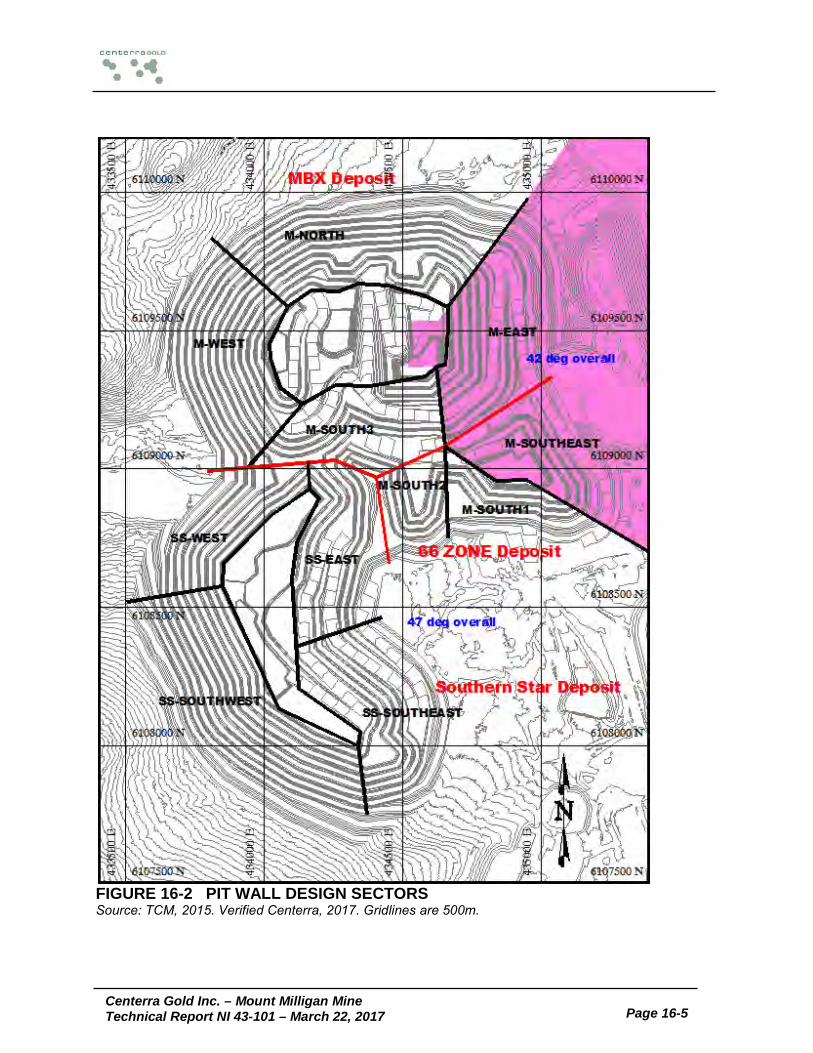
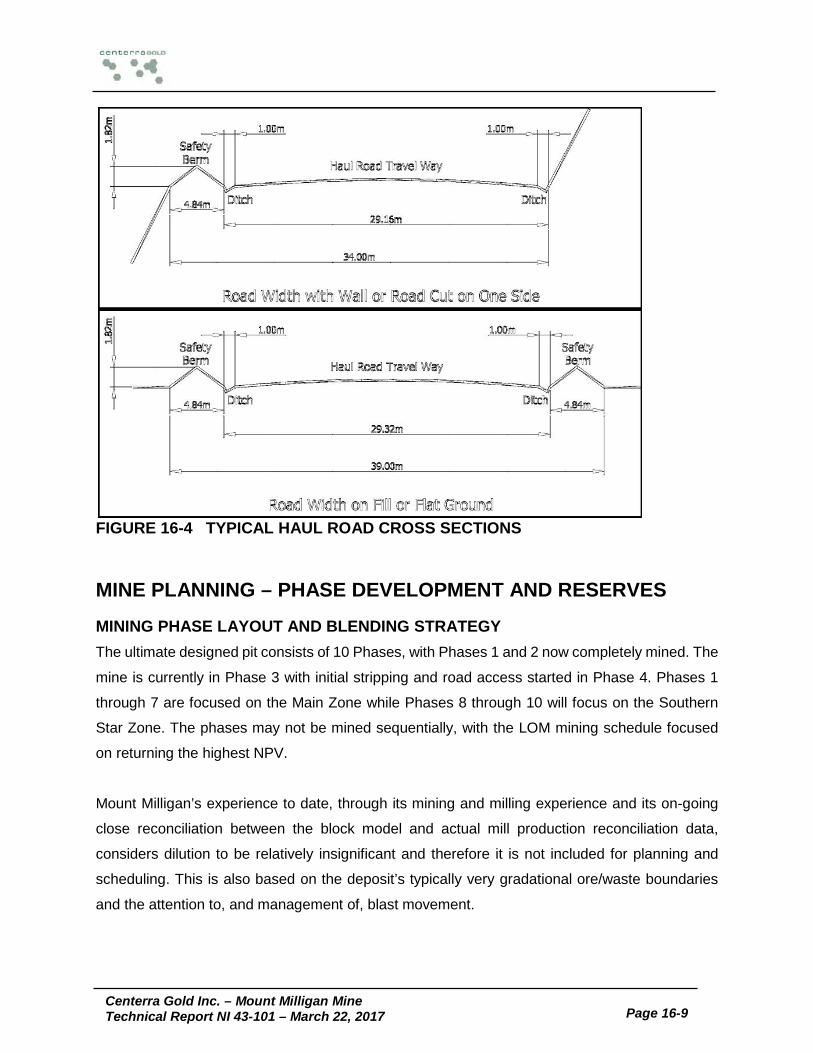
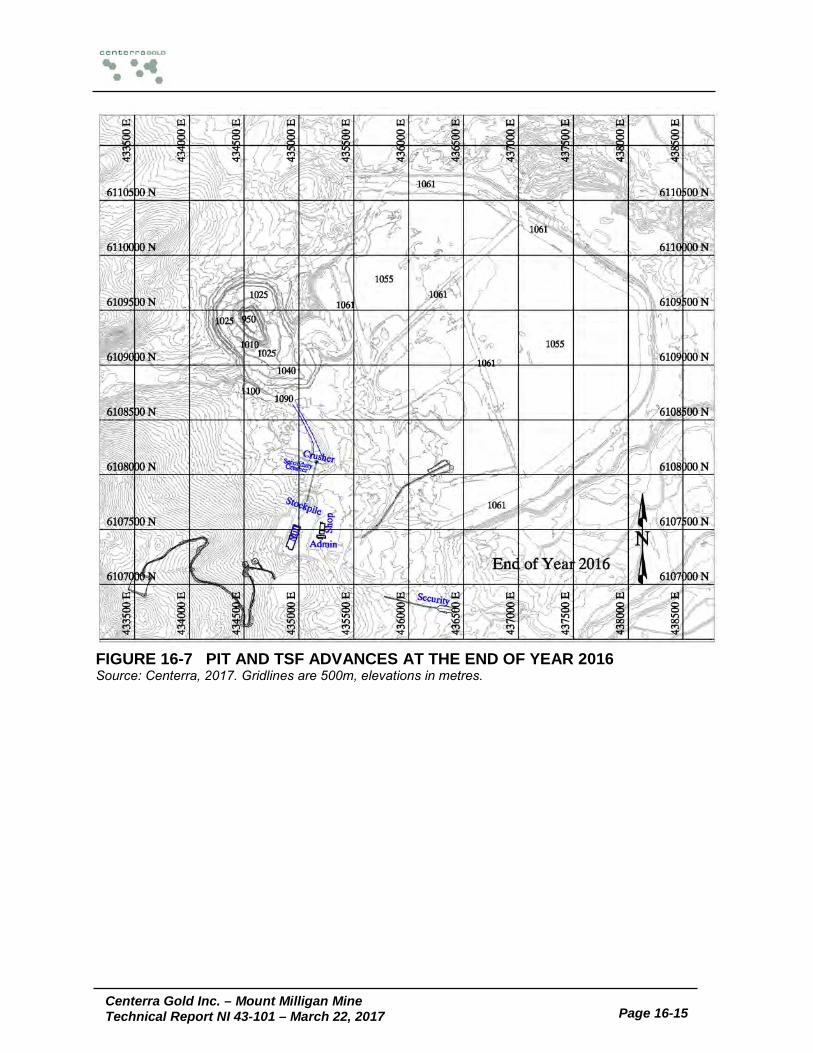
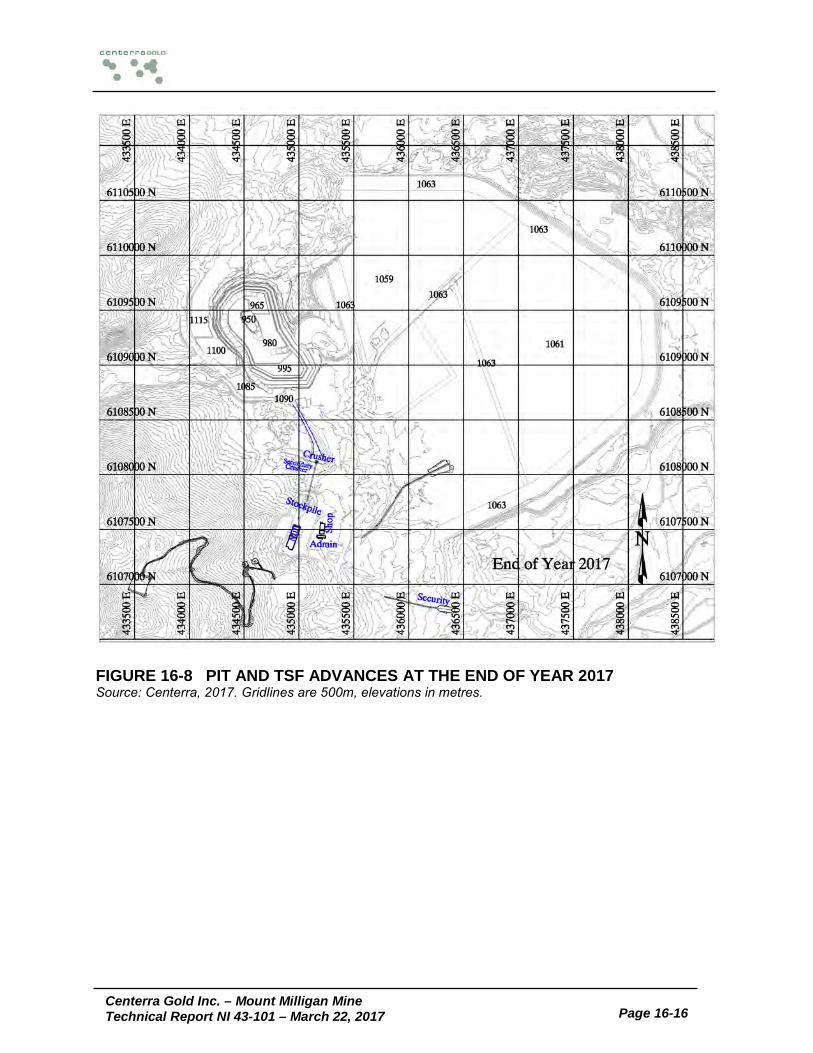
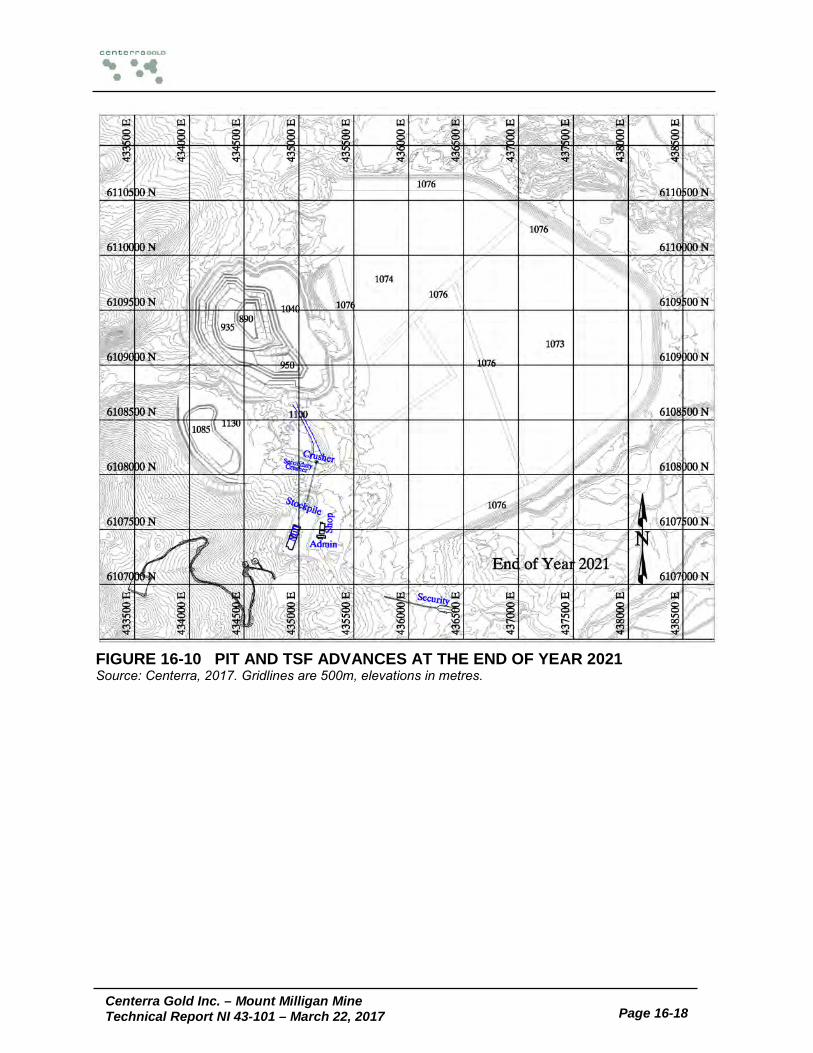
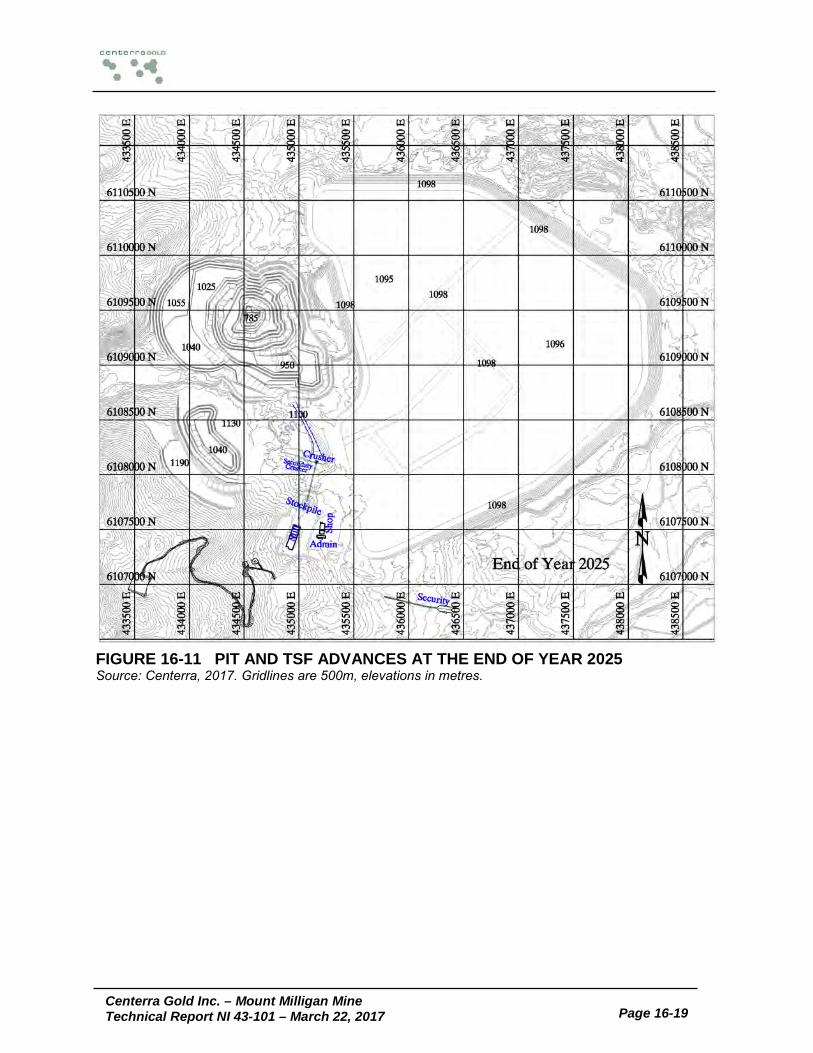
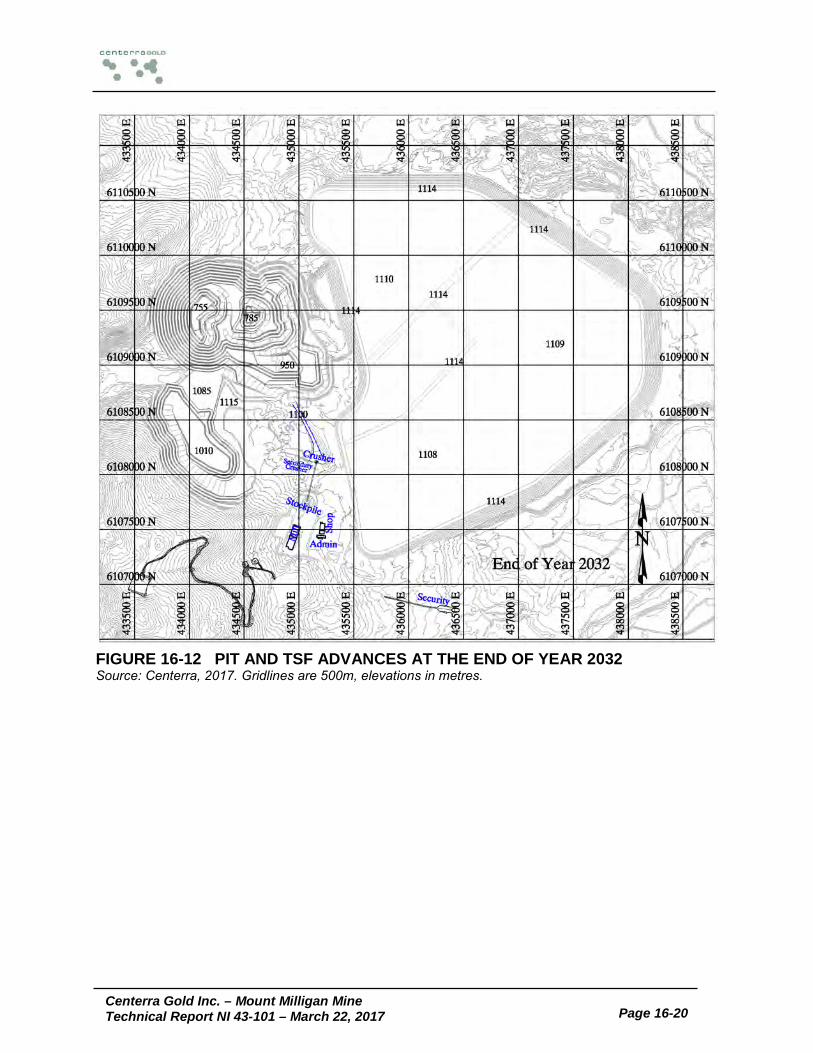
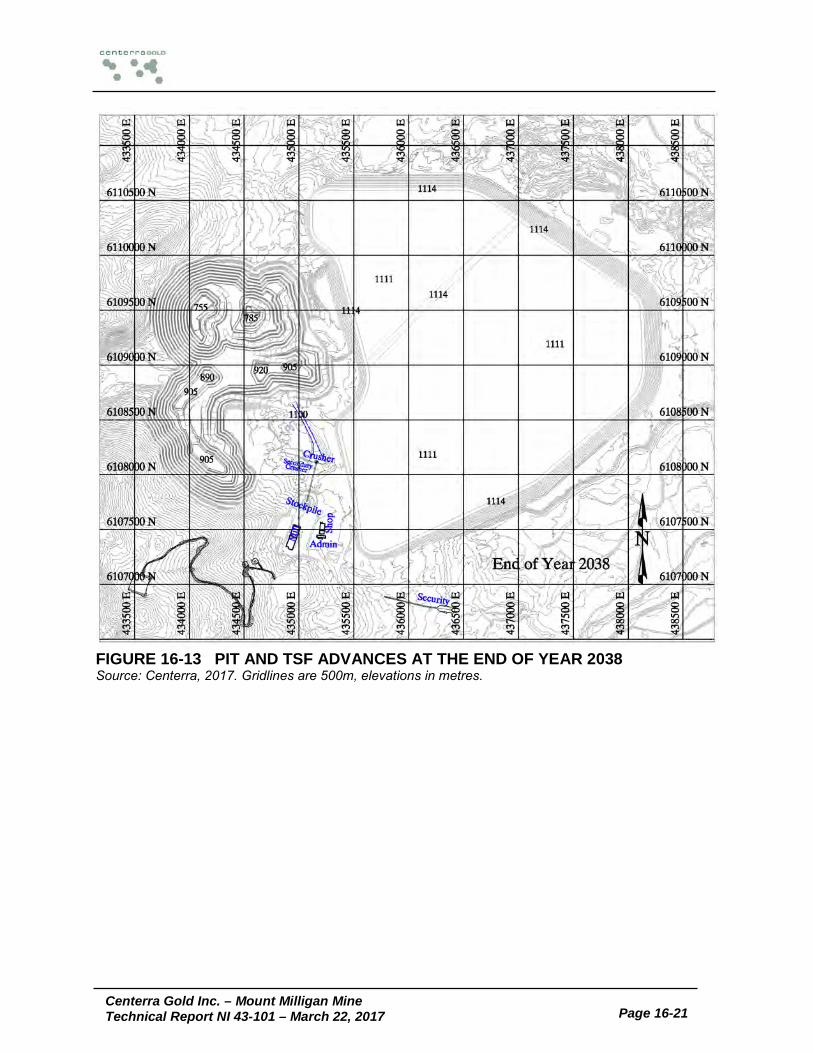
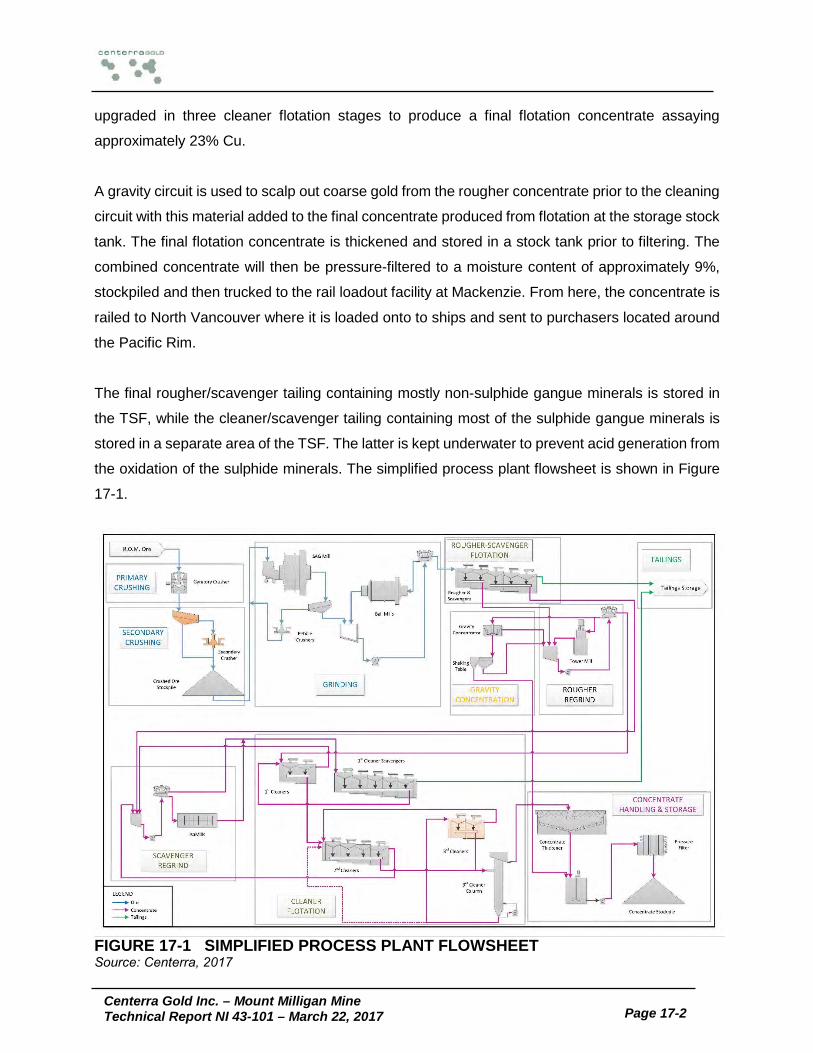
Figure 14-2 Main Deposit Cross Section – 6109360N .................................................... 14-6 Figure 14-3 Isometric View of Mount Milligan Lithology Model ........................................ 14-7 Figure 14-4 1010 Bench - SG Estimates Showing SG Sample Dataset ........................ 14-11 Figure 14-5 Histogram (Lognormal) of Copper Grades From Blast Holes. .................... 14-17 Figure 14-6 Histogram (Lognormal) of Copper Grades From Diamond Drill Holes. ....... 14-18 Figure 14-7 1010 Bench – Hard Boundary Areas ......................................................... 14-21 Figure 14-8 1010 Bench – Lithology Code Distribution ................................................. 14-25 Figure 14-9 1010 Bench –Domain Code Distribution .................................................... 14-26 Figure 14-10 1010 Bench – Copper Block Estimate Distribution ................................... 14-30 Figure 14-11 1010 Bench – Gold Block Estimate Distribution ....................................... 14-31 Figure 14-12 6109450 N – Block Model Compared to Composites (a) Copper (b) Gold 14-33 Figure 15-1 Cut-off Grade Chart by Metal Grade ............................................................ 15-5 Figure 16-1 General Arrangement Map .......................................................................... 16-3 Figure 16-2 Pit Wall Design Sectors ............................................................................... 16-5 Figure 16-3 Catch Benches for Rock Fall Hazards ......................................................... 16-7 Figure 16-4 Typical Haul Road Cross Sections ............................................................... 16-9 Figure 16-5 End of Year 2016 topography .................................................................... 16-11 Figure 16-6 Major Mining Phases ................................................................................. 16-12 Figure 16-7 Pit and TSF Advances at the End of Year 2016 ......................................... 16-15 Figure 16-8 Pit and TSF Advances at the End of Year 2017 ......................................... 16-16 Figure 16-9 Pit and TSF Advances at the End of Year 2018 ......................................... 16-17 Figure 16-10 Pit and TSF Advances at the End of Year 2021 ....................................... 16-18 Figure 16-11 Pit and TSF Advances at the End of Year 2025 ....................................... 16-19 Figure 16-12 Pit and TSF Advances at the End of Year 2032 ....................................... 16-20 Figure 16-13 Pit and TSF Advances at the End of Year 2038 ....................................... 16-21 Figure 17-1 Simplified Process Plant Flowsheet ............................................................. 17-2 Figure 18-1 Tailing Storage Facility – Final Arrangement Year 2038 .............................. 18-2
Centerra Gold Inc. – Mount Milligan Mine
Technical Report NI 43-101 – March 22, 2017 Page 1-1
1 SUMMARY This Technical Report summarizes the current operations, Mineral Reserves and Mineral
Resources for the Mount Milligan copper gold mine (the Mount Milligan Mine, the Project or
the Property) located between Fort St. James and Mackenzie, British Columbia, Canada. The
Technical Report was prepared by and for Centerra Gold Inc. (Centerra) by a qualified person
as further described in Section 2. This Technical Report conforms to National Instrument 43-
101- Standards of Disclosure for Mineral Projects (NI 43-101) and follows the format set out in
Form 43-101F1 for Technical Reports.
Ore is extracted by conventional hard rock open pit methods and delivered to a flotation mill
with an original design capacity rate of 60,000 tonnes per day (t/d). A secondary crushing
circuit together with mill optimization projects will increase throughput to a nominal rate of
62,500 t/d.
All dollar figures in this Technical Report refer to US dollars, unless otherwise noted.
PROJECT LOCATION The Project is located 155 kilometres (km) northwest of Prince George (population
approximately 72,000) in north-central British Columbia. Forestry–based communities
Mackenzie (population approximately 5,200) and Fort St. James (population approximately
1,900) are within daily commuting distance of the Project site. Both communities are serviced
by rail.
PROJECT HISTORY AND OWNERSHIP Limited exploration activity was first recorded in 1937. In 1984, prospector Richard Haslinger
(Haslinger) and BP Resources Canada Limited (BP Resources) located claims on the site. In
1986, Lincoln Resources Inc. (Lincoln) optioned the claims and in 1987 completed a diamond
drilling program that led to the discovery of significant copper-gold mineralization. In the late
1980s, Lincoln reorganized, amalgamated with Continental Gold Corp. (Continental Gold) and
continued ongoing drilling in a joint-venture with BP Resources.
Centerra Gold Inc. – Mount Milligan Mine
Technical Report NI 43-101 – March 22, 2017 Page 1-2
In 1991, Placer Dome Inc. (Placer Dome) acquired the Project from the joint-venture partners,
resumed exploration drilling and completed a pre-feasibility study for the development of a
60,000 t/d open pit mine and flotation process plant.
Barrick Gold Corporation (Barrick) purchased Placer Dome in 2006 and sold its Canadian
assets to Goldcorp Inc. (Goldcorp), who then in turn sold the Project to Atlas Cromwell Ltd.
(Atlas Cromwell). Atlas Cromwell changed its name to Terrane Metals Corp. (Terrane) and
initiated a comprehensive work program.
In October 2010, Thompson Creek Metals Company Inc. (TCM) acquired the Mount Milligan
development project through its acquisition of Terrane and subsequently constructed the
Mount Milligan Mine, which commenced commercial production in February 2014.
In October 2016, TCM was acquired by a subsidiary of Centerra (the Acquisition) and, in
connection with that acquisition, Terrane and certain other subsidiary entities of TCM were
amalgamated into TCM. The Mount Milligan Mine is now owned indirectly by Centerra.
When used in this Technical Report, “TCM” means the company existing prior to the
Acquisition, unless otherwise noted.
Royalties and metals streams associated with the Project are discussed in Section 4.
GEOLOGY AND MINERALIZATION Mount Milligan is a tabular, near-surface, alkalic copper-gold porphyry deposit that measures
some 2,500 metres (m) north-south, 1,500 m east-west and is +400 m thick. It consists of two
principal zones, the Main Zone and Southern Star (SS) Zone. The Main Zone includes four
contiguous sub-zones: MBX, WBX, DWBX and 66, all of which are spatially associated with
the MBX monzonite stock and Rainbow Dyke. The SS Zone is centred on a monzonite stock
of the same name and is some 1,000 m south of the Main Zone.
Main Zone mineralization and associated alteration are primarily hosted in volcanic rocks,
whereas in the SS Zone, mineralization is hosted equally in monzonite stock and volcanic
rocks. Mineralization in both zones consists of pyrite, chalcopyrite and magnetite with bornite
Centerra Gold Inc. – Mount Milligan Mine
Technical Report NI 43-101 – March 22, 2017 Page 1-3
localized along intrusive-volcanic contacts. The pyritic 66 sub-zone is notable in that it is
comparatively gold-rich.
Copper-gold mineralization is primarily associated with potassic alteration which decreases in
intensity outwards from the monzonite stocks. Pyrite content increases significantly outward
from the stocks where it occurs in association with propylitic alteration, which forms a halo
around the potassic-altered rocks.
MINERAL RESOURCE AND MINERAL RESERVE ESTIMATES The Mount Milligan copper-gold porphyry deposit contains a combined Measured and
Indicated Mineral Resource of 243.9 million tonnes (Mt) at 0.134% Cu and 0.226 grams per
tonne (g/t) Au containing 717.7 million pounds (lbs) of copper and 1,769,000 ounces (oz) of
gold and an Inferred Mineral Resource of 11.0 Mt at 0.306 g/t Au and 0.125% Cu, exclusive of
Mineral Reserves. The Mineral Resource estimate was tabulated within a conceptual open pit
shell using spot metal prices of $3.50/lb copper and $1,450/oz gold, an exchange rate of
$1.00/C$1.30, at a $6.25/t (C$8.12/t) cut-off value which includes mining, milling, G&A and
capital costs, and takes into consideration metallurgical recoveries, concentrate grades,
transportation costs, smelter treatment charges, the Haslinger net smelter return (NSR) (see
Section 4), and the stream arrangement with Royal Gold Inc. (Royal Gold) (see Section 4).
The Mineral Resource was cut from the December 31, 2016 mining surface and is reported
exclusive of the Mineral Reserve in Table 1-1. Centerra is not aware of any significant
environmental, permitting, legal, title, taxation, socio-economic, marketing, political, or other
relevant factors which could materially affect the Mineral Resource estimate.
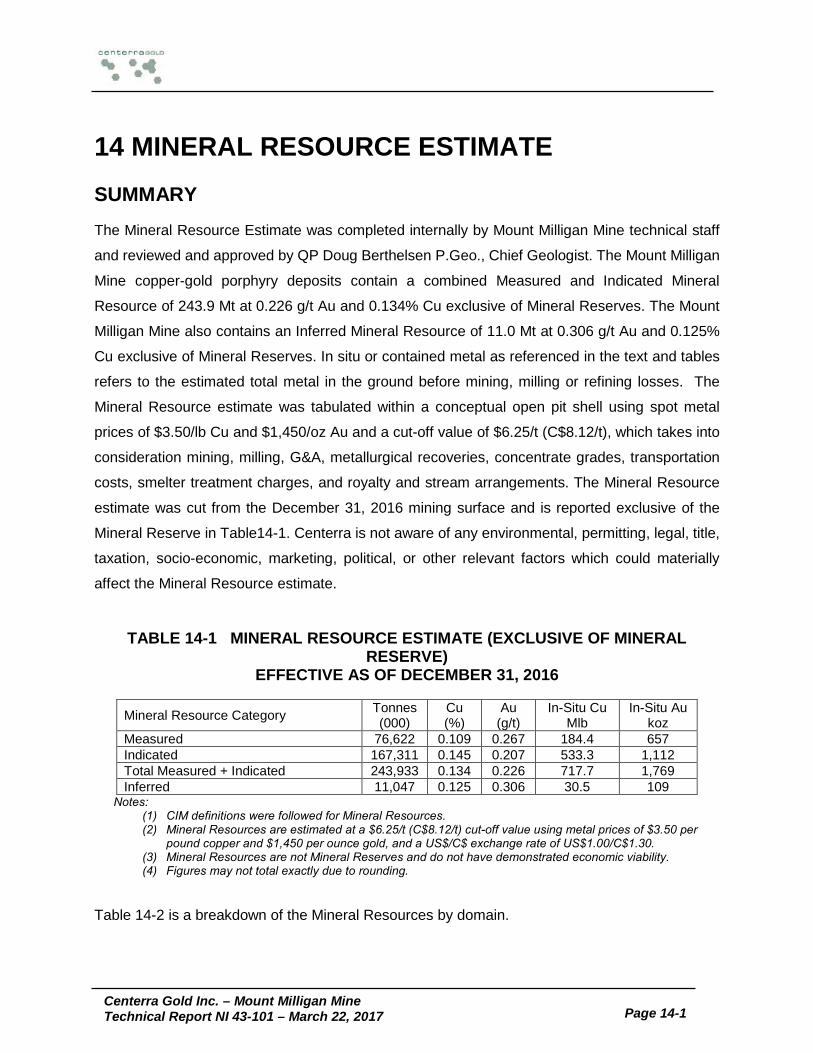
TABLE 1-1 MINERAL RESOURCE ESTIMATE (EXCLUSIVE OF MINERAL RESERVE)
(1) CIM definitions were followed for Mineral Resources. (2) Mineral Resources are estimated at a $6.25/t (C$8.12/t) cut-off value using metal prices of $3.50
per pound copper and $1,450 per ounce gold, and a US$/C$ exchange rate of US$1.00/C$1.30. (3) Mineral Resources are not Mineral Reserves and do not have demonstrated economic viability. (4) Figures may not total exactly due to rounding.
Centerra Gold Inc. – Mount Milligan Mine
Technical Report NI 43-101 – March 22, 2017 Page 1-4
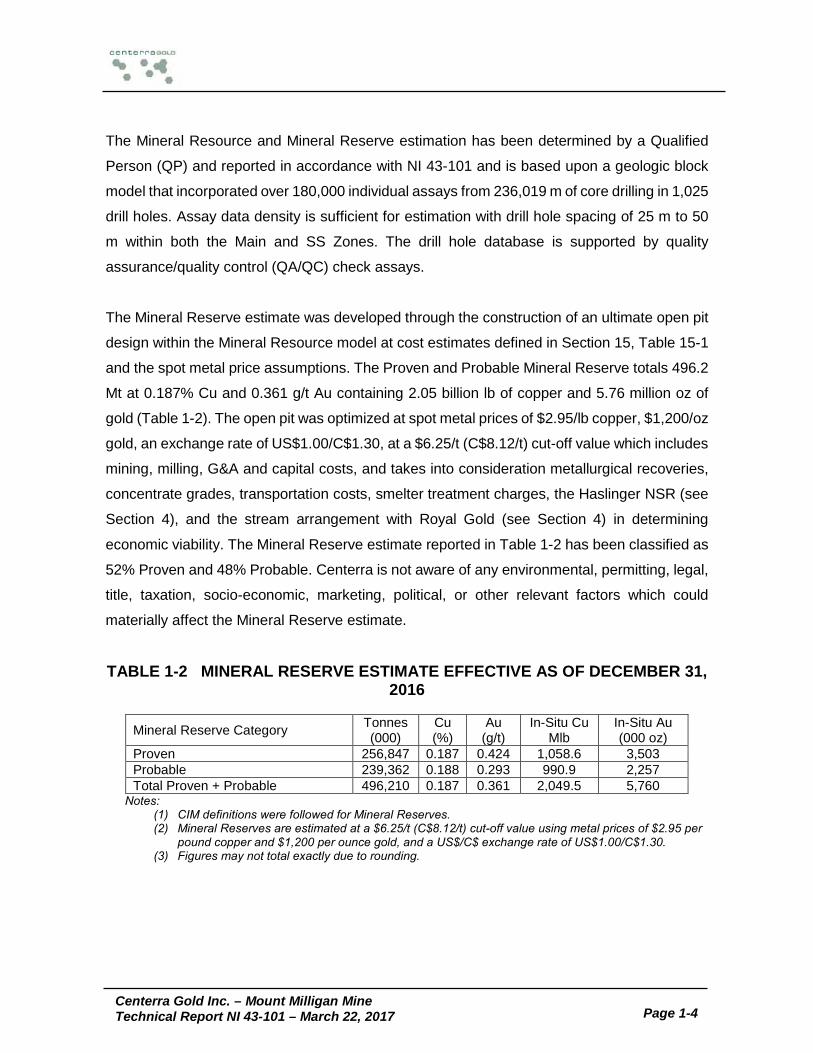
The Mineral Resource and Mineral Reserve estimation has been determined by a Qualified
Person (QP) and reported in accordance with NI 43-101 and is based upon a geologic block
model that incorporated over 180,000 individual assays from 236,019 m of core drilling in 1,025
drill holes. Assay data density is sufficient for estimation with drill hole spacing of 25 m to 50
m within both the Main and SS Zones. The drill hole database is supported by quality
assurance/quality control (QA/QC) check assays.
The Mineral Reserve estimate was developed through the construction of an ultimate open pit
design within the Mineral Resource model at cost estimates defined in Section 15, Table 15-1
and the spot metal price assumptions. The Proven and Probable Mineral Reserve totals 496.2
Mt at 0.187% Cu and 0.361 g/t Au containing 2.05 billion lb of copper and 5.76 million oz of
gold (Table 1-2). The open pit was optimized at spot metal prices of $2.95/lb copper, $1,200/oz
gold, an exchange rate of US$1.00/C$1.30, at a $6.25/t (C$8.12/t) cut-off value which includes
mining, milling, G&A and capital costs, and takes into consideration metallurgical recoveries,
concentrate grades, transportation costs, smelter treatment charges, the Haslinger NSR (see
Section 4), and the stream arrangement with Royal Gold (see Section 4) in determining
economic viability. The Mineral Reserve estimate reported in Table 1-2 has been classified as
52% Proven and 48% Probable. Centerra is not aware of any environmental, permitting, legal,
title, taxation, socio-economic, marketing, political, or other relevant factors which could
materially affect the Mineral Reserve estimate.
TABLE 1-2 MINERAL RESERVE ESTIMATE EFFECTIVE AS OF DECEMBER 31, 2016
Notes: (1) CIM definitions were followed for Mineral Reserves. (2) Mineral Reserves are estimated at a $6.25/t (C$8.12/t) cut-off value using metal prices of $2.95 per
pound copper and $1,200 per ounce gold, and a US$/C$ exchange rate of US$1.00/C$1.30. (3) Figures may not total exactly due to rounding.
Centerra Gold Inc. – Mount Milligan Mine
Technical Report NI 43-101 – March 22, 2017 Page 1-5
METALLURGY Test work on the Mount Milligan project underwent substantial work from 1988 to 2006.
Subsequently, a comprehensive metallurgical test work program was conducted in 2008 to
develop the basis of plant design and the recovery models used in technical reports prior to
production and during initial production. The plant has now entered commercial production and
has encountered throughput and recovery issues. With new information available from plant
test work and the plant limitations becoming better understood, the basis of previous
performance models has been re-visited. Some of the original assumptions have been re-
assessed and issues such as cleaner capacity have been addressed to define new
performance models. These models are still reliant on the 2006 drilling and subsequent test
work programs performed on the deposit, however, they have now being calibrated to the
current performance to produce a current production model. In addition, the long term Life of
Mine (LOM) performance model has been defined together with the capital expenditures
required to accomplish it.
The modified performance equations provide the relationship between mill feed grade,
recovery and concentrate grade and to calculate the average metallurgical parameters over
the coming 22 years of mine life:
• copper recovery – 78.7%
• gold recovery – 67.6%
MINING OPERATIONS The large scale open pit mining for the Mount Milligan Mine will provide mill feed at a nominal
rate of 62,500 t/d (22.8 million tonnes per year (Mt/a)) with the completion of the secondary
crushing circuit. Annual mine production of ore and waste will peak at 49.3 Mt/a with a LOM
stripping ratio of 0.77 tonnes waste to 1 tonne ore.
Over the approximate 22 year remaining mine life, a total of 496.2 Mt of ore grading 0.19% Cu
and 0.36 g/t Au will be milled, yielding an average LOM recovery of 78.7% Cu and 67.6% Au.
Overall, metal payable product will total 1.545 billion lb of copper and 3.854 million oz of gold.
The production schedule, summarized in Table 1-3, was developed through multiple mining
iterations to generate the optimum mining plan.
Centerra Gold Inc. – Mount Milligan Mine
Technical Report NI 43-101 – March 22, 2017 Page 1-6
Key design factors in the mine operations plan include:
• maintain higher grade mineralization in the MBX subzone in the early years
• maintain a smooth waste/ore ratio with required tailings storage facility (TSF)
construction materials
• develop an ore blending strategy while selectively mining from the Main Zone and SS
pits to smooth delivery of copper and gold head grades to achieve the required
concentrate grades
• provide potential waste rock storage in the mined out sections of the Main Zone pit for
waste generated from the WBX and SS mining phases
The mining operations equipment fleet comprises two 311 mm electric blast hole drills, one
203 mm diesel blast hole drill, two 41 m3 electric cable shovels, two 19 m3 front end loaders,
thirteen 217 t trucks and two 190 t trucks. These major units are supplemented with a back-up
equipment fleet of graders, track and rubber-tired dozers, backhoes, and water trucks. A 15 m
bench height has been selected for mining both ore and waste.
TABLE 1-3 AVERAGE ANNUAL TONNAGE, GRADE, RECOVERIES, AND PAYABLE METAL PRODUCTION
MINERAL PROCESSING The current process plant utilizes conventional primary crushing, secondary crushing to assist
the SAG mill, ball mill grinding, rougher and cleaner flotation to produce a marketable gold-
Average Concentrate Production
Average Payable Cu
Average Payable Au
Cu Au Cu Au Cu Cu Au(%) (g/t) (%) (%) ('000 t) (MM lbs) ('000 oz)
smelter treatment charges, and royalty and streaming arrangements in determining
economic viability.
MINING AND MINERAL RESERVES
• The Mineral Reserve estimate has been prepared utilizing acceptable estimation
methodologies and the classification of Proven and Probable Mineral Reserves
conform to CIM definitions and NI 43-101.
• The Mineral Reserve estimate was developed through the construction of an ultimate
open pit design within the Mineral Resource model at cost estimates defined in Section
15, Table 15-1 and the reserve spot metal price assumptions of $2.95/lb copper and
$1,200/oz gold.
• The Proven and Probable Mineral Reserve totals 496.2 Mt at 0.187% Cu and 0.361 g/t
Au containing 2.05 billion lb of copper and 5.76 million oz of gold.
• The Mineral Reserve estimate takes into consideration metallurgical recoveries,
concentrate grades, transportation costs, smelter treatment charges, and royalty and
streaming arrangements in determining economic viability.
Centerra Gold Inc. – Mount Milligan Mine
Technical Report NI 43-101 – March 22, 2017 Page 1-12
• The Mineral Reserve estimate is classified as 51.8% Proven and 48.2% Probable.
• The methodology used for mine planning, ore control, pit limit determination, production
sequence and scheduling, and estimation of equipment/manpower requirements is in
line industry practice. MINERAL PROCESSING
• The metallurgical test work and 2017 recovery models meet industry standards.
• New performance models have been produced to predict expected performance based
on a re-evaluation of historical information and an adjustment to the model based on
current operating information. This performance model is used in years 2017 to 2019
in the new mine model but undergoes improvement through capital expenditure to a
second model as detailed in the metallurgy section.
• In addition to the secondary crushing of the SAG feed material, it will be necessary to
modify the secondary grinding, primary and cleaner flotation areas to achieve LOM
performance models.
• There is a risk in achieving the LOM performance model due to the tight time frame in
accomplishing the required plant modifications. In addition there is a further risk that
these improvements may not provide the desired outcome.
ECONOMIC ANALYSIS
• The total net cash flow discounted at 5% amounts to $1,157 million dollars after
accounting for all operating costs, capital expenditures related to the open pit operation,
the royalty and streaming arrangements, and taxes payable to the provincial and
federal governments.
• Due to the long life of the Mount Milligan Mine, the LOM NPV5% is most sensitive to a
change in discount rate. After discount rate, a change in operating cost assumptions
has the highest effect on NPV.
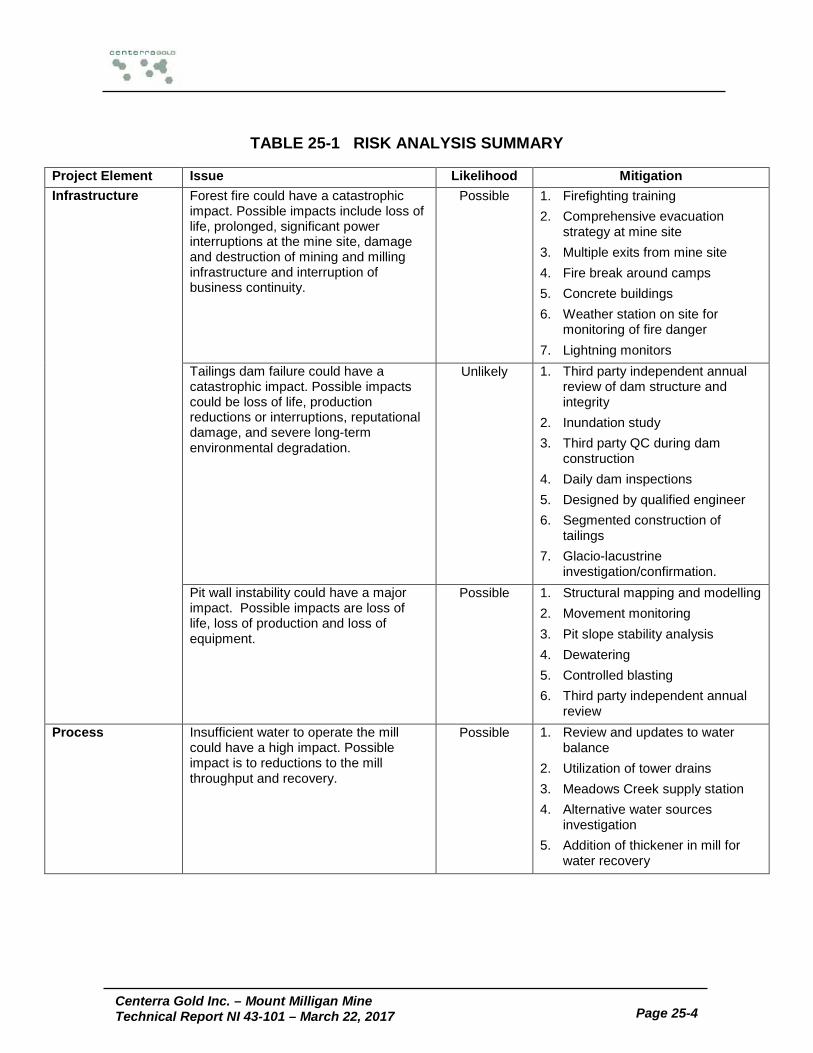
RISKS AND MITIGATION
• Centerra has carried out a risk process which has identified two “extreme severity”
threats and five “high severity” threats where risk mitigation plans were considered for
this Technical Report.
Centerra Gold Inc. – Mount Milligan Mine
Technical Report NI 43-101 – March 22, 2017 Page 1-13
RECOMMENDATIONS In order to achieve the current performance model and to transition to the LOM performance
model, it is recommended that
• the mill continue its program of integrating the new secondary crushing circuit into the
comminution circuit to increase the throughput and efficiency of the SAG mill
• that the mill conduct a test program and study to determine the measures and capital
required to improve the following areas;
o secondary grinding and cyclone classification
o cleaner flotation circuit capacity and performance
o primary flotation circuit capacity and performance
o mill circuit water quality and temperature
• geometallurgical test work be continued to define what opportunities exist to deliver the
ore, or ore blend, most responsive to the current plant setup. This test work would use
Geofloat samples and geometallurgical analysis.
The integration program is covered by the operations budget while approximately $2.1 million
should be allocated for test and study work for the measures and capital improvement. The
geometallurgical program, which is partially covered by the operational budget, together with
$0.23 million (C$0.3 million) for outside consultants, could play a significant role in optimizing
mill throughput and recovery by better defining ore types and characteristics.
Historical interpretation of geology, alteration and structure are currently being used in the
2017 Geology Block Model, however, potential improvements and updates to these models,
in conjunction with the Mt. Milligan Geometallurgical Program, are currently being investigated
by Centerra staff.
Develop a program of geotechnical investigations to assess the potential impacts of structural
features and groundwater flows and pressures on highwall stability.
Continue with regular monitoring programs and annual third party inspections of the TSF and
downstream areas to ensure continued long term stability of the facility.
Centerra Gold Inc. – Mount Milligan Mine
Technical Report NI 43-101 – March 22, 2017 Page 2-1
2 INTRODUCTION This Technical Report, which was prepared by and for Centerra, summarizes the current
operations and the Mineral Reserves and Mineral Resources for the Mount Milligan Mine
located between Fort St James and Mackenzie, British Columbia, Canada.
Centerra acquired its 100% interest in the Mount Milligan Mine on October 20, 2016 when it
acquired (through a subsidiary) TCM (the Acquisition). Prior to this Acquisition, TCM held the
Property through its wholly-owned subsidiary Terrane, which it acquired in 2010. As part of the
Acquisition, TCM and Terrane amalgamated. The Project was constructed by TCM prior to the
Acquisition, and commenced commercial production in February 2014.
When used in this Technical Report, “TCM” means the company existing prior to the
Acquisition, unless otherwise noted.
Centerra, a diversified mining company organized under the laws of Canada, is engaged in
the acquisition, exploration, development, and operation of mineral properties. Centerra’s
shares are listed on the Toronto Stock Exchange under the trading symbol “CG”.
Items of significant change from the 2015 Technical Report prepared for TCM include copper
and gold price assumptions, recovery estimates, operating costs and geologic model updates,
which resulted in an updated Mineral Resource and Mineral Reserve estimate and a new LOM
design and schedule. An updated stream arrangement with Royal Gold is also incorporated
into this Technical Report, which impacts on the Project’s expected cash flows over the LOM.
All dollar figures in this Technical Report refer to US dollars, unless otherwise noted.
SOURCES OF INFORMATION This Technical Report is based on published material and data, professional opinions, and
unpublished materials available to Centerra or prepared by its employees. In addition, certain
information used to support this Technical Report was derived from previous technical reports
on the Project and from reports and documents listed in the References section. Other sources
Centerra Gold Inc. – Mount Milligan Mine
Technical Report NI 43-101 – March 22, 2017 Page 2-2
of data include geologic and block model reports, drill hole assay data, the block model, and
mine plans, which were prepared by employees of Centerra.
This Technical Report has been prepared in compliance with NI 43-101 and follows the format
set out in Form 43-101F1 for Technical Reports.
CONTRIBUTING PERSONS AND SITE INSPECTIONS This Technical Report has been prepared by Peter Andrews, P. Eng., Chief Mine Engineer of
Mount Milligan Mine, Doug Berthelsen, P. Geo., Chief Mine Geologist at Mount Milligan Mine,
and Ignacy (Tony) Lipiec, P.Eng., Technical Director, Process with Amec Foster Wheeler
Americas Limited each of whom is a Qualified Person (QP) as defined in NI 43-101 and has
provided a QP certificate.
Peter Andrews (P. Eng.), Chief Mine Engineer, has been employed at the Mount Milligan Mine
site since February 2015 and is responsible for the preparation and/or supervision of the
Mineral Reserve estimate sections of this Technical Report, and other sections not specifically
covered by other QPs. Mr. Andrews has worked in gold, copper, iron ore and coal mining
operations as a mining engineer for a total of 21 years since he earned his Bachelor of Science
degree (BSc) in Mining Engineering from Queen’s University in Kingston, Ontario. Prior to this,
Mr. Andrews was employed for seven years as an exploration geologist (P. Geo) having
obtained a BSc in Geology from Memorial University of Newfoundland. Mr. Andrews is a
Registered Member of the Association of Professional Engineers and Geoscientists of British
Columbia, License Number 24942, and is a Qualified Person as defined under NI 43-101.
Doug Berthelsen (P.Geo.), Chief Mine Geologist has been employed at Mount Milligan Mine
since August 2014, and has been Chief Geologist of Mount Milligan Mine since March 2015.
He is responsible for the geology sections in this Technical Report including the construction
and/or supervision of the Mineral Resource block model. He currently works onsite and
interfaces regularly with management, operations and field inspections. Mr. Berthelsen has 28
years of experience as a geologist in gold, silver and copper exploration and surface and
underground mining. He graduated from the University of British Columbia with a BSc in
Geology in 1985. He is a Registered Member of the Association of Professional Engineers and
Geoscientists of British Columbia, License Number 31777, and is a Qualified Person as
defined under NI 43-101.
Centerra Gold Inc. – Mount Milligan Mine
Technical Report NI 43-101 – March 22, 2017 Page 2-3
Ignacy Lipiec, (P.Eng.), has been employed as a senior and principal level metallurgical
engineer at Amec Foster Wheeler since 2004. He is responsible for the metallurgy and process
sections of this Technical Report including the validation of the recovery and concentrate
models provided to Geology for inclusion into the Mineral Resource block model. He has 32
years of experience as a metallurgist in gold, silver and copper processing operations and
design. He has visited site in January 2015 and January 2017. He graduated from the
University of British Columbia with a BASc in Mining and Mineral Process Engineering in 1985.
He is a Registered Member of the Association of Professional Engineers and Geoscientists of
British Columbia, License Number 23976, and is a Qualified Person as defined under NI 43-
101.
Certain other Centerra employees compiled certain sections of this Technical Report under
the supervision of Mr. Andrews, Mr. Berthelsen, and Mr. Lipiec. These Centerra employees
are experienced technical professionals in their respective areas of expertise. Additional
support has been provided by Mount Milligan Mine staff, the Toronto and Denver based staff
of Centerra, including with respect to environmental and permitting matters, land and title
matters, capital and operating costs, and financial analysis.
Standard professional procedures have been followed in preparing the contents of this
Technical Report. Data used in this Technical Report have been verified, where possible, and
there is no reason to believe that the data was not collected in a professional manner.
Centerra Gold Inc. – Mount Milligan Mine
Technical Report NI 43-101 – March 22, 2017 Page 2-4
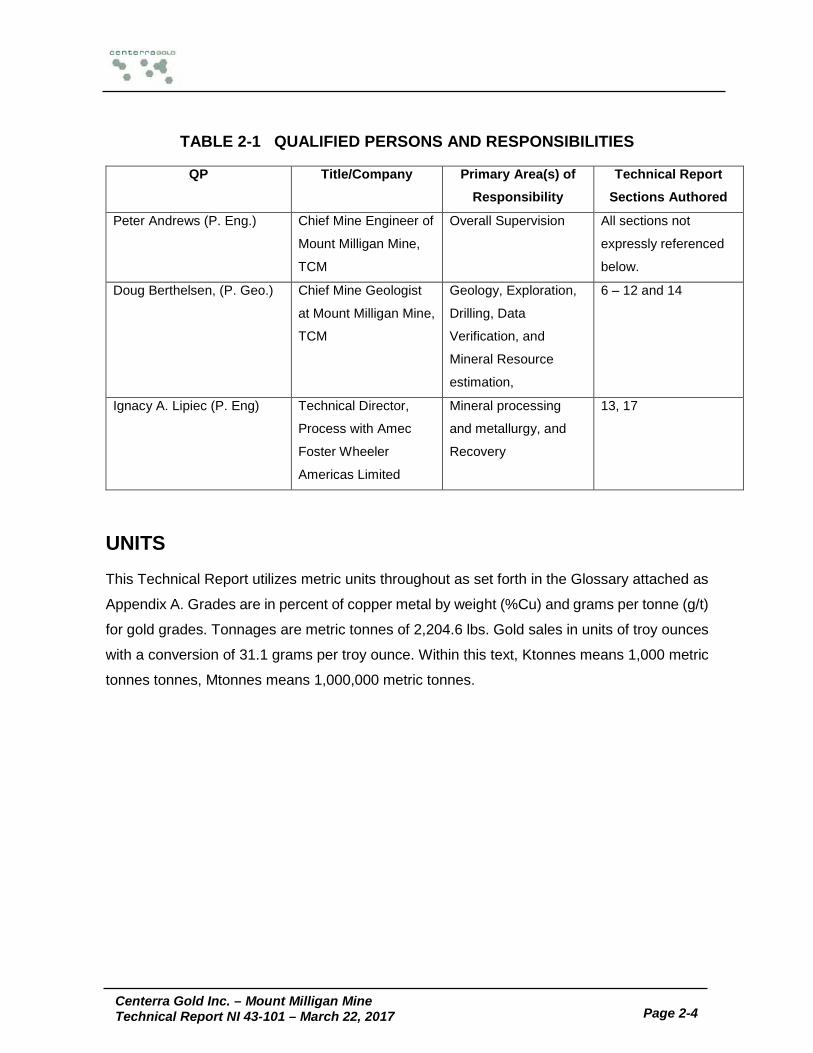
TABLE 2-1 QUALIFIED PERSONS AND RESPONSIBILITIES
QP Title/Company Primary Area(s) of Responsibility
Technical Report Sections Authored
Peter Andrews (P. Eng.) Chief Mine Engineer of
Mount Milligan Mine,
TCM
Overall Supervision All sections not
expressly referenced
below.
Doug Berthelsen, (P. Geo.) Chief Mine Geologist
at Mount Milligan Mine,
TCM
Geology, Exploration,
Drilling, Data
Verification, and
Mineral Resource
estimation,
6 – 12 and 14
Ignacy A. Lipiec (P. Eng) Technical Director,
Process with Amec
Foster Wheeler
Americas Limited
Mineral processing
and metallurgy, and
Recovery
13, 17
UNITS This Technical Report utilizes metric units throughout as set forth in the Glossary attached as
Appendix A. Grades are in percent of copper metal by weight (%Cu) and grams per tonne (g/t)
for gold grades. Tonnages are metric tonnes of 2,204.6 lbs. Gold sales in units of troy ounces
with a conversion of 31.1 grams per troy ounce. Within this text, Ktonnes means 1,000 metric
tonnes tonnes, Mtonnes means 1,000,000 metric tonnes.
Centerra Gold Inc. – Mount Milligan Mine
Technical Report NI 43-101 – March 22, 2017 Page 3-1
3 RELIANCE ON OTHER EXPERTS This section is not relevant to the Technical Report as expert opinion was sourced from
Centerra experts in the appropriate fields as required.
Centerra Gold Inc. – Mount Milligan Mine
Technical Report NI 43-101 – March 22, 2017 Page 4-1
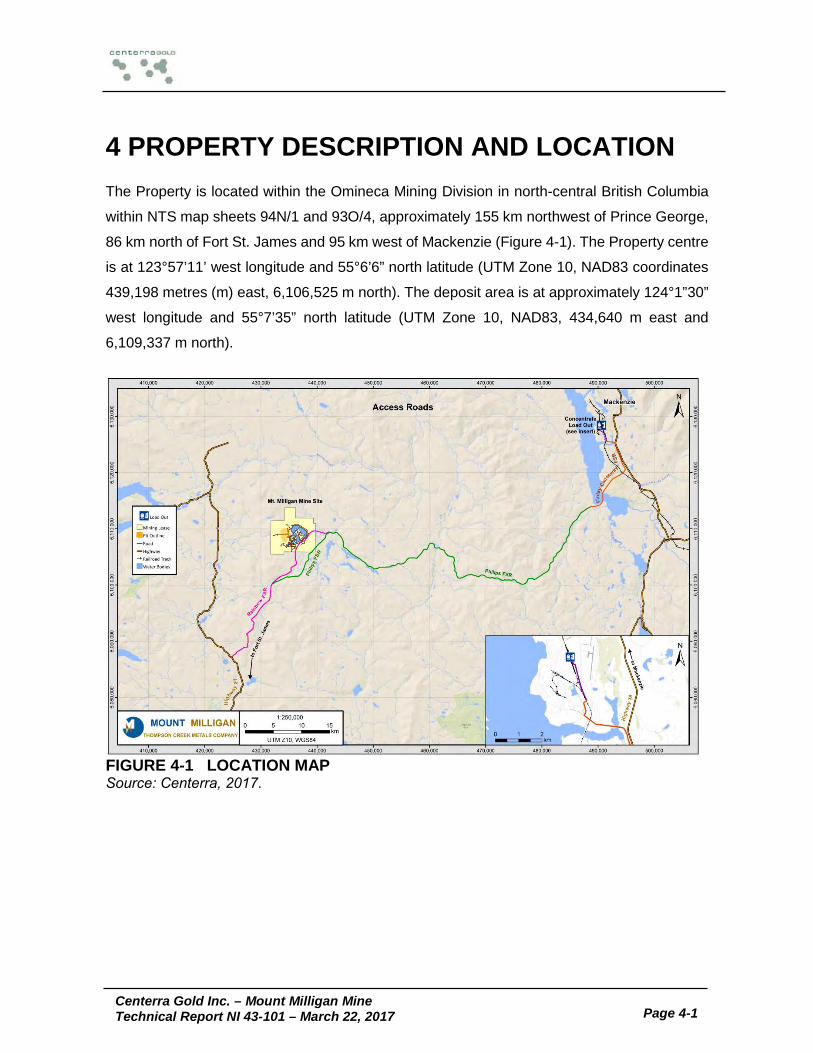
4 PROPERTY DESCRIPTION AND LOCATION The Property is located within the Omineca Mining Division in north-central British Columbia
within NTS map sheets 94N/1 and 93O/4, approximately 155 km northwest of Prince George,
86 km north of Fort St. James and 95 km west of Mackenzie (Figure 4-1). The Property centre
is at 123°57’11’ west longitude and 55°6’6” north latitude (UTM Zone 10, NAD83 coordinates
439,198 metres (m) east, 6,106,525 m north). The deposit area is at approximately 124°1”30”
west longitude and 55°7’35” north latitude (UTM Zone 10, NAD83, 434,640 m east and
6,109,337 m north).
FIGURE 4-1 LOCATION MAP Source: Centerra, 2017.
Centerra Gold Inc. – Mount Milligan Mine
Technical Report NI 43-101 – March 22, 2017 Page 4-2
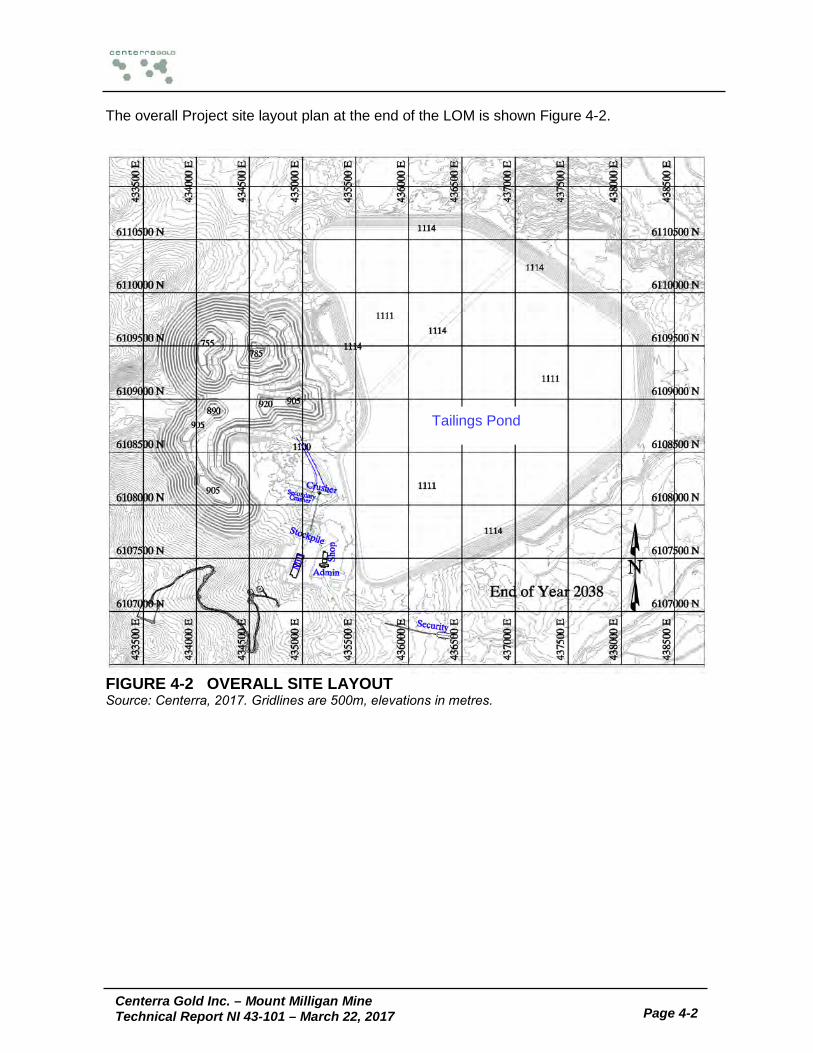
The overall Project site layout plan at the end of the LOM is shown Figure 4-2.
FIGURE 4-2 OVERALL SITE LAYOUT Source: Centerra, 2017. Gridlines are 500m, elevations in metres.
Tailings Pond
Centerra Gold Inc. – Mount Milligan Mine
Technical Report NI 43-101 – March 22, 2017 Page 4-3
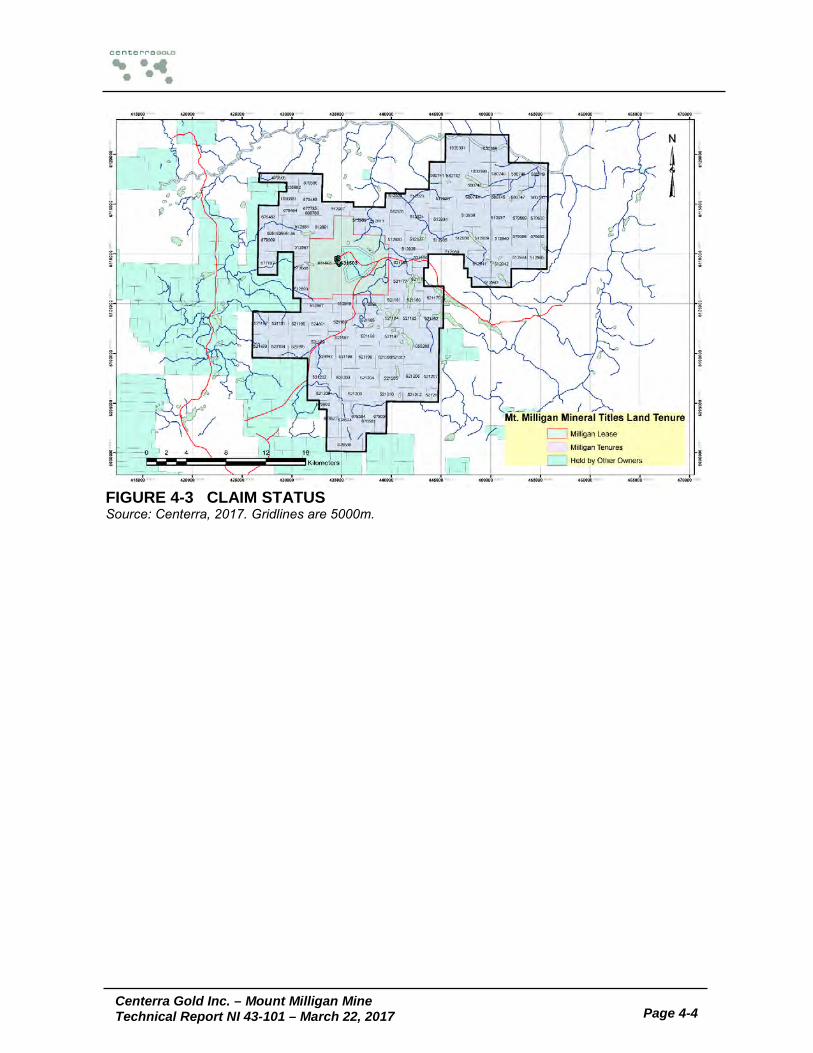
CLAIM STATUS The Property includes 109 claims and one mining lease with a combined area of 51,078.3
hectares (ha) as shown in Figure 4-3. Claim status was searched on the British Columbia
Energy and Mines, Mineral Titles Online BC (MTO) website.
Older claims have been converted from legacy claims to cell claims under the provisions of
the Mineral Tenure Act Regulations (OIC 1161, December 2, 2004). The single mining lease
was issued to Terrane on September 9, 2009, for a 20-year period and requires lease
payments of $79,046 (C$102,760) due annually on September 9.
Mining claims must be renewed on a yearly basis by either filing a statement of exploration
and development work or providing cash payment in lieu of the work. Changes to the Mineral
Tenure Act Regulation effective July 1, 2012 treated all claims as if they were in their first
anniversary year for assessment purposes as of the date of implementation. Maintenance of
the mining claims by exploration and development work requires an expenditure of $3.85/ha
(C$5/ha) during the first and second years, $7.69/ha (C$10/ha) for years three and four,
$11.54/ha (C$15/ha) for years five and six and $15.38/ha (C$20/ha) for each subsequent year.
The cash payment made in lieu of work requires annual payments that are double the work
amounts. Claims must be converted to a lease in order to produce commercial quantities of
ore.
As of January 12, 2005, all administrative functions related to mineral claims in British
Columbia are accomplished online through MTO. MTO now uses one single map of British
Columbia and divides the province into 8,000,000 “cells”. Cells may be of varying size
depending on their latitude, and each cell has a unique identification number. Claims are
acquired by selecting cells on the MTO system.
Centerra has legal access to all of the mining claims and the mining lease.
Centerra Gold Inc. – Mount Milligan Mine
Technical Report NI 43-101 – March 22, 2017 Page 4-4
FIGURE 4-3 CLAIM STATUS Source: Centerra, 2017. Gridlines are 5000m.
Centerra Gold Inc. – Mount Milligan Mine
Technical Report NI 43-101 – March 22, 2017 Page 4-5
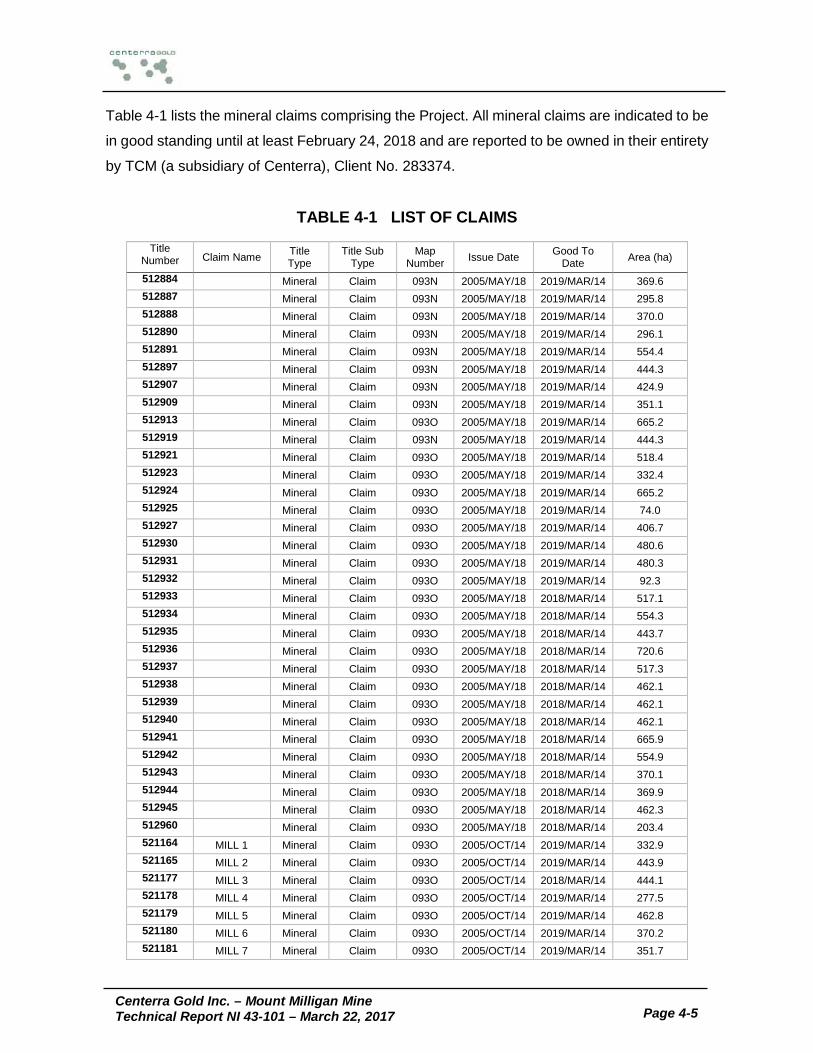
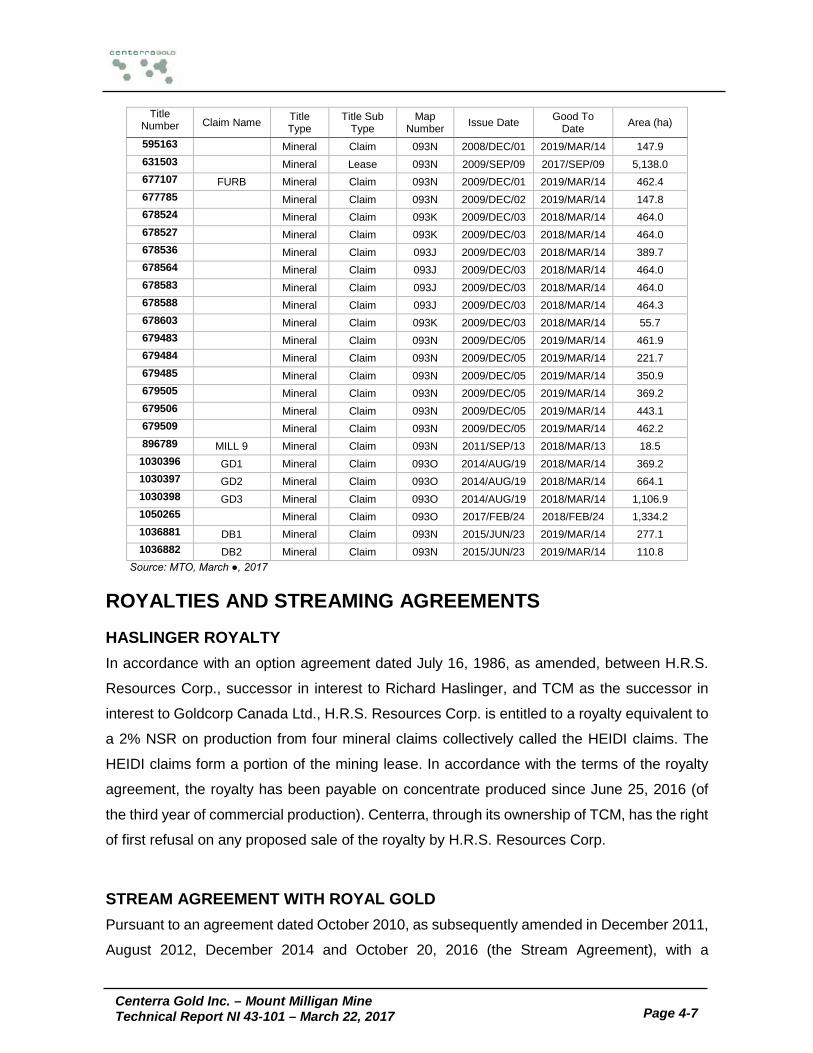
Table 4-1 lists the mineral claims comprising the Project. All mineral claims are indicated to be
in good standing until at least February 24, 2018 and are reported to be owned in their entirety
by TCM (a subsidiary of Centerra), Client No. 283374.
TABLE 4-1 LIST OF CLAIMS
Title Number Claim Name Title
Type Title Sub
Type Map
Number Issue Date Good To Date Area (ha)
512884 Mineral Claim 093N 2005/MAY/18 2019/MAR/14 369.6 512887 Mineral Claim 093N 2005/MAY/18 2019/MAR/14 295.8 512888 Mineral Claim 093N 2005/MAY/18 2019/MAR/14 370.0 512890 Mineral Claim 093N 2005/MAY/18 2019/MAR/14 296.1 512891 Mineral Claim 093N 2005/MAY/18 2019/MAR/14 554.4 512897 Mineral Claim 093N 2005/MAY/18 2019/MAR/14 444.3 512907 Mineral Claim 093N 2005/MAY/18 2019/MAR/14 424.9 512909 Mineral Claim 093N 2005/MAY/18 2019/MAR/14 351.1 512913 Mineral Claim 093O 2005/MAY/18 2019/MAR/14 665.2 512919 Mineral Claim 093N 2005/MAY/18 2019/MAR/14 444.3 512921 Mineral Claim 093O 2005/MAY/18 2019/MAR/14 518.4 512923 Mineral Claim 093O 2005/MAY/18 2019/MAR/14 332.4 512924 Mineral Claim 093O 2005/MAY/18 2019/MAR/14 665.2 512925 Mineral Claim 093O 2005/MAY/18 2019/MAR/14 74.0 512927 Mineral Claim 093O 2005/MAY/18 2019/MAR/14 406.7 512930 Mineral Claim 093O 2005/MAY/18 2019/MAR/14 480.6 512931 Mineral Claim 093O 2005/MAY/18 2019/MAR/14 480.3 512932 Mineral Claim 093O 2005/MAY/18 2019/MAR/14 92.3 512933 Mineral Claim 093O 2005/MAY/18 2018/MAR/14 517.1 512934 Mineral Claim 093O 2005/MAY/18 2018/MAR/14 554.3 512935 Mineral Claim 093O 2005/MAY/18 2018/MAR/14 443.7 512936 Mineral Claim 093O 2005/MAY/18 2018/MAR/14 720.6 512937 Mineral Claim 093O 2005/MAY/18 2018/MAR/14 517.3 512938 Mineral Claim 093O 2005/MAY/18 2018/MAR/14 462.1 512939 Mineral Claim 093O 2005/MAY/18 2018/MAR/14 462.1 512940 Mineral Claim 093O 2005/MAY/18 2018/MAR/14 462.1 512941 Mineral Claim 093O 2005/MAY/18 2018/MAR/14 665.9 512942 Mineral Claim 093O 2005/MAY/18 2018/MAR/14 554.9 512943 Mineral Claim 093O 2005/MAY/18 2018/MAR/14 370.1 512944 Mineral Claim 093O 2005/MAY/18 2018/MAR/14 369.9 512945 Mineral Claim 093O 2005/MAY/18 2018/MAR/14 462.3 512960 Mineral Claim 093O 2005/MAY/18 2018/MAR/14 203.4 521164 MILL 1 Mineral Claim 093O 2005/OCT/14 2019/MAR/14 332.9 521165 MILL 2 Mineral Claim 093O 2005/OCT/14 2019/MAR/14 443.9 521177 MILL 3 Mineral Claim 093O 2005/OCT/14 2018/MAR/14 444.1 521178 MILL 4 Mineral Claim 093O 2005/OCT/14 2019/MAR/14 277.5 521179 MILL 5 Mineral Claim 093O 2005/OCT/14 2019/MAR/14 462.8 521180 MILL 6 Mineral Claim 093O 2005/OCT/14 2019/MAR/14 370.2 521181 MILL 7 Mineral Claim 093O 2005/OCT/14 2019/MAR/14 351.7
Centerra Gold Inc. – Mount Milligan Mine
Technical Report NI 43-101 – March 22, 2017 Page 4-6
Title Number Claim Name Title
Type Title Sub
Type Map
Number Issue Date Good To Date Area (ha)
521182 MILL 8 Mineral Claim 093O 2005/OCT/14 2019/MAR/14 444.4 521183 MILL 9 Mineral Claim 093O 2005/OCT/14 2019/MAR/14 370.4 521184 MILL10 Mineral Claim 093O 2005/OCT/14 2019/MAR/14 296.3 521185 MILL 11 Mineral Claim 093O 2005/OCT/14 2018/MAR/14 444.5 521186 MILL 12 Mineral Claim 093N 2005/OCT/14 2018/MAR/14 444.5 521187 MILL 13 Mineral Claim 093N 2005/OCT/14 2018/MAR/14 407.6 521189 MILL 14 Mineral Claim 093N 2005/OCT/14 2018/MAR/14 370.6 521190 MILL 15 Mineral Claim 093N 2005/OCT/14 2018/MAR/14 463.0 521191 MILL 16 Mineral Claim 093N 2005/OCT/14 2018/MAR/14 463.0 521192 MILL 17 Mineral Claim 093N 2005/OCT/14 2018/MAR/14 370.4 521193 MILL 18 Mineral Claim 093N 2005/OCT/14 2018/MAR/14 370.6 521194 MILL 19 Mineral Claim 093N 2005/OCT/14 2018/MAR/14 463.3 521195 MILL 20 Mineral Claim 093N 2005/OCT/14 2018/MAR/14 463.3 521196 MILL 21 Mineral Claim 093O 2005/OCT/14 2018/MAR/14 444.6 521197 MILL 22 Mineral Claim 093O 2005/OCT/14 2018/MAR/14 444.6 521198 MILL 23 Mineral Claim 093N 2005/OCT/14 2018/MAR/14 463.4 521199 MILL 24 Mineral Claim 093O 2005/OCT/14 2018/MAR/14 463.4 521200 MILL 25 Mineral Claim 093O 2005/OCT/14 2018/MAR/14 463.4 521201 MILL 26 Mineral Claim 093O 2005/OCT/14 2018/MAR/14 185.4 521202 MILL 27 Mineral Claim 093N 2005/OCT/14 2018/MAR/14 445.0 521203 MILL 28 Mineral Claim 093N 2005/OCT/14 2018/MAR/14 445.0 521204 MILL 29 Mineral Claim 093O 2005/OCT/14 2018/MAR/14 445.0 521205 MILL 30 Mineral Claim 093O 2005/OCT/14 2018/MAR/14 445.0 521206 MILL 31 Mineral Claim 093O 2005/OCT/14 2018/MAR/14 463.6 521207 MILL 32 Mineral Claim 093O 2005/OCT/14 2018/MAR/14 370.9 521208 MILL 33 Mineral Claim 093N 2005/OCT/14 2018/MAR/14 445.2 521209 MILL 34 Mineral Claim 093N 2005/OCT/14 2018/MAR/14 445.2 521210 MILL 35 Mineral Claim 093O 2005/OCT/14 2018/MAR/14 445.2 521212 MILL 36 Mineral Claim 093O 2005/OCT/14 2018/MAR/14 333.9 521213 MILL 37 Mineral Claim 093O 2005/OCT/14 2018/MAR/14 167.0 524891 ARM Mineral Claim 093N 2006/JAN/08 2019/MAR/14 463.0 524892 STRONG Mineral Claim 093N 2006/JAN/08 2019/MAR/14 463.4 579598
Mineral Claim 093O 2008/MAR/28 2018/MAR/14 295.8
579599
Mineral Claim 093O 2008/MAR/28 2018/MAR/14 295.6 579600
Mineral Claim 093O 2008/MAR/28 2018/MAR/14 369.7
579602
Mineral Claim 093O 2008/MAR/28 2018/MAR/14 369.5 580741
Mineral Claim 093O 2008/APR/08 2018/MAR/14 443.0
580742
Mineral Claim 093O 2008/APR/08 2018/MAR/14 443.0 580743
Mineral Claim 093O 2008/APR/08 2018/MAR/14 406.1
580744
Mineral Claim 093O 2008/APR/08 2018/MAR/14 461.7 580745
Mineral Claim 093O 2008/APR/08 2018/MAR/14 461.7
580746
Mineral Claim 093O 2008/APR/08 2018/MAR/14 461.5 580747
Mineral Claim 093O 2008/APR/08 2018/MAR/14 461.7
580748
Mineral Claim 093O 2008/APR/08 2018/MAR/14 461.5 580749
Mineral Claim 093O 2008/APR/08 2018/MAR/14 461.5
580750
Mineral Claim 093O 2008/APR/08 2018/MAR/14 461.7 595146
Mineral Claim 093N 2008/DEC/01 2019/MAR/14 443.6
Centerra Gold Inc. – Mount Milligan Mine
Technical Report NI 43-101 – March 22, 2017 Page 4-7
Title Number Claim Name Title
Type Title Sub
Type Map
Number Issue Date Good To Date Area (ha)
595163
Mineral Claim 093N 2008/DEC/01 2019/MAR/14 147.9 631503
Mineral Lease 093N 2009/SEP/09 2017/SEP/09 5,138.0
677107 FURB Mineral Claim 093N 2009/DEC/01 2019/MAR/14 462.4 677785
Mineral Claim 093N 2009/DEC/02 2019/MAR/14 147.8
678524
Mineral Claim 093K 2009/DEC/03 2018/MAR/14 464.0 678527
Mineral Claim 093K 2009/DEC/03 2018/MAR/14 464.0
678536
Mineral Claim 093J 2009/DEC/03 2018/MAR/14 389.7 678564
Mineral Claim 093J 2009/DEC/03 2018/MAR/14 464.0
678583
Mineral Claim 093J 2009/DEC/03 2018/MAR/14 464.0 678588
Mineral Claim 093J 2009/DEC/03 2018/MAR/14 464.3
678603
Mineral Claim 093K 2009/DEC/03 2018/MAR/14 55.7 679483
Mineral Claim 093N 2009/DEC/05 2019/MAR/14 461.9
679484
Mineral Claim 093N 2009/DEC/05 2019/MAR/14 221.7 679485
Mineral Claim 093N 2009/DEC/05 2019/MAR/14 350.9
679505
Mineral Claim 093N 2009/DEC/05 2019/MAR/14 369.2 679506
Mineral Claim 093N 2009/DEC/05 2019/MAR/14 443.1
679509
Mineral Claim 093N 2009/DEC/05 2019/MAR/14 462.2 896789 MILL 9 Mineral Claim 093N 2011/SEP/13 2018/MAR/13 18.5
1030396 GD1 Mineral Claim 093O 2014/AUG/19 2018/MAR/14 369.2 1030397 GD2 Mineral Claim 093O 2014/AUG/19 2018/MAR/14 664.1 1030398 GD3 Mineral Claim 093O 2014/AUG/19 2018/MAR/14 1,106.9 1050265 Mineral Claim 093O 2017/FEB/24 2018/FEB/24 1,334.2 1036881 DB1 Mineral Claim 093N 2015/JUN/23 2019/MAR/14 277.1 1036882 DB2 Mineral Claim 093N 2015/JUN/23 2019/MAR/14 110.8
Source: MTO, March ●, 2017
ROYALTIES AND STREAMING AGREEMENTS HASLINGER ROYALTY In accordance with an option agreement dated July 16, 1986, as amended, between H.R.S.
Resources Corp., successor in interest to Richard Haslinger, and TCM as the successor in
interest to Goldcorp Canada Ltd., H.R.S. Resources Corp. is entitled to a royalty equivalent to
a 2% NSR on production from four mineral claims collectively called the HEIDI claims. The
HEIDI claims form a portion of the mining lease. In accordance with the terms of the royalty
agreement, the royalty has been payable on concentrate produced since June 25, 2016 (of
the third year of commercial production). Centerra, through its ownership of TCM, has the right
of first refusal on any proposed sale of the royalty by H.R.S. Resources Corp.
STREAM AGREEMENT WITH ROYAL GOLD Pursuant to an agreement dated October 2010, as subsequently amended in December 2011,
August 2012, December 2014 and October 20, 2016 (the Stream Agreement), with a
Centerra Gold Inc. – Mount Milligan Mine
Technical Report NI 43-101 – March 22, 2017 Page 4-8
subsidiary of Royal Gold, Inc. (Royal Gold). Centerra has agreed to sell to Royal Gold 35% of
the gold produced and 18.75% of the copper production at the Mount Milligan mine. Royal
Gold will pay $435 per ounce of gold delivered and will pay 15% of the spot price per metric
tonne of copper delivered. When the Stream Agreement was originally entered into by TCM
(prior to the Acquisition by Centerra), TCM received an upfront payment of $781.5 million for
the rights to receive future gold production. As noted above, it was amended by Centerra as
part of the Acquisition to reduce the percentage of gold production allocated to Royal Gold
(from 52.25% to 35%) and to include 18.75% of the copper production from the Mount Milligan
mine.
The Stream Agreement has an initial 50-year term, with automatic successive 10-year renewal
periods.
Centerra sells copper and gold concentrate from Mount Milligan Mine to customers, and then,
per the terms of the Stream Agreement, Centerra purchases gold ounces and copper warrants
in the market for delivery to Royal Gold in an amount based on a portion of the gold and copper
content contained in the copper and gold concentrate sold to customers.
The Stream Agreement covers substantially the entire Property.
The Stream Agreement includes certain restrictions on assignment or transfer of the respective
rights of both parties to the Stream Agreement.
ENVIRONMENTAL LIABILITIES The Project is operated in compliance with all applicable environmental obligations arising from
federal and provincial statutes and regulations that are necessary to the current operation of
its business. The Mount Milligan Mine submitted the five-year revision to its Reclamation Plan
in 2014 and will submit another revision as per permit and regulatory requirements in 2019.
Pursuant to the 2014-2019 revision to the Reclamation Plan, the most recent estimate of the
undiscounted and uninflated cost of reclamation $28.3 million (C$36.8 million). The Mount
Milligan Mine currently has a posted reclamation bond in the amount of $23.1 million (C$30
million).
Centerra Gold Inc. – Mount Milligan Mine
Technical Report NI 43-101 – March 22, 2017 Page 4-9
The Reclamation Plan for the site minimizes and mitigates long-term environmental impacts
resulting from construction and operation of the facility via sound science and contingency
planning. An adaptive management process is utilized whereby new knowledge and
technology is incorporated into successive Management and Reclamation Plans that take into
account operational plan updates. This adaptive management approach will aid in negating or
minimizing activities such as post-closure water treatment.
PERMITS All necessary permitting requirements to operate Mount Milligan Mine have been applied for
and approved by the applicable regulatory agencies. The mine has an operating permit issued
under the BC Mines Act by the Ministry of Energy and Mines (M-236). In addition, there, are
three permits under the provincial Environmental Management Act: an Effluent Permit (PE-
104777), a Refuse Permit (PR-104778) and an Air Permit (PA-104779), all of which were
amended and updated in 2016.
A Road Use Permit and several Special Use Permits were issued by the BC Ministry of Forest
Lands and Natural Resources Operations for various uses of forest lands and roads. The site
also holds a Drinking Water Permit, a Hazardous Waste Storage Permit, an Occupant License
to Cut, Water Act and Water Sustainability Act Licenses, a License of Occupation for the
construction and maintenance of an electric transmission line to site and several approvals for
aerial crossings of the line over streams, and two federally approved Fish Habitat
Compensation Plans issued pursuant to section 35(2) of the Fisheries Act and the Metal Mining
Effluent Regulations. As permits or licenses expire or approach expiration dates, they will be
renewed, reapplied for or allowed to lapse depending on the current and future needs.
The Project was reviewed under both the British Columbia Environmental Assessment Act and
the Canadian Environmental Assessment Act. An Environmental Assessment Application (the
Application) was filed in July 2008. Provincial and federal agencies, First Nations and
stakeholders participated in a harmonized review of the Application. The provincial
Environmental Assessment Certificate was issued in March 2009 and the federal
Environmental Assessment Decision Statement was issued in December 2009. Both the
provincial Environmental Assessment Report and the federal Comprehensive Study Report
Centerra Gold Inc. – Mount Milligan Mine
Technical Report NI 43-101 – March 22, 2017 Page 4-10
concluded that, taking into account the required mitigation measures, the Project is not likely
to cause significant adverse environmental effects. The provincial Environmental Assessment
Certificate was amended in March 2013 to relocate the concentrate rail loadout facility to
Mackenzie and to permit construction of an operations residence on site. A 2016 audit of the
Environmental Assessment Certificate by the Environmental Assessment Office showed no
non-compliances with the commitments. Pursuant to the Certificate, the Project has prepared
and implemented an Environmental, Health and Safety Management System that is compliant
with ISO 14001.
The Project includes a comprehensive water management plan for construction activities and
operational phases. The Project site is designed, operated and managed to prevent all surface
water discharge to the receiving environment during mining operations. Water management
is a significant part of the Reclamation Plan for the Project. The Reclamation Plan employs
proven practices and is not dependent on long-term active water treatment. Under the
Reclamation Plan, all mine components will be decommissioned and reclaimed in accordance
with best industry practices and in compliance with federal and provincial regulations
KNOWN RISKS There are no known risks that may affect access, title or the right or ability to perform work on
the Property.
Centerra Gold Inc. – Mount Milligan Mine
Technical Report NI 43-101 – March 22, 2017 Page 5-1
5 ACCESSIBILITY, CLIMATE, LOCAL RESOURCES, INFRASTRUCTURE AND PHYSIOGRAPHY ACCESS The Mount Milligan Mine is accessible from the east via Mackenzie on the Finlay Philip Forest
Service Road and the North Philip Forest Service Road. There is active logging in the area,
and therefore, the road is maintained in good condition by the various user groups. A western
route, completed in 2005, provides shorter access from Fort St. James via the North
Germansen Road. This route includes 26.7 km of forest service roads, with the balance on
public roads. Road travel to the site of the Mount Milligan Mine is 775 km from Prince Rupert
(population approximately 12,000) and 254 km from Prince George (population approximately
72,000).
CLIMATE The area has short cool summers and cold winters, which are summarized Table 5-1
TABLE 5-1 MOUNT MILLIGAN CLIMATE STATISTICS
Month Jan Feb Mar Apr May Jun Jul Aug Sep Oct Nov Dec Year Average Precipitation (mm) Rainfall 0.3 1.9 4.0 15.9 54.8 58.3 66.3 50.1 67.1 52.4 12.6 1.0 385.0 Snowfall 78.5 64.0 50.5 19.6 6.4 0.8 0.8 0.8 2.8 16.3 68.6 76.0 385.0 Total
Geochemical analysis of silver was routinely conducted in early drilling with 14,896 samples
analyzed from holes 88-61 to 89-212. Samples from later drilling were not analyzed for silver.
Centerra Gold Inc. – Mount Milligan Mine
Technical Report NI 43-101 – March 22, 2017 Page 10-8
As part of the sampling protocol developed by Terrane for the 2006-2007 drill program, every
second sample was analyzed by a multi-element ICP package which included silver. In
addition, all samples from a small drill program completed by Placer Dome in 2004 were
analyzed for silver, bringing the total number of individual silver analyses to 21,219, or roughly
one-quarter of the total available for copper and gold. The majority of these samples are
located within the Main Zone, with fewer located in the SS Zone.
POST-2009 DRILLING (TCM) In 2010-2011, 17 drill holes (10-1003 to 10-1012 and 11-1013 to 11-1019), totalling 10,535 m,
were planned and executed to extend in depth the expression of the DWBX zone towards the
west part of the deposit and north of the King Richard Creek. Good copper and gold intercepts
were defined from the core samples.
In 2011, an additional 10 holes were drilled for metallurgical characterization of the material to
be mined within the Phase 3 pit envelope defined in 2009. These holes were named MET 11-
01 to MET 11-10. A total of 867.5 m were drilled, logged, sampled and assayed.
During June 2013, 20 holes were drilled to define the thickness of the overburden in the east
part of the Main and 66 zones. This core was not assayed.
In 2015 and 2016, 9 holes were drilled to test coincident magnetic, chargeability, and
geochemical anomalies in the Snell Creek and Mitzi Lake area. A total of 3,581.1 m were
drilled and all drill core was logged, photographed, sampled, and assayed. These drill holes
and assay results have not been used in the 2017 Mineral Resource estimation.
SURVEY CONTROL PRE-2006 DRILLING The first grids on the Property were established in 1984 and 1985 when BP Resources
conducted soil geochemical surveys along flagged and tagged lines. The lines were put in
using chain and compass and were not corrected for the local magnetic deviation apparently
caused by the Mount Milligan Intrusive Complex to the northwest.
Centerra Gold Inc. – Mount Milligan Mine
Technical Report NI 43-101 – March 22, 2017 Page 10-9
Between1986 and 1988, Lincoln and United Lincoln established a new grid for geophysical
surveys. These lines were cut and marked by aluminum tags and pickets. The first grid lines
were put in using a compass and were not corrected for the local magnetic deviation. Later
lines were turned off a baseline by a transit and EDM, and were put in using a backsite and
foresite. This grid was used to establish the locations of diamond drill holes 87-1 to 89-120.
In November 1988, McElhanney Surveying established a mine grid whose relative position
was set by labeling a point adjacent to the legal corner post of the PHIL 9 and PHIL 12 mineral
claims as being 10000 N and 10000 E. The northern and eastern boundaries of the PHIL 9
mineral claim were surveyed to tie the mine grid to the legal corner post, and to establish
control points for surveying in drill holes. Drill holes 87-1 to 88-70 were surveyed as time
permitted during the 1988 diamond drill program. The other diamond drill holes were surveyed
as they were drilled.
In early 1989, a legal survey of the PHIL 9 and PHIL 12 mineral claims commenced. This
survey was more accurate than the mine grid survey because it used a different star shot for
control; consequently, the legal survey differs slightly from the mine grid.
The mine grid and legal survey grids are tied at a point called PCON, which is on a small hill
approximately 500 m northwest of the MBX deposit. PCON is tied to a regional Datum through
regional geodetic points on Knob Hill northeast of the Main zone and to a point on the 124th
meridian in the area south of the deposits.
DRILLING 2006–2007 BY TERRANE Planned drill holes were initially spotted by the Terrane field geologist using a hand held GPS,
and markers were placed for drill collar location and field sites.
In April and May of 2007, AllNorth Consultants Ltd. of Prince George was contracted to survey
in the 2006–2007 program drill holes. This survey was conducted using a LEICA RTK GNSS
base station and rover combination. The latest survey was completed on September 11, 2007
and the field data was subsequently post-processed into UTM NAD83 coordinates.
Centerra Gold Inc. – Mount Milligan Mine
Technical Report NI 43-101 – March 22, 2017 Page 10-10
POST-2009 DRILLING In 2010-2011, 17 drill holes (10-1003 to 10-1012 and 11-1013 to 11-1019) were surveyed
using a handheld GPS-RTK (Real Time Kinematic) by the contractor mandated to supervise
the exploration campaign (Equity). The elevation of these collars is based on the 2008 Lidar
survey. Holes were drilled by Apex Drilling.
In 2011, an additional 10 holes (MET 11-01 to MET 11-10) were drilled for the metallurgical
characterization of the material to be mined within the Phase 3 pit envelope defined in 2009.
Collars were surveyed using a handheld GPS-RTK. The elevations are based on the 2008
Lidar survey.
2013 DRILLING (TCM) During June 2013, 20 holes were drilled to define the thickness of the overburden in the east
part of the Main and 66 zones. Collars of vertical holes S13-01 to S13-20 were surveyed by
mine personnel. Elevations are verified on the 2008 Lidar survey.
DOWNHOLE SURVEYS PRE-2006 DRILLING Downhole dips for diamond drill holes 87-1 to 90-758 (pre-Placer Dome) were determined by
acid tests. Downhole azimuths were not determined because it was believed that the results
obtained by conventional downhole survey methods utilizing a compass would have been
meaningless due to the concentrations of magnetite. Nine holes were surveyed with a Sperry
Sun gyro instrument. Data from this study was analyzed and a weighted average azimuth
change of +0.02597 degrees per meter was calculated and applied to all holes with bottom of
hole dips of ≤85°.
The holes drilled under the management of Placer Dome employed a Sperry Sun magnetic
survey instrument, with the location of survey points controlled by magnetic susceptibility
readings of the drill core. Downhole surveys during the 2004 drill program were completed with
an Icefield Instruments inclinometer tool.
Centerra Gold Inc. – Mount Milligan Mine
Technical Report NI 43-101 – March 22, 2017 Page 10-11
2006–2007 DRILLING BY TERRANE Terrane employed a Reflex EZ-Shot magnetic survey instrument to measure azimuth, dip, roll
angle, temperature, and magnetic field strength. Magnetic field strength measurements were
used to identify measurements that may have been influenced by magnetic interference.
2010-2011 DRILLING BY TCM The drill hole collars drilled by Apex Drilling in 2010 and 2011 (10-1003 to 10-1012 and 11-
1013 to 11-1019) were surveyed using an GPS-RTK (Real Time Kinematic) Dip, a hand held
survey GPS coupled with a mobile base.
The 10 vertical drill holes (MET 11-01 to MET 11-10) that were drilled for metallurgical testing
with core being oriented were also surveyed using a handheld GPS-RTK instrument.
2013 DRILLING BY TCM TCM drilled 20 holes to define the thickness of the overburden. Overburden was neither
sampled nor assayed. Core boxes were cross-stacked on pallets and remain at the exploration
camp. Only the collars of the 20 vertical holes were surveyed by mine site surveyors. Hole
deviations were not surveyed.
2015-2016 DRILLING BY TCM Down hole surveys for the five exploration holes completed in 2015 were completed using a
Reflex EZ-Shot downhole tool to take azimuth and dip readings approximately every 50 m,
(Holes 15-1020 to 15-1024).
Down hole surveys for the four holes drilled in 2016 were completed using a Reflex Gyro tool
with azimuth and dip readings taken approximately every 50 m downhole. The Gyro tool was
used in 2016 to reduce anticipated influence from highly magnetic rock.
Centerra Gold Inc. – Mount Milligan Mine
Technical Report NI 43-101 – March 22, 2017 Page 11-1
11 SAMPLE PREPARATION, ANALYSES AND SECURITY PRE-2004 SAMPLES SAMPLE PREPARATION Samples for drill holes 87-1 to 88-60 were prepared (and assayed) by Acme Analytical
Laboratories Ltd. (Acme); drill holes 88-61 to 90-758 were prepared by Mineral Environments
Laboratories Ltd. (Min-En); and drill holes 90-759 to 91-862 were prepared by the Placer Dome
Research Centre (PDRC). All of these laboratories are located in Vancouver, British Columbia.
Samples were prepared as follows:
• Samples were first dried at 95°C.
• Samples were jaw crushed to nominal 6 mm.
• Samples were then roll crushed to nominal 0.3 mm.
• Samples were riffle split until a 300 to 400 g sub-sample was generated.
• Sub-samples were then pulverized to 95% passing a 120 mesh screen.
ASSAYING Gold was assayed by the primary labs (Acme, Min-En, and PDRC) by standard fire assay with
an atomic absorption finish on a 30 g pulp sample. Copper was assayed by digesting 2g of
sample in aqua regia and determining the assay value by atomic absorption spectrometry.
Gold assay batches consisted of 24 samples and copper assay batches of 70 samples. Bondar
Clegg and Chemex, both of Vancouver, British Columbia, performed check assays on selected
sample pulps using the same protocol.
Min-En performed metallic screen fire assays for gold by weight-averaging the entire +120
mesh fraction with the average of two assays of the -120 mesh fraction.
Trace element geochemical analysis of silver by atomic absorption spectroscopy (Min-En) was
routinely conducted on samples from drill holes 88-61 to 89-212.
Centerra Gold Inc. – Mount Milligan Mine
Technical Report NI 43-101 – March 22, 2017 Page 11-2
SECURITY No specific sample security measures were in place during the pre-2004 drill programs.
2004 PLACER DOME SAMPLES SAMPLE PREPARATION Samples for drill holes 04-920 to 04-933 (2004) were prepared (and assayed) by Eco-Tech
Laboratories Ltd. (Eco-Tech) of Kamloops, British Columbia. Samples were prepared as
follows:
• Samples were jaw crushed to nominal 5 mesh.
• Samples were crushed to nominal 10 mesh (equipment used is not documented).
• Samples were then riffle split until a nominal 1 kg sub-sample was generated.
• Sub-samples were then pulverized to nominal 140 mesh.
ASSAYING Gold was assayed by Eco-Tech by standard fire assay with an atomic absorption finish on a
30 g pulp sample. Copper assays utilized aqua regia sample decomposition with analysis by
greater than 7,000 ppm were rerun using atomic absorption spectrometry.
TERRANE 2006–2007 SAMPLES SAMPLE PREPARATION The initial splitting of drill core at the Project site was the only aspect of sample preparation
performed by Terrane employees. The half-core samples were then shipped to ALS Chemex
in North Vancouver, British Columbia for sample preparation and analysis.
Samples were prepared using Method Code PREP-31 as follows:
• Samples were logged into the tracking system and barcodes applied.
• Samples were dried and weighed.
• Samples were fine crushed >70% passing 2 mm.
• Samples were split to 250 g and pulverized to >85% passing 75 µm.
Centerra Gold Inc. – Mount Milligan Mine
Technical Report NI 43-101 – March 22, 2017 Page 11-3
No aspect of the sample preparation was conducted by an officer, director, or associate of
Terrane.
ASSAYING Drill core samples were analyzed for gold content using ALS Chemex’s method Au-AA25. Gold
assays utilized a fire assay fusion sample decomposition of a 30 g pulp with an atomic
absorption spectrometry finish.
Copper analysis was completed using ALS Chemex’s method Cu-OG46. Copper assays
utilized aqua regia sample decomposition with analysis by ICP-AES.
Every second sample was also analyzed for multiple elements using ALS Chemex’s method
ME-MS41. This method analyzed trace levels for 50 elements by aqua regia digestion and a
combination of ICP-AES and inductively coupled plasma – mass spectrometry (ICP-MS).
Silver was analyzed as part of this multi-element package.
In addition to an internal laboratory quality control program utilized by ALS Chemex, Terrane
maintained an additional quality assurance and quality control program through the systematic
use of standards, blanks, and duplicates. For every 20 samples, one standard and one blank
were inserted into the sample stream by core sampling personnel at the Project site. Two
different copper-gold standards were purchased from CDN Resource Laboratories Ltd. in
Delta, British Columbia. Standards were alternated for each batch of 20 samples. In addition,
for every 20th sample, the sample prep laboratory created a duplicate pulp for a comparative
analysis.
ALS Chemex laboratories in North America are registered to ISO 9001:2000 for the provision
of assay and geochemical analytical services by QMI Quality Registrars. In addition, ALS
Chemex’s main North American laboratory in North Vancouver, British Columbia is accredited
by the Standards Council of Canada (SCC) for specific tests listed in the Scope of Accreditation
No. 579, which is available at http://palcan.scc.ca/specs/pdf/677_e.pdf. This accreditation is
based on international standards (ISO 17025) and involves extensive site audits and ongoing
performance evaluations. Assay methods used by Terrane (Au-AA25, Cu-OG46, and ME-
MS41) are listed on this accreditation.
Centerra Gold Inc. – Mount Milligan Mine
Technical Report NI 43-101 – March 22, 2017 Page 11-4
SECURITY Samples were sealed in large rice sacks and stored in the core sampling shed in order to
improve the security of the samples while at the Project site, and also to ensure the validity
and integrity of the samples taken. Twice weekly, the sacks were shipped from the Project site
directly to ALS Chemex’s prep laboratory via Russell Transfer, a bonded independent
expeditor based in Fort St. James, British Columbia.
TCM 2010 - 2016 SAMPLES TCM has continued the field-based quality control program for the 2010-2016 drill programs at
Mount Milligan that was initiated during the 2004 drill program. This program consists of the
insertion of standard reference material, duplicates and blanks into the sample stream to
monitor precision, accuracy and contamination of the sampling and analytical process. Results
of these analyses have been continuously and independently monitored, with a ‘failure table’
documenting the quality control samples that exceed acceptable limits and tracking the
corrective measures taken. Where necessary, analytical batches were re-assayed to achieve
final analyses that met industry standards of quality.
Samples from the 2010 drill program were sent to the ALS sample preparation facility in
Terrace BC for sample preparation. Splits of the pulps were shipped to the ALS laboratory in
Vancouver for analyses. The program continued with the analytical protocol adopted during
2006-2007, with all samples receiving an ICP-AES copper assays following an aqua regia
digestion and gold by fire assay with atomic absorption finish.
Accuracy was monitored through the insertion of standard reference materials at a rate of one
standard for every 20 samples submitted. There were a number of quality control failures for
both copper and gold. All failures were documented in a 'failure table' and a number of the
relevant batches of samples were re-assayed.
Precision was measured through duplicate samples taken at various stages of sample size
reduction, from quarter core field duplicates to preparation duplicates after coarse crushing to
pulp duplicates taken routinely as part of the ALS internal quality control.
Centerra Gold Inc. – Mount Milligan Mine
Technical Report NI 43-101 – March 22, 2017 Page 11-5
Coarse barren limestone or quartzite was routinely added to each batch to monitor possible
contamination during the sample preparation stage. No significant contamination was
indicated during the drill program.
In addition to the quality control samples submitted to the primary laboratory, approximately
5% of sample pulps diamond core holes have been submitted to Acme Labs in Vancouver as
an independent check against analytical bias and accuracy.
Through continuous monitoring of the quality control results, significant issues effecting the
results were identified and resolved, and it was concluded that the quality control and check
assays completed confirm that the 2010-2011 Mt. Milligan assay data are accurate, precise
and free of contamination to industry standards and is of sufficient quality to be used in a
resource estimation.
The results of the QA/QC program for the 2015 and 2016 drill program indicate that Cu and
Mo analyses are accurate, precise and free of contamination. Gold assays are also
uncontaminated but significantly less accurate and precise. The low accuracy in the gold
values can be attributed to the imprecision of the ICP method used in analysis, which is known
to be less accurate and precise than fire assay. The analytical flow sheet called for fire assay
of samples returning >0.2 g/t Au by ICP but the 2015 program returned no samples exceeding
that grade, with the highest value running 0.154 g/t Au. Regardless, the QAQC analysis shows
that the data is sufficiently accurate and precise for the exploratory nature of the 2015 and
2016 drilling programs.
PRODUCTION BLASTHOLE SAMPLES Sample Delivery, Intake and Preparation
• Blast hole samples are collected once or twice a day by the Ore Control
Geologist/Technician and delivered to the on-site assay laboratory for analysis.
• Samples are delivered in individual heavy duty plastic bags with unique barcode ID
tags.
• Upon delivery at the assay laboratory, a Geology Sample Submission form is filled out
at the laboratory stating the date submitted, the person submitted by, the number of
Centerra Gold Inc. – Mount Milligan Mine
Technical Report NI 43-101 – March 22, 2017 Page 11-6
samples along with the sample identifications and the analysis required (Cu, Au, Ag,
S, Fe, ABA).
• Each sample transferred from the bag to individual drying pans and is scanned into a
batch created in the assay laboratory’s Laboratory Information Management System
(LIMS) software.
• Samples are dried, crushed, and riffle split down to ~300 g.
• This split material is then pulverized to -200 mesh, barcoded and staged for wet
chemistry and fire assay.
Wet Chemistry - acid digestion and atomic absorption analysis are completed for each sample,
and copper, iron and silver values are read on a PerkinElmer PinAAcle 900 atomic absorption
spectrometer using internal calibration and quality control standards.
Fire Assay – flux preparation, fusion, cupellation, parting and atomic absorption analysis are
completed for each sample, and gold values are read on a PerkinElmer PinAAcle 900 atomic
absorption spectrometer using internal calibration and quality control standards.
QUALITY CONTROL AND REMEDIAL ACTION PROCEDURE The Mount Milligan Assay Laboratory uses standards and blanks as well as internal duplicates
for QA/QC. A first and last duplicate is digested and analyzed for each set of twenty blast hole
samples. A quality control standard is also digested and analyzed with each set of twenty blast
hole samples. All controls and duplicates must pass QA/QC for each data set prior to data
release.
ADEQUACY OF SAMPLE PREPARATION, ANALYSIS AND SECURITY In the opinion of the applicable author of this Technical Report, sample preparation, security,
and analytical procedures utilized during drilling programs were adequate and conducted
according to industry standards.
Centerra Gold Inc. – Mount Milligan Mine
Technical Report NI 43-101 – March 22, 2017 Page 12-1
12 DATA VERIFICATION In the building of the drill database, a series of assay quality control programs, including the
use of blanks, standards, duplicate samples, and external check assay programs, have been
carried out over the years, both during drill programs and afterwards during a series of assay
checks. As well, a number of database compilation, verification, and review programs
(including third party, independent review) have been undertaken, the last one being in 2014,
subsequent to the release of TCM’s 2015 Technical Report (refer to TCM January 21, 2015 NI
43-101 Technical Report).
The drill database remains unchanged since 2014, and Centerra considers the final 2017
database to be robust and verified.
The QPs of this report are of the opinion that the database is adequate for the estimation of
Mineral Resources according to industry standards.
Centerra Gold Inc. – Mount Milligan Mine
Technical Report NI 43-101 – March 22, 2017 Page 13-1
13 MINERAL PROCESSING AND METALLURGICAL TESTING INTRODUCTION Mount Milligan is a copper-gold porphyry deposit, consisting of two principal zones, the Main
Zone and the SS Zone. The Main Zone includes four contiguous sub-zones: MBX, WBX,
DWBX and 66 (low-copper and high-gold, southeast of the MBX sub-zone). These geologic
zones are the basis for the metallurgical test work.
The Mount Milligan Mine deposit is being mined using conventional open-pit equipment, with
the ore being processed through a gyratory crusher, secondary pre-crushing and a SAG-ball
mill together with a rougher and cleaner flotation plant, producing a marketable gold-rich
copper concentrate.
SUMMARY Metallurgical investigations conducted by various research laboratories prior to
commencement of operations conclusively showed that froth flotation is the optimum process
for the recovery of copper, gold, and silver. These investigations were the basis of the
performance models used in previous resource modelling. With the commencement of
operations, performance issues were identified. As a result, previous assumptions in the
models were addressed together with identified issues in the plant to produce new
performance equations. From these new performance models, the LOM average recoveries
are estimated at 78.7% for copper and 67.6% for gold. Concentrate grade varied with head
grade and ore type with a LOM average of 23.0% Cu. The impurity element contents in the
concentrate were below the penalty levels normally imposed by most smelters; therefore, no
penalties are expected.
METALLURGICAL INVESTIGATIONS (PRIOR TO PRODUCTION) A complete description of pre-production sample selection and test work is provided in
previous technical reports provided on SEDAR and is summarized below. This description,
provided in the previous technical report (2015), is comprehensive and details the selection of
Centerra Gold Inc. – Mount Milligan Mine
Technical Report NI 43-101 – March 22, 2017 Page 13-2
samples and the major test work programs in grinding, flotation and dewatering, conducted
prior to the commencement of operations.
Both composite and variability samples were obtained from 1988 until 2006. Test work on
these samples took place from 1989 until 2007. The last major round of test work performed
in 2007 provided the metallurgical performance models that predict metal recoveries and
concentrate grades from the WBX, SS and 66 zone material. The sample selection performed
covered all significant metallurgical domains.
In general, the test work done on the deposit can be considered typical with test work being
performed by qualified organizations. The organizations involved included Knelson, Hazen
Research, Placer Dome Research, Lakefield (now SGS-Lakefield), Ortech, Boliden-Allis
Research, Bacon Donaldson & Assoc., Coastech Research and Dawson Laboratories with
support from recognized mineralogical and assay facilities. All of the organizations involved
appear to have done the work by standard procedures and to a professional quality. The test
work can be considered to have been extensive and to have covered the attributes of the
samples collected from 1988 to 2006.
Interpretation of the test work and the use of predictive models, in particular for grinding, was
variable by groups providing design input. These groups included Placer Dome Engineering,
MacPherson Consulting, Contract Support Services, Wardrop (Tetra Tech), KWM Consulting
and the BC Joint Mining Venture (a consortium of Fluor and Amec Foster Wheeler). In general,
although the ore was recognized as being very hard, there was a belief that SAG and ball
milling could accomplish the targets. SAG mill power ranged from 20 to 24 MW with all groups
confirming that the throughput was possible with the exception of the Ortech pilot plant run
which suggested higher power was required. Ball mill power requirements varied, but reflected
the known approaches by all the practitioners. Since 2007, it has been recognized by
consulting engineering firms and operators that the interpretation of test results for very hard
ores of the Mount Milligan type have serious issues.
For the flotation test work, the principal interpretation was completed by Wardrop, and is based
on a comprehensive set of data produced from the 2007 test work. The indications are that the
interpretation is substantially correct although the assumptions utilized in some of the
predictions may be considered somewhat aggressive.
Centerra Gold Inc. – Mount Milligan Mine
Technical Report NI 43-101 – March 22, 2017 Page 13-3
For dewatering, test work and sizing was confirmed by vendors and appears to have been
adequate.
INITIAL METALLURGICAL INTERPRETATION (PRIOR TO PRODUCTION) The metallurgical investigations done prior to production are still of significance to the
understanding of the deposit metallurgy, the design of the plant and the construction of the
performance parameters for prior and current LOM calculations. For the current 2017 LOM
model, these parameters are modified.
The interpretation of the test work and the resulting design numbers and recovery formulas
prior to production were performed by Wardrop (now Tetra Tech). These values were applied
in the concentrator design in the feasibility study work performed by Wardrop in 2007-8 and
subsequently updated in 2009-10. Based on this design, Terrane proceeded to order long lead
time equipment through Wardrop. Subsequently, the detailed plant engineering was performed
by the BC Joint Mining Venture (Fluor and Amec Foster Wheeler). During the detailed
engineering, procurement and construction management (EPCM) of the Project, most aspects
of the Wardrop design were maintained except that there were minor upgrades to the SAG
and pebble crushers. There was also a change in regrind technology from vertical stirred mills
to a combination of vertical and horizontal stirred mills. Finally, additional cleaning capacity
was added in the form of one column cell for final concentrate cleaning.
In the 2007 test program, open-circuit tests optimized process conditions for the various ore
zones. These tests were followed by locked cycle tests using a standard set of optimum
conditions established in the open circuit tests. The 2007 test results confirmed the previous
recovery results while the locked cycle tests generated consistently better concentrate grades
compared to the historical test results. This test work was used to optimize the design
flowsheet and define process conditions prior to plant start-up.
The main difference between the 2007 and the historical test programs was that the 2007
program used a vertical stirred mill with fine ceramic grinding media to regrind the concentrate
products.
Centerra Gold Inc. – Mount Milligan Mine
Technical Report NI 43-101 – March 22, 2017 Page 13-4
In general, the metallurgical response of the Main Zone (MBX and WBX) samples was very
similar. Test results from the SS samples, however, showed that the ore zone behaved
differently from the MBX and the WBX sub-zones. Copper recoveries from the SS samples
were consistently lower than those of the MBX and WBX samples. Compared to other zones,
copper recoveries from the 66 sub-zone samples were lower due to the zone’s much lower
copper tenor.
The metallurgical performance models that are used to predict metal recoveries and
concentrate grades in the LOM reserve calculations prior to the 2017 LOM model were
developed based on the results of the locked cycle tests conducted during the 2007 test
program.
To accommodate the process parameters recommended in the 2009 feasibility report —
specifically, a mass recovery of 12% at the bulk rougher/scavenger flotation and a regrind size
of 80% passing 20 µm, the 2007 locked cycle test data was derated to reflect variations in
these parameters in the individual tests.
Using the adjusted data, the plots of head grades-concentrate grades and head grades-metal
recoveries were created for the major ore types. The regression equations that best describe
these relationships, prior to this Technical Report, are provided in Table 13-1.
Centerra Gold Inc. – Mount Milligan Mine
Technical Report NI 43-101 – March 22, 2017 Page 13-5
TABLE 13-1 REGRESSION EQUATIONS (PRE-2017) Copper Concentrate – Head Grade All Zones Cu head ≥ 0.14%, y=5.2831Ln(x) + 34.968 x = Cu head:
>0.39% Cu, capped at 30% Cu
Cu head ≥0.015% and <0.14%, y = 9.543Ln(x) + 43.384 Cu head <0.015%, concentrate grade = 2%
Copper Recovery to Concentrate MBX,WBX,66 Zone Cu head ≥0.05%, y = 105(x)0.1303
x = Cu head: >0.363%, fixed at 92% <0.05%, fixed at 65%
SS Cu head ≥0.14%, fixed at 79.0% Cu head ≥0.10% and <0.14% Cu, fixed at 75% Cu head <0.10%, fixed at 70%
Gold Recovery to Concentrate MBX, WBX Au head ≥0.15g/t, y = 78.289(x)0.0434 x = Au head; recovery
capped at 80%
Au head ≥0.10 g/t and <0.15g/t, fixed at 65% Au head <0.10 g/t, fixed at 50%
SS Au head ≥0.20 g/t, fixed at 69.4% Au head ≥0.10 g/t and <0.20g/t, fixed at 65% Au head <0.10 g/t, fixed at 50%
66 Zone, Cu Head >= 0.10% Au head ≥0.15 g/t, y = 78.289(x)0.0434 x = Au head; recovery capped at 80%
Au head ≥0.10g/t and <0.15g/t, fixed at 65% Au head <0.10g/t, fixed at 50%
66 Zone, Cu Head < 0.10% Au head ≥0.20g/t, y = 65.943(x)0.1303 + 2 x = Au head; recovery capped at 67%
Au head <0.20g/t, fixed at 40%
These equations (now historical) were used as the basis for plant design and all previous
technical reports.
The heads and the products from the locked cycle tests of the 2007 testing program were
assayed for silver, and silver metallurgical balances were created. Silver recoveries vary from
31% to 48% for the MBX, WBX, and SS samples and from 18% to 28% for the 66 Sub-Zone
samples. Silver recoveries obtained from the locked cycle tests increase with silver head grade
but the correlation between the head grades and the recoveries is low. However there was a
Centerra Gold Inc. – Mount Milligan Mine
Technical Report NI 43-101 – March 22, 2017 Page 13-6
reasonable correlation between the Ag/Au ratio in the head and that in the final concentrate,
which can be used to project silver production.
In this Technical Report, adjusted formula are utilized which take into account different
assumptions and which considers current performance issues within the mill. This will be
discussed after the review of mill performance and discussion of test work re-interpretation.
PROCESS PERFORMANCE (TO DATE) Actual copper and gold recovery values achieved since April 2015 (considered first month of
stable plant operation) have not met expectations set by the original metal recovery curves
developed during the feasibility study.
Upon completion, the concentrator went through a start-up which saw a variety of issues with
the commissioning of equipment and later with the operation of the circuits. As the plant began
to achieve steady state operation of equipment, throughput was pushed to attain the designed
throughput rate. As the throughput was pushed, it was recognized that the plant was
encountering issues with the performance of the comminution circuit, in particular, the SAG
mill. This unit had difficulty reducing the feed size being generated by the gyratory crusher
down to an appropriate transfer size even at reduced throughputs. With the recognition of this
issue, steps were undertaken to increase throughput. In addition to changes made in mill
control and operational practice, there were also changes made external to the plant. These
included a finer feed size to the gyratory crusher by increasing the blast powder factor and the
control of the gyratory crusher discharge to a finer size. Although these approaches did
increase throughput, it was recognized that the ultimate target of 60,000 tpd was still not being
consistently met. In addition, the comminution circuit performance remained very sensitive to
ore hardness.
As a result of the issues with attaining throughput in the SAG mill, it was decided to investigate
the use of secondary crushing to increase throughput through the SAG mill. Pre-crushed
material produced by contract crushing was campaigned through the plant to consider the
impact on the SAG mill and associated pebble crushing. In tandem with campaigning material
through the plant, preliminary designs for the secondary crushing circuit were investigated. A
decision was made and an EPC contractor was brought in to deliver a plant which would have
two MP-1250 crushers in combination with screening. The screening would allow the pre-
Centerra Gold Inc. – Mount Milligan Mine
Technical Report NI 43-101 – March 22, 2017 Page 13-7
crushing of the full throughput, although the initial target was to pre-crush 67% (to be achieved
in stages).
This new secondary crushing circuit was installed according to schedule and budget. As the
new circuit ramps up, there will be commissioning issues (discharge liner selection, optimum
SAG mill control parameters, balancing pre-crushing with pebble crushing). With the
maintenance of the powder factor to 0.6 kg/t or greater within the mine operations, throughput
to 62,500 tpd is expected to be realized by 2019 with the possibility of further expansion.
During the period of secondary crusher construction, another change was performed in the
mill which included the addition of a second in-situ SAG discharge screen to address capacity
issues allowing for better separation of finished material versus pebble recycle.
Although the constraints in the SAG and pebble circuits are being surmounted, as tonnage has
increased, both the recovery of copper and gold per unit feed has decreased. This is due to
limitations in secondary grinding and flotation circuits downstream of the SAG mill. In early
2017, grinds at the 60,000 tpd mark reached just over 210 μm, however, it is recognized that
the combined secondary crushing and SAG circuit are still undergoing optimization and
improvements should allow the ball mills to achieve a 195 μm grind. With optimization still
under way, there is some potential risk that the grind may end up above 195 μms.
In addition to the issues due to the flotation feed grind, there are circuit performance issues
with recovery in both the rougher scavenger and also in the cleaner circuits. The impacts of
various factors within the flotation circuits are currently being investigated. Within the rougher
scavenger circuit, these issues may include; residence time, impact of slurry density,
temperature and quality of process water, and cell configurations. Within the cleaner circuit,
many of the issues are similar but with the addition of hydraulic limitations and issues in the
regrind size distribution.
Due to the above issues, it was determined that a new set of recovery curves would be required
for the 2017 update of the mine’s Technical Report. Until the flotation feed grind and flotation
issues are addressed, the recovery models are discounted until 2019 for both copper and gold.
After 2019, the standard recovery models for both copper and gold are used for the remainder
of the LOM.
Centerra Gold Inc. – Mount Milligan Mine
Technical Report NI 43-101 – March 22, 2017 Page 13-8
The data used during the feasibility study was reviewed and reinterpreted and is discussed
below.
UPDATED METALLURGICAL INTERPRETATION FEASIBILITY DATASET AND ASSUMPTIONS The mine model is based on feasibility recovery curves originally created by Wardrop (now
Tetra Tech) in 2009 for the feasibility study update conducted for the property. The feasibility
recovery curves aforementioned are shown in Figure 13-1 below. These curves were based
on test work which is considered representative of the orebody and response of the material
to the plant design.
The basis for these recovery curves was analyzed and the adjustments were made according
to a re-appraisal of assumptions used in the construction of these curves and the results of
Geofloat test work conducted on blasthole drill samples. Finally, the models are further
modified to take into account the response to the ore of existing equipment constraints within
the plant.
Centerra Gold Inc. – Mount Milligan Mine
Technical Report NI 43-101 – March 22, 2017 Page 13-9
Centerra Gold Inc. – Mount Milligan Mine
Technical Report NI 43-101 – March 22, 2017 Page 13-10
FIGURE 13-1 FEASIBILITY RECOVERY CURVES The dataset used to build these curves were the locked cycle test results produced from the
2007 bulk flotation test work. This original analysis was based on the following assumptions:
1. “Due to the preferential grinding of the heavier sulfide minerals in actual operation,
metal recovery at a plant’s primary grind of 210 μm will be about the same as the
laboratory grind of 150 μm.”
Centerra Gold Inc. – Mount Milligan Mine
Technical Report NI 43-101 – March 22, 2017 Page 13-11
2. “The mass pulls for the rougher/scavenger concentrate are higher than the design
parameter (a mass recovery of 12%). To normalize metal recoveries to reflect the
designed parameter, the recoveries were proportionally adjusted downward.”
3. The rock samples floated are representative of all major ore types found in Mount
Milligan’s deposits.
Assumption No. 1 implies that no adjustment was made at the time to take into consideration
the fact that most of the test work data presented above was obtained on ore that had been
ground to a P80 of ~160-180 μm, rather than to a the design grind size of 210 μm. While the
concept of preferential grinding is not a new one, the gap between a P80 of 150um and 210
μm mentioned is too wide and there is potential for some loss in recovery especially given the
fine size of the chalcopyrite and gold present in the feed.
The effect of grind size on recovery was re-analyzed using the data provided in the context of
the feasibility study (2007 G&T Metallurgical Response of Mount Milligan Ores). Results from
the various domains were compared where the respective mass pulls were kept constant for
each grind size tested. Additional data from the 2016 flotation test work was also added to
dataset, as well as results from test work conducted in-house, to determine the effect of
coarser grind size. The relationships obtained are shown in Figure 13-2 below.
Centerra Gold Inc. – Mount Milligan Mine
Technical Report NI 43-101 – March 22, 2017 Page 13-12
FIGURE 13-2 EFFECT OF GRIND SIZE ON COPPER AND GOLD RECOVERY
y = -0.0002x2 + 0.041x + 91.603R² = 0.7899
70
75
80
85
90
95
100
100 150 200 250 300 350 400
Copp
er R
ecov
ery
(%)
Grind Size (P80um)
Copper Recovery as of Function of Grind Size
2007 MBX
2007 66 Ore
2007 WBX
2007 SS Ore
2016 MBX
MBX Lab
60
65
70
75
80
85
90
95
100
100 150 200 250 300 350 400
Gold
Rec
over
y (%
)
Grind Size (P80um)
Gold Recovery as a Function of Grind Size
2007 MBX
2007 66 Ore
2007 WBX
2007 SS Ore
2016 MBX
MBX Lab
Centerra Gold Inc. – Mount Milligan Mine
Technical Report NI 43-101 – March 22, 2017 Page 13-13
The effect of grind size on copper rougher recovery appears to be similar for all types of ore
analyzed. The difference in recovery between a 160 μm and 210 μm grind size is calculated
to be in the order of ~1.7%.
The same analysis was performed on gold recovery, however, as shown above, no obvious
correlation between gold recovery and grind size could be established in the 150-210 μm range
for the different ores. As such, no adjustment can be made on the recovery values obtained in
the laboratory to account for a correction on plant grind size.
As for assumption No. 2, in the original models an adjustment of 0.4 percentage points of
copper recovery was subtracted for each percentage point of mass pull over 12% in the test
results used for the MBX, WBX, SS and 66 ore zones. The adjustment used to adjust gold
recoveries in the original feasibility study models could not be back calculated and remains
unknown at this point. These adjustments however were conducted and applied in the
feasibility study model.
For Assumption No. 2, in order to determine the right factor to use to normalize the recovery
values obtained in the laboratory based on mass pull, the relationship between mass pull and
recovery must be characterized, ideally for each ore type. To do so, flotation results from the
same dataset as the one used to characterize the effect of grind size were used. Figure 13-3
illustrates how copper rougher recovery is affected by mass pull depending on ore type.
Centerra Gold Inc. – Mount Milligan Mine
Technical Report NI 43-101 – March 22, 2017 Page 13-14
y = 62.457x0.1606
R² = 0.9442
75
80
85
90
95
100
4 6 8 10 12 14 16 18 20 22
Copp
er R
ecov
ery
(%)
Mass Pull (%)
MBX Copper Recovery as a Function of Mass Pull
2007-255um
2007-198um
2007-143um
y = 28.203x0.4044
R² = 0.9803
50
55
60
65
70
75
80
85
90
95
4 6 8 10 12 14 16 18 20 22
Copp
er R
ecov
ery
(%)
Mass Pull (%)
66 Copper Recovery as a Function of Mass Pull
2007-196um
2007-158um
2007-113um
Centerra Gold Inc. – Mount Milligan Mine
Technical Report NI 43-101 – March 22, 2017 Page 13-15
y = -0.1328x2 + 6.0247x + 12.273R² = 0.9999
45
50
55
60
65
70
75
80
85
4 6 8 10 12 14 16 18 20 22
Copp
er R
ecov
ery
(%)
Mass Pull (%)
66 Low Cu Copper Recovery as a Function of Mass Pull
2007-206um
2007-167um
2007-131um
y = 58.589x0.172
R² = 0.9744
70
75
80
85
90
95
4 6 8 10 12 14 16 18 20 22
Copp
er R
ecov
ery
(%)
Mass Pull (%)
WBX Copper Recovery as a Function of Mass Pull
2007-255um
2007-218um
2007-143um
Centerra Gold Inc. – Mount Milligan Mine
Technical Report NI 43-101 – March 22, 2017 Page 13-16
FIGURE 13-3 EFFECT OF MASS PULL ON COPPER RECOVERY Based on these trends, using the equation of the tests closer to 200 μm, adjustments to be
made to normalize all obtained copper rougher recovery to 12% mass pull ranged from 1.9%
to 19.2%, depending on ore types and on how far from the 12% mass pull each test was.
Figure 13-4 illustrates how the gold recovery response to mass pull for all ore types varied.
y = -0.1848x2 + 5.8615x + 42.638R² = 0.9982
70
75
80
85
90
95
4 6 8 10 12 14 16 18 20 22
Copp
er R
ecov
ery
(%)
Mass Pull (%)
SS Copper Recovery as a Function of Mass Pull
2007-211um
2007-181um
2007-125um
Centerra Gold Inc. – Mount Milligan Mine
Technical Report NI 43-101 – March 22, 2017 Page 13-17
y = 67.495x0.1309
R² = 0.9452
70
75
80
85
90
95
100
4 6 8 10 12 14 16 18 20 22
Gold
Rec
over
y (%
)
Mass Pull (%)
MBX Gold Recovery as a Function of Mass Pull
2007-255um
2007-198um
2007-143um
y = -0.2226x2 + 7.4067x + 28.117R² = 0.9954
65
70
75
80
85
90
95
4 6 8 10 12 14 16 18 20 22
Gold
Rec
over
y (%
)
Mass Pull (%)
66 Gold Recovery as a Function of Mass Pull
2007-196um
2007-158um
2007-113um
Centerra Gold Inc. – Mount Milligan Mine
Technical Report NI 43-101 – March 22, 2017 Page 13-18
y = -0.2003x2 + 7.3988x + 20.349R² = 0.9987
60
65
70
75
80
85
90
4 6 8 10 12 14 16 18 20 22
Gold
Rec
over
y (%
)
Mass Pull (%)
66 Low Cu Gold Recovery as a Function of Mass Pull
2007-206um
2007-167um
2007-131um
y = 59.71x0.1326
R² = 0.9529
60
65
70
75
80
85
90
4 6 8 10 12 14 16 18 20 22
Gold
Rec
over
y (%
)
Mass Pull (%)
WBX Gold Recovery as a Function of Mass Pull
2007-255um
2007-218um
2007-143um
Centerra Gold Inc. – Mount Milligan Mine
Technical Report NI 43-101 – March 22, 2017 Page 13-19
FIGURE 13-4 EFFECT OF MASS PULL ON GOLD RECOVERY Based on these trends, using the equation of the tests closer to 200 μm, adjustments to be
made to normalize all obtained gold rougher recovery to 12% mass pull range from 1.6% to
7.6%, depending on ore types and on how far from the 12% mass pull each test was.
The third important assumption examined was the representability of the original feasibility
study samples. Since February 2015, a sample of each ore block sent to the mill has been
floated in a manner similar to that used during the feasibility metallurgical testing in order to
better characterize the Mount Milligan deposit. To determine if the samples used as part of the
feasibility study are indeed representative of most of Mount Milligan’s ore, their flotation profile
as in Figure 13-3 and Figure 13-4 (recovery vs mass pull graphs) were compared to those of
the geoflotation test completed to date. The results are shown Figure 13-5 below.
y = 66.122x0.09
R² = 0.9954
60
65
70
75
80
85
90
4 6 8 10 12 14 16 18 20 22
Gold
Rec
over
y (%
)
Mass Pull (%)
SS Gold Recovery as a Function of Mass Pull
2007-211um
2007-181um
2007-125um
Centerra Gold Inc. – Mount Milligan Mine
Technical Report NI 43-101 – March 22, 2017 Page 13-20
Notes: (1) CIM definitions were followed for Mineral Resources. (2) Mineral Resources are estimated at a $6.25/t (C$8.12/t) cut-off value using metal prices of $3.50 per
pound copper and $1,450 per ounce gold, and a US$/C$ exchange rate of US$1.00/C$1.30. (3) Mineral Resources are not Mineral Reserves and do not have demonstrated economic viability. (4) Figures may not total exactly due to rounding.
Table 14-2 is a breakdown of the Mineral Resources by domain.
Centerra Gold Inc. – Mount Milligan Mine
Technical Report NI 43-101 – March 22, 2017 Page 14-2
TABLE 14-2 MINERAL RESOURCE ESTIMATE (EXCLUSIVE OF MINERAL RESERVES) BY DOMAIN AS OF DECEMBER 31, 2016
Deep WBX 3,205 0.22 0.17 19,519 0.25 0.16 1,374 0.29 0.16 East Volcanics 387 0.28 0.11 928 0.30 0.11 137 0.27 0.07 Zone 66 North 12,535 0.46 0.04 898 0.49 0.05 - - -
Zone 66 South 7,859 0.41 0.05 779 0.41 0.05 - - -
Grand Total 76,622 0.27 0.11 167,310 0.21 0.14 11,046 0.31 0.13 Notes:
(1) CIM definitions were followed for Mineral Resources. (2) Mineral Resources are estimated at a $6.25/t (C$8.12/t) cut-off value using metal prices of $3.50 per pound
copper and $1,450 per ounce gold, and a US$/C$ exchange rate of US$1.00/C$1.30. (3) Mineral Resources are not Mineral Reserves and do not have demonstrated economic viability. (4) Figures may not total exactly due to rounding.
GEOLOGY MODEL INTRODUCTION All geological modeling and grade estimations were completed using MineSight software.
Geological data were extracted from a MineSight Torque SQL database and loaded into
MineSight.
GEOLOGICAL INTERPRETATION Historical interpretation of geology, alteration and structure are currently being used, however,
Centerra geology staff is in the process of determining whether these models can be improved
upon and updated.
Centerra Gold Inc. – Mount Milligan Mine
Technical Report NI 43-101 – March 22, 2017 Page 14-3
OVERBURDEN An extensive layer of overburden covers the deposits and low-lying areas to the east and south
of the deposit. This overburden consists of till and fluvial material, and thicknesses are highly
variable, ranging from metres across parts of the deposit to 100 m thick to the north and east of
the MBX stock.
Overburden was typically triconed during exploration drilling, with descriptions collated from the
drillers’ logs. The overburden-bedrock contact was defined as the base of casing, and a points file
was generated in Vulcan to mark the top of bedrock for all drill holes. An overburden surface was
generated through triangulation of the top of bedrock points file.
A geotechnical site investigation program consisting of 17 HQ diameter drill holes was completed
by Knight Piésold (KP). Six of these holes cored overburden within the perimeter of the Main open
pit, and each hole was completed in weathered bedrock. These holes are considered more
accurate than exploration drill holes in defining the base of overburden.
The 2007 site investigation drill logs were obtained from KP. Drill holes KP07-10, KP07-11, KP07-
12, KP07-14, KP07-15, and KP07-16 were collared within the pit limits. The depth to bedrock was
compared to modelled depths (Table 14-3).
TABLE 14-3 GEOTECHNICAL DRILLING – DEPTH TO BEDROCK
Technical Report NI 43-101 – March 22, 2017 Page 14-7
FIGURE 14-3 ISOMETRIC VIEW OF MOUNT MILLIGAN LITHOLOGY MODEL Source: 2009 Report, verified Centerra, 2017
Centerra Gold Inc. – Mount Milligan Mine
Technical Report NI 43-101 – March 22, 2017 Page 14-8
TABLE 14-4 LITHOLOGY CODING OF GEOLOGY MODEL
Geology Code Description 1 Volcanics above Rainbow Dyke 2 Volcanics between Trachyte and Rainbow Dyke 3 Volcanics below Trachyte 4 Upper Trachyte 5 Rainbow Dyke/Sill 6 Lower Trachyte 7 MBX Monzonite Stock 8 Volcanics South of Rainbow Fault 9 66 Zone Monzonite Dyke, South of Rainbow Fault 11 66 Zone Trachyte; South of Rainbow Fault 12 Volcanics West of Harris Fault 14 DWBX Monzonite Stock 15 SS Monzonite Stock 16 Monzonite Intrusions between SS and DWBX Stocks 17 Goldmark and Monzonite Stock 18 Volcanics North of the Oliver Fault
20 Great Eastern Fault and Volcanics East of the Great Eastern Fault
21 Volcanics East of the Great Eastern Fault 24 Outside of estimation envelope
A series of post-mineral dyke swarms occur in both the Main and SS deposits. These dykes are
irregular, discontinuous, and vary from sub-meter to 15 m in width, making them difficult to model
in three dimensions and, as such, the dykes were not modelled. The dyke intervals were included
in the drill hole assay samples, thus their impact is included in the copper and gold grades dataset
for resource estimation.
SPECIFIC GRAVITY DATASET Specific gravity (SG) data were systematically collected across the Mount Milligan deposits, with
a total of 13,802 determinations in the raw database. These measurements were routinely
collected, with one measurement approximately every 10 m downhole. The measurements relied
upon Archimedes Principle, which determines SG through water displacement methodology.
SG was calculated as follows:
• The sample was weighed to determine the dry mass in air (MA).
Centerra Gold Inc. – Mount Milligan Mine
Technical Report NI 43-101 – March 22, 2017 Page 14-9
• The sample was suspended in water where the mass in water was measured (MW).
• The bulk density was then calculated as: SG = MA / (MA – MW).
• The determinations were recorded on a template that captured hole name, depth, and MA.
The determinations were recorded on a template that captured hole name, depth, MA and MW.
This information was later transferred to spreadsheets, with SG calculated from primary
measurements. This method is considered appropriate for competent non-porous rocks, which
are typical of Mount Milligan.
TCM’s validation of the SG data compare favourably with previous determinations.
HISTORICAL SG DETERMINATIONS A small subset of core, covering a range of representative lithologies, was selected from the 2007
HQ diameter Terrane drill program. These samples were sent to ALS Chemex for external
verification of SG, using method OA-GRA-08 which is effectively a water-displacement method
similar to that employed at the Project. The results are summarized in Table 14-5.
TABLE 14-5 SPECIFIC GRAVITY SUMMARY – ALS CHEMEX DATA
Technical Report NI 43-101 – March 22, 2017 Page 14-24
DOMAINS Major geologic domains were defined for grade estimation purposes, broken primarily by structure
(Table 14-16).
TABLE 14-16 GEOLOGIC DOMAIN CODING
Domain Code Name Description
1 North Volcanics North of the Oliver Fault 2 Goldmark Goldmark Stock and Volcanics (Western Fringe) 3 SS West of the Harris Fault; South of roughly 6109100N (break in
intrusive package) 4 MBX Domain East of Harris Fault, North of Rainbow Fault, where Au to Cu ratio is <
5:1; footwall of MBX stock
41 WBX Domain East of Harris Fault, North of Rainbow, hanging wall to MBX stock 42 WBX West West of Harris Fault, above propylitic alteration/low angle faulting 43 DWBX Deep Western Breccia – west of Harris, below WBX West (42) 61 66 North East of Harris Fault, North of Rainbow Fault, where Au to Cu ratio is >
5:1 as defined by modelling bench composites on 30 m plans
63 66 South 66 Zone, South of Rainbow Fault 5 East Volcanics Great Eastern Fault, volcanics east of the fault
A bench plan of coloured and coded domains, and lithology is provided as Figure 14-8 and Figure
14-9.
Centerra Gold Inc. – Mount Milligan Mine
Technical Report NI 43-101 – March 22, 2017 Page 14-25
FIGURE 14-8 1010 BENCH – LITHOLOGY CODE DISTRIBUTION Source: 2009 Report, verified Centerra, 2017. Gridlines are 500m.
Centerra Gold Inc. – Mount Milligan Mine
Technical Report NI 43-101 – March 22, 2017 Page 14-26
FIGURE 14-9 1010 BENCH –DOMAIN CODE DISTRIBUTION Source: 2009 Report, verified Centerra, 2017. Gridlines are 500m.
GOLD AND COPPER INTERPOLATION In order to preserve trends, multiple kriging passes were used in the estimation of copper and
gold. The first pass established the search at half of variogram range, the second pass at three-
quarters variogram range, and the final pass at full variogram range. An additional smaller pass
was added for this MBX Upper Volcanics at a quarter of the variogram range to further minimize
the influence of the high copper grades. This area has a high number copper composites greater
than 0.60%. To reduce the influence of high copper grades the search ellipse size was decreased
systematically. Where at the first pass the ellipse was reduced to 30 m for any copper composite
grade greater than 0.60%, by 60 m at the second pass, and was not restricted for the third pass.
However with the MBX Upper Volcanics an additional pass was added with a restricted search
ellipse of 15 m. This was done to reflect the influence of high grade copper in the blast holes.
Centerra Gold Inc. – Mount Milligan Mine
Technical Report NI 43-101 – March 22, 2017 Page 14-27
Search directions were established as per variogram orientation. The estimation strategy is
summarized in Table 14-17 and Table 14-18. For all blocks, a minimum of two drill holes was
required to make an estimate, with generally a minimum of five and a maximum of 10 composites.
Centerra Gold Inc. – Mount Milligan Mine
Technical Report NI 43-101 – March 22, 2017 Page 14-28
Technical Report NI 43-101 – March 22, 2017 Page 15-4
The Mount Milligan Mineral Resource is a portion of the deposit that is amenable to flotation
processing and mining by open pit methods. The Mount Milligan Mineral Resource estimate
presented in this Technical Report is tabulated within a conceptual open pit geometry based on
operating costs which cover mining, process, general and administration (G&A), plant services,
tailings management and mill recovery curves at spot metal prices indicated.
The base mining costs used to define the Mineral Resource limits were based on LOM estimates
from the site 2017 budget and LOM plan. The mining costs used for the resource definition are
$1.61/t (C$2.09/t) for waste rock, and $1.31/t (C$1.70/t) for material to the primary crusher. An
additional charge of $0.023/t (C$0.030/t) per 15 m bench below the 1070 elevation was added to
the base mining cost to make allowance for the additional cost of haulage from deeper portions
of the deposit. The milling costs applied for resource definition are $4.52/t (C$5.88/t) of ore and
all administration charges including G&A, plant services and tailings management received a
$1.69/t (C$2.20/t) of ore charge.
BLOCK MODEL ORE VERSUS WASTE DETERMINATION AND CLASSIFICATION A total of 10 ore and waste types were coded to the block model with the field name OTYPE. The
determination was based on copper and gold metal content, acid base accounting (ABA) data,
extent of oxidation and overburden classification specific to the deposit as shown in Table 15-2.
TABLE 15-2 ORE TYPE CLASSIFICATION BY CUT-OFF GRADE
OTYPE Name Classification Description 1 ORE ORE Ore above the cut-off 2 PAG WASTE Potentially Acid Generating Waste 3 LNAG WASTE Low Potentially Acid Generating Waste 4 NAG WASTE Non Acid Generating Waste
5 OVERBURDEN WASTE Overburden not classified glacial till or glaciofluvial material
6 OXIDE ORE ORE Oxide material above the cut-off threshold 7 S WASTE Glacial Till 8 C WASTE Glaciofluvial/Eskers/Sands 9 HGLC ORE High Gold Content, Low Copper Content Ore 10 OXIDE WASTE WASTE Oxide
The designation of ore and waste are based on an NSR calculation which determines a value per
tonne for each block in the model. The calculation uses the attributes and equations described in
Centerra Gold Inc. – Mount Milligan Mine
Technical Report NI 43-101 – March 22, 2017 Page 15-5
Table 15-1: concentrate grade, recovery, smelting and transportation cost. A cut-off value of
$6.25/t (C$8.12/t) was determined from the estimated operating charges; which adds the mining,
milling, and G&A costs per tonne of ore, plus $0.34/t (C$0.44/t) of ore for CAPEX requirements
for the LOM, then subtracts the mining cost of waste.
Using the $6.25/t (C$8.12/t) cut-off value, a Cut-off Grade Chart was calculated for each copper
and gold grade (Figure 15-1). Any block with a value per tonne greater than $6.25/t (C$8.12/t)
and with a copper grade greater than or equal to 0.12% is designated as economic. Blocks with
a value per tonne greater than $6.25/t (C$8.12/t) with copper grades less than 0.12% are
designated as HGLC (High Gold Low Copper). Oxide Ore is oxidized material above the cut-off
value with enough sulphide content to be considered still recoverable.
FIGURE 15-1 CUT-OFF GRADE CHART BY METAL GRADE
0.00
0.05
0.10
0.15
0.20
0.25
0.30
0.35
0.40
0.45
0.50
0.03
0.04
0.05
0.06
0.07
0.08
0.09
0.10
0.11
0.12
0.13
0.14
0.15
0.16
0.17
0.18
0.19
0.20
Au G
rade
g/T MBX Yr 1-3
CUTOFF66 Yr 1-3CUTOFFMBX and SSLOM
% Cu Grade
Waste
Ore
LOM 2017 Cutoff ChartUSD CAD
$/oz Au $1,200 $1,560$/lb Cu $2.95 $3.84FX $1.000 $1.300
Cut-off $6.25/t(C$8.12/t)
Centerra Gold Inc. – Mount Milligan Mine
Technical Report NI 43-101 – March 22, 2017 Page 15-6
RESOURCE LIMITING PIT SHELL To determine the resultant Mineral Resources with respect to market prices, the mining software
NPV Scheduler was utilized. The block model containing the information of Measured Mineral
Resources and Indicated Mineral Resources is imported. The assumed costs, based on annual
budgets and price assumptions along with geotechnical slope recommendations from Knight
Piesold Consulting (KP), metal recovery and other mill parameters required to model all costs
associated with getting from rock in the ground through to concentrate production and to final
saleable metal, were entered into the software. Then current topography was then incorporated.
The NPV Scheduler software then relies on the Lerchs-Grossmann algorithm to develop an
overall recommended economic shape or “shell” and calculates an economic cut-off value per
block by calculating recoverable metal content. The cut-off value tells Centerra what metal the
rock must contain to be profitable, and thus only material above this metal content should be
mined as ore (or milled).
The base case Mineral Resource estimate used spot metal prices $3.50/lb copper and $1,450/oz
gold with sensitivity cases at $2.50/lb copper and $1,100/oz gold and $4.00/lb copper and
$1,700/oz gold. All of the resource defining cone runs allowed only the material classifications of
Measured Mineral Resources and Indicated Mineral Resources to provide positive credit to the
economics that defined the geometry.
RESOURCE TO RESERVE CONVERSION For Mineral Reserve classification, the resource pit shell output from NPV Scheduler is brought
into computer aided drafting (CAD) design software MineSight 3D to convert the shell (or cone)
into a pit design. Locations of blocks within the cone, metal content, haul roads, and minimum
mining widths based on loading fleet size are considered to develop the overall feasible pit design.
The location of the block is important, as this helps determine the amount of rock that will be
extracted in order to reach the block. The MineSight 3D design software provides computer aided
drafting tools to map out how to access economic material based on the outputs carried over from
the NPV Scheduler shell. The MineSight 3D software then can be utilized to quantify and tabulate
according to cut off the quantity and quality of economic reserves by tonnage and average grade
by bench by layback. The tabulated reserves then must be scheduled with recoveries and costs
applied to determine saleable product and the resultant economic benefit. If the resultant key
Centerra Gold Inc. – Mount Milligan Mine
Technical Report NI 43-101 – March 22, 2017 Page 15-7
metrics do not match the input parameters an iterative process of refining assumptions and
running through to design and schedule is undertaken to achieve reserve status.
MODIFYING FACTORS Modifying Factors are considerations used to convert Mineral Resources to Mineral Reserves.
These include, but are not restricted to, mining, processing, metallurgical, infrastructure,
economic, marketing, legal, environmental, social and governmental factors.
PROVEN MINERAL RESERVE A Proven Mineral Reserve is the economically mineable part of a Measured Mineral Resource. A
Proven Mineral Reserve implies a high degree of confidence in the Modifying Factors.
PROBABLE MINERAL RESERVE A Probable Mineral Reserve is the economically mineable part of an Indicated Mineral Resource.
The confidence in the Modifying Factors applying to a Probable Mineral Reserve is lower than
that applying to a Proven Mineral Reserve.
TABULATION OF MINERAL RESERVE The Mineral Reserve estimate was developed through the construction of an ultimate open pit
design within the Mineral Resource model at cost estimates and metal price assumptions set forth
in Section 15, Table 15-1. The Proven and Probable Mineral Reserve totals 496.2 Mt at 0.187%
Cu and 0.361 g/t Au containing 2.05 billion lb of copper and 5.76 million oz of gold (Table 15-3).
The open pit was optimized at the same charges used in the Mineral Resource estimate using
spot metal prices of $2.95/lb copper, $1,200/oz gold, a US$1.00/C$1.30 exchange rate, a cut-off
value of $6.25/t (C$8.12/t) and takes into consideration metallurgical recoveries, concentrate
grades, transportation costs, smelter treatment charges, the Haslinger NSR royalty (see Section
4) and the stream arrangement with Royal Gold (see Section 4) in determining economic viability.
The Mineral Reserve estimate reported has been classified as 51.8% Proven and 48.2%
Probable.
Centerra Gold Inc. – Mount Milligan Mine
Technical Report NI 43-101 – March 22, 2017 Page 15-8
TABLE 15-3 MINERAL RESERVE ESTIMATE EFFECTIVE DECEMBER 31, 2016
Notes: (1) CIM definitions were followed for Mineral Reserves. (2) Mineral Reserves are estimated at a $6.25/t (C$8.12/t) cut-off value using metal prices of $2.95 per pound
copper and $1,200 per ounce gold, and a US$/C$ exchange rate of US$1.00/C$1.30. (3) Figures may not total exactly due to rounding.
The estimate of Mineral Reserves is not materially affected by any known environmental matters,
permitting issues, political or socio-economic requirements. The Mineral Reserve estimates are
also not materially affected by any legal, title or taxation issue.
RISK FACTORS The results of the economic analysis to support Mineral Reserves represent forward looking
information that is subject to a number of known and unknown risks, uncertainties and other
factors that may cause actual results to differ materially from those presented here. Uncertainty
that may materially impact Mineral Reserve estimation include realized prices, market conditions,
capital and operating cost estimates, foreign exchange rates, resource model performance,
recoveries, and the timely and successful implementation of recommended actions.
Centerra Gold Inc. – Mount Milligan Mine
Technical Report NI 43-101 – March 22, 2017 Page 16-1
16 MINING METHODS INTRODUCTION The large scale open pit mining for Mount Milligan Mine will provide mill feed at a nominal rate of
62,500 t/d (22.8 Mt/a). Annual mine production will peak at 49.3 Mt/a, with a LOM stripping ratio
of 0.77 tonnes waste to 1 tonne ore. Table 16-1 is a summary of the major mining equipment at
Mount Milligan Mine:
TABLE 16-1 MAJOR MINING EQUIPMENT
Quantity Unit Blast Hole Drills 2
1 Caterpillar Electric Drill MD6640 Caterpillar Diesel Drill MD6290
FIGURE 16-3 CATCH BENCHES FOR ROCK FALL HAZARDS Source: Piteau and Martin, 1977
Centerra Gold Inc. – Mount Milligan Mine
Technical Report NI 43-101 – March 22, 2017 Page 16-8
ULTIMATE PIT DIMENSIONS The ultimate pit dimensions, including the final haul ramps extending to ultimate depth at the 770
m bench at the Main Zone and 875 m bench at the SS Zone, are shown in Table 16-3.
TABLE 16-3 ULTIMATE PIT DIMENSIONS
Design Main Zone SS
Surficial Dimensions 1,700 m E-W 1000 m E-W
1,180 m N-S 1,150 m N-S
Final Ramp Exit 1100 m 1100 m, via Main Zone pit
Ultimate Pit Bottom 755 m bench 905 m bench
Maximum Highwall 1185 m bench 1230 m bench
West Sector Southwest Sector Maximum Depth 430 m 325 m
HAUL ROADS Although many interim phase ramps are much wider, the ultimate pit haul roads have been
designed with an overall 34 m width that will include an outside berm (4.84 m wide, 1.82 m high)
and ditches (1.00 m) for dual lane passing of 236-t haul trucks (8.28 m) with a one-half truck width
(4.12 m) for truck separation. On each side of the truck, an allowance of 4.23 m for rubble build-
up and safety berm creep has been included. Roads have been designed with a maximum 10%
grade.
Haul roads out of the pit have been designed with an overall 39 m width that will include two
outside berms (4.84 m wide, 1.82 m high) and ditches (1.00 m) for dual lane passing of 236-t haul
trucks (8.28 m) with a one-half truck width (4.12 m) for truck separation. Similar allowances of
4.23 m for rubble build-up and safety berm creep have been included on each side of the truck
as detailed on Figure 16-4.
Centerra Gold Inc. – Mount Milligan Mine
Technical Report NI 43-101 – March 22, 2017 Page 16-9
FIGURE 16-4 TYPICAL HAUL ROAD CROSS SECTIONS
MINE PLANNING – PHASE DEVELOPMENT AND RESERVES MINING PHASE LAYOUT AND BLENDING STRATEGY The ultimate designed pit consists of 10 Phases, with Phases 1 and 2 now completely mined. The
mine is currently in Phase 3 with initial stripping and road access started in Phase 4. Phases 1
through 7 are focused on the Main Zone while Phases 8 through 10 will focus on the Southern
Star Zone. The phases may not be mined sequentially, with the LOM mining schedule focused
on returning the highest NPV.
Mount Milligan’s experience to date, through its mining and milling experience and its on-going
close reconciliation between the block model and actual mill production reconciliation data,
considers dilution to be relatively insignificant and therefore it is not included for planning and
scheduling. This is also based on the deposit’s typically very gradational ore/waste boundaries
and the attention to, and management of, blast movement.
Centerra Gold Inc. – Mount Milligan Mine
Technical Report NI 43-101 – March 22, 2017 Page 16-10
The Mineral Reserve for the mining phases is shown in Table 16-4.
TABLE 16-4 MAIN ZONE AND SS PHASES – MINERAL RESERVE FOR HEAD GRADES, RECOVERIES AND CONCENTRATE GRADES
DEVELOPMENT OF MINING PHASES The current LOM Plan consists of eight phases, building off the previous two phases which are
now complete. Current mining and ore feed is taking place in Phase 3.
The spatial arrangements of the current Phase 3 topography and remaining Phase 4 through
Phase 10 topography are illustrated in Figure 16-5 and Figure 16-6, respectively.
Centerra Gold Inc. – Mount Milligan Mine
Technical Report NI 43-101 – March 22, 2017 Page 16-11
FIGURE 16-5 END OF YEAR 2016 TOPOGRAPHY Source: Centerra, 2017. Gridlines are 500m, elevations in metres.
Centerra Gold Inc. – Mount Milligan Mine
Technical Report NI 43-101 – March 22, 2017 Page 16-12
FIGURE 16-6 MAJOR MINING PHASES Source: Centerra, 2017. Gridlines are 500m, elevations in metres.
Centerra Gold Inc. – Mount Milligan Mine
Technical Report NI 43-101 – March 22, 2017 Page 16-13
MINE PRODUCTION SCHEDULE MINING PLAN – ORE AND WASTE ANNUAL PRODUCTION Mount Milligan Mine site staff, together with Centerra corporate office staff, reviewed and
developed multiple iterations for the annual budgeting process. Production schedules were
developed to evaluate impacts of ore blending, waste scheduling, metal delivery and economic
impacts. Annual tonnage and grade statistics were calculated from tabulations of bench average
grades and bench waste tonnage totals by category within each mining phase. TSF building and
waste disposal requirements were a governing guide to insure mill tailings disposal requirements
will be achievable. Final scheduling assumptions incorporate the following mill feed throughput:
• 2017 at 59,600 t/d
• 2018 at 60,700 t/d
• 2019 onward at 62,500 t/d
Total ore and waste will be mined at an average rate of 44 Mt/a for years 2017 through 2031
decreasing to 31 Mt/a from years 2032 through 2038, when waste production steadily falls off,
yielding an overall LOM waste/ore ratio of 0.77:1.0.
A blending strategy to deliver an overall average mill feed of 0.188% Cu to yield a marketable
23% Cu concentrate was achieved through the orderly bench by bench sequencing, by phases,
from the mine phase designs.
Ongoing construction material for TSF embankments will be sourced from overburden, NAG
waste rock and oxide-weathered rock. The overburden and NAG rock can be used for all
downstream (outside) embankment mass fills. Weathered and oxide material will be used for
constructing the upstream (inside) portion of the TSF. All PAG material will be placed inside the
facility, either in the PAG Separator Dykes, the PAG dump (interior to the TSF), the PCC and
Eskers access roads or other areas inside the facility where it will be submerged by tailings or
water at the conclusion of operations.
ANNUAL METAL PRODUCTION IN CONCENTRATE Annual statistics for copper and gold recoveries, to concentrate, were derived from a
comprehensive metallurgical test work program conducted on locked-cycle testing of drill core
collected at the Main and SS Zones (2009 Report), with recent adjustments based on data
Centerra Gold Inc. – Mount Milligan Mine
Technical Report NI 43-101 – March 22, 2017 Page 16-14
compiled since start-up. Test results were modelled to predict the relationship among head
grades, recoveries and concentrate grades from regression equations such that each 15 m block
would be assigned a specific value for concentrate grades and metal recoveries.
Over the approximate 22 year remaining mine life, a total of 496.2 Mt of ore grading 0.19% Cu
and 0.36 g/t Au will be milled yielding an average LOM recovery of 78.7% Cu and 67.6% Au.
Overall metal production in payable product, will total 1.545 billion lb of copper and 3.854 million
oz of gold. Metal production statistics are presented Table 16-5.
TABLE 16-5 AVERAGE ANNUAL TONNAGE, GRADE, RECOVERIES, AND PAYABLE METAL PRODUCTION
ANNUAL MINING PLANS Annual mining plans were developed showing the development of benches for the Main and SS
pits for year ends 2017 through Year 2038. The pit advances and the TSF construction maps are
shown for selected end of year periods (2016, 2017, 2018, 2021, 2025, 2032, 2038 end of mining).
The following figures illustrate the pit and TSF construction advances through the mine production
schedule in Figure 16-7 through to Figure 16-13.
Average Concentrate Production
Average Payable Cu
Average Payable Au
Cu Au Cu Au Cu Cu Au(%) (g/t) (%) (%) ('000 t) (MM lbs) ('000 oz)
PROCESS CONTROL AND INSTRUMENTATION The plant control system consist of a Distributed Control System (DCS) with PC-based Operator
Interface Stations (OIS) located in two separate control rooms: one in the primary crusher station
and one in the main administration building, alongside the mine dispatch center. The plant control
rooms are staffed by trained personnel 24 hours per day.
Centerra Gold Inc. – Mount Milligan Mine
Technical Report NI 43-101 – March 22, 2017 Page 18-1
18 PROJECT INFRASTRUCTURE TAILING STORAGE FACILITY – WASTE MATERIAL MANAGEMENT Mining and placement of overburden, non-acid generating (NAG) sulphide rock, weathered,
and oxide rock from the mine are integrated at the TSF with the construction of the south,
southeast, northeast, and north embankments, PCC, Eskers Road and WSB. Delivery of PAG
rock for sub-aqueous storage at the TSF will be integrated in the cleaner/scavenger tailing
PAG Separator Dyke and bulk storage area within the TSF. Residual overburden will be
stockpiled in the WSB laydown area and material remaining after construction requirements
are met in any time period will be placed in storage areas that meet long-term containment
requirements.
The mine crew and mining equipment is used to deliver, spread and compact embankment
building materials. Seasonal restrictions will be in place during winter and spring melt periods
for core building activities. No seasonal restrictions are applied to the mine crew who deliver
overburden and rock to the upstream and downstream sections of the embankments.
WASTE SEGREGATION Waste from the open pit is separated into categories based on soil, extent of oxidation and
acid generation/metal leaching potential (ARD/ML) and later combined based on destination:
• topsoil (stripped from the tailing area, open pits and plant site);
• overburden (primarily glacial tills, alluvial sands and gravels);
• weathered and oxide waste rock;
NAG waste rock, and
• PAG waste rock.
Sulphide rock classification has been based on the neutralizing potential ratio (NPR) from acid
based accounting (ABA) analyses and identifies as NAG and PAG rock.
ABA estimation uses the assay results of the acid generating potential (AP) of sulphur and the
neutralizing potential (NP). NP divided by AP gives a resultant NPR estimate which is
Centerra Gold Inc. – Mount Milligan Mine
Technical Report NI 43-101 – March 22, 2017 Page 18-2
interpolated within the ore control model and material placed within the TSF according to their
prescribed categories as follows:
• NAG >2
• PAG <2
All waste rock with a NPR less than 2 is treated as PAG.
The final general arrangement of the Main Zone and SS open pits and the TSF is illustrated in
Figure 18-1.
FIGURE 18-1 TAILING STORAGE FACILITY – FINAL ARRANGEMENT YEAR 2038 Source: Centerra, 2017. Gridlines are 500m, elevations in metres.
Centerra Gold Inc. – Mount Milligan Mine
Technical Report NI 43-101 – March 22, 2017 Page 18-3
TAILING EMBANKMENT STAGED CONSTRUCTION The South Embankment will be expanded in stages across King Richard Creek Valley while
the Southeast and Northeast Embankments will be constructed along the eastern plateau
towards the Esker lakes. The North Embankment will be extended westerly through the Esker
deposit and link with the WSB. Confinement between the plant site and TSF will be provided
initially by natural topography, with the WSB extending south in the later years. The peripheral
length of the enclosed embankments will be 10,700 m with a maximum embankment height of
100 m at the South Embankment. Embankments will be raised on an annual basis using the
centreline method of construction.
The PCC and Eskers road will be constructed from weathered and oxide waste rock and
overburden, NAG and PAG rock from the open pit and will follow the staged construction
elevations of the embankments. Provision for cleaner and scavenger tailing pipelines will be
made along the PCC length as well as haul truck access to the North, Northeast and Southeast
Embankments. The Eskers road will permit access to the East and South embankments for
construction.
The WSB will be constructed at the western edge of the TSF across King Richard Creek to
provide containment between the TSF and the Main Zone pit while operating as a water-
retaining structure. On the west side of the WSB, surplus overburden will be placed to develop
a laydown area, to fill a surface depression, and to direct runoff into the TSF.
The PAG Separator Dyke will be developed within the King Richard Creek Valley with PAG
material hauled from the open pits. It will extend easterly and then abut against the Eskers
road to form a containment cell for PAG cleaner tailing.
In the final years of operation the cleaner tailing will be re-routed and discharged into the Main
Zone pit, thereby allowing a scavenger tailing cap to be placed over the PAG Separator Dyke
and the cleaner tailing cell prior to submergence by the supernatant pond.
Tailings deposition is discussed further in Section 17.
Centerra Gold Inc. – Mount Milligan Mine
Technical Report NI 43-101 – March 22, 2017 Page 18-4
OTHER INFRASTRUCTURE Mount Milligan Mine is accessible by commercial air carrier to Prince George, British Columbia,
then by vehicle from the east via Mackenzie on the Finlay Philip Forest Service Road and the
North Philip Forest Service Road, and from the west via Fort St. James on the North Road and
Rainbow Forest Service Road. Road travel to Mount Milligan Mine is 770 km from Prince
Rupert and 253 km from Prince George. The forestry-based communities of Mackenzie and
Fort St. James are within daily commuting distance of the mine, and both of these communities
are serviced by rail.
The infrastructure at Mount Milligan Mine includes a concentrator, a TSF and reclaim water
ponds, as described above, an administrative building and change house, a
truckshop/warehouse, a permanent operations residence, a first aid station, an emergency
vehicle storage, a laboratory, and sewage and water treatment facilities. The power supply is
provided by B.C. Hydro via a 91 km hydroelectric power line. Concentrate is transported by
truck from the Project site to Mackenzie, transferred onto railcars of the Canadian National
Railway to existing port storage facilities of Vancouver Wharves in North Vancouver and
loaded as lots into bulk ore carriers. Concentrate is then shipped to customers via ocean
transport.
Centerra Gold Inc. – Mount Milligan Mine
Technical Report NI 43-101 – March 22, 2017 Page 19-1
19 MARKET STUDIES AND CONTRACTS MARKETABILITY Mount Milligan Mine is strategically located for delivery to Asian custom smelters and the
concentrate analysis is low in deleterious impurities such as arsenic, antimony, bismuth,
chlorine, and fluorine. The presence of significant gold and payable silver values has been
welcomed by custom smelters and has proven to be a positive factor when negotiating sales
contracts, particularly with South Korea, Philippines and Japan. In general, smelters located
in China have offered less favourable terms for the recovery of gold and thus is a less attractive
market for the Mount Milligan concentrates. Delivery to North American smelters is also a
possibility; however the logistic costs are not as favourable as bulk transport to Asia so this
would be an unlikely outcome.
CONTRACTS CONCENTRATE SALES Copper-gold concentrate produced by the Mount Milligan Mine is sold to various smelters and
off-take purchasers. Centerra, through its subsidiary, is currently party to three multi-year
concentrate sales agreements for the sale of copper-gold concentrate produced at Mount
Milligan Mine. Pursuant to these agreements, Centerra has agreed to sell an aggregate of
approximately 100,000 t in 2017, 90,000 t in 2018 and 40,000 t in 2019.
Pricing under these concentrate sales agreements will be determined by reference to specified
published reference prices during the applicable quotation periods. Payment for the
concentrate will be based on the price for the agreed copper and gold content of the parcels
delivered, less smelting and refining charges and certain other deductions, if applicable. The
copper smelting and refining charges are negotiated in good faith and agreed by the parties
for each contract year based on terms generally acknowledged as industry benchmark terms.
The gold refining charges are as specified in the agreements.
Remaining concentrate produced at the Mount Milligan Mine will be sold under short-term
contracts or on a spot basis. Centerra may also choose to enter into another multi-year
concentrate sales agreement, if appropriate, given the mine’s expected concentrate
production.
Centerra Gold Inc. – Mount Milligan Mine
Technical Report NI 43-101 – March 22, 2017 Page 19-2
The commitments under the current multi-year concentrate sales agreements cover
approximately 74 to 80% of the expected concentrate production in 2017 and are also less
than the total expected production in 2018 and beyond. Centerra intends to either extend the
current multi-year agreements as the terms expire, or may enter into additional multi-year sales
agreements. To the extent that production is expected to exceed the volume committed under
these agreements, Centerra will sell the additional volume under short-term contracts or on a
spot basis.
Centerra Gold Inc. – Mount Milligan Mine
Technical Report NI 43-101 – March 22, 2017 Page 20-1
20 ENVIRONMENTAL STUDIES, PERMITTING, AND SOCIAL OR COMMUNITY IMPACT Environmental programs and initiatives are essential to mine success. Mount Milligan Mine’s
environmental permit requirements are implemented in accordance with conditions of the
permits and other regulatory approvals. The Mount Milligan Mine was specifically designed
with a limited spatial footprint and environmental impacts generally occur within that
footprint. Centerra continues to interact with local communities, First Nations and stakeholders
to educate on and improve its environmental performance.
All design, engineering, construction, operation and management of mine facilities and
components incorporates criteria for responsible management of process flows, effluent and
waste products to meet established capture and containment guidelines and permit
requirements. Environmental protection, as well as operational safety and maintenance
requirements, are incorporated into the design of the plant processes, as well as in the
transportation, storage, and disposal of materials within and outside the boundaries of the
plant.
As part of the Environmental, Health and Safety Management System, all employees and
contractors working on the site are provided environmental training to develop awareness of,
and facilitate compliance with, site environmental requirements.
ENVIRONMENTAL ISSUES Environmental impacts and their associated mitigations were considered at the beginning of
the original Project plan. These impacts and mitigations have been approved in various
certificates, permits and management plans with implementation either complete or
significantly underway.
This updated plan contains no activities that change the existing environmental considerations
or materially alter the success of any mitigations that are currently underway or in place. No
additional environmental studies are expected with this updated plan.
Centerra Gold Inc. – Mount Milligan Mine
Technical Report NI 43-101 – March 22, 2017 Page 20-2
WASTE DISPOSAL, MONITORING AND WATER MANAGEMENT The pit waste material is being used for the construction of the TSF and WSB embankments,
the PCC and the PAG Separator Dyke (which separates the cleaner and scavenger tailing
areas). Material remaining after construction requirements are met in any time period will be
placed in storage areas that meet long-term containment requirements.
The main TSF embankment is being constructed in stages using annual raises throughout the
LOM, from low permeability glacial till, overburden and waste rock materials from stripping
operations at the open pit and borrow areas within and near the TSF. With the use of
overburden and NAG waste rock for downstream TSF embankment construction this
eliminates the need for conventional waste rock dumps. Delivery of PAG and oxide/weathered
waste rock to the interior of the TSF and Main Zone pit, once depleted, ensures secure
underwater disposal.
Tailings from the mill are being delivered by gravity to the TSF for as long as possible. Each
delivery pipeline has been sized to carry up to 100% of the design scavenger tailing production
from the circuit. One of the three delivery pipelines is required for use at all times while allowing
for maintenance work to be completed on the other two pipelines. Discharge into the TSF will
be from valved off-takes along the pipeline.
A series of pumps transfer water from active mining bench sumps for discharge into the TSF.
The Project has implemented, prior to construction and continuing in operations, surface water
and groundwater monitoring to ensure that there is no off-site impact of the mining operation.
The Project generates an annual water quality report that describes the monitoring program
and results for a variety of parameters.
As per requirement of the Mine Plan M-236, TCM submitted a revision to its 5-Year
Reclamation Plan in 2014. Pursuant to the 2014-2019 revision to the Reclamation Plan, the
most recent estimate of the undiscounted and uninflated cost of reclamation is $28.3 million
(C$36.8 million). The Mount Milligan Mine currently has a posted reclamation bond in the
amount of $23.1 million (C$30 million).
Centerra Gold Inc. – Mount Milligan Mine
Technical Report NI 43-101 – March 22, 2017 Page 20-3
Environmental and other management plans are updated annually or semi-annually as
necessary and are submitted to applicable regulatory ministries for review and or approval as
part of an adaptive management process.
PROJECT PERMITTING As more particularly described in this updated plan, all necessary permitting requirements to
operate the mine have been applied for and have been approved by the applicable regulatory
agencies.
SOCIAL OR COMMUNITY REQUIREMENTS In 2006, Terrane initiated a consultation program with local communities and First Nations. In
May 2008, Terrane convened a Community Sustainability Committee of community
stakeholders and First Nations as the primary mechanism for ongoing engagement and to
maximize regional benefits from the mine. The Committee continues to meet on a quarterly
basis. Terrane drafted, and the Community Sustainability Committee approved, a
Sustainability Management Plan for the Project which remains in place.
Centerra, through its wholly owned subsidiary, TCM, is also party to a Socio Economic
Agreement with the McLeod Lake Indian Band and an IBA with Nak’azdli Whut’en. These
agreements contemplate the payment of funds to these First Nations groups, and such
amounts have been incorporated into the economic analysis in this Technical Report.
Centerra Gold Inc. – Mount Milligan Mine
Technical Report NI 43-101 – March 22, 2017 Page 21-1
21 CAPITAL AND OPERATING COSTS Total operating costs over the LOM are estimated at $4.5 billion (including $1.1 billion for
mining costs, $2.2 billion for milling costs, $0.8 billion for administrative costs and $0.3 billion
for transportation costs), total selling and marketing costs are estimated at $127 million, total
treatment and refining charges are estimated at $489 million and total capital expenditures are
estimated at $534 million, as shown in Table 21-1.
TABLE 21-1 LOM OPERATING COSTS AS OF JANUARY 1, 2017
Costs Summary Total $ M
Mining 1,080 Milling 2,249
Admin 806
Transportation 347
Selling and Marketing 127
Treatment and Refining 489
Capital 534
The following material assumptions have been used in the LOM plans, estimates of operating
and capital costs and Mineral Reserve estimates:
• A gold price of $1,200/oz,
• A copper price of $2.95/lb,
• Exchange rate: US$1: C$1.30;
• Diesel fuel price assumption: $0.66/litre delivered to site.
• Electrical Pricing of $0.052/kWh (C$0.068/kWh).
The diesel price includes the British Columbia carbon tax and freight to the onsite tank farms
at Mount Milligan. Diesel fuel is sourced from the Prince George distribution terminal and
correlates well with world oil prices. The diesel fuel price assumptions were made when the
price of oil was approximately WTI $55 per barrel.
Centerra Gold Inc. – Mount Milligan Mine
Technical Report NI 43-101 – March 22, 2017 Page 21-2
Based on the operating cost experience to date, and anticipating changing haulage costs over
the LOM associated with the deepening of the main pit in phases 1 through 4 and with mining
the more distant Southern Star, the LOM plan operating costs are summarized in Table 21-2.
Note that the British Columbia mineral taxes in Table 21-2 are based on a gold price of
$1,200/oz and a copper price of $2.95/lb, as assumed for the Mineral Reserve estimation
process.
The all-in sustaining cost, on a by-product basis, per ounce sold, which includes TSF
construction capital but does not include growth capital or the revenue based tax, averages
$427/oz of gold for the period from 2017 to the end of the LOM.
All-in cost, on a by-product basis, per ounce sold, including exploration and taxes averages
$489/oz of gold for the period from 2017 to the end of the LOM.
All-in sustaining cost, on a by-product basis and all-in cost, on a by-product basis, including
exploration are non GAAP measures. See “Non-GAAP Measures” at the beginning of this
Technical Report.
The capital cost forecast shown in Table 21-2 for the LOM plan is further broken down in Table
21-3. The total LOM capital expenditures required to exploit the Mineral Reserves in the LOM
plan is estimated at $534 million, which includes total sustaining capital amounts of nearly
$487 million and growth capital of $46 million. The growth capital consists of costs for the
recovery improvement projects budgeted in 2018.
Mill operating costs average $4.53/t from 2017 to 2038 as shown in Table 21-2. Mill capital
costs are $62 million as shown in Table 21-3. This includes both sustaining and growth capital
costs. The sustaining capital costs reflect the age of the mill and equipment replacement
required to maintain the planned operating availability of 92%.
TABLE 21-2 LOM PLAN - OPERATING AND CAPITAL COST FORECAST
Note: All ounces produced are presumed sold in the same calendar year Although the Mineral Reserve statement doesn’t list silver grades, silver credits have been estimated from the gold/silver ratio and are based on historical values.
Units 2017-2019 2020-2022 2023-2025 2026-2028 2029-2031 2032-2034 2035-2037 2038 Total
smelter treatment charges, and royalty and streaming arrangements in determining
economic viability.
MINING AND MINERAL RESERVES
• The Mineral Reserve estimate has been prepared utilizing acceptable estimation
methodologies and the classification of Proven and Probable Reserves conform to CIM
definitions and NI 43-101.
• The Mineral Reserve estimate was developed through the construction of an ultimate
open pit design within the Mineral Resource model at cost estimates defined in Section
15, Table 15-1 and the reserve spot metal price assumptions of $2.95/lb copper and
$1,200/oz gold.
• The Proven and Probable Mineral Reserve totals 496.2 Mt at 0.187% Cu and 0.361 g/t
Au containing 2.05 billion lb of copper and 5.76 million oz of gold.
Centerra Gold Inc. – Mount Milligan Mine
Technical Report NI 43-101 – March 22, 2017 Page 25-2
• The Mineral Reserve estimate takes into consideration metallurgical recoveries,
concentrate grades, transportation costs, smelter treatment charges, and royalty and
streaming arrangements in determining economic viability.
• The Mineral Reserve estimate is classified as 51.8% Proven and 48.2% Probable.
• The methodology used for mine planning, ore control, pit limit determination, production
sequence and scheduling, and estimation of equipment/manpower requirements is in
line industry practice.
MINERAL PROCESSING
• The metallurgical test work and 2017 recovery models meet industry standards.
• New performance models have been produced to predict expected performance based
on a re-evaluation of historical information and an adjustment to the model based on
current operating information. This performance model is used in years 2017 to 2019
in the new mine model but undergoes improvement through capital expenditure to a
second model as detailed in the metallurgy section.
• In addition to the secondary crushing of the SAG feed material, it will be necessary to
modify the secondary grinding, primary and cleaner flotation areas to achieve LOM
performance models.
• There is a risk in achieving the LOM performance model due to the tight time frame in
accomplishing the required plant modifications. In addition there is a further risk that
these improvements may not provide the desired outcome.
ECONOMIC ANALYSIS
• The total net cash flow discounted at 5% amounts to $1,157 million dollars after
accounting for all operating costs, capital expenditures related to the open pit operation,
the Haslinger NSR and Streaming Agreement with Royal Gold and taxes payable to
the provincial and federal governments.
• Due to the long life of the Mount Milligan Mine, the LOM NPV5% is most sensitive to a
change in discount rate. After discount rate, a change in operating cost assumptions
has the highest effect on NPV.
Centerra Gold Inc. – Mount Milligan Mine
Technical Report NI 43-101 – March 22, 2017 Page 25-3
RISKS AND MITIGATION Centerra defines risk as as an uncertainty that, if it occurs, may have a positive or negative
effect on the outcome of the company's objectives.
Risk treatment workshops for the Mount Milligan Technical report were undertaken in order to
determine the risk profile for the Technical Report. Technical and non-technical risks were
considered which are directly related to the LOM. The result of the workshop was the
identification of 16 risks, their causes and impacts, and the category to which they belong.
The risk process identified two ”extreme severity” threats and five “high severity” threats where
risk mitigation plans were considered for this Technical Report. Table 25-1 is a brief discussion
for each of these seven risks and includes any mitigation.
Centerra Gold Inc. – Mount Milligan Mine
Technical Report NI 43-101 – March 22, 2017 Page 25-4
TABLE 25-1 RISK ANALYSIS SUMMARY
Project Element Issue Likelihood Mitigation Infrastructure Forest fire could have a catastrophic
impact. Possible impacts include loss of life, prolonged, significant power interruptions at the mine site, damage and destruction of mining and milling infrastructure and interruption of business continuity.
Possible 1. Firefighting training 2. Comprehensive evacuation
strategy at mine site 3. Multiple exits from mine site 4. Fire break around camps 5. Concrete buildings 6. Weather station on site for
monitoring of fire danger 7. Lightning monitors
Tailings dam failure could have a catastrophic impact. Possible impacts could be loss of life, production reductions or interruptions, reputational damage, and severe long-term environmental degradation.
Unlikely 1. Third party independent annual review of dam structure and integrity
2. Inundation study 3. Third party QC during dam
construction 4. Daily dam inspections 5. Designed by qualified engineer 6. Segmented construction of
tailings 7. Glacio-lacustrine
investigation/confirmation. Pit wall instability could have a major
impact. Possible impacts are loss of life, loss of production and loss of equipment.
Possible 1. Structural mapping and modelling 2. Movement monitoring 3. Pit slope stability analysis 4. Dewatering 5. Controlled blasting 6. Third party independent annual
review Process Insufficient water to operate the mill
could have a high impact. Possible impact is to reductions to the mill throughput and recovery.
Possible 1. Review and updates to water balance
2. Utilization of tower drains 3. Meadows Creek supply station 4. Alternative water sources
investigation 5. Addition of thickener in mill for
water recovery
Centerra Gold Inc. – Mount Milligan Mine
Technical Report NI 43-101 – March 22, 2017 Page 25-5
Project Element Issue Likelihood Mitigation Life of Mine Plan Inability to achieve LOM throughput
could have a high impact. Impact could include lower cash flow and lower production.
Possible 1. Availability of comprehensive and reliable throughput model
2. Preventative maintenance program
3. Continuous Improvement initiative
4. Geomet model
Inability to achieve LOM recovery could
have a high impact. Impact could result in lower cash flow and less metal produced.
Possible 1. Availability of a comprehensive and reliable recovery model
2. Continuous Improvement initiative
3. Geomet model
Metal prices lower than financial model could have a high impact. Impact could result in decreased revenues.
Possible 1. Hedging metal prices 2. Mining Sequencing 3. Cost reduction strategies
Centerra Gold Inc. – Mount Milligan Mine
Technical Report NI 43-101 – March 22, 2017 Page 26-1
26 RECOMMENDATIONS In order to achieve the current performance model and to transition to the LOM performance
model, it is recommended that
• the mill continue its program of integrating the new secondary crushing circuit into the
comminution circuit to increase the throughput and efficiency of the SAG mill
• that the mill conduct a test program and study to determine the measures and capital
required to improve the following areas:
o secondary grinding and cyclone classification
o cleaner flotation circuit capacity and performance
o primary flotation circuit capacity and performance
o mill circuit water quality and temperature
• geometallurgical test work be continued to define what opportunities exist to deliver the
ore, or ore blend, most responsive to the current plant setup. This test work would use
Geofloat samples and geometallurgical analysis.
The integration program is covered by the operations budget while approximately $2.1 million
(C$2.7 million) should be allocated for test and study work for the measures and capital
improvement. The geometallurgical program, which is partially covered by the operational
budget, together with $0.23 million (C$0.30 million) for outside consultants, could play a
significant role in optimizing mill throughput and recovery by better defining ore types and
characteristics.
Historical interpretation of geology, alteration and structure are currently being used in the
2017 Geology Block Model, however, potential improvements and updates to these models,
in conjunction with the Mt. Milligan Geometallurgical Program, are currently being investigated
by Centerra staff.
Develop a program of geotechnical investigations to assess the potential impacts of structural
features and groundwater flows and pressures on highwall stability.
Centerra Gold Inc. – Mount Milligan Mine
Technical Report NI 43-101 – March 22, 2017 Page 26-2
Continue with regular monitoring programs and annual third party inspections of the TSF and
downstream areas to ensure continued long term stability of the facility.
RISKS AND OPPORTUNITIES There may be also be further opportunities to increase throughput once primary grinding has
been optimized. This includes the potential to push the tonnage to 70 kt/d. This however would
require the addition of substantial grinding capacity in the form of a third ball mill because even
if the pre-crushing would allow the SAG mill to maintain the transfer size, the grind would go
pass 260 μm.
There is also the option of adding a gold cyanidation circuit to the discharge of the cleaner tails
circuit. Some preliminary test work indicates a potential to recover value from fine liberated
and partially liberated material. This circuit would have to handle approximately 10% of the
plant throughput mass. Although no grinding would be required, the required circuit would
consist of; thickener on the cleaner scavenger tails, a cyanidation circuit together with carbon
treatment and gold recovery circuit. Without test work and no engineering, the cost of this
approach is difficult to ascertain. At a throughput of 7,000 tpd, the capital cost of this circuit
would likely be approximately $40 M.
Centerra Gold Inc. – Mount Milligan Mine
Technical Report NI 43-101 – March 22, 2017 Page 27-1
27 REFERENCES The following documents were referenced in the preparation of this document and the 2009
Report. A.R. MacPherson Consultants Ltd., 1995-05, Grindability Study on Two Samples of Mount
Americas Limited for Placer Dome Inc., May 2006, Report #149582. Barker, D.J. and Associates, 1990-07 Pre-Feasibility Study, Hallam Knight Piésold Ltd., Knight
and Piésold Limited, Melis Engineering Ltd., Pacific Western Communications Ltd, Wright Engineers Limited
Blanchflower, J. D., Exploration report on the Mt. Milligan Property, Unpublished consultant’s
report to Lincoln Resources Inc., 26p. Boliden-Allis, 1990-07, Grindability Test Report. Continental Gold Corp., 1990-07, Pre-Feasibility Study (Appendices). Continental Gold Corp., 1991. Mt. Milligan Project, Stage I Report, internal Continental Gold
Corp, (a subsidiary of Placer Dome Inc.) report. Continental Gold Corp., 1991-05, Summary of Stage I Report. Contract Support Services Inc., 1995-05, Final Report, Results of Simulation Testing, Mt.
Milligan Project, Grinding Circuit Analysis. Contract Support Services Inc., 2007-01, Final Report to Terrane Metals Corp. – Results of
Mt. Milligan Feasibility Simulation Study. Deyell, C.L. and Tosdal, R.M., 2004, Alkalic Cu-Au Deposits of British Columbia: Sulfur Isotope
Zonation as a Guide to Mineral Exploration in Geological Field work 2004, BC Ministry of Energy, Mines and Petroleum Resources, Paper 2005-1, pages 191–208.
Ditson, G. M., 1997, Geological and Physical Work on the Mt. Milligan Property, Unpublished
assessment report. EIMCO Process Equipment, 1990-09, Thickening and Filtration Tests. Fonseca, A., 2005, Report on Diamond Drilling on Mt. Milligan Property, North-Central British
Columbia, Assessment report submitted to the BC Ministry of Energy Mines and Petroleum Resources.
Centerra Gold Inc. – Mount Milligan Mine
Technical Report NI 43-101 – March 22, 2017 Page 27-2
G&T Metallurgical Services Ltd., 1997-07, Model Analysis of Four Ore Types – A Technical
Brief. G&T Metallurgical Services Ltd., 2005-07, Canada The Metallurgical Response of Mount
Milligan Ores – A Program of Laboratory and Pilot Plant Studies – Technical Report. G&T Metallurgical Services Ltd., 2007-11, Canada The Metallurgical Response of Mount
Milligan Ores/A Program of Laboratory and Pilot Plant Studies/KM2008 – Technical Report.
Report, Omenica Mining District, British Columbia, Prepared for Terrane Metals Corp. Knight Piésold Limited, 1991-02, Preliminary Overview of Water Balance and Fresh Water
Requirements for Tailings Area C. Knight Piésold Consulting Engineers, 1991-08, Design of Water Storage Dam Report
No.1678/1. Knight Piésold Consulting Engineers, 1991-08, Technical Specifications Form of Tender
Drawings Site Inspection Manual. Knight Piésold memo, dated May 14, 2009, titled “Mt. Milligan Project – Updated Feasibility Pit
Slope Design.” KWM Consulting, Canada, 2007-02, Memo – Grinding Mill Sizing for Mt. Milligan Project. Lakefield Research, 1989-01, An Investigation of The Recovery of Gold and Copper - Process
Report No. 1. Lakefield Research, 1990-04, An Investigation of The Recovery of Gold and Copper - Process
Report No. 2. Lakefield Research, 1990-07, An Investigation of The Recovery of Gold and Copper - Process
Report No. 3. Lakefield Research, 1990-09, An Investigation of The Recovery of Gold and Copper - Process
Technical Report NI 43-101 – March 22, 2017 Page 27-3
Lakefield Research, 1990-09, A Preliminary Investigation of The Environmental Impact of Tailing Samples - Progress Report No. 6.
Lakefield Research, 1990-10, An Investigation of The Recovery of Gold and Copper – Process
Report No. 7. Lakefield Research, 1990-10, Raw Assay Data - Addendum Progress – Report No. 4. Lustig, G., 2006, Technical Report on the Mt. Milligan Project, Omenica Mining District, British
Columbia, Prepared for Atlas Cromwell Ltd. Lustig, G., Labrenz, D., and O’Brien, D., 2007, Technical Report on the Mt. Milligan Project,
Omenica Mining District, British Columbia, Prepared for Terrane Metals Corp. Maxwell Geoservices, Database Compilation Summary, Terrane Metals SQL Database,
Unpublished Consultants Report to Terrane Metals Corp., Melis Engineering Ltd., 1990-08, Pre-Feasibility Study. Melis Engineering Ltd., 1990-10, Mt. Milligan Pilot Plant Thickening and Filtration Tests, 1990-
10. Nelson, J., Bellefontaine, K., Green, K., and Maclean, 1991, Regional geological mapping near
the Mt. Milligan Copper-Gold Deposit; in Geological Fieldwork, 1990, B.C. Ministry of Energy, Mines and Petroleum Resources, Paper1991-1, pages 89-110.
O’Hearn, Tim., 1991-04, Bench Composite Column Leaching Study of Mt. Milligan Waste
Rock. Min Drainage and Extractive Metallurgy Applied Biology Division. Panteleyev, A., 1995, Porphyry Cu-Au: Alkalic, in Selected British Columbia Mineral Deposit
Profiles, Volume 1 - Metallics and Coal, Lefebure, D.V. and Ray, G.E., Editors, British Columbia Ministry of Energy of Employment and Investment, Open File 1995-20, pages 83-86.
Placer Dome Inc., 1990-10, Bench Scale Grinding, Flotation and Cyanide Testing on No. 66
Zone Samples - Report No. 2. Placer Dome Inc., 1991, Mt. Milligan Project, Pre-feasibility Study, six volumes, Placer Dome
Inc. internal report. Placer Dome Inc., 1991-06, Bench Scale Grinding and Flotation Tests on MBX, SIX, WBX and
Southern Star Zone Drill Core Reject Samples – Report No. 3 Volume I of IV. Placer Dome Inc., 1991-06, Bench Scale Grinding and Flotation Tests on MBX, SIX, WBX and
Southern Star Zone Drill Core Reject Samples – Report No. 3 Volume II of IV. Placer Dome Inc., 1991-06, Bench Scale Grinding and Flotation Tests on MBX, SIX, WBX and
Southern Star Zone Drill Core Reject Samples – Report No. 3 Volume III of IV. Placer Dome Inc., 1991-06, Bench Scale Grinding and Flotation Tests on MBX, SIX, WBX and
Southern Star Zone Drill Core Reject Samples – Report No. 3 Volume IV of IV.
Centerra Gold Inc. – Mount Milligan Mine
Technical Report NI 43-101 – March 22, 2017 Page 27-4
Placer Dome Inc., 1991-06, Pilot Plant Testwork on Maxi-Q Ore and Southern Star Zone Ore
- Report No. 4. Placer Dome Inc., 1991-11, Optimization Alternatives Site C and Site A. Placer Dome Inc.,
1992-01, Metallurgical Test Results – Report No. 5. Placer Dome Inc., 1992-08, Investigation of the Factors Contributing to the Drop in Gold Grade
from the Acquisition Study to the Pre-Feasibility Study. Placer Dome Inc., 1996-02, Mt Milligan Project Evaluation. Placer Dome Inc., 1997-10, Project Review in Support of a Pre-feasibility Study. Placer Dome
Inc., 1998-05, Economic Study Volume 1 – Business Report. Placer Dome Inc., 1998-05, Economic Study Volume 2 – Technical Report.
Placer Dome Inc., 2000-01, Bench Scale Evaluation of Various Flotation Circuit Arrangements
and Testwork on Mt. Milligan Resample V279 Composite SS, WBX & 66 Zones – Report No. 7.
Flotation Studies on Half Split NQ Drill Core & Flotation Response on Blend Mill Feed Using the Optimized Flowsheet and Flotation Variables – Report No. 8.
Placer Dome Inc., 2000-01, Copper Concentrate Production, Bench Scale Gravity/Flotation
Tests, Reagent Testing, Neutralizing Power of Scavenger Tailings, & Magnetic Separation Tests on Mt. Milligan 1/2 Drill Core Resample V279 – Report No. 7.
Placer Dome Inc., 2001-01, Feasibility Study and Project Development Report. Placer Dome Technical Services Ltd., 1991-08, Pre-Feasibility Study Volume 3 – Metallurgy. Placer Dome Technical Services Ltd., 1991-08, Pre-Feasibility Study Volume 4 – General
Matters. Placer Dome Technical Services Ltd., 1991-08, Pre-Feasibility Study Volume 5 – Cost
Estimates. Rebagliati, C. M., 1987, 1986-1987 Summary Report, Mt. Milligan Property, Unpublished
Lincoln Resources Inc company report. Rebagliati, C. M., 1988, Assessment report, Mt. Milligan Property, Assessment report
submitted to the BC Ministry of Energy Mines and Petroleum Resources. Rebagliati, C. M., 1989, Assessment Report, Mt. Milligan Property, Assessment report
submitted to the BC Ministry of Energy Mines and Petroleum Resources. Rebagliati, C. M., 1990, Summary Report, Mt. Milligan Project, unpublished consulting report
for Continental Gold Corp.
Centerra Gold Inc. – Mount Milligan Mine
Technical Report NI 43-101 – March 22, 2017 Page 27-5
Richards J. P., 2003, Tectono-Magmatic Precursors for Porphyry Cu-(Mo-Au) Deposit Formation; in Economic Geology, December 1, 2003 vol. 98 no. 8 1515-1533, doi:10.2113/gsecongeo.98.8.1515.
Schiarizza, P. and Boulton, A., 2005, Geology and mineral occurrences of the Quesnel
Terrane, Canim Lake Area (NTS 09P/15), South-central British Columbia; in Geological Field work 2004, BC Ministry of Energy, Mines and Petroleum Resources, Paper 2006-1, pages 163–184.
Sketchley, D. A., Nowak, M. and Verly, G., 1996, Mt. Milligan Project Evaluation – Volume 1 –
Inc., 2007-01, Historical Test Work Review. Wardrop Engineering Inc., 2008: Technical Report – Feasibility Mt. Milligan Property, Northern
BC, (Doc. No. 0652590200-REP-R0015-01), filed on SEDAR by Terrane Metals Corp. on April 14, 2008.
Wardrop, A Tetra Tech Company, 2009: Feasibility Update Study Mt. Milligan Property –
Northern BC, (Doc. No. 0952590100-REP-R0009-00), filed on SEDAR by Terrane Metals Corp. on October 23, 2009.
Warner, L., and Turnbull, P., 1992, Diamond drilling assessment report for the Milligan 1, 2, 4,
5 Mineral Claims, Assessment report submitted to the BC Ministry of Energy Mines and Petroleum Resources.
Warner, L. M., and Campbell, T. J., 1992, A geological, geochemical and diamond drilling
report on the Mt. Milligan Claims, internal Placer Dome Inc. company report. Wright Engineers Ltd., 1989-04, Project Analysis. Various internal mine plan and production spreadsheets as well as mine designs prepared by
Mount Milligan mine planning staff.
Centerra Gold Inc. – Mount Milligan Mine
Technical Report NI 43-101 – March 22, 2017 Page 28-1
28 DATE AND SIGNATURE PAGE This report titled Technical Report – Mount Milligan Mine – North-Central British Columbia and
dated March 22, 2017 (with an effective date of December 31, 2016) was prepared and signed
by the following authors:
(Signed) “Peter Andrews” Dated at Fort St James, BC Peter Andrews March 22, 2017 Chief Mine Engineer Mount Milligan Mine APEGBC Registered Member, Licence 24942 (Signed & Sealed) “Doug Berthelsen” Dated at Fort St James, BC Doug Berthelsen, P.Geo March 22, 2017 Chief Geologist Mount Milligan Mine APEGBC Registered Member, Licence 31777 (Signed & Sealed) “Ignacy A. Lipiec” Dated at Vancouver, BC March 22, 2017 Ignacy A. Lipiec, P. Eng. Technical Director, Process Amec Foster Wheeler Americas Limited APEGBC Registered Member, Licence 23976
Centerra Gold Inc. – Mount Milligan Mine
Technical Report NI 43-101 – March 22, 2017 Page 29-1
29 CERTIFICATE OF QUALIFIED PERSON PETER ANDREWS I, Peter Andrews, as an author of this report entitled “NI 43-101 Technical Report–Mount Milligan Mine, North-Central British Columbia,” dated March 22 2017 (with an effective date of December 31, 2016) (“Report”) prepared for Centerra Gold Inc. (the “Issuer”), do hereby certify that:
1. I am currently employed as Chief Mine Engineer of the Mount Milligan mine at Thompson Creek Metals Company Inc. a wholly owned subsidiary of the Issuer, located at 1 University Avenue, Ste. 1500, Toronto, Ontario, M5J 2P1.
2. This certificate applies to the technical report entitled “NI 43-101 Technical Report–Mount Milligan Mine, North-Central British Columbia” dated March 22, 2017 (with an effective date of December 31, 2016) (the “Technical Report”).
3. I graduated from the Queen’s University in Kingston, ON with a Bachelor of Science degree (BSc) in Mining Engineering in 1995. I have 23 years of experience in mining engineering and operations, having worked in mining operations involving gold, copper, iron ore and coal. I have held senior and chief engineering positions for mines in Canada, with responsibility over the development, review, implementation, and oversight of mine planning, project management, economic analyses and technical reports.
4. I am a Registered Member in good standing of the Association of Professional Engineers and Geoscientists of British Columbia, License No. 24942.
5. I have am familiar with National Instrument 43-101– Standards of Disclosure for Mineral Projects (“NI 43-101”) and by reason of my education, affiliation with a professional association (as defined in NI 43-101) and past relevant work experience, I fulfill the requirements of a “qualified person” for the purposes of NI 43-101.
6. I am responsible for the preparation of Sections 1 to 5, inclusive, Sections 15 and 16, and Sections 18 to 28 inclusive and Section 30, of the Technical Report.
7. I am not independent of the Issuer as described in section 1.5 of NI 43-101, as I am an employee of a subsidiary of the Issuer. .
8. I have been involved with the Mount Milligan mine, subject of the Technical Report, since February 2015 in my capacity as Senior Mine Engineer and Chief Mine Engineer.
9. I currently work onsite at the Mount Milligan mine, subject of the Technical Report and interface regularly with management, operations and field inspections.
10. I have read NI 43-101 and the parts of the Technical Report for which I am responsible have been prepared in compliance with NI 43-101.
11. As of the effective date of the Technical Report, to the best of my knowledge, information and belief, the parts of the Technical Report for which I am responsible contain all scientific and technical information that is required to be disclosed to make the Technical Report not misleading.
Dated this 22nd day of March 2017 at Mount Milligan Mine, Fort St James, British Columbia.
(Signed) “Peter Andrews” Peter Andrews, P.Eng. Chief Mine Engineer of Mount Milligan Mine
Centerra Gold Inc. – Mount Milligan Mine
Technical Report NI 43-101 – March 22, 2017 Page 29-2
DOUG BERTHELSEN I, Doug Berthelsen, P. Geo., as an author of this report entitled “NI 43-101 Technical Report–Mount Milligan Mine, North-Central British Columbia,” dated March 22, 2017 (with an effective date of December 31, 2016) prepared for Centerra Gold Inc. (the “Issuer”), do hereby certify that:
1. I am currently employed as the Chief Geologist of Mount Milligan mine at Thompson Creek Metals Company Inc., a wholly owned subsidiary of the Issuer located at1 University Avenue, Ste. 1500, Toronto, Ontario, M5J 2P1 .
2. This certificate applies to the technical report entitled “NI 43-101 Technical Report–Mount Milligan Mine, North-Central British Columbia” dated March 22, 2017 (with an effective date of December 31, 2016) (the “Technical Report”).
3. I graduated from the University of British Columbia with a Bachelor of Science degree (BSc) in Geology in 1985. I have worked as a Geologist for a total of 28 years since my graduation from university in gold, silver and copper mineral exploration and underground and surface mining operations.
4. I am a Registered Member in good standing of the Association of Professional Engineers and Geoscientists of British Columbia, License No. 31777.
5. I am familiar with National Instrument 43-101 - Standards of Disclosure for Mineral Projects (“NI 43-101”) and by reason of my education, affiliation with a professional association (as defined in NI 43-101) and past relevant work experience, I fulfill the requirements of a “qualified person” for the purposes of NI 43-101.
6. I am responsible for the preparation of Sections 6 to 12, inclusive, and Section 14 of the Technical Report.
7. I am not independent of the Issuer as described in section 1.5 of NI 43-101, as I am an employee of a subsidiary of the Issuer.
8. I have been involved with the Mount Milligan mine, subject of the Technical Report, since August, 2014, and have been Chief Geologist since March, 2015.
9 I currently work onsite at the Mount Milligan mine, subject of the Technical Report and interface regularly with management, operations and field inspections.
10. I have read NI43-101 and the parts of the Technical Report for which I am responsible have been prepared in compliance with NI 43-101.
11. As of the effective date of the Technical Report, to the best of my knowledge, information and belief, the parts of the Technical Report for which I am responsible contain all scientific and technical information that is required to be disclosed to make the Technical Report not misleading.
Dated this 22nd day of March 2017 at Mount Milligan Mine, Fort St James, British Columbia.
(Signed & Sealed) “Doug Berthelsen” Doug Berthelsen P.Geo. Chief Geologist of Mount Milligan Mine
Centerra Gold Inc. – Mount Milligan Mine
Technical Report NI 43-101 – March 22, 2017 Page 29-3
CERTIFICATE OF QUALIFIED PERSON
Ignacy A. Lipiec, P.Eng. 111 Dunsmuir St., Suite 400
Vancouver, British Columbia, V6B 5W3 1. I, Ignacy A. Lipiec, P.Eng., am employed as the Technical Director, Process with Amec Foster
Wheeler Americas Limited.
2. This certificate applies to the technical report titled “Technical Report, Mount Milligan Mine, North-Central British Columbia” dated March 22, 2017 (with an effective date of December 31, 2016 (the “Technical Report”).
3. I am a Professional Engineer of The Association of Professional Engineers and Geoscientists of British Columbia, License No. 23976. I graduated from the University of British Columbia with a B.A.Sc. from Mining and Mineral Process Engineering in 1985.
4. I have practiced my profession for 32 years. I have been directly involved in lab test work and supervision, mill construction, commissioning and operation, and in studies and detailed engineering for mineral processing plants. My experience has primarily been in base and precious metals handling unit operations design from crushing to tailings deposition.
5. As a result of my experience and qualifications, I am a Qualified Person as defined in National Instrument 43–101 Standards of Disclosure for Mineral Projects (NI 43–101).
6. I have last visited the Mount Milligan Mine Property for two days from January 10, 2017 to January 12, 2017.
7. I am responsible for sections 13 and 17 of the Technical Report. 8. I am independent of the Issuer, as independence is described by Section 1.5 of NI 43–101.
9. I have read NI 43–101 and the sections of the Technical Report for which I am responsible have been prepared in compliance with that NI 43-101.
10. As of the effective date of the Technical Report, to the best of my knowledge, information and belief, the sections of the Technical Report for which I am responsible contain all scientific and technical information that is required to be disclosed to make those section of the technical report not misleading.
“Signed and sealed”
Ignacy Lipiec, P.Eng.
Dated: 22 March 2017
Centerra Gold Inc. – Mount Milligan Mine Technical Report NI 43-101 – March 22, 2017 Page 30-1
30 APPENDIX A GLOSSARY Units Of Measure
Canadian Dollars ................................................................................................................ C$ Centimetre .......................................................................................................................... cm Degree .................................................................................................................................. ° Degrees Celsius ................................................................................................................. °C Dry metric ton ................................................................................................................... dmt Gram .................................................................................................................................... g Grams per tonne ................................................................................................................. g/t Greater than ......................................................................................................................... > Hectare (10,000 m2) ........................................................................................................... ha Inch ....................................................................................................................................... " Kilo (thousand) ...................................................................................................................... k Kilogram .............................................................................................................................. kg Kilometre ............................................................................................................................ km Kilotonne .............................................................................................................................. kt Kilotonne or 1000 Tonnes .......................................................................................... Ktonnes Kilowatt .............................................................................................................................. kW Kilowatt hour .................................................................................................................... kWh Kilowatt hours per tonne (metric ton) ............................................................................. kWh/t Less than .............................................................................................................................. < Litre ...................................................................................................................................... L Megawatt .......................................................................................................................... MW Metre ................................................................................................................................... m Metric ton (tonne) .................................................................................................................. t Micron ............................................................................................................................... µm Millimetre .......................................................................................................................... mm Million .................................................................................................................................. M Million tonnes ..................................................................................................................... Mt Million tonnes per year ..................................................................................................... Mt/a Minute (plane angle) ............................................................................................................... ' Ounce .................................................................................................................................. oz Parts per billion ................................................................................................................ ppb Parts per million .............................................................................................................. ppm Percent ................................................................................................................................ % Pound(s) ............................................................................................................................... lb
Centerra Gold Inc. – Mount Milligan Mine
Technical Report NI 43-101 – March 22, 2017 Page 30-2
Specific gravity .................................................................................................................. SG Square kilometre .............................................................................................................. km2 Square metre ...................................................................................................................... m2 Thousand tonnes .................................................................................................................. kt Three dimensional .............................................................................................................. 3D Tonne (1,000 kg) ................................................................................................................... t Tonnes per day ................................................................................................................... t/d Tonnes per hour ................................................................................................................. t/h Tonnes per year ................................................................................................................. t/a United States Dollar ......................................................................................................... US$ Wet metric ton .................................................................................................................. wmt Year (annum)........................................................................................................................ a
Centerra Gold Inc. – Mount Milligan Mine
Technical Report NI 43-101 – March 22, 2017 Page 30-3
ABBREVIATIONS AND ACRONYMS Acid base accounting ....................................................................................................... ABA Acid generating potential .................................................................................................... AP Acid rock drainage ........................................................................................................... ARD Acme Analytical Laboratories Ltd .................................................................................. Acme Acquisition of TCM by Centerra .............................................................................. Acquisition Aerodat Limited ........................................................................................................... Aerodat AMEC Earth and Environmental Inc. ............................................................................ AMEC Amec Foster Wheeler Americas Limited ............................................... Amec Foster Wheeler Atlas Cromwell Ltd. ........................................................................................... Atlas Cromwell Atomic absorption spectrophotometer .............................................................................. AAS Barrick Gold Corporation ............................................................................................. Barrick BP Resources Canada Ltd ................................................................................ BP Resources British Columbia ................................................................................................................ BC Bulk Leach Extractable Gold ........................................................................................... BLEG Centerra Gold Inc. .............................................................................................................. CG Coarse ore stockpile ......................................................................................................... COS Compressive strength ........................................................................................................ CS Continental Gold Corp. ........................................................................................ Continental Copper ............................................................................................................................... Cu DASS No. 39 Holdings Ltd............................................................................................. DASS Deeper downfaulted portion of WBX ............................................................................. DWBX Distributed Control System ............................................................................................... DCS Double-deck ....................................................................................................................... DD Dry mass in air ................................................................................................................... MA Eco-Tech Laboratories ............................................................................................ Eco-Tech Factor of safety ................................................................................................................. FOS G & T Metallurgical Services Ltd ...................................................................................... G&T General and administrative .............................................................................................. G&A Geographic information system ......................................................................................... GIS Gold .................................................................................................................................... Au Goldcorp Inc ............................................................................................................. Goldcorp Golder Associates Ltd. .................................................................................................. Golder High gold low copper ..................................................................................................... HGLC Impact Benefit Agreement .................................................................................................. IBA Independent Mining Consultants ...................................................................................... IMC Induced polarity ................................................................................................................... IP Inductively coupled plasma – atomic emission spectroscopy .................................... ICP-AES Inductively coupled plasma – mass spectrometry ....................................................... ICP-MS Knight Piésold Consulting Inc. ............................................................................................ KP
Centerra Gold Inc. – Mount Milligan Mine
Technical Report NI 43-101 – March 22, 2017 Page 30-4
Laboratory information management system ................................................................... LIMS Life-of-mine ..................................................................................................................... LOM Lincoln Resources Inc ................................................................................................. Lincoln Magnetite breccia ............................................................................................................ MBX Mass in water ................................................................................................................... MW Mineral Environments Laboratories ............................................................................. Min-En Mineral liberation analyzer ................................................................................................ MLA Mineral Titles Online BC ................................................................................................. MTO Ministry of Energy Mines and Petroleum Resources (BC) .......................................... MEMPR Mobile Metal Ion ............................................................................................................... MMI Mount. Milligan Project .......................................................................................... the Project Mount. Milligan Mine .................................................................................................. the mine Mount Milligan Project ......................................................................................... the Property National Instrument 43-101....................................................................................... NI43-101 Net Present Value ........................................................................................................... NPV Net Smelter Return .......................................................................................................... NSR Neutralization potential ratio ............................................................................................ NPR Neutralizing potential ......................................................................................................... NP Non-acid generating ........................................................................................................ NAG Operator Interface Stations ................................................................................................ OIS Pechiney Development Ltd. ...................................................................................... Pechiney Pipeline Corridor Causeway ............................................................................................. PCC Placer Dome Inc. ................................................................................................ Placer Dome Placer Dome Research Centre ..................................................................................... PDRC Point load testing .............................................................................................................. PLT Potassium amyl xanthate ................................................................................................. PAX Potentially acid generating ............................................................................................... PAG Qualified Person ................................................................................................................. QP Quality assurance/quality control ................................................................................. QA/QC Quantile-quantile ............................................................................................................... QQ Real time kinematic .......................................................................................................... RTK Rock quality .................................................................................................................... RQD Rotating biological contactor ............................................................................................ RBC Royal Gold Inc. ....................................................................................................... Royal Gold Run-of-mine .................................................................................................................... ROM SAG mill/ball mill/crusher ............................................................................................... SABC Selco Inc. ....................................................................................................................... Selco Silver .................................................................................................................................. Ag Soil gas hydrocarbon ........................................................................................................ SGH Southern Star ..................................................................................................................... SS Standards Council of Canada .......................................................................................... SCC
Centerra Gold Inc. – Mount Milligan Mine
Technical Report NI 43-101 – March 22, 2017 Page 30-5
Stream agreement with Royal Gold ........................................................... Stream Agreement Tailing Storage Facility ..................................................................................................... TSF Terrane Metals Corp. .................................................................................................. Terrane Three dimensional .............................................................................................................. 3D Unconfined compressive strength .................................................................................... UCS United Lincoln Resources Inc. .......................................................................... United Lincoln Very low frequency ........................................................................................................... VLF Wardrop Engineering Inc. .......................................................................................... Wardrop Western margin of MBX stock ........................................................................................ WBX West Separator Berm ...................................................................................................... WSB World Gold Council ......................................................................................................... WGC