Mountain hare transcriptome and diagnostic markers as resources to monitor hybridization with European hares Marques, J., Ferreira, M., Farelo, L., Callahan, C., Hackländer, K., Jenny, H., Montgomery, W., Reid, N., Good, J., Alves, P. C., & Melo-Ferreira, J. (2017). Mountain hare transcriptome and diagnostic markers as resources to monitor hybridization with European hares. Scientific Data, 4, [170178 ]. https://doi.org/10.1038/sdata.2017.178 Published in: Scientific Data Document Version: Publisher's PDF, also known as Version of record Queen's University Belfast - Research Portal: Link to publication record in Queen's University Belfast Research Portal Publisher rights Copyright 2017 the authors. This is an open access article published under a Creative Commons Attribution License (https://creativecommons.org/licenses/by/4.0/), which permits unrestricted use, distribution and reproduction in any medium, provided the author and source are cited. General rights Copyright for the publications made accessible via the Queen's University Belfast Research Portal is retained by the author(s) and / or other copyright owners and it is a condition of accessing these publications that users recognise and abide by the legal requirements associated with these rights. Take down policy The Research Portal is Queen's institutional repository that provides access to Queen's research output. Every effort has been made to ensure that content in the Research Portal does not infringe any person's rights, or applicable UK laws. If you discover content in the Research Portal that you believe breaches copyright or violates any law, please contact [email protected]. Download date:18. Feb. 2022
Transcript
Mountain hare transcriptome and diagnostic markers as resources tomonitor hybridization with European hares
Marques, J., Ferreira, M., Farelo, L., Callahan, C., Hackländer, K., Jenny, H., Montgomery, W., Reid, N., Good,J., Alves, P. C., & Melo-Ferreira, J. (2017). Mountain hare transcriptome and diagnostic markers as resources tomonitor hybridization with European hares. Scientific Data, 4, [170178 ]. https://doi.org/10.1038/sdata.2017.178
Published in:Scientific Data
Document Version:Publisher's PDF, also known as Version of record
Queen's University Belfast - Research Portal:Link to publication record in Queen's University Belfast Research Portal
Publisher rightsCopyright 2017 the authors.This is an open access article published under a Creative Commons Attribution License (https://creativecommons.org/licenses/by/4.0/),which permits unrestricted use, distribution and reproduction in any medium, provided the author and source are cited.
General rightsCopyright for the publications made accessible via the Queen's University Belfast Research Portal is retained by the author(s) and / or othercopyright owners and it is a condition of accessing these publications that users recognise and abide by the legal requirements associatedwith these rights.
Take down policyThe Research Portal is Queen's institutional repository that provides access to Queen's research output. Every effort has been made toensure that content in the Research Portal does not infringe any person's rights, or applicable UK laws. If you discover content in theResearch Portal that you believe breaches copyright or violates any law, please contact [email protected].
Data Descriptor: Mountain haretranscriptome and diagnosticmarkers as resources to monitorhybridization with European haresJoão P. Marques1,2, Mafalda S. Ferreira1,2, Liliana Farelo1, Colin M. Callahan3,Klaus Hackländer4, Hannes Jenny5, W. Ian Montgomery6,7, Neil Reid6,7, Jeffrey M. Good3,Paulo C. Alves1,2 & José Melo-Ferreira1,2
We report the first mountain hare (Lepus timidus) transcriptome, produced by de novo assembly of RNA-sequencing reads. Data were obtained from eight specimens sampled in two localities, Alps and Ireland.The mountain hare tends to be replaced by the invading European hare (Lepus europaeus) in their numerouscontact zones where the species hybridize, which affects their gene pool to a yet unquantified degree. Wecharacterize and annotate the mountain hare transcriptome, detect polymorphism in the two analysedpopulations and use previously published data on the European hare (three specimens, representing theEuropean lineage of the species) to identify 4 672 putative diagnostic sites between the species. A subset of85 random independent SNPs was successfully validated using PCR and Sanger sequencing. These valuablegenomic resources can be used to design tools to assess population status and monitor hybridizationbetween species.
1CIBIO, Centro de Investigação em Biodiversidade e Recursos Genéticos, InBIO Laboratório Associado,Universidade do Porto, Vairão 4485-661, Portugal. 2Departamento de Biologia, Faculdade de Ciências do Porto,Porto 4169-007, Portugal. 3Division of Biological Sciences, University of Montana, 32 Campus Drive, Missoula, MT59812, USA. 4Institute of Wildlife Biology and Game Management, BOKU-University of Natural Resources andLife Sciences, Vienna 1180, Austria. 5Amt für Jagd und Fischerei Graubünden, Chur 7001, Switzerland. 6Instituteof Global Food Security, School of Biological Sciences, Queen’s University Belfast, Belfast BT9 5BN, UK. 7Schoolof Biological Sciences, Queen’s University Belfast, 97 Lisburn Road, Belfast BT9 7BL, UK. Correspondence andrequests for materials should be addressed to J.M.-F. (email: [email protected]).
OPEN
Received: 15 February 2017
Accepted: 13 October 2017
Published: 5 December 2017
www.nature.com/scientificdata
SCIENTIFIC DATA | 4:170178 | DOI: 10.1038/sdata.2017.178 1
Background & SummaryThe mountain hare (Lepus timidus) is an Arcto-alpine species that was the most common and widelydistributed hare species across Europe during the last glacial periods1. Nowadays, the mountain hare isdistributed from Fennoscandia to Eastern Siberia, but also occurs in isolated/refuge populations(e.g., Ireland, Scotland, the Alps, Poland, the Baltics and Japan), and in places where it has beenintroduced (Iceland, England, Faroe Islands and New Zealand) (see Fig. 1). Even though they are apopular game species and abundant within its range, mountain hares have sharply declined in someregions, particularly in areas of contact with the European hare (Lepus europaeus), where the latter tendsto invade and replace the range of the former1–4. Mountain and European hares share extensive naturaland human-induced contact zones in Western Europe, from the British Isles to Scandinavia and CentralEurope (Fig. 1). Climate change is predicted to affect lagomorphs extensively5,6 and, in particular, toaccelerate the replacement of mountain hares by European hares in the contact zones, such as the Alps,Sweden or Ireland7,8. The two species may hybridize when in contact, resulting in some geneticintrogression9–13, with potential effects on local adaptation14.
Even though the mountain hare and other hare species have been the subject of several populationgenetics studies, these have been mostly based on a few markers10,15–17. Therefore, permanent genomicresources provide fundamental information to develop monitoring tools to evaluate population statusand implement protective policies. In this work, we use high-throughput RNA sequencing to: i) generategenomic resources for the mountain hare; and, ii) use published data on the European hare18 to pinpointcandidate fixed differences between the species that can be used to build genotyping tools to monitor geneexchange in the contact zones. We here present the first mountain hare transcriptome, and the mostcomplete among the currently available European Lepus transcriptomes.
MethodsA summary of the methodological workflow is shown in the flowchart of Fig. 2.
Sampling procedure and locationsSpecimens from the Alps (see Fig. 1) were sampled during regular permit hunting in Grisons,Switzerland. Specimens from Ireland (see Fig. 1) were captured from the wild in Borris-in-Ossory, by theIrish Coursing Club (ICC) for scientific research purposes under National Parks & Wildlife (NPWS)licence No. C 337/2012 issued by the Department of Arts, Heritage and the Gaeltacht (dated 31/10/2012).
Figure 1. Approximate mountain and European hare distribution. Approximate distributions of the
mountain hare, Lepus timidus, and the European hare, L. europaeus, in Eurasia with indication of the areas of
contact and of broad geographic overlap between the species (distribution ranges were adapted from IUCN
Spatial Data Resources; IUCN 201651). Circles indicate the mountain hare sampling locations for this work
(open circle—Ireland; closed circle—Alps).
www.nature.com/sdata/
SCIENTIFIC DATA | 4:170178 | DOI: 10.1038/sdata.2017.178 2
Irish hares were dispatched humanely and in accordance with the licence conditions by means of lethalinjection administered by Mr William Fitzgerald, Veterinary Laboratory Service Follow (MVB MVMCertCSM), from the Department of Agriculture, Food and the Marine, Regional Veterinary Laboratory,Hebron Road, Kilkenny, R95 TX39. Total RNA was isolated from 8 individuals.
RNA extractionLiver tissue was freshly collected, immediately preserved in RNAlater and then stored at −80 °C untilRNA extraction. Prior to extraction, frozen samples were ground in liquid nitrogen with a ceramic mortarand pestle. Mortar and pestle were washed prior to extraction using a 6-step wash that includes thefollowing washing reagents in order: 70% ethanol, tap water, 10% bleach, milli-Q water, RNase away(Thermo Fisher Scientific) and finishing with molecular grade H2O. RNA extraction was performed usingRNeasy Mini Kit according to manufacturer instructions.
RNA sequencing library preparationThe SureSelect Strand-Specific RNA Library Prep for Illumina Multiplexed Sequencing (AgilentTechnologies) kit was used to prepare cDNA libraries for all samples. Library sizes were estimated using aBioanalyzer 2,100 and quantified using KAPA Library quantification kit (KAPA BIOSYSTEMS). Equalmolar concentrations of each library were pooled together for sequencing.
Sequence data processing and de novo transcriptome assemblyA detailed description of tools and commands used in the data analysis is shown in Table 1 (availableonline only). A first quality evaluation of obtained sequence reads (Data Citation 1) was performed withFastQC v0.11.519. After read quality inspection, adapters were removed and quality trimming performedusing TRIMMOMATIC v0.3620, with instructions to remove the first ten bases, Illumina adapters, readsbelow 25 bp long and bases in the ends of reads with quality below 10, and to perform a 4-base slidingwindow trimming and cutting fragments with an average quality below 10. Trimmed-read quality wasrechecked with FastQC (Data Citation 2). A de novo transcriptome assembly was then performed usingall properly paired reads from the eight individuals in the dataset using TRINITY v2.2.021, establishingRF as read orientation for a strand-specific assembly. In addition, as a complementary resource, de novotranscriptome assemblies for each of the two sampling localities were also performed. Transrate v1.0.322
was used to evaluate assembly quality and completeness and to remove possible chimeras and poorlysupported contigs. Cleaned reads were mapped back to the produced assembly and only the well-supported contigs were retained (Transrate optimal cut-off >0.024). In order to remove redundancyproduced by using multi-sample data to perform the assembly, all contigs were clustered using CD-HIT-EST v4.6.423 with a 95% similarity threshold. Open reading frames were predicted with TransDecoderv3.0.024 to remove possible contaminants such as non-coding RNA and DNA contamination. The finalfiltered transcriptome comprised contigs with predicted open reading frame and/or rabbit (Oryctolaguscuniculus) or pfam annotation. Filtered transcriptome as well as raw assemblies are available in Figshare(Data Citation 2).
Figure 2. Methodological workflow. Flowchart of the RNA-sequencing setup and data analysis steps.
Commands used in the analytical steps shown in bold are detailed in Table 1 (available online only).
www.nature.com/sdata/
SCIENTIFIC DATA | 4:170178 | DOI: 10.1038/sdata.2017.178 3
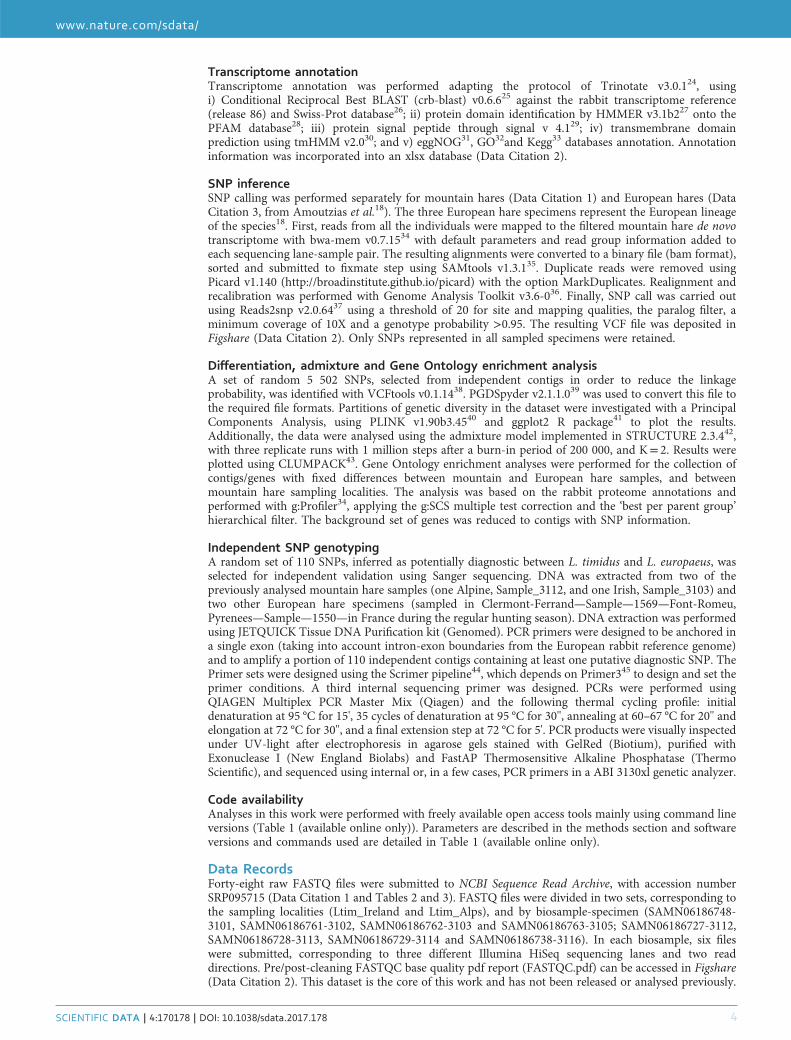
Transcriptome annotationTranscriptome annotation was performed adapting the protocol of Trinotate v3.0.124, usingi) Conditional Reciprocal Best BLAST (crb-blast) v0.6.625 against the rabbit transcriptome reference(release 86) and Swiss-Prot database26; ii) protein domain identification by HMMER v3.1b227 onto thePFAM database28; iii) protein signal peptide through signal v 4.129; iv) transmembrane domainprediction using tmHMM v2.030; and v) eggNOG31, GO32and Kegg33 databases annotation. Annotationinformation was incorporated into an xlsx database (Data Citation 2).
SNP inferenceSNP calling was performed separately for mountain hares (Data Citation 1) and European hares (DataCitation 3, from Amoutzias et al.18). The three European hare specimens represent the European lineageof the species18. First, reads from all the individuals were mapped to the filtered mountain hare de novotranscriptome with bwa-mem v0.7.1534 with default parameters and read group information added toeach sequencing lane-sample pair. The resulting alignments were converted to a binary file (bam format),sorted and submitted to fixmate step using SAMtools v1.3.135. Duplicate reads were removed usingPicard v1.140 (http://broadinstitute.github.io/picard) with the option MarkDuplicates. Realignment andrecalibration was performed with Genome Analysis Toolkit v3.6-036. Finally, SNP call was carried outusing Reads2snp v2.0.6437 using a threshold of 20 for site and mapping qualities, the paralog filter, aminimum coverage of 10X and a genotype probability >0.95. The resulting VCF file was deposited inFigshare (Data Citation 2). Only SNPs represented in all sampled specimens were retained.
Differentiation, admixture and Gene Ontology enrichment analysisA set of random 5 502 SNPs, selected from independent contigs in order to reduce the linkageprobability, was identified with VCFtools v0.1.1438. PGDSpyder v2.1.1.039 was used to convert this file tothe required file formats. Partitions of genetic diversity in the dataset were investigated with a PrincipalComponents Analysis, using PLINK v1.90b3.4540 and ggplot2 R package41 to plot the results.Additionally, the data were analysed using the admixture model implemented in STRUCTURE 2.3.442,with three replicate runs with 1 million steps after a burn-in period of 200 000, and K= 2. Results wereplotted using CLUMPACK43. Gene Ontology enrichment analyses were performed for the collection ofcontigs/genes with fixed differences between mountain and European hare samples, and betweenmountain hare sampling localities. The analysis was based on the rabbit proteome annotations andperformed with g:Profiler34, applying the g:SCS multiple test correction and the ‘best per parent group’hierarchical filter. The background set of genes was reduced to contigs with SNP information.
Independent SNP genotypingA random set of 110 SNPs, inferred as potentially diagnostic between L. timidus and L. europaeus, wasselected for independent validation using Sanger sequencing. DNA was extracted from two of thepreviously analysed mountain hare samples (one Alpine, Sample_3112, and one Irish, Sample_3103) andtwo other European hare specimens (sampled in Clermont-Ferrand—Sample—1569—Font-Romeu,Pyrenees—Sample—1550—in France during the regular hunting season). DNA extraction was performedusing JETQUICK Tissue DNA Purification kit (Genomed). PCR primers were designed to be anchored ina single exon (taking into account intron-exon boundaries from the European rabbit reference genome)and to amplify a portion of 110 independent contigs containing at least one putative diagnostic SNP. ThePrimer sets were designed using the Scrimer pipeline44, which depends on Primer345 to design and set theprimer conditions. A third internal sequencing primer was designed. PCRs were performed usingQIAGEN Multiplex PCR Master Mix (Qiagen) and the following thermal cycling profile: initialdenaturation at 95 °C for 15', 35 cycles of denaturation at 95 °C for 30'', annealing at 60–67 °C for 20'' andelongation at 72 °C for 30'', and a final extension step at 72 °C for 5'. PCR products were visually inspectedunder UV-light after electrophoresis in agarose gels stained with GelRed (Biotium), purified withExonuclease I (New England Biolabs) and FastAP Thermosensitive Alkaline Phosphatase (ThermoScientific), and sequenced using internal or, in a few cases, PCR primers in a ABI 3130xl genetic analyzer.
Code availabilityAnalyses in this work were performed with freely available open access tools mainly using command lineversions (Table 1 (available online only)). Parameters are described in the methods section and softwareversions and commands used are detailed in Table 1 (available online only).
Data RecordsForty-eight raw FASTQ files were submitted to NCBI Sequence Read Archive, with accession numberSRP095715 (Data Citation 1 and Tables 2 and 3). FASTQ files were divided in two sets, corresponding tothe sampling localities (Ltim_Ireland and Ltim_Alps), and by biosample-specimen (SAMN06186748-3101, SAMN06186761-3102, SAMN06186762-3103 and SAMN06186763-3105; SAMN06186727-3112,SAMN06186728-3113, SAMN06186729-3114 and SAMN06186738-3116). In each biosample, six fileswere submitted, corresponding to three different Illumina HiSeq sequencing lanes and two readdirections. Pre/post-cleaning FASTQC base quality pdf report (FASTQC.pdf) can be accessed in Figshare(Data Citation 2). This dataset is the core of this work and has not been released or analysed previously.
www.nature.com/sdata/
SCIENTIFIC DATA | 4:170178 | DOI: 10.1038/sdata.2017.178 4
Trinity raw assemblies (Ltimidus_Trinity.fasta, LtimidusIreland_Trinity.fasta and LtimidusAlps_Tri-nity.fasta) were deposited on Figshare (Data Citation 2 and Table 4). The curated transcriptome assemblyfasta files (LtimidusTranscriptome.cds.fasta and LtimidusTranscriptome.pep.fasta) and the annotateddatabase file (LtimidusTranscriptome.xlsx) can also be found in Figshare (Data Citation 2).
The European hare data used here (Data Citation 3) was previously published by Amoutzias et al.18
Mapping statistics (Table 5), SNP call VCF file (LtimVsLeur.vcf) and population/species diagnosticSNPs tables (Supplementary Tables 1) were deposited in Figshare (Data Citation 2).
Technical ValidationRNA integrityThe quality and quantity of each RNA sample was assessed using the 260/280 and 260/230 absorbanceratios estimated by an IMPLEN P330 NanoPhotometer and RNA Integrity Number (RIN) andconcentration (μg μl−1) with a Bioanalyzer 2,100 (Agilent Technologies). All samples had RIN valuesabove 8.
RNA-Seq data qualityThe Illumina HiSeq run produced a total raw output of 103 941 215 100 bp paired-end reads (207 882430 total reads). Adapter removal and quality trimming decreased this number to 201 569 448 reads(97%) (Table 4). Final analysed reads passed the minimum quality parameters as established by FastQC.
Transcriptome assembly curation, annotation and qualityCleaned reads were assembled into 272 183 contigs with a mean length of 594 bp and a N50 length of839 bp (Table 4). After assembly curation with Transrate optimal cut-off >0.024, clustering with a 95%similarity threshold and open reading frame prediction, were retained 25 868 transcripts with a meanlength of 842 bp and a N50 length of 1 182 (Table 4).
Annotation using a conditional reciprocal best blast hit approach results in 16 772 (65%) annotatedtranscripts, of which 13 641 were annotated to the rabbit transcriptome and 15 955 to the Swiss-Protdatabase (Fig. 3). In order to reduce the number of non-annotated transcripts, the less stringentunidirectional blast hit was added to the database. Hits were recovered for 25 549 transcripts (99%) (Fig. 3).
The mountain hare transcriptome produced in this study represents an important improvementcompared to the currently available transcriptomic resources for European Lepus—L. granatensis46 andL. europaeus18 transcriptomes—as it performs better on several assembly statistics, such as referencecoverage (42 versus 32% in L. granatensis and 40% in L. europaeus; using the rabbit transcriptome asreference).
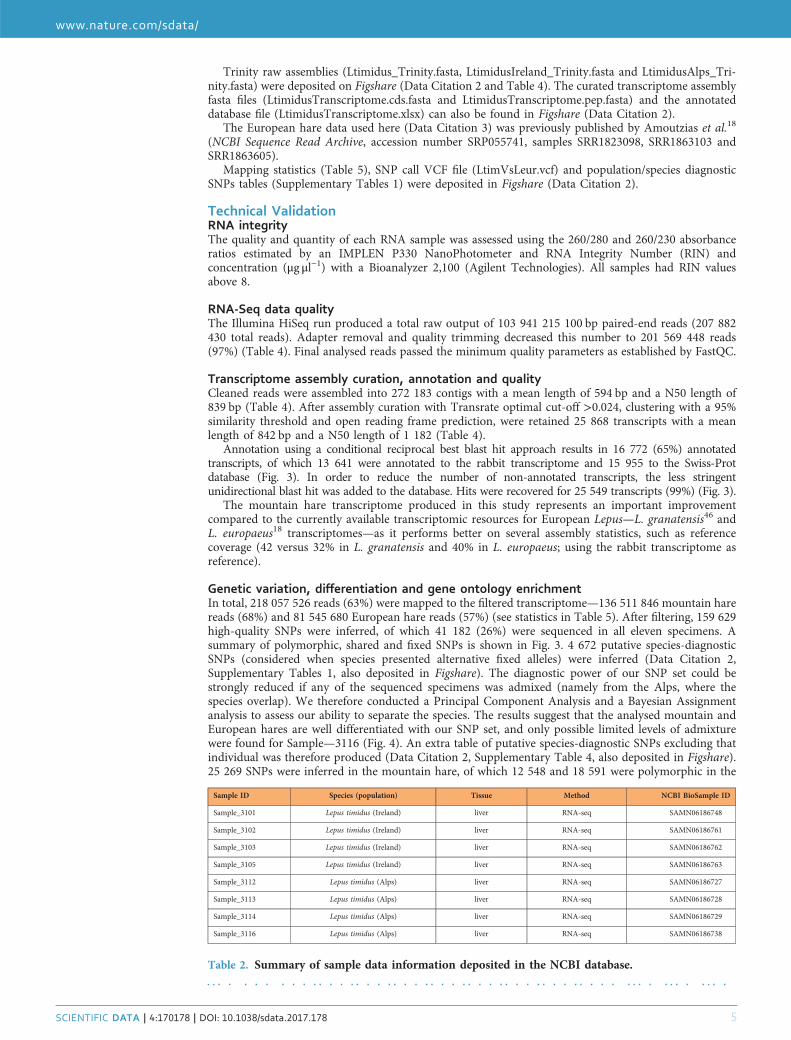
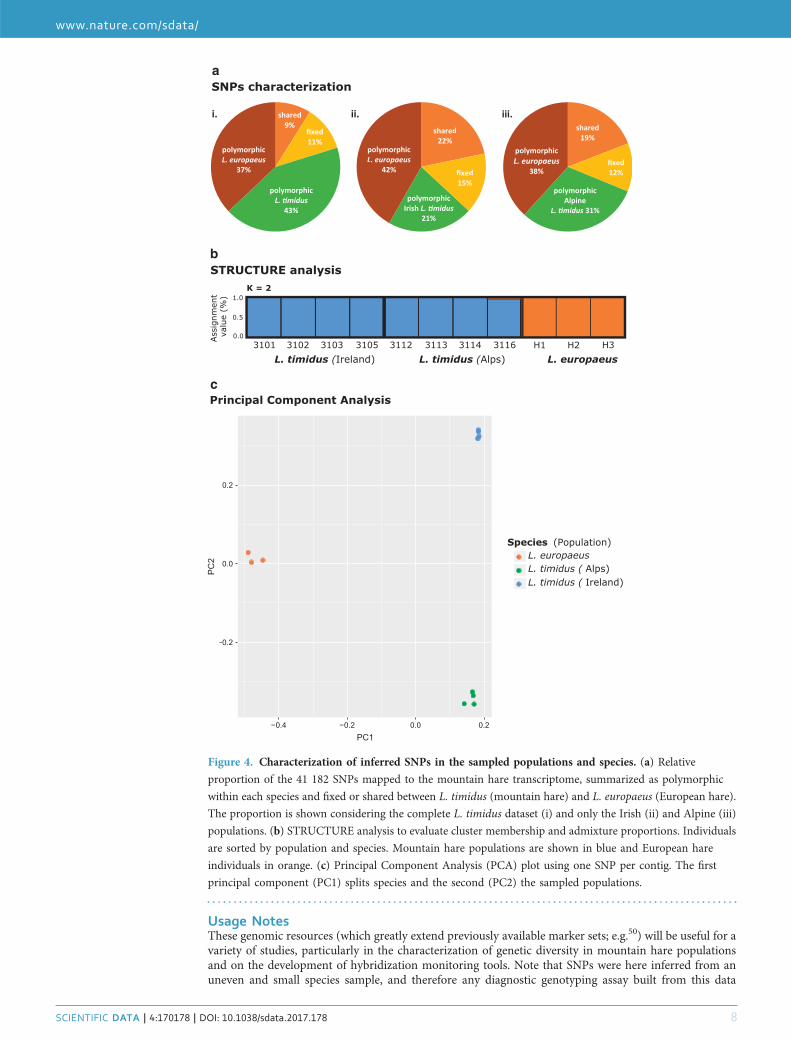
Genetic variation, differentiation and gene ontology enrichmentIn total, 218 057 526 reads (63%) were mapped to the filtered transcriptome—136 511 846 mountain harereads (68%) and 81 545 680 European hare reads (57%) (see statistics in Table 5). After filtering, 159 629high-quality SNPs were inferred, of which 41 182 (26%) were sequenced in all eleven specimens. Asummary of polymorphic, shared and fixed SNPs is shown in Fig. 3. 4 672 putative species-diagnosticSNPs (considered when species presented alternative fixed alleles) were inferred (Data Citation 2,Supplementary Tables 1, also deposited in Figshare). The diagnostic power of our SNP set could bestrongly reduced if any of the sequenced specimens was admixed (namely from the Alps, where thespecies overlap). We therefore conducted a Principal Component Analysis and a Bayesian Assignmentanalysis to assess our ability to separate the species. The results suggest that the analysed mountain andEuropean hares are well differentiated with our SNP set, and only possible limited levels of admixturewere found for Sample—3116 (Fig. 4). An extra table of putative species-diagnostic SNPs excluding thatindividual was therefore produced (Data Citation 2, Supplementary Table 4, also deposited in Figshare).25 269 SNPs were inferred in the mountain hare, of which 12 548 and 18 591 were polymorphic in the
Sample ID Species (population) Tissue Method NCBI BioSample ID
Table 2. Summary of sample data information deposited in the NCBI database.
www.nature.com/sdata/
SCIENTIFIC DATA | 4:170178 | DOI: 10.1038/sdata.2017.178 5
Irish and Alpine samples respectively, and 126 were fixed between sampling localities (Data Citation 2,Supplementary Tables 5, deposited in Figshare). The ‘membrane part’ gene ontology term was foundenriched in the collection of genes with fixed differences between the Irish and Alpine mountain haresamples, while terms ‘lipid metabolic process’, ‘small molecule catabolic process’, ‘extracellular space andacyl-CoA dehydrogenase activity’ were found enriched in genes with fixed differences between samples ofthe two species. Note however that even though the background gene set was controlled for, RNA-sequencing data does not provide an unbiased sample of information across different genes and theseresults may represent tissue-related functions.
Sample ID NCBI SRA runs accession Raw reads Mbytes
Sample_3101 SRR5133282 26,598,712 2,525
Sample_3102 SRR5133280 26,128,525 2,532
Sample_3103 SRR5133285 24,469,456 2,414
Sample_3105 SRR5133283 26,662,182 2,582
Sample_3112 SRR5133287 22,444,667 2,263
Sample_3113 SRR5133281 20,825,930 2,100
Sample_3114 SRR5133286 32,749,011 3,294
Sample_3116 SRR5133284 21,690,965 2,189
Table 3. Illumina RNA-seq data deposited in the NCBI database.
Lepus timidus transcriptome Value
Raw Reads 207,882,430
Clean Reads 201,569,448
Mapped Reads 136,511,846
Raw de novo assembly (Trinity)
Number of contigs 272,183
Largest (bp) 14,048
Smallest (bp) 201
N50 (bp) 839
Mean (bp) 594
Post assembly curation (TransRate)
Number of contigs 113,694
Largest (bp) 14,048
Smallest (bp) 201
N50 (bp) 801
Mean (bp) 567
Post redundancy removal (CD-HIT-EST)
Number of contigs 109,239
Largest (bp) 14,048
Smallest (bp) 201
N50 (bp) 765
Mean (bp) 554
Post open reading frame prediction (TransDecoder)
Number of contigs 25,868
Largest (bp) 13,728
Smallest (bp) 297
N50 (bp) 1,182
Mean (bp) 842
Reference Coverage (%) 42
Table 4. Mountain hare transcriptome assembly and curation statistics.
www.nature.com/sdata/
SCIENTIFIC DATA | 4:170178 | DOI: 10.1038/sdata.2017.178 6
SNP validationIndependent SNP genotyping was performed for a random subset of 110 putative species-diagnosticSNPs from different contigs. Technical validation was considered successful for SNPs showing theexpected alternative alleles, being one fixed in L. timidus (note that the sequenced L. europaeus specimensdiffered from the RNA-sequencing). PCR amplification was successful for 96 of the 110 target contigs(87%), 88 amplicons were successfully sequenced in both species (92%), and concordance betweensequences and expected SNPs was obtained for 85 of the sequenced fragments (97%). This represents anoverall validation success of 77%, which compares to studies using similar approaches47–49 (Data Citation2; see Supplementary Table 8 for full genotyping results, and Supplementary Table 9 with the list of allprimers, both deposited in Figshare). The reported accuracy of technical validation is conservative, as it isreduced by technical issues in PCR amplification and sequencing, and potential intraspecificpolymorphism in the European hare (given the use of two different samples for validation), in additionto real false positives. From the validated SNPs, 73 confirmed alternate alleles in the species, but theirdiagnostic utility should be tested with larger population sampling.
Sample ID Species (population) Raw reads # Mapped reads # Mapped reads %
Figure 3. Annotation summary. Number of transcripts annotated with different combinations of methods
and databases: all transcripts; transcripts annotated with crb-blast against rabbit transcriptome; transcripts
annotated with a unidirectional BLASTx against rabbit transcriptome; transcripts annotated with crb-blast
against the Swiss-Prot database; and transcripts annotated with a unidirectional BLASTx against the Swiss-Prot
database.
www.nature.com/sdata/
SCIENTIFIC DATA | 4:170178 | DOI: 10.1038/sdata.2017.178 7
Usage NotesThese genomic resources (which greatly extend previously available marker sets; e.g.50) will be useful for avariety of studies, particularly in the characterization of genetic diversity in mountain hare populationsand on the development of hybridization monitoring tools. Note that SNPs were here inferred from anuneven and small species sample, and therefore any diagnostic genotyping assay built from this data
Figure 4. Characterization of inferred SNPs in the sampled populations and species. (a) Relative
proportion of the 41 182 SNPs mapped to the mountain hare transcriptome, summarized as polymorphic
within each species and fixed or shared between L. timidus (mountain hare) and L. europaeus (European hare).
The proportion is shown considering the complete L. timidus dataset (i) and only the Irish (ii) and Alpine (iii)
populations. (b) STRUCTURE analysis to evaluate cluster membership and admixture proportions. Individuals
are sorted by population and species. Mountain hare populations are shown in blue and European hare
individuals in orange. (c) Principal Component Analysis (PCA) plot using one SNP per contig. The first
principal component (PC1) splits species and the second (PC2) the sampled populations.
www.nature.com/sdata/
SCIENTIFIC DATA | 4:170178 | DOI: 10.1038/sdata.2017.178 8
should be first tested with adequate sample sizes from pure parental populations of the species, beforebeing applied to hybrid zones.
References1. Thulin, C. G. The distribution of mountain hares Lepus timidus in Europe: A challenge from brown hares L. europaeus? Mamm.Rev. 33, 29–42 (2003).
2. Reid, N. & Montgomery, W. I. Is naturalisation of the brown hare in Ireland a threat to the endemic Irish hare? Biol. Environ.107, 129–138 (2007).
3. Reid, N. European hare (Lepus europaeus) invasion ecology: Implication for the conservation of the endemic Irish hare (Lepustimidus hibernicus). Biol. Invasions 13, 559–569 (2011).
4. Caravaggi, A., Montgomery, W. I. & Reid, N. Range expansion and comparative habitat use of insular, congeneric lagomorphs:invasive European hares Lepus europaeus and endemic Irish hares Lepus timidus hibernicus. Biol. Invasions 17, 687–698 (2015).
5. Leach, K., Kelly, R., Cameron, A., Montgomery, W. I. & Reid, N. Expertly validated models and phylogenetically-controlledanalysis suggests responses to climate change are related to species traits in the order Lagomorpha. PLoS ONE 10,e0122267 (2015).
6. Leach, K., Montgomery, W. I. & Reid, N. Biogeography, macroecology and species’ traits mediate competitive interactions in theorder Lagomorpha. Mammal Review 45, 88–102 (2015).
7. Acevedo, P., Jiménez-Valverde, A., Melo-Ferreira, J., Real, R. & Alves, P. C. Parapatric species and the implications for climatechange studies: A case study on hares in Europe. Glob. Chang. Biol. 18, 1509–1519 (2012).
8. Caravaggi, A. et al. Niche overlap of mountain hare subspecies and the vulnerability of their ranges to invasion by the Europeanhare; the (bad) luck of the Irish. Biol. Invasions 1–20, doi:10.1007/s10530-016-1330-z (2016).
9. Thulin, C. G., Jaarola, M. & Tegelstrom, H. The occurrence of mountain hare mitochondrial DNA in wild brown hares. Mol. Ecol.6, 463–467 (1997).
10. Thulin, C. G., Fang, M. & Averianov, A. O. Introgression from Lepus europaeus to L. timidus in Russia revealed by mitochondrialsingle nucleotide polymorphisms and nuclear microsatellites. Hereditas 143, 68–76 (2006).
11. Suchentrunk, F. et al. Introgressive hybridization in wild living mountain hares (L. timidus varronis) and brown hares (L.europaeus) and morphological consequences. Mamm. Biol. 70, 39–40 (2005).
12. Melo-Ferreira, J., Alves, P. C., Freitas, H., Ferrand, N. & Boursot, P. The genomic legacy from the extinct Lepus timidus to thethree hare species of Iberia: Contrast between mtDNA, sex chromosomes and autosomes. Mol. Ecol. 18, 2643–2658 (2009).
13. Zachos, F. E., Ben Slimen, H., Hackländer, K., Giacometti, M. & Suchentrunk, F. Regional genetic in situ differentiation despitephylogenetic heterogeneity in Alpine mountain hares. J. Zool. 282, 47–53 (2010).
14. Hughes, M., Reid, N., Montgomery, I. & Prodoehl, P. Verification of hybridisation between introduced European and nativeIrish hares. North. Irel. Environ. Agency Res. Dev. Ser. Irel. Environ. Agency Res. Dev. Ser. 11–11 (2011).
15. Hamill, R. M., Doyle, D. & Duke, E. J. Spatial patterns of genetic diversity across European subspecies of the mountain hare, Lepustimidus L. Heredity 97, 355–365 (2006).
16. Melo-Ferreira, J. et al. Recurrent introgression of mitochondrial DNA among hares (Lepus spp.) revealed by species-tree inferenceand coalescent simulations. Syst. Biol. 61, 367–381 (2012).
17. Melo-Ferreira, J. et al. Home-loving boreal hare mitochondria survived several invasions in Iberia: the relative roles of recurrenthybridisation and allele surfing. Heredity 112, 265–273 (2014).
18. Amoutzias, G. D. et al. SNP identification through transcriptome analysis of the european brown hare (Lepus europaeus): Cellularenergetics and mother’s curse. PLoS ONE 11, e0159939 (2016).
19. Andrews S. FastQC: a quality control tool for high throughput sequence data. Available online at: http://www.bioinformatics.babraham.ac.uk/projects/fastqc. 2010.
20. Bolger, A. M., Lohse, M. & Usadel, B. Trimmomatic: A flexible read trimming tool for Illumina NGS data. Bioinformatics 30,2114–2120 (2014).
21. Grabherr, M. G. et al. Full-length transcriptome assembly from RNA-Seq data without a reference genome. Nat. Biotechnol. 29,644–652 (2011).
22. Smith-Unna, R., Boursnell, C., Patro, R., Hibberd, J. M. & Kelly, S. TransRate: Reference-free quality assessment of de novotranscriptome assemblies. Genome Res. 26, 1134–1144 (2016).
23. Fu, L., Niu, B., Zhu, Z., Wu, S. & Li, W. CD-HIT: Accelerated for clustering the next-generation sequencing data. Bioinformatics28, 3150–3152 (2012).
24. Haas, B. J. et al. De novo transcript sequence reconstruction from RNA-seq using the Trinity platform for reference generationand analysis. Nat. Protoc. 8, 1494–1512 (2013).
25. Aubry, S., Kelly, S., Kümpers, B. M. C., Smith-Unna, R. D. & Hibberd, J. M. Deep Evolutionary Comparison of Gene ExpressionIdentifies Parallel Recruitment of Trans-Factors in Two Independent Origins of C4 Photosynthesis. PLoS Genet. 10 (6) e1004365(2014).
26. Boutet, E. et al. UniProtKB/Swiss-Prot, the Manually Annotated Section of the UniProt KnowledgeBase: How to Use theEntry View. Methods Mol. Biol. 1374, 23–54 (2016).
27. Finn, R. D., Clements, J. & Eddy, S. R. HMMER web server: Interactive sequence similarity searching. Nucleic Acids Res. 39,W29–W37 (2011).
28. Finn, R. D. et al. Pfam: The protein families database. Nucleic Acids Research 42, D1, D222-D230, (2014).29. Petersen, T. N., Brunak, S., von Heijne, G. & Nielsen, H. SignalP 4.0: discriminating signal peptides from transmembrane regions.
Nat. Methods 8, 785–786 (2011).30. Krogh, A., Larsson, B., von Heijne, G. & Sonnhammer, E. L. Predicting transmembrane protein topology with a hidden Markov
model: application to complete genomes. J. Mol. Biol. 305, 567–580 (2001).31. Powell, S. et al. eggNOG v3.0: Orthologous groups covering 1133 organisms at 41 different taxonomic ranges. Nucleic Acids Res.
40 (2012).32. Gene Ontology Consortium. The Gene Ontology Consortium. Gene ontology: tool for the unification of biology. Nat. Genet. 25,
25–29 (2000).33. Kanehisa, M., Goto, S., Sato, Y., Furumichi, M. & Tanabe, M. KEGG for integration and interpretation of large-scale molecular
data sets. Nucleic Acids Res. 40, D109–D114 (2012).34. Li, H. & Durbin, R. Fast and accurate long-read alignment with Burrows-Wheeler transform. Bioinformatics 26, 589–595 (2010).35. Li, H. et al. The Sequence Alignment/Map format and SAMtools. Bioinformatics 25, 2078–2079 (2009).36. McKenna, A. H. et al. The Genome Analysis Toolkit: A MapReduce framework for analyzing next-generation DNA
sequencing data. Genome Res. 20, 1297–1303 (2010).37. Gayral, P. et al. Reference-Free Population Genomics from Next-Generation Transcriptome Data and the Vertebrate-
Invertebrate Gap. PLoS Genet. 9, e1003457 (2013).38. Danecek, P. et al. The variant call format and VCF tools. Bioinformatics 27, 2156–2158 (2011).
www.nature.com/sdata/
SCIENTIFIC DATA | 4:170178 | DOI: 10.1038/sdata.2017.178 9
39. Lischer, H. E. L. & Excoffier, L. PGDSpider: An automated data conversion tool for connecting population genetics and genomicsprograms. Bioinformatics 28, 298–299 (2012).
40. Chang, C. C. et al. Second-generation PLINK: rising to the challenge of larger and richer datasets. Gigascience 4, 7 (2015).41. Wickham, H. ggplot2: Elegant Graphics for Data Analysis. Springer-Verlag New York, 2009.42. Pritchard, J. K., Stephens, M. & Donnelly, P. Inference of population structure using multilocus genotype data. Genetics 155,
945–959 (2000).43. Kopelman, N. M., Mayzel, J., Jakobsson, M., Rosenberg, N. A. & Mayrose, I. Clumpak: A program for identifying clustering
modes and packaging population structure inferences across K. Mol. Ecol. Resour. 15, 1179–1191 (2015).44. Mořkovský, L., Pačes, J., Rídl, J. & Reifová, R. Scrimer: Designing primers from transcriptome data. Mol. Ecol. Resour. 15,
1415–1420 (2015).45. Untergasser, A. et al. Primer3-new capabilities and interfaces. Nucleic Acids Res. 40, e115 (2012).46. Marques, J. P. et al. Range expansion underlies historical introgressive hybridization in the Iberian hare. Sci. Rep. 7, 40788 (2017).47. Luo, X. et al. Comparative transcriptomics uncovers alternative splicing and molecular marker development in radish (Raphanus
sativus L.). BMC Genomics 18, 505 (2017).48. Yu, Y. et al. SNP discovery in the transcriptome of white pacific shrimp Litopenaeus vannamei by next generation sequencing.
PLoS ONE 9, e87218 (2014).49. Cánovas, A., Rincon, G., Islas-Trejo, A., Wickramasinghe, S. & Medrano, J. F. SNP discovery in the bovine milk transcriptome
using RNA-Seq technology. Mamm. Genome 21, 592–598 (2010).50. Beugin, M.-P. et al. A single multiplex of twelve microsatellite markers for the simultaneous study of the brown hare (Lepus
europaeus) and the mountain hare (Lepus timidus). Ecol. Evol. 7, 3931–3939 (2017).51. IUCN. IUCN Red List of Threatened Species. Version 2016-1 www.iucnredlist.org (2016).
Data Citations1. NCBI Sequence Read Archive SRP095715 (2017).2. Marques, J. P. et al. Figshare http://dx.doi.org/10.6084/m9.figshare.c.3682042 (2017).3. NCBI Sequence Read Archive SRP055741 (2016).
AcknowledgementsThis work was funded by project HybridAdapt with reference FCT-ANR/BIA-EVF/0250/2012, supportedby Portuguese National Funds through the Fundação para a Ciência e a Tecnologia, FCT. Additionalsupport was obtained from POPH-QREN funds, from the European Social Fund and FCT (IF/00033/2014/CP1256/CT0005 FCT Investigator grant to JM-F, and SFRH/BD/115089/2016 and PD/BD/108131/2015 PhD grants to JPM and MSF respectively). Instrumentation, laboratory and computationalsupport was provided by CIBIO NEW-GEN sequencing platform, supported by European Union'sSeventh Framework Programme for research, technological development and demonstration under grantagreement no. 286431. Laboratory work at the University of Montana was performed in the UMGenomics Core, supported with a grant from the M.J. Murdock Charitable Trust. Transcriptomesequencing was performed through the Vincent J. Coates Genomics Sequencing Laboratory at Universityof California Berkeley, supported by NIH S10 Instrumentation Grants S10RR029668 and S10RR027303.Support was additionally obtained from FLAD (Luso-American Foundation) travel grant to MSF. We aregrateful to René Gadient and local hunters in Grisons for their tremendous effort in collecting samplesunder Alpine conditions. Laura Claffey issued the licence to take animals for scientific purposes in Ireland(dated 31/10/2012) from the Wildlife Licensing Unit, National Parks & Wildlife Service (NPWS),Department of Arts, Heritage & the Gaeltacht, and Mr Jimi Conroy, the local NPWS ConservationOfficer consented to sampling within his jurisdiction. We thank the Irish Coursing Club (ICC) forproviding hares, and in particular Mr D.J. Histon, Chief Executive and Secretary, for supporting theresearch. Thanks also to Mr William Fitzgerald, Department of Agriculture, Food and the Marine fordispatching animals in a humane manner.
Author ContributionsJ.P.M. and J.M.-F. conceived the study. J.M.-F., P.C.A., N.R., W.I.M., K.H. and H.J. organized andperformed the sampling. C.C. and M.S.F. performed laboratory work at the University of Montana underthe supervision of J.M.G. L.F. performed laboratory work at CIBIO under the supervision of J.M.-F. J.P.M. analysed the data. J.P.M. and J.M.-F. wrote the paper with contributions from M.S.F. and L.F. Allauthors read, revised and approved the manuscript.
Additional InformationSupplementary Information accompanies this paper at http://www.nature.com/sdata
Competing interests: The authors declare no competing financial interests.
How to cite this article: Marques, J. P. et al. Mountain hare transcriptome and diagnostic markers asresources to monitor hybridization with European hares. Sci. Data 4:170178 doi: 10.1038/sdata.2017.178(2017).
Publisher’s note: Springer Nature remains neutral with regard to jurisdictional claims in published mapsand institutional affiliations.
Open Access This article is licensed under a Creative Commons Attribution 4.0 Interna-tional License, which permits use, sharing, adaptation, distribution and reproduction in any
medium or format, as long as you give appropriate credit to the original author(s) and the source, provide alink to the Creative Commons license, and indicate if changes were made. The images or other third party
www.nature.com/sdata/
SCIENTIFIC DATA | 4:170178 | DOI: 10.1038/sdata.2017.178 10
material in this article are included in the article’s Creative Commons license, unless indicated otherwise ina credit line to the material. If material is not included in the article’s Creative Commons license and yourintended use is not permitted by statutory regulation or exceeds the permitted use, you will need to obtainpermission directly from the copyright holder. To view a copy of this license, visit http://creativecommons.org/licenses/by/4.0/
The Creative Commons Public Domain Dedication waiver http://creativecommons.org/publicdomain/zero/1.0/ applies to the metadata files made available in this article.