56
Mountain Line On-Demand Feasibility Study Adopted November 20, 2019

Mountain Line On-Demand Feasibility Study Adopted November 20, 2019


i
MOUNTAIN LINE ON-DEMAND FEASIBILITY STUDY
TABLE OF CONTENTS
Exective Summary ....................................................................................................................................... iii
Chapter 1: Introduction................................................................................................................................ 1
Benefits ..................................................................................................................................................... 1
Applicability .............................................................................................................................................. 2
Chater 2: On-Demand Strategies ................................................................................................................. 3
Microtransit .............................................................................................................................................. 3
Transportation Network Company (TNC) ............................................................................................... 4
Comparing Strategies .............................................................................................................................. 5
Peer City Research .................................................................................................................................... 5
Chapter 3: Performance Analysis................................................................................................................. 6
Low Performing Routes ............................................................................................................................ 6
Geographic Gaps ...................................................................................................................................... 7
Temporal Analysis .................................................................................................................................. 11
Conclusion .............................................................................................................................................. 13
Chapter 4: Program Design ........................................................................................................................ 14
Goal 1: Provide a cost-effective solution in areas along low performing routes ................................. 14
Goal 2: Provide a level of service where there is none, either spatially or temporally ........................ 16
Goal 3: Provide first mile-last mile connection to fixed-route .............................................................. 18
Conclusion .............................................................................................................................................. 21
Chapter 5: Implementation ....................................................................................................................... 23
Recommendations ................................................................................................................................. 23
Five-Year Budget .................................................................................................................................... 26
Funding ................................................................................................................................................... 26
Policy Considerations ............................................................................................................................ 27
Federal Requirements ............................................................................................................................ 29
Data Sharing ........................................................................................................................................... 30
Vehicles ................................................................................................................................................... 30
Marketing ................................................................................................................................................ 30

ii
MOUNTAIN LINE ON-DEMAND FEASIBILITY STUDY
Appendix ..................................................................................................................................................... 32
Appendix A: Private software companies for microtransit ................................................................... 33
Appendix B: Estimated ridership in FMPO ............................................................................................. 39
Appendix C: Risk assessment of on-demand programs ....................................................................... 40
Appendix D: Pinellas Suncoast Transit Authority (PSTA)’S contract with Uber................................... 42
Appendix E: Program design spreadsheet ............................................................................................ 43
Appendix F: Peer city research spreadsheet ......................................................................................... 44

iii
MOUNTAIN LINE ON-DEMAND FEASIBILITY STUDY
Exective Summary The purpose of the Mountain Line On-Demand Feasibility Study (On-Demand Study) is to analyze the
cost, considerations, and benefits of implementing an on-demand program within the Mountain Line boundary. On-demand transportation is defined as a flexible, real-time hailed transportation option which
utilizes emerging technologies and private sector partnerships. As new mobility service providers disrupting
transportation services with cutting edge technology emerge, there is a growing trend for public transit agencies
to partner with these private companies to enhance public transit. Such partnerships tend to focus on on-demand
services that can be hailed in real-time such as subsidizing Transportation Network Companies (TNC), like Uber and
Lyft, trips to connect to a transit stop or implementing an
in-house microtransit program through a software
partnership that allows agency vehicles to be summoned on-demand.
Chapter 1: Introduction – Provides information on the purpose of this study, types of on-demand
strategies researched, the benefits of implementing on-demand program, and applicability of these
strategies. On-demand transportation can complement a fixed-route transit system by helping fill transportation gaps, such as a first mile-last mile connection, serve suburban or rural areas where fixed-route transit is not warranted, or provide late-night or weekend service when fixed-route transit
ridership is low. In areas that are dense and have linear streets, fixed-route is still the most cost-efficient
way to move people from one place to another. On-demand transportation should not replace high
ridership routes.
Chapter 2: On-Demand Strategies – Provides information on the two main on-demand strategies:
microtransit and partnership with TNCs. Microtransit is IT-enabled, multi-passenger transportation
service that serves passengers using dynamically generated routes to maximize ridership and
productivity. There are a variety of private companies that partner with transit agencies to provide this
service through a spectrum of operation models, from software only to a turn-key solution. TNCs, such as Uber and Lyft match passengers with vehicles via a mobile app and website.
Chapter 3: Performance Analysis - This section includes three different analyses which feed into the
program design of an on-demand strategy. The first part analyzes Mountain Line’s fixed-route system and identifies low performing routes and sections of routes to understand if an on-demand system
would be more cost-effective than providing fixed-route in these areas. This analysis demonstrated that for the Thorpe Loop area, an on-demand program can be more cost efficient than fixed-route and
provide a higher level of service.
The second part of this chapter includes a geographic analysis which identifies areas within Mountain Line’s boundary where there currently is no transit service and assesses travel patterns and number of trips to and from these areas. The geographic analysis shows that University Heights, Country Club
Estates, Industrial Drive, and Doney Park are the areas where on-demand transportation are recommended for further analysis.
GOALS OF STUDY:
• To provide a cost-effective
solution in areas along low
performing routes
• To provide a level of service
where there is currently no fixed-route transit, both
spatially and temporally
• To provide a first mile-last mile connection to fixed-
route

iv
MOUNTAIN LINE ON-DEMAND FEASIBILITY STUDY
Lastly, a temporal analysis which identifies the time gap in which of no transit service is provided by
Mountain Line from about 10:30 pm – 5:45 am. Further analysis shows that the period from 11 pm – 3 am on Friday and Saturday has the highest concentration of vehicle trips outside of Mountain Line’s
current service hours. These results indicate that this time period would be the priority to fill a temporal gap when there is no transit service. If funding allows, the program could expand to other days of the week.
Chapter 4: Program Design – The section incorporates the data results from Chapter 3 and designs an on-demand program which addresses a specific goal identified in Chapter 1.
Goal 1: Provide a cost-effective solution in areas along low performing routes. Thorpe Loop is the one area in the Mountain Line system where there are more benefits than challenges to streamlining a low
performing route with an on-demand solution. It is recommended that this program will use the microtransit strategy with one dedicated vehicle during Route 5 service hours and will rely on utilizing
Mountain Lift paratransit vehicles that are in service to supplement the service.
Goal 2: Provide a level of service where there is none, either spatially or temporally. This chapter has
two different on-demand programs to meet this goal; a Late-Night program and a program in Doney
Park.
The Late-Night zone will cover Flagstaff city limits and run from 11 pm – 2:30am Fridays and Saturdays. Since Mountain Line currently does not run service during this time, a TNC partnership can be the first
phase to understand demand and travel patterns. To receive the Late-Night TNC subsidy, this study
recommends it by required that a passenger must use fixed-route for one part of their journey. For
example, using the bus to get to work but then using a TNC to get home when the fixed-route is no longer running.
Doney Park is an area that is outside of Flagstaff city limits that could be considered for an on-demand
program. However, through additional analysis, Doney Park is not recommended at this time. Funding
for this program poses a challenge since it is outside of Flagstaff city limits. Due to the large service area and high ridership numbers, Mountain Line would need 3 - 4 dedicated vehicles in the area for microtransit. This equates to over $700,000 in operating costs and Mountain Line would need to buy
additional vehicles.
Goal 3: Provide first mile-last mile connection to fixed-route. Based on results from geographic gaps in Chapter 3, University Heights and Country Club/Industrial are two areas where a first mile-last mile on-
demand program could be implemented.
The hills and narrow roads in the University Heights neighborhood are challenging for a 40-foot bus to safely navigate. Connecting people from University Heights to Routes 4, 14, and 10 is a viable option for
a first mile-last mile solution since there are three different fixed-route options. It is recommended that this program utilizes the microtransit strategy since it is about $70,000 less than a TNC partnership.
The second on-demand zone includes the Country Club neighborhood and Industrial Drive area north of I-40 and south of Route 66 and the railroad tracks. The on-demand solution could be delivered
through either the TNC or microtransit strategy since the overall program costs are similar for both programs. Microtransit has advantages and is the recommended strategy since it is operated in-house, there is more ownership of the program, and there are Mountain Lift vehicles that pickup and drop-off in the area.

v
MOUNTAIN LINE ON-DEMAND FEASIBILITY STUDY
Chapter 5: Implementation - Provides recommendations and phasing of the on-demand programs
analyzed in this On-Demand Study. The phasing recommendations are based on the need, readiness, and feasibility of the program. This chapter also provides a five-year budget, policy considerations,
federal requirements, and marketing suggestions.
The first priority is to have a demonstration in the Thorpe Loop area. Then it would be Late-Night, followed by University Heights and then Country Club/Industrial. Doney Park is not recommended at
this time. Funding for this program poses a big challenge since it is outside of Flagstaff city limits. In addition, TNC availability in Doney Park is another issue that would need to be addressed before the
program is implemented.
The following is a five-year budget to implement the on-demand programs. Funding these programs is
a challenge since there are limited new revenue opportunities. Public-private partnerships is a potential revenue source to fund these programs. Otherwise, according to peer city research, majority of agencies
used local funds to pay for on-demand programs. The local funds include savings from eliminated fixed-route service and local sales tax.
Five-year budget for on-demand programs
Year 1 Year 2 Year 3 Year 4 Year 5
Program implementation
Thorpe Loop Thorpe Loop,
Late-Night
Thorpe Loop,
Late-Night,
University
Heights
Thorpe Loop,
Late-Night,
University
Heights,
Country
Club/Industrial
Thorpe Loop,
Late-Night,
University
Heights,
Country
Club/Industrial
Annual
Operations
$169,670 $300,476 $598,743 $979,278 $979,278
One-time
software start-up costs
$35,000 N/A N/A N/A N/A
Annual
Technology
fees
$9,000 $9,000 $27,000 $54,000 $54,000
Fleet Costs *If
Mountain Lift is at
capacity
$160,000 N/A $320,000 $480,000 N/A
Total Cost $373,670 $309,476 $945,743 $1,513,278 $1,033,278
The On-Demand Study also includes a variety of policy considerations, including fare structure,
payment options, Title VI implications, wait times, and pick up policies. There is also information on federal requirements including drug and alcohol testing requirements, Americans with Disabilities Act
(ADA), and National Transit Database (NTD) requirements.
Marketing is also a crucial part of implementing an on-demand program. Based on peer research, one
of the top lessons learned from other on-demand programs is to have a robust marketing plan. This
includes tabling events to teach people how to use the app, flyers in the mail, social media, lunch and learns, and advertisement on websites. The On-Demand Study provides messaging ideas and targeted marketing information.

1
MOUNTAIN LINE ON-DEMAND FEASIBILITY STUDY
Chapter 1: Introduction As new mobility service providers disrupting transportation services with cutting edge technology
emerge, there is a growing trend for public transit agencies to partner with these private companies to enhance public transit. Such partnerships tend to focus on on-demand services that can be hailed in real-time such as subsidizing Transportation Network
Companies (TNC), like Uber and Lyft trips to connect to a transit stop or implementing an in-house microtransit
program through a software partnership that allows agency vehicles to be summoned on-demand. On-demand
transportation is defined as a flexible, real-time hailed transportation option which utilizes emerging technologies
and private sector partnerships.
The purpose of the Mountain Line On-Demand Feasibility
Study (On-Demand Study) is to analyze the cost,
considerations and benefits of implementing an on-demand
service within the Mountain Line boundary.
BENEFITS
On-demand transportation has a variety of benefits for the customer, including reduced wait times and increased mobility options. It can also help reach community coverage goals, such as providing some level of service in an area that does not have any. Figure 1 shows the benefits from the customer
perspective, transit agency perspective, and shared benefits.
Figure 1: Benefits of On-Demand Transportation.
GOALS OF STUDY:
• To provide a cost-effective solution in areas along low
performing routes
• To provide a level of service
where there is currently no
fixed-route transit, both
spatially and temporally
• To provide a first mile-last mile connection to fixed-
route

2
MOUNTAIN LINE ON-DEMAND FEASIBILITY STUDY
APPLICABILITY
On-demand transportation can complement a fixed-route transit system by helping fill transportation gaps, such as a first mile-last mile connection, serve suburban or rural areas where fixed-route transit is not warranted, or provide late-night or weekend service when fixed-route transit ridership is low. In
areas that are dense and have linear streets, fixed-route is still the most cost-efficient way to move people from one place to another. On-demand transportation should not replace high ridership routes.
Best uses include:
• Connections to bus stops and transit hubs
• Provide service during off-peak hours
• Service in low-density areas or suburban neighborhoods
• Replace low performing fixed-routes
Figure 2: Jersey City on-demand service with Via. Source: 6sqft.com

3
MOUNTAIN LINE ON-DEMAND FEASIBILITY STUDY
Chater 2: On-Demand Strategies There are two main on-demand strategies to choose from: microtransit and partnership with
transportation network companies (TNCs). The following provides information on the types of operation models and applicability of each strategy.
MICROTRANSIT
The Federal Transit Administration (FTA) defines microtransit as IT-enabled, multi-passenger transportation service that serves passengers using dynamically generated routes to maximize
ridership and productivity. The rides are real-time hailed through a smart phone app. This transportation option is intended to increase passenger convenience by keeping wait times between 5
– 20 minutes and reduces walking distances since it is a curb to curb program.
OPERATION MODELS
There are a variety of private companies that partner with transit agencies to provide this service through a spectrum of operation models, from software only to a turn-key solution. Hybrid operation
models also exist wherein the private company can provide software and vehicles, or software and
operations.
SOFTWARE
Most of the companies offering microtransit services provide the software only operation model. This includes both a passenger app and a driver app. The software for the driver app will dynamically route drivers in real-time to pick up riders in the most efficient manner. The software matches riders together
with similar origins and destinations, creating shared rides. The driver has a tablet that gives directions
to pick up passengers. The software only model also includes a smartphone app and website for
passengers to request rides; some companies also provide a call-in option for people who do not have
a smart phone or would rather talk to a person to order a ride. However, based on the peer cities, if the app-based option is advertised and promoted, people tend to use the app since it results in a faster pick up. Through the app, the passengers can see where the vehicle is in real-time and the estimated wait
time.
Through the software only model, the drivers, vehicles, and operations management are all provided
by the transit agency. This provides the agency more control of the overall program, driver training, customer service expectations, and vehicle maintenance. Agencies can also use underutilized
paratransit vehicles for microtransit service. In this scenario, drivers do not need a Commercial Drivers
License (CDL) to operate a paratransit van, making it easier to hire drivers and expedited training.
TURN-KEY
The turn-key solution is an operation model where the private company deploys and operates the microtransit service on the agency’s behalf. The model includes the technology needs as well as the
drivers, vehicles, and operations management. This option can be more expensive than the software
only model, and the agency has less control of the overall operations and program details. This solution
works best for transit agencies that do not have capacity to either repurpose existing vehicles or purchase additional vehicles. In addition, if an agency is facing driver shortages or is at management or dispatching capacity, this solution can relieve some of the added workload of establishing a new
program. With the turn-key model, there needs to be in-house oversite of the program and

4
MOUNTAIN LINE ON-DEMAND FEASIBILITY STUDY
management of the private company to ensure not only the success of the program, but that it
complements the transit agency’s brand and reputation in the community.
EXAMPLES
The following table shows examples of private companies that provide microtransit software; this is not an exhaustive list and was updated October 2018. There is additional information in Appendix A.
Table 1: Microtransit service providers
TransLoc Routematch Ecolane Via Transdev
Type of
service provided
Software only Software only Software only Software or
turn-key
Software or
turn-key
Cost for 6-
month pilot
6-month pilot:
$25,000
(subsidized)
6 months pilot
with 6 vehicles:
$45,000 -
$50,000
N/A 6-month pilot is
$23,500, 12-
month for
$44,000
N/A
Software start-up costs
Included in
pilot
Included in
pilot
$33,000 first
year, 20% less
the next year
$40,000 set up
fee
$15,000 -
$35,000
Reoccurring software costs
1-5 vehicles
$500 per
month, 6-10
$450 per month
$1,000 per
vehicle per
month
$800 per
vehicle per
month
$700 per
vehicle per
month
Depends on
partnership
agreement
Turn-key cost
per hour
N/A N/A N/A $45-49 per hour Call center
$1.80 per call.
$28-$33 per
hour
Order rides
through app and phone
option
Both Both Both Both Both
ADA vehicle option
Software only Software only Software only Yes Yes
Provide data Yes Yes Yes Yes Yes
Payment through app
No? Yes Yes Yes Yes
Integrate fare with Mountain Line
No? Yes Yes Yes Yes
TRANSPORTATION NETWORK COMPANY (TNC)
Transportation Network Companies (TNC) such as Uber and Lyft have provided app-based ride-
sourcing services in U.S. cities since 2012. These companies match passengers with vehicles via a mobile app and website. These services are also known as ride-hailing and ridesharing.

5
MOUNTAIN LINE ON-DEMAND FEASIBILITY STUDY
TRANSIT PARTNERSHIPS
When TNCs began expanding in U.S. cities, it was uncertain if this new service would complement transit or detract from ridership growth. Several transit agencies partnered with TNCs directly to try and understand the relationship between transit and this new technology. The primary motivation for
transit agencies to partner with TNCs include demonstrating innovation, increasing mobility for existing and new transit customers, and improving cost efficiency. TNC companies are motivated by attracting new customers and demonstrating efforts to solve local mobility challenges. Many of the partnerships with TNCs have been in the form of agencies subsidizing TNC trips within a certain area or time of day
to fill in transportation gaps. Taxi’s have also been utilized to provide a cash-only and call-in option.
COMPARING STRATEGIES
Both a TNC partnership and a microtransit program are best used in areas and/or times of day when
there is low fixed-route ridership, such as late-night service or serving a suburban neighborhood. However, there are two major differences between the on-demand solutions. The first difference is
program oversight and management. Transit agencies have less control with a TNC partnership in terms
of vehicle type, drivers, and data sharing. However, these programs run more like a turn-key since there
is less staff needed and utilizes existing vehicles. A challenge with a TNC partnership is the availability of data. TNCs have been hesitant to provide trip data, including origin and destination data, due to
concerns over privacy and public record requests. The second difference is the cost of service. Microtransit operations are often budgeted using cost per hour, like traditional fixed-route services.
TNC partnerships are subsidizing trips and therefore budgeted using cost per trip. Depending on the
estimated ridership, a service might be more cost efficient through one of the on-demand strategies,
but not the other.
PEER CITY RESEARCH
Peer city research was conducted to understand the types of on-demand programs that are being implemented around the country. Researching how these programs are being implemented, lessons
learned, and successes associated with the services is pertinent to the development of this On-Demand Study. Additional information about the research can be found in Appendix F.
Fourteen different on-demand programs were researched; six of those were TNC partnerships and eight were microtransit programs. From the research conducted, 47% are first mile-last mile programs, 40% of the programs serve areas with no or limited transit service, and 13% are programs to fill late-night or
weekend service gaps.
There are four main lessons learned from the peer city research. The first is marketing. It is important to create a robust plan, educate customers, and use both traditional outreach methods and social media to promote the program. Second is demand. Many of the programs had more demand than predicted, which causes difficulties with wait times and budget. It is important to be flexible and track
the program daily, especially during the beginning of implementation. The third lesson learned is to
have a pilot or demonstration. It is important to test and make adjustment often. Lastly is planning. Be
clear on the goals to help design the program. The agencies researched include:
City of Phoenix | San Joaquin Regional Transit District | Capital Metro | Pinellas Suncoast Transit Authority | Norwalk
Transit District | York Regional Transit | City of Arlington | Gwinnett County Transit | Harvard University | Tri-Valley
Wheels | City of Monrovia | Valley Regional Transit | Dayton RTA| Marin Transit | Ann Arbor Area Transit Authority

6
MOUNTAIN LINE ON-DEMAND FEASIBILITY STUDY
Chapter 3: Performance Analysis This section includes three different analyses which feed into the program design of an on-demand
strategy. The first part analyzes Mountain Line’s fixed-route system and identifies low performing routes and sections of routes to understand if an on-demand system would be more cost-effective than providing fixed-route in these areas. The second part is a geographic analysis which identifies areas
within Mountain Line’s boundary where there currently is no transit service and assesses travel patterns and number of trips to and from these areas. This analysis is to understand first mile-last mile
connections in Flagstaff. Lastly, a temporal analysis is conducted which identifies time gaps of no transit service within Mountain Line’s system.
LOW PERFORMING ROUTES
Figure 3 shows Mountain Line’s average weekday boardings from October 2018. Route 5, overlaid in yellow, has the lowest ridership in the system. In addition, the Thorpe area, known as Thorpe Loop has
additional concerns for the system since it increases the ride time by 8 minutes or more for the passengers who are traveling downtown. Another section with low ridership is on Route 3, along Soliere/Country Club. This area is overlaid in blue. This section of the route is surrounded by bus stops
Figure 3: Average Daily Boardings October 2018

7
MOUNTAIN LINE ON-DEMAND FEASIBILITY STUDY
in the top and middle of the ridership categories, making it challenging to reasonably cut the route at
the same time. Country Club’s low density and circuitous roads makes it difficult for a fixed-route bus to travel through the neighborhood. Therefore, it is possible to consider an on-demand program
meeting new service area goals that would drop passengers at these low performing bus stops and increase their productivity. See Chapter 4 for more information.
Table 2 represents the three areas in the Mountain Line system which are low performing. The cost
estimates for the microtransit and TNC partnerships are for wait times of 15 minutes or less. The estimated cost for microtransit uses a cost per hour of $50.71, which incorporates FY20 budgeted wages
for an operator and operations and maintenance of a paratransit vehicle. To determine the number of vehicles needed for microtransit, estimated ridership and size of the area is needed. More information
on estimated ridership and area size is in Chapter 4: Program Design and Appendix B and E. The cost estimates for TNC partnership subtracts $1.25, cost of a one-way Mountain Lift ticket, from the
estimated Lyft trip in the area (https://www.lyft.com/rider/cities/flagstaff-az) and multiplies that number by estimated ridership in the area. More information on estimated ridership can be found in
Appendix B. The fixed-route costs are for 15-minute frequency to show comparative costs and utilizes
cost per hour of $63.51.
Thorpe Loop is the only area that can be reasonably cut from the rest of the route and have an on-demand service serve that area cost-effectively. The Soliere/Country Club will be further analyzed as a
first mile-last mile solution since the route cannot be reasonably streamlined.
Table 2: Low performing areas in Mountain Line's system
Route 5 Thorpe Loop Soliere/Country Club
Fixed-route existing
frequency
$440,700 $58,300 $94,700
Fixed-route cost (15
mins)
$997,600 $181,100 $253,500
Microtransit $1,149,336 $169,670 $300,989
TNC Partnership $1,505,244 $130,031 $150,282
Other Considerations Route 5 has high enough
ridership that it would
take 6 microtransit
vehicles to serve this
area, increasing costs.
Route 5 would be 35 min
runtime, save passengers
8 minutes going
downtown.
Better for a first mile-last
mile program since route
cannot be reasonably
cut.
GEOGRAPHIC GAPS
WITHIN FLAGSTAFF
Transit is a valued part of Flagstaff's mobility culture, as demonstrated by the dedicated transit tax that
was first approved in 2000 for ten years, increased in 2008, and renewed in 2016 with a sunset in 2030.
This transit tax has an integral role in providing fixed-route services in Flagstaff. However, there are
several areas in Flagstaff which are not conducive to fixed-route due to the street configuration, lack of
connectivity within the area, and/or low densities. Microtransit and TNCs can potentially serve these areas better than fixed-route because they can be more responsive and can cover a larger area, increasing the potential rider pool.
As shown in Figure 4, there are several areas within Flagstaff city limits which are outside of a .25-mile walk shed from existing bus stops. This map is developed using the road network providing a realistic

8
MOUNTAIN LINE ON-DEMAND FEASIBILITY STUDY
view into where people can walk to stops to access the Mountain Line system. Blue areas are those that
are served while grey are not. Areas of Flagstaff that do not currently have transit service are analyzed in Table 3.
Figure 4: Quarter Mile Walking Shed Buffer from Bus Stop
University Heights and Ponderosa Trails
University Heights and Ponderosa Trails are both residential suburban neighborhoods south of I-40 in the Flagstaff city limits. Both of these neighborhoods have low walkability to stops since many of the
roads are circuitous and do not connect to the main road. Route 4 and 14 could be rerouted to serve University Heights, but the narrow streets and hills make it difficult for a 40-foot bus to navigate the roads and the extra time would mean more buses would be needed to maintain existing levels of service on the remainder of the routes. Mountain Line’s 5-Year Transit plan identifies serving Pulliam Airport. If Mountain Line starts to serve the airport, a route could go through Ponderosa Trails and serve that
neighborhood through fixed-route. Therefore, University Heights is recommended for more on-demand research and Ponderosa Trails is not.
Woody Mountain
Woody Mountain has a mixture of low-income housing along Route 66, including Hidden Hollow Manufactured Homes and Kit Carson RV Park. There are also housing communities along Woody
Mountain Road, including Presidio in the Pine and Timber Sky Development, which are not dedicated

9
MOUNTAIN LINE ON-DEMAND FEASIBILITY STUDY
affordable housing. This area is also home to one of W.L. Gore and Associates Inc. offices, a large
employer in Flagstaff. Serving this area with fixed-route is an area identified in Mountain Line’s 5-Year Transit Plan as Route 8 can extend to serve this area. Therefore, this area is not recommended for
further on-demand research.
Pine Canyon
Pine Canyon is a low-density suburban neighborhood adjacent to a golf course. This neighborhood houses many vacation rentals and second homes making it likely a low ridership area. This
neighborhood also has circuitous roads which do not connect, causing difficulties for fixed-route and
walking to and from bus stops. Route 4 and 14 could be rerouted to serve this area, however this would add 17 minutes of run time, decreasing the rider experience for existing riders. Since this area has many vacation rentals and second homes, it is not recommended for further on-demand research. The
Mountain Line’s 5-Year Transit Plan shows potential service along the new John Wesley Powell road. As
planning for and the roadway develops, the appropriate service type can be re-evaluated.
Country Club Estates
Country Club Estates is a large suburban, residential neighborhood. There is a golf course throughout the neighborhood, with narrow, circuitous roads. Currently, Route 3 serves several apartment
complexes along Soliere Avenue. Due to the size and road configuration in Country Club, walking to the bus stops on Soliere Avenue is not a convenient option for people living in the neighborhood. Since the
bus stops along Soliere Avenue have low ridership, it is recommended Country Club be analyzed further for a first mile-last mile on-demand program to bring more people to these existing bus stops.
Industrial Drive
Industrial Drive is home to a variety of human service organizations, including Flagstaff Shelter Services, Hozhoni Foundation, and The Guidance Center. This area is between Route 66 and the railroad tracks
to the north and I-40 to the south, causing barriers to access existing transit. This is a major destination
for many of Mountain Line’s most vulnerable passengers, who must walk almost one mile to access
Route 66 bus stops. To serve this area through fixed-route, a new route would need to be created.
Therefore, this area is recommended for further on-demand research to understand the best way to
serve this are through an on-demand program.
Flagstaff Pulliam Airport
Flagstaff Pulliam Airport is a popular destination in Flagstaff. It provides flights to Denver, Dallas, and
Phoenix seven days a week. Parking is free at the airport, but the limited capacity provides challenges
for future growth. There is currently no public transportation that goes to the airport. Serving the airport is identified in Mountain Line’s 5-Year Transit Plan as an area to add fixed-route service. Therefore, it is not recommended to analyze this area further through an on-demand program.
Table 3 below represents the areas in Flagstaff without transit service. It evaluates if these areas can be
served by an existing fixed-route and estimates the added cost and run time to reroute existing service
to service these areas. It also provides a recommendation if these areas should be researched further
for on-demand service.
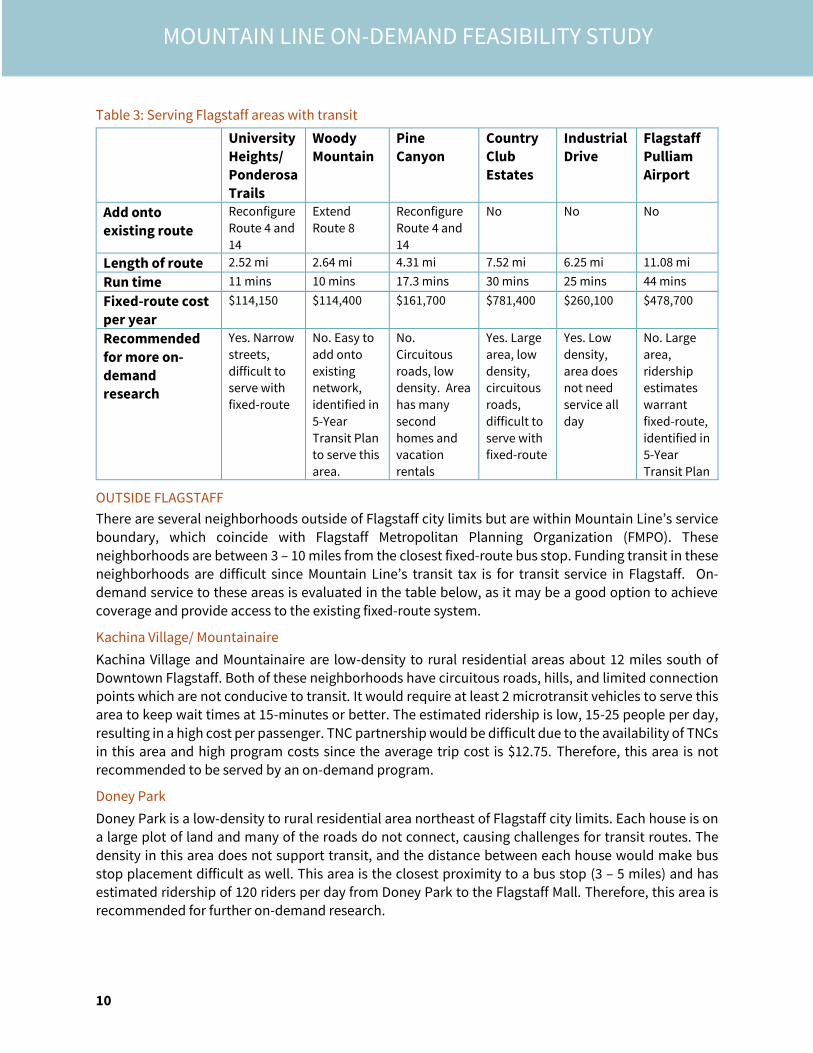
10
MOUNTAIN LINE ON-DEMAND FEASIBILITY STUDY
Table 3: Serving Flagstaff areas with transit
University
Heights/ Ponderosa Trails
Woody
Mountain
Pine
Canyon
Country
Club Estates
Industrial
Drive
Flagstaff
Pulliam Airport
Add onto existing route
Reconfigure
Route 4 and
14
Extend
Route 8
Reconfigure
Route 4 and
14
No No No
Length of route 2.52 mi 2.64 mi 4.31 mi 7.52 mi 6.25 mi 11.08 mi
Run time 11 mins 10 mins 17.3 mins 30 mins 25 mins 44 mins
Fixed-route cost per year
$114,150 $114,400 $161,700 $781,400 $260,100 $478,700
Recommended
for more on-demand research
Yes. Narrow
streets,
difficult to
serve with
fixed-route
No. Easy to
add onto
existing
network,
identified in
5-Year
Transit Plan
to serve this
area.
No.
Circuitous
roads, low
density. Area
has many
second
homes and
vacation
rentals
Yes. Large
area, low
density,
circuitous
roads,
difficult to
serve with
fixed-route
Yes. Low
density,
area does
not need
service all
day
No. Large
area,
ridership
estimates
warrant
fixed-route,
identified in
5-Year
Transit Plan
OUTSIDE FLAGSTAFF
There are several neighborhoods outside of Flagstaff city limits but are within Mountain Line’s service boundary, which coincide with Flagstaff Metropolitan Planning Organization (FMPO). These
neighborhoods are between 3 – 10 miles from the closest fixed-route bus stop. Funding transit in these
neighborhoods are difficult since Mountain Line’s transit tax is for transit service in Flagstaff. On-
demand service to these areas is evaluated in the table below, as it may be a good option to achieve coverage and provide access to the existing fixed-route system.
Kachina Village/ Mountainaire
Kachina Village and Mountainaire are low-density to rural residential areas about 12 miles south of Downtown Flagstaff. Both of these neighborhoods have circuitous roads, hills, and limited connection points which are not conducive to transit. It would require at least 2 microtransit vehicles to serve this
area to keep wait times at 15-minutes or better. The estimated ridership is low, 15-25 people per day,
resulting in a high cost per passenger. TNC partnership would be difficult due to the availability of TNCs in this area and high program costs since the average trip cost is $12.75. Therefore, this area is not recommended to be served by an on-demand program.
Doney Park
Doney Park is a low-density to rural residential area northeast of Flagstaff city limits. Each house is on a large plot of land and many of the roads do not connect, causing challenges for transit routes. The
density in this area does not support transit, and the distance between each house would make bus stop placement difficult as well. This area is the closest proximity to a bus stop (3 – 5 miles) and has estimated ridership of 120 riders per day from Doney Park to the Flagstaff Mall. Therefore, this area is recommended for further on-demand research.

11
MOUNTAIN LINE ON-DEMAND FEASIBILITY STUDY
Bellemont
Bellemont is an unincorporated community in Coconino County. It is located along Interstate 40 about
11 miles west-northwest of Flagstaff. Bellemont has small plot sizes and houses a variety of duplexes
and single-family homes. For transit access, many of the roads do not connect to each other, limiting walkability in the neighborhood. From downtown Flagstaff to Bellemont on the I-40, there are few attractions along the corridor. It would require at least 2 microtransit vehicles to serve this area to keep wait times at 15-minutes or better. The estimated ridership is low, 15-25 people per day, resulting in a
high cost per passenger. TNC partnership would be difficult due to the availability of TNCs in this area
and high program costs since the average trip cost is $19.75. Therefore, this area is not recommended to be served by an on-demand program. However, Coconino County is developing a Bellemont Area Plan, which encourages future dense development in this area. Monitoring the development in this area
is recommended for future consideration.
Timberline-Fernwood
Timberline-Fernwood is a low-density to rural residential area, northeast on 89A, outside of Flagstaff
city limits. This area has a small populated, has large plots of land, and many of the roads do not connect. If there is an on-demand program in Doney Park, this area could be incorporated into their
program. However, this should only be added after there has been proven success in the Doney park area.
Table 4 below represents the areas outside of Flagstaff city limits. It shows the run time and cost associated if fixed-route would serve these areas. It also provides a recommendation if these areas would warrant on-demand service. Cost per trip is using fixed-route cost per hour of $64, hourly
frequency, and estimated ridership to serve these areas. Estimated ridership can be found in Appendix B.
Table 4: Serving FMPO areas with fixed-route transit
Kachina Village/
Mountainaire
Doney Park Bellemont Timberline-
Fernwood
Add onto existing route
No No No No
Length 24.56 mi 20.38 mi 25.80 mi 25.12 mi
Run time 98 minutes 81 miles 103 minutes 100 minutes
Fixed-route cost
per year
$798,700 $839,500 $663,800 $815,000
Cost per trip $124.06 $41.35 $130.40 $123.12
Recommended
for on-demand
No. Travel time would
warrant 2 vehicles.
High cost w/ low
population.
Yes. High number
of trips to the
mall, easy
connection.
No. Travel time
would warrant 2
vehicles. High cost
w/ low population.
If there is Doney
Park service, could
add this area to it.
TEMPORAL ANALYSIS
Each route on Mountain Line starts and stops at varying times. When Mountain Line is not running, Flagstaff has taxis, Uber, and Lyft to provide a level of transportation for those who do not have a vehicle
or wish not to drive. This gap in service makes taking public transit a one-way option for late night workers and people who go to a late-night movie or go downtown for entertainment. Table 5 displays

12
MOUNTAIN LINE ON-DEMAND FEASIBILITY STUDY
the stop and start times, demonstrating the general gap in service from about 10 pm – 6 am on the
weekdays and about 8 pm -7 am on weekends.
Table 5: Mountain Line transit start and stop times
Weekday Weekend
Stop time Start time Stop time Start time
Route 2 10:37 pm 5:38 am 8:37 pm 6:48 am
Route 3 10:39 pm 6:15 am 8:39 pm 6:45 am
Route 4 10:12 pm 6:05 am 8:12 pm 7:05 am
Route 5 9:46 pm 6:32 am 7:46 pm 7:32 am
Route 7 9:51 pm 5:40 am 7:51 pm 6:45 am
Route 8 9:30 pm 6:15 am 7:30 pm 7:15 am
Route 10 10:45 pm 6:25 am 8:20 pm 7:25 am
Route 14 10:04 pm 6:14 am 8:04 pm 7:14 am
Route 66 10:38 am 5:49 am 8:38 pm 6:49 am
STREETLIGHT DATA ANALYSIS
StreetLight Data is a company that utilizing cell phone data to aggregate travel patterns for analysis. The following analysis is conducted using 11 pm fixed-route stopping times since the Mountain Line 5-
Year Transit Plan recommends smoothing spans on fixed-route to 11 pm on weekdays and add service
hours on weekends. It would cost approximately $107,000 annually for fixed-route to expand hours to
11 pm, compared to $225,750 to provide those trips via TNC or taxi during 8 pm – 11 pm.
Using StreetLight Data, 11 pm – 6am on Fridays and Saturdays have the greatest number of vehicle trips
when fixed-route is not running; the greatest concentration of vehicle trips is between 11 pm – 3 am.
For scale, vehicle trips during morning commute hours are shown in Table 6 as well.
Table 6: Number of car trips outside of Mountain Line hours
Monday – Thursday Friday and Saturday Saturday Sunday
6 am – 10 am 55,961 43,760 15,762 13,762
11 pm – 6 am 7,425 24,301 12,052 9,957
11 pm – 3 am 4,407 16,979 9,383 7,456
As seen in Figure 5, the top five origins and destinations on Friday and Saturday from 11 pm to 3 am are downtown Flagstaff, Northern Arizona University (NAU), Southside, Beulah Area, and Flagstaff Mall.

13
MOUNTAIN LINE ON-DEMAND FEASIBILITY STUDY
Figure 5: Top origins and destinations from 11 pm to 3 am
CONCLUSION
The low performing routes analysis demonstrated that for the Thorpe Loop area, an on-demand program can be more cost efficient than fixed-route and provide a higher level of service. Replacing
fixed-route with on-demand service would also allow Route 5 to streamline, reducing operation costs for the Mountain Line system and travel time for passengers. The results from this analysis indicate
Thorpe Loop would be a good pilot for on-demand program design to achieve the goal of cost-
effectiveness.
The geographic analysis shows that University Heights, Ponderosa Trails, Pine Canyon, Country Club
Estates, Industrial Drive, and Doney Park are the areas where on-demand transportation could serve. Pine Canyon will not move to program design since this neighborhood is not a priority to provide
transportation since it is an affluent neighborhood with many second homes and vacation rentals. Ponderosa Trails will also not be included in program design since this area can be served by a fixed-route connecting to the airport. Therefore, results indicate University Heights, Country Club Estates,
Industrial Drive, and Doney Park are good areas to pilot on-demand program to achieve the goals of geographic coverage where there currently is no transit service and first mile-last mile connections.
The temporal analysis shows that the period from 11 pm – 3 am on Friday and Saturday has the highest concentration of vehicle trips outside of Mountain Line’s current service hours. These results indicate that this time period would be the priority when filling a temporal gap of no transit service. If funding
allows, the program could expand to other days of the week.

14
MOUNTAIN LINE ON-DEMAND FEASIBILITY STUDY
Chapter 4: Program Design
The following on-demand programs have been designed by incorporating the data results from Chapter
3: Performance Analysis. Each program has a specific goal which is identified in Chapter 1. When designing an on-demand zone, there is a balance between potential ridership and zone size. In order to maintain 15-minute wait times, it is estimated that one vehicle can have 4.7 boardings in one hour
within a 5 – 7 square mile zone. If the zone is larger than 7 square miles or ridership exceeds 4.7 boardings, then an additional vehicle is needed, which increases program costs.
Historical Mountain Lift trip schedules were also analyzed to understand the paratransit demand in the area. Under the microtransit strategy, paratransit vehicles could be used for on-demand service when
no paratransit trips are scheduled, as long as it does not hinder paratransit on-time performance.
Partnering with TNCs was analyzed in the study. However, partnering with taxi companies can also be
included. Taxi’s also play an integral role in providing a cash-only and call in option for customers. Therefore, it is recommended that a TNC partnership also includes a taxi company. This
recommendation also satisfies the Federal Transit Administration’s (FTA) taxi cab exception. More
information is found in Chapter 5, Federal Requirements.
GOAL 1: PROVIDE A COST-EFFECTIVE SOLUTION IN AREAS ALONG LOW
PERFORMING ROUTES
Incorporating results from low performing routes in Chapter 3: Performance Analysis, Thorpe Loop is the one area on the Mountain Line system where there are more benefits than challenges to
streamlining a low performing route with an on-demand solution. An on-demand program can be more cost efficient than providing fixed-route with comparable wait times. It would also reduce travel times for passengers going to and from Cheshire neighborhood, increasing the attractiveness of the route.
More information regarding program design can be found in Appendix E.
PROGRAM DESCRIPTION
This program consists of replacing Thorpe Loop on Route 5, which includes stops 2-7 outbound and 25-30 inbound with an on-demand program. The geofenced area, as shown in Figure 6, includes Thorpe Loop stops, Flagstaff Medical Center stop, and the Downtown Connection Center.
It is recommended that this program uses the microtransit strategy with one dedicated vehicle during Route 5 service hours and relies on utilizing Mountain Lift paratransit vehicles that are in service to supplement the service. It is not recommended to have a TNC partnership to solely serve the Thorpe Loop area since existing Mountain Lift vehicles already serve this area frequently. A Mountain Lift vehicle can perform on-demand trips when demand is low in the paratransit program, resulting in better coordination and flexibility between both programs. Figure 6: Thorpe Loop on-demand zone

15
MOUNTAIN LINE ON-DEMAND FEASIBILITY STUDY
MOUNTAIN LIFT ANALYSIS
There are approximately 15 Mountain Lift clients that live in Clark Homes or in the general vicinity. There is an average of 12 clients who regularly travel to J.C. Montoya Adult Center. In November 2016, there was an average of more than 150 pickups from Thorpe Loop area, which equals about 5 trips per day.
STAFFING AND FLEET
Table 7: Thorpe Loop microtransit staffing and fleet needs
Staffing requirements
Operators 3 to fill annual service needs, though only 1 in service at a time
Ops Supervisors 0
Mechanic 0
Fleet requirements 1 dedicated vehicle. Mountain Lift vehicles for surplus trips
RIDERSHIP AND COST
Estimated ridership is based on actual October 2017 boardings and alightings at the stops along Thorpe
Loop. Estimated fares are determined by multiplying estimated ridership by $2.50, the price of an adult
day pass. Operating costs are estimated using revenue hours multiplied by FY20 budgeted wages for
operators, the direct and indirect operations and maintenance of a vehicle, and indirects including administration, utilities, and legal. The total cost is for operations only. For microtransit, there are one-time technology start-up costs ranging from $15,000 - $45,000 and annual technology fees ranging from
$6,000 - $9,000 per vehicle.
Table 8: Annual cost for Thorpe Loop microtransit service
Estimated Ridership 34,485
Revenue Hours 5,046
Estimated Fares $86,213
Fixed-Route Cost $181,100
Cost per Trip $7.42
Total Cost (including fares) $169,670
ADDITIONAL CONSIDERATIONS:
The following provides program considerations and challenges with implementing the Thorpe Loop
program. See Appendix C for a risk assessment of the program.
• Challenges with transfers: There are challenges with transferring from Route 5 to an on-demand program because travel times would increase for riders who are wanting to go to
destinations in the Thorpe Loop. If wait times average 15 minutes, then a rider’s trip would increase from eight minutes to twenty-three minutes of travel time.
• Technology concerns: There are two schools, a senior center, and senior and low-income housing along Thorpe Loop. Since this population might not have access to a smart phone, there could be increased challenges with a primarily app-based program. Therefore, it is
pertinent to have a call-in option and travel training to get seniors and youth comfortable with the technology.
• Public concerns: This on-demand solution requires Route 5 to reduce service in a senior
and low-income area. This could cause some public backlash about the on-demand

16
MOUNTAIN LINE ON-DEMAND FEASIBILITY STUDY
program and Mountain Line organization. To mitigate this challenge, it will be necessary to
communicate to the affected area and the public in general that this area is not losing service, rather replacing it with a premium service with lower wait times. It will be important
to involve stakeholders, such as J.C. Montoya Senior Center, Clark Home residents, and school staff early in the process to address any issues.
GOAL 2: PROVIDE A LEVEL OF SERVICE WHERE THERE IS NONE, EITHER
SPATIALLY OR TEMPORALLY
Incorporating results from geographic gap and temporal analysis in Chapter 3: Performance Analysis,
the late-night gap will be filled through an on-demand program between 11 pm – 2:30 am, Fridays and Saturdays. This can be a first phase in providing late-night service since the greatest number of trips are during these days compared to Monday – Thursday.
Doney Park is an area outside of Flagstaff city limits that could be considered for an on-demand program. This area is recommended since an on-demand program is also about $200,000 less than adding a fixed-route. In addition, Doney Park to the Flagstaff Mall is one of the highest origin and
destination sets among the areas in the FMPO. There is an average of 4,000 trips per day between these
two areas, equating to an estimated 120 trips with an on-demand program. The methodology behind
the estimated ridership and fixed-route costs can be found in Appendix B and E.
PROGRAM DESCRIPTION
LATE-NIGHT
The Late-Night zone will cover Flagstaff city limits and run from 11 pm – 2:30am Fridays and Saturdays. To fill the temporal gap on Saturday from 8 pm – 11 pm, it is recommended the fixed-route system expands service on Saturdays to 11 pm. It would cost approximately $107,000 annually for fixed-route
to expand hours to 11 pm, compared to $225,750 to provide those trips via TNC or taxi during 8 pm – 11
pm. After 11 pm, number of trips drop off, so it would be more cost effective to have a TNC partnership
and taxi provider to provide a call-in and cash option. It is suggested that any private mobility provider can be a part of the Late-Night program by entering into a contract with Mountain Line. Since Mountain
Line currently does not run service during this time, a TNC partnership can be the first phase to understand demand and travel patterns. A late-night option through microtransit or fixed-route is not
recommended at this time since it would create third shift challenges for mechanics, operations
supervisors, and customer service.
To receive the Late-Night TNC subsidy, this plan recommends it be required that a passenger must use fixed-route for one part of their journey. For example, using the bus to get to work but then using a TNC to get home when the fixed-route is no longer running, so as to control cost by limiting access to the
program to those using fixed-route while in operation. This option would require increased technology
for fare payment, such as mobile ticketing. It is anticipated that Mountain Line will have mobile ticketing
by spring of 2020. This partnership would also require Mountain Line to have access to the TNC’s API
(application programming interface), so payment can be integrated into the app. This requirement
should be included in any contract with a TNC company. It would also be helpful for the TNC companies to add Mountain Line’s fixed-route arrival times in the app. This has been done in other cities in the country, like Denver, Colorado.

17
MOUNTAIN LINE ON-DEMAND FEASIBILITY STUDY
DONEY PARK
The Doney Park zone is 17 sq. miles and includes a grocery store and a few other amenities. The zone
also includes the Mall Connection Center (MCC), which is about 5 – 7 miles from Doney Park, though has
few origins and destinations in-between. The MCC serves three different routes which connect to Downtown Flagstaff. It is recommended this on-demand zone is served through a TNC partnership since it is $59,798 less than a
microtransit strategy. In addition, this area currently does not have transit service, so a TNC partnership can be the first phase to understand demand and utilization of the program. If the
TNC partnership surpasses 45,000 annual trips,
microtransit would be the more cost-efficient
option. If the program surpasses 65,000 annual trips, fixed-route would be more cost-efficient. However, there are still land-use, road
configuration, and density challenges for fixed-
route to be successful in this area.
STAFFING AND FLEET
Table 9: Late-Night and Doney Park staffing and fleet for TNC partnership
Staffing
requirements
Late-Night Doney Park
Operators 0 0
Ops Supervisors 0 0
Mechanic 0 0
Fleet requirements TNC partnership TNC partnership
RIDERSHIP AND COST
For Late-Night service, estimated ridership is based on travel from StreetLight Data on Fridays and Saturdays from 11 pm – 3 am. For Late-Night service, cost per trip is calculated by the average cost of
the Lyft trip in Flagstaff minus $1.25 the customer would pay. Estimated ridership for Doney Park is based on gathering percentages of travel from StreetLight Data based on actual travel to and from
origins and destinations in the FMPO. Vehicular trips were then multiplied by 3%, which is the transit mode share from the FMPO Trip Diary. Cost per trip is calculated by the average cost of a Lyft trip in Doney Park to the Mall Connection Center minus $1.25 the customer would pay.
Table 10: Cost for Late-Night and Doney Park TNC Partnership
Late-Night Doney Park
Estimated Ridership 12,168 43,560
Annual Hours 364 5,046
Fixed-Route Cost $483,912 $839,500
Cost per trip $10.75 $13.75
Total Cost (including
fares) $130,806 $598,950
Figure 7: Doney Park on-demand zone

18
MOUNTAIN LINE ON-DEMAND FEASIBILITY STUDY
ADDITIONAL CONSIDERATIONS
The following provides considerations and challenges with implementing the Late-Night and Doney Park programs. See Appendix C for a risk assessment of the programs.
• TNC availability: Currently, TNC availability during late night hours and in Doney Park can
be an issue in Flagstaff. Since Doney Park is a lower density neighborhood, wait times could be longer than in city limits since there are not as many vehicles in the area. Through a TNC partnership, more demand is created, which could result in more drivers in the area. In addition, Uber and Lyft have historically provided incentives for drivers to go to high
demand areas with driver shortages. A pilot program would be instrumental to understand the relationship between demand and driver availability. Otherwise, a microtransit program would be the other solution and have dedicated vehicles in the zone. Microtransit program for Late-Night would cost $659,887 and for Doney Park would cost $658,748.
• TNC fare structure: The program costs are based on passengers paying $1.25 per ride, the
same as a one-trip on the fixed-route, and Mountain Line would subsidize the rest of the trip. Based on peer city research, the rate that passengers pay tend to be higher than fixed-
route fares since it is a more premium service. Some agencies have paid up to $5 for the trip, and then the customer pays the rest. When customers order the ride, they would see the
discount applied and know how much they are paying for the ride. For the Late-Night option, having Mountain Line pay up to $5 would change the budget to $236,038 per year. This budget estimate does not have the condition that a trip has to end or start with fixed-
route.
• Surge Pricing: Surge pricing is a tool that Uber and Lyft use to maximize the relative supply
and demand in an area. This tends to happen during late night hours, when there is a high demand for TNCs. This can dramatically increase the price of a trip, sometimes 3.5 times
the usual price. Some transit agencies have tried to reduce surge pricing in the contract
between the TNC but have been unsuccessful. However, Uber has provided incentives for more drivers to work during those surge times to try and add supply, thus decreasing the
increased prices.
• Funding for Doney Park: Since Doney Park is outside of Flagstaff City Limits, the dedicated
transit tax cannot be used to fund this program. To implement this program, Coconino County or a different entity would need to fund this program.
GOAL 3: PROVIDE FIRST MILE-LAST MILE CONNECTION TO FIXED-ROUTE
Based on results from geographic gaps in Chapter 3: Performance Analysis, there are two areas where a first mile-last mile on-demand program would benefit the Mountain Lift system: University Heights
and Country Club/Industrial areas. More information regarding program design can be found in
Appendix E.
PROGRAM DESCRIPTION
UNIVERSITY HEIGHTS
The hills and narrow roads in University Heights neighborhood are challenging for a 40-foot bus to safely navigate. Connecting people from University Heights to Routes 4, 14, and 10 is a viable option for a first mile-last mile solution since there are three different route options and, during peak service, there

19
MOUNTAIN LINE ON-DEMAND FEASIBILITY STUDY
is a bus arriving every five minutes. According to
StreetLight Data, the main destinations for people with an origin in University Heights are NAU’s
campus, Woodlands Village, or Milton Road, which these routes directly serve.
The closest Mountain Line stops are about 1 – 2
miles from parts of University Heights. The on-demand zone, shown in Figure 8, includes
University Heights, Route 10 (stops 8 and 13), Route 4 (stop 5), and Route 14 (stops 13 and 14)
near Beulah Boulevard and Woodlands Village Boulevard.
It is recommended that this program utilizes the microtransit strategy with one dedicated vehicle all day and an additional dedicated vehicle during
peak hours (6 am – 9 am and 4 pm – 7 pm). Mountain Lift vans can help supplement the demand, but
since this area does not have many paratransit trips, this is not a reliable vehicle source. The TNC
strategy could be an option, however according to the estimated ridership, a TNC partnership has higher overall program costs of $376,862 compared to $298,267 for microtransit. TNCs could be a back
up option if the microtransit vehicles are in-use. This would require an agreement with a TNC company
and the microtransit software company to allow trips to dispatch to the TNC company.
COUNTRY CLUB/INDUSTRIAL DRIVE
The second on-demand zone, shown in Figure 9, includes the Country Club neighborhood and Industrial Drive area north of I-40 and south of Route 66 and the railroad tracks.
Route 3 runs in the northern part of the Country Club neighborhood. Figure 3 in Demand Analysis shows
that this section of fixed-route is in the bottom 25% of bus stop performance. A first mile-last mile
program would benefit this section by bringing more riders to these low performing stops. Expanding fixed-route service in this neighborhood is very difficult due to the circuitous roads, making on-demand
a better service option.
The Industrial Drive area is home to human service agencies and Flagstaff Shelter Services—major
destinations for Mountain Line’s most vulnerable
riders—generating the need for some sort of public transportation option. However, due to the low density and lack of connectivity in the area, it does not warrant a new fixed-route. An on-demand program
can help fill that transportation gap and connect people to the fixed-route. The on-demand zone
utilizes Route 3 stops 9-15 outbound and 18-24 inbound, and the Mall Connection Center. Route 66 bus stops are not included in the geofenced zone
since the vehicles would have to cross the train tracks, potentially increasing travel times.
The on-demand solution could be delivered through
either the TNC or microtransit strategy since the
Figure 8: University Heights on-demand zone
Figure 9: Country Club/Industrial on-demand zone

20
MOUNTAIN LINE ON-DEMAND FEASIBILITY STUDY
overall program costs are similar for both programs. Microtransit has advantages and is the
recommended strategy since it is operated in-house, there is more ownership of the program, and there are Mountain Lift vehicles that pickup and drop-off in the area. Flagstaff Shelter Services’ busiest times
for transportation are 8 am in the mornings and 4 pm in the afternoons when people are coming to and from the shelter. Therefore, a dedicated vehicle will be needed during these peak times. It is recommended to have one dedicated vehicle all day and an additional dedicated vehicle during peak
hours (6 am – 9 am and 4 pm – 7 pm).
MOUNTAIN LIFT ANALYSIS
There are approximately 45 Mountain Lift clients that live in University Heights or the surrounding area. Utilizing data from November 2016, University Heights has about 70 pickups (2.3 per day). Ponderosa Trails, a neighboring area, has about 180 Mountain Lift pickups (6 per day). In Country Club, there are
about 60 pickups per month (2 per day). In Industrial area, there are about 200 pickups (6.8 per day).
STAFFING AND FLEET
Table 11: University Heights and Country Club/Industrial staffing and fleet
Staffing requirements
University Heights Country Club/Industrial
Operators 4 to fill annual service needs, though only 1
in service at a time
5 to fill annual service needs,
though only 1 in service at a time
Ops Supervisors 0 0
Mechanic 0 0
Fleet requirements 2 vehicles: 1 dedicated, 1 during 6 am – 9 am,
4 pm – 7 pm
2 vehicles: 1 dedicated, 1 during 6
am – 9 am, 4 pm – 7 pm
RIDERSHIP AND COST
Estimated ridership is based on gathering percentages of travel from StreetLight Data Location-Based Services (LBS) for an Average Weekday in 2017 based on actual travel to and from origins and
destinations in the FMPO. Then, the vehicular trips are multiplied by 3%, which is the transit mode share from the FMPO Trip Diary (3%). Estimated fares are determined by multiplying estimated ridership by
$2.50, the price of an adult day pass. Operating costs are estimated using revenue hours multiplied by FY20 budgeted wages for operators, the direct and indirect operations and maintenance of a vehicle, and indirects including administration, utilities, and legal. More information regarding ridership and
program design can be found in Appendix B and E. For microtransit there are one-time technology
startup costs ranging from $15,000 - $45,000 and annual technology fees ranging from $6,000 - $9,000 per vehicle. Fixed-route details are found on Table 3 in Chapter 3.
Table 12: Cost for University Heights and Country Club/Industrial microtransit program
University Heights Country Club/Industrial
Estimated Ridership 27,225 38,496
Revenue Hours 7,224 9,402
Estimated Fares $86,213 $96,240
Fixed-Route Cost $271,100 $1,041,500
Cost per Trip $13.46 $12.39
Total Cost (including
fares) $298,267 $380,535

21
MOUNTAIN LINE ON-DEMAND FEASIBILITY STUDY
ADDITIONAL CONSIDERATIONS
The following provides considerations and challenges with implementing the University Heights and Country Club/Industrial programs. See Appendix C for a risk assessment.
• Challenges with transfers: Route 3 runs every 30 minutes during peak hours. This can
cause challenges with timing transfers from microtransit to fixed-route. This challenge can be mitigated by making sure microtransit and fixed-routes are integrated into the same app to enable comprehensive trip planning. When trip planning, it shows real-time arrival of the microtransit compared to the fixed-route system, which can help mitigate missed
connections. The Mall Connection Center stop is better for first mile-last mile connection since it serves three different routes with seven buses arriving in an hour.
• Microtransit on University Heights Drive only: To maintain 15-minute wait times, a
suggestion is for microtransit vehicles to pickup and drop-off passengers on University Heights Drive. This option would only be for able-bodied passengers.
• Fare Integration: Fare integration with the fixed-route system will be critical for both first
mile-last mile solutions to be successful. An example of fare integration would be providing the passenger with an all-day fixed-route pass if they use microtransit. It is suggested the first mile-last mile programs have a higher fare, which includes a day pass. More
information can be found in Chapter 5, Policy Considerations.
CONCLUSION
This section provides a summary of all the on-demand programs analyzed in this chapter. These
programs are prioritized in the next chapter, Chapter 5: Implementation.
Table 13: Summary of On-demand programs
Thorpe Loop University Heights
Country Club/Industrial
Late-Night Doney Park
On-Demand Program
Microtransit Microtransit Microtransit TNC
partnership
TNC
partnership
Size of zone 0.7 sq. mi 0.74 sq. mi 3.11 sq. mi 66.08 sq. mi 9.7 sq. mi
Service days/hours
7 days a week,
Route 5
service hours
7 days a week,
Route 10
service hours
7 days a week,
Route 3 service
hours
Friday and
Saturdays, 11
pm – 2:30 am
7 days a week,
Route 66
service hours
Staffing
Requirements
3 operators 4 operators 5 operators Program
oversite
Program
oversite
Dedicated Vehicles
1 vehicle 2 vehicles: 1
dedicated, 1
during 6 am –
9 am, 4 pm – 7
pm
3 vehicles: 1
dedicated, 2
during 6 am – 9
am, 4 pm – 7 pm
N/A N/A
Trips per Hour 6.83* 3.77 4.09 33.43 8.63
Cost per Trip $7.42 $13.46 $12.39 $10.75 $13.75
Annual
Operating costs
$169,670 $298,267 $380,535 $130,806 $598,950
* Utilizing paratransit vehicles in the field for excess pickups

22
MOUNTAIN LINE ON-DEMAND FEASIBILITY STUDY
IMPACTS ON MOUNTAIN LIFT
The microtransit programs identified in this On-Demand Study plan to use underutilized paratransit vehicles. Mountain Line currently has eight paratransit vehicles, but five are used in maximum service. These on-demand programs also rely on Mountain Lift paratransit vehicles that are in service to help fill
the surplus demand of the dedicated vehicles. Paratransit vehicles are sometimes standing down for over an hour in the field, waiting for their next pickup. To better utilize the driver and vehicle, drivers would switch over to become on-demand service during these extended breaks. Currently the technology does not exist to have shared rides between paratransit clients and on-demand clients. In
the future, when the technology exists, the microtransit and on-demand programs would ideally work
side by side, sharing rides with on-demand and paratransit passengers to increase capacity. If this shared ride system is implemented, it is important to abide by ADA requirements and the excessive trip length requirement. This requirement states that paratransit trip should be in comparison to the time
required to make a similar trip using the fixed-route system. Another consideration is the added pick up
time for paratransit clients. For example, paratransit vehicles currently go into apartment complexes
to pick up people and sometimes the driver will help a passenger to their door. This can add travel time for customers who already on the vehicle and can delay people waiting to be picked up.
Another consideration to manage demand for the microtransit programs is trip brokering with a TNC. If
there is no available paratransit vehicle and the dedicated vehicle is busy, a trip goes to a TNC to help fill the demand. This would require an agreement with a TNC company and the microtransit software
company to allow trips to dispatch to the TNC company. This would keep operating costs lower than adding an additional vehicle to meet demand. It is also more dynamic, since the TNC vehicles are
already in the field and can react more quickly than Mountain Line dispatching an additional vehicle,
assuming there is staff available. The payment process for the TNC trip would need to be established prior to implementing a brokerage model.
ANTICIPATED GROWTH
Since the on-demand programs are more flexible than Mountain Lift and include same day booking,
online payment, and real-time arrival estimates; it is anticipated that some paratransit clients will start
using the microtransit service instead of Mountain Lift. Mountain Line staff will need to have a way to
track when a vehicle is in paratransit use compared to microtransit use to understand the cost associated with each program. To understand if there are cost savings, staff would track trips made by
paratransit clients and then use cost per microtransit trip verse cost per paratransit trip.
In FY2018, the Mountain Lift cost per trip was $36.70. By increasing the capacity on the vehicles,
especially when there is down time between pickups, the cost per trip will decrease since the vehicles
are more efficiently used. Another consideration to decrease cost is for the programs is to integrate in the future. This integration would have additional efficiencies such as shared software costs and management.

23
MOUNTAIN LINE ON-DEMAND FEASIBILITY STUDY
Chapter 5: Implementation This chapter provides recommendations and phasing of the on-demand programs analyzed in this On-
Demand Study. The phasing recommendations are based on the need, readiness, and feasibility of the program. This chapter also provides a five-year budget, policy considerations, federal requirements, and marketing suggestions.
RECOMMENDATIONS
The results of this On-Demand Study suggest the first on-demand program to be considered is the
Thorpe Loop program, a microtransit program replacing a section of Route 5. The program provides a variety of benefits to the Mountain Line system and its customers. In addition, this area has the highest
activity of paratransit pickups analyzed in this On-Demand Study, so it would be a good testing ground
to understand if paratransit vehicles can be utilized for a microtransit program. To test this out, a demonstration program is recommended prior to officially streamlining Route 5. The demo would be
for a small group of people, for example Clark Homes residents, to understand the type of demand from this development and if existing paratransit vehicles in the field can provide trips during down time. If this is successful, a larger scale demo, marketed throughout the city could be for six months to a year.
The second program to be considered is Late-Night program. Late-night service has been a request on
Mountain Line’s Never Rider Community Survey and Mountain Line’s Onboard Survey for several years.
It is recommended to smooth spans to 11 pm on fixed-route per the Mountain Line 5-Year Transit Plan on Monday - Saturday. If funding does not allow, the Late-Night program can start at 10 pm to fill the one-hour gap. This would add $70,000 to the Late-Night budget. Filling in the late-night gap with a TNC
partnership is an appropriate first phase into understanding ridership demand and origin and
destination information. To implement this program, mobile ticketing on the fixed-route and an
agreement between a TNC company allowing for fare integration in the app will need to be established.
The next on-demand program to implement would be University Heights. This area has the most frequent fixed-route connections, making it the most feasible first mile-last mile connection. If this area
is successful, then Country Club/Industrial Drive could be considered. However, both options require having a complete trip planning app with fixed-route coordination in place prior to implementation to ensure customers are making their connections on time.
Lastly, Doney Park is not recommended at this time. Funding for this program poses a challenge since it is outside of Flagstaff city limits. In addition, TNC availability in Doney Park is another issue that would
need to be addressed before the program is implemented. Due to the large service area and high ridership numbers, Mountain Line would need 3 - 4 dedicated vehicles in the area for microtransit. This
equates to over $700,000 in operating costs and Mountain Line would need to buy additional vehicles.
IMPLEMENTATION PHASES
Table 14: Implementation Phases on on-Demand programs
Phase 1 Phase 2 Phase 3 Thorpe Loop Late-Night University Heights
Country Club/Industrial

24
MOUNTAIN LINE ON-DEMAND FEASIBILITY STUDY
IMPLEMENTATION TIMELINE
A demo is recommended to test and confirm the contents in this Study. If the demo is successful, this
timeline applies. Otherwise, modify request for proposal timeline and move dates accordingly.
Table 15: Implementation timeline of on-demand programs
Activities 2020 2021 2022
F M A M J J A S O N D J F M A M J J A S O N D J F M A M
Draft/Publish RFI
for Thorpe Loop
demo
Develop and
conduct
marketing
campaign
Train drivers
Implement Thorpe
Loop demo
without changing
Route 5
Debrief demo
Request for
Proposals process
Implement Thorpe
Loop
Streamline Route
5
Initiate
conversations
with TNCs for
Late-Night service
Sign contracts
with TNCs/Taxis
Conduct
marketing
campaign
Implement Late-
Night program
Train drivers on
First mile-last mile
program
Develop and
conduct
marketing
campaign
Implement
program

25
MOUNTAIN LINE ON-DEMAND FEASIBILITY STUDY
MEASURES OF SUCCESS
When implementing a pilot program, it is important to identify performance measures beforehand and track them during to understand if the pilot program is successful and should continue. Below are several performance measures in categories of high, medium, and low, ranging from the most critical
factors that should be tracked closely to factors that are less important in the decision making of whether to continue the program or not. These performance measures are intended for a pilot of 6 months to a year.
For a smaller demo program in the Thorpe Loop area, lasting 2 weeks to a month; key performance
measures to track will be ridership, wait times, number of calls and complaints, number of shared rides,
and number of trips transferring to fixed-route. The demo is intended to understand the demand of the program and number of vehicles needed to meet the demand. It will provide a testing ground to understand if paratransit vehicles in the field have the capacity to pick up on-demand customer during
their down-time. After the demo, a survey to customers would also be beneficial to understand if
customers preferred this service over fixed-route, understand if the service was easy to use, and
challenges associated.
Table 16: High performance measures to track
Performance Measure Data Needs Program Associated Riders paying about 18% of trip costs
(similar to fixed-route)
Ridership and fare box return All
Ridership of pilot program is
increasing
Ridership All
Wait times are 15 minutes or less Average wait time All
Majority of trips are shared rides Number of shared rides All
On-demand service is less expensive
than adding a bus on Route 5
Program cost for Thorpe Loop
program and cost for additional
bus
Thorpe Loop
Table 17: Medium performance measures to track
Performance Measure Data Needs Program Associated Ridership increases at first mile-last
mile bus stops
Baseline ridership at bus stops,
ridership at bus stops during
program
University Heights and Country
Club/Industrial
Majority of trips transfer to fixed-
route
Number of on-demand trips,
number of transfers (make sure
systems are integrated)
All
Majority of trips utilize the app for
booking and payment
Number of on-demand calls, and
cash payment
All
Higher ridership on Route 5 after
streamlining
Baseline ridership on Route 5,
ridership during program
Thorpe Loop
Table 18: Low performance measures to track
Performance Measure Data Needs Program Associated Number of Mountain Lift clients
using the service increases
Number of profiles created,
number of trips taken, Mountain
Lift ridership
All

26
MOUNTAIN LINE ON-DEMAND FEASIBILITY STUDY
FIVE-YEAR BUDGET
Table 19: Five-year budget for on-demand programs
Year 1 Year 2 Year 3 Year 4 Year 5
Program implementation
Thorpe Loop Thorpe Loop,
Late-Night
Thorpe Loop,
Late-Night,
University
Heights
Thorpe Loop,
Late-Night,
University
Heights,
Country
Club/Industrial
Thorpe Loop,
Late-Night,
University
Heights,
Country
Club/Industrial
Annual Operations
$169,670 $300,476 $598,743 $979,278 $979,278
One-time start-
up software costs
$35,000 N/A N/A N/A N/A
Annual
Technology fees
$9,000 $9,000 $27,000 $54,000 $54,000
Fleet Costs *If
Mountain Lift is at capacity
$160,000 N/A $320,000 $480,000 N/A
Total Cost $373,670 $309,476 $945,743 $1,513,278 $1,033,278
FUNDING
According to peer city research, majority
of the programs use local funds to
operate on-demand services. The local funds include savings from eliminated
fixed-route service, local sales tax, and
fare recovery from the program.
The City of Arlington uses FTA formula 5307 funding for operations, but since this is the only public transportation
option in the city, those funds are
available. Valley Regional Transit uses 5307 funding and the City of Boise pays for local match. Marin Transit uses 5310 funds for operations, but these funds are
limited for trips serving seniors and people with disabilities. Each of these
agencies followed federal regulations, such as having accessible vehicles and reporting.
Gwinnett County operates its microtransit program with Congestion Mitigation and Air Quality Improvement Program (CMAQ). Flagstaff is not currently eligible for CMAQ funds as the city is in
attainment with air quality standards.
FUNDING SOURCES FROM PEER PROGRAMS
Local funds Funding from cut routes
FTA CMAQ
Figure 10: Funding sources from peer programs

27
MOUNTAIN LINE ON-DEMAND FEASIBILITY STUDY
REVENUE OPPORTUNITIES
The FTA has a Mobility On-Demand (MOD) Sandbox grant which was released in FY2016 and FY2019. In FY2019 the grant had three focus areas: payment integration, autonomous vehicles, and seamless transportation integration. This grant is for one-time funds to help start and operate a one-year pilot
program. The FTA currently does not have long-term operating funds for on-demand programs.
Another revenue source would be from public-private partnerships. For example, partnering with the Downtown Business Alliance (DBA) to pay for late night trips or the J.C. Montoya Senior Center to help pay for trips within Thorpe Loop. The first step would be to start conversations with the organization
and determine budget capacity. A service agreement would be required to determine funding amount
and duration.
POLICY CONSIDERATIONS
FARE STRUCTRE
For the Thorpe Loop program, it is recommended fare would be the same structure as the fixed-route
system. Since the Thorpe Loop is replacing existing fixed-route service, fares should not increase. A day pass would be valid on the fixed-route as well. (Adults are $1.25 for one-way and $2.50 for day pass.)
For the first mile-last mile programs (University Heights and Country Club), a higher fare can be considered since this an added service. It is suggested that customers would pay a higher price for the first mile-last mile on-demand trip but receive a free fixed-route day pass. Based on peer cities, a
recommendation of $5 for a day pass should be considered. Since this is a different program, Mountain Line’s existing fare products, such as monthly pass and ecoPASS, would not be included in this program.
A comprehensive fare product including unlimited on-demand and fixed-route trips can be considered at a higher price point to capture the on-demand trips.
For Late-Night service, the customer would pay $1.25 towards a TNC or taxi trip and Mountain Line
would subsidize the rest of the trip. This is not part of a day pass but is in-line with Mountain Line’s one-way fare when the bus is otherwise unavailable. To receive this subsidy, the customer would have to take a fixed-route one half of their journey. Mobile ticketing on the fixed-route system and a partnership
agreement with a TNC will make this integration feasible. Since this is a different program, Mountain Line’s monthly pass and ecoPASS would not be included in this program.
Fare integration between the on-demand program and fixed-route system is important so the customer can have a seamless journey between both systems and to promote the use of people connecting to
fixed-route system. Mobile ticketing on the fixed-route system will make this integration much easier.
PAYMENT
The on-demand programs are technology based and customers are encouraged to use the smartphone app to pay for their trip. Fare integration between the on-demand program and fixed-route system is
important so the customer can have a seamless journey between both systems and to promote the use of people connecting to the fixed-route system.
There is more information on how to meet the needs of passengers with no smartphone and/or
unbanked customers under Civil Rights Compliance.

28
MOUNTAIN LINE ON-DEMAND FEASIBILITY STUDY
CIVIL RIGHTS COMPLIANCE
TITLE VI
When implementing the microtransit services, Mountain Line’s Title VI outreach process will need to be
conducted in all the microtransit zones since service is either increasing frequency (University Heights and Country Club) or service is being reduced (Route 5 in Thorpe Loop). Title VI will include a comment
period of at least 30 days prior to implementation of service. Even though service in Thorpe Loop area is being replaced with a microtransit service, it could still be perceived as a reduction in service. The
public process can serve as rider engagement and education on the benefits of microtransit compared to fixed route. The public process will not be required for demonstrations that have the intent of ending and be evaluated after the service. However, public process will be triggered after the demo and before
the regular service is launched.
CUSTOMERS WITH NO INTERNET OR SMARTPHONE ACCESS
For the microtransit programs, customers with no Internet or smartphone access would call into Mountain Line’s dispatch to schedule a ride, acting as a call center. The call center allows customers to
call in for booking a vehicle at the same standard as someone with a smart phone. According to peer research, advertising the app and conducting trainings on the app will reduce the number of people
calling in, therefore reducing the need for additional staff.
For the Late-Night program, customers can call the taxi companies that are part of the program if they
do not have a smart phone. There is also a company called GoGo Grandparent which provides a simple to use, 24/7 call-in option to hail Ubers and Lyft.
LIMITED ENGLISH PROFICIENCY (LEP)
To comply with Mountain Line’s LEP plan and to increase access to the on-demand programs; the app
used for the on-demand programs and informational materials will at minimum be available in Spanish.
UNBANKED CUSTOMERS
Unbanked customers are people who are not served by a bank or similar financial institution and relies on the use of cash rather than checks or credit cards. For microtransit, the paratransit vehicles currently
do not have fare boxes installed, but would need to install to allow for use by cash-only customers. The
fare boxes that are used on Mountain Line’s fixed-route boxes cost $2,850 each. These fareboxes are
large and would be a challenge to fit on the paratransit vehicle. Smaller farebox solutions would need to be researched to find a solution to accept cash payment on-board. The Late-Night program,
customers without a bank account can use a taxi company that is part of the program.
SERVICE AREA PROVISIONS
PICK UP POLICY
The microtransit service should only be a curb to curb service. Policy should prevent vehicles going into drive ways or driving into apartment complexes. The customer should be alerted when the vehicle is 5
minutes away and will be encouraged to wait outside for the vehicle. The vehicle should wait for 2
minutes, and if the customer is not ready to board, the vehicle will leave to its next destination.
WAIT TIMES
To ensure the attractiveness of the program, a goal is to keep wait times to 15 minutes or less. The on-demand app will display real-time arrival information and customers can also track the vehicle as well. If wait times continue to exceed 15 minutes, an added vehicle will be needed in the area to help alleviate

29
MOUNTAIN LINE ON-DEMAND FEASIBILITY STUDY
demand. Another consideration to manage demand for the microtransit programs is trip brokering with
a TNC. If there is no available paratransit vehicle and the dedicated vehicle is busy, a trip goes to a TNC to help fill the demand. TNC integration with the app will be needed for this to be feasible.
It can also be considered to have customers walk up to 2 blocks of their pick-up location to ensure efficient service. This can help group riders together and can also reduce drive time. This will only be for able bodied individuals. Individuals need to be able to put preferences in the app if they are unable
to walk this distance.
FEDERAL REQUIREMENTS
Mountain Line receives Federal Transit Administration (FTA) grant funds for transit operations and capital projects. Therefore, it is Mountain Line’s responsibility to comply with statutory and regulatory
requirements associated with the management of federally assisted grants. Mountain Line complies
with all mandated procedures such as legal, financial, and technical capacity to carry out programs, procurement requirements, and all applicable civil rights statutes.
DRUG AND ALCOHOL TESTING REQUIREMENTS
Under federal transit law, public transportation operations that receive financial assistance under the
FTA’s programs must conduct controlled substance and alcohol testing of public transportation employees, contractors, and subcontractors as well. This law can cause challenges when partnering
with TNC companies since all the drivers would be considered safety-sensitive positions and would have to follow the federal drug and alcohol requirements. However, there is one exception to this
regulation, which is called the taxi cab exception. In general, when there are two or more TNC or taxi
companies to choose from, the testing regulations do not apply. The rationale for this is the practical
difficulty of trying to administer a drug and alcohol testing program in connection with multiple companies. For any TNC or taxi partnerships, in order to abide by drug and alcohol requirements, two
or more companies would need to be included in the program.
AMERICANS WITH DISABILITIES ACT (ADA)
The Americans with Disabilities Act (ADA) of 1990 are a set of specific requirements transit providers
must follow to ensure their services, vehicles, and facilities are accessible to and usable by individuals with disabilities. The ADA applies to almost all providers of transportation service, whether private or
public, and whether or not an entity receives Federal financial assistance.
When transit systems partner with a TNC or taxi company, ADA regulations still apply. For the service
to be considered accessible, some vehicles, whether provided by the TNC or taxi entity, the transit
agency, or another contractor, must be accessible to passengers who use wheelchairs, such that the service to passengers with disabilities is equivalent to that provided to passengers without disabilities.
In Flagstaff, there is limited access to accessible vehicles for TNCs and taxi companies. Mountain Lift
could fill in the ADA trips, however this can be an issue for the Late-Night program since paratransit is
not running during those hours. Valley Regional Transit in Idaho partnered with Non-Emergency Medical Transportation (NEMT) providers since no taxi companies had ADA vehicles. This could be an option in Flagstaff to help address ADA requirements during hours when paratransit is not operating but needs to be addressed prior to implementation.

30
MOUNTAIN LINE ON-DEMAND FEASIBILITY STUDY
NATIONAL TRANSIT DATABASE (NTD)
Recipients or beneficiaries of grants from the FTA are required to submit data to NTD. According to peer city research, microtransit programs are reporting unlinked passenger trips (UPT), vehicle revenue hours (VRH), and vehicle revenue miles (VRM) under demand response.
Contracts with TNC for on-demand, shared mobility service may be included in NTD reporting. To report TNC trips to NTD, the trip must be shared, meaning passengers are grouped together based on passenger origins and destinations. Currently, Uber and Lyft do not have a shared ride feature in Arizona since there is not enough volume of TNC trips in this state yet. For these services to be implemented,
there needs to be a certain volume of ride requests to assume that there is efficiency for multiple riders
to be matched. Therefore, trips cannot be counted until that option is available.
DATA SHARING
New transportation technologies such as bike share, scooter share, and TNCs are operated by private
mobility companies and produce unprecedented amount of data generated by their customers. The data streams contain important information for the public sector to aid in planning, policy making, and
vital regulation and oversight. Although these companies are operating in the public right-of-way, the
data is not always obtainable by the public entities. When entering into a public-private partnership with a mobility company, a data sharing agreement in the contract is necessary in order to obtain the
data needed for planning and program oversight. An example of Pinellas Suncoast Transit Authority (PSTA)’s contract with Uber can be found in Appendix D.
VEHICLES
The proposed microtransit programs would
use Mountain Line’s existing paratransit
vehicles. These are standard cutaway buses
that are ADA wheelchair accessible. Currently, Mountain Line has eight vehicles but only five
are used during peak demand. If additional vehicles are needed, it is recommended to look
at different vehicle types, such as mini-van style or Ford Transit van. Research from microtransit programs that use cutaways show
that there can be a negative stigma associated with using paratransit vehicles. In addition, they are not
as comfortable as a mini-van type solution or Transit van, which detracts from the attractiveness of the service. To note, the lifecycle costs are different between the vehicles. The Transit Van is around $55,000 and have a shorter useful life compared to the cutaways which are $160,000 but can last around seven years or longer.
MARKETING
Marketing is a crucial aspect when implementing an on-demand program since this is typically a new
type of service in a community. Based on peer research, one of the top lessons learned from other on-
demand programs is to have a robust marketing plan. This includes tabling events to teach people
how to use the app, flyers in the mail, social media, lunch and learns, and advertisement on websites.
Figure 11: Mountain Lift Paratransit vehicle

31
MOUNTAIN LINE ON-DEMAND FEASIBILITY STUDY
AUDIENCE
Table 20: Marketing audiences
Type of audience Definition Collateral materials
General Public People in Flagstaff and surrounding
neighborhoods in the FMPO
Social media ads on Mountain Line and other
partners’ pages, Mountain Line website, press
release, notifications at DCC, Kaspar Office,
and MCC, tutorial on how to use the program
(video or flyer).
Targeted Group Neighborhoods, community
centers, and businesses within and
surrounding the on-demand zone
Tabling events at community events (i.e.,
farmers markets), flyers mailed to houses,
flyers distributed to businesses, lunch and
learns at large employers (i.e., Flagstaff
Medical Center).
MESSAGING
Messaging for an on-demand program should be creative, catchy, and simple. Since it is a new service and requires some explaining on how to use the program, the messaging should provide basic steps on
how to use the service, which app to download, and show a map of the zone. Several agencies have created how-to videos which are posted on their website and social media.
Naming is also an important aspect of branding the program and making it
attractive to users. For example, San Joaquin Regional Transportation District
(RTD) has a microtransit program called Van Go!, inspired by the Dutch painter
Vincent van Gogh. Each vehicle has a
different van Gogh painting on the side of
the vehicle. Others include Pick-Up by Cap Metro in Austin, Texas and Go Dublin!
from Tri-Valley Wheels in Dublin, California.
Agencies throughout the U.S. have put forth innovate and creative marketing events to promote their on-demand programs. A few examples include:
• “Appy Hour”: Big Blue Bus in Santa Monica partnered with Lyft to provide MODE (Mobility On-Demand Every Day). This service is a curb-to-curb, on-demand program for senior and individuals with disabilities. To teach people how to use Lyft, the agency created an event
called “appy hour.” A staff member went to senior housing, community spaces, and senior centers to explain step by step on how to use the app. This included downloading, entering
credit card information, hailing a ride, etc. After these events, more seniors started to use the app instead of calling into Big Blue Bus’s call center.
• Boots on the Ground: When City of Arlington implemented their microtransit service with
Via, they had staff members conduct a “boots on the ground” marketing approach. This included setting up tables at Walmart and other popular areas. Staff helped people download the app and explain how to use the service.
Figure 12: San Joaquin RTD Van Go! Ad. Source:sanjoaquinrtd.com

32
MOUNTAIN LINE ON-DEMAND FEASIBILITY STUDY
Appendix
Appendix A: Private Software Companies for microtransit
Appendix B: Estimated Ridership in Flagstaff Metropolitan Planning Organization (FMPO)
Appendix C: Risk Assessment of on-demand programs
Appendix D: Pinellas Suncoast Transit Authority (PSTA)’S contract with Uber
Appendix E: Program design spreadsheet
Appendix F: Peer city research spreadsheet

33
MOUNTAIN LINE ON-DEMAND FEASIBILITY STUDY
APPENDIX A: PRIVATE SOFTWARE COMPANIES FOR MICROTRANSIT
The following provides detailed information about private software companies for microtransit services. The companies researched include TransLoc, Via, Routematch, Ecolane, and Transdev. This is not an exhausted list of private software providers. The information was gathered in October 2018.
TRANSLOC
TransLoc is a technology provider with the mission to make public transit the first choice for all.
TransLoc provides transit agencies will the tools to optimize their service, through real-time tracking and dispatch for fixed-route, transit model app for passengers, and On-Demand software solution for microtransit. In January 2018, TransLoc joined Ford Smart Mobility Business Group. Through this partnership, TransLoc has a focus on “ushering in the future of mobility with agency-owned flexible microtransit solutions.”
SOLUTION
TransLoc provides software for operating microtransit. This includes On-Demand Dispatching and real-
time rider communications and tracking. Currently TransLoc has implemented 36 pilots through the United States. These pilots have been used to tackle transportation issues such as first mile-last mile
connection, underperforming routes, and underserved areas.
TECHNOLOGY AND HARDWARE NEEDS
The technology needs from the transit agency are minimal. Each vehicle needs an iPad to run the driver
app, which provides a map and directions of the route. It also includes passenger information, such as name, number of passengers, and picture (optional) so the driver knows who and how many people
they are picking up.
FARE
The price of fare is very flexible and up to the agency. Most agencies have made the microtransit service
free during the pilot period. Others, who have fareboxes installed in the vehicles, take cash only.
TransLoc does not have payment integration with the app, limiting the flexibility of pay options.
EQUITY
TransLoc has both a call option and app-based option to request rides. A smart phone is not required to use this service, but the app-based option is faster, and the user can see wait times and estimated
arrival. Vehicles are provided by the transit agency, so the vehicles can be ADA accessible. Many agencies have repurposed paratransit vehicles. The app does not have any features for people who are
visually impaired, and the app is only in English.
DATA
TransLoc provides the transit agency with all the data and the agency can keep the data. Data includes origin and destination, ridership, and passengers per hour. TransLoc is flexible to work with the agency
if other data points are desired. Ridership data can be used for NTD reporting.
COST
Currently, TransLoc is focusing on implementing pilots with transit agencies. Ford Mobility is
subsidizing pilots, which include use case consulting, simulator tool (estimates which use cases are most successful), implementation (includes weekly calls, training, help with staging), and marketing support throughout the whole pilot. Ford Mobility is subsidizing the first 44 pilots at $25,000 for a 6-

34
MOUNTAIN LINE ON-DEMAND FEASIBILITY STUDY
month pilot. After the pilot, the software costs are $500 for 1-5 vehicles per month, $450 for 1-6 vehicles
per month. Without the subsidy, a pilot costs $114,175.
PLANNING ASSISTANCE
TransLoc has a simulator tool which takes origin and destination data, census data, paratransit data, and other data sources to predict ridership and estimate if certain areas or use cases, would be more successful than others. They predict passengers per hour and ridership.
WHAT STANDS OUT?
TransLoc is focusing on starting pilots with transit agencies, and Ford Mobility is subsidizing majority of the cost. This software is new to TransLoc and the company is using pilot projects to “fool-proof” the
software. There are currently 36 pilots on-line and the simulator tool has been 90% accurate in predictions verse outcomes. TransLoc has a strong focus on partnership and working with the transit agency step by step. Their microtransit app is not customizable and does not reflect the branding of the
transit agency. They do not have dynamic routing capabilities. Meaning, once a vehicle’s route is
created, if another customer requests a ride along the recently created route, the route will not change and deviate to pick them up, reducing the efficiency of the vehicle and extending wait times.
VIA
Via is a real-time hailed, dynamically routed shuttle service. Their mission of “we ride together”, represents the various technology options the company delivers to match riders together who are
traveling with similar origins and destinations. Via provides a Transportation Network Company (TNC) option, Ride with Via, which is currently deployed in Chicago, New York, and Washington DC. Via also
has a microtransit platform as both software only and turn-key option.
SOLUTION
Via boasts to have the “technology for the future of mobility.” Through Via’s microtransit platform,
there is powerful rider aggregation algorithm, dynamic predictive routing, and custom apps. Via has a Transit as a Service (TaaS) model, providing a turn-key solution. They also have a software as a service
(SaaS) solution to integrate the software with agency operations. Their solutions have been deployed
to tackle first mile-last mile solutions and frequency vs. coverage tradeoff.
TECHNOLOGY AND HARDWARE NEEDS
The technology needs from the transit agency are minimal. Each vehicle needs a tablet or smartphone to run the driver app, which provides a map and directions of the route. It also includes passenger
information, such as name, number of passengers, and picture (optional) so the driver knows who and how many people they are picking up.
FARE
The price of fare is very flexible and up to the agency. Most agencies have made the microtransit service free during the pilot period. Via is primarily a cashless service. There is payment integration with the
app. There is also an option for people who do not have bank services. Customers can pay cash to buy pre-paid vouchers at, for example a grocery store. Then, customer enters voucher code in the app.
EQUITY
Via has both a call option and app-based option to request rides. A smart phone is not required to use
this service, but the app-based option is faster, and the user can see wait times and estimated arrival. With the TaaS model, vehicles can be ADA accessible. Through the SaaS model, vehicles are provided

35
MOUNTAIN LINE ON-DEMAND FEASIBILITY STUDY
by the transit agency, so the vehicles can be ADA accessible. Many agencies have repurposed
paratransit vehicles. There is both a cash and credit card option. The app has features for people who are visually and hearing impaired, such as multiple font sizes and voice over capabilities. The app can
also come in multiple languages.
DATA
Via provides the transit agency with all the data and the agency can keep the data. Data includes origin and destination, ridership, and passengers per hour. Via is flexible to work with the agency if other data
points are desired. Ridership data can be used for NTD reporting.
COST
Through the SaaS model, a 6-month pilot is $23,500 and a 12-month pilot is for $44,000. Via mentioned that pilot price is negotiable. Without a pilot, for example through an RFP process, there is $40,000 set up fee, then it is $700 per vehicle per month. The TaaS model is $45-$49 per service hour.
PLANNING ASSISTANCE
Via helps with planning through goal setting, data collation, simulation of service, service model design
(help define the on-demand transit service parameters), launch support, marketing, and performance
optimization throughout the pilot.
WHAT STANDS OUT?
Via is the only private company providing a turn-key option. There are less pilots and active programs compared to TransLoc, but Via has more customization features and has been established longer as a
company. Via provides planning and implementation services and is also willing to work together with agencies. In addition, since Via has TNC deployment and a turn-key option, Via understands operations
and customer satisfaction from a holistic point of view, not just from the software perspective. Therefore, the company is continuing to make improvements to the customer and driver experience
and optimize the best performance and utilization of vehicles.
ROUTEMATCH
SOLUTION
Routematch provides software solutions for demand responsive vehicles, fixed-route, payment
integration, and on-demand software. They develop human centric solutions that connect people to new opportunities. Routematch has a partnership with Lyft to maximize transportation options and
help fill first mile-last mile gaps.
TECHNOLOGY AND HARDWARE NEEDS
The hardware needs from the transit agency are minimal. Each vehicle needs a tablet to run the driver app, which provides a map and directions of the route.
FARE
The price of fare is very flexible and up to the agency. Most agencies have made the microtransit service free during the pilot period. Routematch is focusing on payment integration and mobility as a service
platform. Payment through the app can also be integrated with Lyft. Payment can be through the app, but can also be cash on-board.
EQUITY
Routematch has both a call option and app-based option to request rides. A smart phone is not required to use this service, but the app-based option is faster, and the user can see wait times and estimated

36
MOUNTAIN LINE ON-DEMAND FEASIBILITY STUDY
arrival. Vehicles are provided by the agency, so they can be ADA accessible. Many agencies have
repurposed paratransit vehicles. There is both a cash and credit card option. The app has features for people who are visually and hearing impaired, such as multiple font sizes and voice over capabilities.
The app can also come in multiple languages.
DATA
Routematch provides the transit agency with all the data and the agency can keep the data. Data includes origin and destination, ridership, and passengers per hour. Routematch is flexible to work with
the agency if other data points are desired. Ridership data can be used for NTD reporting.
COST
Routematch has a “pay as you go” option to reduce the cost barrier. A cost estimate is $1,000 per vehicle per month. A 6-month pilot with 6 vehicles is $45,000 - $50,000. Software and licensing is about $125,000 after the pilot. Routematch can help with funding and is open to negotiating costs.
PLANNING ASSISTANCE
Routematch can help with planning, such as best case uses and number of vehicles. They also help with
setting fare prices.
WHAT STANDS OUT?
Routematch has been creating dispatching software for fixed-route and demand responsive operations
since 2000. Their payment integration and on-demand software are new platforms for the company. They do not have as many pilots or existing programs that are using the software compared to Via or
TransLoc.
ECOLANE
SOLUTION
Ecolane specializes in demand response management software and Mobiltiy as a Service (MaaS). The company prides itself on reliable and innovative solution, backed by trusted customer relations. The
demand responsive management software provides real-time, logic-based schedule optimization. The
company has partnered with Amazon’s Alexa, so customers can book, change, and review upcoming trips by using the interactive voice response.
TECHNOLOGY AND HARDWARE NEEDS
The hardware needs from the transit agency are minimal. Each vehicle needs a tablet to run the driver app, which provides a map and directions of the route. The customer app is accessible on iOS and
Android platforms. The customer app has trip details, real-time arrival, flexibility to manage trips.
FARE
Fares are flexible and up to the agency. There is payment through the app, also a cash option on-board
if desired.
EQUITY
Ecolane has both a call option and app-based option to request rides. A smart phone is not required to use this service, but the app-based option is faster, and the user can see wait times and estimated arrival. Vehicles are provided by the agency, so they can be ADA accessible. Many agencies have
repurposed paratransit vehicles. There is both a cash and credit card option. The app has features for people who are visually and hearing impaired, such as multiple font sizes and voice over capabilities. The app can also come in multiple languages.

37
MOUNTAIN LINE ON-DEMAND FEASIBILITY STUDY
DATA
Ecolane provides the transit agency with all the data and the agency can keep the data. Ridership data
can be used for NTD reporting.
COST
The mobility on-demand software is $29,000 for the first year and 20% less the next year. This includes
the app, Alexa application, website, and call lines. There is also an implementation start-up fee, which differs between each agency. For the licensing, it is $4,000 per year, and 20% less the next year.
PLANNING ASSISTANCE
Ecolane does not help with planning or have predictive modeling capability to estimate ridership and efficiency.
WHAT STANDS OUT?
Ecolane specializes in real-time dynamically routing. For example, if a vehicle is running late or breaks
down, the software can automatically distribute the trips to different drivers. The feature is not on TransLoc’s software. In addition, Ecolane is focusing on MaaS, integrating other modes and trips
together with one payment.
TRANSDEV
SOLUTION
Transdev is a full-service provider, including turn-key solutions, demand responsive brokerage, on-
demand software, and autonomous vehicle partnerships. The company promotes itself as “The Mobility Company”, striving to be on the cutting edge of mobility services. For on-demand service,
Transdev provides a hybrid model for turn-key services, meaning certain services can be contracted out through Transdev. They also provide payment integration through their app.
TECHNOLOGY AND HARDWARE NEEDS
The hardware needs from the transit agency are minimal. Transdev provides a tablet for each vehicle. The driver app provides a map, directions of route, and details of the passenger being picked up. The
customer app is accessible on iOS and Android platforms. The app is customizable and can be branded
based on the transit agency’s program. The customer app has trip details, real-time arrival, flexibility to
manage trips.
FARE
Fares are flexible, and the agency decides the rate. There is payment through the app, also a cash option
on-board if desired.
EQUITY
Transdev has equity at the center of their microtransit services. Transdev can provide a calling center
option to help with scheduling a trip. A smart phone is not required to use this service, but the app-
based option is faster, and the user can see wait times and estimated arrival. Transdev can provide wheelchair accessible vehicles, or the transit agency can provide vehicles. The app has features for people who are visually and hearing impaired, such as multiple font sizes and voice over capabilities. The app can also come in multiple languages.
DATA
Transdev provides the transit agency with all the data and the agency can keep the data. Ridership data
can be used for NTD reporting.

38
MOUNTAIN LINE ON-DEMAND FEASIBILITY STUDY
COST
Turn-key services is $28 - $33/hr. The call center is about $1.80 per call. The app with branding is $15,000
- $35,000 per year, depending on if there will be payment integration with fixed-route system, or the
level of customization.
PLANNING ASSISTANCE
Transdev does not provide planning assistance but would contact planning work to AECOM if needed.
WHAT STANDS OUT?
Transdev provides a flexible turn-key option. They also have a call center option to help with customer
service. They partner with autonomous vehicle (AV) companies and are working towards an on-demand AV option. They have a trip brokerage option, to maximize transportation options for the customer.

39
MOUNTAIN LINE ON-DEMAND FEASIBILITY STUDY
APPENDIX B: ESTIMATED RIDERSHIP IN FMPO
Percentages of travel was first gathered from StreetLight Data Location-Based Services (LBS) for an Average Weekday in 2017 based on actual travel to and from origins and destinations in the FMPO. FMPO's Regional Travel Model was used to convert percentages to trips for an Average Weekday in Fall
2017 excluding internal trips in the destinations and trips from outside the FMPO. The Regional Travel Model trips are person trips in automobiles, scaled using the average vehicle occupancy for all
automobiles from the 2012 FMPO Trip Diary (1.46 person per vehicle). Trips were rounded to the nearest 500 to better reflect the accuracy. Estimated Ridership is based on transit mode share from the FMPO
Trip Diary (3%). A range of 3% – 5% is used since on-demand service provides a more convenient, flexible service compared to fixed-route service.
Origins
Destinations
Milton NAU Downtown FMC Sunnyside/4th
Street
Mall Average
Thorpe total trips 2,500 1,000 3,000 500 1,500 500 1,500
Estimated Ridership 75-125 30-50 90-150 15-25 45-75 15-25 45-75
West Route 66 total
trips
3,500 1,500 2,500 500 1,500 1,000 2,000
Estimated Ridership 105-175 45-75 75-125 15-25 45-75 30-50 60-100
Christmas
Tree/Smokerise total
trips
500 500 500 500 1,000 3,000 1,000
Estimated Ridership 15-25 15-25 15-25 15-25 30-50 90-150 30-50
Foxglenn total trips 500 500 500 0 1,500 1,500 500
Estimated Ridership 15-25 15-25 15-25 0 45-75 45-75 15-25
Highway 180 &
Cheshire total trips
2,000 1,500 4,000 1,500 1,500 500 2,000
Estimated Ridership 60-100 45-75 120-200 45-75 45-75 15-25 60-100
Ponderosa Trails total
trips
1,000 1,500 500 500 500 500 500
Estimated Ridership 30-50 45-75 15-25 15-25 15-25 15-25 15-25
University Heights
total trips
2,000 2,000 1,500 500 500 500 1,000
Estimated Ridership 60-100 60-100 45-75 15-25- 15-25 15-25 30-50
Country Club Area
total trips
1,000 500 1,500 500 1,500 3,000 1,500
Estimated Ridership 30-50 15-25 45-75 15-25 45-75 90-150 45-75
Doney Park
/Timberline total trips
500 1,000 1,000 500 1,500 4,000 1,500
Estimated Ridership 15-25 30-50 30-50 15-25 45-75 120-
200
45-75
Kachina
Village/Mountainaire
total trips
500 500 500 500 500 500 500
Estimated Ridership 15-25 15-25 15-25 15-25 15-25 15-25 15-25
Bellemont total trips 500 500 500 500 500 500 500
Estimated Ridership 15-25 15-25 15-25 15-25 15-25 15-25 15-25
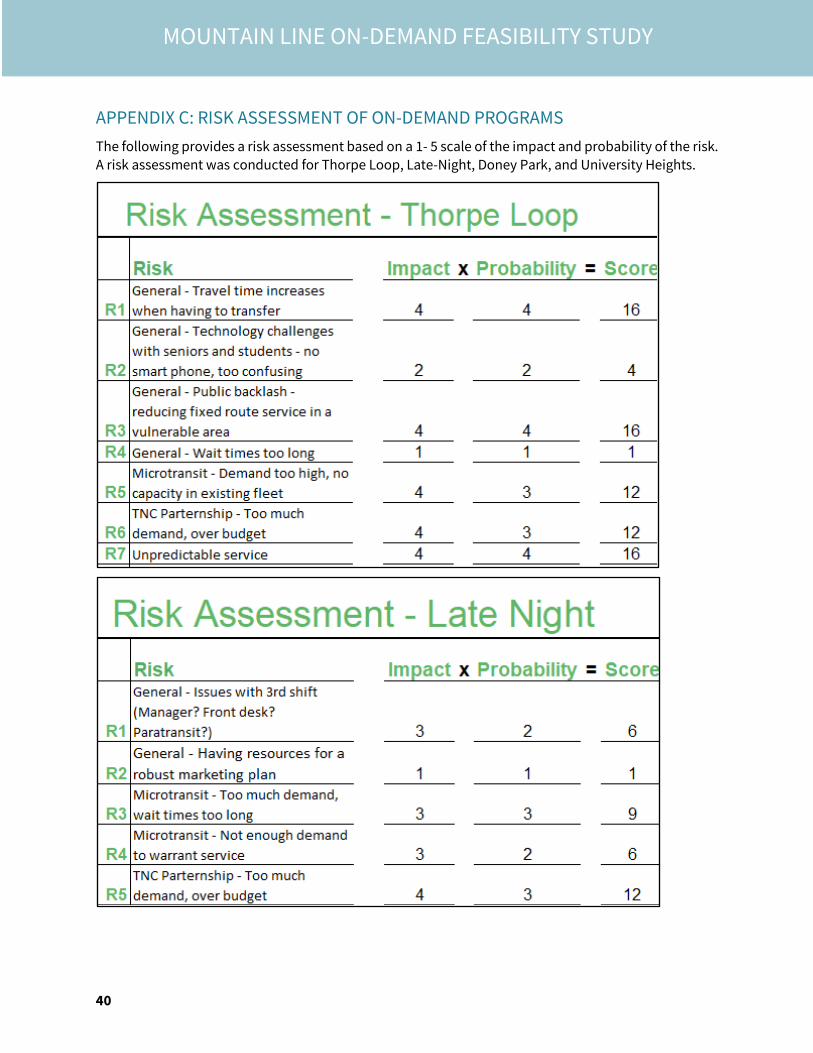
40
MOUNTAIN LINE ON-DEMAND FEASIBILITY STUDY
APPENDIX C: RISK ASSESSMENT OF ON-DEMAND PROGRAMS
The following provides a risk assessment based on a 1- 5 scale of the impact and probability of the risk. A risk assessment was conducted for Thorpe Loop, Late-Night, Doney Park, and University Heights.
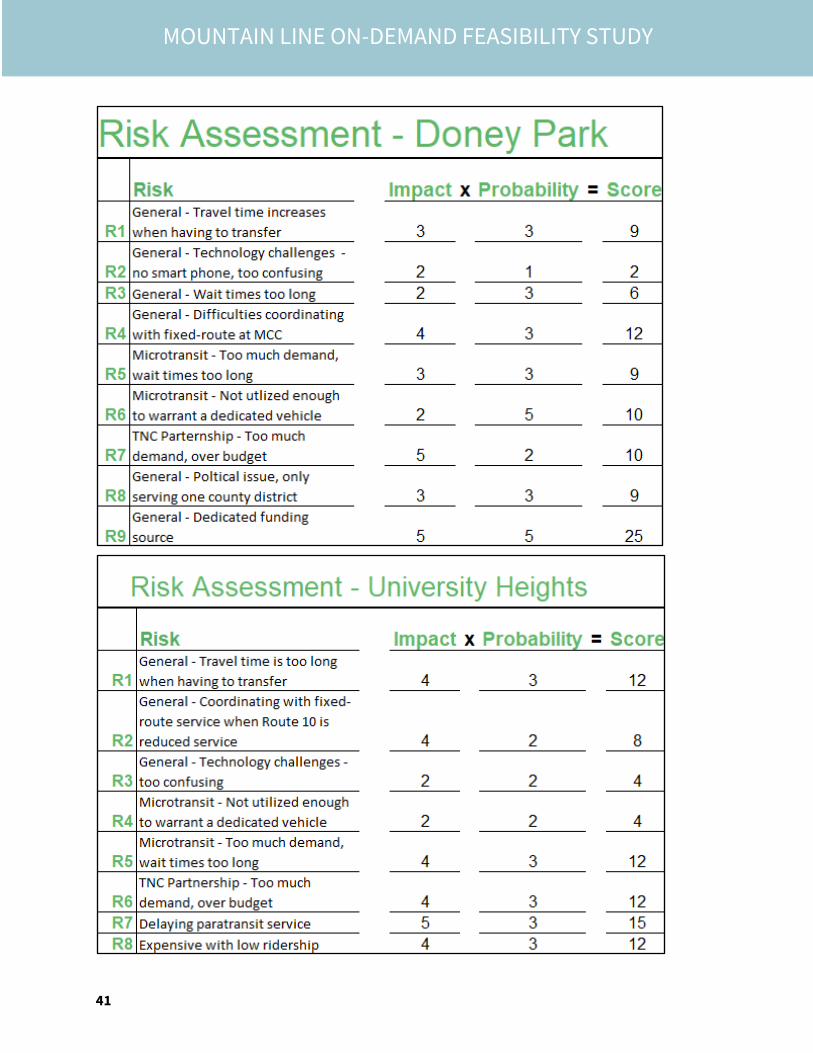
41
MOUNTAIN LINE ON-DEMAND FEASIBILITY STUDY

42
MOUNTAIN LINE ON-DEMAND FEASIBILITY STUDY
APPENDIX D: PINELLAS SUNCOAST TRANSIT AUTHORITY (PSTA)’S CONTRACT
WITH UBER
Link to contract: https://www.apta.com/wp-content/uploads/Contract-Uber-PSTA-Agreement.pdf
Example below:

43
MOUNTAIN LINE ON-DEMAND FEASIBILITY STUDY
APPENDIX E: PROGRAM DESIGN SPREADSHEET
S:\Planning\On-Demand Project\Alt Analysis\Program Design.xlsx

44
MOUNTAIN LINE ON-DEMAND FEASIBILITY STUDY
APPENDIX F: PEER CITY RESEARCH SPREADSHEET
S:\Planning\On-Demand Project\Peer research\Peer Cities.Programs.Companies.xlsx
City of Phoenix San Joaquin Regional Transit
District
Capital Metro Pinellas Suncoast Transit
Authority (PSTA)
Norwalk Transit District
Phoenix, AZ Stockton, CA Austin, TX Pinellas County, FL Norwalk and southwest CT
Name of service RTD Van Go! Pick up by Cap Metro Direct Connect Wheels2U
Type of On-Demand service Partnership with Lyft Turn key style, Mobility-on-
demand rideshare program with
Ecolane
SaaS, on-demand Microtransit utilizing
paratransit vehicles
Partnership with Uber, united
taxi, and wheelchair transport.
Saas, on-demand microtransit
utilizing paratransit vehicles
Description First/last mile solution. Take a Lyft
to the nearest bus stop. New users
use code PHXRIDES for $5 off each
of their first 5 rides to transit
stops. Existing users, use TRANSIT
PHX for 20% off. 6 month pilot in
north and south Phoenix
On-demand ride-share service to
help residents travel more easily
within the Northern San Joaquin
County. 1 year ago has
partnership with Uber for rides,
pay 50% of ride up to $5. Had a 6
month pilot with TransLoc and
now with Ecolane
Capital Metro launched a flexible, on-
demand service that utilizes their
dispatchers, paratransit vehicles, and
operators. Opened system to
paratransit and regular clients.
Geofenced area with low density but
growing area not ready for bus yet.
Take an uber or taxi to 24
locations to help with first or last
mile. Partnership with Uber,
united taxi, and wheelchair
transport. Receives $5 discount
towards the trip.
Started early September. On-demand
ride-share service allowing residents
to request rides and be picked up in
minibus vehicles and bring you to
your destination. Regular fixed route
ends at 7pm, leaving only 2 shuttle
routes till midnight. This
complements late night service.
Goals of program First/last mile San Joaquin has low density
areas, wanted to provide some
level of service to those areas
Provide some level of service to an
area with very little service
Connect people with the core
route network
Provide public transit during late
night hours.
Audience served General public General public General public General public General public, pick up/drop in 2
square mile
Days and hours 24/7 7 days a week, 8am - 5pm 7am - 7pm M-F, 10am - 5pm Sat 6:00am - 11:00pm, 7 days a week Th-Sat 5pm - 12am, Sun 12pm - 9pm
Geofencing Yes, north and south phoenix Yes, specific area, planning to
expand after pilot
Yes, low density area that is growing
but does not warrant fixed route
24 direct connect stops Yes, specific area with train station,
entertainment, restaurants, TOD
housing, large residential area
Transportation gap addressed Spatial, first/last mile Spatial Spatial Spatial, first/last mile Temporal
Operation model Partnership Software as a Service Software as a Service Partnership Software as a Service
Pilot (how long) Yes, 1 year. Start October 2017 Yes, 1 year with Uber, 6 months
with TransLoc
Yes, one year. Ended service June 2,
2018
Yes, started Feb 2016 Yes, 6 months
Partnership with private
company
Lyft Ecolane Via Uber, American taxi, wheelchair
transport
TransLoc
Costs Swap, City gave marketing space at
bus shelters and Lyft gave
discounts to riders. No City money
was directly used
$1 million for a year $10,000 per license per year. $100,000
setting up software. About $200,000 a
year total.
Budget - FY17 $100,000, FY19 -
156,000
$25,000
Funding mechanisms None Bought vehicles with 5310 and
5311. Wanted to use 5311 for
operating, but reporting was too
complicated. Now uses LTF (local
transit funds) not part of FTA
Pilot - Innovative Mobility fund.
Continued service - local sales tax, fare
recovery, and investments. No federal
funds will be used
General funds, all local Partnership between City of Norwalk,
CT, and Norwalk Transit. Some
funding from cut routes, City funds
Fare New Lyft users - $5 for 4 rides.
Existing riders - 20% off of ride
$5 one way trip, free transfers to
buses
Free Pays $5 towards trip Free during pilot. City of Norwalk is
paying up to 25,000 trips
ADA/FTA compliance Used promo code and no FTA
funds being used
All vehicles ADA Yes, paratransit vehicles, Cap Metro
drivers
Uses local funds, has multiple
providers
All vehicles are ADA
Fleet Private vehicles 8 ADA vehicles in pilot phase,
expand to 14 vehicles in January
2019 to be county wide
7 Paratransit vehicles, 4 vehicles at
most
Uber and taxi fleet. Partnered
with Wheelchair transport
2 Paratransit vehicles

45
MOUNTAIN LINE ON-DEMAND FEASIBILITY STUDY
City of Phoenix San Joaquin Regional Transit
District
Capital Metro Pinellas Suncoast Transit
Authority (PSTA)
Norwalk Transit District
Phoenix, AZ Stockton, CA Austin, TX Pinellas County, FL Norwalk and southwest CT
Name of service RTD Van Go! Pick up by Cap Metro Direct Connect Wheels2U
App and calling option Limited ADA availability Both options Both options Both options, 90% use Uber
through app
App based, has a calling feature but
app is advertised.
Successes Helped provide some data for OnD
and travel patterns. Had some
utilization of existing Lyft users,
very few new users
Both Ecolane and TransLoc have
great customer service and
helped with launch. Starting to
focus on marketing, ridership
when from 4 passengers per day
to 10 in 2 weeks.
More than 20,000 trips in one year After removing boundaries,
ridership tripled from April to
August. In September it grew but
is leveling out
Up to 100 riders during the weekend.
Will expand zone to include large
residential area
Lessons learned Spell out what you want from TNC
and set expectations early on. Ex.
Data sharing and what type of
data.
Marketing - important to use
traditional methods and social
media. Outreach events to teach
people how to use the app.
Important to educate customers on
how to use the app. Keep checking the
routing and make sure it is efficient.
Cap Metro would inform Via, they
would rework the algorithm. A pilot is
great testing ground.
First PSTA used zones, but this
hindered travel. Switched to use
Direct Connect stops, allowing
more freedom in travel
Need a robust advertisement
program. Wish we would have more
resources for advertisement
Challenges Can not tell if user is using transit
or just Lyft trip. City and Valley
Metro does not have fare and
tracking capabilities for fare
integration.
Majority of people using service is
elderly or people with
disabilities, 90% use call in
option. Marketing has been a
challenge since the agency mostly
uses social media. Going to start
to use more traditional methods
like flyers and outreach events.
TransLoc is not as robust as
Ecolane. Has capability to do
whole county. TransLoc is better
for a small area
Nothing extreme. Had to train 50+
community about the app.
Zones made travel difficult
because you couldn't cross zones.
Might have to backtrack your
travel to get to the closest DC stop
So far, everything is running smoothly
Additional staffing None Part of contract, uses National
Trust (owns Ecolane) for
maintenance, dispatch, drivers,
etc. RTD provides vehicles and
facilities'
Hire 2 temporary dispatch to answer
calls. 51% of people called during the
beginning of pilot, went down to 40%.
None No additional staffing. Some drivers
moved from part time to full time.
Had to have supervisors stay 1 extra
hour
Technical challenges Lyft did not geofence in the
beginning, difficult to figure out if
trip was FLM solution.
90% use call in option, however
app works very well. Due to
marketing. TransLoc is better for
small areas, does not work well
for large, complex areas.
Have to keep working with Via to
tweak algorithm to keep maximizing
ridership.
Switched to start using a
promocode, some people had to
be trained on how to use promo
code. $5 starts when an origin or
destination is within 800ft of a DC
stop. Some people had a
destination not within the 800 ft,
so no price reduction. Nothing
wrong with app, just need to
communicate better and train
people
None, very easy to train drivers and
use app. Trained drivers in 15 mins
Future of the program Data is helpful to decide if they
want to do a microtransit or
readjust fixed-route program
Expand to county wide Program ended June 2018, not because
the program did not work, there was a
trial period with Via for one-year free
service. Currently has an RFP out to
continue service
Recently changed the fare
structure to pay first $5. Before
was 50% of the ride, up to $3.
Expanded DC stops to 24.
After pilot going to move towards a
first/last mile scenario. Use
microtransit to feed into core routes.
Funding will become more difficult,
and competitive, so we will have to
scale back on low performing routes.
Ridership All zones - 5,557 a year. 15 per day. No data received 20,000 one year ~55 per day. ~4.5
Passenger per hour
September 2018 - 3,975.
September 2017 - 948. ~132 per
day
100 per weekend. ~50 per day. ~ 7
passengers per hour. September to
February = 3,216
Other performance measures Average distance - 7.27 mi,
duration 14 mins, average fare
$11.13 (1.79 discount)
No data received Towards the end of the pilot, 70% of
paratransit clients used this service.
40% were shared rides. Via made cost
per passenger lower since average
person per hour 3.65. Average $51 per
trip
Track average distance traveled
(keep it low), average response
time (keep it low), total unique
riders (keep it low)
Collecting revenue per service hour:
2. Average wait time is 2-3 mins.

46
MOUNTAIN LINE ON-DEMAND FEASIBILITY STUDY
York Regional Transit City of Arlington Gwinnett County Transit Harvard Transportation & Parking Tri-Valley Wheels City of Monrovia
York Region, Ontario, Canada Arlington, TX Gwinnett County, GA Harvard Campus, MA Dublin, CA Monrovia, CA
Name of service Mobility Plus Services Arlington On-Demand Microtransit Pilot Evening Van Service Go Dublin! Go Monrovia
Type of On-Demand service 14 On-Demand services, providing
fixed-route replacement (stop to
stop), rural service (curb to bus
stop)
Transit as a service powered by
Via
Microtransit service in area with
no transit service, partnership
with TransLoc
Evening SaaS on-demand van
service.
Rideshare promotion with Uber,
Lyft, and DeSoto Cab Company.
Residents must use rideshare
options (i.e.. Lyft line)
Partnership with Lyft, City
subsidizes price
Description Providing on-demand services for
first-last mile solutions.
Replacement of fixed-route,
where on-demand now runs
along bus stops where route used
to run. In rural areas, has a
nearest curb address to closest
bus stop or hub location, on-
demand service to commuter rail.
City of Arlington is the largest city
in the US without a transit system,
so the City issued an RFP in the
summer of 2017 for transit
services. Out of 4 participants, Via
was most qualified. Offer on-
demand rideshare option, M-F
6am - 9pm, Saturday 9am-9pm
Providing microtransit pilot that
will run for free in Snellville,
which currently does not have
transit service. Door to door
service within a specific zone
Previously used manual, paper
system with call in option. In 2016,
went from TransLoc software to
Via. Transports faculty, staff, and
students safely around campus as
supplement to Harvard's fixed
route shuttle bus system
Wheels pays for 50% of your fare,
up to $5.00 for any ride within city
limits.
GoMonrovia is the City’s enhanced
mobility program that features
$0.50 rides with the car-sharing
provider, Lyft, and $1.00 30-minute
rides with the bikeshare provider,
LimeBike. these options are being
provided in partnership with the
City’s existing dial-a-ride program.
Wanted to bridge the gap with
Gold Line station.
Goals of program Provide best service to
community, creating an extension
of fixed-route system.
Provide some transit service in
Arlington
Provide transit where there is
currently none. In 2016, started
looking at solutions to service this
area.
Provide more convenient rider
experience and fill in gaps of fixed
route system
Wheels wanted to provide transit
service in less-populated areas.
Wanted to give residents an easy,
affordable transportation solution
Provide fast, convenient, and
affordable transportation options
Audience served General public General public General public Students, faculty, and staff. Need
Harvard email to create log in
General public General public
Days and hours M-F have (1) Service between
9:30am and 2:30pm, (1) Rural
service between 8:30am to
11:00pm, (1) Peak hour commuter
rail connector, and (8) services
running from 7:00pm to 11:00 pm;
Sat there are (3) services from
7:00am to 7:00pm and (5) services
from 7:00pm to 11:00 pm.
M-F 6am - 9pm, Saturday 9am-9pm Monday through Friday from
6:00am - 8:30pm, Saturday from
7am - 7pm
Every night 7pm - 3am during
academic year. 7pm - 12:30am
after commencement - until
classes begin
Everyday 24/7 Everyday 24/7
Geofencing Yes, pick up people and drop off
at nearest location
Yes, covers large portion of the
city, plus centreport station
Yes, 17 square mile zone. No
transit near by
Yes, campus service area. Door to
door in some areas (mostly
residential) and corner to corner in
other areas
Trip must start and end in city
limits
Yes, City limits and several
unincorporated areas within LA
county
Transportation gap addressed Spatial Spatial Spatial Spatial and temporal. More
flexible (door to door) during late
night hours
Temporal and Spatial Spatial, First/Last mile
Operation model Software as a Service Transit as a service Software as a service Software as a service Partnership with Lyft, Uber, and
DeSoto Cab
Partnership with Lyft, City
subsidizes price
Pilot (how long) Providing service for several years No, signed 4 year contract, with
approval each year
Yes, started in September, 6
month pilot
No, previously used TransLoc Started November 2016 for 1 year
pilot.
No pilot, existing for 8 months
Partnership with private
company
Routematch Via TransLoc Via Lyft, Uber, and DeSoto Cab Lyft and Lime for bikeshare
Costs $25 per passenger hour $900,000 one year contract.
Negotiating price for year 2, cost
increased 1.8 million to increase
number of vans and additional
costs.
$25,000 for TransLoc pilot,
$150,000 per month in operations
Could not disclose. Via negotiated
price, first was too expensive
FY18 $28,748 Subsidy - was $6-7, now it is $3-4
shared
Funding mechanisms Different than US models. The
City subsidizes the transportation.
Budget is flexible, move money
from fixed-route to demand
services
1/3 general fund, 2/3 formula
funding from FTA
Pilot - local funds. After pilot - ask
for more CMAQ funds
University general fund Transportation Develop Act funds
from Wheels and Measure BB
funds from the Alameda County
Transportation Commission
Local Return Dollars, dial-a-ride is
also funded through this source.
Fare Service integration. $4 per trip (2
hour transfer window), included
fixed route. Pay with smartcard or
cash
$3 one way Free Free Agency pays 50% of fare, up to
$5.00
$0.50 for shared rides, $3 for non-
shared
ADA/FTA compliance Yes, vehicles are paratransit
vehicles
Yes, vehicles have ADA access Yes, vehicles are ADA Yes, ADA vehicles DeSoto has ADA vehicles, cash
option, and phone option. Since
there are multiple vendors,
taxicab exception applies
Has dial-a-ride option, Lyft is
partnering with MV to increase
accessible vehicles. City program,
not FTA
Fleet 15 in fleet, but Via drivers can use
own vehicles during peak
demand. Use 16-18 during peak.
7 total, 5 in service Maximum is 4 vehicles Private vehicles, ADA options
through cap company
Private vehicles

47
MOUNTAIN LINE ON-DEMAND FEASIBILITY STUDY
York Regional Transit City of Arlington Gwinnett County Transit Harvard Transportation & Parking Tri-Valley Wheels City of Monrovia
York Region, Ontario, Canada Arlington, TX Gwinnett County, GA Harvard Campus, MA Dublin, CA Monrovia, CA
Name of service Mobility Plus Services Arlington On-Demand Microtransit Pilot Evening Van Service Go Dublin! Go Monrovia
App and calling option Both options Both options, calling option not
used frequently
Both options, 90% use app Both options, 95% app usage Yes, through DeSoto cab Both, people can call Dial-a-Ride
number, they can order Lyft
through concierge service
Successes Ridership is continuing to grow,
15-16% each year
Ridership is continuing to grow
(almost too much). Expanded
area, and ridership continued to
grow. About 620 rides per day. 18-
35 age is most ridership, 55-65 is
second. Overall very happy with
service and via's customer service
Ridership is continuing to grow.
90% use phone app, very little on
staffing
95% app usages, 200 a night
ridership (with TransLoc was 150),
Average miles decreased, 30%
increase in passengers. More
efficiency and better algorithms
with Via. Via has their own service
and TaaS, so they understand
customer service and operations
Uses promo code, limited
procurement needs. Ridership is
continuing to grow. Fixed route
cost $26.13 per rider subsidy, Go
Dublin is $2.35. Ridership on BRT
is growing after program. 28000 to
32759. $5 get you anywhere
where transit exists.
Great increases in ridership. 1,800
rides first week, 60,000 a month.
Elderly population is starting to
use service. Did reach out events
to teach elderly how to download
app and hail a ride. No issues with
local taxi company, transit is very
limited in area.
Lessons learned Removed branding for individual
programs. Everything from
paratransit to fixed route is just
YRT, helped reduced stigma with
getting into a paratransit vehicle.
Dedicate time for training and
outreach.
Marketing - helpful to have "boots
on the ground" set up tables at
Walmart and other popular areas
to help download app and use
service. Via underestimated cost
of service for bid, now in second
year is increasing price and
number of vehicles to keep wait
times low
Include key destination points in
zone, added Walmart to area
after pilot began. Not a huge
volume of calls (10-30 calls).
Helps to have buy in from
paratransit contractor. They
helped spread the word, great
partner
Via can have both geofencing and
first last mile capability. TransLoc
can only do one. TransLoc is not as
flexible, lack of dynamically re-
routing system, sometimes
passengers would be on board for
an hour (walking would take 20
mins). Negotiate price with Via.
Reports are better and more
reporting options with Via
Union in Dublin was not happy
because routes had to be cut.
Demand, make sure subsidy is not
too much and program is not
sustainable. If you are just using
promo code, it follows FTA.
Demand was underestimated, not
sure how to mitigate that.
Determine a cost per subsidy that
is sustainable, do not want to keep
increasing price.
Challenges Not having the technology has
been difficult. New Routematch
technology will launch in April.
Scalability - demand keep
increasing, wait times are
increasing. Some issues for
elderly to adopt, extra marketing
and training could be helpful.
Software lacks operational
thinking. i.e. When one driver
logs off and another one log in,
rides que during between shifts.
Also, app does not optimize in
real time, i.e.. If a vehicle is
delayed due to securing a
wheelchair, rides stack up and
routes do not change. Some
agencies have used override
option.
TransLoc has challenges making a
day go from 7am - 3:30am,
difficulty reporting. No problems
with Via. There are 30 "tweak"
options. Via is very comprehensive
to explain consequences.
More riders may use service than
expected and use funds quickly.
Safety could be an issue since
Uber drivers are not screened
strictly. Challenges getting data
from TNCs. Cost for wheelchairs
are more expensive to customer
(Uber XL), need to figure out
solution. Should agency subsidize
more?
Demand is getting too high.
Looking for grants to supplement
program.
Additional staffing None Via provides 2 local staff to help
with customer service. Via staffs
one project manager located in
NY. Otherwise, no additional
staffing with City of Arlington
Needed additional drivers and
supervisors. No dispatch or other
staffing needed.
No additional staff since initial
program started.
No additional staffing, very easy
to manage program
No added City staff
Technical challenges Enough time for training staff how
to use program
Some adoption issues with
customers. Otherwise, app is easy
to use from customer and drivers
Contractor's phone is down a lot,
issue not due to TransLoc.
Easy to implement. Many
challenges with TransLoc's
software (explained in Lesson
Learned and Challenges)
Looking into concierge option to
order Lyft rides for call-in option.
Otherwise, easy to use for
customers
Nothing so far, had a Lyft tutorial
providing free dinner and help
download app and hail a ride.
Future of the program New technology in April, adding
trip attributes (only drop-off at
stops with benches). One app for
trip planning, including private
and public options
Increase number of vehicles. If successful, program will expand
to another area. Might start
charging fares, however need to
figure out installing fareboxes.
Need to revisit rider policy - since
it is free, what is the policy for no-
shows.
No changes decided as of yet Might expand program. Looking
into more wheel chair
accessibility options. There is a
new partnership with Uber/MV,
can we utilize that.
Might more towards $0.50 in
certain areas or only connect to
transit? Going to conduct a study
session to figure out solutions.
Ridership Continuing to grow, 15-16% each
year
620 per day. ~41 passenger per
hour
250 riders per day. ~17 passengers
per hour
200 a night. ~25 per hour May 18 - 1659. ~53 trips per day 60,000 a month. ~ 2,000 trips per
day
Other performance measures Develop new performance
measures as new technology
launches. Strategy for cost per
passenger, trip length, and divide
it by urban and rural areas.
Passengers per hour 1.3 - 1.8
N/A N/A Average miles of vehicles,
passengers per vehicle.
Average wait is 10 - 15 minutes N/A

48
MOUNTAIN LINE ON-DEMAND FEASIBILITY STUDY
Valley Regional Transit Dayton RTA Marin Transit Ann Arbor Area Transit Authority
(AAATA)
Ada County and Canyon County Dayton, OH Marin County Ann Arbor, MI
Name of service VRT Transit Connections RTA Connect Marin Transit Connect FlexRide
Type of On-Demand service Partnership with Lyft for first/last
mile
Partnership with Lyft for first/last
mile
Microtransit service for first/last
mile and to service seniors and
people with disabilities
Microtransit with local private
company
Description Riders get a $2 Lyft ride to several
bus stops. Can get the ride to or
from a bus stop. But be within a 2
mile radius of the bus stop.
2 options - 1. customer can
transfer to an RTA bus stop for
free. 2. customers can use Lyft
within a zone for a $2 trip
Provides on-demand trips in service
area. Area includes transit and BART
connections, YMCA, senior housing,
etc. Marin Transit is a 5311 agency
Door to door ride sharing service
Goals of program Provide a first/last mile
connection for 'best in class
routes'. Focus on making transit
better and more ridership along
high frequency routes. Not
focusing on coverage
First/last mile and spatial.
Provide people in more rural
areas with a transportation
option
First last mile solution, wanted to
serve multiple markets and provide
a transportation option where fixed
route is not conducive
FlexRide is a same-day and next-day
on-demand service. Services area is
less dense than a suburb and links up
to bus routes and civic services. This
service also provides a connection to
a bus route. Service days are M-F 9-5.
Audience served General public General public General Public General public
Days and hours 6 a.m. to 9 p.m. Monday-Friday
and from 7:30 a.m. to 6 p.m. on
Saturday
24/7 Weekdays from 6:30am - 7pm 9am to 5pm M-F
Geofencing Yes, specific zone with 14 bus
stops, serving 4 routes
Yes, 5 different zones, all with
bus stops to transfer to fixed
route or just use service within
zone for $2 trip
Yes, 3 square mile area. Includes
some transit and BART connections
Provide service in an area where
there is no fixed route, and help
connect people to bus routes
Transportation gap addressed First/last mile First/last mile and spatial First last mile Spatial (area in low density)
Operation model Partnership with Lyft Partnership with Lyft for first/last
mile. Other taxi providers and
paratransit
Partnership with Via Transportation TaaS
Pilot (how long) yes, 18 months. Contract with Lyft
for 3 one year extensions N/A
Yes, 1 year but will extend for 6
months
1 year pilot, will extend for another
year
Partnership with private
company
Lyft Lyft Via Metro On-Demand (MODE) - Only Ann
Arbor based
Costs $200,000 No data received ~ $55 - $75 per hour, using
paratransit costs. Contract
paratransit service
Pay by service hour, ends up costing
$40 per service hour.
Funding mechanisms 5307 funding, City of Boise for
local match
Funds from cut fixed routes 5310 funds 2014 Transportation Improvement
Millage
Fare $2 for customer, transit agency
pays the rest
Free if transferring to bus stop,
$2 within zone
Regular rides are $4 per seat. 50%
discounts for Marin Access services
or passengers riding to or from a
transit stop. Per rider charges also
decrease as your party increases.
For example, a regular priced trip
for two riders is $8, but the third is
$3 more, the fourth is $2 more and
all additional are only $1 more.
$1 each way. Discounts available
students, seniors, and disabled
ADA/FTA compliance ADA - partners with NEMT
providers since no taxi companies
had ADA vehicles. FTA - taxi
exception rule since partner with
2 other transportation providers
If person calls RTA, first try to get
on paratransit service, then push
to Lyft or taxi provider
ADA accessible vehicles. Promoting
to senior homes and human service
agencies to fit the 50% of rides for
seniors and people with disabilities
Yes, vehicles are ADA
Fleet Lyft fleet, 2 NEMT providers Paratransit, Lyft, and taxi
providers fleet
Peak 3-4 vehicles, 2 during normal
times
1 - 2 vehicles

49
MOUNTAIN LINE ON-DEMAND FEASIBILITY STUDY
Valley Regional Transit Dayton RTA Marin Transit Ann Arbor Area Transit Authority
(AAATA)
Ada County and Canyon County Dayton, OH Marin County Ann Arbor, MI
Name of service VRT Transit Connections RTA Connect Marin Transit Connect FlexRide
App and calling option
Both, mostly app usage.
Customers can call VRT to
schedule with NEMT
App is Lyft, calling option is RTA
and first put on paratransit
Both, seniors tend to call in,
otherwise app is very popular
Both. Reserve a ride a day before or at
least 45 minutes in advance. Walk-ons
acceptable at certain locations if
space available
Successes 6 weeks in, but already 500 riders,
trending upwards. Went through
procurement process for contract
with Lyft. Combined bus pass and
Lyft rides for $90
On-demand program ridership is
growing, people get to their
destinations quicker, have more
transportation options,
especially in rural areas. For
people who call in, 80% are able
to be on paratransit
Students with mobility devices and
an adult day program have really
benefited. Ridership is continuing
to grow. Successful travel training
with these agencies to promote
independence
Program is slowly growing. Calls are
handled by contractor, did not need
additional staffing.
Lessons learned Lyft only provides OnD within
census tracks, can not know if ride
to bus stop or just within the
zone. Make sure everything is in
contract, not sure in procurement
meeting. Ex. Lyft line not in Boise,
but Lyft said this would be part of
program, so far it is not.
Outreach - reach out to locals,
attended all city council
meetings, rode routes and gave
information out. Lots of customer
outreach to prepare people.
Policy - if ride service is late, and
you miss you fixed route
connection, they will take you to
final destination
Time and effort for marketing a
new program. In the beginning, be
critical of algorithm, it took about 6
months to get it right. Might need a
longer pilot than anticipated
Need to continually advertise people
and teach people how to use the app.
Scalability - able to provide fast, on-
demand service but only able to pay
for one van.
Challenges Getting data, like OnD. Contract
with federal clauses. Took 7
months with back and forth
between agency and lyft
Trapeze Software with
paratransit vehicles are not able
to do exactly what we want. Very
difficult to schedule on-demand
trips for people who call in.
Union issues when program just
started
Took 6 months for software to
stabilize. Pre-book feature was
difficult, in beginning it would deny
rides
Goal is to have 2-4 passengers per
hour, currently at 1-2. Only 10% of
people request a ride through on-line
or app. Need to advertise app and
train people. Average wait to 15
minutes, since there is only one
vehicle
Additional staffing None None, but call center when
service was just launched had
long wait times, not it is steady
and under 60 sections, have 15
call reps
None, just additional drivers but
they contract that service out
None
Technical challenges None with app. Part of
procurement was Tapride from
Double map to put technology on
NEMTs. However, right now just
calling company to schedule ride
Trapeze service has been
challenging but it is not intended
to do what we want to do
Took 6 months for software to
stabilize. Pre-book feature was
difficult, in beginning it would deny
rides
Longer wait times, not as attractive as
same day booking
Future of the program Plan to expand program to it
covers most of Boise. Will
continue to track progress
Would like to move towards an
on-demand program with our
paratransit fleet, possibly
different software. Goal is to be
the regional coordinator for
mobility
Eventually go to board for approval
to continue service
Move towards the first/last mile
connector and integrate real time bus
arrival in app
Ridership 500 in first 6 weeks No data received 1300 per month No data received
Other performance measures N/A No data received 2 passengers per hour No data received


