The management of most fisheries worldwideassumes that most or all adults contribute to thespawning population. Reduced or delayed spawninghas been recorded in some species, but it is not consid-ered to be a common phenomenon (Woodhead 1979).Burton (1999) documented studies of several commer-cial species of fish where the spawning participationrates varied between 50 and 90% of the adult popula-tion. Other studies of both marine and freshwaterfishes found that species often skip spawning whenconditions are poor (Crim et al. 1992, Dion et al. 1994,Alekseyev et al. 1996, Rideout et al. 2000). Stock
assessments of species with reduced spawningparticipation rates should be taken into account sincepopulation productivity may also be reduced.
Barramundi Lates calcarifer is a large centropomid fishthat occurs throughout Southern and South East Asia,from India to northern Australia. It grows to over 20 kg inweight and is the largest species in freshwater reaches ofrivers in northern Australia and adjacent southern PapuaNew Guinea. Barramundi are found in all the rivers andadjacent coastal parts of southwestern Papua NewGuinea and are particularly abundant in the middlereaches of the large Fly River (Swales et al. 2000).
The life cycle of barramundi in Papua New Guinea isfairly well understood. They are protandrous herma-
Movement patterns of barramundi Lates calcarifer,inferred from 87Sr/86Sr and Sr/Ca ratios in otoliths,
indicate non-participation in spawning
David A. Milton1,*, Simon R. Chenery2
1CSIRO Marine Research, PO Box 120, Cleveland, Queensland 4163, Australia2Analytical Geochemistry Group, British Geological Survey, Keyworth, Nottingham NG12 5GG, UK
ABSTRACT: The migration patterns of the large catadromous fish, barramundi Lates calcarifer insouthern Papua New Guinea were examined by analysing 87Sr/86Sr and Sr/Ca ratios by MC-LA-ICPMS and LA-ICPMS, respectively. Individual migration histories between coastal and riverinehabitats could be inferred from the 87Sr/86Sr ratios. These were used to calibrate the Sr/Ca ratios froma larger sample of fish and identify periods when the fish were resident in freshwater. The largestfreshwater population of barramundi occurs in the middle reaches of the Fly River. We found thatmost adult barramundi from this population do not migrate annually to spawn on the coast. Fish varyin the age that they first enter freshwater, and most have arrived by sexual maturity (4 yr). We esti-mate that only half the adult fish in the Fly and nearby Kikori rivers have ever migrated back to thecoast during their lifetime. This implies that many barramundi do not participate in spawning. Fishexamined from the spawning ground were mostly marine residents, and some had spent shortperiods in rivers adjacent to their spawning ground. Tagging and scale chemistry studies from north-ern Australia have also found little evidence of movement of freshwater resident barramundi back tothe sea. This implies that the phenomenon of non-participation in spawning may be widespread inthis species. Our results suggest that freshwater fisheries for barramundi may have less effect on thespawning population than those in coastal regions and thus be able to sustainably remove a greaterproportion of the population.
Resale or republication not permitted without written consent of the publisher
Mar Ecol Prog Ser 301: 279–291, 2005
phrodites that spawn in marine salinities (>30) on thecoast, 160 km west of the Fly River mouth during themonsoon wet season (November to March) (Moore1979, 1982). Larvae enter coastal swamps filled by themonsoon rains and grow rapidly. They leave theswamps within a year and migrate to large rivers, par-ticularly the Fly River, where they mature as males atabout 500 mm TL and 3 yr of age. These males usuallychange sex between 75 (5 yr) and 1050 mm total length(TL) (10 yr old) (Moore 1979, Moore & Reynolds 1982)and the majority are female by 950 mm. Tagging stud-ies have shown extensive movements of adult barra-mundi between the middle reaches of the Fly Riverand the coastal spawning ground (Moore & Reynolds1982). Fish migrate from the Fly River to the spawninggrounds during the pre-monsoon period (September toNovember). At this time, they are extensively caughtby gill nets set along the banks of the lower estuaryand form the basis of a valuable seasonal artisanal fish-ery in the region (Opnai & Tenakanai 1987, Kare 1995).
Based on these studies and similar findings fromnorthern Australia (Davis 1986), most barramundi inPapua New Guinea are assumed to exhibit this lifecycle. Thus, the large decline in catches of the seasonalartisanal fishery on the migrating adults in the mid1990s was assumed to reflect a decline in the adultpopulation as a result of overfishing of mature females(Milton et al. 1998). However, routine monitoring offish populations in the middle Fly River found thatalthough catches had declined, fish were still relativelyabundant during the period when the artisanal fisherycatch was negligible (Swales et al. 2000).
To better understand the dynamics of barramundipopulations and manage the valuable artisanal fishery,we needed to re-examine the movement patterns ofbarramundi to ascertain the linkages between theircoastal and freshwater populations. The contributionof freshwater fish to the spawning population can thenbe estimated and the 2 components managed moreeffectively. Recaptures from conventional taggingstudies rarely provide evidence of the frequency ofmigrations by individuals because of their low number.Tagging studies of barramundi in Papua New Guineaand northern Australia (Moore & Reynolds 1982, Davis1986) did show movements from freshwater to marinehabitats but did not estimate migration frequency.
Migration frequency can be estimated from changes inthe fish otolith concentration of elements such as Sr andBa. These elements vary between marine and freshwa-ters and changes in their concentrations in otoliths havebecome a useful proxy to help understand the move-ments of fish between these environments. However,these relationships can be affected by a number of fac-tors, such as fish physiology, growth rates and stress(Kalish 1992, Sadovy & Severin 1992, Secor & Rooker
2000). Sr/Ca ratios in otoliths vary widely among fishspecies collected in estuarine and marine waters (Secor& Rooker 2000). This can make inferences on fish move-ment from these data difficult to make (Milton & Chen-ery 2003). An alternative approach is to use 87Sr/86Srratios in otoliths (Kennedy et al. 1997). This approach hasseveral advantages over Sr/Ca ratios. The isotopes arenot selectively absorbed and thus closely reflect waterratios. The ratio is stable in marine waters (Hodell et al.1989) but varies between river systems that differ in theirunderlying geology (Peterman et al. 1970). Thus, there isthe potential to discriminate among river systems, oreven branches of the same system (Kennedy et al. 2000,Milton & Chenery 2003).
Thus, the aims of this study were to (1) estimate themigration frequency between fresh and saltwater ofbarramundi populations resident in freshwater, partic-ularly the middle Fly River, with 87Sr/86Sr ratios; (2) usethe 87Sr/86Sr ratios to calibrate Sr/Ca ratios in a largersample of fish in order to estimate the contribution offish from freshwater, including the Fly River, to thespawning population; (3) examine available environ-mental catch monitoring data in the Fly River to assessthe extent of seasonal changes in CPUE that are relatedto migration; and (4) review the life cycle of barramundiin Papua New Guinea and assess the implications formanaging the coastal and inland fisheries.
MATERIALS AND METHODS
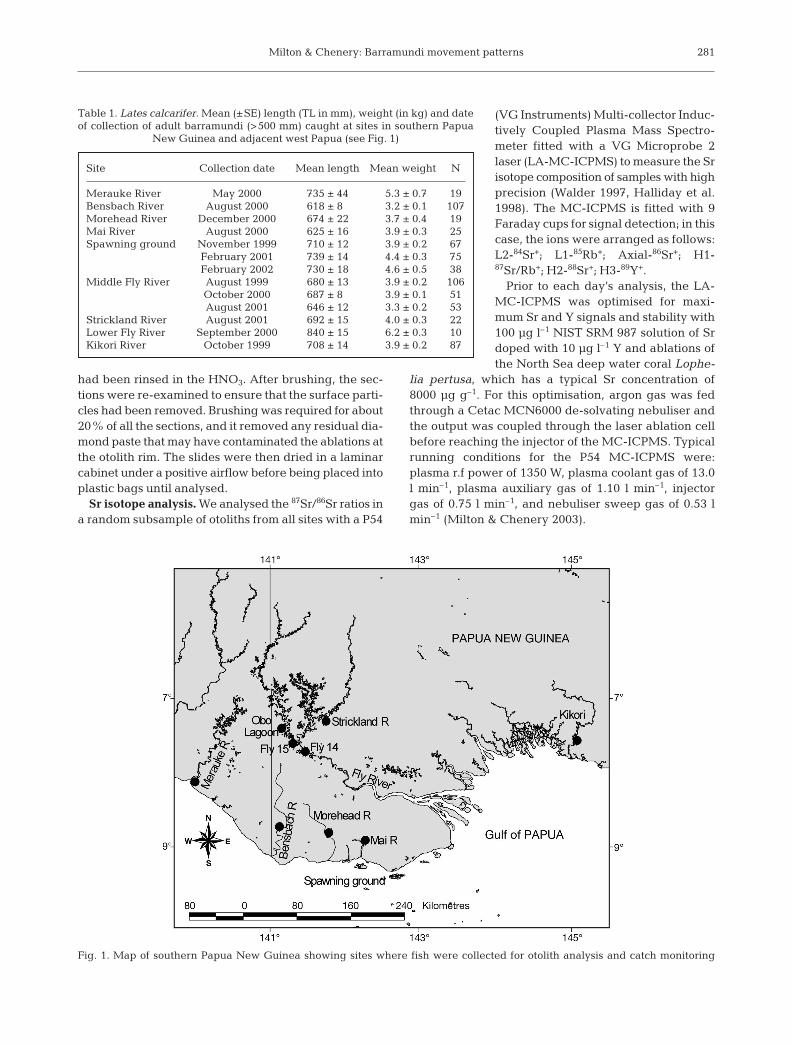
Sample collection. Otoliths were removed fromadult barramundi caught with gill nets in the Fly,Strickland, Kikori, Mai, Morehead, Bensbach and Mer-auke rivers and on the coastal spawning grounds(Table 1, Fig. 1). Fish were measured (total length inmm), weighed (in g), sexed by macroscopic examina-tion of gonads and otoliths dissected, washed with dis-tilled water and dried with tissue paper before storagein polythene bags. All otoliths were removed from thefish within 1 h after capture, with the exception of thefish from Merauke River; these could not be processeduntil 3 h after the fish were caught, as they were pur-chased from the market.
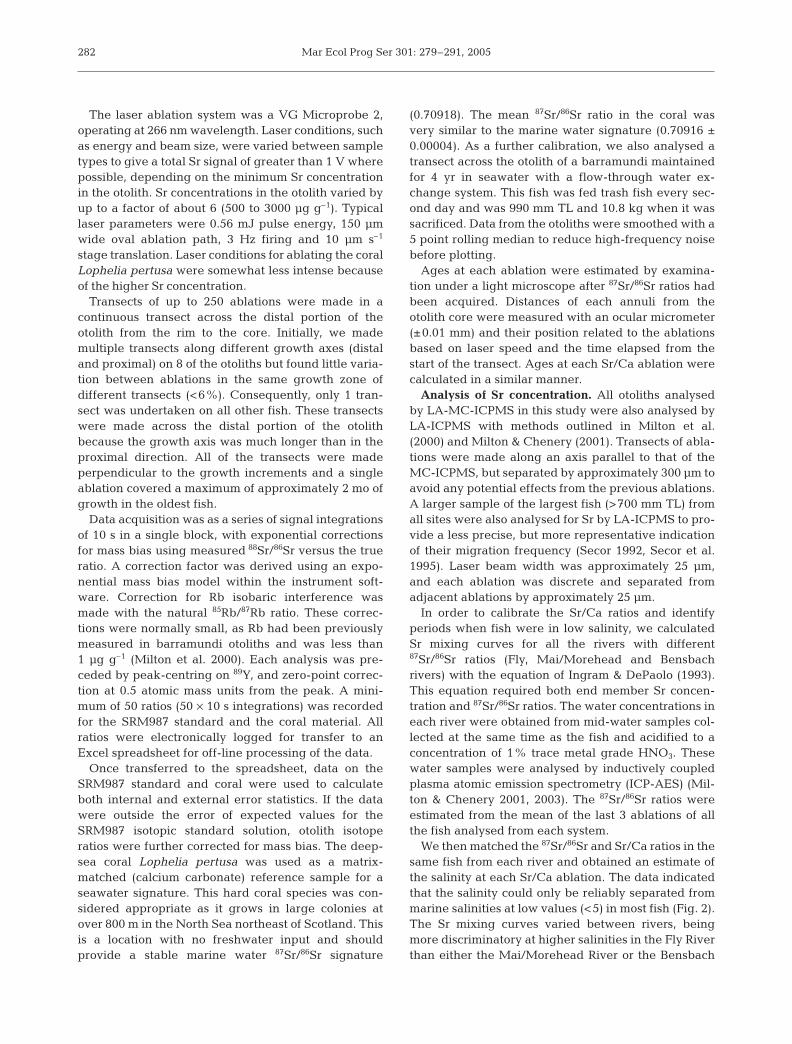
In the laboratory, the otoliths were weighed (±0.1 mg)and embedded in polyester resin. Traverse sections weremade through the origin with a diamond saw. Thin sec-tions (300 µm) were mounted on labelled microscopeslides and polished with diamond pastes (3 and 1 µ) un-til the surface was smooth. The surface of the section wasthen wiped vigorously on 2 occasions with a piece of tis-sue paper moistened with 0.5 M HNO3 (Aristar). Therims of the cleaned sections were examined with a stereomicroscope and where residual resin or diamond pasteremained, it was brushed with a clean nylon brush that
280
Milton & Chenery: Barramundi movement patterns
had been rinsed in the HNO3. After brushing, the sec-tions were re-examined to ensure that the surface parti-cles had been removed. Brushing was required for about20% of all the sections, and it removed any residual dia-mond paste that may have contaminated the ablations atthe otolith rim. The slides were then dried in a laminarcabinet under a positive airflow before being placed intoplastic bags until analysed.
Sr isotope analysis. We analysed the 87Sr/86Sr ratios ina random subsample of otoliths from all sites with a P54
(VG Instruments) Multi-collector Induc-tively Coupled Plasma Mass Spectro-meter fitted with a VG Microprobe 2laser (LA-MC-ICPMS) to measure the Srisotope composition of samples with highprecision (Walder 1997, Halliday et al.1998). The MC-ICPMS is fitted with 9Faraday cups for signal detection; in thiscase, the ions were arranged as follows:L2-84Sr+; L1-85Rb+; Axial-86Sr+; H1-87Sr/Rb+; H2-88Sr+; H3-89Y+.
Prior to each day’s analysis, the LA-MC-ICPMS was optimised for maxi-mum Sr and Y signals and stability with100 µg l–1 NIST SRM 987 solution of Srdoped with 10 µg l–1 Y and ablations ofthe North Sea deep water coral Lophe-
lia pertusa, which has a typical Sr concentration of8000 µg g–1. For this optimisation, argon gas was fedthrough a Cetac MCN6000 de-solvating nebuliser andthe output was coupled through the laser ablation cellbefore reaching the injector of the MC-ICPMS. Typicalrunning conditions for the P54 MC-ICPMS were:plasma r.f power of 1350 W, plasma coolant gas of 13.0l min–1, plasma auxiliary gas of 1.10 l min–1, injectorgas of 0.75 l min–1, and nebuliser sweep gas of 0.53 lmin–1 (Milton & Chenery 2003).
281
Site Collection date Mean length Mean weight N
Merauke River May 2000 735 ± 44 5.3 ± 0.7 19Bensbach River August 2000 618 ± 8 3.2 ± 0.1 107Morehead River December 2000 674 ± 22 3.7 ± 0.4 19Mai River August 2000 625 ± 16 3.9 ± 0.3 25Spawning ground November 1999 710 ± 12 3.9 ± 0.2 67
Strickland River August 2001 692 ± 15 4.0 ± 0.3 22Lower Fly River September 2000 840 ± 15 6.2 ± 0.3 10Kikori River October 1999 708 ± 14 3.9 ± 0.2 87
Table 1. Lates calcarifer. Mean (±SE) length (TL in mm), weight (in kg) and dateof collection of adult barramundi (>500 mm) caught at sites in southern Papua
New Guinea and adjacent west Papua (see Fig. 1)
Fig. 1. Map of southern Papua New Guinea showing sites where fish were collected for otolith analysis and catch monitoring
Mar Ecol Prog Ser 301: 279–291, 2005
The laser ablation system was a VG Microprobe 2,operating at 266 nm wavelength. Laser conditions, suchas energy and beam size, were varied between sampletypes to give a total Sr signal of greater than 1 V wherepossible, depending on the minimum Sr concentrationin the otolith. Sr concentrations in the otolith varied byup to a factor of about 6 (500 to 3000 µg g–1). Typicallaser parameters were 0.56 mJ pulse energy, 150 µmwide oval ablation path, 3 Hz firing and 10 µm s–1
stage translation. Laser conditions for ablating the coralLophelia pertusa were somewhat less intense becauseof the higher Sr concentration.
Transects of up to 250 ablations were made in acontinuous transect across the distal portion of theotolith from the rim to the core. Initially, we mademultiple transects along different growth axes (distaland proximal) on 8 of the otoliths but found little varia-tion between ablations in the same growth zone ofdifferent transects (<6%). Consequently, only 1 tran-sect was undertaken on all other fish. These transectswere made across the distal portion of the otolithbecause the growth axis was much longer than in theproximal direction. All of the transects were madeperpendicular to the growth increments and a singleablation covered a maximum of approximately 2 mo ofgrowth in the oldest fish.
Data acquisition was as a series of signal integrationsof 10 s in a single block, with exponential correctionsfor mass bias using measured 88Sr/86Sr versus the trueratio. A correction factor was derived using an expo-nential mass bias model within the instrument soft-ware. Correction for Rb isobaric interference wasmade with the natural 85Rb/87Rb ratio. These correc-tions were normally small, as Rb had been previouslymeasured in barramundi otoliths and was less than1 µg g–1 (Milton et al. 2000). Each analysis was pre-ceded by peak-centring on 89Y, and zero-point correc-tion at 0.5 atomic mass units from the peak. A mini-mum of 50 ratios (50 × 10 s integrations) was recordedfor the SRM987 standard and the coral material. Allratios were electronically logged for transfer to anExcel spreadsheet for off-line processing of the data.
Once transferred to the spreadsheet, data on theSRM987 standard and coral were used to calculateboth internal and external error statistics. If the datawere outside the error of expected values for theSRM987 isotopic standard solution, otolith isotoperatios were further corrected for mass bias. The deep-sea coral Lophelia pertusa was used as a matrix-matched (calcium carbonate) reference sample for aseawater signature. This hard coral species was con-sidered appropriate as it grows in large colonies atover 800 m in the North Sea northeast of Scotland. Thisis a location with no freshwater input and shouldprovide a stable marine water 87Sr/86Sr signature
(0.70918). The mean 87Sr/86Sr ratio in the coral wasvery similar to the marine water signature (0.70916 ±0.00004). As a further calibration, we also analysed atransect across the otolith of a barramundi maintainedfor 4 yr in seawater with a flow-through water ex-change system. This fish was fed trash fish every sec-ond day and was 990 mm TL and 10.8 kg when it wassacrificed. Data from the otoliths were smoothed with a5 point rolling median to reduce high-frequency noisebefore plotting.
Ages at each ablation were estimated by examina-tion under a light microscope after 87Sr/86Sr ratios hadbeen acquired. Distances of each annuli from theotolith core were measured with an ocular micrometer(±0.01 mm) and their position related to the ablationsbased on laser speed and the time elapsed from thestart of the transect. Ages at each Sr/Ca ablation werecalculated in a similar manner.
Analysis of Sr concentration. All otoliths analysedby LA-MC-ICPMS in this study were also analysed byLA-ICPMS with methods outlined in Milton et al.(2000) and Milton & Chenery (2001). Transects of abla-tions were made along an axis parallel to that of theMC-ICPMS, but separated by approximately 300 µm toavoid any potential effects from the previous ablations.A larger sample of the largest fish (>700 mm TL) fromall sites were also analysed for Sr by LA-ICPMS to pro-vide a less precise, but more representative indicationof their migration frequency (Secor 1992, Secor et al.1995). Laser beam width was approximately 25 µm,and each ablation was discrete and separated fromadjacent ablations by approximately 25 µm.
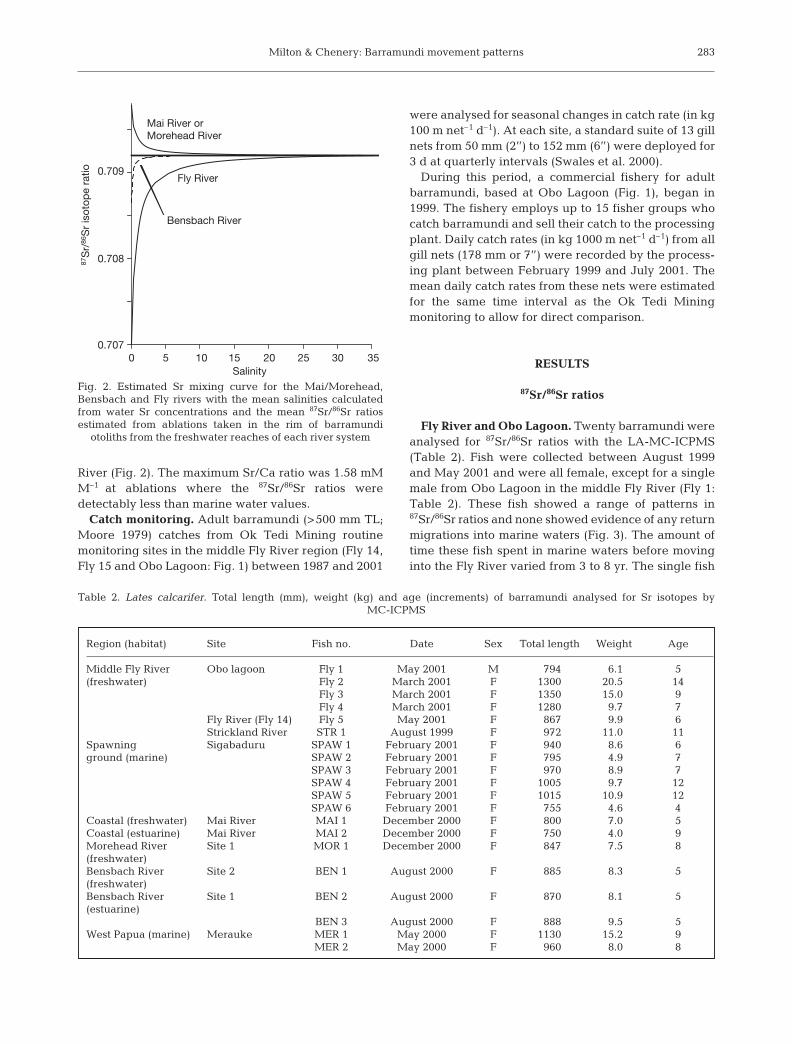
In order to calibrate the Sr/Ca ratios and identifyperiods when fish were in low salinity, we calculatedSr mixing curves for all the rivers with different87Sr/86Sr ratios (Fly, Mai/Morehead and Bensbachrivers) with the equation of Ingram & DePaolo (1993).This equation required both end member Sr concen-tration and 87Sr/86Sr ratios. The water concentrations ineach river were obtained from mid-water samples col-lected at the same time as the fish and acidified to aconcentration of 1% trace metal grade HNO3. Thesewater samples were analysed by inductively coupledplasma atomic emission spectrometry (ICP-AES) (Mil-ton & Chenery 2001, 2003). The 87Sr/86Sr ratios wereestimated from the mean of the last 3 ablations of allthe fish analysed from each system.
We then matched the 87Sr/86Sr and Sr/Ca ratios in thesame fish from each river and obtained an estimate ofthe salinity at each Sr/Ca ablation. The data indicatedthat the salinity could only be reliably separated frommarine salinities at low values (<5) in most fish (Fig. 2).The Sr mixing curves varied between rivers, beingmore discriminatory at higher salinities in the Fly Riverthan either the Mai/Morehead River or the Bensbach
282
Milton & Chenery: Barramundi movement patterns
River (Fig. 2). The maximum Sr/Ca ratio was 1.58 mMM–1 at ablations where the 87Sr/86Sr ratios weredetectably less than marine water values.
Catch monitoring. Adult barramundi (>500 mm TL;Moore 1979) catches from Ok Tedi Mining routinemonitoring sites in the middle Fly River region (Fly 14,Fly 15 and Obo Lagoon: Fig. 1) between 1987 and 2001
were analysed for seasonal changes in catch rate (in kg100 m net–1 d–1). At each site, a standard suite of 13 gillnets from 50 mm (2’’) to 152 mm (6’’) were deployed for3 d at quarterly intervals (Swales et al. 2000).
During this period, a commercial fishery for adultbarramundi, based at Obo Lagoon (Fig. 1), began in1999. The fishery employs up to 15 fisher groups whocatch barramundi and sell their catch to the processingplant. Daily catch rates (in kg 1000 m net–1 d–1) from allgill nets (178 mm or 7’’) were recorded by the process-ing plant between February 1999 and July 2001. Themean daily catch rates from these nets were estimatedfor the same time interval as the Ok Tedi Miningmonitoring to allow for direct comparison.
RESULTS
87Sr/86Sr ratios
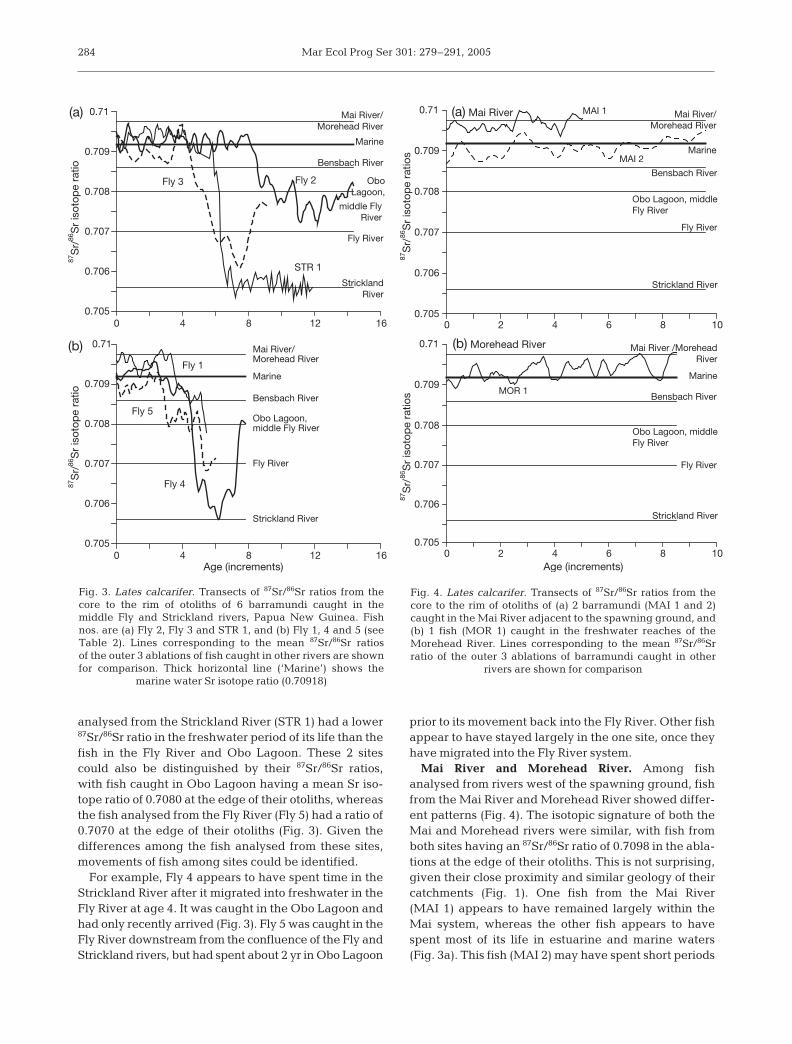
Fly River and Obo Lagoon. Twenty barramundi wereanalysed for 87Sr/86Sr ratios with the LA-MC-ICPMS(Table 2). Fish were collected between August 1999and May 2001 and were all female, except for a singlemale from Obo Lagoon in the middle Fly River (Fly 1:Table 2). These fish showed a range of patterns in87Sr/86Sr ratios and none showed evidence of any returnmigrations into marine waters (Fig. 3). The amount oftime these fish spent in marine waters before movinginto the Fly River varied from 3 to 8 yr. The single fish
283
0 10 20 305 15 25 35Salinity
0.707
0.708
0.709
87S
r/86
Sr
isot
ope
ratio Fly River
Mai River orMorehead River
Bensbach River
Fig. 2. Estimated Sr mixing curve for the Mai/Morehead,Bensbach and Fly rivers with the mean salinities calculatedfrom water Sr concentrations and the mean 87Sr/86Sr ratiosestimated from ablations taken in the rim of barramundi
otoliths from the freshwater reaches of each river system
Region (habitat) Site Fish no. Date Sex Total length Weight Age
Middle Fly River Obo lagoon Fly 1 May 2001 M 794 6.1 5(freshwater) Fly 2 March 2001 F 1300 20.5 14
Fly 3 March 2001 F 1350 15.0 9Fly 4 March 2001 F 1280 9.7 7
Fly River (Fly 14) Fly 5 May 2001 F 867 9.9 6Strickland River STR 1 August 1999 F 972 11.0 11
Spawning Sigabaduru SPAW 1 February 2001 F 940 8.6 6ground (marine) SPAW 2 February 2001 F 795 4.9 7
SPAW 3 February 2001 F 970 8.9 7SPAW 4 February 2001 F 1005 9.7 12SPAW 5 February 2001 F 1015 10.9 12SPAW 6 February 2001 F 755 4.6 4
Coastal (freshwater) Mai River MAI 1 December 2000 F 800 7.0 5Coastal (estuarine) Mai River MAI 2 December 2000 F 750 4.0 9Morehead River Site 1 MOR 1 December 2000 F 847 7.5 8(freshwater)Bensbach River Site 2 BEN 1 August 2000 F 885 8.3 5(freshwater)Bensbach River Site 1 BEN 2 August 2000 F 870 8.1 5(estuarine)
BEN 3 August 2000 F 888 9.5 5West Papua (marine) Merauke MER 1 May 2000 F 1130 15.2 9
MER 2 May 2000 F 960 8.0 8
Table 2. Lates calcarifer. Total length (mm), weight (kg) and age (increments) of barramundi analysed for Sr isotopes byMC-ICPMS
Mar Ecol Prog Ser 301: 279–291, 2005
analysed from the Strickland River (STR 1) had a lower87Sr/86Sr ratio in the freshwater period of its life than thefish in the Fly River and Obo Lagoon. These 2 sitescould also be distinguished by their 87Sr/86Sr ratios,with fish caught in Obo Lagoon having a mean Sr iso-tope ratio of 0.7080 at the edge of their otoliths, whereasthe fish analysed from the Fly River (Fly 5) had a ratio of0.7070 at the edge of their otoliths (Fig. 3). Given thedifferences among the fish analysed from these sites,movements of fish among sites could be identified.
For example, Fly 4 appears to have spent time in theStrickland River after it migrated into freshwater in theFly River at age 4. It was caught in the Obo Lagoon andhad only recently arrived (Fig. 3). Fly 5 was caught in theFly River downstream from the confluence of the Fly andStrickland rivers, but had spent about 2 yr in Obo Lagoon
prior to its movement back into the Fly River. Other fishappear to have stayed largely in the one site, once theyhave migrated into the Fly River system.
Mai River and Morehead River. Among fishanalysed from rivers west of the spawning ground, fishfrom the Mai River and Morehead River showed differ-ent patterns (Fig. 4). The isotopic signature of both theMai and Morehead rivers were similar, with fish fromboth sites having an 87Sr/86Sr ratio of 0.7098 in the abla-tions at the edge of their otoliths. This is not surprising,given their close proximity and similar geology of theircatchments (Fig. 1). One fish from the Mai River(MAI 1) appears to have remained largely within theMai system, whereas the other fish appears to havespent most of its life in estuarine and marine waters(Fig. 3a). This fish (MAI 2) may have spent short periods
284
0 4 8 12 160.705
0.706
0.707
0.708
0.709
0.71
87S
r/86
Sr
isot
ope
ratio
87S
r/86
Sr
isot
ope
ratio
Fly 2Fly 3
0 4 8 12 16Age (increments)
0.705
0.706
0.707
0.708
0.709
0.71
Fly 4
Fly 1
Fly 5
STR 1
(a)
(b) Mai River/Morehead River
Marine
Bensbach River
Obo Lagoon,middle Fly River
Fly River
Strickland River
Mai River/Morehead River
Marine
Bensbach River
OboLagoon,
middle FlyRiver
Fly River
StricklandRiver
Fig. 3. Lates calcarifer. Transects of 87Sr/86Sr ratios from thecore to the rim of otoliths of 6 barramundi caught in themiddle Fly and Strickland rivers, Papua New Guinea. Fishnos. are (a) Fly 2, Fly 3 and STR 1, and (b) Fly 1, 4 and 5 (seeTable 2). Lines corresponding to the mean 87Sr/86Sr ratiosof the outer 3 ablations of fish caught in other rivers are shownfor comparison. Thick horizontal line (‘Marine’) shows the
marine water Sr isotope ratio (0.70918)
0 2 4 6 8 100.705
0.706
0.707
0.708
0.709
0.71
87S
r/86
Sr
isot
ope
ratio
s87
Sr/
86S
r is
otop
e ra
tios
(a) Mai River
0 2 4 6 8 10Age (increments)
0.705
0.706
0.707
0.708
0.709
0.71 (b) Morehead River
Marine
Bensbach River
MAI 1
MAI 2
MOR 1
Strickland River
Fly River
Obo Lagoon, middleFly River
Mai River /MoreheadRiver
Marine
Bensbach River
Obo Lagoon, middleFly River
Strickland River
Fly River
Mai River/Morehead River
Fig. 4. Lates calcarifer. Transects of 87Sr/86Sr ratios from thecore to the rim of otoliths of (a) 2 barramundi (MAI 1 and 2)caught in the Mai River adjacent to the spawning ground, and(b) 1 fish (MOR 1) caught in the freshwater reaches of theMorehead River. Lines corresponding to the mean 87Sr/86Srratio of the outer 3 ablations of barramundi caught in other
rivers are shown for comparison
Milton & Chenery: Barramundi movement patterns
in freshwater reaches of the next most adjacent river,the Bensbach (Fig. 3a). The fish from the MoreheadRiver (MOR 1) made at least 4 migrations into estuarineand marine waters after it matured (~ 4 yr of age).
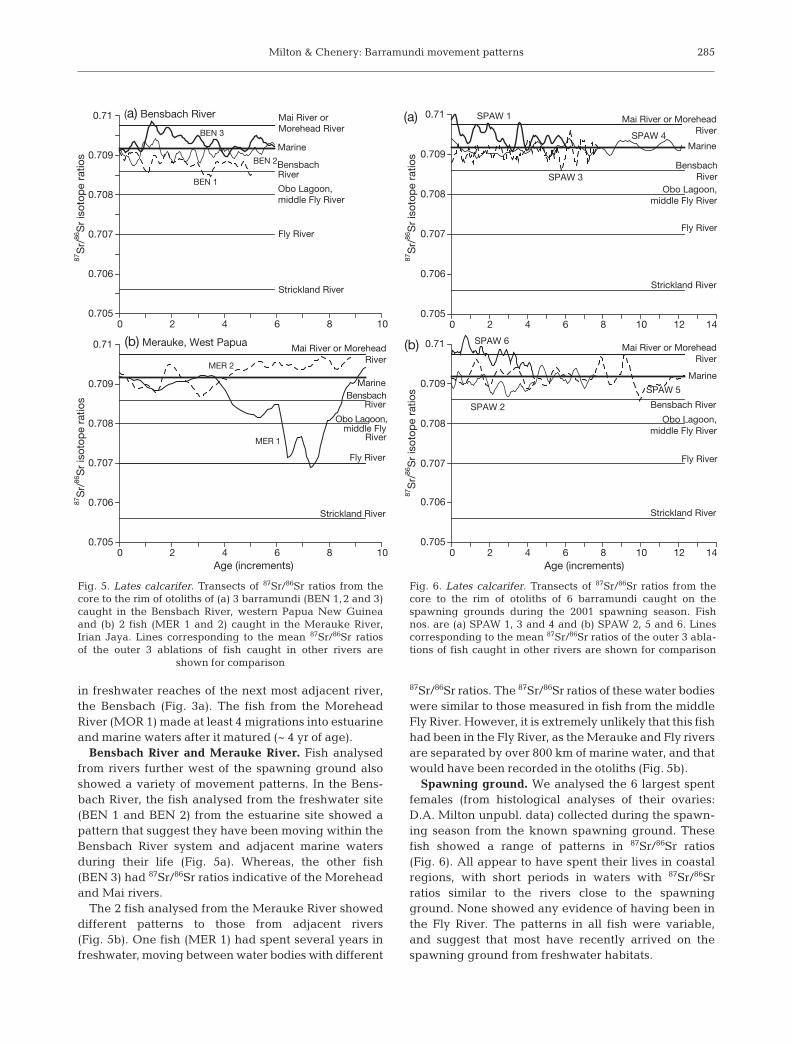
Bensbach River and Merauke River. Fish analysedfrom rivers further west of the spawning ground alsoshowed a variety of movement patterns. In the Bens-bach River, the fish analysed from the freshwater site(BEN 1 and BEN 2) from the estuarine site showed apattern that suggest they have been moving within theBensbach River system and adjacent marine watersduring their life (Fig. 5a). Whereas, the other fish(BEN 3) had 87Sr/86Sr ratios indicative of the Moreheadand Mai rivers.
The 2 fish analysed from the Merauke River showeddifferent patterns to those from adjacent rivers(Fig. 5b). One fish (MER 1) had spent several years infreshwater, moving between water bodies with different
87Sr/86Sr ratios. The 87Sr/86Sr ratios of these water bodieswere similar to those measured in fish from the middleFly River. However, it is extremely unlikely that this fishhad been in the Fly River, as the Merauke and Fly riversare separated by over 800 km of marine water, and thatwould have been recorded in the otoliths (Fig. 5b).
Spawning ground. We analysed the 6 largest spentfemales (from histological analyses of their ovaries:D.A. Milton unpubl. data) collected during the spawn-ing season from the known spawning ground. Thesefish showed a range of patterns in 87Sr/86Sr ratios(Fig. 6). All appear to have spent their lives in coastalregions, with short periods in waters with 87Sr/86Srratios similar to the rivers close to the spawningground. None showed any evidence of having been inthe Fly River. The patterns in all fish were variable,and suggest that most have recently arrived on thespawning ground from freshwater habitats.
285
0 2 4 6 8 100.705
0.706
0.707
0.708
0.709
0.71
87S
r/86
Sr
isot
ope
ratio
s87
Sr/
86S
r is
otop
e ra
tios
BEN 3
BEN 1
0 2 4 6 8 10Age (increments)
0.706
0.708
0.71
0.705
0.707
0.709
Obo Lagoon,middle Fly
Fly River
MarineBensbach
(b) Merauke, West Papua
(a) Bensbach River
BEN 2
MER 1
MER 2
Mai River or MoreheadRiver
Strickland River
Obo Lagoon,middle Fly River
Fly River
Marine
Bensbach River
Mai River orMorehead River
Strickland River
River
River
Fig. 5. Lates calcarifer. Transects of 87Sr/86Sr ratios from thecore to the rim of otoliths of (a) 3 barramundi (BEN 1,2 and 3)caught in the Bensbach River, western Papua New Guineaand (b) 2 fish (MER 1 and 2) caught in the Merauke River,Irian Jaya. Lines corresponding to the mean 87Sr/86Sr ratiosof the outer 3 ablations of fish caught in other rivers are
shown for comparison
0 2 4 6 8 10 12 14
0.706
0.708
0.71
0.705
0.707
0.709
87S
r/86
Sr
isot
ope
ratio
s87
Sr/
86S
r is
otop
e ra
tios
0 2 4 6 8 10 12 14Age (increments)
0.706
0.708
0.71
0.705
0.707
0.709
Bensbach River
Marine
SPAW 4
SPAW 6
SPAW 5
SPAW 1
SPAW 3
SPAW 2
Mai River or MoreheadRiver
Obo Lagoon,middle Fly River
Fly River
Strickland River
BensbachRiver
Marine
Mai River or MoreheadRiver
Obo Lagoon,middle Fly River
Fly River
Strickland River
(a)
(b)
Fig. 6. Lates calcarifer. Transects of 87Sr/86Sr ratios from thecore to the rim of otoliths of 6 barramundi caught on thespawning grounds during the 2001 spawning season. Fishnos. are (a) SPAW 1, 3 and 4 and (b) SPAW 2, 5 and 6. Linescorresponding to the mean 87Sr/86Sr ratios of the outer 3 abla-tions of fish caught in other rivers are shown for comparison
Mar Ecol Prog Ser 301: 279–291, 2005
Calibration
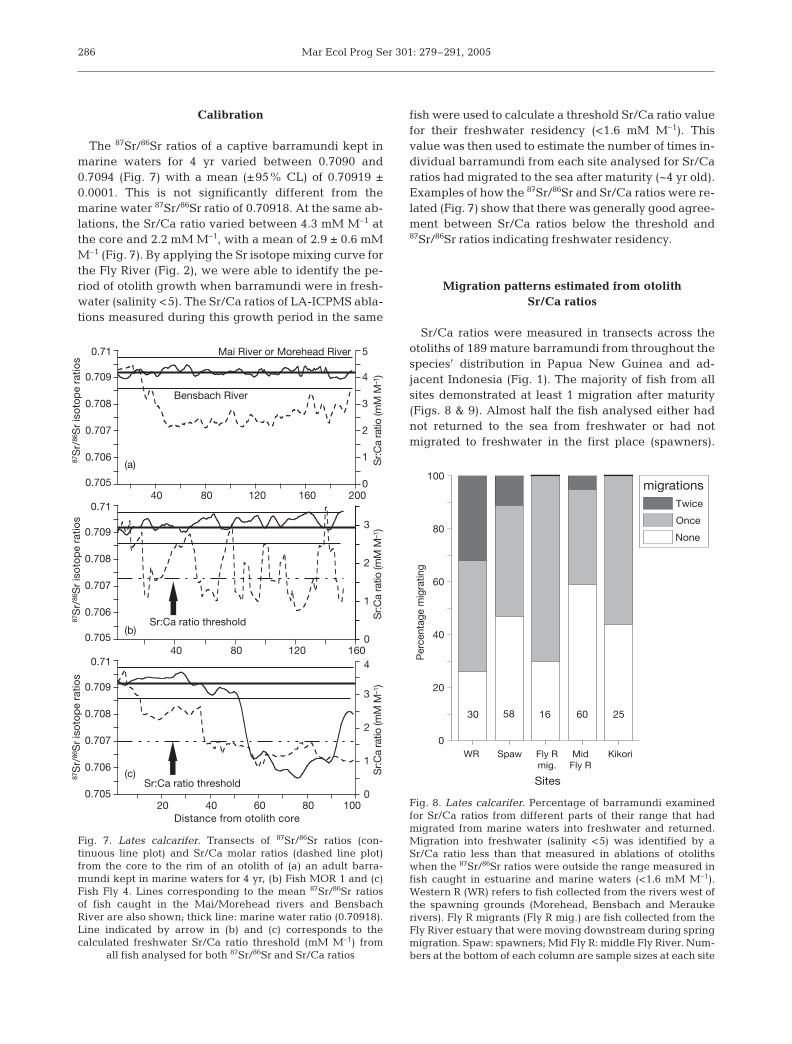
The 87Sr/86Sr ratios of a captive barramundi kept inmarine waters for 4 yr varied between 0.7090 and0.7094 (Fig. 7) with a mean (±95% CL) of 0.70919 ±0.0001. This is not significantly different from themarine water 87Sr/86Sr ratio of 0.70918. At the same ab-lations, the Sr/Ca ratio varied between 4.3 mM M–1 atthe core and 2.2 mM M–1, with a mean of 2.9 ± 0.6 mMM–1 (Fig. 7). By applying the Sr isotope mixing curve forthe Fly River (Fig. 2), we were able to identify the pe-riod of otolith growth when barramundi were in fresh-water (salinity <5). The Sr/Ca ratios of LA-ICPMS abla-tions measured during this growth period in the same
fish were used to calculate a threshold Sr/Ca ratio valuefor their freshwater residency (<1.6 mM M–1). Thisvalue was then used to estimate the number of times in-dividual barramundi from each site analysed for Sr/Caratios had migrated to the sea after maturity (~4 yr old).Examples of how the 87Sr/86Sr and Sr/Ca ratios were re-lated (Fig. 7) show that there was generally good agree-ment between Sr/Ca ratios below the threshold and87Sr/86Sr ratios indicating freshwater residency.
Migration patterns estimated from otolithSr/Ca ratios
Sr/Ca ratios were measured in transects across theotoliths of 189 mature barramundi from throughout thespecies’ distribution in Papua New Guinea and ad-jacent Indonesia (Fig. 1). The majority of fish from allsites demonstrated at least 1 migration after maturity(Figs. 8 & 9). Almost half the fish analysed either hadnot returned to the sea from freshwater or had notmigrated to freshwater in the first place (spawners).
286
40 80 120 160 2000.705
0.706
0.707
0.708
0.709
0.71
0
1
2
3
4
5
Sr:C
a ra
tio (m
M M
–1)
Sr:C
a ra
tio (m
M M
–1)
Sr:C
a ra
tio (m
M M
–1)
Mai River or Morehead River
Bensbach River
(a)
(b)
40 80 120 1600.705
0.706
0.707
0.708
0.709
0.71
0
1
2
3
20 40 60 80 100Distance from otolith core
0.705
0.706
0.707
0.708
0.709
0.71
87S
r/86
Sr
isot
ope
ratio
s87
Sr/
86S
r is
otop
e ra
tios
87S
r/86
Sr
isot
ope
ratio
s
0
1
2
3
4
(c)
Sr:Ca ratio threshold
Sr:Ca ratio threshold
Fig. 7. Lates calcarifer. Transects of 87Sr/86Sr ratios (con-tinuous line plot) and Sr/Ca molar ratios (dashed line plot)from the core to the rim of an otolith of (a) an adult barra-mundi kept in marine waters for 4 yr, (b) Fish MOR 1 and (c)Fish Fly 4. Lines corresponding to the mean 87Sr/86Sr ratiosof fish caught in the Mai/Morehead rivers and BensbachRiver are also shown; thick line: marine water ratio (0.70918).Line indicated by arrow in (b) and (c) corresponds to thecalculated freshwater Sr/Ca ratio threshold (mM M–1) from
all fish analysed for both 87Sr/86Sr and Sr/Ca ratios
WR Spaw Fly Rmig.
MidFly R
Kikori
Sites
0
20
40
60
80
100
Per
cent
age
mig
ratin
g
migrations
None
Once
Twice
30 58 16 60 25
Fig. 8. Lates calcarifer. Percentage of barramundi examinedfor Sr/Ca ratios from different parts of their range that hadmigrated from marine waters into freshwater and returned.Migration into freshwater (salinity <5) was identified by aSr/Ca ratio less than that measured in ablations of otolithswhen the 87Sr/86Sr ratios were outside the range measured infish caught in estuarine and marine waters (<1.6 mM M–1).Western R (WR) refers to fish collected from the rivers west ofthe spawning grounds (Morehead, Bensbach and Meraukerivers). Fly R migrants (Fly R mig.) are fish collected from theFly River estuary that were moving downstream during springmigration. Spaw: spawners; Mid Fly R: middle Fly River. Num-bers at the bottom of each column are sample sizes at each site
Milton & Chenery: Barramundi movement patterns
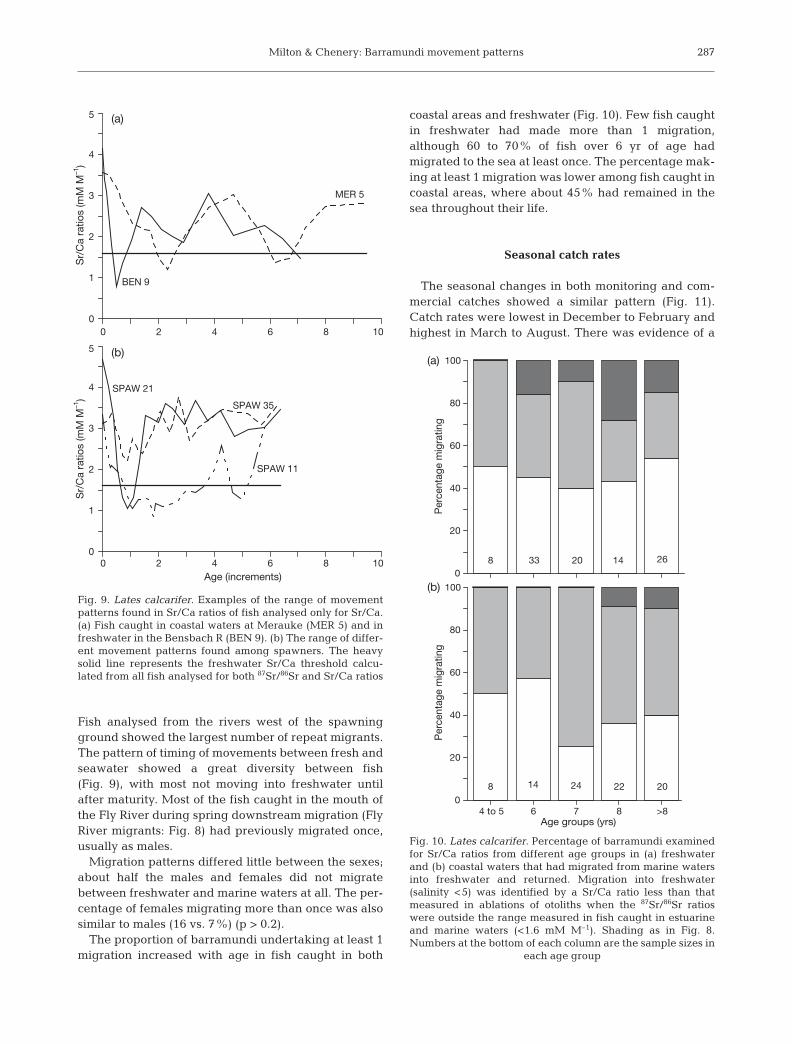
Fish analysed from the rivers west of the spawningground showed the largest number of repeat migrants.The pattern of timing of movements between fresh andseawater showed a great diversity between fish(Fig. 9), with most not moving into freshwater untilafter maturity. Most of the fish caught in the mouth ofthe Fly River during spring downstream migration (FlyRiver migrants: Fig. 8) had previously migrated once,usually as males.
Migration patterns differed little between the sexes;about half the males and females did not migratebetween freshwater and marine waters at all. The per-centage of females migrating more than once was alsosimilar to males (16 vs. 7%) (p > 0.2).
The proportion of barramundi undertaking at least 1migration increased with age in fish caught in both
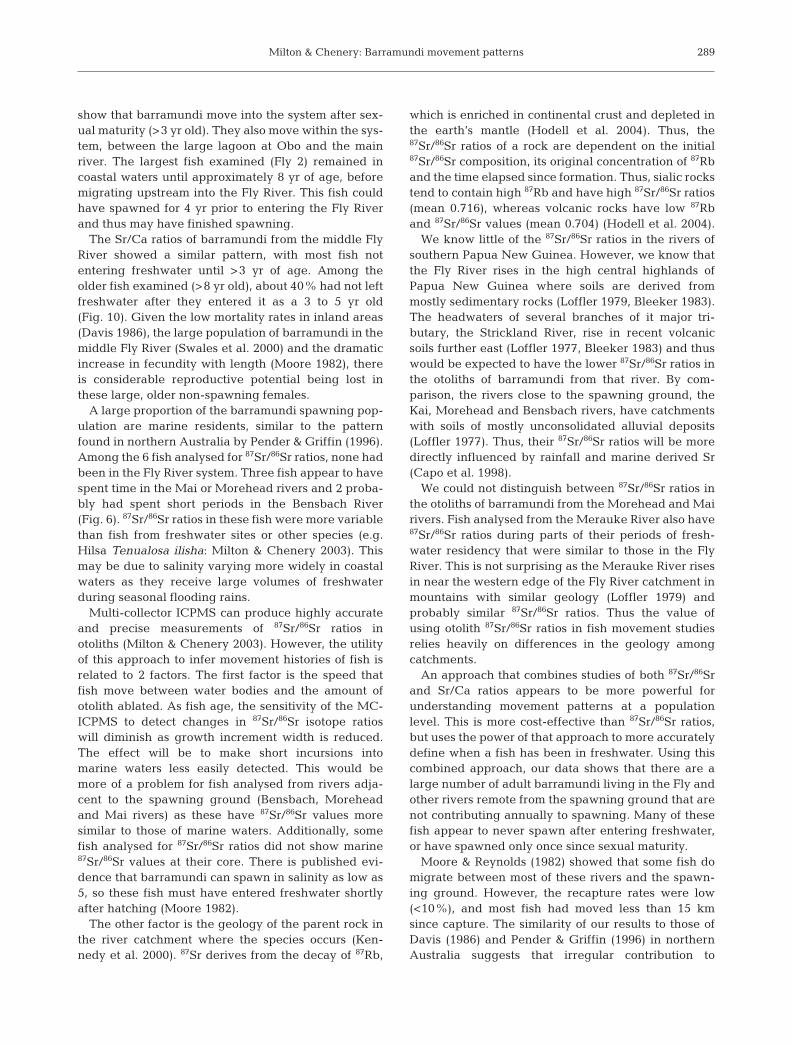
coastal areas and freshwater (Fig. 10). Few fish caughtin freshwater had made more than 1 migration,although 60 to 70% of fish over 6 yr of age hadmigrated to the sea at least once. The percentage mak-ing at least 1 migration was lower among fish caught incoastal areas, where about 45% had remained in thesea throughout their life.
Seasonal catch rates
The seasonal changes in both monitoring and com-mercial catches showed a similar pattern (Fig. 11).Catch rates were lowest in December to February andhighest in March to August. There was evidence of a
287
0 2 4 6 8 100
1
2
3
4
5
Sr/
Ca
ratio
s (m
M M
–1)
Sr/
Ca
ratio
s (m
M M
–1)
0 2 4 6 8 10Age (increments)
0
1
2
3
4
5
(a)
(b)
MER 5
BEN 9
SPAW 11
SPAW 21
SPAW 35
Fig. 9. Lates calcarifer. Examples of the range of movementpatterns found in Sr/Ca ratios of fish analysed only for Sr/Ca.(a) Fish caught in coastal waters at Merauke (MER 5) and infreshwater in the Bensbach R (BEN 9). (b) The range of differ-ent movement patterns found among spawners. The heavysolid line represents the freshwater Sr/Ca threshold calcu-lated from all fish analysed for both 87Sr/86Sr and Sr/Ca ratios
0
20
40
60
80
100
Per
cent
age
mig
ratin
gP
erce
ntag
e m
igra
ting
4 to 5 6 7 8 >8Age groups (yrs)
0
20
40
60
80
100
8
8
33
14
20 14 26
24 22 20
(a)
(b)
Fig. 10. Lates calcarifer. Percentage of barramundi examinedfor Sr/Ca ratios from different age groups in (a) freshwaterand (b) coastal waters that had migrated from marine watersinto freshwater and returned. Migration into freshwater(salinity <5) was identified by a Sr/Ca ratio less than thatmeasured in ablations of otoliths when the 87Sr/86Sr ratioswere outside the range measured in fish caught in estuarineand marine waters (<1.6 mM M–1). Shading as in Fig. 8.Numbers at the bottom of each column are the sample sizes in
each age group
Mar Ecol Prog Ser 301: 279–291, 2005
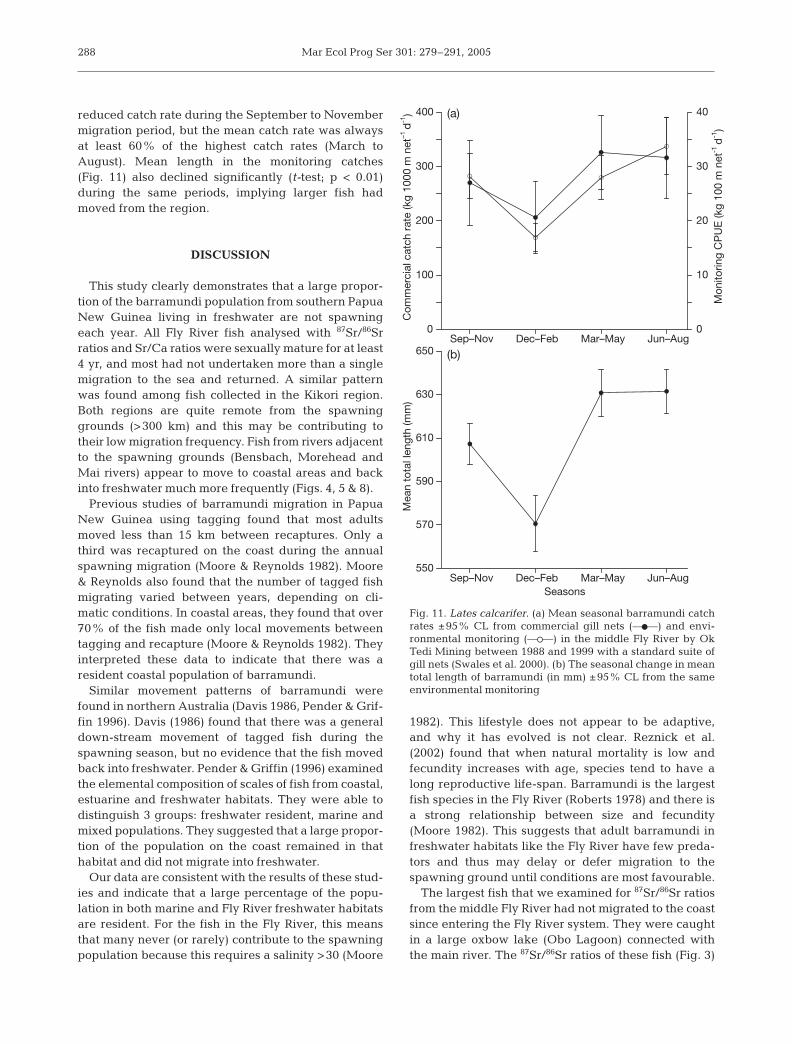
reduced catch rate during the September to Novembermigration period, but the mean catch rate was alwaysat least 60% of the highest catch rates (March toAugust). Mean length in the monitoring catches(Fig. 11) also declined significantly (t-test; p < 0.01)during the same periods, implying larger fish hadmoved from the region.
DISCUSSION
This study clearly demonstrates that a large propor-tion of the barramundi population from southern PapuaNew Guinea living in freshwater are not spawningeach year. All Fly River fish analysed with 87Sr/86Srratios and Sr/Ca ratios were sexually mature for at least4 yr, and most had not undertaken more than a singlemigration to the sea and returned. A similar patternwas found among fish collected in the Kikori region.Both regions are quite remote from the spawninggrounds (>300 km) and this may be contributing totheir low migration frequency. Fish from rivers adjacentto the spawning grounds (Bensbach, Morehead andMai rivers) appear to move to coastal areas and backinto freshwater much more frequently (Figs. 4, 5 & 8).
Previous studies of barramundi migration in PapuaNew Guinea using tagging found that most adultsmoved less than 15 km between recaptures. Only athird was recaptured on the coast during the annualspawning migration (Moore & Reynolds 1982). Moore& Reynolds also found that the number of tagged fishmigrating varied between years, depending on cli-matic conditions. In coastal areas, they found that over70% of the fish made only local movements betweentagging and recapture (Moore & Reynolds 1982). Theyinterpreted these data to indicate that there was aresident coastal population of barramundi.
Similar movement patterns of barramundi werefound in northern Australia (Davis 1986, Pender & Grif-fin 1996). Davis (1986) found that there was a generaldown-stream movement of tagged fish during thespawning season, but no evidence that the fish movedback into freshwater. Pender & Griffin (1996) examinedthe elemental composition of scales of fish from coastal,estuarine and freshwater habitats. They were able todistinguish 3 groups: freshwater resident, marine andmixed populations. They suggested that a large propor-tion of the population on the coast remained in thathabitat and did not migrate into freshwater.
Our data are consistent with the results of these stud-ies and indicate that a large percentage of the popu-lation in both marine and Fly River freshwater habitatsare resident. For the fish in the Fly River, this meansthat many never (or rarely) contribute to the spawningpopulation because this requires a salinity >30 (Moore
1982). This lifestyle does not appear to be adaptive,and why it has evolved is not clear. Reznick et al.(2002) found that when natural mortality is low andfecundity increases with age, species tend to have along reproductive life-span. Barramundi is the largestfish species in the Fly River (Roberts 1978) and there isa strong relationship between size and fecundity(Moore 1982). This suggests that adult barramundi infreshwater habitats like the Fly River have few preda-tors and thus may delay or defer migration to thespawning ground until conditions are most favourable.
The largest fish that we examined for 87Sr/86Sr ratiosfrom the middle Fly River had not migrated to the coastsince entering the Fly River system. They were caughtin a large oxbow lake (Obo Lagoon) connected withthe main river. The 87Sr/86Sr ratios of these fish (Fig. 3)
288
Sep–Nov Dec–Feb Mar–May Jun–Aug0
100
200
300
400
Com
mer
cial
cat
ch r
ate
(kg
1000
m n
et–1
d-1
)
0
10
20
30
40
Mon
itorin
g C
PU
E (k
g 10
0 m
net
-1 d
-1)
Sep–Nov Dec–Feb Mar–May Jun–AugSeasons
550
570
590
610
630
650
Mea
n to
tal l
engt
h (m
m)
(a)
(b)
Fig. 11. Lates calcarifer. (a) Mean seasonal barramundi catchrates ±95% CL from commercial gill nets (––d––) and envi-ronmental monitoring (––s––) in the middle Fly River by OkTedi Mining between 1988 and 1999 with a standard suite ofgill nets (Swales et al. 2000). (b) The seasonal change in meantotal length of barramundi (in mm) ±95% CL from the sameenvironmental monitoring
Milton & Chenery: Barramundi movement patterns
show that barramundi move into the system after sex-ual maturity (>3 yr old). They also move within the sys-tem, between the large lagoon at Obo and the mainriver. The largest fish examined (Fly 2) remained incoastal waters until approximately 8 yr of age, beforemigrating upstream into the Fly River. This fish couldhave spawned for 4 yr prior to entering the Fly Riverand thus may have finished spawning.
The Sr/Ca ratios of barramundi from the middle FlyRiver showed a similar pattern, with most fish notentering freshwater until >3 yr of age. Among theolder fish examined (>8 yr old), about 40% had not leftfreshwater after they entered it as a 3 to 5 yr old(Fig. 10). Given the low mortality rates in inland areas(Davis 1986), the large population of barramundi in themiddle Fly River (Swales et al. 2000) and the dramaticincrease in fecundity with length (Moore 1982), thereis considerable reproductive potential being lost inthese large, older non-spawning females.
A large proportion of the barramundi spawning pop-ulation are marine residents, similar to the patternfound in northern Australia by Pender & Griffin (1996).Among the 6 fish analysed for 87Sr/86Sr ratios, none hadbeen in the Fly River system. Three fish appear to havespent time in the Mai or Morehead rivers and 2 proba-bly had spent short periods in the Bensbach River(Fig. 6). 87Sr/86Sr ratios in these fish were more variablethan fish from freshwater sites or other species (e.g.Hilsa Tenualosa ilisha: Milton & Chenery 2003). Thismay be due to salinity varying more widely in coastalwaters as they receive large volumes of freshwaterduring seasonal flooding rains.
Multi-collector ICPMS can produce highly accurateand precise measurements of 87Sr/86Sr ratios inotoliths (Milton & Chenery 2003). However, the utilityof this approach to infer movement histories of fish isrelated to 2 factors. The first factor is the speed thatfish move between water bodies and the amount ofotolith ablated. As fish age, the sensitivity of the MC-ICPMS to detect changes in 87Sr/86Sr isotope ratioswill diminish as growth increment width is reduced.The effect will be to make short incursions intomarine waters less easily detected. This would bemore of a problem for fish analysed from rivers adja-cent to the spawning ground (Bensbach, Moreheadand Mai rivers) as these have 87Sr/86Sr values moresimilar to those of marine waters. Additionally, somefish analysed for 87Sr/86Sr ratios did not show marine87Sr/86Sr values at their core. There is published evi-dence that barramundi can spawn in salinity as low as5, so these fish must have entered freshwater shortlyafter hatching (Moore 1982).
The other factor is the geology of the parent rock inthe river catchment where the species occurs (Ken-nedy et al. 2000). 87Sr derives from the decay of 87Rb,
which is enriched in continental crust and depleted inthe earth’s mantle (Hodell et al. 2004). Thus, the87Sr/86Sr ratios of a rock are dependent on the initial87Sr/86Sr composition, its original concentration of 87Rband the time elapsed since formation. Thus, sialic rockstend to contain high 87Rb and have high 87Sr/86Sr ratios(mean 0.716), whereas volcanic rocks have low 87Rband 87Sr/86Sr values (mean 0.704) (Hodell et al. 2004).
We know little of the 87Sr/86Sr ratios in the rivers ofsouthern Papua New Guinea. However, we know thatthe Fly River rises in the high central highlands ofPapua New Guinea where soils are derived frommostly sedimentary rocks (Loffler 1979, Bleeker 1983).The headwaters of several branches of it major tri-butary, the Strickland River, rise in recent volcanicsoils further east (Loffler 1977, Bleeker 1983) and thuswould be expected to have the lower 87Sr/86Sr ratios inthe otoliths of barramundi from that river. By com-parison, the rivers close to the spawning ground, theKai, Morehead and Bensbach rivers, have catchmentswith soils of mostly unconsolidated alluvial deposits(Loffler 1977). Thus, their 87Sr/86Sr ratios will be moredirectly influenced by rainfall and marine derived Sr(Capo et al. 1998).
We could not distinguish between 87Sr/86Sr ratios inthe otoliths of barramundi from the Morehead and Mairivers. Fish analysed from the Merauke River also have87Sr/86Sr ratios during parts of their periods of fresh-water residency that were similar to those in the FlyRiver. This is not surprising as the Merauke River risesin near the western edge of the Fly River catchment inmountains with similar geology (Loffler 1979) andprobably similar 87Sr/86Sr ratios. Thus the value ofusing otolith 87Sr/86Sr ratios in fish movement studiesrelies heavily on differences in the geology amongcatchments.
An approach that combines studies of both 87Sr/86Srand Sr/Ca ratios appears to be more powerful forunderstanding movement patterns at a populationlevel. This is more cost-effective than 87Sr/86Sr ratios,but uses the power of that approach to more accuratelydefine when a fish has been in freshwater. Using thiscombined approach, our data shows that there are alarge number of adult barramundi living in the Fly andother rivers remote from the spawning ground that arenot contributing annually to spawning. Many of thesefish appear to never spawn after entering freshwater,or have spawned only once since sexual maturity.
Moore & Reynolds (1982) showed that some fish domigrate between most of these rivers and the spawn-ing ground. However, the recapture rates were low(<10%), and most fish had moved less than 15 kmsince capture. The similarity of our results to those ofDavis (1986) and Pender & Griffin (1996) in northernAustralia suggests that irregular contribution to
289
Mar Ecol Prog Ser 301: 279–291, 2005
spawning by freshwater resident barramundi may bewidespread.
We have no estimates of the population size of bar-ramundi, but a companion study of barramundi popu-lation structure (J. Salini et al. unpubl. data) found asingle breeding population with 69 distinct mt DNAcontrol region haplotypes in 208 fish. This resultimplies that barramundi have a high genetic diversityin Papua New Guinea and that the effective (spawn-ing) population size is very large. If this is true, thenthe number of barramundi apparently not contributingto the spawning population may actually be a rela-tively small proportion of the total population. This isdespite it being a large proportion of the populationpresent in the middle Fly River.
Are these freshwater resident fish not migrating be-cause they are physiologically incapable of spawning?This is unlikely, given that Moore (1982) found adultsthat had enlarged gonads throughout the distributionrange during the spawning season. The range of agespresent in the middle Fly River is also similar to thosefound on the coast (Moore & Reynolds 1982). Rather, itappears that the proximate cues for migration of barra-mundi from freshwater are complex (McDowall 1988)or are linked to rare climatic events. Rainfall, tempera-ture, moon phase, olfaction and fish condition have allbeen identified as important cues for migration ofmany freshwater and marine fishes (McDowall 1988,Naslund et al. 1993, Boubee et al. 2001, Hodgson &Quinn 2002, Okamura et al. 2002). Similar cues areprobably involved in barramundi migration.
Moore & Reynolds (1982) found that there was aninverse relationship between river height in the FlyRiver and commercial catch on the coast near thespawning grounds. They found that low water levels inSeptember to October forced fish from the large off-river water bodies in the middle Fly River and into thedeeper main river. However, if the water level rose, thefish moved back into the water bodies. Their results,combined with our data, suggest that conditions forbarramundi migration from freshwater occur irregu-larly. Fish that are resident in deeper lakes andswamps away from the coast may never migrate,despite their being reproductively active. This hasimplications for barramundi fisheries in freshwaterthroughout the geographic range. If these fish do notmigrate to spawn for several years, they are effectively‘dead’ (McDowall 1988) and their capture and removalmay not significantly affect the spawning population.
In developing the management plan for the barra-mundi fishery in Western Province, the National Fish-eries Authority of Papua New Guinea set a total allow-able catch of 260 t for the entire fishery and this wasallocated 50:50 between the coastal and inland fish-eries (Anonymous 2003). The catch from the middle
Fly River has been over 170 t for the last 2 yr, withoutdeclines in catch rates, whereas the catch from thecoastal fishery has been only about 50 t. Previously,this would be of concern to managers, but our studiessuggest that the high catch from the middle Fly Rivermay not be impacting the spawning population to theextent previously thought (e.g. Milton et al. 1998).
Acknowledgements. We thank our colleagues in CSIRO, PNGNational Fisheries Authority and Ok Tedi Mining for provid-ing technical and logistical support throughout this project.A. Anas, G. Fry, J. Salini and C. Tenakanai helped collect andprocess fish from remote parts of Papua New Guinea. T. Vander Velde prepared the otoliths for trace element analysis. DrsB. Wells, T. Davis and 2 anonymous referees provided con-structive comments on earlier drafts of this manuscript. Thisstudy was partially funded by the Australian Centre for Inter-national Agricultural Research (FIS/98/24), Ok Tedi Mining,CSIRO and the British Geological Survey.
LITERATURE CITED
Alekseyev SS, Dgebuadze YY, Mina MV, Mironovsky AN(1996) Small ‘large barbs’ spawning in tributaries of LakeTana: what are they? Folia Zool (Suppl 1) 45:85–96
Anonymous (2003) National barramundi fishery managementplan. PNG National Fisheries Authority, Port Moresby
Bleeker P (1983) Soils of Papua New Guinea. CSIRO andAustralian National University Press, Canberra
Boubee JA, Mitchell CP, Chisnall BL, West DW, Bowman EJ,Haro A (2001) Factors regulating downstream migrationof mature eels (Anguilla spp.) at Aniwhenua Dam, Bay ofPlenty, New Zealand. NZ J Mar Freshw Res 35:121–134
Burton MPM (1999) Notes on potential errors in estimatingspawning stock biomass: determining the effects of non-participatory adults for some groundfish species. J NorthwAtl Fish Sci 25:205–213
Capo RC, Stewart BW, Chadwick OA (1998) Strontiumisotopes as tracers of ecosystem processes: theory andmethods. Geoderma 82:197–225
Crim LW, Wilson CE, So YP, Idler DR, Johnston CE (1992)Feeding, reconditioning and rematuration responses ofcaptive Atlantic salmon (Salmo salar) kelt. Can J FishAquat Sci 49:1835–1842
Davis TLO (1986) Migration patterns in barramundi, Latescalcarifer, in van Diemen Gulf, Australia, with estimates offishing mortality in specific areas. Fish Res 4:243–258
Dion R, Richardson M, Roy L, Whoriskey FG (1994) Thespawning patterns and interspecific matings of sympatricwhite (Catostomus commersoni) and longnose (C. catosto-mus) suckers from Gouin Reservoir system, Quebec. Can JZool 72:195–200
Halliday AN, Lee DC, Christensen JN, Rehkamper M and 6others (1998) Application of multiple collector-ICPMS tocosmochemistry, geochemistry, and paleoceanography.Geochim Cosmochim Acta 62:919–940
Hodell DA, Mueller PA, McKenzie JA, Mead GA (1989)Strontium isotope stratigraphy and geochemistry of thelate neocene ocean. Earth Planet Sci Lett 92:165–178
Hodell DA, Quinn RL, Brenner M, Kamenov G (2004) Spatialvariation of strontium isotopes (87Sr/86Sr) in the Mayaregion: a tool for tracking ancient human migration.J Arch Sci 31:585–601
290
Milton & Chenery: Barramundi movement patterns
Hodgson S, Quinn TP (2002) The timing of adult sockeyesalmon migration into freshwater: adaptations by popula-tions to prevailing thermal regimes. Can J Zool 80:542–555
Ingram BL, DePaolo DJ (1993) A 4300 year strontium isotoperecord of estuarine paleosalinity in San Francisco Bay,California. Earth Planet Sci Lett 119:103–119
Kalish JM (1992) Stress induced changes in the concentrationof elements in the otoliths of Australian salmon. J Exp MarBiol Ecol 162:265–277
Kare B (1995) A review of research on barramundi, reef fish,dugong, turtles and Spanish mackerel and their fisheriesin the Torres Strait adjacent to Papua New Guinea. SciNew Guinea 21:43–56
Kennedy BP, Blum JD, Folt CL, Nislow KH (2000) Using nat-ural strontium isotopic signatures as fish markers: method-ology and application. Can J Fish Aquat Sci 57:2280–2292
Loffler E (1977) Geomorphology of Papua New Guinea. CSIROand Australian National University Press, Canberra
Loffler E (1979) Papua New Guinea. Hutchinson, AustraliaMcDowall RM (1988) Diadromy in fishes: migrations between
freshwater and marine environments. Croom Helm,London
Milton DA, Chenery SR (2001) Sources and uptake of tracemetals in otoliths of juvenile barramundi (Lates calcarifer).J Exp Mar Biol Ecol 264:47–65
Milton DA, Chenery SR (2003) Movement patterns of thetropical shad hilsa (Tenualosa ilisha) inferred from tran-sects of 87Sr/86Sr isotope ratios in their otoliths. Can J FishAquat Sci 60:1376–1385
Milton DA, Die D, Tenakanai C, Swales S (1998) Selectivityfor barramundi (Lates calcarifer) in the Fly River, PapuaNew Guinea: implications for managing gill-net fisherieson protandrous fishes. Mar Freshw Res 49:499–506
Milton DA, Tenakanai C, Chenery SR (2000) Can the move-ments of barramundi in the Fly River region, Papua NewGuinea be traced in their otoliths? Estuar Coast Shelf Sci50:855–868
Moore R (1979) Natural sex inversion in the giant perch (Latescalcarifer). Aust J Mar Freshw Res 30:803–813
Moore R (1982) Spawning and early life history of barra-mundi, Lates calcarifer in Papua New Guinea. Aust J MarFreshw Res 33:647–661
Moore R, Reynolds LF (1982) Migration patterns of barra-mundi Lates calcarifer in Papua New Guinea. Aust J MarFreshw Res 33:671–682
Naslund I, Milbrink G, Eriksson LO, Holmgren S (1993)Importance of habitat productivity differences, competi-
tion and predation for the migratory behaviour of ArticCharr. Oikos 66:538–546
Okamura AK, Yamada Y, Tanaka S, Horie N, Utoh T, MikawaN, Akazawa A, Oka HP (2002) Atmospheric depression asthe final trigger for the seaward migration of the Japaneseeel Anguilla japonica. Mar Ecol Prog Ser 234:281–288
Opnai JL, Tenakanai CD (1987) Review of the barramundifishery in Papua New Guinea. In: Copland JW, Grey DL(eds) Management of wild and cultured Seabass/Barra-mundi (Lates calcarifer). ACIAR Proc 20:50–54
Pender PJ, Griffin RK (1996) Habitat history of barramundiLates calcarifer in a north Australian river system based onbarium and strontium levels in scales. Trans Am Fish Soc125:679–689
Peterman ZE, Carmichael ISE, Smith LA (1970) 87Sr/86Srratios of Quaternary lavas of the Cascade Range, northernCalifornia. Geol Soc Am Bull 81:311–318
Reznick D, Ghalambor C, Nunney L (2002) The evolution ofsenescence in fish. Mech Ageing Dev 123:773–789
Rideout RM, Burton MPM, Rose GA (2000) Observations onmass atresia and skipped spawning in northern Atlanticcod, from Smith Sound, Newfoundland. J Fish Biol 57:1429–1440
Roberts TR (1978) An ichthyological survey of the Fly River inPapua New Guinea with descriptions of new species.Smithson Contrib Zool 281:1–72
Sadovy Y, Severin KP (1992) Trace elements in biogenicaragonite: correlation of body growth rate and strontiumlevels in the otoliths of the white grunt, Haemulon plumeri(Pisces: Haemulidae). Bull Mar Sci 50:237–257
Secor DH (1992) Application of otolith microchemistry ana-lysis to investigate anadromy in Chesapeake Bay stripedbass Morone saxatilis. Fish Bull US 90:798–806
Secor DH, Rooker JP (2000) Is otolith strontium a useful scalarof life cycles in estuarine fishes? Fish Res 46:359–371
Secor DH, Henderson-Arzapalo A, Piccoli PM (1995) Canotolith microchemistry chart patterns of migration andhabitat utilisation in anadromous fishes? J Exp Mar BiolEcol 192:15–33
Swales S, Storey AW, Bakowa KA (2000) Temporal and spatialvariations in fish catches in the Fly River system in PapuaNew Guinea and the possible effects of the Ok Tedicopper mine. Environ Biol Fish 57:75–95
Walder AJ (1997) Advanced isotope ratio mass spectrometryII: isotope ratio measurement by multiple collector induc-tively coupled plasma mass spectrometry. In: Platzner IT(ed) Modern isotope ratio mass spectrometry. Wiley,London, p 83–108
Woodhead AD (1979) Senescence in fishes. Symp Zool SocLond 44:179–205
291
Editorial responsibility: Otto Kinne (Editor-in-Chief), Oldendorf/Luhe, Germany
Submitted: September 8, 2004; Accepted: March 12, 2005Proofs received from author(s): September 15, 2005