52
movie #7614 movie #3250 movie #15868 Lessons from the Netflix Prize Yehuda Koren The BellKor team (with Robert Bell & Chris Volinsky)
| Date post: | 19-Dec-2015 |
| Category: |
Documents |
| View: | 221 times |
| Download: | 0 times |
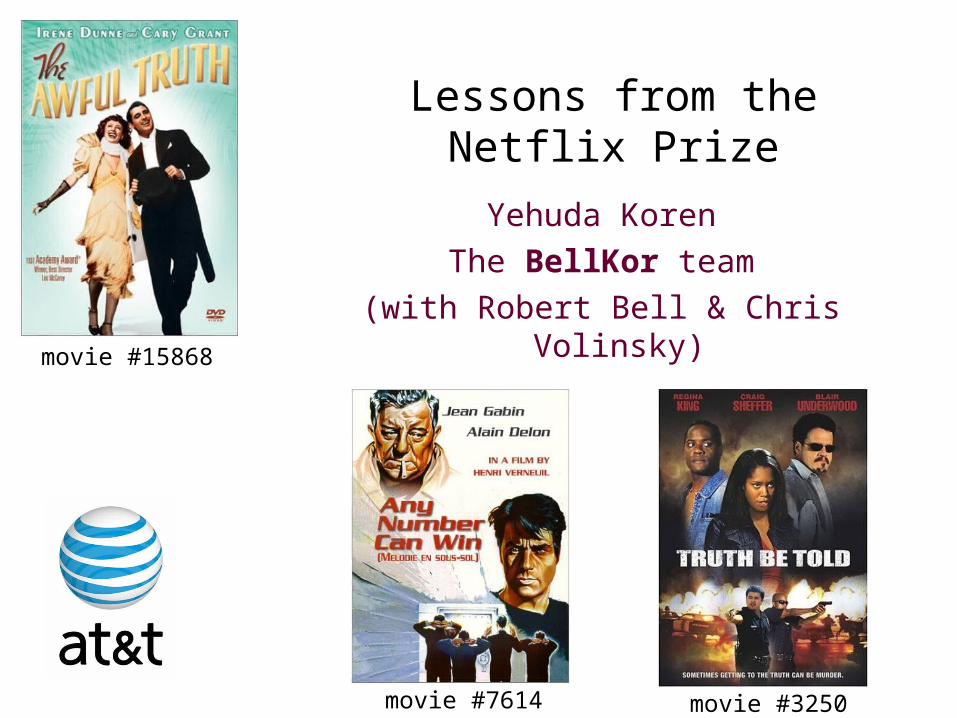
movie #7614 movie #3250
movie #15868
Lessons from the Netflix Prize
Yehuda KorenThe BellKor team
(with Robert Bell & Chris Volinsky)

We Know What You OughtTo Be Watching This
Summer
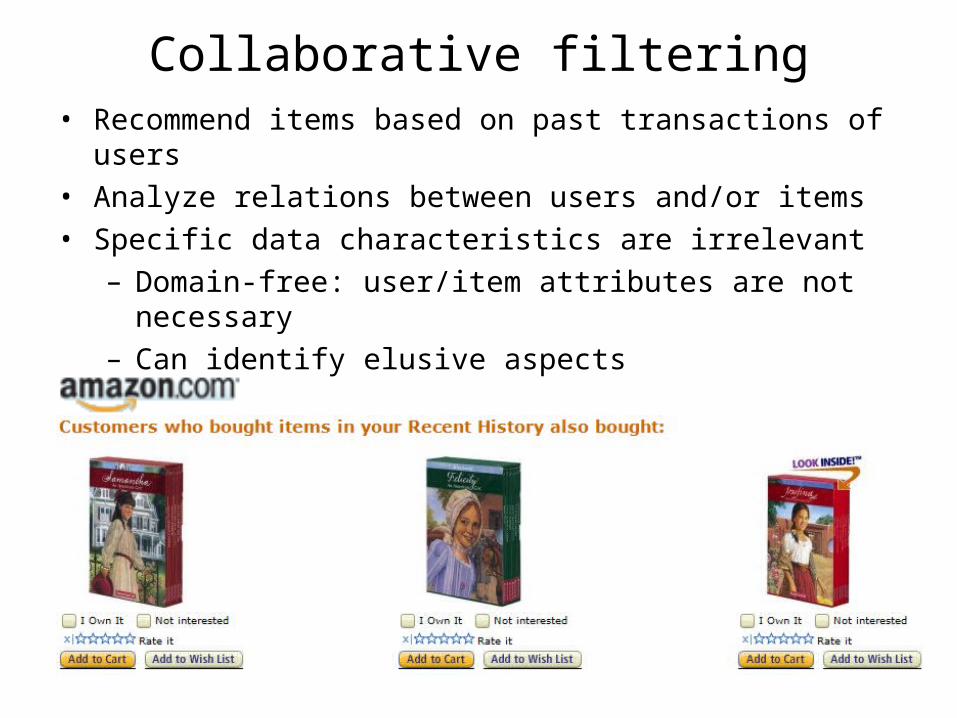
Collaborative filtering• Recommend items based on past transactions of users
• Analyze relations between users and/or items
• Specific data characteristics are irrelevant
– Domain-free: user/item attributes are not necessary
– Can identify elusive aspects

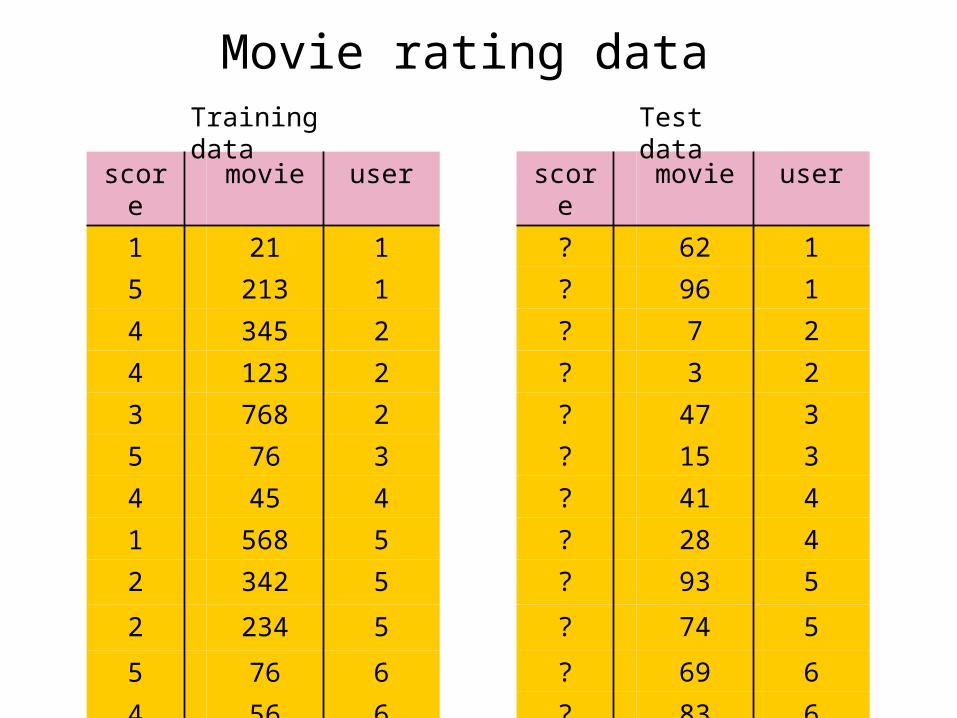
usermoviescore
1211
12135
23454
21234
27683
3765
4454
55681
53422
52342
6765
6564
usermoviescore
162?
196?
27?
23?
347?
315?
441?
428?
593?
574?
669?
683?
Training data Test data
Movie rating data

Netflix Prize• Training data
– 100 million ratings– 480,000 users– 17,770 movies– 6 years of data: 2000-2005
• Test data– Last few ratings of each user (2.8 million)– Evaluation criterion: root mean squared error (RMSE) – Netflix Cinematch RMSE: 0.9514
• Competition– 2700+ teams– $1 million grand prize for 10% improvement on Cinematch result– $50,000 2007 progress prize for 8.43% improvement

Overall rating distribution
• Third of ratings are 4s• Average rating is 3.68
From TimelyDevelopment.com

#ratings per movie
• Avg #ratings/movie: 5627

#ratings per user
• Avg #ratings/user: 208
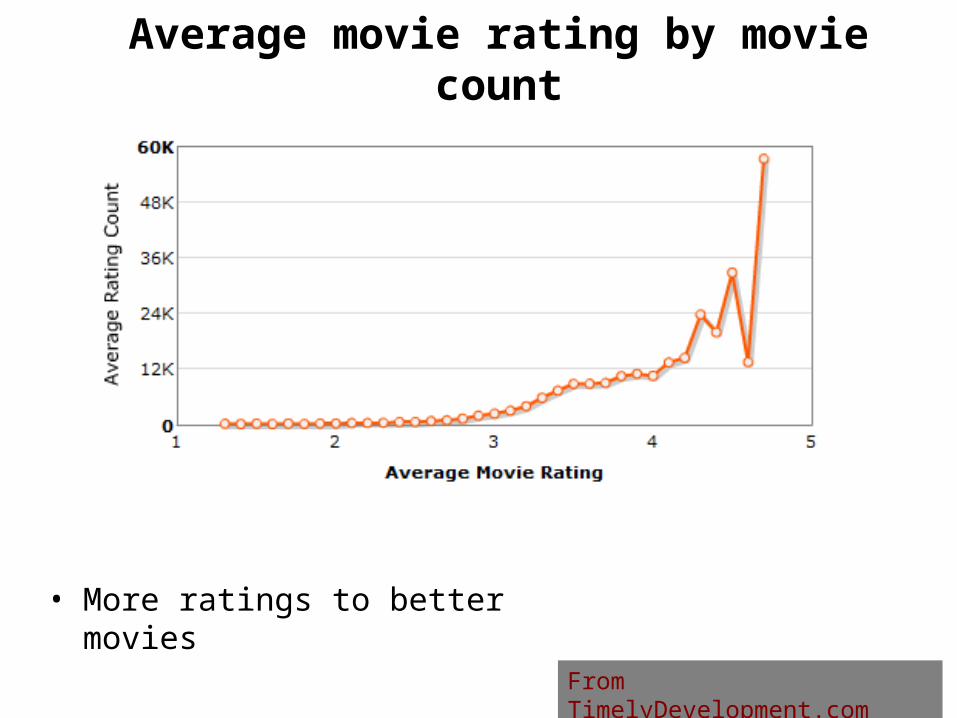
Average movie rating by movie count
• More ratings to better movies
From TimelyDevelopment.com

Most loved movies
TitleAvg ratingCount
The Shawshank Redemption 4.593 137812
Lord of the Rings: The Return of the King4.545 133597
The Green Mile 4.306 180883
Lord of the Rings: The Two Towers 4.460 150676
Finding Nemo 4.415 139050
Raiders of the Lost Ark 4.504 117456
Forrest Gump 4.299 180736
Lord of the Rings: The Fellowship of the ring4.433 147932
The Sixth Sense 4.325 149199
Indiana Jones and the Last Crusade 4.333 144027

Important RMSEs
Grand Prize: 0.8563; 10% improvement
BellKor: 0.8693; 8.63% improvement
Cinematch: 0.9514; baseline
Movie average: 1.0533
User average: 1.0651
Global average: 1.1296
Inherent noise ???? :
Personalization
erroneous
accurate
Challenges
• Size of data– Scalability
– Keeping data in memory
• Missing data– 99 percent missing
– Very imbalanced
• Avoiding overfitting• Test and training data differ significantly movie #16322

• Use an ensemble of complementing predictors• Two, half tuned models worth more than a single,
fully tuned model
The BellKor recommender system
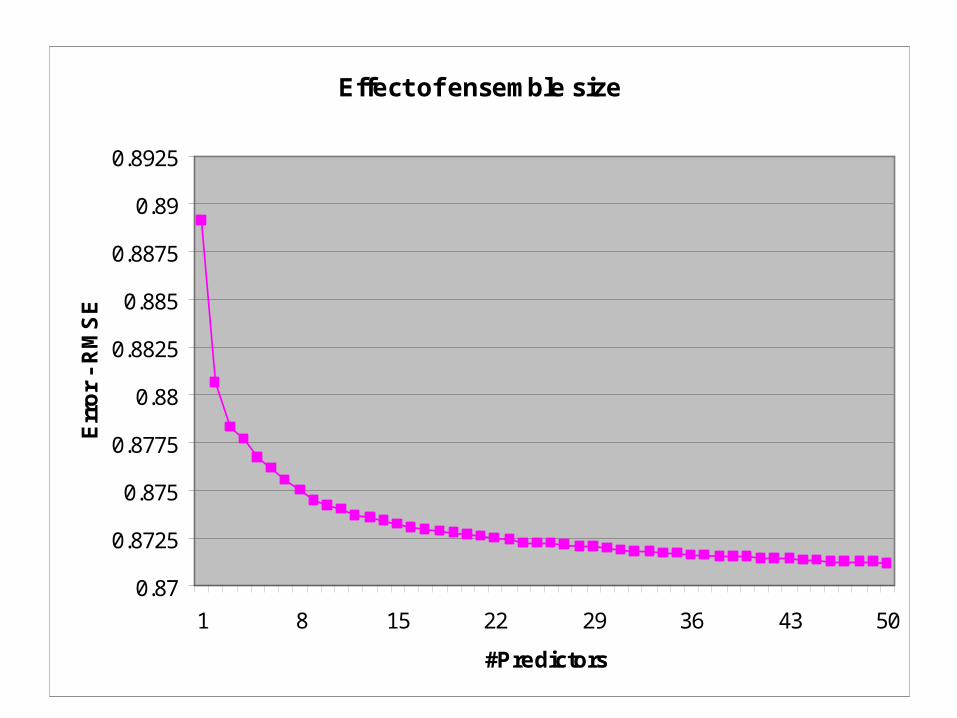
Effect of ensemble size
0.87
0.8725
0.875
0.8775
0.88
0.8825
0.885
0.8875
0.89
0.8925
1 8 15 22 29 36 43 50
#Predictors
Err
or
- R
MS
E

• Use an ensemble of complementing predictors• Two, half tuned models worth more than a single,
fully tuned model• But:
Many seemingly different models expose similar characteristics of the data, and won’t mix well
• Concentrate efforts along three axes...
The BellKor recommender system

The first axis:• Multi-scale modeling of the data• Combine top level, regional modeling of
the data, with a refined, local view:– k-NN: Extracting local patterns– Factorization: Addressing regional
effects
The three dimensions of the BellKor system
Global effects
Factorization
k-NN

Multi-scale modeling – 1st tier
• Mean rating: 3.7 stars• The Sixth Sense is 0.5 stars above
avg• Joe rates 0.2 stars below avgBaseline estimation:
Joe will rate The Sixth Sense 4 stars
Global effects:

Multi-scale modeling – 2nd tier
• Both The Sixth Sense and Joe are placed high on the “Supernatural Thrillers” scale
Adjusted estimate:Joe will rate The Sixth Sense 4.5 stars
Factors model:

Multi-scale modeling – 3rd tier
• Joe didn’t like related movie Signs
Final estimate:Joe will rate The Sixth Sense 4.2 stars
Neighborhood model:

The second axis:• Quality of modeling• Make the best out of a model • Strive for:
– Fundamental derivation– Simplicity– Avoid overfitting– Robustness against #iterations,
parameter setting, etc. • Optimizing is good, but don’t overdo it!
The three dimensions of the BellKor system
global
local
quality

• The third dimension will be discussed later...
• Next:Moving the multi-scale view along the quality axis
The three dimensions of the BellKor system
global
local
quality
???

• Earliest and most popular collaborative filtering method• Derive unknown ratings from those of “similar” items (movie-movie
variant)• A parallel user-user flavor: rely on ratings of like-minded users (not
in this talk)
Local modeling through k-NN

k-NN
123456789101112
113554
2544213
324123435
424542
5434225
613324
users
mo
vies
-unknown rating -rating between 1 to 5

k-NN
123456789101112
113? 554
2544213
324123435
424542
5434225
613324
users
mo
vies
-estimate rating of movie 1 by user 5

k-NN
123456789101112
113? 554
2544213
324123435
424542
5434225
613324
users
Neighbor selection:Identify movies similar to 1, rated by user 5
mo
vies

k-NN
123456789101112
113? 554
2544213
324123435
424542
5434225
613324
users
Compute similarity weights:s13=0.2, s16=0.3
mo
vies

k-NN
123456789101112
1132.6554
2544213
324123435
424542
5434225
613324
users
Predict by taking weighted average:(0.2*2+0.3*3)/(0.2+0.3)=2.6
mo
vies

Properties of k-NN
• Intuitive• No substantial preprocessing is required• Easy to explain reasoning behind a recommendation• Accurate?

Grand Prize: 0.8563
BellKor: 0.8693
Cinematch: 0.9514
Movie average: 1.0533
User average: 1.0651
Global average: 1.1296
Inherent noise ???? :
0.96
0.91
k-NN on the RMSE scale
k-NN
erroneous
accurate

k-NN - Common practice1. Define a similarity measure between items: sij
2. Select neighbors -- N(i;u): items most similar to i, that were rated by u
3. Estimate unknown rating, rui, as the weighted average:
( ; )
( ; )
ij uj ujj N i uui ui
ijj N i u
s r br b
s
baseline estimate for rui
k-NN - Common practice1. Define a similarity measure between items: sij
2. Select neighbors -- N(i;u): items similar to i, rated by u
3. Estimate unknown rating, rui, as the weighted average:
Problems:
1. Similarity measures are arbitrary; no fundamental justification
2. Pairwise similarities isolate each neighbor; neglect interdependencies among neighbors
3. Taking a weighted average is restricting; e.g., when neighborhood information is limited
( ; )
( ; )
ij uj ujj N i uui ui
ijj N i u
s r br b
s

(We allow )
Interpolation weights
• Use a weighted sum rather than a weighted average:
( ; )
1ijj N i u
w
( ; )ui ui ij uj ujj N i ur b w r b
• Model relationships between item i and its neighbors• Can be learnt through a least squares problem from all
other users that rated i:
2
( ; )Minw vi vi ij vj vjv u j N i u
r b w r b

Interpolation weights
2
( ; )Minw vi vi ij vj vjv u j N i u
r b w r b
• Interpolation weights derived based on their role; no use of an arbitrary similarity measure
• Explicitly account for interrelationships among the neighbors
Challenges:• Deal with missing values• Avoid overfitting• Efficient implementation
Mostly unknown
Estimate inner-products among movie ratings
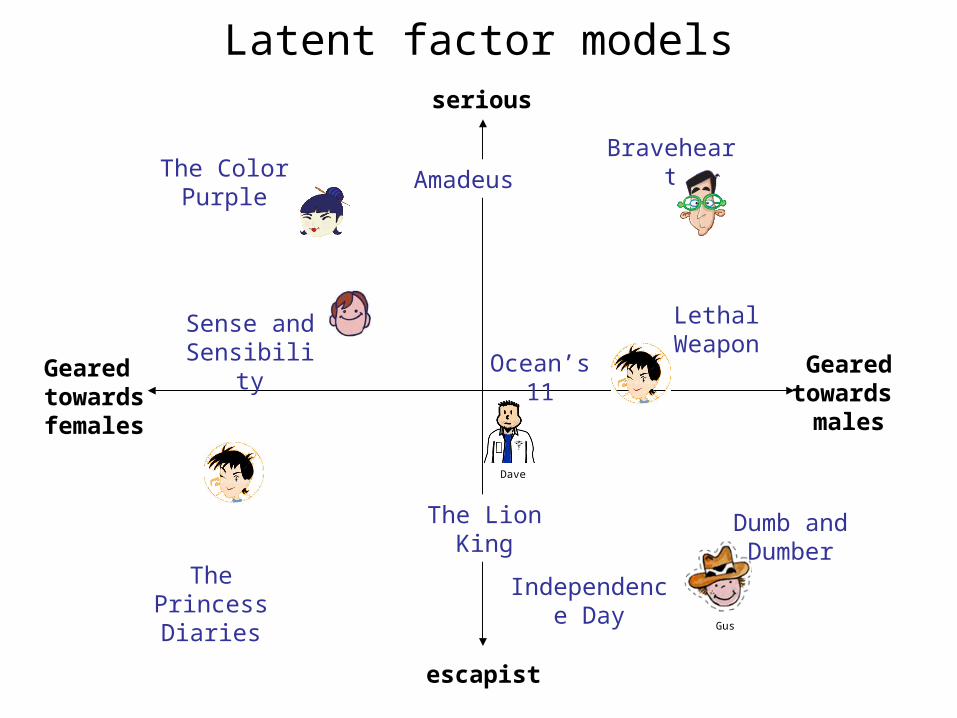
Geared towards females
Geared towards
males
serious
escapist
The PrincessDiaries
The Lion King
Braveheart
Lethal Weapon
Independence Day
AmadeusThe Color Purple
Dumb and Dumber
Ocean’s 11
Sense and Sensibility
Gus
Dave
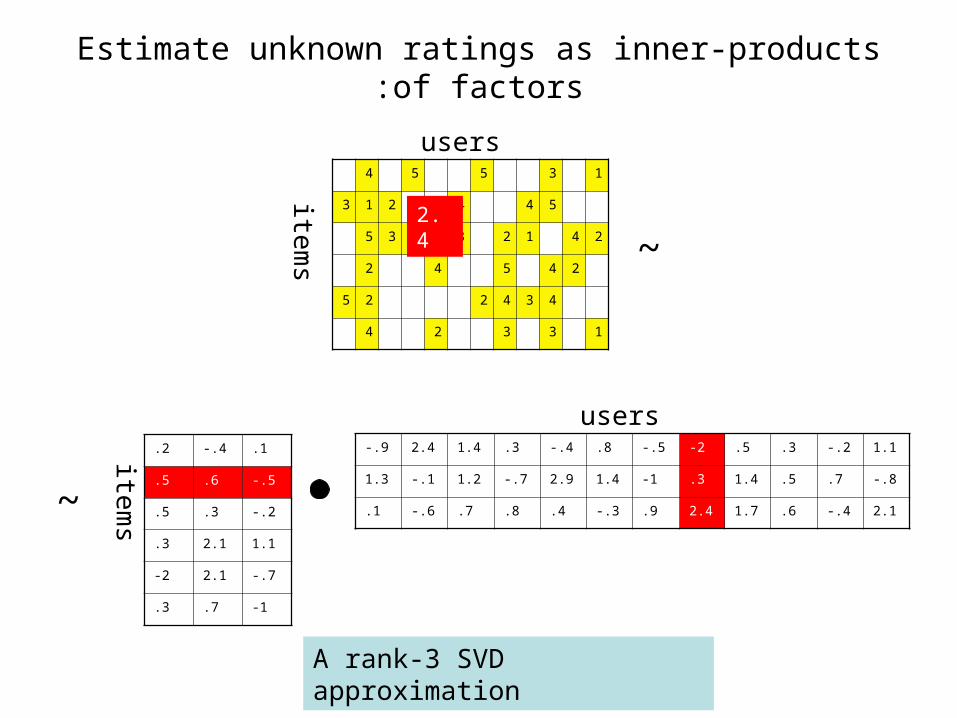
Latent factor models

Latent factor models
13554
544213
24123435
24542
434225
13324
item
s
.1-.4.2
-.5.6.5
-.2.3.5
1.12.1.3
-.72.1-2
-1.7.3
1.1-.2.3.5-2-.5.8-.4.31.42.4-.9
-.8.7.51.4.3-11.42.9-.71.2-.11.3
2.1-.4.61.72.4.9-.3.4.8.7-.6.1
~
~
item
s
users
users
A rank-3 SVD approximation

Estimate unknown ratings as inner-products of factors:
13554
544213
24123435
24542
434225
13324
item
s
.1-.4.2
-.5.6.5
-.2.3.5
1.12.1.3
-.72.1-2
-1.7.3
1.1-.2.3.5-2-.5.8-.4.31.42.4-.9
-.8.7.51.4.3-11.42.9-.71.2-.11.3
2.1-.4.61.72.4.9-.3.4.8.7-.6.1
~
~
item
s
users
A rank-3 SVD approximation
users
?

Estimate unknown ratings as inner-products of factors:
13554
544213
24123435
24542
434225
13324
item
s
.1-.4.2
-.5.6.5
-.2.3.5
1.12.1.3
-.72.1-2
-1.7.3
1.1-.2.3.5-2-.5.8-.4.31.42.4-.9
-.8.7.51.4.3-11.42.9-.71.2-.11.3
2.1-.4.61.72.4.9-.3.4.8.7-.6.1
~
~
item
s
users
A rank-3 SVD approximation
users
?
Estimate unknown ratings as inner-products of factors:
13554
544213
24123435
24542
434225
13324
item
s
.1-.4.2
-.5.6.5
-.2.3.5
1.12.1.3
-.72.1-2
-1.7.3
1.1-.2.3.5-2-.5.8-.4.31.42.4-.9
-.8.7.51.4.3-11.42.9-.71.2-.11.3
2.1-.4.61.72.4.9-.3.4.8.7-.6.1
~
~
item
s
users
2.4
A rank-3 SVD approximation
users

Latent factor models13554
544213
24123435
24542
434225
13324
.1-.4.2
-.5.6.5
-.2.3.5
1.12.1.3
-.72.1-2
-1.7.3
1.1-.2.3.5-2-.5.8-.4.31.42.4-.9
-.8.7.51.4.3-11.42.9-.71.2-.11.3
2.1-.4.61.72.4.9-.3.4.8.7-.6.1
~
Properties:• SVD isn’t defined when entries are unknown use
specialized methods• Very powerful model can easily overfit, sensitive to
regularization• Probably most popular model among contestants
– 12/11/2006: Simon Funk describes an SVD based method– 12/29/2006: Free implementation at timelydevelopment.com

Grand Prize: 0.8563
BellKor: 0.8693
Cinematch: 0.9514
Movie average: 1.0533
User average: 1.0651
Global average: 1.1296
Inherent noise ???? :
0.93
0.89
Factorization on the RMSE scale
factorization

Our approach
• User factors: Model a user u as a vector pu ~ Nk(, )
• Movie factors:Model a movie i as a vector qi ~ Nk(γ, Λ)
• Ratings:Measure “agreement” between u and i: rui ~ N(pu
Tqi, ε2)
• Maximize model’s likelihood:– Alternate between recomputing user-factors,
movie-factors and model parameters– Special cases:
• Alternating Ridge regression• Nonnegative matrix factorization

Combining multi-scale views
global effects
regional effects
local effects
Residual fitting
factorization
k-NN
Weighted average
A unified model
k-NN
factorization

Localized factorization model
• Standard factorization: User u is a linear function parameterized by pu
rui = puTqi
• Allow user factors – pu – to depend on the item being predicted
rui = pu(i)Tqi
• Vector pu(i) models behavior of u on items like i

RMSE vs. #Factors
0.905
0.91
0.915
0.92
0.925
0.93
0.935
0 20 40 60 80
#Factors
RM
SE Factorization
Localized factorization
Results on Netflix Probe set
More accurate

Top contenders for Progress Prize 2007
0
1
2
3
4
5
6
7
8
9
10
10/2
/200
6
11/2
/200
6
12/2
/200
6
1/2/
2007
2/2/
2007
3/2/
2007
4/2/
2007
5/2/
2007
6/2/
2007
7/2/
2007
8/2/
2007
9/2/
2007
10/2
/200
7
% i
mp
rove
men
t
ML@Toronto
How low can he go?
wxyzConsulting
Gravity
BellKor
Grand prize
multi-scale modeling
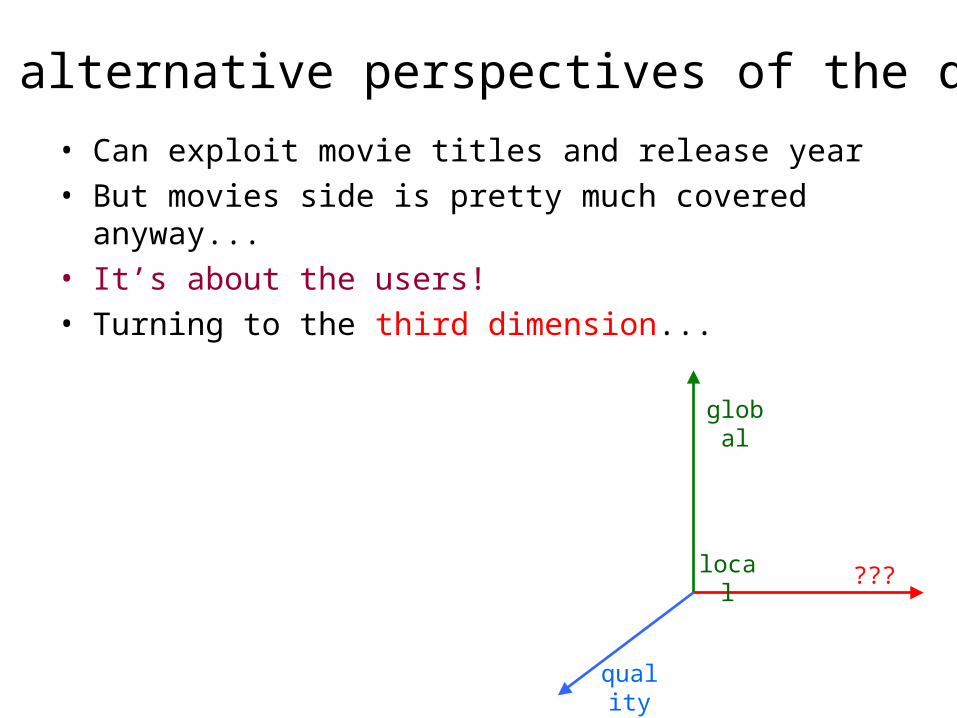
• Can exploit movie titles and release year• But movies side is pretty much covered anyway...• It’s about the users!• Turning to the third dimension...
Seek alternative perspectives of the data
global
local
quality
???

The third dimension of the BellKor system
• A powerful source of information:Characterize users by which movies they rated, rather than how they rated
A binary representation of the data
13554
544213
24123435
24542
434225
13324
users
mo
vies
101001001010
001100100111
110110101110
011010010010
001111000011
101010010010
usersm
ovie
s

The third dimension of the BellKor system
movie #17270
Great news to recommender systems:• Works even better on real life datasets (?)• Improve accuracy by exploiting implicit
feedback• Implicit behavior is abundant and easy to
collect:– Rental history– Search patterns– Browsing history– ...
• Implicit feedback allows predicting personalized ratings for users that never rated!

binaryimplicit
global
local
quality
The three dimensions of the BellKor system
Where do you want to be?• All over the global-local axis• Relatively high on the quality axis• Can we go in between the explicit-
implicit axis?• Yes! Relevant methods:
– Conditional RBMs [ML@UToronto]– NSVD [Arek Paterek]– Asymmetric factor models
ratingsexplicit

LessonsWhat it takes to win:1. Think deeper – design better algorithms2. Think broader – use an ensemble of multiple predictors3. Think different – model the data from different perspectives
At the personal level:1. Have fun with the data2. Work hard, long breath3. Good teammates
Rapid progress of science:1. Availability of large, real life data2. Challenge, competition3. Effective collaboration
movie #13043

13554
544213
24123435
24542
434225
13324
12343
454
4342
23
5
42
Yehuda Koren
AT&T Labs – Research
BellKor homepage:www.research.att.com/~volinsky/netflix/


![5 movie mas mayo [movie-mas.com]](https://static.documents.pub/doc/80x56/559b4a451a28ab9c678b4596/5-movie-mas-mayo-movie-mascom.jpg)


