34
Janet Oakley Director of Director of American Association of State Highway and Transportation Officials Moving Ahead for Progress in the 21 st Century Act (MAP-21) And Beyond
Janet Oakley Director of Director of
American Association of State Highway and Transportation Officials
Moving Ahead for Progress in the 21st Century Act
(MAP-21) And Beyond
MAP-21Key highlights ◦ Funding
◦ Program Reforms – program consolidation, performance and accountability, project delivery
Historic Preservation ◦ Funding and Collaboration Opportunities
The Future for the Federal-Aid Surface Transportation Program
America responds to Surface Transportation needs
Strong bipartisan support for passage in Congress ◦ House 372-52; Senate 74-19
Program Reforms ◦ Funding
◦ Program consolidation
◦ Performance and Accountability
◦ Accelerating Project Delivery
Moving Ahead for Progress in the 21st Century Act (MAP-21)
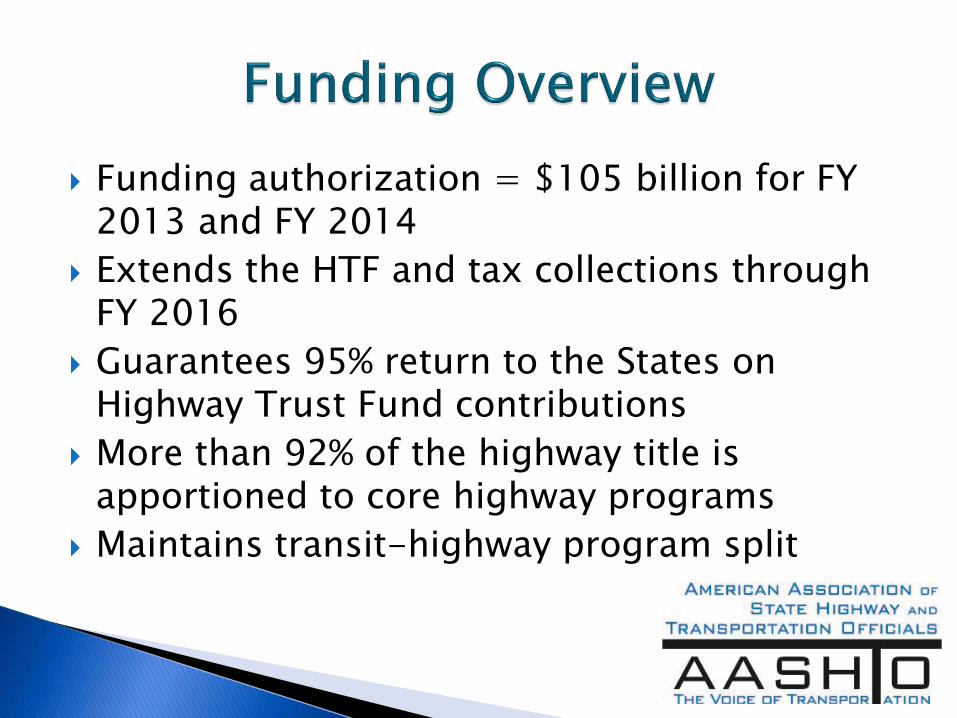
Funding authorization = $105 billion for FY 2013 and FY 2014
Extends the HTF and tax collections through FY 2016
Guarantees 95% return to the States on Highway Trust Fund contributions
More than 92% of the highway title is apportioned to core highway programs
Maintains transit-highway program split
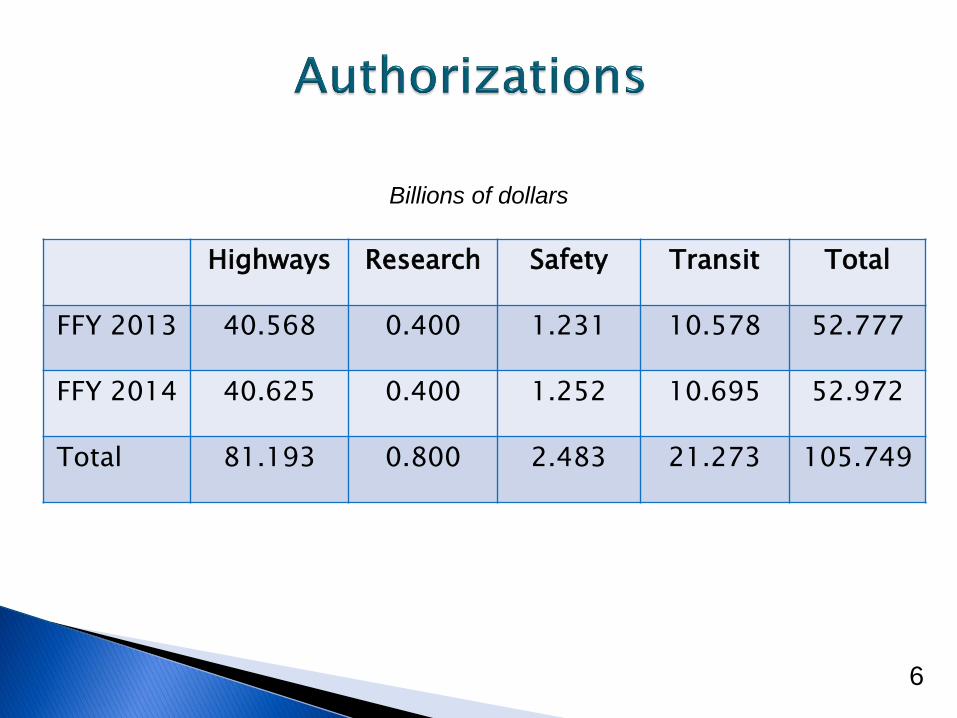
Highways Research Safety Transit Total
FFY 2013 40.568 0.400 1.231 10.578 52.777
FFY 2014 40.625 0.400 1.252 10.695 52.972
Total 81.193 0.800 2.483 21.273 105.749
6
Billions of dollars
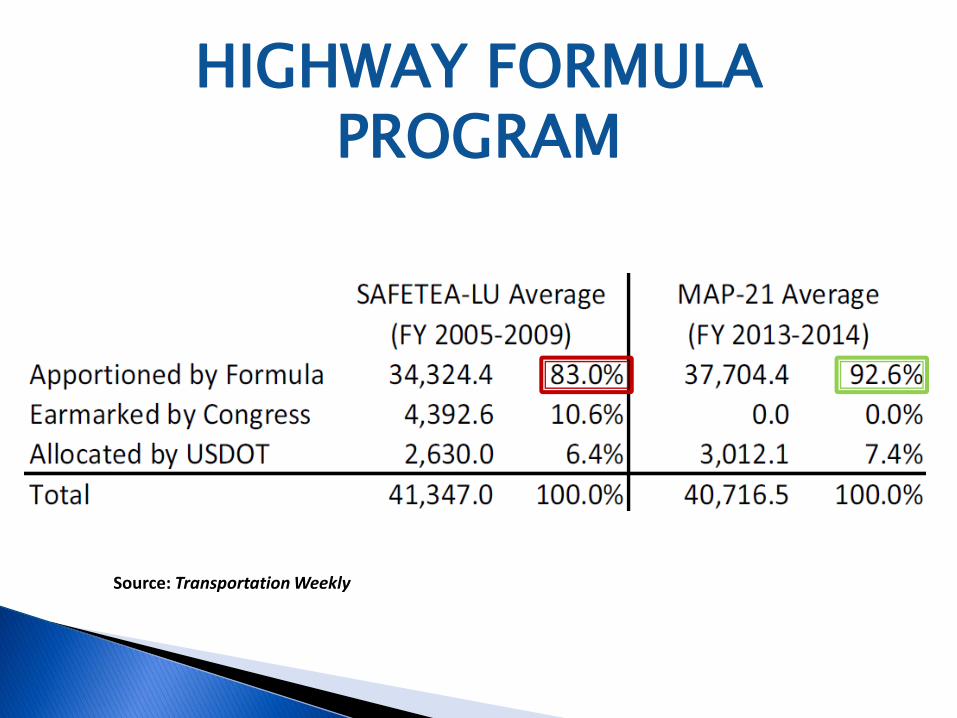
Source: Transportation Weekly
HIGHWAY FORMULA PROGRAM
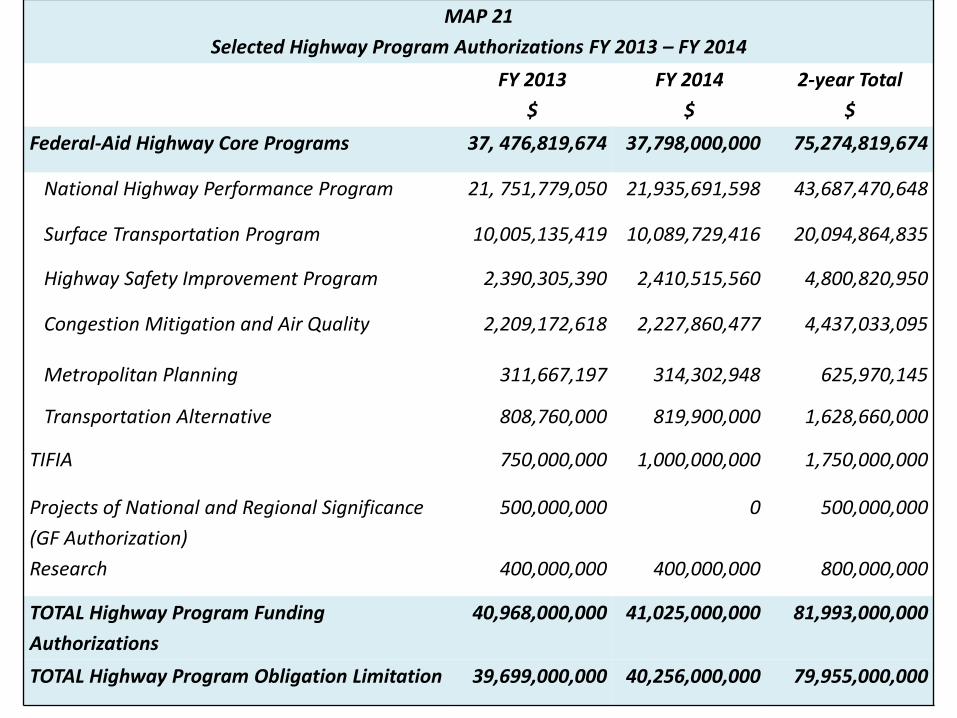
MAP 21
Selected Highway Program Authorizations FY 2013 – FY 2014
FY 2013
$
FY 2014
$
2-year Total
$
Federal-Aid Highway Core Programs 37, 476,819,674 37,798,000,000 75,274,819,674
National Highway Performance Program 21, 751,779,050 21,935,691,598 43,687,470,648
Surface Transportation Program 10,005,135,419 10,089,729,416 20,094,864,835
Highway Safety Improvement Program 2,390,305,390 2,410,515,560 4,800,820,950
Congestion Mitigation and Air Quality 2,209,172,618 2,227,860,477 4,437,033,095
Metropolitan Planning 311,667,197 314,302,948 625,970,145
Transportation Alternative 808,760,000 819,900,000 1,628,660,000
TIFIA 750,000,000 1,000,000,000 1,750,000,000
Projects of National and Regional Significance
(GF Authorization)
500,000,000 0 500,000,000
Research 400,000,000 400,000,000 800,000,000
TOTAL Highway Program Funding
Authorizations
40,968,000,000 41,025,000,000 81,993,000,000
TOTAL Highway Program Obligation Limitation 39,699,000,000 40,256,000,000 79,955,000,000
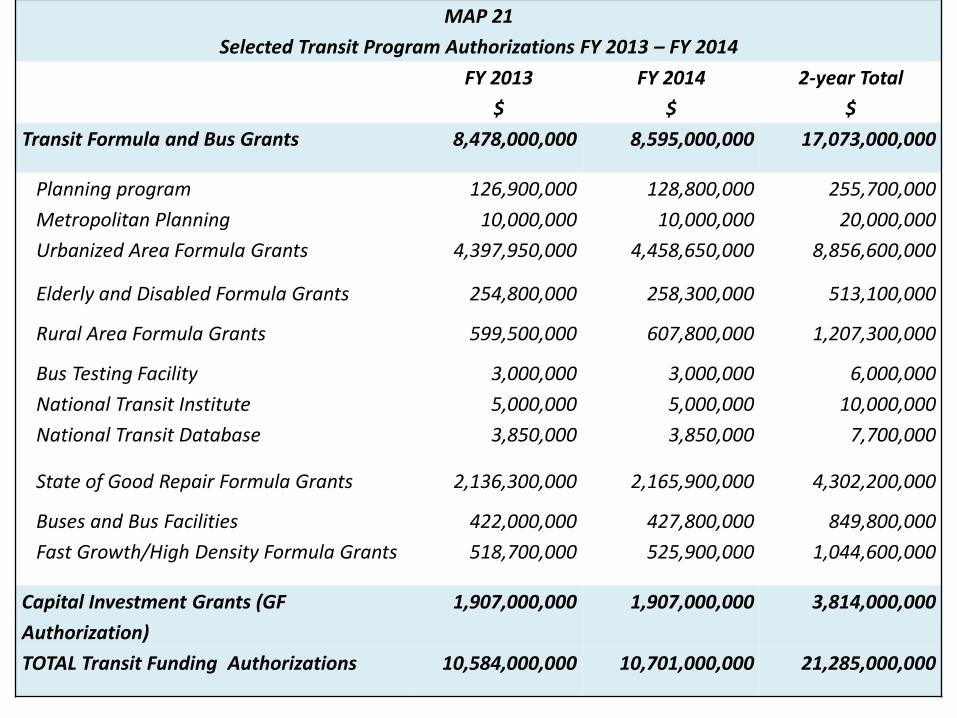
MAP 21
Selected Transit Program Authorizations FY 2013 – FY 2014
FY 2013
$
FY 2014
$
2-year Total
$
Transit Formula and Bus Grants 8,478,000,000 8,595,000,000 17,073,000,000
Planning program 126,900,000 128,800,000 255,700,000
Metropolitan Planning 10,000,000 10,000,000 20,000,000
Urbanized Area Formula Grants 4,397,950,000 4,458,650,000 8,856,600,000
Elderly and Disabled Formula Grants 254,800,000 258,300,000 513,100,000
Rural Area Formula Grants 599,500,000 607,800,000 1,207,300,000
Bus Testing Facility 3,000,000 3,000,000 6,000,000
National Transit Institute 5,000,000 5,000,000 10,000,000
National Transit Database 3,850,000 3,850,000 7,700,000
State of Good Repair Formula Grants 2,136,300,000 2,165,900,000 4,302,200,000
Buses and Bus Facilities 422,000,000 427,800,000 849,800,000
Fast Growth/High Density Formula Grants 518,700,000 525,900,000 1,044,600,000
Capital Investment Grants (GF
Authorization)
1,907,000,000 1,907,000,000 3,814,000,000
TOTAL Transit Funding Authorizations 10,584,000,000 10,701,000,000 21,285,000,000
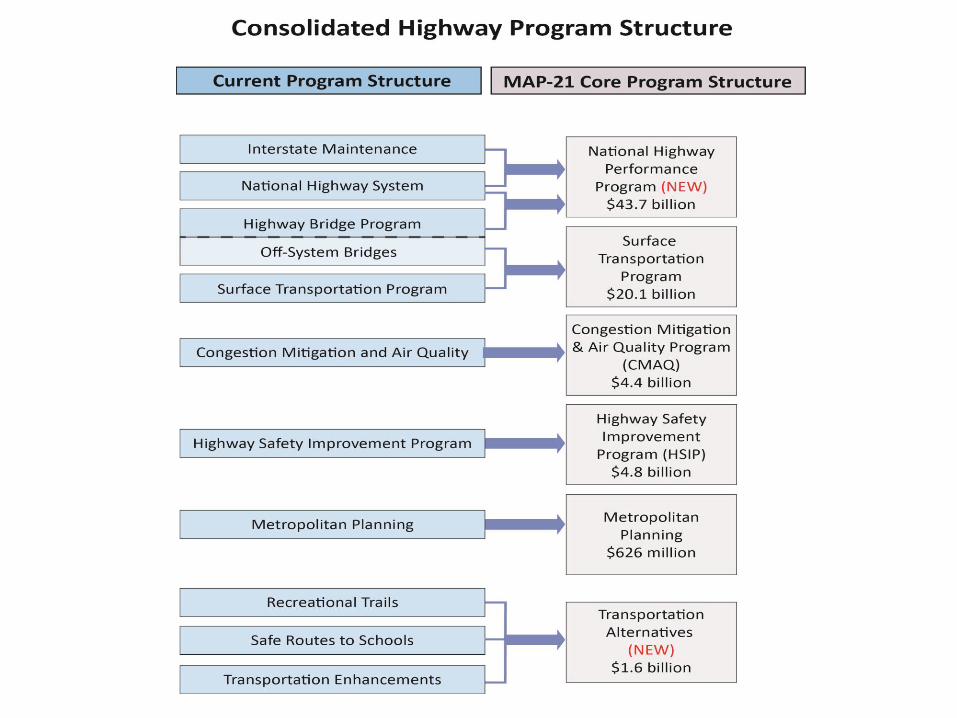
Moving Ahead for Progress in the 21st Century Act (MAP-21)
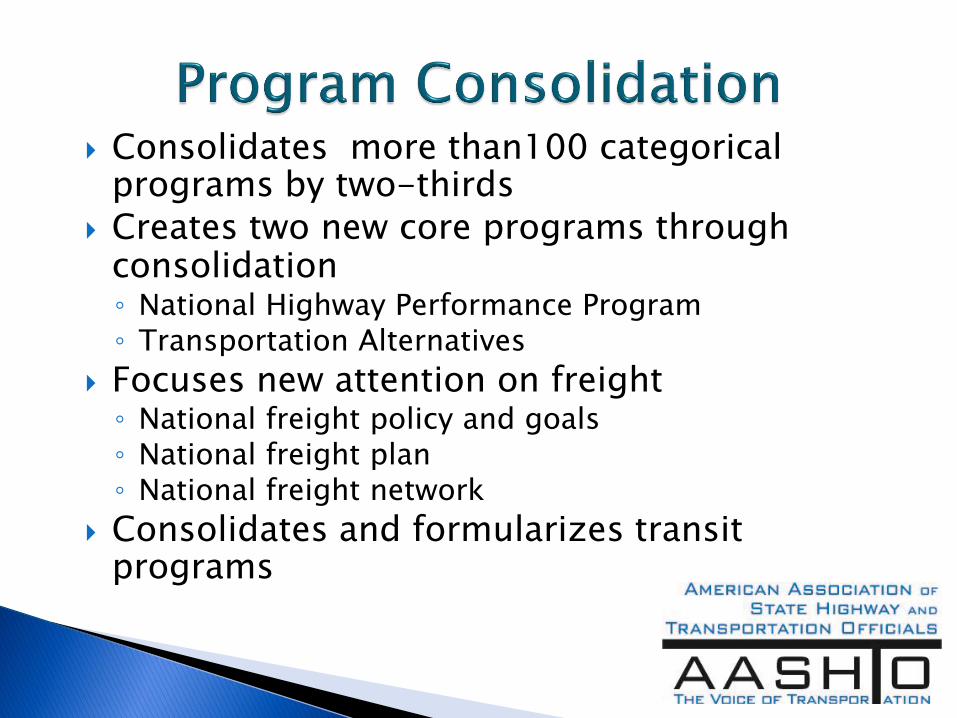
Consolidates more than100 categorical programs by two-thirds
Creates two new core programs through consolidation ◦ National Highway Performance Program ◦ Transportation Alternatives
Focuses new attention on freight ◦ National freight policy and goals ◦ National freight plan ◦ National freight network
Consolidates and formularizes transit programs
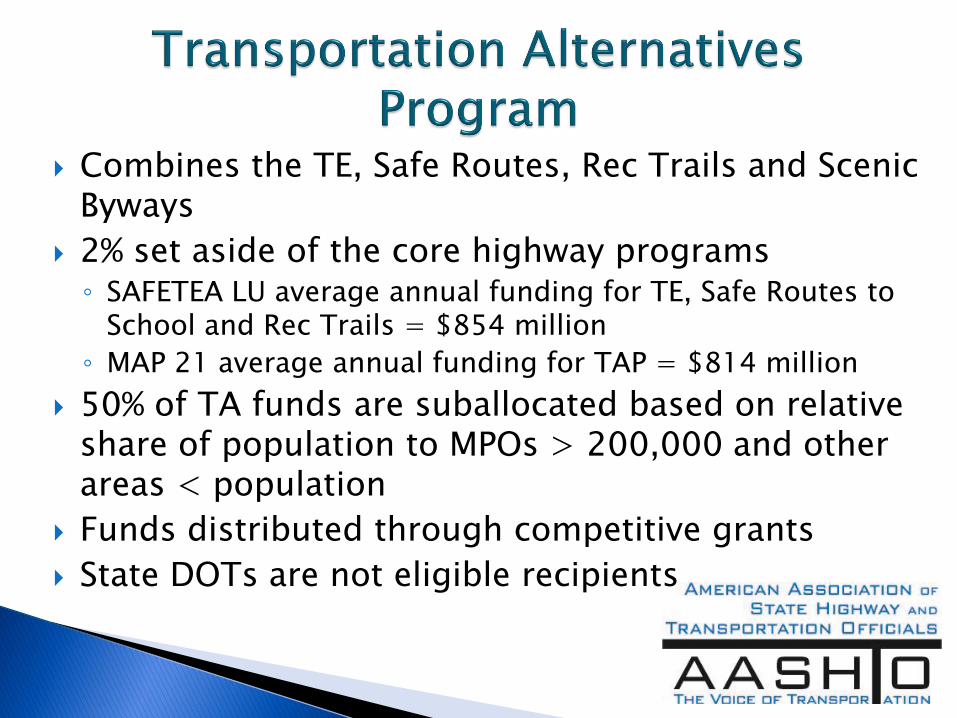
Combines the TE, Safe Routes, Rec Trails and Scenic Byways
2% set aside of the core highway programs ◦ SAFETEA LU average annual funding for TE, Safe Routes to
School and Rec Trails = $854 million
◦ MAP 21 average annual funding for TAP = $814 million
50% of TA funds are suballocated based on relative share of population to MPOs > 200,000 and other areas < population
Funds distributed through competitive grants
State DOTs are not eligible recipients
Historic preservation, rehabilitation and operation of historic transportation buildings, structures and facilities
Archaeological activities related to transportation projects
Moving Ahead for Progress in the 21st Century Act (MAP-21)
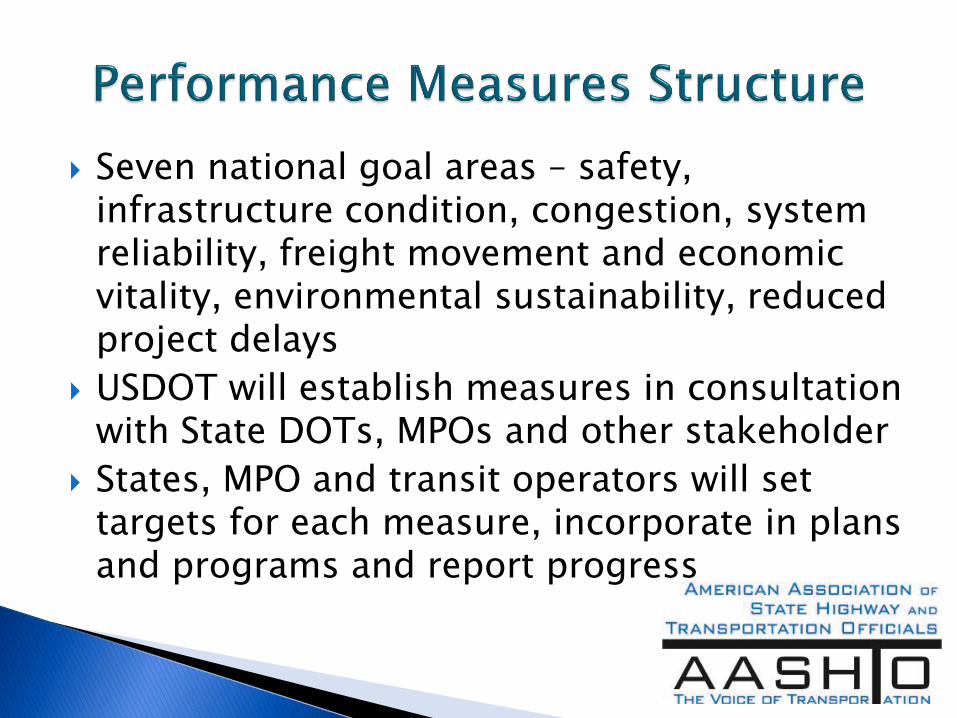
Seven national goal areas – safety, infrastructure condition, congestion, system reliability, freight movement and economic vitality, environmental sustainability, reduced project delays
USDOT will establish measures in consultation with State DOTs, MPOs and other stakeholder
States, MPO and transit operators will set targets for each measure, incorporate in plans and programs and report progress
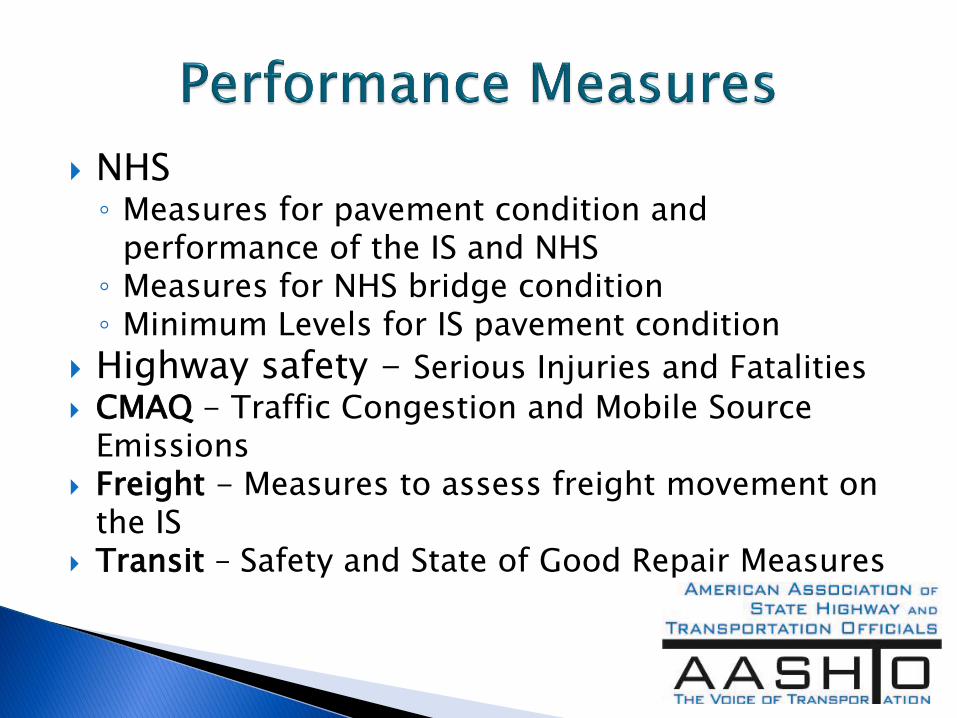
NHS ◦ Measures for pavement condition and
performance of the IS and NHS ◦ Measures for NHS bridge condition ◦ Minimum Levels for IS pavement condition
Highway safety - Serious Injuries and Fatalities
CMAQ - Traffic Congestion and Mobile Source Emissions
Freight - Measures to assess freight movement on the IS
Transit – Safety and State of Good Repair Measures
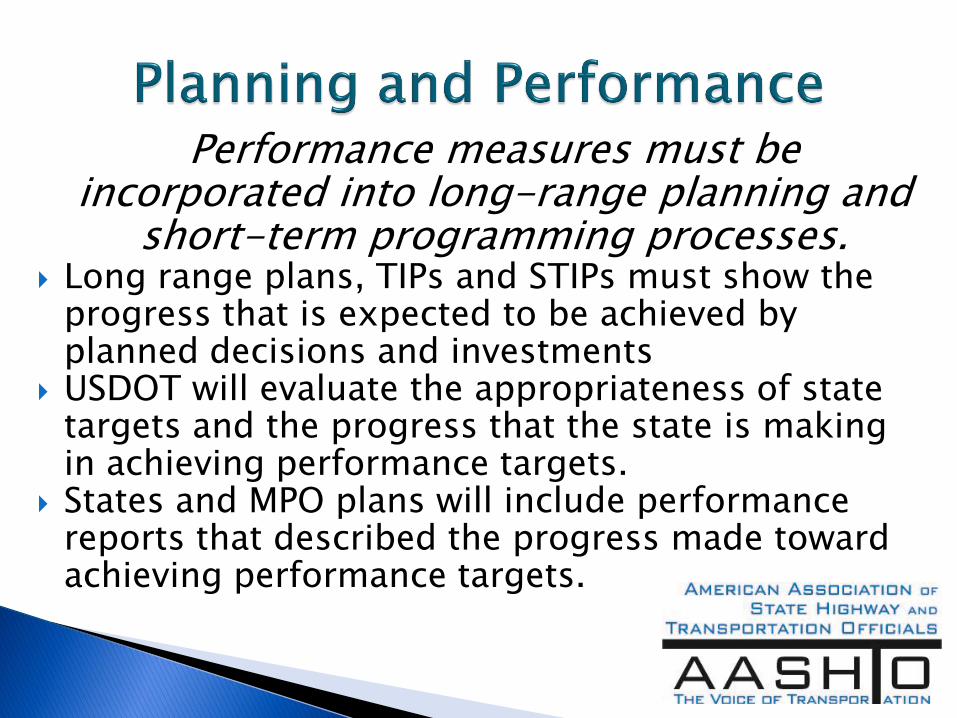
Performance measures must be incorporated into long-range planning and
short-term programming processes. Long range plans, TIPs and STIPs must show the
progress that is expected to be achieved by planned decisions and investments
USDOT will evaluate the appropriateness of state targets and the progress that the state is making in achieving performance targets.
States and MPO plans will include performance reports that described the progress made toward achieving performance targets.
Moving Ahead for Progress in the 21st Century Act (MAP-21)
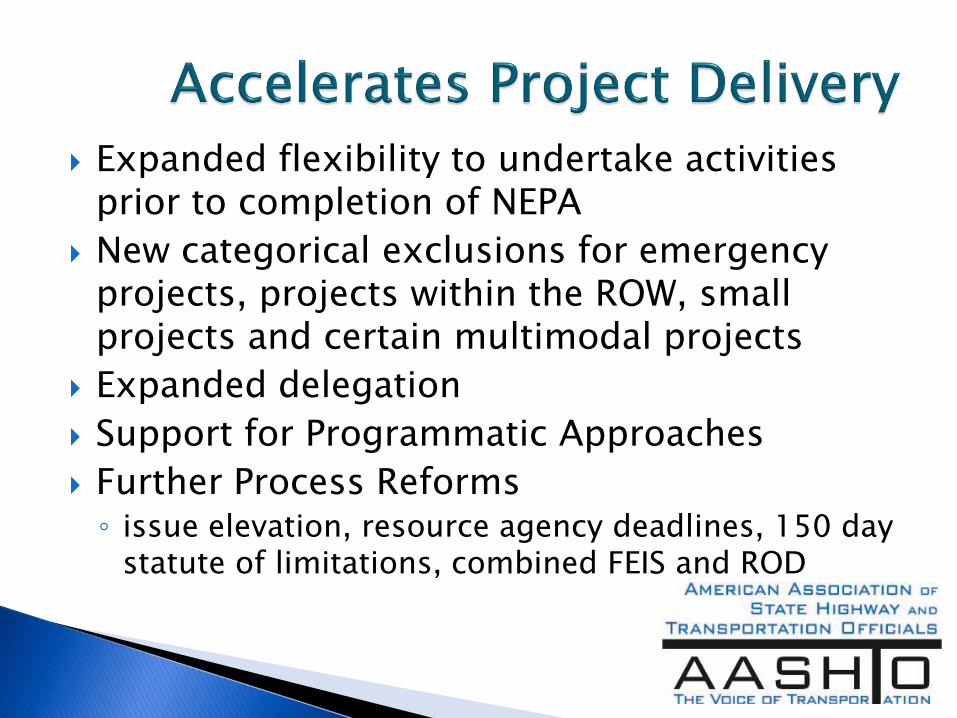
Expanded flexibility to undertake activities prior to completion of NEPA
New categorical exclusions for emergency projects, projects within the ROW, small projects and certain multimodal projects
Expanded delegation
Support for Programmatic Approaches
Further Process Reforms ◦ issue elevation, resource agency deadlines, 150 day
statute of limitations, combined FEIS and ROD
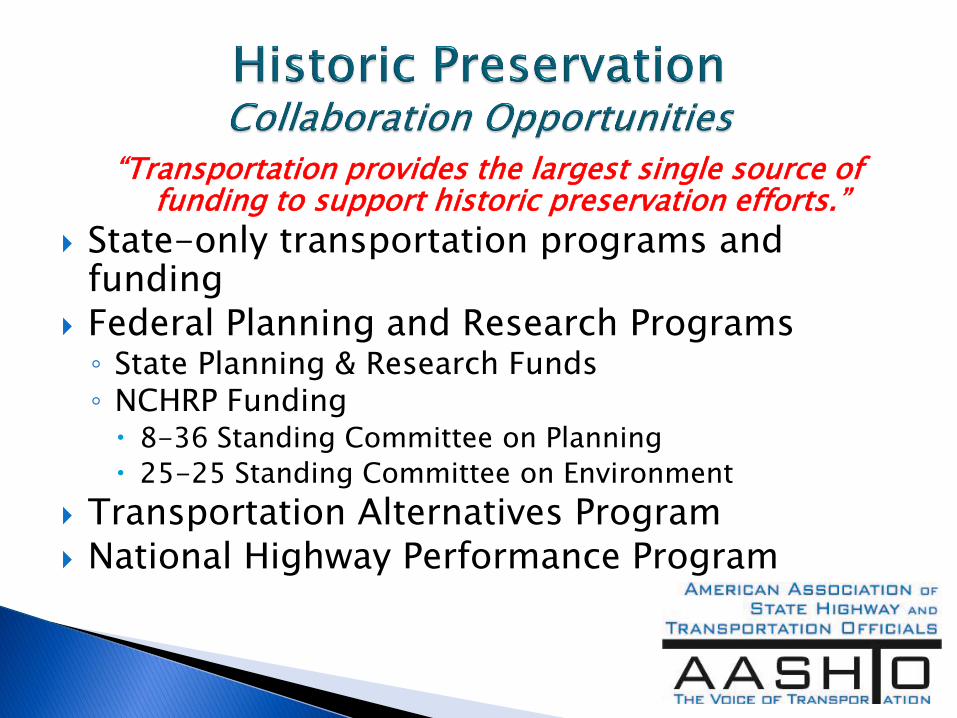
“Transportation provides the largest single source of funding to support historic preservation efforts.”
State-only transportation programs and funding
Federal Planning and Research Programs ◦ State Planning & Research Funds ◦ NCHRP Funding 8-36 Standing Committee on Planning
25-25 Standing Committee on Environment
Transportation Alternatives Program National Highway Performance Program
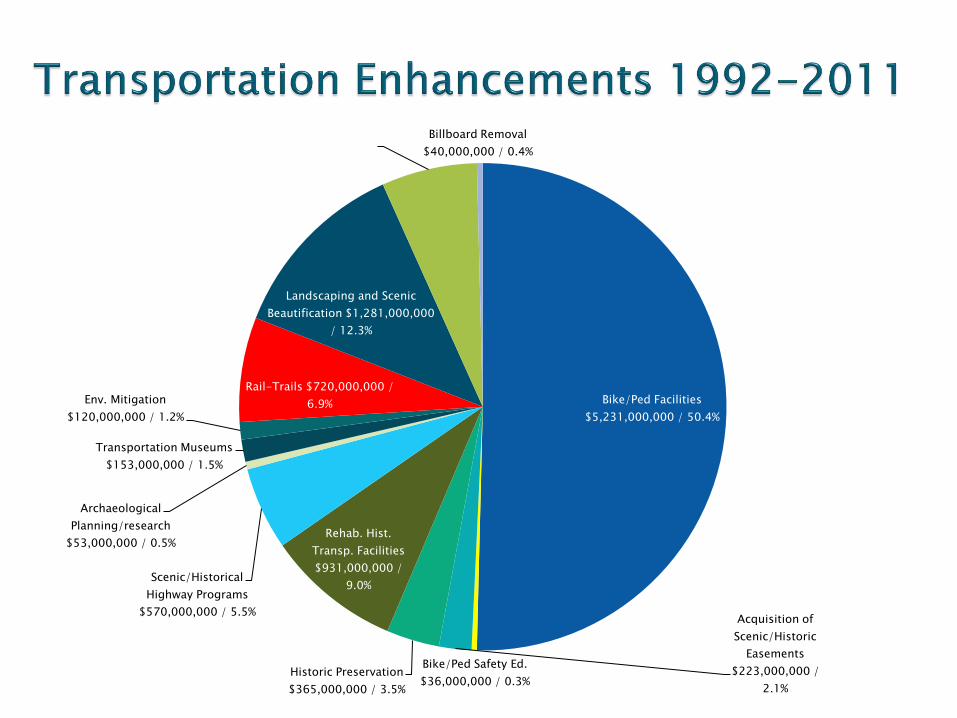
Bike/Ped Facilities
$5,231,000,000 / 50.4%
Bike/Ped Safety Ed.
$36,000,000 / 0.3%
Acquisition of
Scenic/Historic
Easements
$223,000,000 /
2.1%
Historic Preservation
$365,000,000 / 3.5%
Rehab. Hist.
Transp. Facilities
$931,000,000 /
9.0% Scenic/Historical
Highway Programs
$570,000,000 / 5.5%
Archaeological
Planning/research
$53,000,000 / 0.5%
Transportation Museums
$153,000,000 / 1.5%
Env. Mitigation
$120,000,000 / 1.2%
Rail-Trails $720,000,000 /
6.9%
Landscaping and Scenic
Beautification $1,281,000,000
/ 12.3%
Pedestrian Streetscapes
$658,000,000 / 6.3% Billboard Removal
$40,000,000 / 0.4%
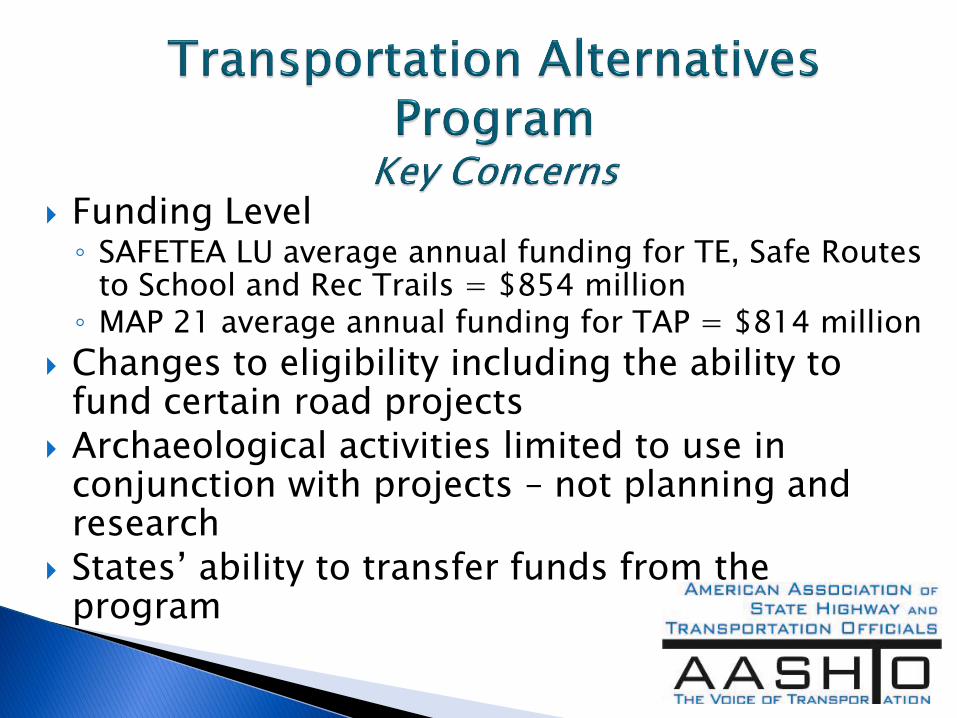
Funding Level ◦ SAFETEA LU average annual funding for TE, Safe Routes
to School and Rec Trails = $854 million ◦ MAP 21 average annual funding for TAP = $814 million
Changes to eligibility including the ability to fund certain road projects
Archaeological activities limited to use in conjunction with projects – not planning and research
States’ ability to transfer funds from the program
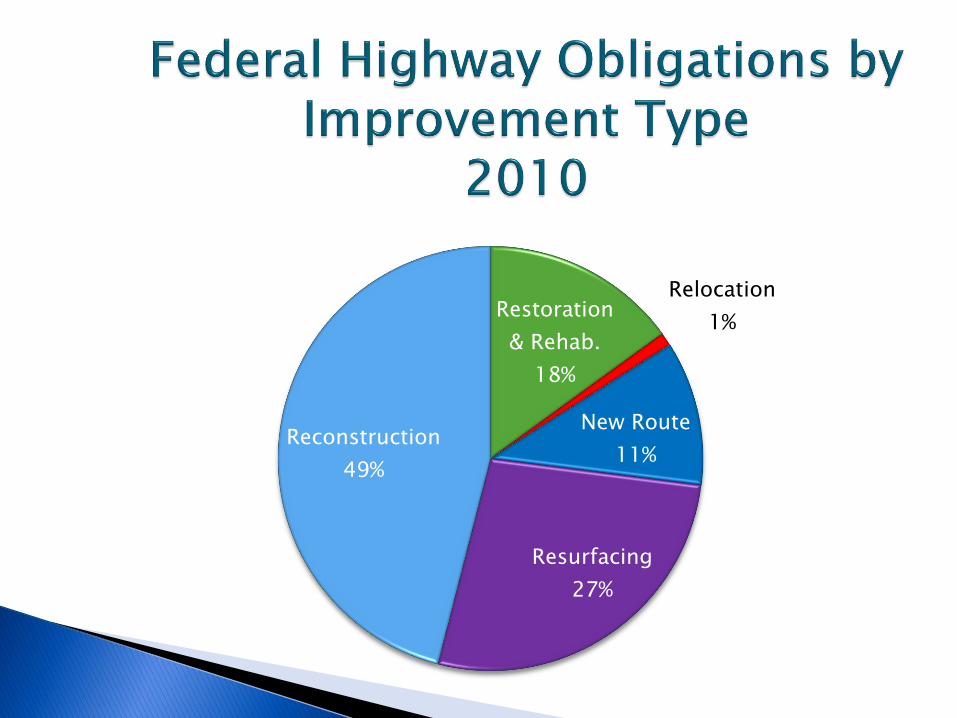
Restoration
& Rehab.
18%
Relocation
1%
New Route
11%
Resurfacing
27%
Reconstruction
49%
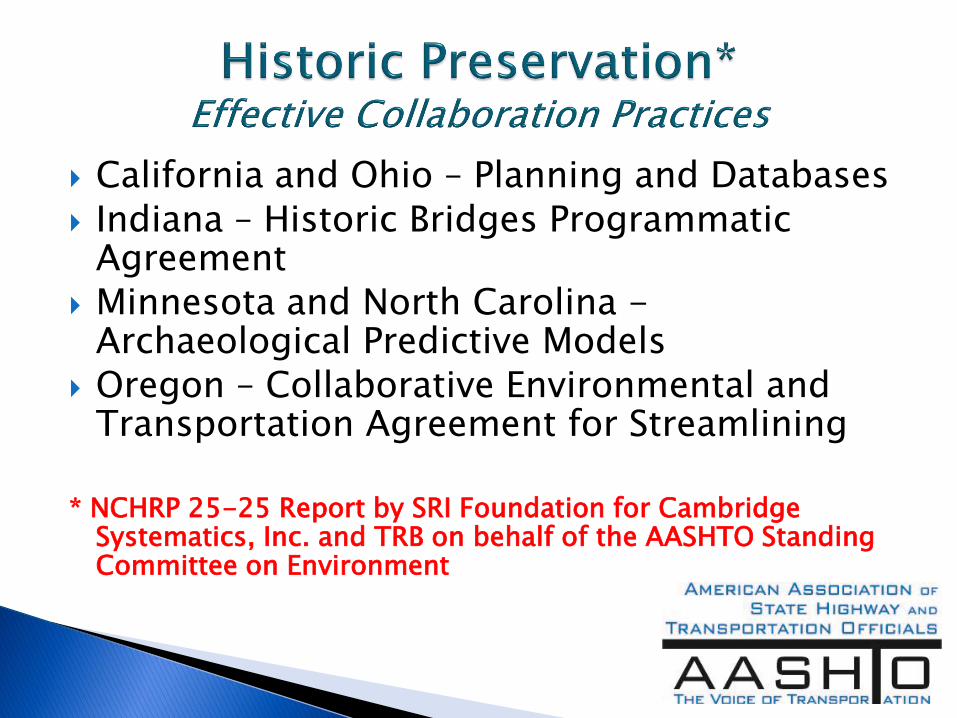
California and Ohio – Planning and Databases Indiana – Historic Bridges Programmatic
Agreement Minnesota and North Carolina -
Archaeological Predictive Models Oregon – Collaborative Environmental and
Transportation Agreement for Streamlining * NCHRP 25-25 Report by SRI Foundation for Cambridge
Systematics, Inc. and TRB on behalf of the AASHTO Standing Committee on Environment
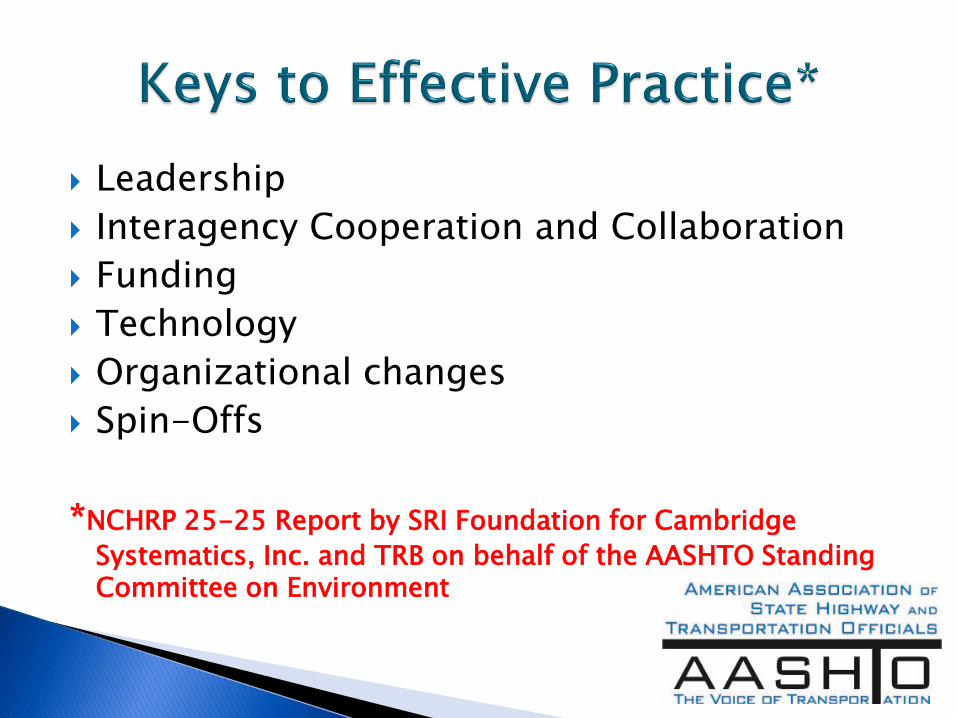
Leadership
Interagency Cooperation and Collaboration
Funding
Technology
Organizational changes
Spin-Offs
*NCHRP 25-25 Report by SRI Foundation for Cambridge
Systematics, Inc. and TRB on behalf of the AASHTO Standing Committee on Environment
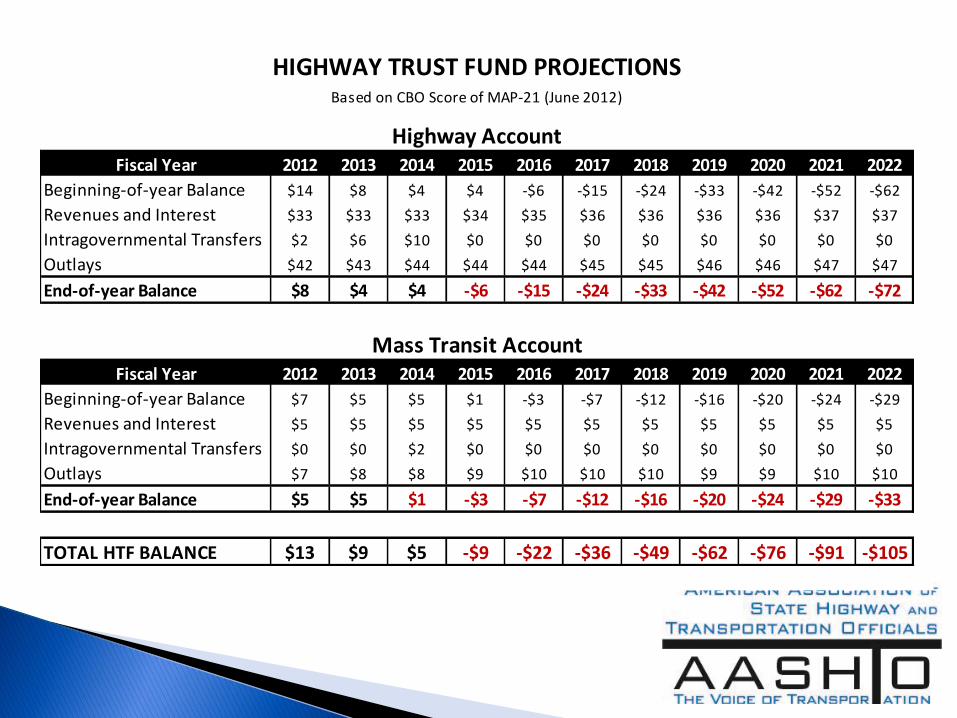
Fiscal Year 2012 2013 2014 2015 2016 2017 2018 2019 2020 2021 2022
Beginning-of-year Balance $14 $8 $4 $4 -$6 -$15 -$24 -$33 -$42 -$52 -$62
Revenues and Interest $33 $33 $33 $34 $35 $36 $36 $36 $36 $37 $37
Intragovernmental Transfers $2 $6 $10 $0 $0 $0 $0 $0 $0 $0 $0
Outlays $42 $43 $44 $44 $44 $45 $45 $46 $46 $47 $47
End-of-year Balance $8 $4 $4 -$6 -$15 -$24 -$33 -$42 -$52 -$62 -$72
Fiscal Year 2012 2013 2014 2015 2016 2017 2018 2019 2020 2021 2022
Beginning-of-year Balance $7 $5 $5 $1 -$3 -$7 -$12 -$16 -$20 -$24 -$29
Revenues and Interest $5 $5 $5 $5 $5 $5 $5 $5 $5 $5 $5
Intragovernmental Transfers $0 $0 $2 $0 $0 $0 $0 $0 $0 $0 $0
Outlays $7 $8 $8 $9 $10 $10 $10 $9 $9 $10 $10
End-of-year Balance $5 $5 $1 -$3 -$7 -$12 -$16 -$20 -$24 -$29 -$33
TOTAL HTF BALANCE $13 $9 $5 -$9 -$22 -$36 -$49 -$62 -$76 -$91 -$105
Mass Transit Account
Highway Account
Based on CBO Score of MAP-21 (June 2012)
HIGHWAY TRUST FUND PROJECTIONS
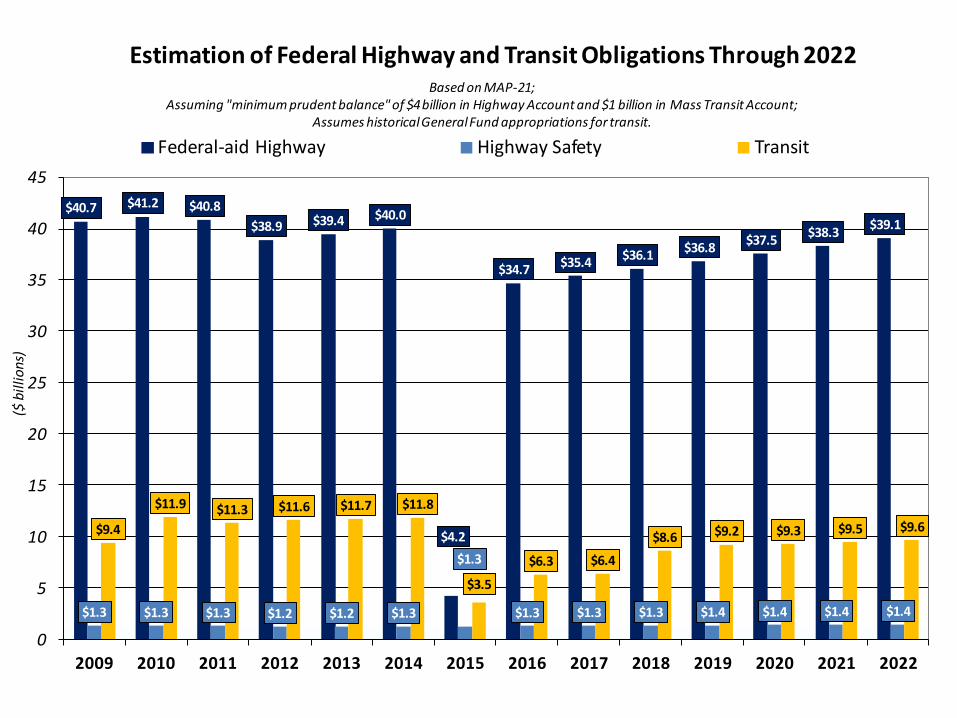
$40.7 $41.2 $40.8
$38.9 $39.4 $40.0
$4.2
$34.7 $35.4 $36.1
$36.8 $37.5
$38.3 $39.1
$1.3 $1.3 $1.3 $1.2 $1.2 $1.3
$1.3
$1.3 $1.3 $1.3 $1.4 $1.4 $1.4 $1.4
$9.4
$11.9 $11.3 $11.6 $11.7 $11.8
$3.5
$6.3 $6.4
$8.6 $9.2 $9.3 $9.5 $9.6
0
5
10
15
20
25
30
35
40
45
2009 2010 2011 2012 2013 2014 2015 2016 2017 2018 2019 2020 2021 2022
($ b
illi
on
s)
Estimation of Federal Highway and Transit Obligations Through 2022
Federal-aid Highway Highway Safety Transit
Based on MAP-21;Assuming "minimum prudent balance" of $4 billion in Highway Account and $1 billion in Mass Transit Account;
Assumes historical General Fund appropriations for transit.
The gas tax has served us well!
The gas tax is declining due to VMT flattening and economic issues as well as fuel efficiency
In the short run we will need to rely on gas tax
Subsets such as indexing have value but are limited
Many options but most have shortcomings
Two-year bill with a reform platform – national focus, program consolidation, performance and accountability, streamlined project delivery
Remain at a stand-off on future federal funding, roles and responsibilities
States and their local partners are moving forward to meet passenger and freight mobility needs but as a nation we are still falling behind
Continued opportunities for collaboration