21
Presentation to Chicago Region 18 November 2014 1 Moving Beyond the Spreadsheet Use of PI AF to Standardize Calculations and Analysis Stephen Reynolds SunCoke Energy
| Date post: | 25-May-2018 |
| Category: |
Documents |
| Upload: | truonglien |
| View: | 217 times |
| Download: | 3 times |

Presentation to Chicago Region 18 November 2014 1
Moving Beyond the Spreadsheet
Use of PI AF to Standardize Calculations and Analysis
Stephen ReynoldsSunCoke Energy

Abstract• SunCoke Energy operates six sites in the US and Brazil for the conversion of
metallurgical coal into metallurgical coke used in the manufacture of steel.
• The core technology used across the coke, steam, and power sections has remained consistent across the sites leading to common analytical concepts.
• However, people change, systems change, needs change. Analytical tools evolve. Variations begin.
• By using PI AF and Asset-Based Analytics, we begin to bring the calculations back to standard, automate repetitive system tasks, and allow our people more time for performance improvement rather than spreadsheet improvement.
• The PI System now feeds our Business Intelligence.
Presentation to Chicago Region 18 November 2014 2

Topics
• SunCoke and the SunCoke Way
• Oven Inspections
• Maximo Work Order Interface
• Template Calculations
• Preparing for Business Intelligence
Presentation to Chicago Region 18 November 2014 3

SunCoke Operations
Presentation to Chicago Region 18 November 2014 4
Our cokemaking operations are strategically located inproximity to our customers’ integrated steelmaking facilities
Middletown*
Haverhill 1* Haverhill 2*
Granite City
*65% owned by SXCP
Coal MiningJewell Coke
Indiana Harbor
Vitoria, Brazil
Odisha, India
114M tonsof reserves
SunCoke History
• 1960’s – Jewell prototype oven design
• 1998 – First commercial expansion, Indiana Harbor, IN
• 2005 – Expansion with first internally owned process for steam generation, Haverhill, OH (HHO 1)
• 2007 – First international expansion with power generation, Vitoria ES, Brasil
• 2008 – Expansion with first domestic power generation, Haverhill, OH (HHO 2)
• 2009 – Expansion to Granite City, IL
• 2009 – SunCoke Way initiated to standardize operating processes and metrics
• 2011 – First start-up under the SunCoke Way, Middletown, OH
• 2012 – PI Enterprise Agreement established
• 2013 – Visa SunCoke partnership, Odisha, India (not included in PI System)
Presentation to Chicago Region 18 November 2014 5

Coking and Heat Recovery
Presentation to Chicago Region 18 November 2014 6
• Metallurgical coal mined and supplied to ovens
• Coal charged / coke pushed from ovens on 48 hr cycles
• Coke process operates at >2000 deg F (MACT)
• Flue gas processed in Heat Recovery Steam Generators (HRSG)
• High pressure steam supplied to customers or used to drive turbine generators
• Coke provides heat and structural support as well as reducing agent in blast furnace

The SunCoke WayThe way we work, everyone, everyday, to continuously improve results.
Critical Processes
Identify key performance indicators to measure performance
Identify roles and personnel accountable and responsible for results
Define event and exception criteria to trigger analysis
Define and implement the improvement action plan
Determine sequential review structure to drive communication and accountability
Used to implement and manage the SunCoke Way.
Safety and Environmental
Operational Control
Critical Systems
System Tools
Critical systems drive the work within each process. Each system defines the metrics, roles and responsibilities, reviews, events, and action plans to achieve success in the critical process.
Metrics
Roles and Responsibilities
Events
Action Plans
Sequential Review
Asset
Management
Maintenance / Reliability
Quality
Management
Organizational Capabilities
Develop skills and attributes required to execute critical systems and drive continuous improvement
Presentation to Chicago Region 18 November 2014 7

Oven Inspections
Problem Statement:
• Over 130 inspection points per oven
• Over 1000 ovens fleet wide
• Single corporate inspection team
• Inspections captured and communicated through extensive paperwork
• Inspections tied to performance data through oral history and complex spreadsheets
• How to quickly identify, prioritize, communicate required repairs?
Solution:
• Data captured using PI Manual Logger
• Context added through PI AF
• Visualization added through existing PI Visualization tools
Presentation to Chicago Region 18 November 2014 8

Using PI AF
Presentation to Chicago Region 18 November 2014 9
• Moving Inspections to Oven Templates in PI AF
• Combining inspection data with performance data for health index calculation and analysis
• Utilizing roll-up functionality of PI AF to prioritize sites, batteries, specific ovens.

Maximo Interface
Problem Statement:
• Work orders are people driven.
• Preventative maintenance (PM) is calendar based.
Solution:
• PI can identify failures through instrument readings
• Equipment in-service time can be tracked
• PI Notifications can route to Maximo
Presentation to Chicago Region 18 November 2014 10

Meter Based PM – Coal Crusher
Presentation to Chicago Region 18 November 2014 11
• PI Notifications sends PI data into Maximo via web service
• Triggers PM work orders based on machine run hours
• Reduces administrative steps in workflow
• Optimizes PM scheduled work
PMService Life (h)
Grease Feeders 400
Precision Grease Crusher Bearings 720
Inspect Breaker Plates 2200
Inspect Coupling 2200
Change Motor Bearing Oil 2200
Clean/Overhaul Motor 17000
Instrument Based WO - Thermocouples
Presentation to Chicago Region 18 November 2014 12
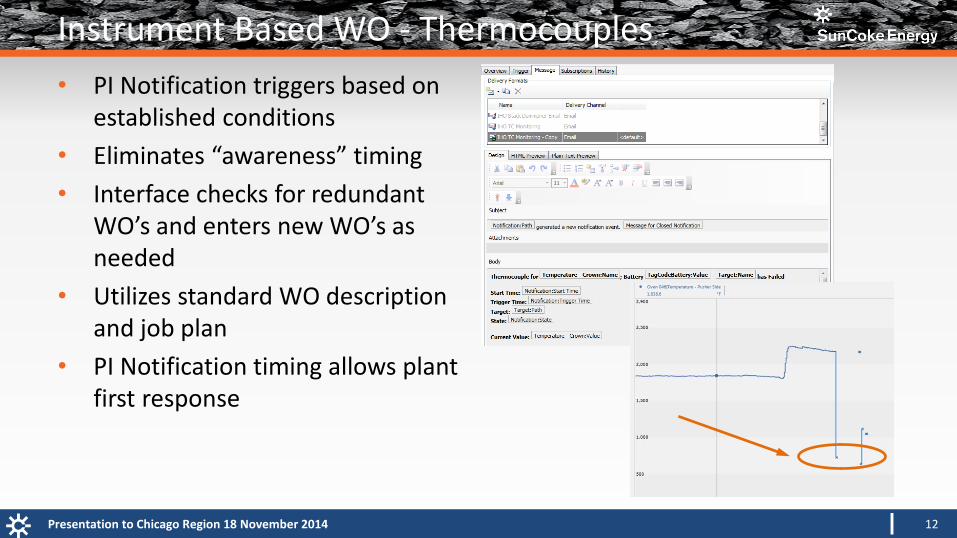
• PI Notification triggers based on established conditions
• Eliminates “awareness” timing
• Interface checks for redundant WO’s and enters new WO’s as needed
• Utilizes standard WO description and job plan
• PI Notification timing allows plant first response

Template Calculations
Problem Statement:
• Over 80% of our ovens have consistent instrumentation
• Over 90% of our steam and power equipment have consistent instrumentation
• Every plant has a different analysis
Solution:
• Utilize PI AF templates to push single analytical solutions
Presentation to Chicago Region 18 November 2014 13

Current Solutions
Presentation to Chicago Region 18 November 2014 14
Not To Exceed Limits
Analyze specific indicators for operating limit violations, count occurrences, roll up across hierarchy
Analyze specific ovens for production rate using multiple data points, roll up across hierarchy
Oven Health Score
Combine oven performance with oven inspection, calculate for oven, roll up across hierarchy
HRSG EfficiencyComplete multiple mass / energy calculations to determine HRSG efficiencies and output, roll up across hierarchy
HRSG Leak Detection
Utilize water balance to calculate leak risk and trigger early notification
And Counting… SunCoke is just beginning to scratch the surface
Coking Rate

Standard Analyses
Presentation to Chicago Region 18 November 2014 15
• Boundary limits checked against targets
• Temperature crosses and other process checks are analyzed
• Watch tag given a “0” or “1” to facilitate count and roll up
• Engineering calculations added to PI AF hierarchy for visualization

Preparing for BI
Problem Statement:
• Preparing Business Intelligence platform to consolidate plant metrics calculations
• Not all data is metered, routinely measured, or routinely recorded
• Manually entered data must satisfy design standards for data architecture
• Granularity of data is used for broad time analyses (weekly, monthly, yearly…)
Solution:
• Utilize PI Manual Logger and Excel interface to input data
• Structure data through PI AF
• Prepare data for data model
Presentation to Chicago Region 18 November 2014 16

Production Metrics
Presentation to Chicago Region 18 November 2014 17
• Less than 10 actual values combine to generate roughly 25 distinct metrics (and counting)
• Scale measures can be metered (PI Data Archive) or tracked by weight tickets (shoebox historian)

Solution Design
Presentation to Chicago Region 18 November 2014 18
• Build separate BI Hierarchy in protected PI AF database
• Structure data and context to simplify E-T-L process– Use categorization to improve query
processing– Prepare data using analytics – hourly
averages, minimums, maximums, production deltas, etc.
– Use templates for scalability and standardization
• Manual entry requires three attributes sharing common timestamp– Actual value– Entry timestamp– User ID

Quick Benefits
Presentation to Chicago Region 18 November 2014 19
HRSG Notifications:
• Captured 70% tube leaks with early warning
• Saved 6-8 hours each on permitted venting and steam sales
Oven Inspections:
• Saving hours on paperwork
• Continuing to develop optimization
T/C Notifications:
• No missed WO’s
• Theft deterrent
Cycle Time Improvement:
• Consistent temperature measurement
• Cycle time optimization
• An improvement in cycle time by 2 hours results in average of 7 more pushes per oven annually
• Roughly $70K more revenue per oven

Conclusion
Presentation to Chicago Region 18 November 2014 20
• Recruit a willing internal business partner
• Find the common elements
• Structure the context
• Build the analytics
• Get help
• Deploy
• Wes Alderman
• Bruno Bachiega
• Trevor Bell
• Jamilly Brito
• James Butler
• Tamalyn Ennis
• Glenn Hummel
• Bob Johnson
• Matthew Keen
• Anand Kshatriya
• Scott Larson
• Nicholas Thorson
• Andre Zardini
• OSIsoft
• Process Innovations
• Rovisys
In Conclusion: Acknowledgements:

End of Presentation – Questions?
Presentation to Chicago Region 18 November 2014 21


