Moyie Lake Burbot: Population Assessment 2007 Matthew D. Neufeld BC Ministry of Environment 401 – 333 Victoria Street Nelson, BC V1L 4K3 April 2008 This project was funded by the Bonneville Power Administration through the Northwest Power and Conservation Council’s Fish and Wildlife Program, in co- operation with the Idaho Department of Fish and Game, and the Kootenai Tribe of Idaho.
Transcript
Moyie Lake Burbot:
Population Assessment 2007
Matthew D. Neufeld
BC Ministry of Environment 401 – 333 Victoria Street
Nelson, BC V1L 4K3
April 2008
This project was funded by the Bonneville Power Administration through the Northwest Power and Conservation Council’s Fish and Wildlife Program, in co-operation with the Idaho Department of Fish and Game, and the Kootenai Tribe of Idaho.
Table of Contents
Table of Contents............................................................................................................................................................. i
List of Tables................................................................................................................................................................... ii
List of Figures ................................................................................................................................................................. ii
List of Appendices ......................................................................................................................................................... iii
2.1.1 Trapping Equipment and Burbot Handling ................................................................................................... 5 2.1.2 North Moyie................................................................................................................................................. 5 2.1.3 South Moyie.................................................................................................................................................. 6
2.2 Population Estimate.............................................................................................................................................. 6 2.2.1 Single Census - Peterson Type Estimate....................................................................................................... 6 2.2.2 Multiple Census - Jolly-Seber Estimate ....................................................................................................... 7
3.1.1 North Moyie................................................................................................................................................. 8 3.1.2 South Moyie................................................................................................................................................. 8
3.2 Population Index................................................................................................................................................ 12 3.2.1 Single Census - Peterson Type Estimate..................................................................................................... 12 3.2. 2 Multiple Census - Jolly-Seber Estimate ..................................................................................................... 12
Literature Cited ............................................................................................................................................................ 22
Table 1. Summary of Peterson burbot trapping data from the north basin Moyie Lake, spring 2007.......... 12 Table 2. Summary of trapping data used for Jolly-Seber population estimates on north Moyie (including
trapping data from previous Prince (2007) studies)....................................................................... 13 Table 3. Summary of trapping data used for Jolly-Seber population estimates on south Moyie (including
trapping data from Prince (2007) studies). ................................................................................... 13 Table 4. Jolly-Seber model output where equal survival and recruitment rates assumed among basins, but
allowed for differential catchability............................................................................................... 15 Table 5. Jolly-Seber model output where the catchability (on the logit scale) at each sampling event was a
linear function of the number of traps set. ..................................................................................... 16
List of Figures Figure 1. Location of the Kootenai River burbot recovery area and proposed broodstock sources in Duncan
Reservoir, Arrow Lakes Reservoir, Columbia and Moyie Lakes………………………………….4 Figure 2. Plot of number of burbot captured vs number of traps set (data from all years, sampling events and
basins)……………………………………………………………………………………………...7 Figure 3. North Moyie Lake trap set and burbot capture locations, April 2007……………………………..9 Figure 4. North Moyie trap set and burbot capture locations, May 2007…………………………………..10 Figure 5. South Moyie trap set and burbot capture locations, October 2007……………………………….11
Moyie Lake Burbot: Population Assessment 2007 ii
List of Appendices
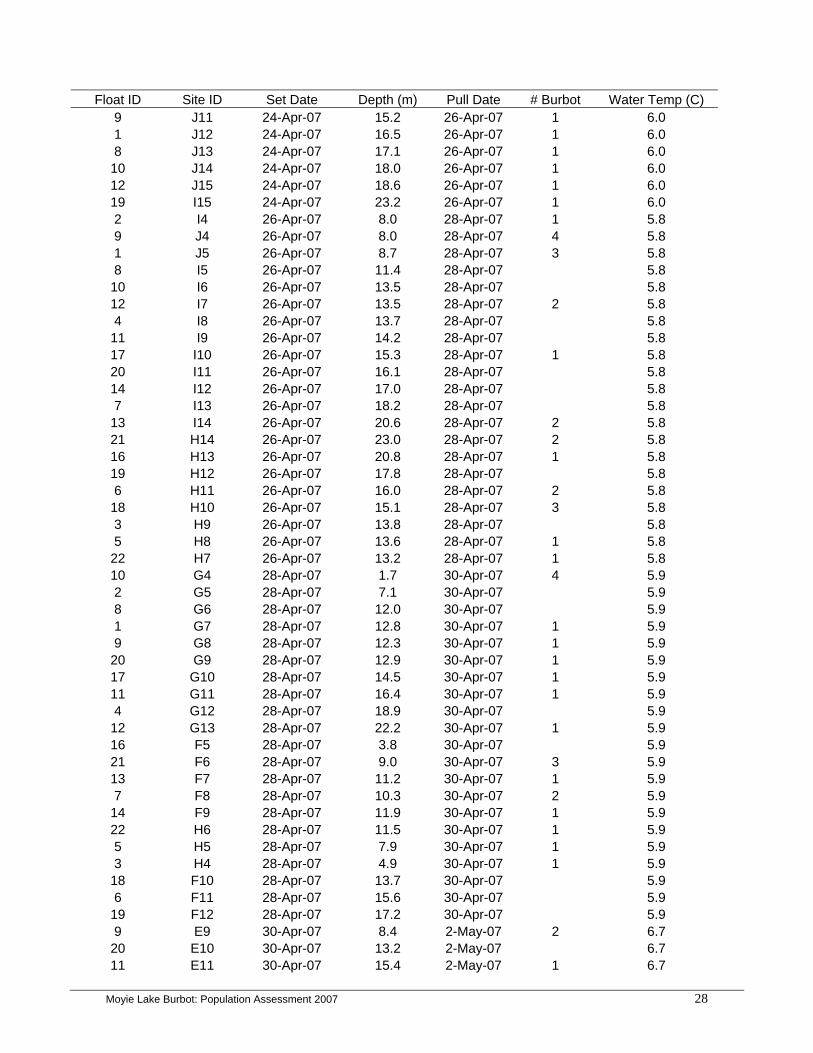
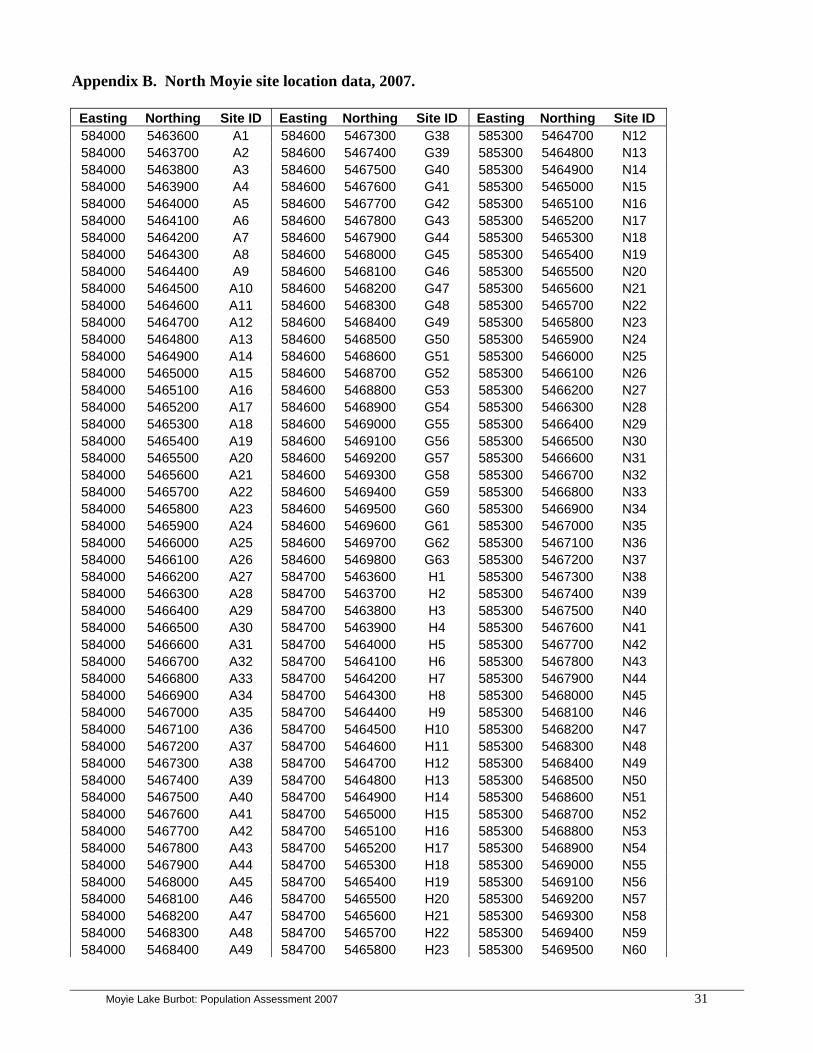
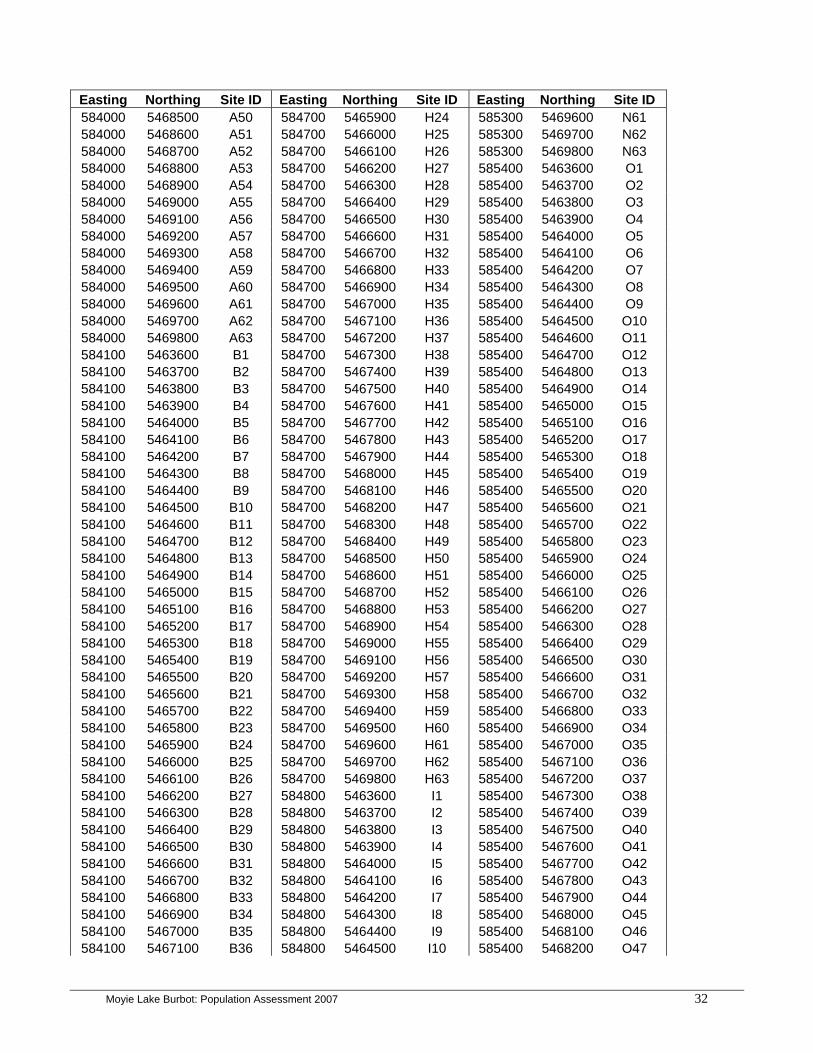
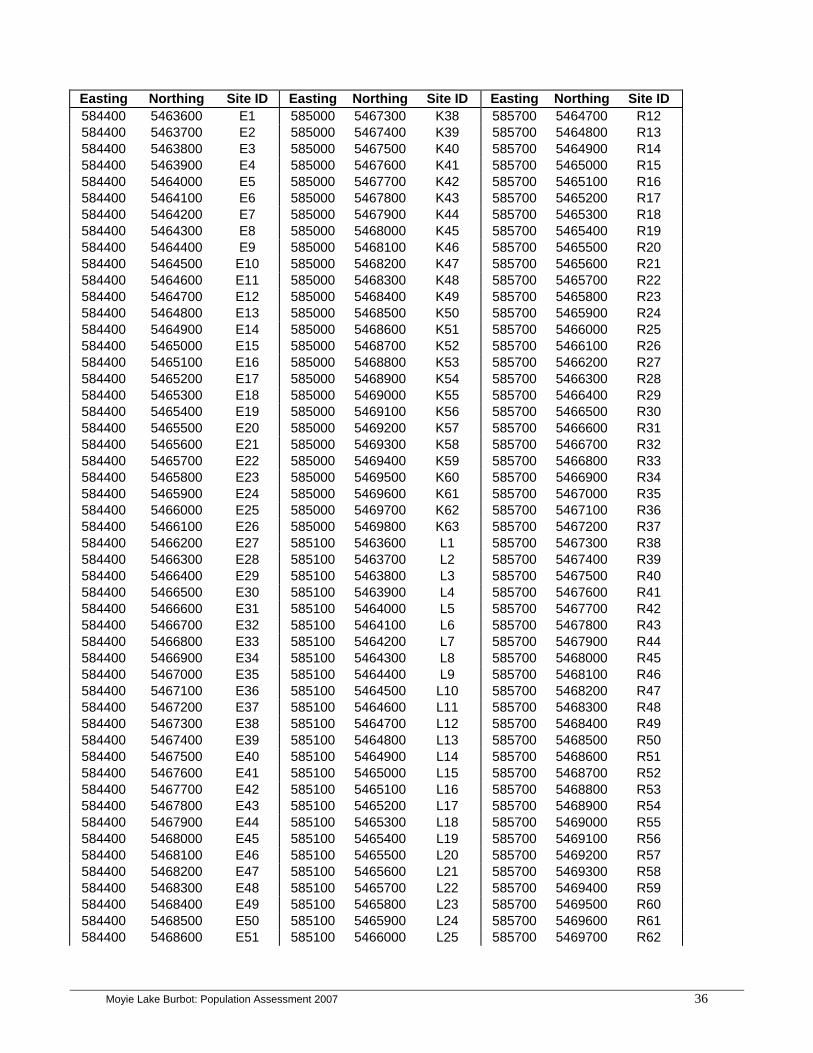
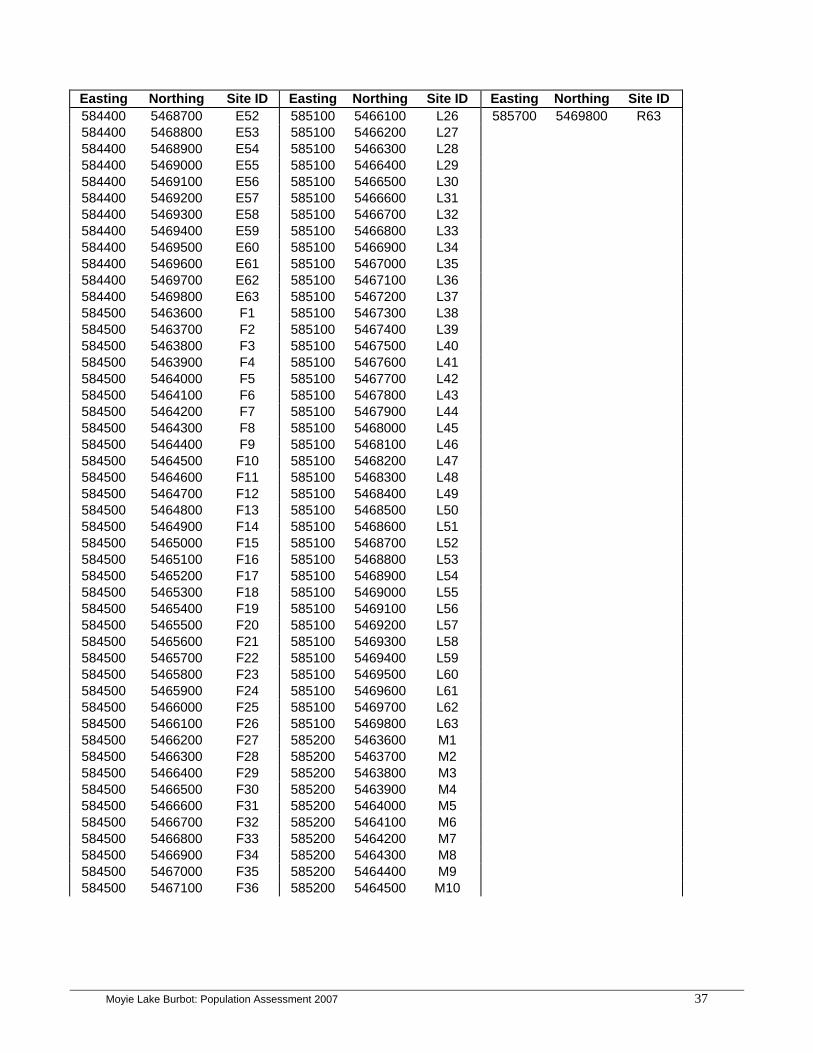
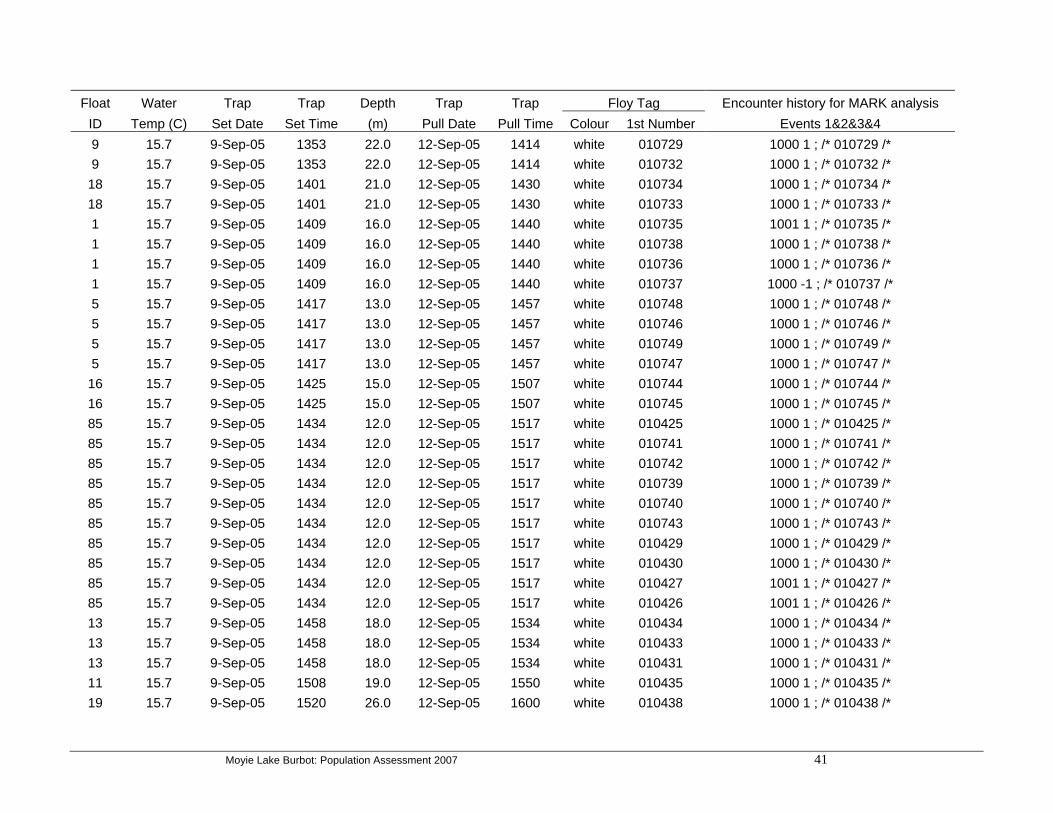
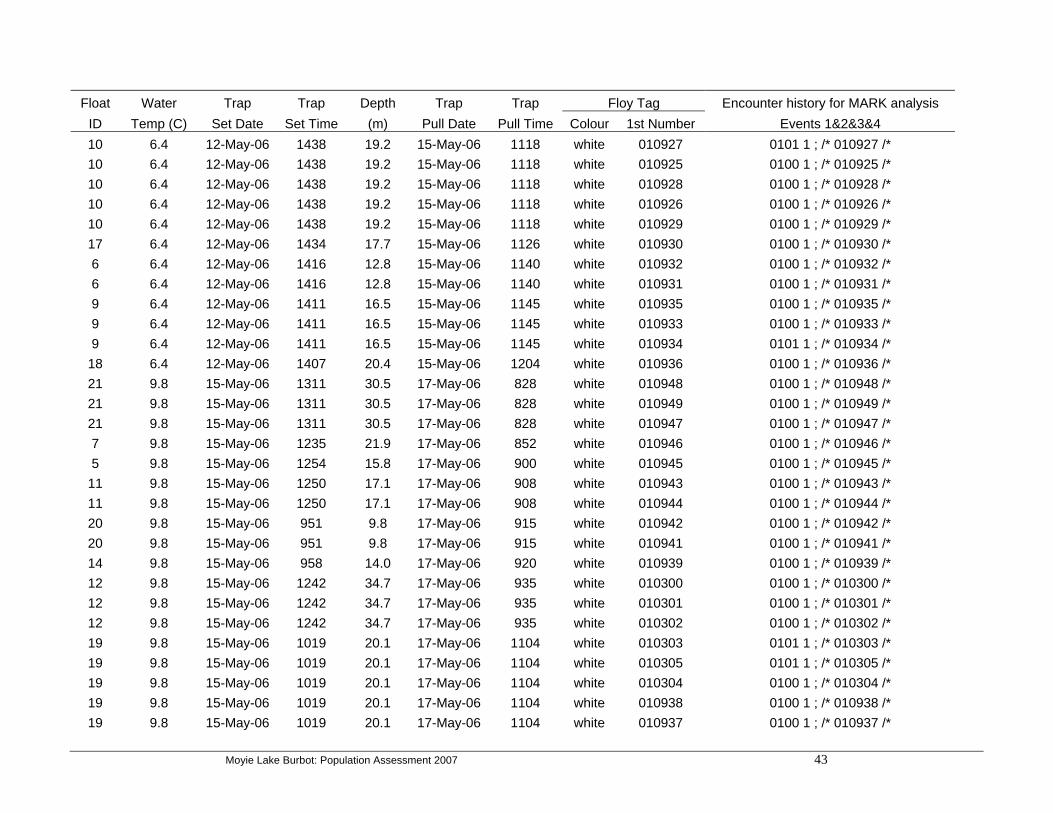
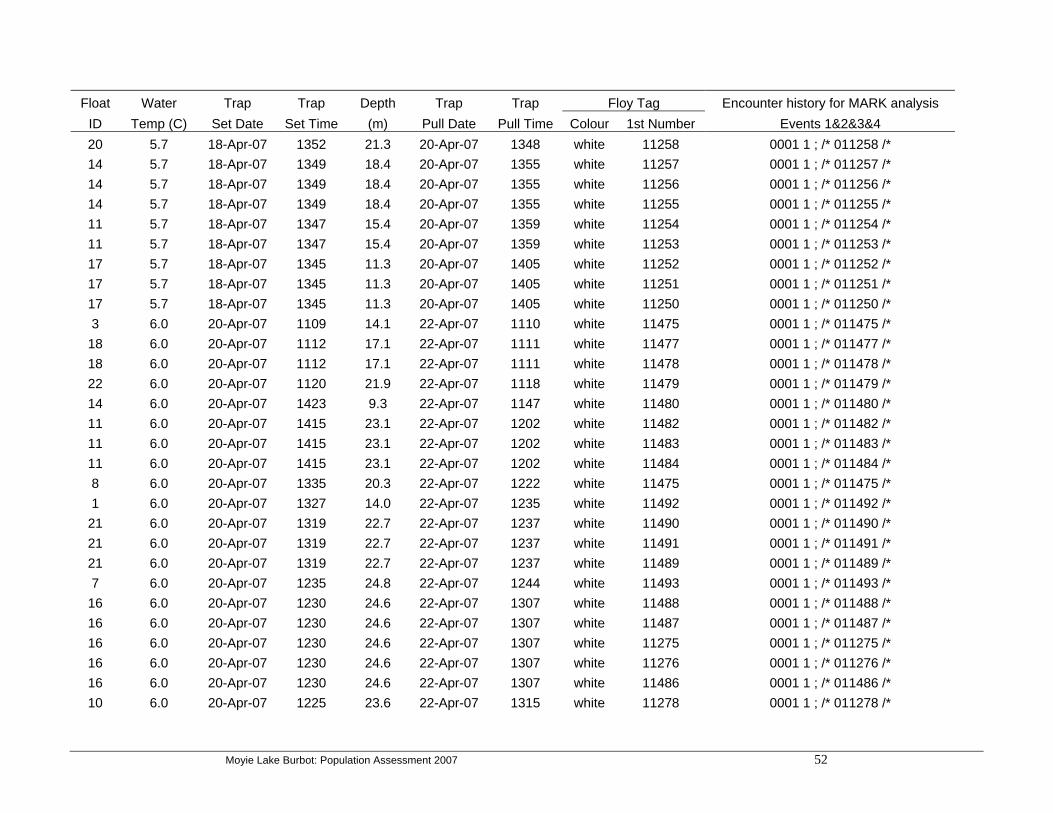
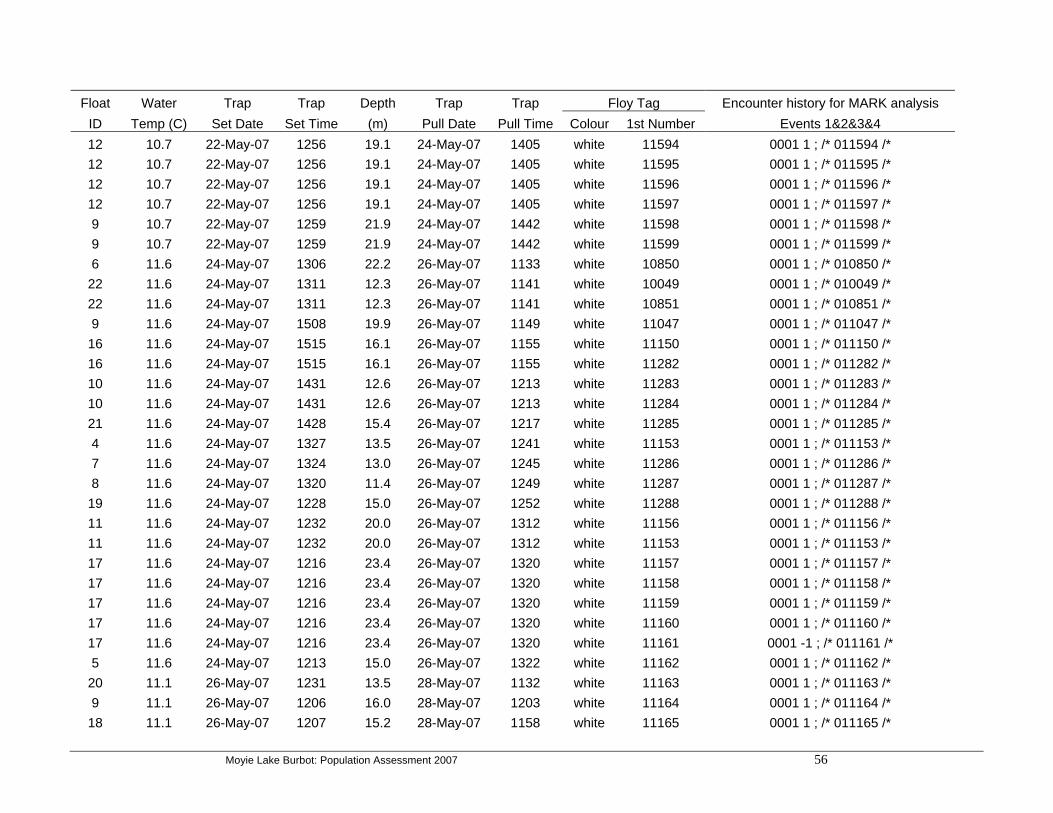
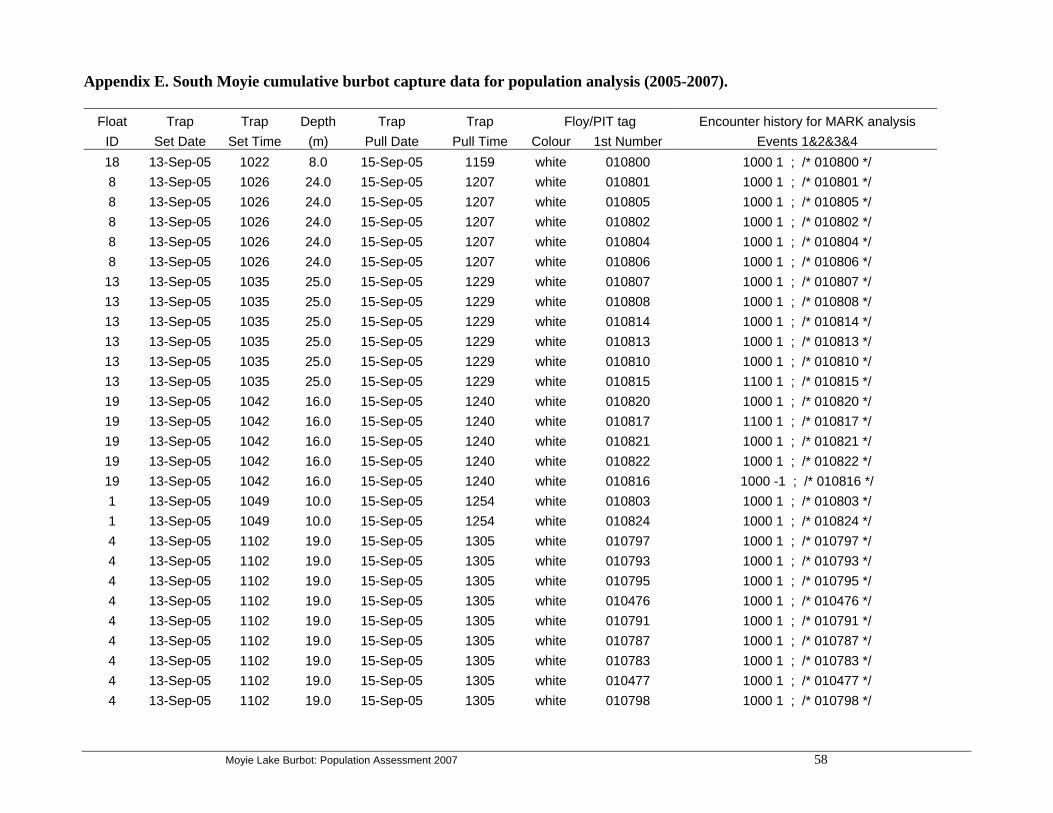
Appendix A. North Moyie trap set data, 2007 (see Appendix B for Site ID details). .................................. 26 Appendix B. North Moyie site location data, 2007. ..................................................................................... 31 Appendix C. North Moyie cumulative burbot capture data for population analysis (2005-2007) . .............. 40 Appendix D. South Moyie Trap Set Data 2007. ........................................................................................... 57 Appendix E. South Moyie cumulative burbot capture data for population analysis (2005-2007) ................ 58
Moyie Lake Burbot: Population Assessment 2007 iii
Abstract Burbot trapping on the north basin of Moyie Lake was undertaken on two separate sampling periods from April 16 to May 2, and May 22 to May 28, 2007. Sampling effort totalled 448 trap-days (one trap fished for 24 h) for a total catch of 255 burbot. Mean catch per unit effort (CPUE) of burbot for both sampling periods combined was 1.14 burbot per trap set (48 h period). On the south basin of Moyie Lake, an additional sampling session was completed between October 23 and 24, 2007. Sampling effort totalled 27 trap-days, for a total catch of 22 burbot and a mean CPUE of 1.63 burbot per trap set (48 h). In total, 19 of these 22 captured burbot were transported to the University of Idaho for conservation aquaculture research. Trapping data from these sessions on north and south Moyie were combined with data from previous studies to develop population estimates. The north and south basins of Moyie were treated as separate populations for estimation as little movement occurs between the two basins. The population size on Moyie Lake was estimated using both single and multiple census methods. Population estimates using different methods showed some variability, however poor precision because of the small number of marked fish that were recaptured resulted in overlap of the confidence bounds of almost all estimates. Analysis for both study areas suggested that there was insufficient mixing of tags between the samples for Peterson estimates, which would tend to bias our results lower than the actual population size. As well, trapping data suggested that trap avoidance may be an issue, which would tend to bias both our estimates higher than the actual population size. Given these issues, it was likely that the true population sizes were somewhere between the results of these two types of estimates. Given the constraints noted above, we evaluated all the data and established a population estimate that reflected the most likely compromise. In the north basin, although there was variability in estimates using these two methods as well as poor precision, there was reasonable evidence to suggest the population in the north basin was between 1500 and 2500 adult burbot. Estimates of population size for the south basin were more consistent between estimate methods, although they also showed poor precision. There was reasonable evidence to suggest the population in the south basin was between 1000 and 1200 adult burbot. The annual survival rate on both basins was estimated to be ~70-80%. Previous studies modelling the historic burbot population in Kootenay Lake have suggested an exploitation rate of 20% annually was the maximum sustainable for that population. Based on the estimates of population size for Moyie Lake and these modelling results for a different burbot population, the maximum sustainable exploitation rate may be somewhere between 300-500 burbot/year on the north basin and 200-240 burbot/year on the south basin of Moyie Lake.
Moyie Lake Burbot: Population Assessment 2007 1
1.0 Introduction Burbot (Lota lota) has become a species of special concern in Kootenay Lake and in the Kootenay River in south eastern British Columbia. Both the lake and river supported large sport harvests of burbot throughout the 1960s and 1970s, until severe declines resulted in eventual closure of these fisheries (Ahrens and Korman 2002, Paragamian et al. 2000). In Canada, the Kootenay Lake population has been Red Listed (S1) by B.C.’s Conservation Data Center. Recent trapping and underwater video work suggests the historic population on Kootenay Lake at Balfour has been extirpated (Baxter et al. 2002a and 2002b, Neufeld and Spence 2004a and 2004b, Neufeld 2005). In the Kootenay/ai River in BC and Idaho, the population may now be less than 30 individuals (Pyper et al. 2004). A plan has now been developed to address burbot restoration in Idaho (Neufeld et al. 2006), and a multilateral agreement has been signed to ensure this issue is addressed (KVRI Burbot Committee 2005). Both U.S. and Canadian committee members are now working in the field and at the planning table to address the problem. Studies are currently underway to identify important habitats, determine the status of remnant stocks, develop fish culture techniques, and assess the impact of dam operations on burbot reproduction in the Kootenay system. Previous work in Canada has included night surveys to identify burbot spawning activity in Kootenay Lake (Spence 1999, Baxter et al. 2002a and 2002b, Neufeld and Spence 2004), and operation of a fence on the Goat River to identify spawning numbers on that tributary (Bisset and Cope 2002). Joint efforts in both Canada and the US have included trapping on Kootenay Lake and Kootenay/ai River to help assess population strength and distribution (Pyper et al. 2004, Neufeld and Spence 2004b, Neufeld 2005) as well as tagging fish for telemetry investigations (Neufeld and Spence 2004a, Paragamian 1994, Paragamian 2000, Paragamian et al. 2001, Paragamian et al. 2005, Paragamian and Wakkinen in press, Partridge 1983) These investigations have identified a population size considered by managers to be too small to recover on its own, and also insufficient to provide suitable numbers as broodstock for conservation aquaculture operations. Given the status of the Kootenay/ai population, burbot from Columbia Lake as well as Duncan and Arrow Lakes reservoirs have been provided to the Kootenai Tribe of Idaho (KTOI) and the University of Idaho (U of I) to assist the development of conservation aquaculture techniques for this species (Baxter et al. 2002a and 2002b, Neufeld and Spence 2004a and 2004b, Neufeld 2005). Genetic testing and behavioural studies are now under way to identify which of these stocks is best suited as a broodstock source (Powell et al. 2008). It is anticipated that fish culture using a brood source from one of these Canadian water bodies will be key to restoring burbot in the recovery area (Figure 1; KVRI Burbot Committee 2005, Neufeld et al. 2006). Burbot studies on Trout and Columbia lakes have indicated that the populations in these water bodies are most likely not large enough to support any take for broodstock purposes (Baxter et al. 2002a and 2002b, Neufeld and Spence 2004a and 2004b, Prince and Spence 2007). In fact, the Columbia Lake burbot fishery has been closed since 2007 due to conservation concerns. Although burbot numbers on Arrow Lakes Reservoir and Duncan Reservoir appear to be healthy (Arndt and Baxter 2006, Neufeld 2005), genetic samples from these populations show enough divergence from Kootenay burbot to suggest consideration of other stocks for conservation aquaculture purposes (Powell et al. 2008). Genetic analysis points to Moyie Lake as a suitable brood source for re-introduction into the Kootenay/ai River (Powell et al. 2008). Not only do these fish show
Moyie Lake Burbot: Population Assessment 2007 2
genetic similarities to Kootenay River burbot, but they are more likely to be acceptable from a fish health perspective given they occur within the Kootenay River drainage. Prior to 2005, very little was known about burbot stock strength in Moyie Lake. Therefore, detailed studies to estimate population strength and quantify fishery impacts were undertaken starting in 2005. Reports detailing both the fishery impacts (Westover 2007) and an estimate of population size (Prince 2007) were completed by the spring of 2007. Although the total Moyie Lake harvest in 2006-07 and the south basin population size were quantified reasonably well during these initial surveys, the number of recapture samples for the north basin was too small to develop a reliable population estimate. Additional work was therefore completed in 2007 to increase the number of recapture events and provide a more reliable estimate of population size. This study followed many of the recommendations of previous sampling efforts (Prince 2007) and was designed to identify some basic burbot life history traits and refine the estimate of population size on Moyie Lake. This estimate will help provide the data necessary to set limits around the export of broodstock for Kootenai burbot recovery efforts, as well as to effectively manage the winter sport fishery. Specifically, our objectives were to:
refine previous estimates of Moyie Lake burbot population status; use population estimates and mortality factors to begin developing a guideline for the
number of burbot available for harvest and removal for fish culture experiments without substantially impacting successful recruitment and long term maintenance of fisheries on this system;
provide burbot from Moyie Lake for conservation aquaculture experiments in Idaho.
Moyie Lake Burbot: Population Assessment 2007 3
Figure 1. Location of the Kootenai River burbot recovery area and proposed broodstock sources in
Duncan Reservoir, Arrow Lakes Reservoir, Columbia and Moyie Lakes.
Moyie Lake Burbot: Population Assessment 2007 4
2.0 Methods 2.1 Burbot Trapping
2.1.1 Trapping Equipment and Burbot Handling Sampling was conducted from a 7.0 m boat. Maximum and minimum depths as well as set locations were recorded for all net sets using a GPS capable depth sounder (Garmin GPSMAP 182C). Trap set and pull times were recorded for each set. Burbot were captured for marking using cod traps. All traps were baited with kokanee (Oncorhynchus nerka) spawner carcasses placed in mesh bait bags (further described in Spence 2000). Traps were pulled from depth with an electric winch assembly (EZ Pull electric pot puller model-AMS6013PCSTD), quickly tagged with a Floy or PIT tag and then either released overboard or retained in holding tanks onboard for hatchery broodstock. Depending on the number of burbot present in traps, the tagging process was often less than 30 seconds and never took more than 1 minute to complete.
2.1.2 North Moyie Burbot trapping was undertaken on two separate sampling periods from April 16 to May 2, and May 22 to May 28, 2007. This work built on four earlier sampling sessions between 2005 and 2007 (detailed in Prince 2007; Appendix C). Analysis of previous trapping efforts on the north basin of Moyie Lake (Prince 2007) suggested that trap spacing of 87 meters was enough to avoid trap competition. For this study, we selected spacing of traps at 100 meters, and confined set depth to 25 meters or less due to concerns over mortality and significant damage resulting from decompression trauma when burbot are removed from deep water locations (Neufeld and Spence 2004c). Previous burbot studies have suggested relatively even distribution of burbot by depth in the spring after ice off and in the fall after turnover (Bernard et al. 1993, Prince 2007). Locating traps on a grid by referencing locations from landmarks and a map in past studies has been a difficult or impossible task, and when traps are placed closer than 100 meters, trap competition may become an issue. To increase the accuracy of trap placements we first laid out a 100x100 m point grid on a GIS coverage of Moyie Lake using ArcMap software. Then, using an HP IPac (model HX2790) showing the map and grid, and a wireless bluetooth GPS antenna (model GPS 10 Deluxe) to indicate our location in real time on the grid, we navigated the boat to our selected sample set locations. In the first sampling session (April), we set traps at each of the sample points that fell within the boundary of the lake, and were not deeper than 25 m, to provide a marked sample. In the second sampling session (May), we randomly selected a subset of these locations to provide a recapture sample. These two sessions were combined and added to previous study data for multiple mark-recapture analysis. The target length of trap sets was 48 hours following recommendations of Bernard et al. (1991), with some small variation in set duration depending on the daytime set and pull times. Observations from previous studies suggest that few burbot enter traps during daylight hours (Bernard et al 1991, Prince 2007) and, therefore, effort was not adjusted for the small deviation in daylight soak times around the target of 48 h and each set represented one unit of effort (one trap set). Catch per unit effort (CPUE) was then simply the total number of burbot captured divided by the total number of trap sets.
Moyie Lake Burbot: Population Assessment 2007 5
2.1.3 South Moyie Burbot trapping was undertaken on one sampling period between October 23 and 24, 2007 on the south basin of Moyie Lake. This work built on three additional sampling sessions between 2005 and 2007 (detailed in Prince 2007). Although the primary objective of sampling on south Moyie was to provide adult broodstock for hatchery trials, recapture samples were also used to supplement mark-recapture samples from previous studies. Because high quality, healthy burbot were required for brood stock, all sets on south Moyie were restricted to depths of less than 7 meters to reduce damage associated with deep water retrieval (Neufeld and Spence 2004c). To accommodate this objective, traps were not set in a random pattern. Although burbot are distributed through all depth intervals in Moyie Lake, previous studies suggest that the use of shallow traps for tagging projects does not significantly skew recapture results (Lafferty et al. 1992, Neufeld and Spence 2004a, Prince 2007) and given the time period between this and previous samples (1 year) adequate mixing of tags was a reasonable assumption. Given the primary objective of sampling was to provide broodstock, the target set length was adjusted to 24 h for this study; however, there was some deviation around this target. Again, observations that few burbot enter traps during daylight hours (Bernard et al 1991, Prince 2007) resulted in no adjustment for the small deviation in daylight soak times around the target. However, given that these sets were half the length of our standard sets, 0.5 of a standard trap set was used as the level of effort for each set in calculations. Thus, catch per unit effort (CPUE) was the total number of burbot captured divided by ½ the total number of trap sets. 2.2 Population Estimate
2.2.1 Single Census - Peterson Type Estimate For the single recapture estimate, burbot were trapped on north Moyie during April 2007 and May 2007 (method detailed in section 2.1.1). We used both a Chapman modification (Seber 1982) and Maximum Likelihood Estimator (MLE) method to estimate the total number of burbot in north Moyie Lake during the spring of 2007. Our recapture number of 8 burbot was near the minimum for MLE estimators and reasonable for Chapman’s modification, so we presented both estimates. The total number of burbot using the Chapman modification was calculated as:
1)1(
)1)(1(ˆ2
21 −+
++=
mnnN
where is the estimated total population size, nN̂ 1 is the number of fish that were initially captured, marked, and released in April 2007, n2 is the number of fish that were captured in May 2007, and m2 is the number of marked fish that were recaptured in May, 2007. Ninety-five percent confidence intervals for were calculated using methods outlined in Seber (1982) for Chapman population estimates with small sample size. This method assumes that
is Poisson distributed and produces confidence bounds that are non-symmetric around the estimated total.
N̂
N̂
Moyie Lake Burbot: Population Assessment 2007 6
The total number of burbot using MLE was calculated as:
2
21
11
11011110 ))((ˆm
nnn
nnnnN =
++=
where is the estimated total population size, nN̂ 1 is the number of fish that were initially captured, marked, and released in April 2007, n2 is the number of fish that were captured in May 2007, and m2 is the number of marked fish that were recaptured in May, 2007. Confidence intervals using MLE methods were calculated by maximizing the likelihood function over unknown parameters.
Assumptions around tag loss and mortality were evaluated in this present study. A post-tagging mortality rate of 5% is approximately equal to the actual rates observed in recent studies on Duncan Reservoir and Moyie Lake (Neufeld and Spence 2004c, Prince 2007), while a tag loss rate of 5% was similar to that reported by Lafferty et al. (1992). Although tag loss and mortality in combination could be as high as 10%, the impact to estimates was small given the wide confidence intervals.
2.2.2 Multiple Census - Jolly-Seber Estimate For the multiple recapture estimates, data were used from burbot trapping on north and south Moyie between September 2005 and October 2007 (methods detailed in section 2.1.2 and 2.1.3) including 4 sampling sessions on each basin. Trapped fish were marked with uniquely coded Floy tags and were subsequently released. Previous studies and the results from this study suggested little movement of fish between basins, and therefore they were treated as separate populations (Prince 2007). Jolly-Seber multiple census population estimates were calculated using the program MARK. Two models reflecting variation in assumptions were fit to the data. First, a Jolly-Seber model was fit to the combined North and South basin dataset. This model assumed equal survival and recruitment rates among basins, but allowed for differential catchability. Secondly, because of the apparent relationship between catch and effort (Figure 2) an alternate Jolly-Seber model was fit where the catchability (on the logit scale) at each sampling event was a linear function of the number of traps set.
Figure 2. Plot of number of burbot captured vs number of traps set (data from all years, sampling
events and basins).
Moyie Lake Burbot: Population Assessment 2007 7
3.0 Results 3.1 Burbot Trapping
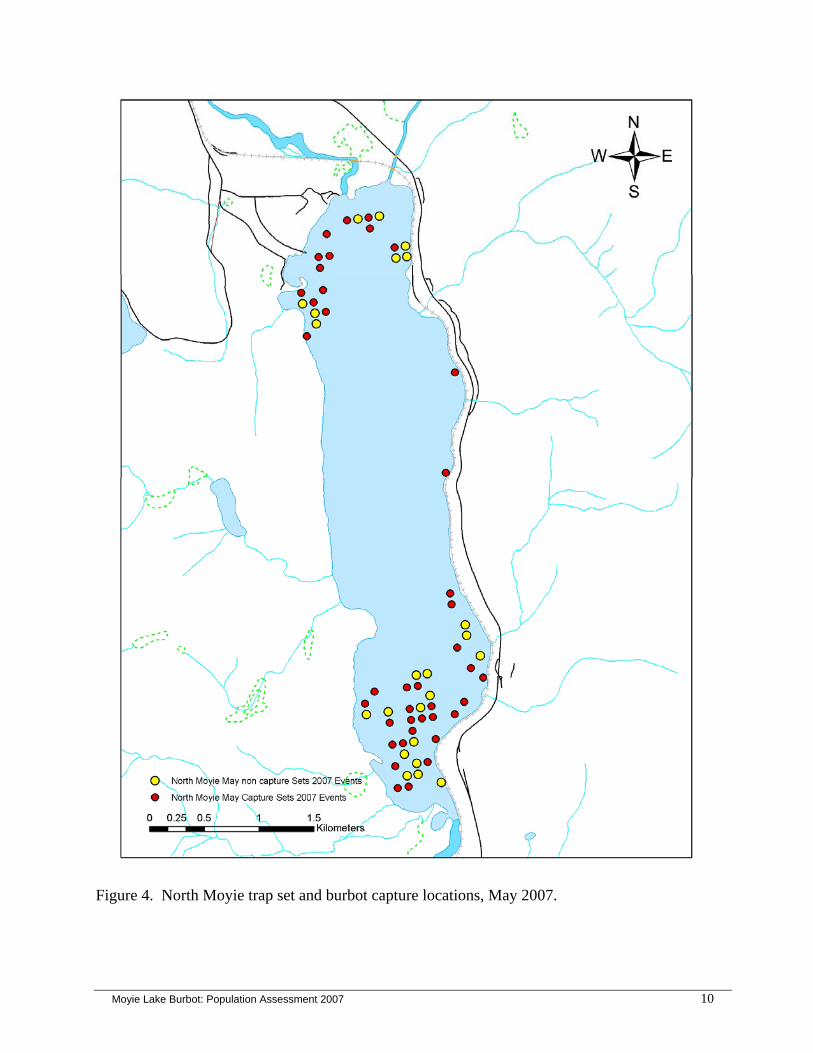
3.1.1 North Moyie Burbot trapping was undertaken on two sampling periods between April 16 and May 2 (April Session) as well as May 22 and May 28, 2007 (May Session). Sampling effort totalled 448 trap-days effort (one trap fished for 24 hours) for a total catch of 255 burbot (Appendices A to C). Mean CPUE of burbot for both sampling periods combined was 1.14 burbot per trap set (48 h period). Although much of Moyie Lake is greater than 25 m in depth, deeper sets were avoided because of concerns over decompression trauma and associated mortality with deep water trapping (Neufeld and Spence 2004c). Although previous work on Moyie Lake, Duncan Reservoir and some Alaskan lakes has suggested that burbot use much of the deep water habitat not sampled in this and previous studies (Lafferty et al. 1992, Neufeld and Spence 2004a, Prince 2007), previous studies also suggest that the use of shallow traps for tagging projects does not significantly skew recapture results if enough time elapses between trapping sessions to allow sufficient tag mixing. Traps set in the April session had a mean depth of 14.3 m (range 1.7 - 25.0 m). A total of 324 trap/days effort resulted in the capture of 180 burbot (Figure 3, Table 1) and a mean CPUE of 1.11 burbot per trap set (48 h). Traps set in the May session had a mean depth of 14.2 m (range 2.5 - 24.2 m). A total of 124 trap-days of effort resulted in the capture of 75 burbot (Figure 4, Table 1) and a mean CPUE of 1.19 burbot per trap set (48 h). Trapping data suggested a relatively even distribution of burbot by depth. The number of burbot captured in each set ranged from zero to five, and there was no significant difference in the set depth of traps stratified by the number of burbot captured (Kruskal-Wallis p=0.847). In addition, there was no difference in the depth of traps that captured fish and those that did not (Kolmogorov-Smirnov p=0.523). Trapping data also suggested that the depth of capture had little effect on recapture probability. The depth of burbot captured once and those captured more than once showed no significant difference (Kolmogorov-Smirnov p=0.153).
3.1.2 South Moyie Burbot trapping was undertaken on one sampling period between October 22 and 24, 2007 (October Session) to provide fish for population estimation and a conservation aquaculture program. Sampling effort totalled 27 trap-days effort (one trap fished for 24 h), for a total catch of 22 burbot (Figure 5, Table 3; Appendices D and E) and a mean CPUE of 1.63 burbot per trap set (48 h). Trap sets had a mean depth of 3.6 m (range 1.5 - 7 m). In total, 19 of the 22 captured burbot were transported to the University of Idaho for conservation aquaculture research.
Moyie Lake Burbot: Population Assessment 2007 8
Figure 3. North Moyie Lake trap set and burbot capture locations, April 2007.
Moyie Lake Burbot: Population Assessment 2007 9
Figure 4. North Moyie trap set and burbot capture locations, May 2007.
Moyie Lake Burbot: Population Assessment 2007 10
Figure 5. South Moyie trap set and burbot capture locations, October 2007.
Moyie Lake Burbot: Population Assessment 2007 11
3.2 Population Index
3.2.1 Single Census - Peterson Type Estimate Burbot were captured during two sampling sessions (dubbed sessions 4 and 4’) in April and May, 2007. These sessions were added to three previous sampling efforts (Prince 2007) for multiple census samples (detailed in section 3.2.2; Table 1 and 2). For the purpose of the single census estimate, events 4 and 4’ were sufficiently close in time that an assumption of the population being largely closed was reasonable. A total of 178 burbot were captured and tagged in session 4, two of which were recaptured during this same sampling effort. One additional burbot died from decompression trauma. This resulted in a total of 180 burbot captures and 177 released with tags in session 4. In sampling session 4’, a total of 75 burbot were captured, of which eight had been tagged in session 4 and 67 were untagged, for a mark rate of 11% (Table 1). Given this capture history (Table 1) the total number of adult burbot in north Moyie Lake in the spring of 2007 was estimated to be 1500 and 1700 (SE~400) using Chapman and MLE Peterson methods, respectively (Table 2). We examined the effects of tag loss and post tagging mortality on these estimates (assumed to be ~10%), which decreased the resulting estimate by ~10%. However, this reduction was dwarfed by uncertainty in the estimates due to low recapture rates. Table 1. Summary of Peterson burbot trapping data from the north basin Moyie Lake, spring 2007.
Event 4 4' Year 2007 2007 Start Date 16-Apr 22-May End Date 02-May 28-May
Recaptured from Event 4 2a 8 Recaptured from Event 4' 0
Captured with Tags 2a 8 Captured without Tags 178 67 Captured 180 75 Released with Tags 177 n/a Handling Related Mortalities 1 n/a Removed to Hatchery 0 0
a recaps within a single event should be eliminated for closed population model estimates.
3.2. 2 Multiple Census - Jolly-Seber Estimate Burbot in both the north and south basins of Moyie Lake were captured during 4 sampling sessions which were used to provide a Jolly-Seber population estimate (Table 2 and 3). Two of these periods (2 and 4) had two sampling sessions within, completed less than one month apart, which were pooled to increase sample size. Three of these sampling sessions were completed during previous studies (event 1, 2 and 3; Prince 2007), while one was completed during this current study (event 4; Table 2 and 3). In north basin, a total of 255 burbot were captured during sampling session 4, 13 of which were recaptured during session 4, and 20 of which were recaptured from previous sessions. Two of these 20 fish were recaptures from tags that were applied in the south basin of Moyie, and were therefore excluded for this analysis. This resulted in a north basin, session 4 mark rate of about
Moyie Lake Burbot: Population Assessment 2007 12
7% (Table 2). On south basin, a total 22 burbot were captured during session 4, five of which were tagged for a mark rate of 23% (Table 3). Table 2. Summary of trapping data used for Jolly-Seber population estimates on north Moyie [including trapping data from previous studies(Prince 2007)].
Event 1 2 3 4 All Year 2005 2006 2006 2007 Start Date 09-Sep 12-May 30-Oct 16-Apr
End Date 12-Sep 09-Jun 05-Nov 28-May Totals
Recaptured from Event 1 0 4a,c 0 6 11
Recaptured from Event 2 1b 1 11d 12 Recaptured from Event 3 0 3 3
Recaptured from Event 4 13be 13
Captured with Tags 0 5 1 33e 39 Captured without Tags 66 141 85 222 514 Captured 66 146 86 255 553 Released with Tags 66 136 84 220 506 Handling Related Mortalities 0 10 2 2 14 Removed to Hatchery 0 0 0 0 0 a contains 1 recapture that was a stray from S.Basin and should be eliminated from abundance estimates b recaptures within a single event should be eliminated for open population model estimates c contains 1 recapture that lost its tag but due to recapture date and event (i.e. 1st date of 2nd sample event), it had to have been originally tagged in event 1 and is therefore included in abundance estimates d contains 2 recaptures that were strays from S.Basin and should be eliminated from abundance estimates e contains 2 recaptures 2-4 days apart in session 4 and 1 fish recaptured with a tag in 2007 was not found in any tagging data
* 3 of the 2005 fish tagged in the North Basin were harvested during the 2006 winter fishery and one found dead July 10 (2007) on bottom of lake.
Table 3. Summary of trapping data used for Jolly-Seber population estimates on south Moyie (including trapping data from Prince (2007) studies).
Recaptured from Event 2 a 3 8 4 12 Recaptured from Event 3 0 0 0 Recaptured from Event 4 0 0 Captured with Tags 0 6 10 5 21 Captured without Tags 59 157 54 16 286 Captured 59 163 64 22 308 Released with Tags b 59 158 20 0 237 Handling Related Mortalities 0 5 1 0 6 Removed to Hatchery 0 0 30 22* 52 a recaptures within a single event should be eliminated for open population model estimates b 1 of the 2005 fish tagged in the South Basin was harvested during the 2006 winter fishery * 1 additional fish caught in session 4 (from N Basin in Apr 06).
Moyie Lake Burbot: Population Assessment 2007 13
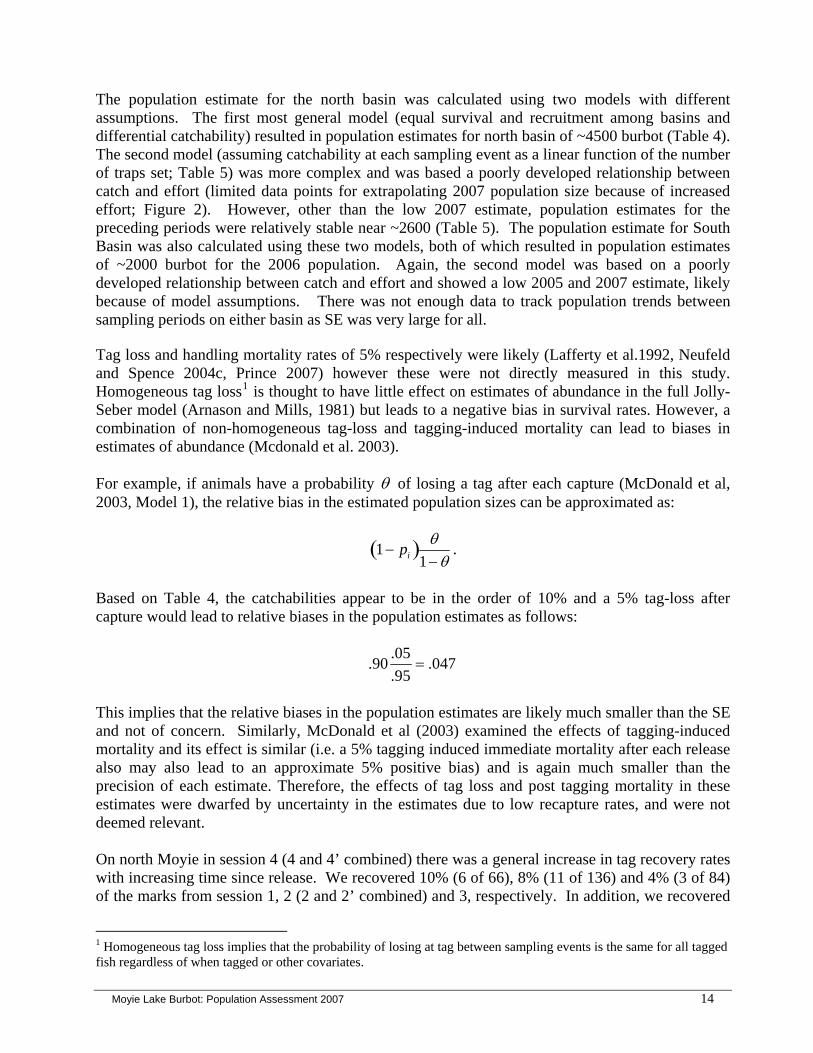
The population estimate for the north basin was calculated using two models with different assumptions. The first most general model (equal survival and recruitment among basins and differential catchability) resulted in population estimates for north basin of ~4500 burbot (Table 4). The second model (assuming catchability at each sampling event as a linear function of the number of traps set; Table 5) was more complex and was based a poorly developed relationship between catch and effort (limited data points for extrapolating 2007 population size because of increased effort; Figure 2). However, other than the low 2007 estimate, population estimates for the preceding periods were relatively stable near ~2600 (Table 5). The population estimate for South Basin was also calculated using these two models, both of which resulted in population estimates of ~2000 burbot for the 2006 population. Again, the second model was based on a poorly developed relationship between catch and effort and showed a low 2005 and 2007 estimate, likely because of model assumptions. There was not enough data to track population trends between sampling periods on either basin as SE was very large for all. Tag loss and handling mortality rates of 5% respectively were likely (Lafferty et al.1992, Neufeld and Spence 2004c, Prince 2007) however these were not directly measured in this study. Homogeneous tag loss1 is thought to have little effect on estimates of abundance in the full Jolly-Seber model (Arnason and Mills, 1981) but leads to a negative bias in survival rates. However, a combination of non-homogeneous tag-loss and tagging-induced mortality can lead to biases in estimates of abundance (Mcdonald et al. 2003). For example, if animals have a probability θ of losing a tag after each capture (McDonald et al, 2003, Model 1), the relative bias in the estimated population sizes can be approximated as:
1− pi( ) θ1−θ
.
Based on Table 4, the catchabilities appear to be in the order of 10% and a 5% tag-loss after capture would lead to relative biases in the population estimates as follows:
.90.05.95
= .047
This implies that the relative biases in the population estimates are likely much smaller than the SE and not of concern. Similarly, McDonald et al (2003) examined the effects of tagging-induced mortality and its effect is similar (i.e. a 5% tagging induced immediate mortality after each release also may also lead to an approximate 5% positive bias) and is again much smaller than the precision of each estimate. Therefore, the effects of tag loss and post tagging mortality in these estimates were dwarfed by uncertainty in the estimates due to low recapture rates, and were not deemed relevant. On north Moyie in session 4 (4 and 4’ combined) there was a general increase in tag recovery rates with increasing time since release. We recovered 10% (6 of 66), 8% (11 of 136) and 4% (3 of 84) of the marks from session 1, 2 (2 and 2’ combined) and 3, respectively. In addition, we recovered
1 Homogeneous tag loss implies that the probability of losing at tag between sampling events is the same for all tagged fish regardless of when tagged or other covariates.
Moyie Lake Burbot: Population Assessment 2007 14
about 5% of the tags in session 4’ which were released in session 4. This trend of increasing recovery rates with increasing time since original capture suggested that trapping effects (trap avoidance) may have occurred. On south Moyie in session 4, there were insufficient tag recoveries from session 1 and 3 to properly evaluate recapture trends associated with time since release. However, it is likely that the same trapping effects observed in the north basin affected our results in this basin as well. We recovered 1.7% (1 of 59), 2.5% (4 of 158) and 0% (0 of 20) of the marks from sessions 1, 2 (2 and 2’ combined) and 3, respectively. Table 4. Jolly-Seber model output where equal survival and recruitment rates assumed among basins, but allowed for differential catchability. Based on 2005/2006 Data (Prince
2007) Based on 2005/2006/2007 data
Period1 North Basin Est (SE)
South Basin Est (SE)
North Basin Est (SE)
South Basin Est (SE)
Catchability 1.0 (Fall 2005) ne ne ne ne 1.7 (Spring 2006) 0.08 (0.06) 0.10 (0.09) 0.03 (0.02) 0.12 (0.07) 2.2 (Fall 2006) ne ne 0.02 (0.01) 0.06 (0.02) 2.8 (Summer 2007) NA NA ne ne
2Survival - between periods (SE)
1.0 (Fall 2005) 0.56 (0.40) 0.56 (0.40) 0.81 (0.33) 0.81 (0.33) 1.7 (Spring 2006) ne ne 0.96 (0.43) 0.96 (0.43) 2.2 (Fall 2006) NA NA ne ne
Population Estimates 1.0 (Fall 2005) ne ne ne ne 1.7 (Spring 2006) 2000 (1500) 1500 (1200) 4600 (2700) 1300 (700) 2.2 (Fall 2006) ne ne 4500 (1800) 1200 (500) 2.8 (Summer 2007) NA NA ne ne 1 Periods are converted to decimal years starting with Fall 2005 = 1. 2 Survival rates are reported for the actual interval in question. Yearly survival rates are obtained using . For example, the actual survival rate based on the 2005/2006 data between the Fall of 2005 (t=1) and the Spring of 2006 (t=1.7) is estimated as . The estimated yearly survival rate is estimated as 0.56
φYearly = φActual1/Λt
0.561/.7 = .44
ne – not estimable at start and end of experiment NA – not available with 2005/2006 data are used Annual survival rates on north and south Moyie appear to be ~ 70-80% (between period survivals ~80-95%; Table 4 and 5). Low survival rates calculated by the second model (Table 5) for the last period were again based on a poorly developed catch/effort relationship (limited data points for extrapolating 2006-07 survival rates because of increased effort in 2007) and were not reflected in population estimates. As well, the low survival rates generated in previous studies were likely the result of limited sample size, and not actual survival rates.
Moyie Lake Burbot: Population Assessment 2007 15
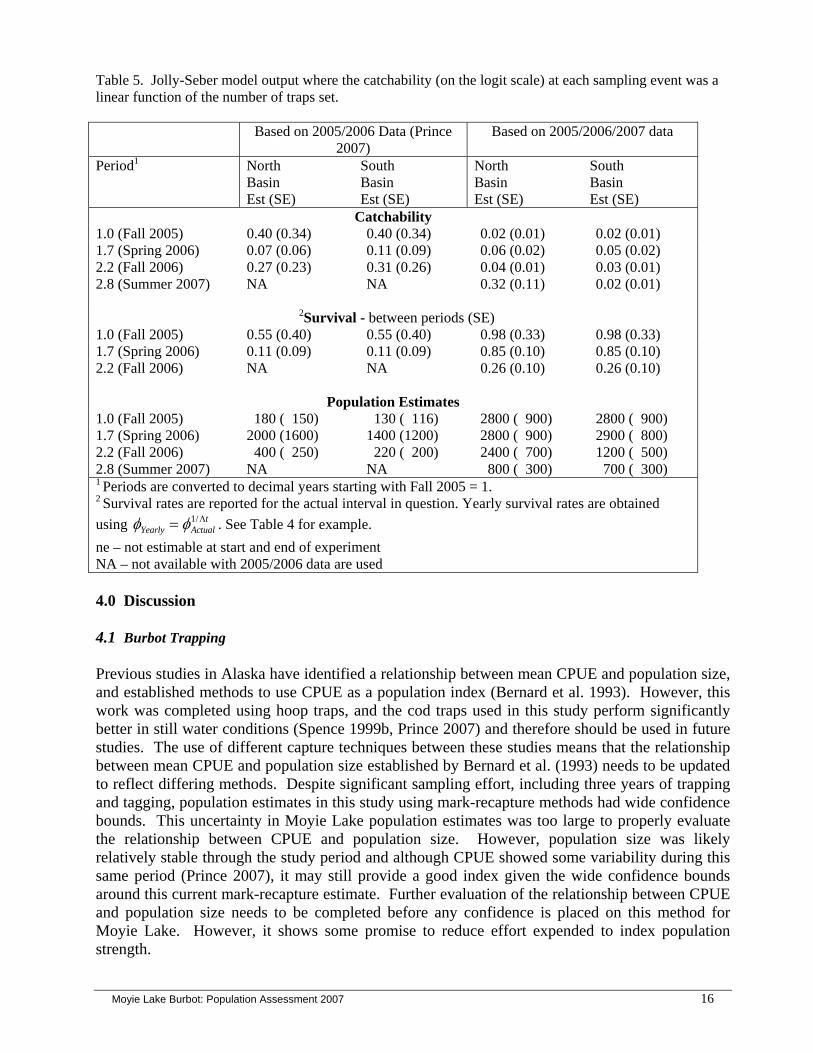
Table 5. Jolly-Seber model output where the catchability (on the logit scale) at each sampling event was a linear function of the number of traps set. Based on 2005/2006 Data (Prince
Population Estimates 1.0 (Fall 2005) 180 ( 150) 130 ( 116) 2800 ( 900) 2800 ( 900) 1.7 (Spring 2006) 2000 (1600) 1400 (1200) 2800 ( 900) 2900 ( 800) 2.2 (Fall 2006) 400 ( 250) 220 ( 200) 2400 ( 700) 1200 ( 500) 2.8 (Summer 2007) NA NA 800 ( 300) 700 ( 300) 1 Periods are converted to decimal years starting with Fall 2005 = 1. 2 Survival rates are reported for the actual interval in question. Yearly survival rates are obtained using . See Table 4 for example. φYearly = φActual
1/Λt
ne – not estimable at start and end of experiment NA – not available with 2005/2006 data are used 4.0 Discussion 4.1 Burbot Trapping Previous studies in Alaska have identified a relationship between mean CPUE and population size, and established methods to use CPUE as a population index (Bernard et al. 1993). However, this work was completed using hoop traps, and the cod traps used in this study perform significantly better in still water conditions (Spence 1999b, Prince 2007) and therefore should be used in future studies. The use of different capture techniques between these studies means that the relationship between mean CPUE and population size established by Bernard et al. (1993) needs to be updated to reflect differing methods. Despite significant sampling effort, including three years of trapping and tagging, population estimates in this study using mark-recapture methods had wide confidence bounds. This uncertainty in Moyie Lake population estimates was too large to properly evaluate the relationship between CPUE and population size. However, population size was likely relatively stable through the study period and although CPUE showed some variability during this same period (Prince 2007), it may still provide a good index given the wide confidence bounds around this current mark-recapture estimate. Further evaluation of the relationship between CPUE and population size needs to be completed before any confidence is placed on this method for Moyie Lake. However, it shows some promise to reduce effort expended to index population strength.
Moyie Lake Burbot: Population Assessment 2007 16
4.2 Population Estimate Although significant effort was expended in this and previous studies, a number of biases likely exist in the data and related estimates. Burbot catches were low relative to the population as a whole and, without additional data, little could be done to fit the models to correct for these issues. Evenson (1998) also identified that low probability of capture for burbot population studies in Alaska often resulted in marginally precise estimates, and fluctuations in catchability often confounded population index methods using CPUE. In general, population estimates in this study using similar methods showed little measurable variation between time periods, with the exception of our model based on catchability. However, there were significant differences in the estimated population size depending on the estimate type employed. These differences may have resulted from a combination of trap effects and inadequate mixing of marked and unmarked fish during recapture sessions. Trapping data showed an increase in recapture rate as the time since original capture increased. Although some previous studies have suggested that trapping effects were not an issue using hoop traps to capture burbot (Bernard et al. 1993) this trend in our data suggested some trap avoidance by previously captured burbot using cod traps. The probability of this effect being related to differences in the traps appears unlikely given their similarity in design and capture mechanism. Trap soak times were also similar to the work of Bernard et al. (1993). If trap avoidance is in fact occurring, this would bias both Jolly-Seber and Peterson estimates higher than the actual population size. The Peterson estimates from this and previous studies were significantly lower than Jolly-Seber estimates. This may have resulted from insufficient mixing of marked and unmarked fish due to shorter times between sample sessions (2 and 2’ as well as 4 and 4’) used to complete those calculations (~1 month between samples; Prince 2007). In contrast, better mixing of tags likely occurred between samples for the Jolly-Seber estimate as a result of longer times between sample sessions (> 6 months). The implications of this difference are that Peterson estimates from this and previous studies may have underestimated the true population size. A simple Peterson estimate using sessions 1, 2 and 3 pooled as a mark sample and 4 as a recapture sample can be used to test the potential for underestimation due to lack of mixing. The pooled approach yields a much larger estimate of about 3600 fish. Although violations of estimate assumptions are probable with this approach due to mortality and other factors that occurred in the period of time between these samples, the higher estimate further suggests insufficient mixing in our 4’ estimate. Population estimates had poor precision because of the small number of marked fish that were recaptured despite significant effort. A model based estimate where catchability was a function of traps set may be a feasible alternative to the unspecified JS model, but the large amount of effort in 2007 that is well away from the bulk of the data points makes extrapolation tenuous.
Moyie Lake Burbot: Population Assessment 2007 17
In comparing results from the previous report (Prince 2007) and this report, the estimated population abundances for the North basin are extremely variable. Closed population estimates ranged from:
• 1700 (SE 1000) based on 2007 data with a single recapture between episodes 2 and 2’ • 6000 (SE 3500) based on 2007 data with a single recapture between episodes 2 and 3 • 7400 (SE 5000) based on 2007 data with episodes 2, 2’ and 3. • 7400 (SE 5000) based on 2007 data with episodes 2, 2’ and 3 and catchability modeled as a
function of effort • 1500 (SE 400) based on 2008 data with 8 recaptures between episodes 4 and 4’.
The estimates for north basin from the open population models are not much better (see Tables 4 and 5) ranging from 4500 (SE 1800) when the most general model is fit; and 2400 (SE 700) in 2006 and a very small estimate of 800 (SE 300) for 2007 when catchability is modeled as a function of effort. All of these estimates (except for the estimate of 800) are consistent with each other because of the very large SEs and there is no objective way to choose among them. As well, better estimates in the future are unlikely, given that the extensive data collected to date was not robust enough to account for potential biases or significantly refine SE of estimates. However, given these limitations, an estimate of around 1500-2500 fish would seem to be a compromise that is reasonably supported by the data. The very low estimate of 800 (SE 300) fish is based on extrapolating the relationship between catchability and effort well beyond the range of most of the data, and therefore is likely an outlier. Estimates of population size for the South basin are more consistent. Closed population estimates ranged from:
• 800 (SE 300) based on 2007 data with a single recapture between episodes 2 and 2’ • 1200 (SE 300) based on 2007 data with a single recapture between episodes 2 and 3 • 1200 (SE 300) based on 2007 data with episodes 2, 2’ and 3. • 1200 (SE 300) based on 2007 data with episodes 2, 2’ and 3 and catchability modeled as a
function of effort The estimates for south basin from the open population models ranged from 1300 (SE 700), 1200 (SE 500) and up to 2800 (SE 900) for models where catchability is modeled as a function of effort. All of these estimates are again consistent with each other (given the relatively large SE). An estimate of around 1000-1200 fish would seem to be reasonably supported by the data. Ahrens and Korman (2002) suggested an exploitation rate of 20% annually was the maximum sustainable based on modelling of the historic burbot population in Kootenay Lake. Care must be taken when applying this rate because the exploitation rate (Ahrens and Korman 2002) is based on a modelling exercise from a separate population, and the applicability of this rate to Moyie Lake burbot has not been evaluated. However, based on the estimated population size in the north basin of Moyie Lake (~1500 to 2500) and these modelling results, a maximum sustainable exploitation rate may be somewhere between 300 to 500 burbot/year. Westover (2007) estimated harvest in 2006-07 of 168 and a total catch of 347 burbot. Using the lower of the population estimates to roughly account for aforementioned biases, we might already be harvesting the population at about half the maximum sustainable level, and this does not take into account significant statistical uncertainty in estimates of both population size and catch. In addition, a creel survey conducted in
Moyie Lake Burbot: Population Assessment 2007 18
2007-08 showed a significant change in effort (report in prep.) and likely a larger harvest. This population estimate and the final harvest numbers from 2007-08 (when this report is complete) must be further evaluated to identify whether the sport harvest is sustainable. Based on estimates of population size in the south basin of Moyie Lake (~1000 to 1200) and modelling results of sustainable exploitation rates (Ahrens and Korman 2002), a sustainable exploitation rate for south Moyie Lake may be somewhere between 200 to 240 burbot/year. Westover (2007) estimated no harvest in 2006-07 and a total catch of 21 burbot. Although there is likely some small harvest in the south basin, this work suggests it is likely a small number. In addition to harvest, broodstock capture programs have removed ~25 burbot per year from the south basin of Moyie Lake in each of the last 2 years of study. However, the removal of broodstock and the low level fishery currently appear well within the bounds of sustainable harvest. Again, care must be taken when applying this rate because of uncertainty around the applicability of Ahrens and Korman (2002) exploitation rate and the poor precision of estimates.
Moyie Lake Burbot: Population Assessment 2007 19
Recommendations
If broodstock collection is to continue on Moyie Lake, some continued monitoring needs to be completed to set targets for broodstock removal. This includes population estimates generated every 3 to 4 years to track population status as well as some annual monitoring and periodic full assessments of harvest to track changes in fishery participation or harvest.
Future indexing programs should consider issues of trap avoidance and tag mixing
identified in this study when planning future studies.
Given the high variability in M-R estimates despite significant effort in this study, refined CPUE based methods may be more efficient with similar uncertainty; however, methods to use CPUE to index burbot numbers need to be refined if they are to be reliable.
Significant advantages to spawning fish in the wild and rearing eggs in a hatchery setting
have been identified, however more study needs to be completed to identify spawning sites and timing on Moyie Lake if this technique is to be employed.
Creel survey results from 2006-07 (Westover 2007) and population estimates from the
same period (current report) suggested an annual harvest rate which may be sustainable. However monitoring of this fishery in 2007-08 showed a significant change in effort (report in prep.) and likely a larger harvest. The current sport fishing regulations for burbot on Moyie Lake should be evaluated against this increase in effort, and changes made if it appears that harvest rates are not sustainable.
Moyie Lake Burbot: Population Assessment 2007 20
Acknowledgements Angela Prince and Scott Cope of Westslope Fisheries conducted much of the previous fieldwork this study built on. Don Miller of Kootenay Wildlife Services Ltd., Jack Siple and Chris Lewendowski (KTOI) as well as John Bell (MoE) conducted much of the fieldwork for this project. Colin Spence (MoE) provided invaluable technical experience during this project and critical review of this paper. Albert Chirico (MoE) helped produce maps detailing trapping locations. Ron Ek (BC Freshwater Fisheries Society) provided the use of a tank and trailer for burbot transport. Vaughn Paragamian (IDFG) and Sue Ireland (KTOI) provided administrative support and technical direction. In addition, the Bonneville Power Administration (Northwest Power and Conservation Council Fish and Wildlife Program) funded the project through the Idaho Department of Fish and Game and the Kootenai Tribe of Idaho. Lastly, thanks go to Carl Schwartz for his advice regarding study design, completion of analysis of M-R data and the development of population estimates using the Program MARK.
Moyie Lake Burbot: Population Assessment 2007 21
Literature Cited Ahrens, R. and J. Korman. 2002. What Happened to the West Arm Burbot Stock in Kootenay
Lake? Use of an Age-Structured Population Model to Determine the Possible Causes for Recruitment Failure. Consult. rept. prep. by Ecometric Research Inc. for B.C. Min. Environment, Lands and Parks, Nelson, BC
Arnason A. N. and Mills K. H. (1981). Bias and loss of precision due to tag loss in Jolly-Seber
estimates for mark-recapture experiments. Canadian Journal of Fisheries and Aquatic Sciences 38, 1077-1095.
Arndt, S. and J. Baxter. 2006. Status of Burbot (Lota lota) in Arrow Lakes Reservoir. Report
prepared for the Columbia Basin Fish & Wildlife Compensation Program (Nelson) and BC Hydro (Castlegar).
Baxter, J., C. Spence and M. Neufeld. 2002a. Kootenay Lake Burbot Studies Progress 2000-2001.
Report prepared for the Ministry of Water Land and Air Protection, Nelson, B.C. Baxter, J., C. Spence and M. Neufeld. 2002b. Kootenay Lake Burbot Studies Progress 2001-
2002. Report prepared for the Ministry of Water Land and Air Protection, Nelson, B.C. Bernard, D.R., J.F. Parker and R. Lafferty. 1993. Stock Assessment of Burbot Populations in
Small and Moderate-Sized Lakes. North American Journal of Fisheries Management. 13:657-675.
Bisset, J. E., and R. S. Cope. 2002. Goat River Burbot Spawner Enumeration Program, Creston, B.
C. Report prepared for Columbia-Kootenay Fisheries Renewal Partnership, Cranbrook, B. C. Prepared by Westslope Fisheries, Cranbrook, B. C.
Cowen L. and Schwarz C. J. (2006). The JollySeber Model with Tag Loss. Biometrics 62, 699-
705. Evenson, Matthew J. 1998. Burbot Research in the Tanana River Drainage. Fisheries Data Series
# 98-38. Alaska Department of Fish & Game, Division of Sport Fish, December, 1998. Jolly G. M. (1965). Explicit estimates from capture-recapture data with both death and
Prepared by the Kootenai Tribe of Idaho with assistance from S. P. Cramer and Associates. 77 pp.
Lafferty, R., J.F. Parker, D.R. Bernard. 1992. Stock Assessment and Biological Characteristics of
Burbot in Lakes of Interior Alaska during 1991. Fishery Data Series # 92-20. Alaska Department of Fish & Game, Division of Sport Fish, July 1992.
Moyie Lake Burbot: Population Assessment 2007 22
McDonald T. L., Amstrup S. C. and Manly B. F. J. (2003). Tag loss can bias Jolly-Seber capture-recapture estimates. Wildlife Society Bulletin 31, 814-822.
Northcote, T.C. 1973. Some Impacts of Man on Kootenay Lake and Its Salmonids. Great Lakes
Fishery Commision, Technical Report No. 2. Neufeld and Spence. 2004a. Kootenay Fisheries Investigations, Sturgeon and Burbot Progress,
2002. Report prepared for Ministry of Environment, Lands and Parks, Nelson B.C. Neufeld and Spence. 2004b. White Sturgeon and Burbot Recovery Progress 2003-04. Report
prepared for Ministry of Environment, Lands and Parks, Nelson B.C. Neufeld and Spence. 2004c. Evaluation of a Simple Decompression Procedure to Reduce
Decompression Trauma in Trap Caught Burbot. Transactions of the American Fisheries Society. 133:5 560-574.
Neufeld, M.D, V.L. Paragamian and S. Ireland. 2006. Draft Kootenai River Burbot – 5 Year
Operational Research Plan. Report completed for the KVRI Burbot Committee. Neufeld. 2005. White Sturgeon and Burbot Recovery Progress in British Columbia 2004-05.
Report prepared for Ministry of Environment, Lands and Parks, Nelson B.C. Paragamian, V. L. 1994. Kootenai River Fisheries Investigation: stock status of burbot and
rainbow trout and fisheries inventory. Idaho Department of Fish and Game. Bonneville Power Administration. Annual Progress Report (1993), Project 88-65. Boise, Idaho.
Paragamian, V. L. 2000. The Effects of Variable Flows on Burbot Spawning Migrations in the
Kootenai River, Idaho, USA and British Columbia, Canada. Pages 111-123 in V. L. Paragamian and D. W. Willis, editors. Burbot: biology, ecology, and management. American Fisheries Society, Fisheries Management Section, Publication Number 1, Bethesda Maryland.
Paragamian, V. L., and V. D. Wakkinen. In progress. Seasonal Movement and the Interaction of
Temperature and Discharge on Burbot in the Kootenai River, Idaho, USA, and British Columbia, Canada.
Paragamian, V. L., V. Whitman, J. Hammond, and H. Andrusak. 2000. Collapse of the Burbot
Fisheries in Kootenay Lake, British Columbia, Canada, and the Kootenai River, Idaho, USA, post-Libby Dam. Pages 155-164 in V. L. Paragamian and D. W. Willis, editors. Burbot: biology, ecology, and management. American Fisheries Society, Fisheries Management Section, Publication Number 1, Bethesda, Maryland.
Paragamian, V. L., J. Kozfkay, and V. Whitman. 2001. Kootenai River Fisheries Investigation:
burbot stock status. Idaho Department of Fish and Game. Bonneville Power Administration. Annual Progress Report, Project 88-65. Boise, Idaho.
Moyie Lake Burbot: Population Assessment 2007 23
Paragamian, V. L., B. Gunderman, and R. Hardy. 2005. Effects of Regulated Discharge on Burbot Migration. Journal of Fish Biology 66:1199-1213.
Partridge, F. 1983. Kootenai River Fisheries Investigations in Idaho. Completion Report. Prepared
for the US Army Corps of Engineers by the Idaho Department of Fish and Game.
Powell, M., V. L. Paragamian, and J. Dunnigan. 2008. Mitochondrial variation in western North American burbot with special reference to the Kootenai River in Idaho and Montana. in V. L. Paragamian and D. Bennett, editors. Burbot: ecology, management, and culture. Symposium 59. American Fisheries Society, Bethesda, Maryland.
Prince, A. and C.R. Spence. 2007. Moyie Lake Burbot Stock Status, 2005-2006. Consultant
report prepared for BC Ministry of Environment, Nelson, B.C. Pyper, B.J., M.J. Daigneault, V.L. Paragamian, and S.C. Ireland. 2004. Population Dynamics and
Extinction Risk of a Burbot (Lota lota) Stock in Decline. S. P Cramer and Associates, Gresham, OR. Draft report preprared for the Kootenai Tribe of Idaho. 46pp.
Seber G. A. F. 1965. A note on the multiple recapture census. Biometrika 52, 249-259. Seber, G.A.F. 1982. The Estimation of Animal Abundance and Related Parameters. Second
Edition. Charles Griffin & Company Ltd. London. Spence, C.R. 1999a. Kootenay Lake Burbot Studies: Progress 1998-1999. Report to Habitat
Conservation Trust Fund and Bonneville Power Administration from the Ministry of Environment, Lands and Parks, Nelson, B.C. ii+53 pp.
Spence, C.R. 1999b. A Comparison of Catch Success Between Two Styles of Burbot Traps in
Lakes, pages 165-170. In: V.L. Paragamian and D.W. Willis (editors). Burbot Biology, Ecology, and Management. Publication Number 1, Fisheries Management Section of the American Fisheries Society. Spokane, WA.
Westover, W.T. 2007. Moyie Lake Creel and Spawning Survey (January-March 2007). BC Ministry of Environment Report.
Appendix A. North Moyie trap set data, 2007 (see Appendix B for Site ID details). Float ID Site ID Set Date Depth (m) Pull Date # Burbot Water Temp (C)
Float Water Trap Trap Depth Trap Trap Floy Tag Encounter history for MARK analysis
ID Temp (C) Set Date Set Time (m) Pull Date Pull Time Colour 1st Number Events 1&2&3&4 9 15.7 9-Sep-05 1353 22.0 12-Sep-05 1414 white 010729 1000 1 ; /* 010729 /* 9 15.7 9-Sep-05 1353 22.0 12-Sep-05 1414 white 010732 1000 1 ; /* 010732 /*
Float Water Trap Trap Depth Trap Trap Floy Tag Encounter history for MARK analysis
ID Temp (C) Set Date Set Time (m) Pull Date Pull Time Colour 1st Number Events 1&2&3&4 6 9.1 17-May-06 1035 26.8 19-May-06 1108 white 010994 0100 -1 ; /* 010994 /*
Float Water Trap Trap Depth Trap Trap Floy Tag Encounter history for MARK analysis
ID Temp (C) Set Date Set Time (m) Pull Date Pull Time Colour 1st Number Events 1&2&3&4 4 7.1 1-Nov-06 1430 12.5 3-Nov-06 1154 white 010860 0010 1 ; /* 010860 /*
Float Water Trap Trap Depth Trap Trap Floy Tag Encounter history for MARK analysis
ID Temp (C) Set Date Set Time (m) Pull Date Pull Time Colour 1st Number Events 1&2&3&4 7 5.7 16-Apr-07 1612 3.6 18-Apr-07 1103 white 11226 0001 1 ; /* 011226 /* 3 5.7 16-Apr-07 1524 2.4 18-Apr-07 1121 white 11229 0001 1 ; /* 011229 /*
Float Water Trap Trap Depth Trap Trap Floy Tag Encounter history for MARK analysis
ID Temp (C) Set Date Set Time (m) Pull Date Pull Time Colour 1st Number Events 1&2&3&4 6 5.7 18-Apr-07 1146 5.4 20-Apr-07 1055 white 11208 0001 1 ; /* 011208 /*
Float Water Trap Trap Depth Trap Trap Floy Tag Encounter history for MARK analysis
ID Temp (C) Set Date Set Time (m) Pull Date Pull Time Colour 1st Number Events 1&2&3&4 1 7.6 28-Apr-07 1242 12.8 30-Apr-07 1407 white 11465 0001 1 ; /* 011465 /*
Float Trap Trap Depth Trap Trap Floy/PIT tag Encounter history for MARK analysis
ID Set Date Set Time (m) Pull Date Pull Time Colour 1st Number Events 1&2&3&4 13 8-May-06 1059 14.9 10-May-06 1500 white 010635 0100 1 ; /* 010635 */ 8 10-May-06 1127 21.6 12-May-06 843 white 010650 0100 1 ; /* 010650 */