90947512 - 1 - MP6/ms6 5/14/2014 BEFORE THE PUBLIC UTILITIES COMMISSION OF THE STATE OF CALIFORNIA Order Instituting Rulemaking to Integrate and Refine Procurement Policies and Consider Long-Term Procurement Plans. Rulemaking 13-12-010 (Filed December 19, 2013) ASSIGNED COMMISSIONER’S RULING TECHNICAL UPDATES TO PLANNING ASSUMPTIONS AND SCENARIOS FOR USE IN THE 2014 LONG TERM PROCUREMENT PLAN AND 2014-15 CAISO TPP Energy Division, in consultation with the California Energy Commission (CEC), has determined technical updates are required to the February 27, 2014 Assigned Commissioner’s Ruling (ACR) on “Planning Assumptions and Scenarios for use in the 2014 Long Term Procurement Plan (LTPP) and 2014-15 CAISO TPP.” The ACR Attachment on Planning Assumptions and Scenarios and the associated Scenario Tool Excel workbook referenced in the herein Attachment are being updated. There are five technical corrections that Energy Division has implemented, as detailed herein: 1. Corrections to account for avoided transmission and distribution losses from demand-side resources; 2. Updates to the managed demand forecast including revised Additional Achievable Energy Efficiency (AAEE) assumptions; 3. Corrections to the supply stack counting of once-through cooling (OTC) units in its year of assumed retirement; 4. Corrections to the language referring to the storage target identified in Decision (D.) 13-10-040; and FILED 5-14-14 01:38 PM
Transcript
90947512 - 1 -
MP6/ms6 5/14/2014 BEFORE THE PUBLIC UTILITIES COMMISSION OF THE STATE OF CALIFORNIA Order Instituting Rulemaking to Integrate and Refine Procurement Policies and Consider Long-Term Procurement Plans.
Rulemaking 13-12-010 (Filed December 19, 2013)
ASSIGNED COMMISSIONER’S RULING TECHNICAL UPDATES TO PLANNING ASSUMPTIONS AND SCENARIOS FOR USE IN THE 2014
LONG TERM PROCUREMENT PLAN AND 2014-15 CAISO TPP
Energy Division, in consultation with the California Energy Commission
(CEC), has determined technical updates are required to the February 27, 2014
Assigned Commissioner’s Ruling (ACR) on “Planning Assumptions and
Scenarios for use in the 2014 Long Term Procurement Plan (LTPP) and 2014-15
CAISO TPP.” The ACR Attachment on Planning Assumptions and Scenarios
and the associated Scenario Tool Excel workbook referenced in the herein
Attachment are being updated.
There are five technical corrections that Energy Division has implemented,
as detailed herein:
1. Corrections to account for avoided transmission and distribution losses from demand-side resources;
2. Updates to the managed demand forecast including revised Additional Achievable Energy Efficiency (AAEE) assumptions;
3. Corrections to the supply stack counting of once-through cooling (OTC) units in its year of assumed retirement;
4. Corrections to the language referring to the storage target identified in Decision (D.) 13-10-040; and
FILED5-14-1401:38 PM
R.13-12-010 MP6/ms6
- 2 -
5. Documentation of corrections and updates that were previously announced by staff email to Rulemaking (R.) 13-12-010 parties on March 19, 2014.
1. Corrections to Account For Avoided Transmission and Distribution Losses from Demand-Side Resources
The Scenario Tool produces a loads and resources table that illustrates the
projected balance of supply and demand in terms of available system capacity at
coincident peak demand. Demand-side resource projections need to account for
avoided transmission and distribution losses when calculating the balance of
projected supply and demand. Earlier versions of the Scenario Tool included
several customer-located resources to calculate the balance of projected supply
and demand: AAEE, incremental small solar photovoltaic, incremental
demand-side combined heat power, and demand response, but did not account
for avoided transmission and distribution losses. The latest version of the
Scenario Tool (version 2) corrects this error and the ACR Attachment (sections
4.1.6, 4.1.9, and 4.2.5) has been updated to describe accounting for avoided
transmission and distribution losses. The table below specifies factors supplied
by the CEC for accounting of avoided transmission and distribution losses. The
factors are multiplied by demand-side resource projections to determine the
avoided generation replaced by the presence of the demand-side resource.
forecast_CMF/LSE_and_Balancing_Authority_Forecasts/). The Scenario Tool
originally accounted for this correction with a separate line item because earlier
versions of the IEPR demand forecast tables did not include this correction. The
latest version of the Scenario Tool (version 2) removes the line item because it is
now accounted for in the latest IEPR demand forecast tables.
3. Corrections to the supply stack counting of OTC units in its year of assumed retirement
The original Scenario Tool did not count the capacity of an OTC unit in the
year of assumed retirement. The compliance date for OTC units generally falls
on December 31 of the compliance year. Therefore, if retirement is the assumed
R.13-12-010 MP6/ms6
- 5 -
compliance method, the capacity of the OTC unit should still be counted in the
compliance year, and not be considered retired until the next year. The latest
version of the Scenario Tool (version 2) corrects this.
4. Corrections to the language referring to the energy storage target identified in D.13-10-040
The ACR Attachment and Scenario Tool both referred to the energy
storage target identified in D.13-10-040 as either a “mandate” or a “target” and
used the terms interchangeably. However, D.13-10-040 describes the storage
target as only a target, and not a mandate. Therefore Energy Division staff
corrected the storage language in the ACR Attachment (section 4.2.4) and
Scenario Tool (version 2) to use the term “target” and not “mandate.”
5. Documentation of corrections and updates that were previously announced by staff email to R.13-12-010 parties on March 19, 2014
There are three other minor corrections and updates to the original
February 27, 2014 ACR Attachment that were previously announced by staff
email to LTPP parties on March 19, 2014:
1. Corrections to the “DR Capacity in Local Area Reliability Studies” Table in section 4.2.5. The original table tallied Demand Response (DR) ex ante impacts using 1-in-2 weather year data, however, the intent was to tally 1-in-10 weather year data. The corrected table clarifies this and now lists the DR Program MW in 2024 using 1-in-10 weather year ex ante impacts.
2. Updates to the “RPS Portfolio Summary” Table in section 4.2.6. The original table summarized the seven RPS portfolios with limited information on how the portfolios were built and the intended use. The updated table provides greater detail on the information used to calculate the renewable net short for each portfolio and the intended use of the portfolio.
R.13-12-010 MP6/ms6
- 6 -
3. Corrections to the “RPS Portfolio Summary by CREZ” Table in the Appendix. The original table contained formatting that inadvertently hid several cells in the table. The corrected table now shows all cells.
IT IS RULED that:
The February 27, 2014 Assigned Commissioner’s Ruling on “Planning
Assumptions and Scenarios for use in the 2014 LTPP and 2014-15 CAISO TPP”
and the associated Scenario Tool Excel workbook referenced in the Attachment
are updated, as shown in the Attachment to this Ruling.
Table 8: RPS Portfolio Summary by CREZ ..................................................................................... 41
Table 9: RPS Portfolio Summary by Technology ........................................................................... 42
R.13-12-010 MP6/ms6
- 1 -
1 Introduction
California Public Utilities Commission (CPUC) Energy Division staff prepared this document with collaboration from staff of the California Energy Commission (CEC) and California Independent System Operator (CAISO). The staff of the CPUC, CEC, and CAISO worked together to design the scenarios set forth in this document, discussed alternative sets of assumptions for each scenario, and for the preferred resources, discussed how alternative assumptions interact with baseline demand forecasts. CEC staff provided analysis to the CPUC for development of Renewable Portfolio Standard (RPS) project portfolios. The draft assumptions, scenarios, and RPS portfolios were presented at a public workshop on December 18, 2013. LTPP parties submitted written formal comments and reply comments in January, 2014, informing changes in this document. The staff of the CPUC, CEC, and CAISO recommends these assumptions and scenarios, and the related RPS portfolios, for use in resource planning studies in the 2014 Long Term Procurement Plan (LTPP) proceeding and 2014-15 CAISO Transmission Planning Process (TPP). The assumptions were crafted to serve as reasonable, transparent building blocks of the proposed scenarios. The scenarios were created to focus on key policies that will impact the long-term planning of the state’s electricity resources and infrastructure. This document was adopted for use in the 2014 LTPP proceeding (R.13-12-010) by Assigned Commissioner's Ruling.
Assumption: a statement about the future for a given load or resource. For example, future load conditions are an assumption.
Scenario: a complete set of assumptions defining a possible future world. Scenarios are driven by major factor(s) with impacts across many aspects of loads and resources. For example, a change in the energy load forecast would be considered a new scenario since the change would impact other variables including the amount of renewables and transmission needs.
Portfolio: a component of scenarios, portfolios are the mix of resources to be modeled, created as a result of applying the assumptions in a specific scenario. A high distributed generation scenario would have a different portfolio of resources than a low cost scenario. RPS portfolios refer specifically to the portfolio of supply-side renewable resources in a given scenario.
Sensitivity: a variation on a scenario where only one variable is modified to assess its impact on the overall scenario results. Removing Diablo Canyon Power Plant, while holding other assumptions constant, is an example of a sensitivity. Changing the energy load forecast would be considered a new scenario rather than a sensitivity since the change would impact other variables including the amount of renewables and transmission needs.
Load Forecast: refers to electricity demand, measured by both annual peak demand and annual energy consumption. Load forecasts are influenced by economic and demographic factors as well as retail rates.
Managed Forecast: refers to a load forecast that has been adjusted to account for the impact of programs or expectations not embedded into the original forecast. An example is adjusting the California Energy Demand Forecast to account for energy efficiency programs not yet funded but with expectations for funding and specific programs in the future.
Probabilistic Load Level: refers to the specific weather patterns assumed in the study year. For example a 1-in-10 Load Level indicates a high load event due to weather patterns expected to occur approximately once every 10 years. The probabilistic load level primarily impacts annual peak demand (and other demand characteristics, such as variability) but does not significantly impact annual energy consumption.
Resource Plans: refer to the need to build new resources or maintain existing resources from an electrical reliability perspective.
R.13-12-010 MP6/ms6
- 4 -
Bundled Plans: refer to the three large Investor Owned Utilities’ procurement plans established in compliance with AB 57 to determine upfront and reasonable procurement standards.
1.3 Background
The Long Term Procurement Plan (LTPP) proceedings were established to ensure a safe, reliable, and cost-effective electricity supply in California.1 A major component of the LTPP proceeding addresses the overall long-term need for new system reliability resources, including the adoption of system resource plans.2 These resource plans will allow the CPUC to comprehensively assess the impacts of state energy policies on the need for new resources. Based on these system resource plans, the CPUC shall consider updates to the Investor-Owned Utilities’ (IOUs) bundled procurement plans with a focus on the IOUs’ obligation to maintain electric supply procurement responsibilities on behalf of IOU customers.
The CPUC initiated the 2012 LTPP proceeding (R.12-03-014) by a Rulemaking issued on March 27, 2012.3 The Rulemaking’s stated purpose is “to continue our efforts through integration and refinement of a comprehensive set of procurement policies, practices, and procedures underlying long-term procurement plans.”4
To address the resource planning portion of the 2012 LTPP, CPUC Energy Division held public workshops and received comments from LTPP parties regarding standardized planning assumptions and scenarios to be studied in system reliability studies. On December 20, 2012, the CPUC adopted the set of
1 Pursuant to AB 57 (Stats. 2002, ch. 850, Sec 3, Effective September 24, 2002), added Pub. Util. Code § 454.5., enabling resources to resume procurement of resources. See also OIR 3/27/2012, Scoping Memo 1. 2 See Scoping Memo and Ruling of Assigned Commissioner and Administrative Law Judge, Rulemaking (R.)12-03-014, issued May 17, 2012. 3 This proceeding follows R.10-05-006, R.08-02-007, R.06-02-013, R.04-04-003, and R.01-10-024, and the rulemakings initiated by the Commission to ensure that California’s major investor-owned utilities (IOUs) resume and maintain procurement responsibilities on behalf of their customers. 4 Order Instituting Rulemaking to Integrate and Refine Procurement Policies and Consider Long-Term Procurement Plans, R.12-03-014, issued March 27, 2012, p. 1.
R.13-12-010 MP6/ms6
- 5 -
assumptions and scenarios to be used in the 2012 LTPP system reliability/operational flexibility studies.5
In 2013 as part of Track 2 of the 2012 LTPP, the CAISO and other LTPP parties conducted system operational flexibility studies based on the CPUC-adopted planning assumptions and scenarios. In September 2013, the CPUC decided to cancel Track 2 and defer these system studies to the following LTPP cycle.6 Concurrently with these activities, the CPUC considered Southern California local reliability needs in Tracks 1 and 4 of the 2012 LTPP. A Track 1 decision was issued in February 2013 7, and the CPUC expects to issue a decision in Track 4 in early 2014. Track 3 (procurement rules) of the 2012 LTPP does not directly relate to resource planning.
The CPUC anticipates taking up system and local reliability issues again with an updated set of planning assumptions and scenarios to be used in a new LTPP Rulemaking commencing in 2014. The CPUC initiated the 2014 LTPP proceeding (R.13-12-010) by a Rulemaking issued on December 19, 2013. On December 11, 2013, draft planning assumptions and scenarios were sent to parties. On December 18, 2013, CPUC Energy Division held a public workshop, and in January 2014, received comments from LTPP parties regarding the updated set of planning assumptions and scenarios to be studied in the 2014 LTPP proceeding. This document describes the updated set of planning assumptions and scenarios for use in R.13-12-010.
Because the CAISO utilizes similar planning assumptions in its annual Transmission Planning Process (TPP), there should be alignment and consistency with the planning assumptions used in CPUC planning processes. To ensure consistency between the LTPP and TPP planning assumptions, the CAISO will use the assumptions proposed in this document in the development of the draft study plan for the 2014-2015 TPP, which is expected to be issued for stakeholder comments in February 2014, and finalized in March 2014.
5 Decision Adopting Long-Term Procurement Plans Track 2 Assumptions and Scenarios, D.12-12-010. 6 Assigned Commissioner and Administrative Law Judge’s Ruling Regarding Track 2 and Track 4 Schedules, R.12-03-014, issued September 16, 2013. 7 Decision Authorizing Long-Term Procurement for Local Capacity Requirements, D.13-02-015, issued February 13, 2013.
R.13-12-010 MP6/ms6
- 6 -
1.4 History of LTPP Planning Assumptions
Since the 2006 LTPP, the CPUC has worked to improve transparency and data access, and to streamline long-term procurement planning processes. The main effort of the 2008 LTPP was the creation of the Energy Division Straw Proposal on LTPP Planning Standards. 8 The 2010 LTPP took strides towards implementing that proposal, with adjustments based on party comments. CPUC Energy Division held several workshops in the summer of 2010, and in December 2010 the 2010 LTPP Standardized Planning Assumptions were issued via a Joint Scoping Memo and Ruling.9 Following a similar process of workshops and comments in 2012, the CPUC established LTPP planning assumptions for the 2012 LTPP that build upon the last four years of planning efforts to further improve the LTPP process. 10 This document refines earlier efforts and furthermore seeks to achieve transparent and consistent assumptions and coordination for resource planning activities across the energy agencies.
2 Guiding Principles
The Guiding Principles11 for developing assumptions to be used and scenarios to be investigated in the upcoming 2014 LTPP Rulemaking build upon the 2012 LTPP:
A. Assumptions should take a realistic view of expected achievements from established policies while exploring potential impacts from possible policy changes.
B. Assumptions should reflect real-world possibilities, including the stated positions or intentions of market participants.
8 Energy Division Straw Proposal on LTPP Planning Standards, http://docs.cpuc.ca.gov/published/Graphics/103215.PDF 9 See Assigned Commissioner and Administrative Law Judge’s Joint Scoping Memo and Ruling, issued December 3, 2012, http://docs.cpuc.ca.gov/EFILE/RULC/127542.htm 10 Decision Adopting Long-Term Procurement Plans Track 2 Assumptions and Scenarios, D.12-12-010, issued December 20, 2012. 11 See Assigned Commissioner’s Ruling on Standardized Planning Assumptions, R.12-03-014, issued June 27, 2012.
R.13-12-010 MP6/ms6
- 7 -
A. Scenarios should be informed by an open and transparent process. An exception is confidential market price data, which may be reasonably submitted with publicly available engineering or market-based price data checked against confidential market price data for accuracy.
B. Scenarios should inform the transmission planning process and the analysis of flexible resource requirements to reliably integrate and deliver new resources to loads.12
C. Scenarios should be designed to form useful policy information, for example tracking greenhouse gas reduction goals, and reliability implications of existing and expected resource procurement policies.
D. Resource portfolios should be substantially unique from each other.
E. Scenarios should inform bundled procurement plan limits and positions.
F. Scenarios should be limited in number based on the policy objectives that need to be understood in the current Long Term Procurement Plan cycle.
G. Resource planners including the CPUC, CEC, and CAISO should strive to reach agreement on planning assumptions, and commit to transparent, consistent, and coordinated planning processes.
3 Planning Scope: Area & Time Frame
The following assumptions and scenarios are created specifically with regard to the loads served by and the supply resources interconnected to the CAISO-controlled transmission grid and the associated distribution systems. The LTPP planning period is established as twenty years in order to consider the major impacts of infrastructure decisions now under consideration. While
12 Scenarios used by the CAISO Transmission Planning Process must meet the requirements in Section 24.4.6.6 of the CAISO’s tariff. Scenarios developed in the LTPP process may inform the development of the CAISO’s TPP scenarios to the extent feasible under the CAISO tariff and adopted by that organization.
R.13-12-010 MP6/ms6
- 8 -
detailed planning assumptions are used to create an annual loads and resources assessment in the first period (2014-2024), more generic long-term assumptions are used in the second period (2025-2034), reflecting heightened uncertainties around future conditions. The second period is designed to inform resource choices made today as well as shape policy discussions, and not to make authorizations of need in those years. The CPUC primarily expects technical studies of system and local reliability in 2024 to inform procurement decisions. However, the CPUC does not limit itself to studying 2024 and may also consider technical studies of interim years before 2024. The CAISO’s TPP studies target several years within the first ten-year period. As such, the staff of the CPUC, CEC, and CAISO focused on developing the most reasonable set of assumptions up to year 2024. This document supersedes the previous versions of assumptions and scenarios in this proceeding.
4 Planning Assumptions
A description of assumptions is provided in this section. All values are reported in the 2014 Scenario Tool, a spreadsheet developed by CPUC staff to quantitatively present the load and resource assumptions for each of the scenarios described in this document.13
4.1 Demand-side Assumptions
4.1.1 Base, Incremental, and Managed Forecasts
Demand-side assumptions are either base forecasts or incremental to the demand forecast. Base values, such as the California Energy Demand Forecasts (CED),14 are independent forecasts without ties to any other forecast. Incremental resource projections, such as Additional Achievable Energy Efficiency15 (AAEE,
13 The 2014 Scenario Tool, version 2 will be posted to the following location: http://www.cpuc.ca.gov/PUC/energy/Procurement/LTPP/ltpp_history.htm 14 The CED: California Energy Demand 2014-2024 Forecast, http://www.energy.ca.gov/2013_energypolicy/documents/demand-forecast_CMF/LSE_and_Balancing_Authority_Forecasts/ 15 The AAEE projections: Estimates of Additional Achievable Energy Savings, Supplement to California Energy Demand 2014-2024 Forecast, http://www.energy.ca.gov/2013_energypolicy/documents/demand-forecast_CMF/Additional_Achievable_Energy_Efficiency/
R.13-12-010 MP6/ms6
- 9 -
and formerly known as Incremental Uncommitted Energy Efficiency, or IUEE), are not embedded in the base forecast, but can be used to modify the base forecast to create a net or “managed” forecast. As an example, in the CED, which is treated as a base load forecast, the CEC embeds an amount of energy efficiency representing current codes and standards and established energy efficiency programs. AAEE represents future expected energy and capacity savings from programs not yet established or funded, so AAEE is considered an incremental resource projection. Reducing the base load forecast by the AAEE incremental impacts creates a managed load forecast. Assumptions originating from other state agencies, for example the CED, will not be re-litigated in this proceeding.
4.1.2 Locational Certainty
As California chooses to meet its electricity needs with increasing proportions of demand-side management resources, such as energy efficiency and customer-sited solar photovoltaic (PV) self-generation, it becomes increasingly important to accurately forecast the locations of these demand-side impacts in order to capture the benefits of these resources. Reliability studies in transmission-constrained local areas depend on these demand-side resources providing capacity value at least within the electrical areas forecasted, and preferably at specific transmission-level busbar or substation locations if they are to offset local capacity requirements. Historically, demand-side resource projections lacked the locational certainty needed to contribute to local reliability. However, the current California Energy Demand set of forecasts, with its embedded demand-side resources and incremental AAEE projections, is moving in the direction of greater locational certainty by providing impacts at the climate zone level. The CEC defines 15 climate zones in California.16 Efforts are underway to further refine the locational certainty of all demand-side resources so that their benefit as substitutes for conventional generation can be realized in future planning cycles.
4.1.3 Load
The CEC’s 2013 Integrated Energy Policy Report (IEPR) California Energy Demand (CED) forecasts serve as the source for the “managed demand forecast,” consisting of a base load forecast coupled with several alternative Additional Achievable Energy Efficiency (AAEE) projections (see subsection on Energy Efficiency below). The CED base forecasts include three load cases, “Low”, 16 See p. 51 of http://www.energy.ca.gov/2013publications/CEC-200-2013-004/CEC-200-2013-004-V1-CMF.pdf
R.13-12-010 MP6/ms6
- 10 -
“Mid”, and “High”, each factoring in variations on economic and demographic growth, retail electricity rates, fuel prices, and other elements. Each load case also has peak demand weather variants, for example, 1-in-2 weather year and 1-in-10 weather year.
The 2013 IEPR CED forecast accounts for transportation electrification given existing state policies. Development of policies that drive higher electrification growth is underway, and may include increased penetration of electric vehicles (EVs) across all vehicle types, and accelerated rail electrification. As the impacts of such policies become more certain, future planning assumptions will consider accounting for such policies by adjusting the base load forecast (e.g., changes in load shapes and higher annual energy consumption).
The CEC adopted the CED base forecasts on December 11, 2013, and published final versions in spreadsheet format.17 The 2013 IEPR final report, published on January 23, 2013,18 based on the IEPR record and in consultation with the CPUC and the CAISO, recommends that the Mid load case (and associated peak demand weather variants) of the CED base forecasts shall be used for long-term infrastructure planning activities at the CPUC, CEC, and CAISO.
4.1.4 Energy Efficiency
Energy efficiency forecasts shall be developed from the CEC’s 2013 IEPR CED base forecasts and its supplemental Additional Achievable Energy Efficiency (AAEE) projections. Each load case of the CED base forecasts contains an embedded EE component that will be paired with an AAEE projection scenario representing additional savings. CEC staff, with input from the Demand Analysis Working Group and in consultation with CPUC staff and CAISO staff, developed the AAEE projections from the CPUC’s 2013 California Energy Efficiency Potential and Goals Study.19 The AAEE projections include five
17 See spreadsheets at http://www.energy.ca.gov/2013_energypolicy/documents/demand-forecast_CMF/LSE_and_Balancing_Authority_Forecasts/ 18 See pp. 127-130 of http://www.energy.ca.gov/2013publications/CEC-100-2013-001/CEC-100-2013-001-CMF.pdf 19 Attached to the R.13-11-005 Assigned Commissioner’s Ruling Amending Scoping Memorandum, and providing guidance on energy savings goals for program year 2015 http://docs.cpuc.ca.gov/SearchRes.aspx?DocFormat=ALL&DocID=88661908
R.13-12-010 MP6/ms6
- 11 -
savings scenarios, “Low”, “Low-Mid”, “Mid”, “High-Mid”, and “High”. In general, the lowest savings scenario includes only the EE savings most certain to materialize while the highest savings scenario includes all EE potential including aspirational goals (e.g. emerging technologies). Planning studies performed for local reliability purposes require disaggregating savings projections down to the transmission-level busbar as well as estimates of the load-shape impacts of such savings. Such studies may need to account for uncertainties regarding busbar location and load-shape impacts. Transmission and distribution loss-avoidance effects shall be accounted for.
Like the CED base forecasts, the CEC adopted the AAEE projection scenarios on December 11, 2013, and published final versions in spreadsheet format.20 During 2013, the CEC, CPUC and CAISO engaged in collaborative discussion on how to consistently account for reduced energy demand from energy efficiency in these planning and procurement processes. To that end, the 2013 IEPR final report, published on January 23, 2013,21 based on the IEPR record and in consultation with the CPUC and the CAISO, recommends using the Mid AAEE scenario for system‐wide and flexibility studies for the CPUC 2014 LTPP and CAISO 2014-15 TPP cycles. Because of the local nature of reliability needs and the difficulty of forecasting load and AAEE at specific locations and estimating their daily load‐shape impacts, using the Low-Mid AAEE scenario for local studies is more prudent at this time.
For the purposes of calculating a statewide renewable net short to develop Renewable Portfolio Standard (RPS) portfolios, that calculation must also account for energy load reductions from incremental EE for all California Publicly Owned Utilities (POUs). That amount of incremental EE is the sum of the projections of each POU’s incremental (uncommitted) EE reported by the POU on the CEC’s S-2 supply forms.22 The CEC projects 3,420 GWh of POU
20 http://www.energy.ca.gov/2013_energypolicy/documents/demand-forecast_CMF/Additional_Achievable_Energy_Efficiency/ 21 See pp. 127-130 of http://www.energy.ca.gov/2013publications/CEC-100-2013-001/CEC-100-2013-001-CMF.pdf 22 http://energyalmanac.ca.gov/electricity/s-2_supply_forms_2013/ See each POU’s Uncommitted Energy Efficiency plans in the spreadsheet section “Generation/Production” on line item 3.
R.13-12-010 MP6/ms6
- 12 -
incremental EE savings in 2022 and recommends the same assumption in 2024. This number is used to calculate the statewide renewable net short in 2024.
4.1.5 Solar Photovoltaics
The CED forecasts embed the impacts of initiatives such as the California Solar Initiative, as well as the effects of retail rates and programs such as Net Energy Metering. As such, the default projection for behind-the-meter solar PV assumes no change from what the CED forecasts embed. Besides the default projection, planning scenarios may model a low or high projection of behind-the-meter solar PV incremental to the default projection. The low incremental projection is created by subtracting the self-generation PV projection embedded in the CED “Mid” load case (mid PV projection) from the self-generation PV projection embedded in the CED “Low” load case (high PV projection). The high incremental projection is created by subtracting the self-generation PV projection embedded in the CED “Mid” load case from the projection in the CPUC’s study on the ratepayer impacts of Net Energy Metering (NEM) prepared by Energy and Environmental Economics (E3).23 The NEM study result projects total cumulative behind-the-meter PV to reach 5,573 MW of installed capacity in 2020,24 and CPUC staff linearly extrapolates this to 7,783 MW of installed capacity in 2024.
Although behind-the-meter PV is generally regarded as a demand-side resource, both the CED embedded PV and any incremental amounts will be modeled as supply resources, and modelers will adjust upward the load forecast as needed when accounting for CED embedded self-generation on the supply-side. This maintains consistency with modeling practice that treats these resources as non-dispatchable generators with both capacity value and an annual production profile. Transmission and distribution loss-avoidance effects shall be accounted for. Absent more specific locational and technology type information for a resource projection, the default shall be to allocate aggregate resource projections to substations on the basis of peak load ratios, and to model capacity value at peak (peak impact factor) and annual energy production (capacity factor) using
23 http://www.cpuc.ca.gov/PUC/energy/Solar/nem_cost_effectiveness_evaluation.htm 24 See the “Forecast” Tab in the E3 NEM Summary Public Model located at: http://www.cpuc.ca.gov/NR/rdonlyres/AD52FE7A-E283-4AB8-BCB2-87DF56D7443B/0/E3NEMSummaryTool.xlsm
R.13-12-010 MP6/ms6
- 13 -
values implied by the CED “Mid” load case embedded self-generation PV projection for each of the three major IOUs. The table below summarizes by IOU the implied peak impact factor and capacity factor.
Table 1: Small Solar PV Operational Attributes
Variable PG&E SCE SDG&E Average of all 3
IOUs
Peak impact
factor
0.47 0.47 0.47 0.47
Capacity factor 0.18 0.19 0.20 0.19
4.1.6 Combined Heat and Power
The CED forecasts embed the impacts of initiatives such as the Self-Generation Incentive Program. As such, the default projection for behind-the-meter combined heat and power (CHP) assumes no change from what the CED forecasts embed. Besides the default projection, planning scenarios may model a low or high projection of behind-the-meter CHP incremental to the default projection. ICF International conducted a policy analysis of CHP resources through 2030 and produced a report published in July 2012.25 The low incremental projection is based on a CEC analysis of the “Base” projection of on-site generation from the ICF report. The high incremental projection is based on a CEC analysis of the “High” projection of on-site generation from the ICF report.26 Note that since the projections in the ICF report are statewide, these numbers are disaggregated to planning areas for the three major IOUs using ratios derived from the CEC analysis of the “Base” and “High” projections of on-site generation from the ICF report. This results in CAISO area 2024 incremental installed capacity projections of 955 MW in the low case, and 2,405 MW in the high case.
25 See Combined Heat and Power: Policy Analysis and 2011-2030 Market Assessment – Consultant Report at http://www.energy.ca.gov/2012publications/CEC-200-2012-002/CEC-200-2012-002-REV.pdf 26 Straight-line interpolation for intervening years between the “Base” case and “High” case target years identified in the ICF report
R.13-12-010 MP6/ms6
- 14 -
Although behind-the-meter CHP is generally regarded as a demand-side resource, both the CED embedded CHP and any incremental amounts will be modeled as supply resources, and modelers will adjust upward the load forecast as needed when accounting for CED embedded self-generation on the supply-side. This maintains consistency with modeling practice that treats these resources as non-dispatchable generators with both capacity value and an annual production profile. Transmission and distribution loss-avoidance effects shall be accounted for. Absent more specific locational and technology type information for a resource projection, the default shall be to allocate aggregate resource projections to substations on the basis of peak load ratios, and to model capacity value at peak (peak impact factor) as 0.70 of installed capacity and annual energy production using a 0.80 capacity factor.
4.1.7 Demand Response
The CED forecasts embed the impacts of non-dispatchable demand response (DR) programs, in other words, those impacts are treated on the demand-side. These programs are generally non-event-based and/or tariff-based and include TOU rates, Permanent Load Shifting, and Real Time Pricing. Dispatchable DR programs, which are generally event-based price-responsive and reliability programs, are treated as supply resources.
There may be other effects that supply additional DR impacts, for example, a higher EV penetration could lead to charging models that can provide load shifting and frequency regulation by managing the charging times of an aggregate group of EVs. These speculative impacts are not accounted for at this time. Another expected future DR impact may come from defaulting residential customers to TOU rates. These impacts may be explored in the next major CEC IEPR planning cycle.
4.1.8 Energy Storage
Energy storage units shall be modeled as supply-side resources, therefore this document describes the planning assumptions for distribution-connected and customer-side storage, as well as transmission-connected storage, within the Supply-side Assumptions section.
4.1.9 Avoided Transmission and Distribution Losses
Demand-side resource projections need to account for avoided transmission and distribution losses when calculating the balance of projected supply and demand. The table below specifies factors supplied by the CEC for accounting of avoided transmission and distribution losses. The factors are multiplied by
R.13-12-010 MP6/ms6
- 15 -
demand-side resource projections to determine the avoided generation replaced by the presence of the demand-side resource.
Table 2: Factors to Account for Avoided Transmission and Distribution Losses
PG&E SCE SDG&E
Peak, distribution losses only 1.067 1.051 1.071
Peak, transmission and distribution
losses
1.097 1.076 1.096
Energy, transmission and distribution
losses
1.096 1.068 1.0709
4.2 Supply-side Assumptions
All supply-side resource assumptions are solely for planning purposes. Inclusion or exclusion of a specific project or resource in the planning cycle has no implications for existing or future contracts. To the extent a specific projected resource is not available, the analysis assumes an electrically equivalent resource will be available.
All supply-side resources should be categorized either as within a specific local area, as a generic system resource, or as out-of-state. Resources should be accounted for in terms of their most current net qualifying capacity (NQC). For purposes of constructing simple annual load and resource tables, August NQC values will be used. In the absence of a NQC, a resource’s expected NQC should be based on its expected installed capacity adjusted for the peak impact value of that technology type. To the extent that NQC accounting methodologies change in the future, those changes should be reflected in LTPPs subsequent to the current LTPP. For variable resources, methods that can forecast production based on a variety of conditions are preferred to utilizing single point or year assumptions. In addition, generation profiles of variable resources are used in the production simulation model analysis. These profiles may also be used in TPP studies to determine output levels of these resources corresponding to the load levels (peak, off-peak, partial peak, and light load base cases) of the applicable studies. The Effective Load Carrying Capability (ELCC) method of assigning capacity value to wind and solar resources is expected to become available for the next cycle of developing planning assumptions. At this time, no degradation of resource production over time is accounted for in these planning assumptions.
R.13-12-010 MP6/ms6
- 16 -
4.2.1 Existing Resources
The capacities of existing resources shall be the monthly NQC values found in the 2014 Resource Adequacy compliance year NQC list.27 The CAISO and CPUC both publish these lists annually on their respective websites.
4.2.2 Conventional Additions
The default values for conventional resource additions 50 MW or larger derive from the list of power plant siting cases maintained on the CEC website.28 The default values for conventional resource additions smaller than 50 MW derive from other databases maintained by the CEC. The CEC updates these lists several times per year. A power plant project shall be counted if it (1) has a contract, (2) has been permitted, and (3) has begun construction. A power plant project that does not meet these criteria may be counted if the staff of the agency with permitting jurisdiction expects the project to come online within the planning horizon.29
4.2.3 Combined Heat and Power
Resources identified here export electricity to the grid. The Demand-side Assumptions section discusses resources that provide on-site energy. The default projection for exporting CHP assumes no net growth. Planning scenarios that model a higher penetration of exporting CHP shall add either a low or a high incremental projection of growth. ICF International conducted a policy
27 See Resource Adequacy Compliance Materials at http://www.cpuc.ca.gov/PUC/energy/Procurement/RA/ra_compliance_materials.htm 28 http://www.energy.ca.gov/sitingcases/all_projects.html 29 The Oakley power plant project was approved by the CPUC but recently annulled by the California Court of Appeal: http://www.courts.ca.gov/opinions/documents/A138701.PDF Therefore, Oakley will not be assumed as a conventional resource addition. During the second year of the LTPP cycle, CPUC staff expects to facilitate additional studies with varying additional resource options to determine the best way to fill any need found from studies conducted during the first year of the LTPP cycle. At that time, there may be an opportunity to explore the efficacy of the Oakley power plant in meeting identified needs.
R.13-12-010 MP6/ms6
- 17 -
analysis of CHP resources through 2030 and produced a report in July 2012.30 The low incremental projection is based on a CEC analysis of the “Base” projection of exporting CHP from the ICF report. The high incremental projection is based on a CEC analysis of the “High” projection of exporting CHP from the ICF report.31 Note that since the projections in the ICF report are statewide projections, these numbers are adjusted downward by a factor of 0.8, approximately the CAISO area to statewide load ratio. This results in CAISO area 2024 installed capacity projections of 164 MW in the low case, and 1,855 MW in the high case.
Absent more specific locational and technology type information for a resource projection, the default shall be to allocate aggregate resource projections to substations on the basis of peak load ratios, and to model capacity value at peak (peak impact factor) as 0.70 of installed capacity. These resources are assumed to be dispatchable by the CAISO.
4.2.4 Energy Storage
CPUC Decision (D.)13-10-040 established a 2020 procurement target32 of 1,325 MW installed capacity of new energy storage units within the CAISO planning area. Of that amount, 700 MW shall be transmission-connected, 425 MW shall be distribution-connected, and 200 MW shall be customer-side. D.13-10-040 also allocates procurement responsibilities for these amounts to each of the three major IOUs. Storage operational after January 1, 2010 and no later than December 31, 2024 shall count towards the procurement target. The default planning assumption for new storage capacity shall account for a conservative expected contribution to grid services and reliability from the storage procurement target in D.13-10-040. No further growth in new storage capacity is assumed post 2024.
30 See Combined Heat and Power: Policy Analysis and 2011-2030 Market Assessment – Consultant Report at http://www.energy.ca.gov/2012publications/CEC-200-2012-002/CEC-200-2012-002-REV.pdf 31 Straight-line interpolation for intervening years between the “Base” case and “High” case target years identified in the ICF report 32 The Decision specifies that resources must be online by 2024 so in the planning assumptions, target amounts are reached in 2024.
R.13-12-010 MP6/ms6
- 18 -
The 50 MW that CPUC Decision (D.)13-02-015 ordered SCE to procure is subsumed within the 2020 procurement target and shall not be (double) counted elsewhere in the planning assumptions.
While all storage can provide energy services, that is, storage can charge during periods of low energy prices and discharge during periods of high energy prices, their ability to provide capacity and flexibility (load-following, ancillary services, etc.) depends on their visibility and controllability by the CAISO. Transmission-connected storage will likely interconnect to the system near transmission substations and be visible and controllable by the CAISO. Therefore, all of the 700 MW of new transmission-connected storage described above is assumed to provide capacity and flexibility as a default.
The ability of distribution-connected storage to provide capacity and flexibility carries significant uncertainty, in part because this technology is new to the market, and in part because current policy and the CAISO market does not fully support the participation of distribution-connected resources. Therefore, only 50% of the 425 MW of new distribution-connected storage described above is assumed to provide capacity and flexibility as a default. This acknowledges that greater than zero percent but less than 100% of these resources are expected to provide such services.
The ability of customer-side storage to provide capacity and flexibility carries even higher uncertainty. Not only is the market new, but customer-side storage will likely be non-dispatchable by either the CAISO or the IOUs (absent significant policy and market changes) and it is unclear how much of customer-side storage will charge from the grid or on-site generation, and according to what schedule. Therefore, none of the 200 MW of new customer-side storage described above is assumed to provide capacity and flexibility as a default.
Note that although there are limits on the amount of storage procurement assumed to provide capacity and flexibility as described above, all 1,325 MWs can provide energy services and will be modeled as such in studies involving production cost simulations. The capacity limitation described above applies to power-flow type studies conducted in the CAISO’s TPP. The table below describes the assumptions that shall be used for the technical characteristics and accounting of the three classes of storage described by D.13-10-040.
R.13-12-010 MP6/ms6
- 19 -
Table 3: Storage Operational Attributes
Values are MW in 2024
Transmission- connected
Distribution- connected
Customer- side
Total Installed Capacity
700 425 200
Amount providing capacity and flexibility
700 212.5 0
Amount with 2 hours of storage
280 170 100
Amount with 4 hours of storage
280 170 100
Amount with 6 hours of storage
140 85 0
Charging rate: If a unit is discharged and charged at the same power level, assume it takes 1.2 times as long to charge as it does to discharge. Example: 50 MW unit with 2 hours of storage. If the unit is charged at 50 MW, it will take 2.4 hours to charge. If the unit is charged at 25 MW, it will take 4.8 hours to charge.
In the CAISO’s TPP Base local area reliability studies, locations for this new storage capacity must be assumed. It is reasonable to assume that cost-effectiveness requirements for new storage capacity will lead to siting at the most effective locations to contribute to local area reliability. As the CAISO’s technical studies in the 2014-15 TPP identify transmission constraints in the local areas, the CAISO will identify the effective busses for mitigating those constraints. The storage amounts providing capacity and flexibility identified in the table above will be distributed amongst effective busses within the local areas and modeled. These bus locations are potential development sites for storage and shall inform the actual procurement to meet the storage procurement target.
The default planning assumptions accounting for the storage procurement target are admittedly conservative. For example, the assumption that half of distribution-connected storage and all of customer-side storage does not provide capacity or flexibility probably undercounts their value. The intention is to model the grid conservatively to start with in order to reveal potential reliability needs. Any revealed reliability needs will be used to inform how the storage procurement target actually gets implemented. To enable this, during the second year of the LTPP cycle, CPUC staff expects to facilitate additional studies with varying additional resource options to determine the best way to fill any need
R.13-12-010 MP6/ms6
- 20 -
found from studies conducted during the first year of the LTPP cycle. CPUC staff expects to explore two additional resource options for storage:
1. In addition to the default planning assumptions for new storage, add one or two new large-pumped hydro storage units, the exact MW amount depends on what the revealed need is. Note that according to D.13-10-040, the maximum size of pumped storage projects that count towards storage procurement target is 50 MW. Therefore if studies demonstrate that this additional resource option is the best way to fill any need, the LTPP proceeding will consider pumped storage projects larger than 50 MW in general solicitations for new capacity conducted by utilities.
2. In addition to the default planning assumptions for new storage, assume policy and market changes that enable a more complete contribution to grid services and reliability from new distribution-connected and customer-side storage. Additional storage beyond the storage procurement target may be assumed depending on what the revealed need is.
All energy storage described here is exclusive and incremental to any similar technologies that are accounted for as non-dispatchable DR (e.g. Permanent Load Shifting) embedded within the CEC’s CED forecasts.
4.2.5 Demand Response
Dispatchable demand response (generally event-based price-responsive and reliability programs) shall be accounted for as a supply-side resource. The most recent Load Impact reports33 filed with the CPUC serve as the default
assumption. The Load Impact reports are published annually on April 1. For the purpose of building load and resource tables, DR capacity shall be counted using the 1-in-2 weather year condition ex-ante forecast of August load impact, portfolio-adjusted. For system analyses that assume load based on a 1-in-2 weather year condition, DR capacity shall be counted using the 1-in-2 weather year ex-ante forecast of monthly load impact, portfolio-adjusted. For analyses that assume load based on a 1-in-10 weather year condition, DR capacity shall be counted from the 1-in-10 weather year ex-ante forecast of monthly load impact, portfolio-adjusted. Transmission and distribution loss-avoidance effects shall be accounted for. For the purpose of building detailed profiles of DR load impact in system and local area planning models, DR is assumed available at times of system stress, subject to program operating constraints but not limited to operating hours specified in Resource Adequacy accounting rules. Program operating constraints are obtained from the utilities’ Load Impact reports and tariffs for each program.34 The ex-ante load impact for each operating hour of the day, by program, is also found in the Load Impact reports. For modeling purposes, programs with operating hours beyond hour ending 18 shall be triggered at $600/MWh and all other programs shall be triggered at $1000/MWh.
In the CAISO’s TPP Base local area reliability studies, not all of the programs from the default DR capacity assumption are counted, due to uncertainty in the ability of those DR programs to mitigate first contingencies under an N-1-1 condition (as defined by NERC reliability criteria). In the 2012 LTPP Track 4, CPUC and CAISO staff settled on the subset of DR programs that are “fast response”, and located in the most effective areas for mitigating first
contingencies under an N-1-1 condition, as an acceptable assumption for local area studies. “Fast response” in the Track 4 context refers to the expectation that such DR would be able to respond in sufficiently less time than 30 minutes from the CAISO dispatch, to allow CAISO operators enough time to detect a non-response and dispatch an alternative resource if needed to mitigate a contingency. The table below identifies for each IOU the programs and capacities that meet the “fast response” criteria. DR capacity will be allocated to busbar using the method defined in D.12-12-010, or specific busbar allocations provided by the IOUs.
Table 4: DR Capacity in Local Area Reliability Studies
“Fast Response” DR Program MW in 2024 using 1-in-10 weather year ex ante impacts
PG&E SCE SDG&E
Base Interruptible 290 622 1
Agricultural Pumping Interruptible n/a 70 n/a
AC Cycling Residential 116 319 14
AC Cycling Non-Residential 2 85 4
The default planning assumptions accounting for DR capacity are admittedly conservative given CPUC expectations to restructure programs and expand capacity in the recently opened DR Rulemaking R.13-09-011. However, rather than speculate what the outcome of the DR Rulemaking might be, the default planning assumptions presume the continuation of the utilities’ existing DR programs. The intention is to model the grid conservatively to start with in order to reveal potential reliability needs. Any revealed reliability needs will be used to inform new DR program development/procurement. To enable this, during the second year of the LTPP cycle, CPUC staff expects to facilitate additional studies with varying additional resource options to determine the best way to fill any need found from studies conducted during the first year of the LTPP cycle. CPUC staff expects to explore an additional resource option that expands DR capacity such that the total DR capacity is equal to 5% of the forecasted managed 1-in-2 weather year system peak demand by 2021, and reaches 10% of the forecasted managed 1-in-2 weather year system peak demand by 2030. The expanded DR capacity shall be assumed available to hour ending 21, triggered at $600/MWh, and use limited to 20 hours per month. These parameters may be adjusted depending on the revealed need.
R.13-12-010 MP6/ms6
- 23 -
4.2.6 RPS Portfolios
Overview
The forecast of renewable resources is developed using the Renewable Portfolio Standard (RPS) Calculator. The RPS Calculator uses public data to develop portfolios of renewable resources to use for planning studies. Since a large portion of the cost associated with renewables is tied to the cost of transmission capacity needed to deliver the power to market, the RPS Calculator optimizes existing transmission and, when necessary, optimizes the use of minor upgrades to existing transmission lines as well as the use of new transmission lines. As such, when two similar resources are incorporated into the RPS Calculator, it selects the resource with access to current transmission capacity over the resource that requires new transmission capacity, thereby minimizing additional transmission cost. The RPS Calculator also incorporates four policy priority metrics: permitting (i.e. quickest on-line time), lowest cost, least environmentally harmful, and commercial interest. The weight applied to each metric, in addition to the overall renewable net short (RNS) need, impacts the make-up of a given portfolio. The portfolios created for the 2014-2015 TPP and LTPP reflect the application of a 70% weight to the Commercial Interest score and a 10% weight to the Environmental, Permitting, and Cost scores.
CPUC & CEC Collaboration
CPUC and CEC staff collaboratively developed the RPS portfolios, with the CEC providing to the CPUC its most recent IEPR CED retail sales forecast, demand side management assumptions, environmental scores, and online renewable generation, which the CPUC uses to, among other things, calculate each portfolio’s RNS. Once the RPS portfolios are created and vetted via a public stakeholder process, the CPUC and CEC jointly submit the portfolios to the CAISO for incorporation into the CAISO’s Transmission Planning Process (TPP) studies. The CAISO’s transmission modeling, which is more detailed than the modeling performed by RPS Calculator, determines what, if any, transmission improvements are needed in order to bring the projects included in the portfolios to market. The CPUC also sends to the CAISO any additional portfolios it needs to conduct LTPP specific studies.
Portfolio Selection Process
The RPS Calculator first selects resources assumed as very likely to be constructed when filling a given RNS need. Such resources are referred to, interchangeably, as the “Discounted Core” projects or “commercial” projects. For a project to be included into the Discounted Core it must meet two
R.13-12-010 MP6/ms6
- 24 -
milestones: (1) have a CPUC approved Power Purchase Agreement, and (2) have a complete (i.e. data adequate) application for a major environmental permit. Projects that do not meet these criteria are referred to as “generic” projects. These are the same criteria that were applied to the renewable resources in the 2010 LTPP RPS portfolios and the 2012-13 TPP RPS portfolios. The weights applied to each metric – Commercial Interest, Environmental, Permitting, and Cost – in addition to the given sales forecasts, demand side management assumptions, and transmission assumptions, drives a portfolio’s outcome.
For planning purposes, we assume that an existing renewable generation facility located in California that has a contract that expires before its expected retirement age remains in service until its scheduled retirement age. Such a resource does not count toward any specific Load Service Entity’s RPS, but it is nonetheless included in the calculation of the expected renewable supply and is therefore counted toward filling the RNS. Renewable resources that have a commercial online date of July 31st, or earlier, of the given year are assumed to be “existing” projects.
Two Versions of the RPS Calculator
The CPUC published two versions of the RPS Calculator: the “regular” version, which gives preference to a modest number of distributed photovoltaic generation (DG) projects near load, and a “high DG” version, which gives preference to greater number of DG projects near load.35 For the CAISO’s 2014-15 TPP, CPUC staff created a third version of the RPS calculator that models different transmission availability in the Imperial CREZ than is modeled in the “regular” version of the RPS calculator. The portfolio created with this version is referred to as a “sensitivity” of the corresponding portfolio created with the “regular” version.
In light of the continually increasing renewable technological potential and their respective cost-effectiveness, some costs and performance assumptions embedded in the calculator are now somewhat outdated, which limits the RPS Calculator’s robustness when modeling RPS targets greater than 33%. The cost and performance assumption however are being updated in a new version of the RPS Calculator. The new RPS Calculator will be vetted by stakeholders in 2014
35 The RPS Calculator may be downloaded here: http://www.cpuc.ca.gov/PUC/energy/Procurement/LTPP/ltpp_history.htm
R.13-12-010 MP6/ms6
- 25 -
and early 2015 with the expectation that it will be ready to inform the 2016-2017 LTPP planning cycle. The new RPS Calculator will be fundamentally redesigned so that resource options will be added to a portfolio based not on their individual value-vs-cost alone, but rather, on how they impact the value-vs-cost of an entire portfolio since every resource impacts this value-vs-cost relationship differently when added to, or subtracted from, the system. The new, more robust, RPS Calculator will be especially useful when considering RPS goals in excess of the current 33% target.
The Scenario Tool
For the purposes of creating a load and resource table, the Scenario Tool maintains an approximation of the capacity value (NQC value) of new RPS resources throughout the planning horizon for each of the defined planning scenarios. In order to develop this approximation, each portfolio is modeled twice: once with a 2024 RNS target year and again with a 2034 RNS target year. The NQC values produced by the 2024 RNS target year run of the Calculator are used directly by the Scenario Tool for years 2014-2024. For years 2025-2034, the difference in the amount of NQC that the RPS Calculator produces for the 2024 RNS target year versus the 2034 RNS target year is divided by 10 (the extrapolated time horizon). This incremental NQC amount is added each year from 2025-2034 in the Scenario Tool.
The table below summarizes seven different RPS portfolios that will be modeled in the different planning scenarios described later in this document.
R.13-12-010 MP6/ms6
- 26 -
Table 5: RPS Portfolio Summary
Portfolio Name Base Demand Forecast
For RNS
Demand Side Management Assumptions
Version of RPS Calculator
Study in which Portfolio Is Used **
Base Demand Forecast for Study
33% 2024 Mid AAEE *
Mid(1:2) Mid AAEE Regular TPP #1b, #1c
TPP #1d
LTPP #1, #1e
Mid(1:5) peak
Mid(1:2) 8760
Mid(1:2) 8760
33% 2024 LowMid AAEE *
Mid(1:2) LowMid AAEE
Regular TPP #1a Mid(1:10) peak
33% 2024 High Load Mid AAEE
High(1:2) Mid AAEE Regular LTPP #2 High(1:2) 8760
33% 2024 Mid AAEE (sensitivity) *
Mid(1:2) Mid AAEE Regular (sensitivity)
TPP #1c
TPP #1d
Mid(1:5) peak
Mid(1:2) 8760
High DG 33% 2024 Mid AAEE + DSM *
Mid(1:2) Mid AAEE, High Inc Sm PV, Low Inc CHP
High DG TPP #1c
TPP #1d, LTPP #5
Mid(1:5) peak
Mid(1:2) 8760
High DG 40% 2024 Mid AAEE
Mid(1:2) Mid AAEE High DG LTPP #4 Mid(1:2) 8760
High DG 40% 2024 HighMid AAEE + Higher DSM
Mid(1:2) HighMid AAEE, High Inc Sm PV, High Inc CHP
High DG LTPP #3 Mid(1:2) 8760
* These portfolios are used in the CAISO’s TPP.
** The numbering in this column refers to the Scenario numbers as described in the Scenario Matrix, see Table 5 of this document.
R.13-12-010 MP6/ms6
- 27 -
See the Appendix of this document for tables describing the makeup of the RPS portfolios by Competitive Renewable Energy Zones (CREZs) and by technology type.
4.2.7 Nuclear Retirements
Diablo Canyon Power Plant (DCPP) is assumed to have obtained renewal of licenses to continue operation beyond 2025 by default. The alternative assumption is retirement in 2023, in order to explore the impact of a loss of DCPP within the first 10 year planning horizon. These assumptions should be informed by AB 1632 (Blakeslee, Chapter 722, Statutes of 2006) seismic and related studies around the DCPP area.
4.2.8 Once-Through-Cooled Technology Retirements
The default assumption is that power plants using OTC technology (except DCPP) retire according to the current State Water Resources Control Board (SWRCB) OTC compliance schedule.
4.2.9 Renewable and Hydro Retirements
Retirements are based on facility age as a proxy for a unit reaching its operational lifetime. Operational history will not be considered in this planning cycle. A “Low” level of retirement assumes these resource types stay online unless there is an announced retirement date. A “Mid” level assumes solar and wind resources retire at age 25, other non-hydro renewable technologies retire at age 40, and hydro resources retire at age 70. A “High” level assumes solar and wind resources retire at age 20, other non-hydro renewable technologies retire at age 25, and hydro resources retire at age 50. Note that retirement assumptions based on facility age carry a wide range of uncertainty.
4.2.10 Other Retirements
Retirements are based on facility age as a proxy for a unit reaching its operational lifetime. Operational history will not be considered in this planning cycle. A “Low” level of retirement assumes “Other” resource types stay online unless there is an announced retirement date. A “Mid” level assumes retirement based on resource age of 40 years or more. A “High” level assumes retirement based on resource age of 25 years or more. Note that retirement assumptions based on facility age carry a wide range of uncertainty. “Other” includes all resources whose retirement assumptions are not explicitly described above, for example peakers and cogeneration facilities.
R.13-12-010 MP6/ms6
- 28 -
4.2.11 Imports
The default value for imports shall be based on the CAISO Available Import Capability for loads in its control area. This is equal to the CAISO Maximum Imports minus Existing Transmission Contracts (ETCs) outside its control area, and is published on its website annually. 36 In 2013 this value was 13,396 MW. For the purposes of load and resource tables, i.e. the Scenario Tool, the 13,396 MW value is used throughout the planning horizon. An alternative assumption is historical expected imports as calculated by the CEC.37 For studies requiring information about resources outside of the CAISO area, the latest Transmission Expansion Policy Planning Committee (TEPPC) data should be used, for example, either the 2022 or 2024 Common Case generation table.38
Technical studies require a more nuanced approached to accounting for imports. In the 2010 and 2012 LTPP studies the CAISO used a tool to calculate California state and CAISO area maximum imports. The tool calculates import limits for each scenario being studied based on inertia changes in the Southern California Import Transmission (SCIT) area due to increased penetration of renewable resources and retirement of generation resources with inertia. The CAISO will update the tool and use it for the LTPP studies envisioned by this document.
4.2.12 Existing Procurement Authorizations
Existing procurement authorizations of both generation and transmission assets shall be accounted for as a default planning assumption. For generation assets, prior CPUC decisions D.13-02-015 and D.13-03-029 shall be accounted for in all planning scenarios. Resources counted from D.13-03-029 include 3x100 MW GT peakers at the Pio Pico site in San Diego, plus a 10 MW net capacity increase from repowering “MMC Escondido aggregate” in San Diego. These resources are assumed online in 2016.
Resources counted from D.13-02-015 include:
36 http://www.caiso.com/Documents/2014Assigned-UnassignedRA_ImportCapability-BranchGroups-AfterStep6.pdf 37 As described in Appendix D, http://www.energy.ca.gov/2012publications/CEC-200-2012-003/CEC-200-2012-003.pdf 38 See Data/Surveys” at http://www.wecc.biz/committees/BOD/TEPPC/External/Forms/external.aspx
R.13-12-010 MP6/ms6
- 29 -
For West LA Basin: 1x900 MW CCGT, 1x100 MW GT peaker, 50 MW storage.39
For Big Creek/Ventura: 2x100 MW GT peakers.
These resources are assumed online by 2019 and are generic resources located at existing sites. The location choice is meant to facilitate modeling ease and not prejudge where these new resources may actually be sited.
At least 350 MW of preferred resources located in the West LA Basin and at least 50 MW of preferred resources located in Big Creek/Ventura are assumed to be procured as part of the authorization in D.13-02-015. However, there is high uncertainty as to what preferred resources will actually be procured. Therefore, the technical studies conducted in the first year of the LTPP cycle will not speculate on these preferred resources and not include them. In the second year of the LTPP cycle, these preferred resources will be modeled when revisiting technical studies to fill any needs. These preferred resources will be modeled first before any additional resources are considered to fill needs. The latest information from the SCE Request For Offers process to procure preferred resources shall inform how these preferred resources are modeled in the second year of the LTPP cycle.
The transmission projects approved by the CAISO Board in the 2013-14 TPP shall be included in all planning scenarios. The transmission projects approved by the CAISO Board in the 2014-15 TPP are expected to inform any analyses in the second year of the LTPP cycle (2015) on how to fill any needs.
The pending Track 4 decision from the 2012 LTPP cycle is also expected to issue an authorization to procure new resources. At this time, the decision is not final and the mix of resources to be authorized is unknown. Therefore, speculating on
39 The 50 MW storage amount is listed here for convenience, but should not be separately modeled as part of D.13-02-015 assumptions. The 50 MW storage amount is already counted under the assumption for achievement of the storage procurement target in D. 13-10-040, and should not be double counted.
R.13-12-010 MP6/ms6
- 30 -
Track 4 procurement as a planning assumption is inappropriate. However, should more definitive information about Track 4 procurement become available in the second year of the LTPP cycle, that information could be modeled when revisiting technical studies to fill any needs.
4.3 Other Assumptions
4.3.1 The Second Planning Period
The second planning period (2025-2034) will use simplified planning assumptions. Generally, these assumptions reflect extrapolation of the approaches of the first planning period.
Net (managed) load growth will be extrapolated using the average, annual compound growth rate from the prior period. Only the net load will be extrapolated (i.e. the forecast load, after demand side adjustments such as AAEE), rather than extrapolating individual load or demand assumptions. The formula for calculating the growth rate is:
1
20142024
1
2014
2024
NetLoad
NetLoadGrowthRate
where Net Load is the gross load forecast minus AAEE. This annual growth rate is then applied to the 2024 Net Load to calculate the Net Load for 2025-2034.
Resource retirements will be calculated based on resource age or other characteristic, as described for the first planning period of each scenario.
Resource Additions (except renewables) will be calculated based on Known and Planned Additions for all scenarios.
Imports will be assumed to remain constant from the 2024 value through the second planning period.
Dispatchable DR will be assumed to remain constant from the 2024 value through the second planning period.
R.13-12-010 MP6/ms6
- 31 -
Behind-the-meter PV is extrapolated beyond 2024 using a logarithmic trendline.
Behind-the-meter CHP and supply-side CHP are both held constant post 2030.
RPS resource additions listed in the Scenario Tool for years 2025-2034 will be calculated using the RPS Calculator based on the assumption of maintaining the 33% (or 40%) RPS target in 2034. First, the 2014-2024 growth rate in net statewide retail sales for the scenario is used to project net statewide retail sales in 2034. Next, the RPS Calculator is run to produce a projection of additional renewables in 2034 to maintain the RPS target. Finally, this projection in the form of NQC values is plugged into the Scenario Tool by dividing the projection into equal amounts added each year from 2025 to 2034.
4.3.2 Deliverability
Resources can be modeled as Energy-only or Deliverable. The CAISO’s TPP, for purposes of identifying needed policy-driven transmission additions, assumes that the renewable resource portfolios provided by the CPUC will require deliverability. Beyond that, however, in order to better allow for analysis of options for providing additional generic capacity, any additional resources will only be assumed Deliverable if they meet one of two criteria:
1. Fits on the existing transmission and distribution system,40 including minor upgrades,41 or new transmission approved by both California ISO and CPUC, or
2. Baseload or flexible resources.42
40 For this purpose, “fits” refers to the simple transmission assumptions listed on tab g – TxInputs of the 33% RPS Calculator. Staff shall collaborate with the California ISO to update the assumptions and to apply these assumptions to the resource portfolios. 41 Minor upgrades do not require a new right of way; other factors such as cost are not considered.
R.13-12-010 MP6/ms6
- 32 -
This assumption is only for study and planning purposes and does not prejudge any future CPUC decisions on transmission or resource approvals.
4.3.3 Price Methodologies
The same methodologies as were used in the 2012 LTPP shall be used for the 2014 LTPP.
Natural Gas
The CEC’s Natural Gas Reference Case as put forward in the 2013 IEPR shall be used as the base for calculating natural gas prices.43 This price series was constructed to be consistent in baseline assumptions with the CED forecast and therefore the two are congruent for planning purposes.
Greenhouse Gas
The Greenhouse Gas (GHG) price forecast as put forward in the 2013 IEPR Natural Gas Market Assessment: Outlook report, to be published in December 2013 by the CEC, shall be used as the base for calculating GHG prices.
Price differentiation may occur, for example, specified imports shall be subtracted from production cost modeling and accounted for, then remaining imports would be assigned annual GHG values based on an implied market heat rate or other value.
42 Flexibility currently does not have a standard definition, but a definition will be established either in this proceeding or in the Resource Adequacy proceedings (the current proceeding is R.11-10-023). Generally speaking, baseload resources are those that provide a constant power output, such as a nuclear plant while flexible resources are those that can respond to dispatch instructions. There is some overlap between these two categories, for example a baseload design combined cycle plant could provide some flexibility. 43 The Energy Commission 2013 IEPR Revised Burner-tip Price Forecast can be obtained as described here: http://www.energy.ca.gov/2013_energypolicy/documents/2013-11-19_Notice_of_Availability.pdf
R.13-12-010 MP6/ms6
- 33 -
5 Planning Scenarios
The LTPP scenarios are developed to help answer current resource planning questions before the CPUC. The critical questions facing the 2014 LTPP include the following:
1. What new resources need to be authorized and procured to ensure adequate system reliability, both for local areas and the system generally, during the planning horizon?
What is the need for flexible resources and how does that need change with different portfolios? What operational characteristics (e.g. ramp rates, regulation speeds) are needed in what quantities? Are these needs location specific?
How does increased penetration of preferred resources affect reliability?
How does the potential retirement of major resources (e.g. once-through-cooling, nuclear) change the resource needs?
How might GHG emission constraints impact portfolio design?
How can reliability needs be balanced against costs, while also creating opportunities for achieving economically efficient outcomes?
2. What mix of resources minimizes cost to customers over the planning horizon?
Is there a preferred mix of energy-only, fully deliverable resources, and demand side resources? How does this mix vary depending on the operational characteristics of the resources?
Does increased distribution-level generation reduce overall costs?
R.13-12-010 MP6/ms6
- 34 -
What synergies exist between generation and transmission resources, and between different types of supply resources that can be used to limit overall costs?
The TPP scenarios are developed for the CAISO transmission planning process, to assess the transmission system and propose transmission plans that identify cost-effective transmission additions or non-conventional alternatives over the planning horizon, based upon the following objectives:
1. Maintain reliability of the transmission system, both at the system level and in local planning areas;
2. Integrate the renewable generation in the CPUC RPS portfolios into the transmission system;
3. Perform an economic assessment of potential transmission projects.
5.1 2014 Planning Scenarios
The following scenarios were crafted through a collaborative effort amongst CPUC, CEC and CAISO staff to reflect a reasonable range of possible energy futures. A primary goal is to assess the differences in potential reliability needs for each of these scenarios, especially operational flexibility needs. The different scenarios should not speculate on what specific resources might fill any need, rather, the scenarios will establish what the needs are in each of these possible futures. Afterwards, any scenarios showing need may be restudied with various resource options to determine how to best fill any need. The analysis of each scenario will include emissions and emissions cost information, but there will be no comprehensive analysis to optimize for least cost and lowest emissions in this LTPP cycle.
Inevitably, resource limitations will likely demand prioritization of the scenarios for their use in the LTPP. The scenarios shall be studied in the following order:
1. Trajectory
2. High Load
3. Expanded Preferred Resources
4. 40% RPS in 2024
5. High DG
R.13-12-010 MP6/ms6
- 35 -
The CAISO will likely only have the resources to study 3-4 scenarios, plus 1 or 2 sensitivities, within the first year of the LTPP cycle. In the second year of the LTPP cycle, CPUC staff expects to facilitate additional studies with varying additional resource options to determine the best way to fill any need found from studies conducted during the first year of the LTPP cycle. The CAISO may restudy scenarios that had need, exploring the various additional resource options the CPUC proposed. Analyses to determine the best way to fill any need shall first consider existing procurement authorizations that were not studied in the first year of the LTPP cycle (i.e. part of 2012 LTPP Track 1 and maybe all of Track 4). If any need remains, three additional resource options may be studied, depending on the amount and nature of reliability need. The additional resource options are as follows, but are not limited to these three:
1. High DR
2. Large-pumped storage
3. Non-pumped storage
Any LTPP party may choose to conduct its own technical studies to inform the LTPP proceeding by using the Assumptions and Scenarios described in this document, replicating the CAISO’s studies, or creating their own scenarios. More weight will be given to analyses that follow the guidelines and general assumptions in this document so that results are directly comparable between studies from different parties and the CAISO.
The remainder of this section qualitatively describes the rationale for each scenario and provides additional details on the assumptions forming that scenario. The Scenario Matrix shown in the following section summarizes the assumptions that form each scenario.
5.2 Trajectory Scenario
The Trajectory scenario is the control scenario for resource and infrastructure planning, designed to reflect a modestly conservative future world with little change from existing procurement policies and little change from business as usual practices. This scenario assumes an average level of economic and demographic growth, and as such, uses the Mid load case for the 2013 IEPR CED forecast. This is paired with the Mid AAEE scenario from the 2013 IEPR CED forecast. The Trajectory scenario assumes no incremental demand-side small PV or CHP beyond what is already embedded in the 2013 IEPR CED forecast. For supply-side resources, this scenario assumes the default for conventional additions, no net growth in supply-side CHP, the default for storage and DR, a
R.13-12-010 MP6/ms6
- 36 -
commercial-interest driven RPS portfolio maintaining the 33% standard in 2024, no nuclear retirement, a low level of renewable and hydro retirement, a mid level of retirement for other resource types, the default for imports, and accounts for existing procurement authorizations.
5.2.1 TPP Application of the Trajectory Scenario
The CAISO will use the Trajectory Scenario in the transmission planning process to assess the transmission system and propose transmission plans that identify cost-effective transmission additions or non-conventional alternatives over the planning horizon. The categories of transmission additions considered by the CAISO in this process are based upon the following objectives:
1. Reliability - Maintain reliability of the transmission system (local planning areas and the bulk system);
2. Policy-driven - Integrate the renewable generation in the CPUC RPS portfolios into the transmission system;
3. Economic - Perform an economic assessment of potential transmission projects.
As illustrated in the Scenario Matrix in the following section, the various components of the TPP use different weather variants of the Mid load case from the 2013 IEPR CED forecast. Also as described above in the Planning Assumptions section of this document, the local reliability studies portion of the TPP uses the LowMid AAEE scenario instead of the Mid AAEE scenario, and it uses the “Fast response” subset of total DR capacity instead of the entire DR capacity available from all programs.
Both the Policy-driven and Economic Studies portions of the TPP will evaluate impacts from three cases, each maintaining a 33% RPS in 2024:
1. A commercial-interest driven RPS portfolio;
2. A similar commercial-interest driven RPS portfolio that includes new transmission out of the Imperial CREZ;
3. A High DG driven RPS portfolio.
5.2.2 Diablo Canyon Impact Sensitivity
This sensitivity off of the Trajectory scenario explores the potential loss of about 2,240 MW of baseload capacity from PG&E’s Diablo Canyon Power Plant
R.13-12-010 MP6/ms6
- 37 -
(DCPP), assuming it retires when its license expires in 2024 (Unit 1) and 2025 (Unit 2). The only difference between this scenario and the Trajectory scenario is the retirement of DCPP. DCPP will actually be assumed offline in 2023 to ensure it is retired within the target year of planned technical studies, 2024.
5.3 High Load Scenario
The High Load scenario explores the impact of higher than expected economic and demographic growth and therefore diverges from the Trajectory scenario by using the High load case from the 2013 IEPR CED forecast. This will model both higher peak demand and higher annual energy consumption, but the Mid AAEE scenario is still assumed here. This scenario also uses a commercial-interest driven RPS portfolio built assuming high load and maintaining the 33% standard in 2024.
5.4 High DG Scenario
This scenario explores the implications of promoting high amounts of distributed generation (DG), which may imply more aggressive pursuit of customer-sited distributed generation programs, and a shift in RPS procurement towards favoring wholesale distributed generation projects located near load pockets. This scenario diverges from the Trajectory scenario by assuming a high incremental amount of demand-side small PV and a low incremental amount of demand-side CHP beyond what is embedded in the 2013 IEPR CED forecast, and uses a High DG driven RPS portfolio maintaining the 33% standard in 2024. This scenario’s impact on the transmission system is effectively explored as part of the CAISO TPP’s Policy and Economic studies.
5.5 40% RPS in 2024 Scenario
The 40% RPS in 2024 scenario would assess the operational impacts associated with a higher RPS target post-2020. Given that the CA legislature is exploring the establishment of a higher RPS target and trends in RPS procurement indicate a possibility of overshooting 33% by 2020, this scenario would provide policymakers with data to evaluate the system impact of this increased penetration of renewables to the grid. This scenario diverges from the Trajectory scenario by using a High DG driven RPS portfolio that targets achieving a 40% standard in 2024.
R.13-12-010 MP6/ms6
- 38 -
5.6 Expanded Preferred Resources Scenario
The Expanded Preferred Resources scenario would assess the impact of broadly pursuing higher levels of preferred resources, a policy direction driven by the California Air Resources Board’s (CARB) 2050 greenhouse gas (GHG) emission reduction goals. CARB, via AB 32, seeks to reduce GHG emissions to 80% below 1990 levels by the year 2050. This scenario also explores higher levels of CHP growth because current state goals, including the AB 32 Scoping Plan, continue to promote CHP growth. This scenario diverges from the Trajectory scenario by assuming the HighMid level of AAEE, which is still consistent with the assumption of a Mid load case 2013 IEPR CED forecast. This scenario also includes a high incremental amount of demand-side small PV beyond what is embedded in the 2013 IEPR CED forecast, a high penetration of new demand and supply-side CHP, and a High DG driven RPS portfolio that targets achieving a 40% standard in 2024.
6 Scenario Matrix
The table below defines each of the assumptions for each of the scenarios.
- 39 -
Table 6: Scenario Matrix
Name Notes Priority Load AA‐EECustomer
PV
Customer
CHPExisting
Conven.
Additions
CHP
Additions
Storage
Additions
Dispatchable
DRRPS Portfolio
Nuclear
Retirement
OTC
Retirement
Renewable
+ Hydro
Retirement
Other
Retirement
Existing
Proc.
Auth.
Imports
Trajectory
Conservative expected case for
TPP and LTPP studies assuming
little change in existing policies.1 Mid(1in2) Mid IEPR IEPR NQC List Default None Default


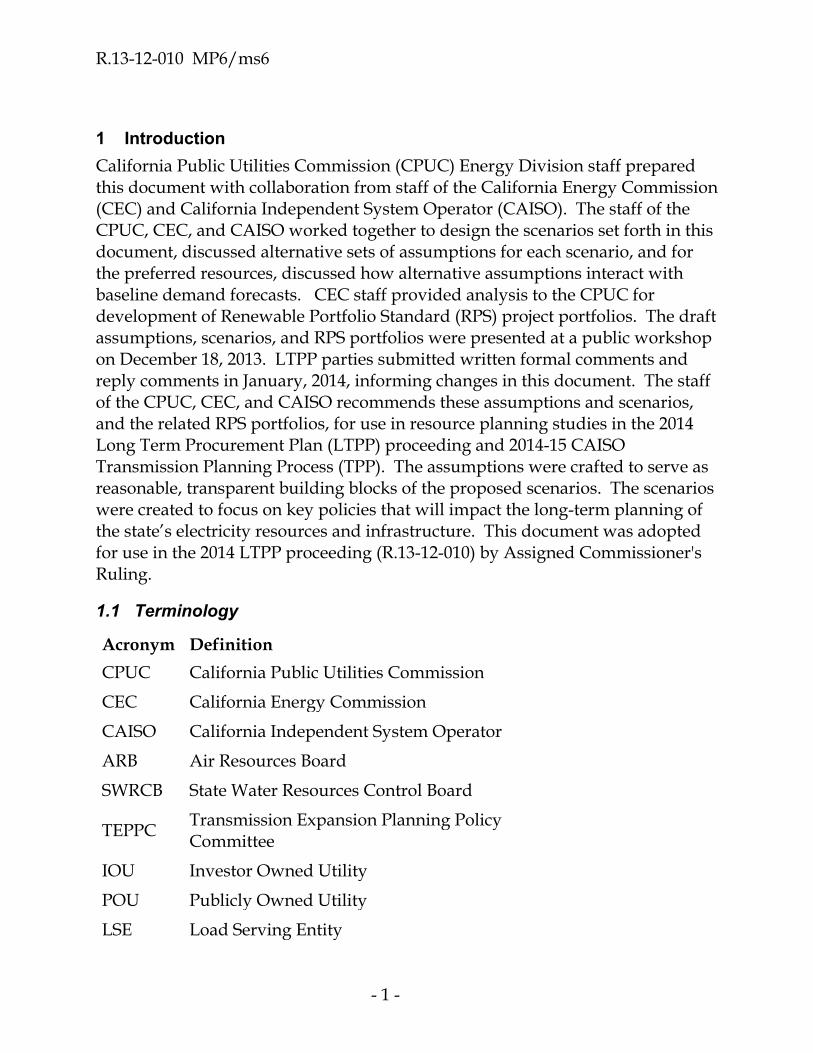
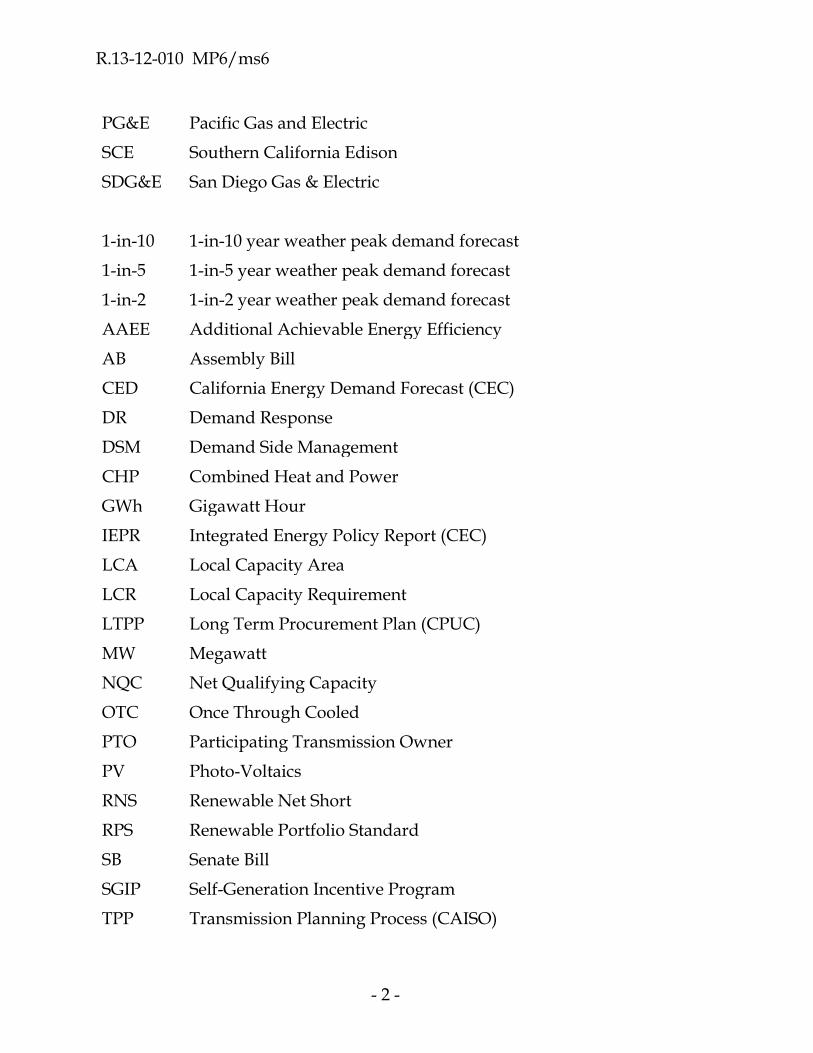


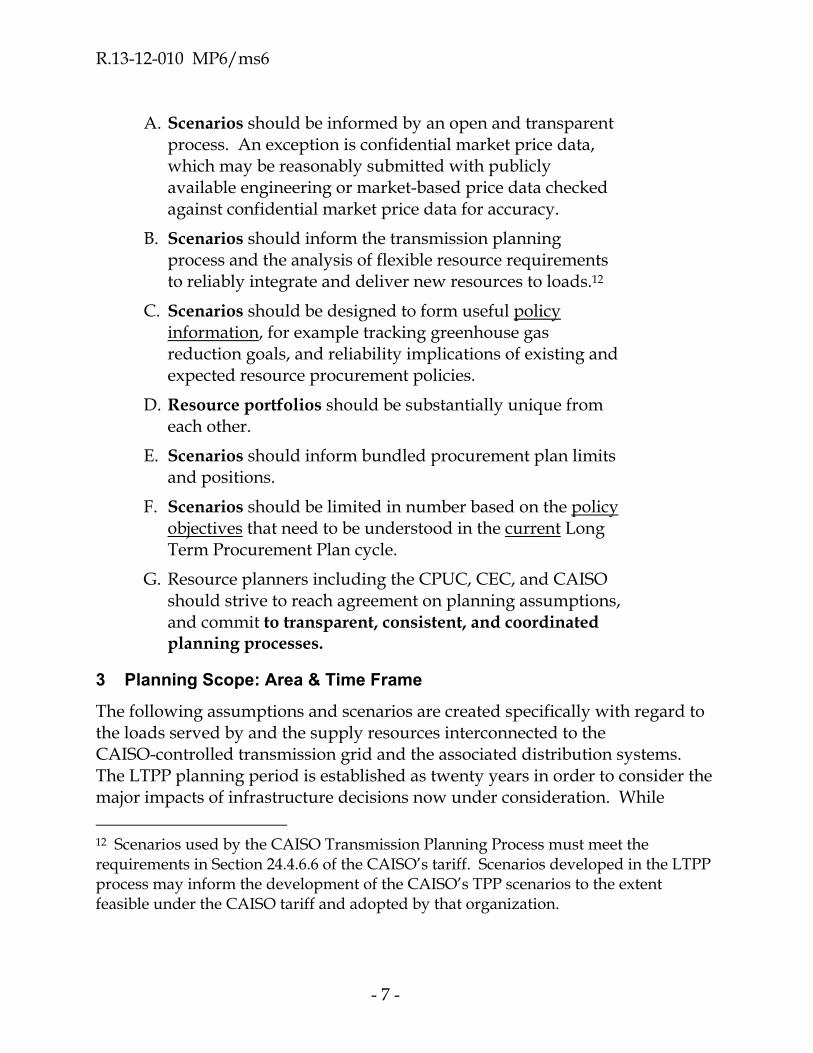


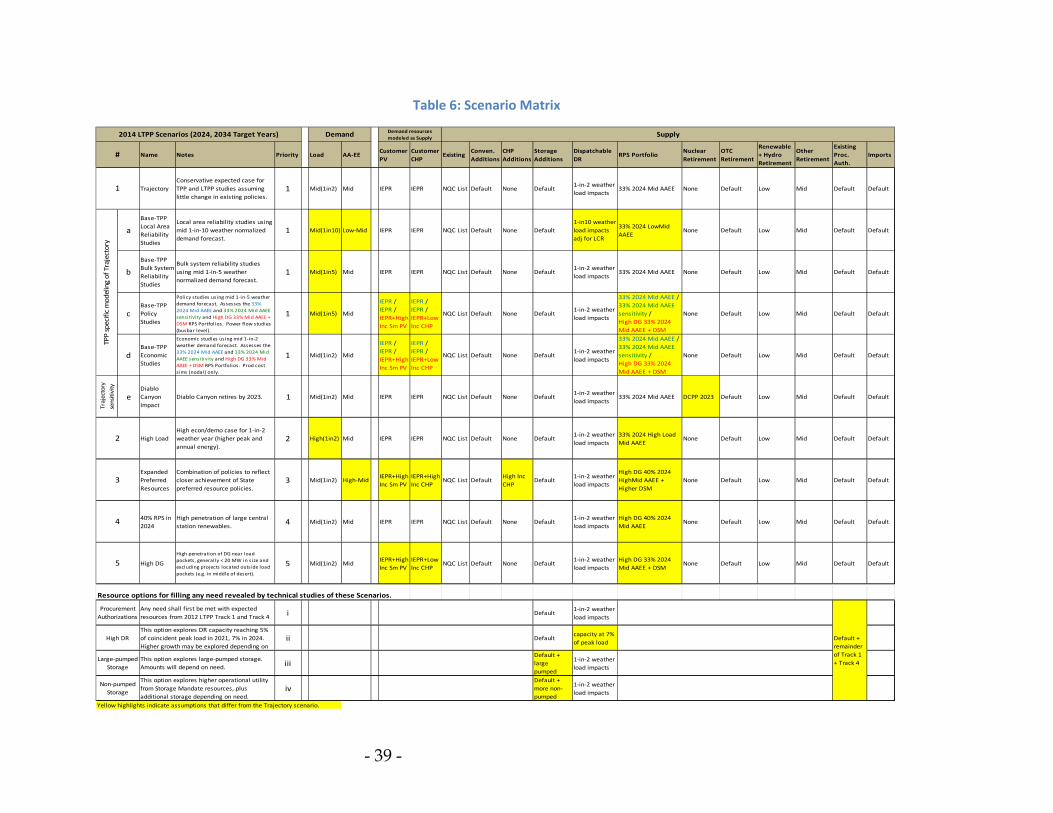
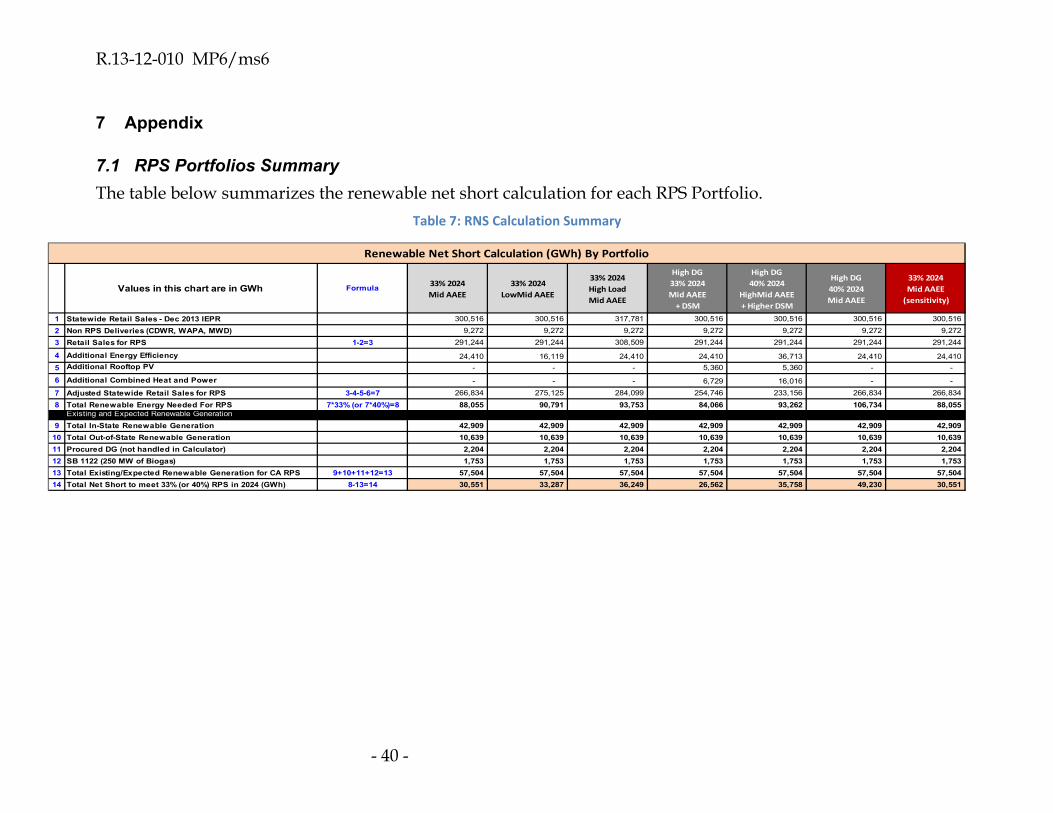

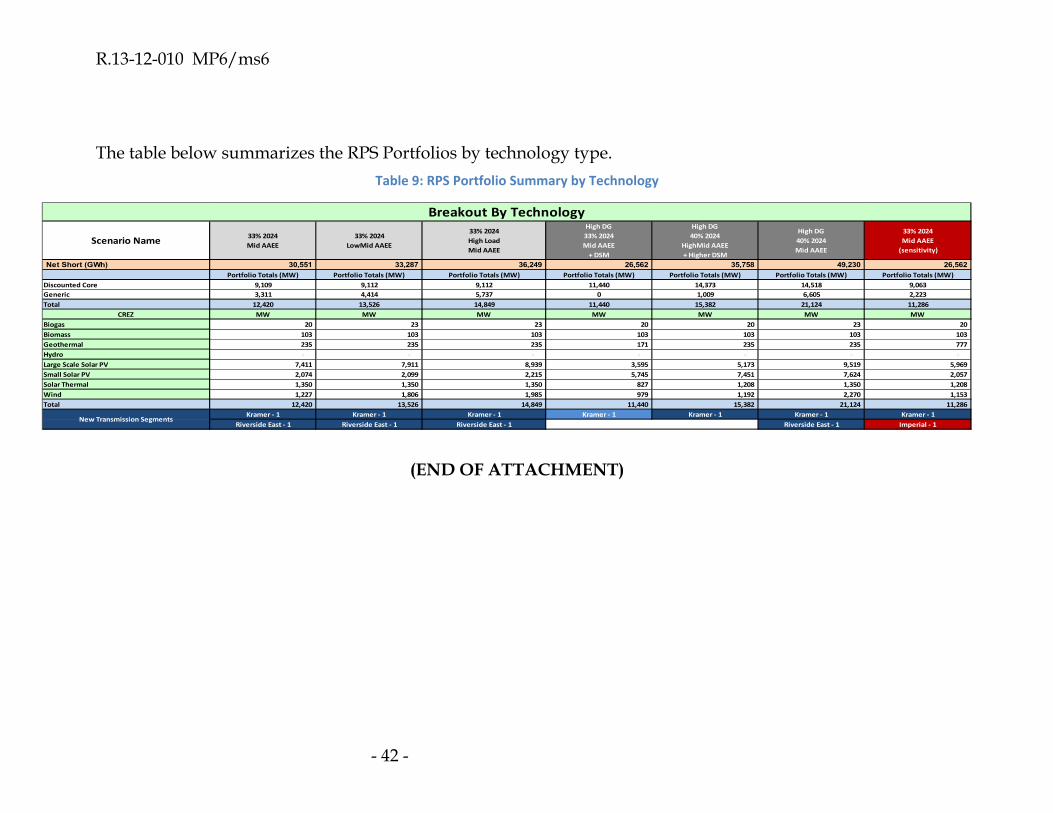


![Soft-start/quick exhaust valve MS6-SV--D-10V24 - Festo USA · en Operating instructions 8043786 1702a [8043788] Soft-start/quick exhaust valve MS6-SV-...-D-10V24](https://static.documents.pub/doc/80x56/5c2e457909d3f2ef0b8c5a19/soft-startquick-exhaust-valve-ms6-sv-d-10v24-festo-usa-en-operating-instructions.jpg)


