1 MPPT CONTROL Of STANDALONE -PV SYSTEM With BATTERY as an ENERGY STORAGE ELEMENT By ANAMIKA SINHA (111EE0235) SWASTIK SAMBIT SAHU (111EE0231) Under the supervision of Prof. ANUP KUMAR PANDA HEAD OF DEPARTMENT (ELECTRICAL ENGINEERING)
Transcript
1
MPPT CONTROL
Of
STANDALONE -PV SYSTEM
With
BATTERY as an ENERGY STORAGE ELEMENT
By
ANAMIKA SINHA (111EE0235)
SWASTIK SAMBIT SAHU (111EE0231)
Under the supervision of
Prof. ANUP KUMAR PANDA
HEAD OF DEPARTMENT (ELECTRICAL ENGINEERING)
2
ACKNOWLEDGEMENT
We would like to extend our gratitude to all people who have contributed their invaluable
time. Without them it would not have been possible for us to learn and complete the project
in time.
We would like to thank Prof. Anup Kumar Panda, Professor and Head of Department of
Electrical Engineering; our Project Supervisor, for his direction, advice, support,
encouragement and his constant presence throughout the period of the project. His concern of
the progress at all points of time, his assistance in providing hardware components, readiness
for consultation at all times and his assistance have been truly invaluable.
We would also like to thank Mr.Ramprasad Samantray and Mr.Debasish Mohapatra for
their constant help throughout the period of the project. Their guidance and suggestions have
been immensely helpful. Being patient, rectifying our mistakes and helping us reach to the
right conclusion; their help has been indispensable and we are truly grateful to them.
3
CERTIFICATE
This is to certify that the thesis entitled “MPPT Control of Standalone-PV System with
Battery as an Energy Storage Element”, submitted by Anamika Sinha (Roll. No.
111EE0235) and Swastik Sambit Sahu (Roll. No. 111EE0231) in partial fulfillment of the
requirements for the award of Bachelor of Technology in Electrical Engineering in the
session 2014-2015 at National Institute of Technology, Rourkela is a bonafide record of
research work carried out by them under my supervision and guidance. The candidates have
fulfilled all the prescribed requirements. The Thesis which is based on candidates’ own work,
have not submitted elsewhere for a degree/diploma. In my opinion, the thesis is of standard
required for the award of a bachelor of technology degree in Electrical Engineering.
Place: Rourkela
Dept. of Electrical Engineering Prof. A. K. Panda
National institute of Technology Head of Department
4
ABSTRACT
In this thesis the main focus is on using MPPT control of standalone-PV system with battery
to supply power to the loads. This implies battery is an energy storage element and it can be
used as a power source when PV is insufficient for the same. The system comprises of a
battery, PV panel and a boost converter circuit. The project consists of both software and
hardware design. The boost converter tracks the maximum power point (MPP) of the PV
panel by controlling the duty cycle and then it is given as a gate pulse to the boost converter.
The function of battery is to maintain a constant dc-link voltage. Perturbation and observation
method is used as MPPT (Maximum Power Point Tracking) control algorithm. MATLAB
SIMULINK is used to create a simulation model of the Standalone-PV system and then the
output is verified. For implementation of MPPT in hardware, a microcontroller is needed
which is a part of bigger circuit, that is solar charge controller. Solar charge controller is the
heart of hardware circuit. After verification of simulation, the whole set up is designed in
hardware and it is tested to run according to the desired parameters.
5
CONTENTS
1. INTRODUCTION
1.1 Requirement of Renewable Energy
1.2 Types Of Renewable Energy
1.2.1 Solar energy
1.2.2 Wind energy
1.2.3 Hydropower
1.2.4 Geothermal energy
1.2.5 Biomass
1.3 Recent trends in Renewable Energy
1.4 Solar Cell
1.5 Types of PV panels
1.5.1 Monocrystalline Panels
1.5.2 Polycrystalline Panels
1.5.3 Hybrid Panels
2. LITERATURE SURVEY
3. SOLAR CELL MODELLING
4. Maximum Power Point Tracking (MPPT)
4.1 MPPT techniques
4.1.1 Perturb and observe (hill climbing method)
4.1.2 Incremental conductance
4.1.3 Current sweep
4.1.4 Constant voltage
4.1.5. Fuzzy Logic Control
4.1.6 Neural Network
4.2 Algorithm of Perturbation and observation
5. WORK DONE
6. HARDWARE IMPLEMENTATION
6.1 Buck Converter
6.1.1 Buck Converter Design
6.1.2 Inductor Design
10
11
12
12
12
13
13
13
14
16
17
17
17
17
18
19
22
23
23
23
24
24
24
24
26
27
30
31
32
33
6
6.1.3 Capacitor Design
6.1.4 MOSFET Design
6.1.5 MOSFET Driver
6.2 Schematic and Working
6.3 Voltage Measurement
6.4 Current Measurement
7. RESULTS AND DISCUSSION
8. CONCLUSION
9. LIST OF REFERENCES
34
35
36
37
39
40
41
47
48
7
LIST OF FIGURES
Figure Name Page No.
Fig.1- Estimated Renewable energy share of global final energy consumption in 2012 14
Fig.2- Solar PV total capacity, 2004-2013 15
Fig.3- Solar PV capacity and additions, Top 10 countries, 2013 15
Fig.4 -Circuit diagram of PV cell 19
Fig.5-Power vs. Voltage graph of PV panel 20
Fig.6- Current vs. Voltage graph of PV panel 20
Fig.7-The Complete Setup 27
Fig.8- MATLAB Simulink file for hardware 27
Fig.9 -PV Current vs. Time 28
Fig.10 -PV Voltage vs. Time 28
Fig.11- Battery voltage vs. Time 29
Fig.12-MPP Graph-Power vs. Time 29
Fig.13 Synchronous Buck Converter 31
Fig.14- Toroidal Inductor 34
Fig.15- IRFZ44 MOSFET 35
Fig.16- Mosfet Driver IR2014 36
Fig.17- IR2014 Circuit diagram 37
Fig.18- Circuit diagram of charger circuit 37
Fig.19- Testing for gate pulse of MOSFET 41
Fig.20- Gate Pulses Traced 41
Fig.21- Testing of Buck Converter. 42
Fig.22- 50% Duty with unfiltered output 42
Fig.23- 50% Duty with Filtered output 43
Fig.24- Complete Solar Charge Controller 43
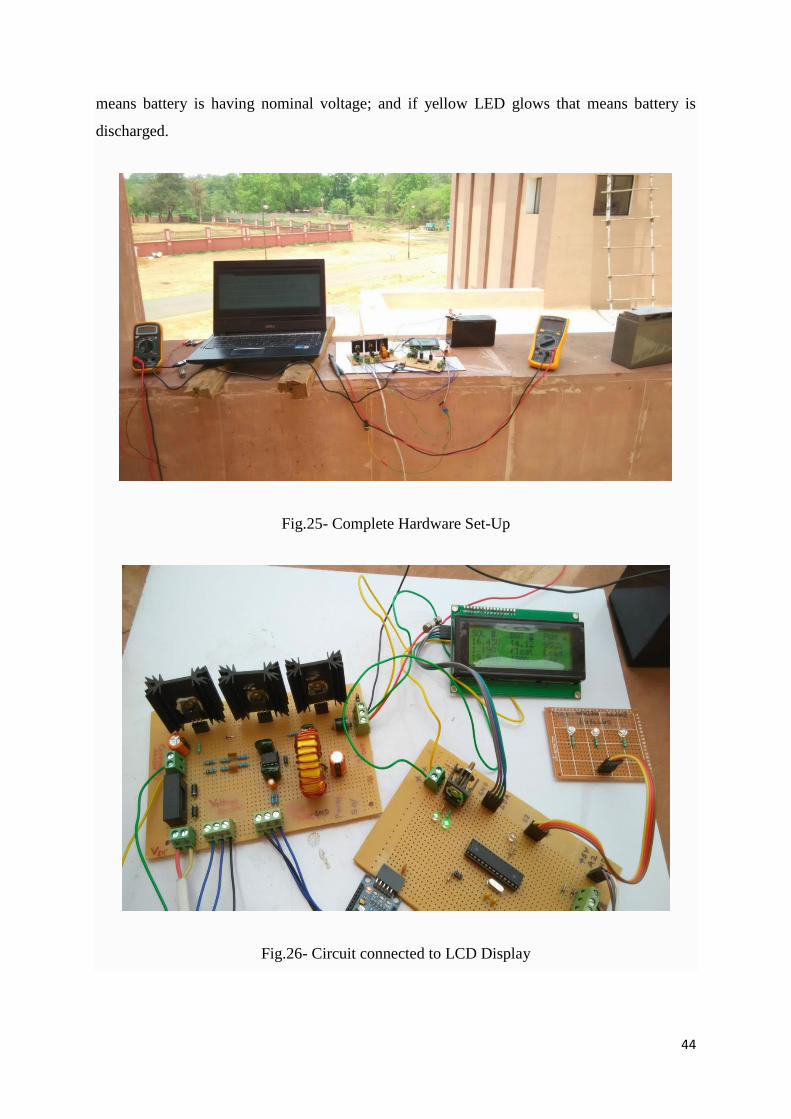
Fig.25- Complete Hardware Set-Up 44
Fig.26- Circuit connected to LCD Display 44
Fig.27- Results of Solar Panel and Battery captured in Laptop 45
Fig.28- Plotted Graphs for Captured Datas in the Laptop 45
Fig.29- Complete Hardware SET-UP in Operation 46
8
LIST OF TABLES
Table Name Page No.
TABLE 1: Different parameters of PV cell 21
TABLE 2: Different MPPT methods 25
TABLE 3: Different Hardware components 30
9
LIST OF FLOWCHARTS
Flowchart name Page no.
FLOWCHART -1: Power Signals 38
FLOWCHART -2: Control Signals 39
10
1. INTRODUCTION
Standalone-PV systems are generally used for isolated loads or household purposes [1]. The
increase in power demand in the utility side with less harmonics and fluctuation are the major
issues .The conventional sources of energy have the probability to last for limited time but
renewable sources of energy like solar energy is infinite and also eco-friendly. With the
increased efficiency of power electronics devices we can use this solar energy to provide the
power to the consumers. The only flaw of solar energy is that the set-up required is quite
expensive. The output power of PV depends on many criteria’s like insolation and
temperature. With variation in these two parameters the output is also varied, which will
thereby lead to fluctuation in the utility side, which is totally undesirable. So it is important to
have a control which will make our SOLAR-PANEL’s output totally independent of weather
conditions. Currently there are many algorithms like incremental inductance, perturbation and
observation, fuzzy logic etc. [2]-[7]. In this project we totally concentrate on the method of
PERTURBATION and OBSERVATION. This algorithm controls the duty cycle of boost
converter and it is given as gate pulse to the converter then. The battery used here is like an
energy storage element. It not only maintains dc link voltage across the capacitor constant
but also supplies to the load during bad weather conditions when PV is unable to generate the
power required by the load. A standalone PV system has many practical applications. For
household purposes it can be used for any type of loads -- linear or nonlinear. The simulation
results and the hardware design shows that STANDLONE-PV system can be efficiently used
for isolated loads.
11
1.1 Requirement of Renewable Energy
Renewable energy is the energy which can be naturally replenished. It is derived from natural
resources such as sunlight, wind, tides, waves, biomass and geothermal heat. Such resources
are inexhaustible unlike fossil fuels which are getting exhausted at an alarming rate. REN21’s
2014 report states that contribution of renewable energy sources was 19 percent in energy
consumption and 22 percent in electricity generation.
Organisations all over the globe are adopting Clean Development Mechanisms (CDMs).
Fossil fuels cause pollution too which has an adverse effect on the atmosphere. Renewable
energy sources however do not cause any emissions, which results in clean energy; one that is
not associated with effects of pollution.
Renewable energy is being rapidly adopted by countries which has resulted in significant
energy security and limiting magnitude of long term climate changes mitigating deterioration
of environment.
Market for renewable energy technologies has been growing at a steady rate and projects
based on renewable energy being undertaken by developing countries also help in poverty
reduction. Renewable energy technologies are getting cheaper because of mass production
and market competition as well as mass acceptance.
12
1.2 Types of Renewable Energy
There are different types of renewable energy resources such as
1. Solar energy
2. Wind energy
3. Hydro energy
4. Geothermal energy
5. Biomass
1.2.1 Solar energy
Solar energy is an important source of renewable energy. It is harnessed as heat and radiant
light from the sun. Solar thermal energy, used in space heating can be harnessed from solar
energy. Solar energy can also be converted to electrical energy which then can be used in a
wide variety of applications. Even though it has an additional cost of initial installation, the
long term benefits are rewarding.
Implementation of solar energy is the huge step in mitigation of global warming. Solar
energy in particular has accelerated in its adoption by countries as a source of energy
generation. It is increasingly being adopted in order to balance climate changes.
1.2.2 Wind energy
Wind power is extracted from air flow by using wind turbines. Kinetic energy in the wind can
be converted into mechanical power which can then be converted into electrical energy. Wind
turbines are used to harness wind energy. Power output of a wind turbine is directly
proportional to cube of wind velocity.
Large wind farms hold hundreds of wind turbines which are then connected to the electrical
network. Wind power, somewhat reliable, is usually used in conjunction with other sources to
give uninterrupted supply. Wind energy is clean, widely distributed and pollution free.
13
1.2.3 Hydropower
Hydropower is a form of renewable energy contained in flowing water that can be captured
and turned into electricity. Hydropower is increasingly used in the field of irrigation. Water
turbines convert the potential energy of water into electrical energy which is then used. Up to
10MW, hydropower installations are considered as renewable energy sources.
Hydroelectricity is generated by water; production of electrical power by using gravitational
force of water. The cost of hydroelectricity is comparatively low. It is conventionally
produced from dams, but can also be produced from tides and reservoirs.
1.2.4 Geothermal energy
Geothermal energy, a form of renewable energy is the thermal energy stored in the layers of
the Earth. There is a conduction of heat from the core to the surface of the earth due to
temperature difference. The heat is utilized to yield highly heated steam using it to run steam
turbines to produce electricity.
It is cost effective, sustainable, renewable, ecologically non-damaging and reliable form of
energy.
1.2.5 Biomass
Biomass is derived from plants and plant based materials and is a form of renewable energy
source. Biomass acts as a natural form of battery storing sun’s energy and yielding it
whenever required. Wood is the largest biomass energy source. Biomass is used for
electricity generation.
14
1.3 Recent Trends in Renewable Energy
Currently renewable energy resources are being adopted at a steady rate. Renewable energy
has provided an estimated 19 % of the total energy consumption of the world in the year of
2012 and has only grown since. Solar PV has expanded at a rapid rate with a growth capacity
of 55% annually for the past 4-5 years. However it is to be noted that the use of renewable
resources is still limited in comparison to the vast potential that they hold.
Fig.1- Estimated Renewable energy share of global final energy consumption in 2012
Fig.1 shows the percentage of energy share shared by different types of energy sources.
Renewable energy sources account for 19 % of total energy share.
15
Fig.2- Solar PV total capacity, 2004-2013
Fig. 2 shows the growth of PV capacity over the period 2004-2013 from 3.7 gigawatts to 139
gigawatts
Fig.3- Solar PV capacity and additions, Top 10 countries, 2013
Fig.3 shows the growth of PV capacity in year 2013 for top ten countries w.r.t to year 2012.
16
1.4 Solar Cell
A solar cell is an electrical device which converts incident light rays into electricity on the
basis of photovoltaic effect. Solar cells are used in building solar panels. Solar cells are
considered as photovoltaic even though the incident light may be sunlight or an artificial
source.
Solar modules are made of semiconductor material. Silicon crystals are the mostly used
semiconductor crystal. Manufacturing of solar cells is done by the help of high purity silicon.
Using melt and cast method silicon crystals are processed into cells and then the cast is sliced
into wafers from the ingots.
PV cell absorbs incident sunlight and creates electron hole pairs. Then separation of charge
carriers takes place and the carriers are separately extracted to external circuit.
A solar array generates solar power on the principle of photovoltaic effect. Solar cells can be
connected in series or in parallel decided by the voltage and current requirements. The
photovoltaic modules have a sheet of glass on the side that faces the sun so as to protect the
wafers even while allowing light to pass through.
The electrical energy produced from a solar panel is DC and can be used for DC loads or
stored in a battery to be used later. For homes that are connected to a utility grid, inverters
can be used to convert the DC to AC thereby running AC loads.
Modules can be connected or stringed together to make an array with a specific DC voltage
and current capacity, but MPPTs are preferred in order to obtain a higher value of efficiency.
17
1.5 Types of PV Panels
PV is not only used as standalone-systems but also in microgrids [8]. PV panels can be
differentiated on the basis of their efficiency and the amount of space taken by them, i.e.
installation size.
There are different types of PV panels available in the market such as
1. Monocrystalline Panels
2. Polycrystalline Panels
3. Hybrid Panels
1.5.1 Monocrystalline Panels
In this type, the cells are aligned in a particular direction, which means when the sun is
incident on the cells at the correct angle; they exhibit high efficiency and work best when sun
directly shining on them.
1.5.2 Polycrystalline Panels
In these panels, the individual crystals are not all perfectly aligned together which reduces
their efficiency as compared to monocrystalline panel. However, this misalignment can be a
benefitting factor because the cells work better even when light is incident from other angles.
1.5.3 Hybrid Panels
The extra amorphous layer behind the monocrystalline cells is able to extract more energy
from the incident sunlight, especially under low light conditions. They have the highest
efficiency and take up less space. These, however are more expensive than monocrystalline
and polycrystalline panels.
18
2. LITERATURE SURVEY
PV system is one of the fuming topics in the research. Many advance level works have been
done. PV has been used to supply to the grid without any energy source or even with energy
source [9]. In this case bidirectional is used as we need power flow in both directions, from
PV to the grid and even from the grid to the PV.
Many PV’s are connected in parallel in the form of generators to supply to the load. This
paper proposes a fuzzy-based frequency control method for the Photovoltaic generator in a
PV–diesel hybrid system without smoothing of PV output power fluctuations [10].
In one of the papers control strategy has been proposed for the distribution network [11]. It is
possible that faults (both temporary and permanent faults) or even transient disturbance can
occur . At that time a control mechanism is required so that PV output does not have any
effect. This paper describes the mechanism.
Another paper elaborates power control design of a battery charger for load following
applications in a Hybrid Active PV generator [12].
19
3. SOLAR CELL MODELLING
An ideal solar cell can be modelled as a current source parallel connected across a diode.
Fig.4 - Circuit diagram of PV cell
The current- voltage characteristic equation of a solar cell referred to in Fig.4 is given as-
1Ss IRn
V
AkT
q
scpphp eInInI (1)
The photocurrent depends on the solar insulation and cell’s working temperature, is given as-
1000
STTkII risccph (2)
The cell’s saturation current changes with the cell temperature and is given as
TTkA
qE
r
rscscr
gap
eT
TII
113
(3)
Where I = output current
V =voltage of the PV array
Np = number of cells connected in parallel
Ns = number of cells connected in series
S =solar irradiation level
T = temperature
20
Fig.5- Power vs. Voltage graph of PV panel
Fig.6- Current vs. Voltage graph of PV panel
The output characteristics of PV System is non-linear and it changes with INSOLATION and
TEMPERATURE. When these two factors vary, MPP point varies accordingly. With
increase in insolation the MPP shifts to right as shown in Fig.5. For higher magnitude of
voltage we get the maximum power. In Fig.6 Current Vs Voltage graph is shown. With
increase in insolation the MPP voltage increases and thereby the maximum current also
increases. For the insolation level above 300W/m2
the MPP is almost constant.
21
TABLE 1:
Table 1 shows the different parameters of PV cell along with their symbols and values .
Symbol Description Value
Iph Photocurrent
Isc Module reverse
saturation current
q Electron charge 1.602 × 10⁻¹⁹ C
A Ideality factor 1.60
k Boltzman constant 1.38 × 10⁻²³ J/K
Rs Small series resistance
Iscc Short-circuit current 3.27 A
ki Short-circuit current
temperature coefficient 1.7e-3
Tr Reference temperature
of the solar cell 301.19 K
Irsc Tr Reverse saturation
current 2.079e-6 A
Egap Silicon Bandgap
energy 1.1eV
np No. of cells
connected in parallel
ns No. of series
connected cells
S Solar radiation 0~1000 W/m2
T PV module Surface temperature 400 K
22
4. MAXIMUM POWER POINT TRACKING (MPPT)
Normally a solar panel is able to convert only 30-40% of the total incident solar irradiation
into electrical energy. Maximum Power Point Tracking (MPPT) is used to improve the
efficiency of a particular solar panel.
Maximum Power Point Tracking (MPPT) is an algorithm that is used to extract maximum
power from PV under specific conditions. Maximum power of a PV panel depends on factors
such as solar irradiation, ambient temperature and cell temperature.
Normally a PV module produces maximum power voltage at cell temperature of 25°C.
However depending on outside temperature it can fall or rise.
MPPT checks the output of a particular PV panel and after comparing it with battery voltage
decides the most efficient voltage i.e. maximum power point voltage.
The purpose of a MPPT system is applying proper resistance after sampling output of PV cell
in order to obtain maximum power.
MPPT is most effective in cooler conditions because PV module works better at cold
temperatures. It is also very effective when the battery is deeply discharged because more
current can be extracted under low charge conditions.
MPPT devices are integrated with power electronics creating an electric power converter
system in form of solar inverters which convert DC power to AC power.
23
4.1 MPPT Techniques
There are different techniques used to track the maximum power point such as:
1. Perturb and observe (hill climbing method)
2. Incremental Conductance method
3. Current sweep
4. Constant voltage
5. Fuzzy Logic Control
6. Neural network
4.1.1 Perturb and observe (hill climbing method)
Perturb and observe is one of the simplest methods due to its lower value of time complexity.
This method uses one voltage sensor which senses the PV voltage and measures power. If
power increases, the algorithm is designed to achieve constant power. However, this method
can result in oscillations of power output because the algorithm continues to perturb
recursively even after reaching MPP. This can be solve by setting an error limit to end the
recursion.
It is easy to implement and is known as hill climbing method because it depends on the rise
and fall of power vs. voltage curve with respect to maximum power point.
4.1.2 Incremental conductance
In this particular method, the controller measures incremental changes in voltage and current
in the incremental conductance method. Even though it takes more number of computations it
is better at tracking changes than perturb and observe method.
Maximum power point is calculated by comparing incremental conductance (IΔ / VΔ) with PV
array conductance (I / V). The output voltage is the voltage at which both ratios, i.e.
conductance are same. The voltage is maintained till there are changes in irradiation levels
upon which the process is repeated.
Here both voltage and current are sensed simultaneously, therefore change due to irradiance
does not cause in error. This method however is more complicated than perturb and observe
method.
24
4.1.3 Current sweep
This method helps in obtaining I-V characteristics by using a sweep waveform of the PV
array current which is updated at fixed intervals of time. MPP is calculated from the curve at
the same intervals of time.
4.1.4 Constant voltage
In this method the operating point of PV array is maintained near Maximum Power Point.
The PV array voltage is matched to a fixed reference voltage which is chosen to give optimal
performance.
4.1.5 Fuzzy Logic Control
Fuzzy logic is also used for implementing MPPT by the use of microcontrollers. Fuzzy logic
controllers are not restricted with the need of accurate models. They have a distinct advantage
of handling non linearity and imprecise inputs and have a fast rate of convergence.
A fuzzy control system operates on the principle of fuzzy logic. It studies analog input values
in context of logical variables having continuous values between zero and one.
4.1.6 Neural Network
Neural networks are also used for implementing MPPT and they are also suitable for
microcontrollers. They are a family of statistical learning algorithms used in estimation of
approximate functions. They have three layers: input, output and hidden layers which have
user dependent nodes whose number can be changed.
Input variables such as open circuit voltage and short circuit current; temperature and solar
irradiation can be used to find outputs such as duty cycle signal which in turn can be used to
find maximum power point and make the converter operate around the point.
25
TABLE 2:
Table 2 shows the different MPPT methods and compares their convergence speed and
efficiency.
26
4.2 Algorithm of Perturbation and Observation
NOTE: The change of duty cycle has to be done in the direction of MPP.
• STEP-1:
Initialize initial value, maximum value, minimum value of duty cycle and also the
increment value to increase/decrease the duty cycle.
• STEP-2:
If rate of change in power and rate of change in voltage both are negative, then duty cycle has
to be decreased else if rate of change in voltage is positive, then duty cycle has to be
increased.
• STEP-3:
If rate of change in power is positive but rate of change in voltage is negative, then duty
cycle has to be increased else if rate of change in voltage is positive, duty cycle has to be
decreased.
• STEP-4:
If the duty cycle value exceeds the maximum initialized value or is lesser than the minimum
initialized value, then the duty cycle value must not be changed and it must be same as the
previous value.
• STEP-5:
The first four steps should be repeated that means should be in for or while loop until
Maximum Power point is reached.
27
5. WORK DONE
Fig.7-The Complete Setup
Fig.7 shows the whole set up of our SIMULATION/HARDWARE .It comprises PV panel,
boost-converter and battery (as the energy storage element).Capacitor Cin is to reduce the
ripples in MPP voltage. It should be smaller in magnitude otherwise more time will be
consumed to obtain MPP.
Fig.8- MATLAB Simulink file
28
Fig.9 -PV Current vs. Time
Fig.9 represents output current of PV panel after doing a MPP control. Total number of cells
taken in simulation are 900 cells in series and 8 cells in parallel. The current first increases
but after reaching the MPP voltage it becomes constant.
Fig.10 -PV Voltage vs. Time
Fig.10 represents the output voltage of PV panel after doing a MPP control. It is also
maintained at MPP which is 450 V for the cell configuration which we have taken here.
29
Fig.11- Battery voltage vs. Time
Fig.11 represents battery voltage Vs time . If battery is charging more current is drawn from
PV and if it is discharging, less amount of current will be drawn.
Fig.12-MPP Graph-Power vs. Time
Fig.12 is the MAXIMUM POWER graph. It shows that once MPP is reached there will be
certain perturbation as actual P-V curve will tend to decrease from MPP so then the algorithm
will take its action and once perturbation occurs it will not allow further decrease of power
and the output power will remain constant. This totally depends on algorithm. The more
effective the algorithm is the better the output will be. The algorithm must be written in such
a way that if the obtained power is less than MPP, we should proceed in direction of MPP.
Once MPP is reached perturbation will occur then after that no more changes have to be done
in the code; the obtained power has to be maintained. Here MPP power is 12000 W.
30
6. HARDWARE IMPLEMENTATION
TABLE 3: Table 3 shows the hardware components used in the hardware of project.