7/27/2019 MPRA Paper 27821 http://slidepdf.com/reader/full/mpra-paper-27821 1/45 Munich Personal RePEc Archive Industrial Location in India under Liberalization Dilip Saikia Institute for Financial Management and Research 29. February 2009 Online at http://mpra.ub.uni-muenchen.de/27821/ MPRA Paper No. 27821, posted 4. January 2011 08:12 UTC
Institute for Financial Management and Research (IFMR)24 Kothari Road, Nungambakkam, Chennai, Tamil Nadu- 600034 (India)E-mail- [email protected]; [email protected]
ABSTRACT
The economic liberalization policy initiated in the country since 1991 has made large-scale delicensing of industry and changes in the industrial location policies along withthe stabilization-cum-structural adjustments of the economy. This curtailed the role of
the state as industrial owner and location regulator and increases the role of privatesector in industrialization. With the increasing dominance of private sector inindustrialization under the liberalization policy it is expected that industries will bemore spatially concentrated in the leading industrial regions. However, the neoclassical principle suggests that in the long run “divergence is followed by convergence”. This isin contrast with the theory that raises the question about the regional industrialdevelopment in India under the two policy regimes (an inward looking restrictive policyregime prior to 1980s and liberalization policy since 1991). The main objective of our study is to see whether there is convergence or divergence of industrial location and alsothe relative concentration of industries within the states in the post liberalization period, and thus, understands the influence of economic liberalization on industrial
location in India. These two objectives are examined with the employment data of organized manufacturing sector for the pre- and post-reform periods using: firstcoefficient of variation of manufacturing employment, aggregated for all industries andsecond, location quotients and specialization coefficients, disaggregated into three use-based manufacturing sectors (consumer goods, intermediate goods and capital goods).Our study finds that there is more concentration of the manufacturing industries in the post liberalization period in India and the tendency to catch up the industriallydeveloped states is hardly seen among the backward states, which suggest wideninginter-regional divergence, as against the neo-classical principle “divergence followed byconvergence”.
This paper is a part of my study during the M. Phil Programme (2008-2010) at theCentre for Development Studies (CDS), Thiruvananthapuram, Kerala- 695011. I am grateful to Prof. K. J. Joseph, Prof. P. Mohanan Pillai, Dr. U. S. Mishra and Dr.Vinoj Abraham for their valuable suggestions and advice during the preparation of thepaper. Also thankful to all the faculty members and students of the Centre forDevelopment Studies for their insightful comments and suggestions on the paper.They are not, of course, responsible for anything written here.
Despite the stagnant growth of the industrial sector over the years, the sector
continues to be an engine of growth in India. As Kuznets (1963) observed that
rapid growth in industrial productivity is an essential element in thedevelopment and structural transformation of now developed economies (cited
in Ahluwalia, 1991: 33). A similar argument is reflected in Kaldor‟s first Law,
which states that the Gross Domestic Product (DGP) growth is a function of the
manufacturing growth, which in turn is a function of the productivity growth
(Kaldor‟s second law). Various empirical studies in developing countries
including India (Chakravorty, 2003a; Lall & Chakravorty, 2005; and Deichmann
et al, 2008) show that geographical variation in industrialization is one of theprimary causes of regional inequality in India. In the literature of regional
economies several reasons are found for the existence of regional inequality:
history, natural resources, human capital, local political economy, and culture
have all been identified as contributory factors. The traditional cumulative
causation theorists argue that industrialization follows the classic “virtuous
cycle” principles: new industries locate where other industries already exist. Firms
locate in already dense industrial areas because they realize tangible benefits
from being close to other firms and to consumers, market access, thick labor
markets, available infrastructure, transportation, raw materials and resources,
agglomeration benefits, knowledge and technology spillover, externalities and
so on. Empirical evidence from many developing countries suggests that these
benefits in large cities outweigh the costs of congestion, higher wages and land
prices. Although the private industries seek to locate in this profit maximizing
locations, the location decisions of State owned industries are influenced by the
consideration of balanced regional development. However, the role of the State
as industrial owner and industrial location regulator has been substantially
curtailed under the regime of liberalization and structural reforms. Therefore,
with the increasing dominance of private sector industrialization, it is expected
that industries will be more spatially concentrated in leading industrial regions,
which will lead to higher levels of regional inequality. Conversely, the
neoclassical theory suggests that in the long run “divergence is followed by
convergence”: that is inter-regional inequality increases during the early phasesof industrial development, being concentrated in metropolitan areas, and
begins to decline at some later indeterminate point. This is in contrast with the
theory that raises the question about the regional development of the
industrialization in India under the two policy regimes, namely the in-ward
looking restrictive industrial policies (until the mid 1980s) and the liberalization
policies since the early 1990s and that of the effect of economic liberalization on
industrial location in India.
The main thrust of our study is to understand the process of industrial location
and to see how economic liberalization influences the industrial location in
India. The specific objectives of the paper are two-fold. The first objective is to
examine whether there is convergence or divergence of industries across the
Indian states in the post liberalization period. The second objective is to see
whether there is relative concentration of industries or group of industries
within the states. These two objectives are examined with the data from Indian
manufacturing industries for the period 1980-81 to 2002-03 and it is done in two
steps: first we compute the coefficient of variation of organized industrial
employment, aggregated for all industries across the Indian states for the
period 1980-81 to 2002-03. This will help us to achieve our first objective. In the
second step, we have selected 16 Indian states and computed the location
quotient and specialization coefficient, disaggregated into three use-based
manufacturing sectors (consumer goods, intermediate goods and capital goods)
at four points of time (1881-82, 1988-89, 1995-96 and 2002-03) for each of the
state to examine the concentration of industries within the states/regions. This
will help us in achieving the second objective of the paper.
The paper is organized in to seven sections. This introduction is followed by the
theoretical perspectives of industrial location. Section 3 explains the two
industrial policy regimes in India. Section 4 reviews the existing literature onindustrial location in India. Section 5 analyzes the data source and
methodology. Section 6 discusses the empirical findings. Section 7 sums up our
discussion.
2. THEORETICAL PERSPECTIVES OF INDUSTRIAL LOCATION
An understanding of the variables influencing the location of industries has
been the focus of concern within the industrial economics. Hence, it is logical tobegin the problem of industrial location from the theoretical background of
regional development and industrial location. The literature of regional
development is rich with theoretical formulation and empirical studies on the
concentration of economic activities in some particular regions. The „Classical‟
location theory that was devised by Webber in 1909 (translated into English in
1929) stated that the best location is the one where cost is minimized. Webber
put more emphasis on the transportation cost in assembling materials at the
manufacturing site and in delivering the finished products to the market,
although he recognized the influence of labour cost and the possibilities of
economies may be achieved as a result of agglomeration of several plants in
close proximity to one another. However, Webber did not include the demand
side of the product. Palander, in 1935 added market area analysis to Webber's
work. Harold Hotelling, in 1929 introduced the notion of competition in
location decisions and established the foundation of locational
interdependence. He claimed that firms would tend to locate toward the center
of the market area rather than disperse (Badri, 2007: 2). Hoover (1937)
attempted to integrate cost and demand factors into a theory to explain
industrial location in a capitalistic framework. Hoover stressed that due to
incentives that attract firms to lagging regions. Fiscal incentives have been
widely used to attract industries and stimulate the growth potential of lagging
regions. The rationale for doing so is that to attract firms, lagging regions need
to offset the costs associated with transport and logistics, weaker infrastructure,higher factor prices, and lower levels of public services and amenities..
However, empirical findings show that the magnitude of these factors varies
place to place. For example, study done by Maniet al (1997) have found positive
effects of factor prices on industrial location in India, while Head and Ries
(1996) have found no effect of factor prices on industrial location in China and
Deichmann et al. (2005) and Henderson et al (1996) have found negative effect
of factor prices on in Indonesia (Deichmann et al, 2008). Recent studies (Badri,
2007; Deichmann et al, 2005; and Lall and Chakravorty, 2003) show that- (a)
technological change and more efficient transportation have reduced the
importance of access to raw materials, (b) unionization, quality of education,
quality of life, and business climate are becoming more important and (c) taxes
and other financial incentives have little impact on choice of industrial location.
3. INDUSTRIAL POLICY REGIME IN INDIAN
India has come across two policy regimes since gaining its political
independence. The process of industrialization of the states and country as a
whole guided by an inward looking and state led command planning strategy
until the mid 1980s (Subrahmanian, 2003 and Ahluwalia, 1991). However, by
the middle eighties there has been some domestic deregulation, a movement
away from physical controls, significant rationalization and some liberalization
of trade and industrial policies1 and since the early 1990s the government opens
up the economy with the New Industrial Policy, 1991 based on pro-marker
1 However, some writers such as Ahluwalia (1991) have mentioned that this liberalizationprocess has started since the late 1970s.
industries. The importance of the public sector enterprises lies on the
establishment of industries in the backward areas, since there is lack of private
initiative in areas, which requires bulky investment and long gestation period.
Because the public sector industries are large and concentrated in the basic andcapital goods industries, they are expected to form the core of the subsequent
development and therefore, the location of the public sector enterprises have
the critical importance to bring about a better balance of industry in the
country.
The Industrial Development and Regulation (IDR) Act, 1951 was the principle
instrument for channeling the investment in the industrial sector in „socially
desired directions‟. As Ahluwalia (1991) observed, “It controlled not only entry
to an industry and expansion of capacity, but also technology and import
content”. Industrial licensing has been used increasingly for attaining the
objective of regional dispersal of industrialization by favouring the applications
by the private sector for setting up industries in backward areas. The industrial
policy 1977 decided not to be issued licenses for new industries within the
peripheries of metropolitan cities. Furthermore, the financial institutions have
also been instructed to deny finance to new industries, which do not require an
industrial license and which would like to locate in these areas. The second and
third plan emphasized on „promoting greater integration between the large
scale and small scale enterprises‟ by providing fiscal incentives and
reservations for the small-scale sector. “The period from 1967 to 1979 saw a
congealing of numerous protectionist policies towards small scale sector”
(Ahluwalia, 1991). Under the policy of backward area development
programme, the second and third plan have emphasized on the development of
infrastructure in backward areas and the promotion of small scale industries as
the main instrument for industrial development. Various incentives for
encouraging industrial growth were capital investment subsidy, transport
retrenching labour, on selling factories, and on acquiring and selling land.”
Mohan (1997) contends that the instruments of policy that were used to
influence industrial location may have been somewhat inadequate in greatly
altering the distribution of industries across the country.2
During 1980s a seriesof internal de-regulation policies were taken by the government and, then in
1991, the severe financial crisis faced by the Indian economy forced the central
government to take a drastic stabilization-cum-structural adjustments policy
measures to set industry free of excessive regulation in tune with the pro-
market reforms.
LIBERALIZED POLICY REGIMEThe economic liberalization policy initiated since 1991 has made large scale de-
licensing of industry and changes in industrial location policies along with the
stabilization-cum-structural adjustments3 of the economy. Regarding the
changes in the industrial policy, Mohan (2006) observed, “The obsolete system
of capacity licensing of industries was discontinued, the existing legislative
restrictions on the expansion of large companies were removed, phased
manufacturing programs were terminated, and the reservation of many basic
industries for investment only by the public sector was removed. At the same
time restrictions that existed on the import of foreign technology were
withdrawn, and a new regime welcoming foreign direct investment, hitherto
discouraged with limits on foreign ownership, was introduced. With this
2 Mohan (1997:313) further, observed that the fact that the older industrial states have lost someground in their hitherto dominated shares in industry itself a creditable achievement for Indian
industrial location policies.3 Stabilization involves short-term demand management through monetary and fiscal policies.The specific objectives of stabilization are: first to bring inflation under control throughrestrictive monetary policies and secondly, to correct deficit in the balance of payments usuallythrough devaluation of exchange rates accompanied by import liberalization and thirdly, tocheck fiscal deficits by curbing government spending, particularly the non-developmentalexpenditures. Structural adjustment, on the other hand, is combined with the supply side of theeconomy or raising the long-term growth through improving efficiency, productivity andcompetitiveness. (Joseph, 1987 & 1997)
massive reform introduced in one stroke in 1991, the stage was set for a policy
framework that encouraged new entry, introduced new competition, both
domestic and foreign, which thereby induced the attainment of much greater
efficiency in industry over a period of time.” The very few location restric tionsnow exist under the new policy regime. The private enterprises can now
establish industries anywhere of the country they wish without facing
restrictions, except a few environmental, pollution and other local land-use-
related restrictions and also up to a certain distance from the metropolitan
cities. The role of the central government as industrial owner and location
regulator, thus, has curtailed and the role of private sector in industrialization
has increased under the liberalization policy regime.
In a liberalized policy regime, we could have two sets of possible situations:
first, under the dominance of the private sector in industrialization, it is credible
that industrial location will be more concentrated in the already industrially
developed states leading to widening of interregional divergence. On the other
hand, the second view argues that although in the liberalized era the role of the
central government in industrialization has curtailed, the state governments
would have greater freedom and scope to attract private investment (including
foreign investment) into the state by adopting pro-active industrial policies and
practices offering attractive investments and conditioning the investment
climate market friendly for entry and operation of industries in the state, which
will provide advantage to the industrially backward states to accelerate
industrial growth through its own policies and thus, reduce inter-regional
variation in industrial disparities (Subrahmanian, 2003). However, the criticism
of the argument is that, since every state has an equal opportunity to lure
industrial investment under the liberalized policy regime, the developed states
will take the advantage of available infrastructure to attract investment and
At the same time, Lall & Chakravorty (2005) have found that new private sector
industrial investments in India are biased toward existing industrial and coastal
districts and that the structural reforms lead to increased spatial inequality inindustrialization. Awasthi (2000) in a district level survey in Gujarat also finds
that investment have flown mostly to the districts that have proximity to some
major industrial concentration with the advantage of forward and backward
linkages, or are on major trunk route or near the ports. Similarly, Subrahmanian
(2003) also finds that there has not been a major change in the ranks4 of the
states under the pro-market liberalized policies: the already developed states
continue the top rank, which implies the continuation of the earlier pattern of
the industrial development under the state-lead policy regime.
Thus, we can see that there are differences in the empirical evidence of
industrial location in India, which is mainly due to the different variables used
for the purpose of analysis. However, most of the evidence shows that although
the share of the large cities has declined and that of the secondary cities and
periphery areas increased, the already industrialized areas have continued the
dominance in the industrial development even in the post reforms period. But
these evidences are not enough to reach at a general conclusion about the
pattern and regional dispersal of industrial location in the post liberalization
period and to examine the influence of economic liberalization on industrial
location in India, since the period covered by most of these studies is prior the
year 1997-98, which is too early to realize the long term impact of liberalization.
Our study covers the period up to 2002-03.
4 This relative rank is on the basis of a composite index computed by using seven indicators tocapture the industrial development of a state. The indicators are: percentage share of factoriesin the registered factory sector, percentage share of output of registered factory sector,percentage share of employment in the registered factory sector, value added per worker in thefactory sector, per capita value added, percentage share of domestic product originating frommanufacturing sector, per capita output of each state.
The principle source of industrial statistics in India is the Annual Survey ofIndustries (ASI) conducted every year (since 1959) by the National Sample
Survey Organization (NSSO) and processed by the Central Statistical
Organization (CSO). The ASI relates to the organized or the registered sector of
manufacturing. It covers industrial units registered under the sections 2m(i)
and 2m(ii) of the Factories Act, 1948 and Bidi and Cigar establishment
registered under the Bidi and Cigar Workers (Conditions of Employment) Act,
1966. ASI collects data using two methods: a 'census' sector survey with 100%coverage of units employing 50 or more persons with the aid of power and
employing 100 or more persons with the use of power; and a 'sample' sector
survey of the smaller units employing 10 or more persons with the aid of power
and 20 or more persons without the aid of power.
In the ASI frame all the industries are classified in their appropriate National
Industrial Classification (NIC) groups on the basis of the principle product
manufactured. Until 1997-98 the ASI data was organized according to the NIC
1987 classification and then the NIC 1998 classification has followed until 2003-
04 and since then the NIC 2004 classification has been followed. For the period
1980-81 to 1997-98 we have used the ASI data published in “Annual Survey of
Industries: A Database on the Industrial Sector in India”, Economic and
Political Weekly (EPW) Research Foundation, 2003-04 (Vol. II) at the two digit
NIC 1987 code and the period 1998-99 to 2002-03 the data have been drawn at
the three digit NIC 1998 code from the same source and to arrive at a consistent
data at two digit level we have used the concordance table published by the
CSO to reclassify the data according to NIC 1998 code. However, to get certain
two-digit NIC 1987 code (say 34 and 35) we need four-digit classification of NIC
1998 code. So by using the three-digit classification for the concordance, we
may lose some information. But we assume that this lose of information is
minimal and will not affect our analysis.
Our analysis of industrial sector will focus on the organized or registered
manufacturing sector. This implies the exclusion of unorganized manufacturing
activities along with electricity, water & gas supply undertakings and repair
services units, all of which count as industry. To examine the issues of interest,
we have used the employment data of the organized manufacturing sector5 to
represent the industrial activities. The rationale of using the manufacturing
employment as the variable to represent industrial activities because of the fact
that the primary objective of inducing industrial development in the lagging
regions is to generate local employment opportunities (Paranjape, 1988) and
thus, reduce the regional imbalances in income distribution. However, as
Nagaraj (2000) has pointed out that the registered manufacturing sector
accounts only one-fifth of the industrial employment (cited in Chaudhury, 2002:
155), our study will not explain a large part of the industrial sector. This
limitation of our study should be kept in mind throughout the paper. By
employment, we use the concept of “total persons engaged” in th e ASI frame,
which includes all the workers6, persons holding supervisory or managerial
positions, engaged in purchase of raw materials etc. or purchase of fixed assets
for the factory and watch & ward staff; and all working proprietors and their
family members who are actively engaged in work of the factory even without
5 However, other variables like the gross value of output, net value added by the industries andinvestment in the industries can also be used effectively to represent the industrial activities.6 In the ASI frame workers are defined as all the persons employed directly or through anyagency whether for wages or not and engaged in any manufacturing process or in cleaning anyparts of the machinery or premises used for manufacturing process or the subject ofmanufacturing process. The number of workers and employees, in the ASI frame is an averagenumber obtained by dividing man-days worked by the number of days the factory had workedduring the reference year, where man-days represent the total number of days paid for duringthe reference year.
any pay and unpaid members of the cooperative societies who worked in or for
the factory in any direct or productive capacity.
The study covers 16 states with employment shares more than 1 percent each.The selected states are Andhra Pradesh, Assam, Bihar, Delhi, Gujarat, Haryana,
Tamil Nadu, Uttar Pradesh, and West Bangle. For the purpose of a comparative
analysis of the pre- and post liberalization periods we have considered four
points of time covering both the period: 1881-82, 1988-89, 1995-96 and 2002-03.
DATA AGGREGATIONThe ASI data were reported at the 2-digit NIC code. The ASI data, which are
reported in NIC 2-digit codes, were further aggregated following the use-based
classification7 as suggested by Ahluwalia (1991) in order to make our analysis
easier and simple. As Ahluwalia pointed out, “Use-based classification not only
constitutes economically meaningful groups which have interest from the point
of view, but they also have a practical advantage because of the smaller noise
element in the data.” Under the use-based classification the manufacturing
sector has been divided into in to capital goods, intermediate goods, consumer
durables and consumer non-durables (Ahluwalia, 1991: 55).8 However, a major
problem of the use-based classification is that even 3 digit NIC product groups
are not fine enough in quite a few cases to enable on to precisely classify them
(Chaudhury, 2002). Constrained by this, we have merged the consumer
7 However, the manufacturing sector can also be classified in to input-based classification also.Under the input-based classification, the manufacturing sector is classified into agro- based,metal-based and chemical-based subgroups, depending on the source of raw materials.8 This use-based classification is somewhat different from the traditional use-basedclassification of the industries, which has an additional use-base sector: basic goods (Ahluwalia,1991: 55). The exercise done by Ahluwalia on the use-based classification of manufacturingindustries is similar to the one followed by the Reserve Bank of India in which the band (andnow the CSO also) prepares composite indices of the industrial production. (Ahluwalia, 1991:56)
durables and non-durables into one group. The use-based classification of
industries at the two-digit level is not precise one and we may lose some
information for this. But, we assume that this lose of information is minimal
and will not affect our analysis. The analysis has carried out for all the threeindustry sectors identified here for analysis. The use-based classification of the
manufacturing industries followed in our analysis as per the NIC 1987
classification is given in Appendix 1.
PROBLEMS WITH THE ASI DATA
Some of the limitations of ASI data are worth noting. Firstly, since the definition
of industry was set by the Factories Act, certain types of establishments such assoftware manufacturers and everything in the service sector, are not covered by
the ASI. Secondly, the ASI covers only the organized sector of India's industrial
economy. The number of employees covered, for instance, is less than ten
million, which clearly is a far lower number than the true size of the population
engaged in formal and informal industrial activity (Lall and Chakravorty, 2005).
Thirdly, the survey data are naturally subject to the problem of variation in
response and therefore in coverage (Ahluwalia, 1991: 201). Fourthly,
establishment under the control of the Defense Ministry, Oil Storage and
distribution units, restaurants and cafes, and technical teaching institutions not
providing anything for sale or exchange were kept outside the coverage.
5.2 METHODOLOGY
The technique of analysis used in this paper is simple economic-base type of
analysis, such as estimation of coefficient of variations, location quotients and
specialization coefficients for each of the States that have been identified as
regions for the purpose of this paper. The estimates are based on employment
statistics for the organized manufacturing sector.
ik e Employment in the ith industry of the kth region (i=1,2…n; k=1,2…m)
k
E Total employment in the kth region of all industries;
n
i
ik k e E 1
i
E Total employment in the ith industry of all the regions;
m
k
ik i e E 1
E Total employment in the regions,
n
i
m
k
ik e E 1 1
The value of lik connotes that, if 10 lik then less than proportionate share of
ith industry is in kth region and if 1lik then, more than proportionate share of
industry ith is in kth region. For example, if 1lik , it means that the regions
share of the particular industry/sector is equal to its share of all industries and
3lik means that the regions share of that industry/sector is three times its
share of all industries (Lall and Chakravorty, 2005).
The location quotient, which indicates the industries that are concentrated, or
otherwise, in a region, would provide the basis for a qualitative judgment about
the “structural base” of the region's industrial economy. Given the sets or
blocks of interrelated industries it is possible by using location quotient analysis
to identify one or more sets of interrelated industries in which a region
specializes. The industries for which 1 Iij , may be taken as constituting an
interrelated set or block of industries and one or more such sets or blocks ofindustries located in a region may be defined as the “industrial base” of the
region (Alagh, Subrahmanian and Kashyap, 1971) and the industries with low
location quotients are relatively non-concentrated.
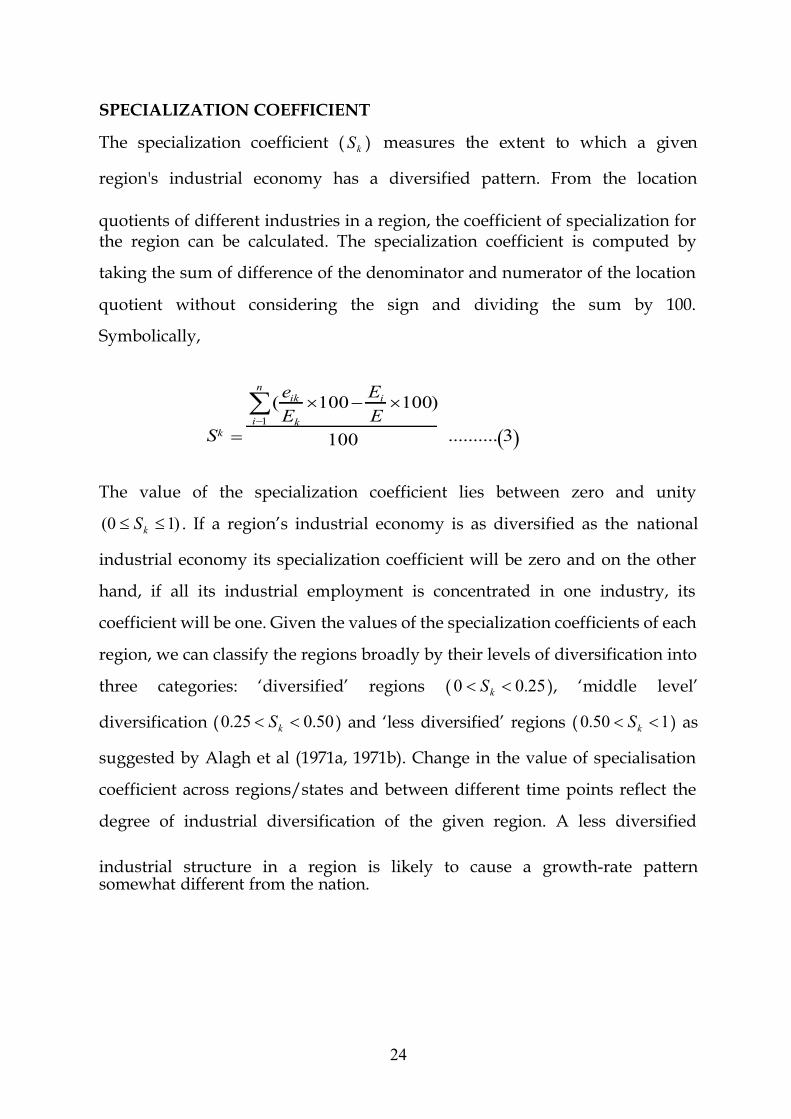
region's industrial economy has a diversified pattern. From the location
quotients of different industries in a region, the coefficient of specialization forthe region can be calculated. The specialization coefficient is computed by
taking the sum of difference of the denominator and numerator of the location
quotient without considering the sign and dividing the sum by 100.
Symbolically,
The value of the specialization coefficient lies between zero and unity
)10( k S . If a region‟s industrial economy is as diversified as the national
industrial economy its specialization coefficient will be zero and on the other
hand, if all its industrial employment is concentrated in one industry, its
coefficient will be one. Given the values of the specialization coefficients of each
region, we can classify the regions broadly by their levels of diversification into
three categories: „diversified‟ regions ( 25.00 k S ), „middle level‟
diversification ( 50.025.0 k S ) and „less diversified‟ regions ( 150.0 k S ) as
suggested by Alagh et al (1971a, 1971b). Change in the value of specialisation
coefficient across regions/states and between different time points reflect the
degree of industrial diversification of the given region. A less diversified
industrial structure in a region is likely to cause a growth-rate patternsomewhat different from the nation.
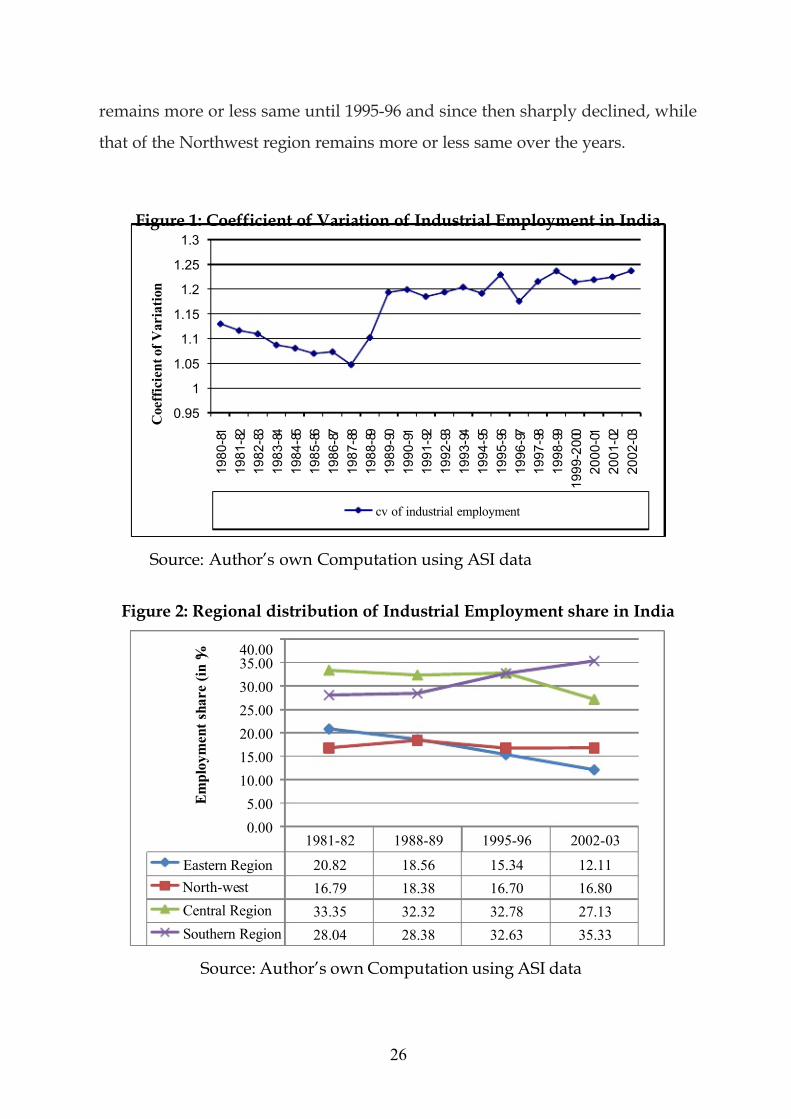
6.1 INTER-REGIONAL INEQUALITY IN INDUSTRIAL LOCATION
We begin our analysis by attempting an assessment of the concentration of
regional distribution of the industries by using coefficient of variation (CV) ofthe organized manufacturing industry sector employment in India for the
period 1980-81 to 2002-03. Figure.1 shows the CV of industrial employment in
India over the years. It is obvious from the figure that there was successive
decline in the CV between 1980-81 and 1987-88, which implies that some de-
concentration in the regional distribution of industries was taken between this
period. However, between 1987-88 and 1989-90 there was an increase in the CV
from 1.05 in 1987-88 to 1.2 in 1989-90 and since then it continues to remain moreor less same up to 1994-95. Further, the year 1995-96 again witnessed a steep
increase in the CV followed by a significant decline in the next year (1997-98)
and then continues to increase. Thus, there was a convergence in the
distribution of Indian manufacturing industries between the period 1980-81 to
1987-88 and then a sharp divergence has taken place in the previous two years
liberalization and since then it continues to diverse over the year (except a
decline in 1996-97), which implies that in the post liberalization period the
manufacturing industries are more concentrated in some regions and other
regions are lagging behind.
This is quite understandable by looking at the inter-regional distribution of
manufacturing employment. Figure.2 and Table.1 reports the percentage share
of the regions and states in organized sector manufacturing employment at four
time points. It is obvious that the Southern region has gained employment
shares over the years (increased to 35.3% in 2002-03 from 28% in 1980-81), while
the Eastern region has considerably lost their share (declined to about 12% from
20.82% during the same period). The employment share of the Central region
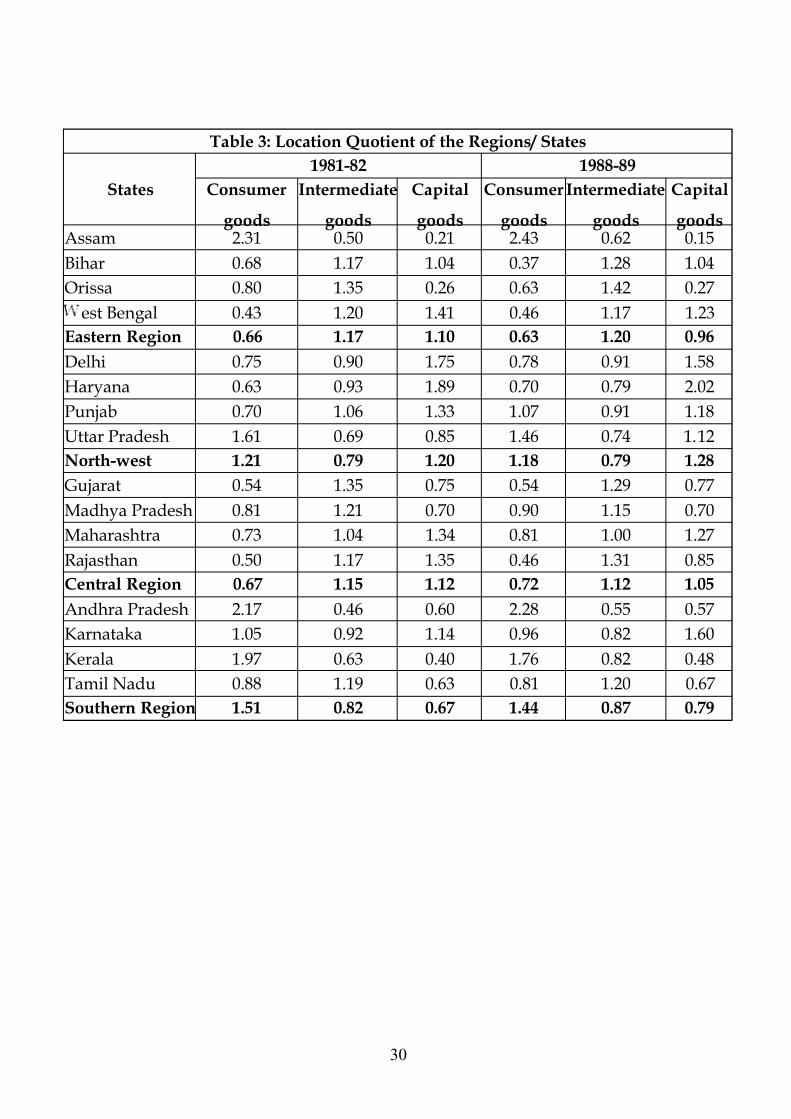
To explain the relative regional concentration of industries we have calculated
the location quotient for each of the sixteen sates and four regions using the
employment data of the manufacturing industries, the result of which is givenin Table.3. The concept of “industrial base” will be helpful at this stage to
understand the structure of regional distribution of industries and also for
inter-regional comparison of the industrial location pattern. To start with, it is
obvious that the industrial base of the Southern regions consists of a set of
consumer good industries in both the pre and post liberalization period, while
that of the Eastern region consists of a set of resource based intermediate goods
industries. Although the Eastern region had some base in capital goodsindustries in 1981-82, it lost its base, in 1988-89. The Northwest region‟s
industrial base mainly consists a set of consumer goods (but, lost its base in
2002-03) and capital goods in both the pre and post liberalization periods, while
the industrial base of the Central region comprises of a set of intermediate
goods and capital goods industries in both the period.
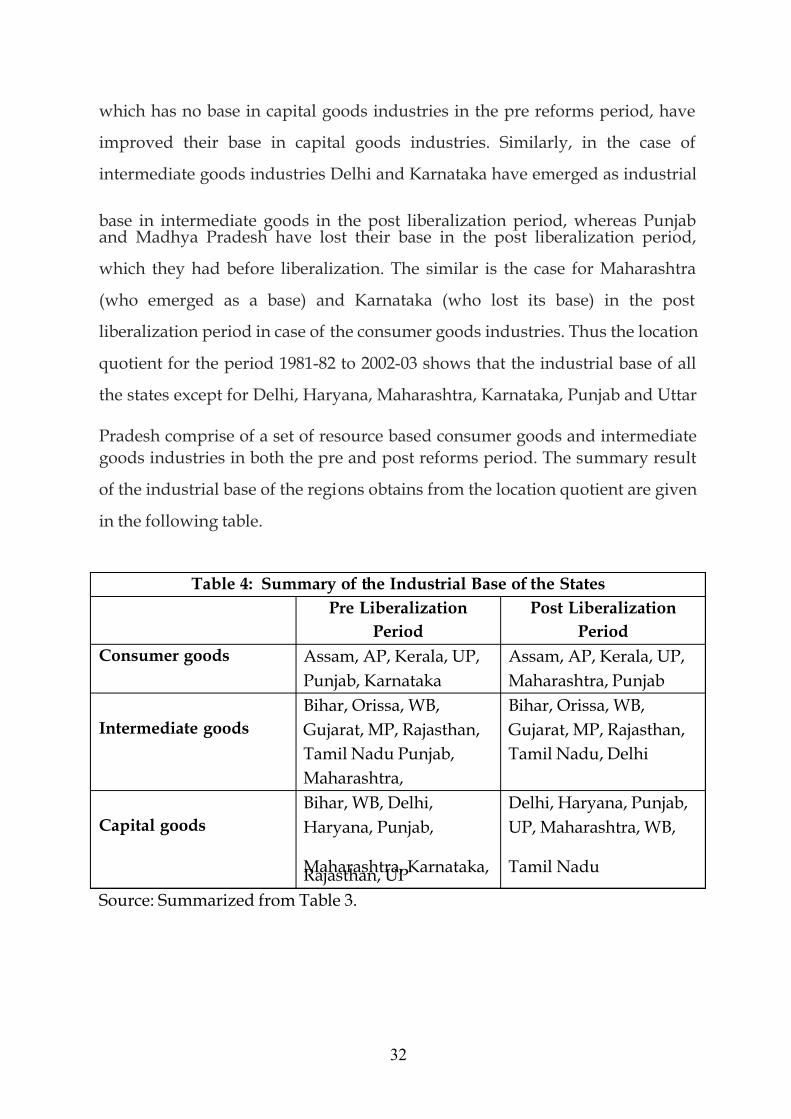
At the state level, it is found that for all the states except Delhi, Haryana, Uttar
Pradesh, Maharashtra, Karnataka and Punjab the industrial base mainly consist
of a set of demand driven consumer goods and resource based intermediate
goods industries. For example, the industrial base of the states like Assam,
Andhra Pradesh and Kerala comprise of a set of consumer goods industries in
both the pre and post liberalization periods. Similarly, the industrial base of
Bihar, Orissa, West Bengal, Gujarat, Madhya Pradesh, Rajasthan and Tamil
Nadu comprise of a set of intermediate goods industries in both the pre and
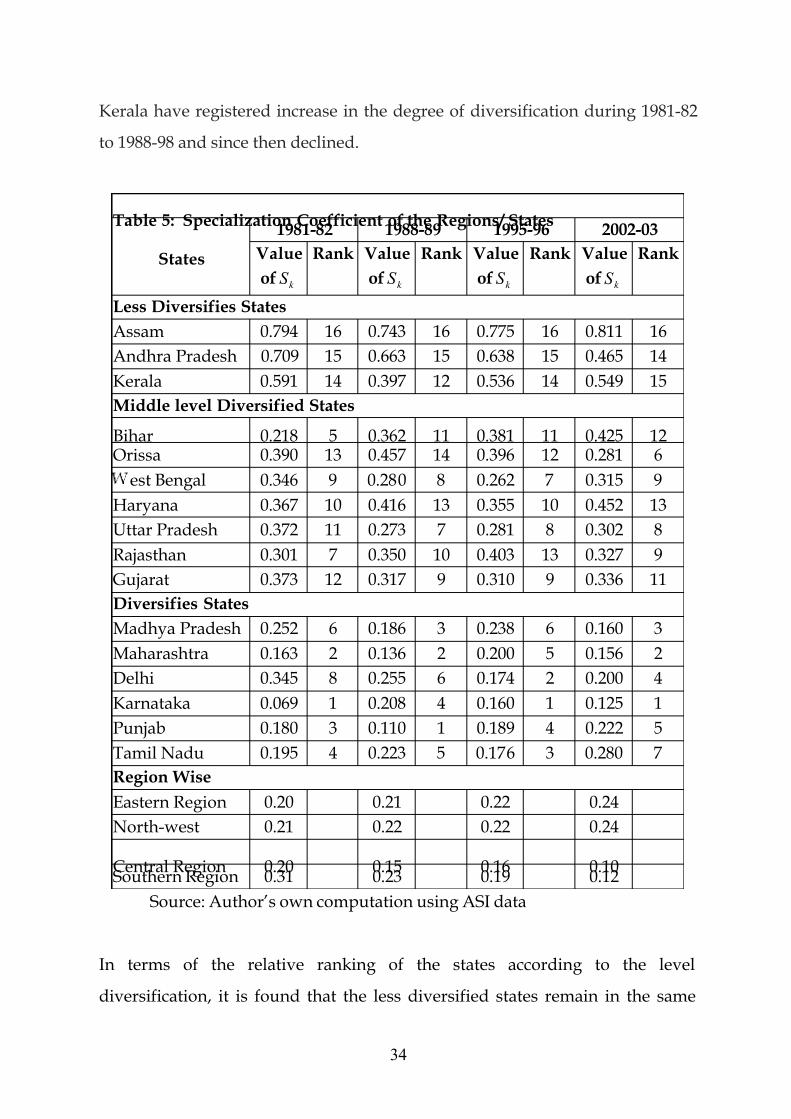
To examine whether the overall industrial system of the states-regions has a
concentrated or diversified pattern, we computed the specialization coefficient
)( k
S
, the result of which are given in Table. 5. Considering the four regions foranalysis, it is found that the specialization coefficient for the Eastern and
Northwest regions have increased, while that of the Central and the Southern
regions have declined over the years, which implies that in the Eastern and
Northwest regions concentration has increased and the Central and Southern
regions have more diversified over the years. Now, classifying the regions into
three broad groups according to their levels of diversification, it is found that
Delhi, Karnataka, Madhya Pradesh, Maharashtra, Punjab, and Tamil Nadu are
the diversified states, whereas Bihar, West Bengal, Orissa, Haryana, Uttar
Pradesh, Gujarat, and Rajasthan could be grouped in the middle level of
diversification; and Assam, Andhra Pradesh and Kerala are the less diversified
states.
Considering the changes in the diversification of industries that took place
during the period 1981-82 to 2002-03, it is observed that among the diversified
states Punjab and Tamil Nadu have registered a decrease in the degree of
diversification, while Karnataka, Delhi and Madhya Pradesh have shown some
increase in the degree of diversification and Maharashtra showed no change
over the years. In the middle level category, while on the one hand, West
Bengal, Gujarat and Uttar Pradesh have shown some increase in the degree of
diversification during 1981-82 to 2002-03 followed by a decline in 2002-03 in the
degree of diversification; on the other, Orissa and Rajasthan have registered a
decline during 1981-82 to 2002-03 followed by an increase in 2002-03. However,
Bihar and Haryana, in the middle category have registered a decline in the
diversification over the years. In the less diversified group, Andhra Pradesh has
witnessed highest increase in the degree of diversification, while Assam and
relative rank over the years, while changes have taken place in the relative
ranks of the middle level diversified group and diversified. However, these
changes in the relative ranks are mostly within the respective groups. In the
diversified group, Karnataka continues to be at the top rank (except slipped to4th in 1988-89); Maharashtra continues to be at the second rank (except slipped
to 5th in 2002-03); for Delhi the rank is improved; while, for the others it changes
within them. Similarly, in the middle level diversified group, the relative rank
of Orissa has improved, while that of Bihar and Rajasthan has declined; and
West Bengal, Gujarat and Uttar Pradesh has remained more or less at the same
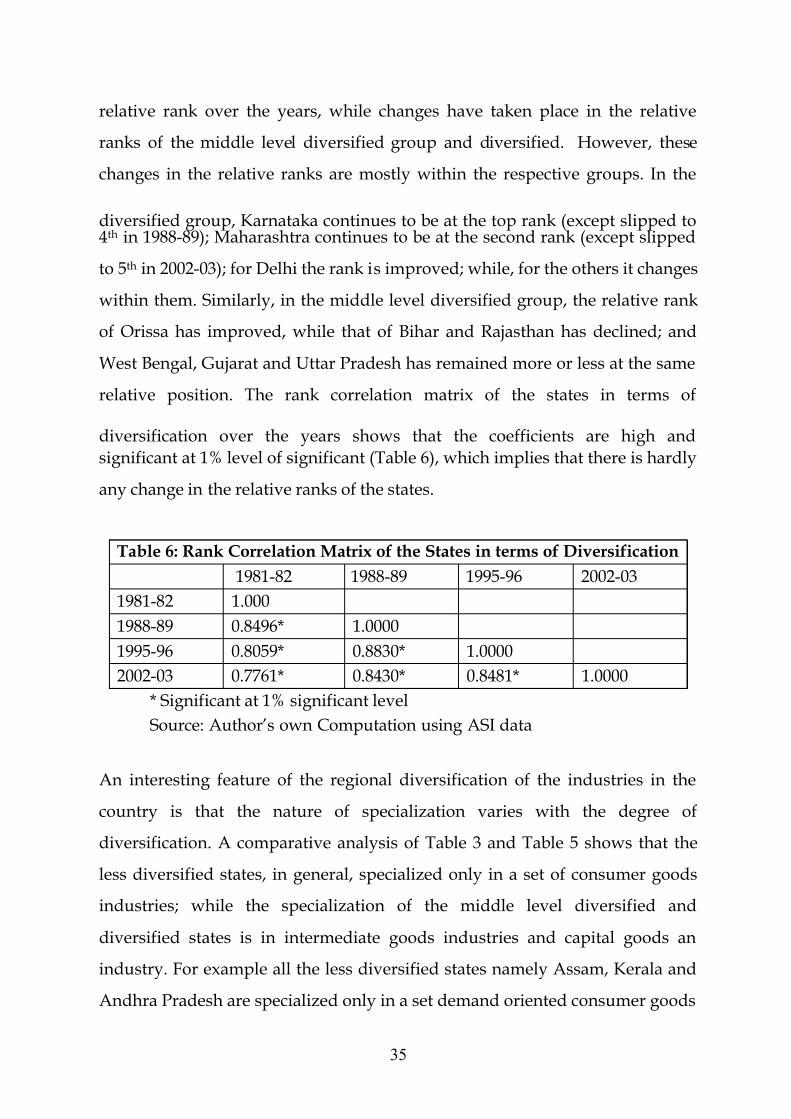
relative position. The rank correlation matrix of the states in terms of
diversification over the years shows that the coefficients are high and
significant at 1% level of significant (Table 6), which implies that there is hardly
any change in the relative ranks of the states.
Table 6: Rank Correlation Matrix of the States in terms of Diversification
1981-82 1988-89 1995-96 2002-03
1981-82 1.000
1988-89 0.8496* 1.0000
1995-96 0.8059* 0.8830* 1.0000
2002-03 0.7761* 0.8430* 0.8481* 1.0000
* Significant at 1% significant level
Source: Author‟s own Computation using ASI data
An interesting feature of the regional diversification of the industries in the
country is that the nature of specialization varies with the degree of
diversification. A comparative analysis of Table 3 and Table 5 shows that the
less diversified states, in general, specialized only in a set of consumer goods
industries; while the specialization of the middle level diversified and
diversified states is in intermediate goods industries and capital goods an
industry. For example all the less diversified states namely Assam, Kerala and
Andhra Pradesh are specialized only in a set demand oriented consumer goods
industries. On the other hand, all the middle level diversified states specialized
in resource based intermediate goods industries, except Haryana and Uttar
Pradesh who specialized in capital goods industries. Similarly, almost all the
diversified states specialized in a set of capital goods industries, except MadhyaPradesh and to some extent Tamil Nadu who specialize in a set of intermediate
goods.
7. CONCLUSION AND IMPLICATIONS
Industrial growth is essential for raising the economic growth in a country like
India. However, the regional variation in the industrial development is one of
the primary causes of the regional disparities in India. In this paper we havemade an attempt to compare the process of industrial location in India in the
pre- and post-liberalization period taking the year 1991 as the point of
departure. The findings show that the post liberalization period has witnessed
more concentration of manufacturing industries, which suggests widening the
inter-regional divergence in India in terms of industrial development in the
post liberalization period. The Southern region has gained employment shares
over the years at the cost of the Eastern region and to some extent Central
region. At the states level, the share of West Bangle and Maharashtra has
declined significantly, while that of Andhra Pradesh and Tamil Nadu has
increased. Considering the degree of diversification it if found that Central and
Southern regions have become more diversified, while Eastern and Northwest
regions become less diversified over the years. It is observed that the nature of
specialization varies with the degree of diversification. The less diversified
states, in general, specialized in a set of consumer goods industries, while the
middle level diversified and diversified states are specialized in intermediate
goods and capital goods industries. Further, the results show that the less
diversified states remain in the same relative ranks over the years, while
changes have taken place in the relative ranks of the middle level diversified
and diversified states. On the whole, our discussion leads to the conclusion that
India is diverging, not converging in terms of inter-regional distribution of
manufacturing industries in the post liberalization period. The tendency to
catch up the industrially developed states is hardly seen among the backwardstates. Thus, we can say that the regional development of industries in India in
the post liberalization period follows the classic “virtuous cycle” principles: new
industries locate where other industries already exist.
However, our conclusion is not the precise, since we consider only the
organized manufacturing sector. Our study does not cover the small scale and
unorganized manufacturing sector, whose coverage is much more than the
organized sector. Further, our study considers only the organized
manufacturing sector employment to explain industrial activities. The result
may be different if we include the small-scale and un-organized manufacturing
sector and consider gross value of industrial output or industrial investment,
other than employment to represent industrial activities.
Though the structural reforms of 1991 were used to be a point of departure in
the analysis, it does not imply that this concentration process is purely the
result of the economic liberalization. Our study does not investigate the
influence of economic liberalization on industrial location, as well as the factors
causing the industrial concentration in the post reforms period. The probable
reasons of industrial concentration in the post reforms period could be the
traditional factors that we have mentioned above or some region specific factors
such as cost structure, characteristics of labour forces, geographical
characteristics, investment climate, political condition, etc.
It is worthwhile to emphasize the importance of industrial and incentive
policies at the state level, as the central government has minimal role to play in
industrial location in the post liberalization period. Ahluwalia (2002 b)
emphasized that „because liberalization has created a more competitive
environment, the pay off from pursuing good policies has increased, thereby
increasing the importance of state level action‟. Under the liberalization policyregime the states have more freedom and flexibility, and thus, they could take
the advantage of initial development, physical capabilities and economic and
geographical environment to attract and develop industries (Dholakia, 2000).
Now a day several state governments are competing with each other in
“incentive war” such as relief from sales tax, electricity and water rebates,
capital subsidy, and preferential treatment in government purchases, etc. to
attract new investment in to the state. Although these direct government
incentives are necessary for attracting industrial investment, they are unlikely
to be sufficient. Factors that are likely to be more important are availability of
transport and communications, water and power, and services and social
amenities. Therefore, the backward states should emphasize more on providing
appropriate physical infrastructure (power, water, transport and telecom), legal
and financial infrastructure (corporate law, accountancy norms, and banks,
capital markets), and social infrastructure to attract new industrial investment.
Another important point, as Bhargava (1995) pointed out, is the regulatory
regime prevalent in the states. Although industrial licensing system has been
abandoned, several labour, company, and tax laws and environmental licenses
and permits need to be taken for access to land, water and power etc. Under
such a situation, states having fewer complexities in these regulations along
with other advantages will attract more industrial investment, and thus, results
in more concentration of industries. Therefore, the states are required to
reconsider their development strategies, alter necessary policy decisions and
change institutional structure to attract more industrial investment in their